
BIOLOGIA - Government College University · BIOLOGICAL SOCIETY OF PAKISTAN . Biological...
162
BIOLOGIA (PAKISTAN) ISSN 0006-3096 (Print) ISSN 2313-206X (Online) BIOLOGIA (PAKISTAN) June 2014 Vol. 60, No.1, Editor-in-Chief AZIZULLAH EDITORS PAKISTAN FOREIGN Nusrat Jahan (GCUL) Ashraf Muhammed Ahmed Ali (S. Arabia) Ghazala Yasmeen (GCUL) Athar Tariq (U.S.A.) Khalid Pervaiz Lone (Health Univ.) Imumorin, Ikhide Godwin (U.S.A.) Syed Shahid Ali (LU) B. Faye (France) Muhammad Saleem (PU) Salih Dogan (Turkey) Aamir Ali (UOS) Wolfgang Von Engelhardt (Germany) Hassan Sher (Swat Univ.) Qi Bin Zhang (China) Managing Editors Abdul Qayyum Khan Sulehria (Zoology) Tanzeem Akbar Cheema (Botany) Sub-editor Naila Malkani BIOLOGICAL SOCIETY OF PAKISTAN Biological Laboratories, GC University, Lahore, Pakistan www.biosoc.pk
Transcript of BIOLOGIA - Government College University · BIOLOGICAL SOCIETY OF PAKISTAN . Biological...

BIOLOGIA (PAKISTAN) ISSN 0006-3096 (Print) ISSN 2313-206X (Online)
BIOLOGIA
(PAKISTAN) June 2014 Vol. 60, No.1,
Editor-in-Chief AZIZULLAH
EDITORS PAKISTAN FOREIGN
Nusrat Jahan (GCUL) Ashraf Muhammed Ahmed Ali (S. Arabia)
Ghazala Yasmeen (GCUL) Athar Tariq (U.S.A.)
Khalid Pervaiz Lone (Health Univ.) Imumorin, Ikhide Godwin (U.S.A.)
Syed Shahid Ali (LU) B. Faye (France)
Muhammad Saleem (PU) Salih Dogan (Turkey)
Aamir Ali (UOS) Wolfgang Von Engelhardt (Germany)
Hassan Sher (Swat Univ.) Qi Bin Zhang (China)
Managing Editors
Abdul Qayyum Khan Sulehria (Zoology) Tanzeem Akbar Cheema (Botany)
Sub-editor Naila Malkani
BIOLOGICAL SOCIETY OF PAKISTAN Biological Laboratories, GC University, Lahore, Pakistan
www.biosoc.pk

BIOLOGIA (PAKISTAN) ISSN 0006-3096 (Print) ISSN 2313-206X (Online)
BIOLOGIA
(PAKISTAN)
Vol. 60, No.1, 2014
Editor-in-Chief AZIZULLAH
Editors
PAKISTAN FOREIGN
Nusrat Jahan (GCUL) Jonathan Palmer (New Zealand)
Ghazala Yasmeen (GCUL) Athar Tariq (U.S.A.)
Khalid Pervaiz Lone (Health Univ.) C.J. Secombes (U.K.)
Syed Shahid Ali (UOL) B. Faye (France)
Muhammad Saleem (PU) Salih Dogan (Turkey)
Aamir Ali (UOS) Wolfgang Von Engelhardt (Germany)
Hassan Sher (Swat Univ.) Qi Bin Zhang (China)
Managing Editors
Abdul Qayyum Khan Sulehria (Zoology) Tanzeem Akbar Cheema (Botany)
Sub-editor
Naila Malkani
BIOLOGICAL SOCIETY OF PAKISTAN Biological Laboratories, GC University, Lahore, Pakistan
www.biosoc.pk
BIOLOGICAL SOCIETY OF PAKISTAN Biological Laboratories, GC University, Lahore, Pakistan
www.biosoc.pk
PRESIDENT
Muhammad Ramzan Mirza Department of Zoology,
GC University, Lahore, Pakistan
VICE PRESIDENTS
Athar Hussain Shah Department of Botany,
GC University, Lahore, Pakistan
Anjum Perveen Department of Botany,
University of Karachi, Karachi, Pakistan
Rehana Asghar Department of Biology
Mirpur, University, AJK
Nusrat Jahan Department of Zoology
GC University, Lahore, Pakistan
Syed Akram Shah Department of Zoology,
Peshawar University, Peshawar, Pakistan
Asmatulla Kakar Department of Zoology,
University of Balochistan, Quetta, Pakistan
GENERAL SECRETARY Zaheer-ud-din Khan Department of Botany,
GC University, Lahore, Pakistan JOINT SECRETARY
Muhammad Afzal Department of Zoology & Fisheries Agricultural University, Faisalabad
Pakistan
EDITOR-IN-CHIEF
Azizullah Department of Zoology,
GC University, Lahore, Pakistan
MANAGING EDITORS
Abdul Qayyum Khan Sulehria Department of Zoology
Govt. Islamia College, Civil Lines Lahore. Pakistan.
Tanzeem Akbar Cheema Department of Botany
GC University, Lahore. Pakistan.
Sub-Editor Naila Malkani
ADVISORY BOARD Tasneem Farasat (LCU for Women, Lahore) Azhar Maqbool (UVAS, Lahore) Altaf Dasti (B. Z. U., Multan) Wazir Ali Baloch (University of Sindh, Jamshoro) Muhammad Ayub (DG, Fisheries Punjab) Sana Ullah Khan Khattak (University of Peshawar, Peshawar) Zahid Hussain Malik (University of AJK, Muzaffarabad) M. Shafiq Ahmed (PU, Lahore) Atta Muhammad (Univ. of Balochistan, Quetta) Aliya Rehman (Karachi University) Moin-ud-Din Ahmad (Urdu Uni., of Sci. Tech., Karachi)
Pei Sheng-Ji (China) Kazuo N. Watanabe (Japan) Jin Zou (U. K.) Mary Tatnar (U. K.) William Bill Radke (U. S. A.) David B. Wilson (U. S. A.) Lee A. Meserve (U. S. A.) Fabrizio Rueca (Italy) Silvana Diverio (Italy) Giorgia Della Rocca (Italy) R. Pabst (Germany)

ANNUAL MEMBERSHIP
PAKISTAN Life Fellow Rs. 10,000.00 Fellow Rs. 2000.00 (per annum) Student Member Rs. 800.00 (Will not receive free copy (per annum) of journal)
FOREIGN Fellow US $ 60.00 (per annum)
JOURNAL SUBSCRIPTION Complete Volume Single Copy
PAKISTAN Rs. 1500.00 Rs. 750.00 FOREIGN
Surface mail US $ 200.00 US $ 120.00
Air Mail US $ 240.00 US $ 140.00
All correspondence relating to membership and publication should be addressed to:
MANAGING EDITORS
Abdul Qayyum Khan Sulehria
Department of Zoology Govt. Islamia College, Civil Lines Lahore.
Pakistan.
Tanzeem Akbar Cheema Department of Botany
GC University, Lahore. Pakistan.
E-mail: [email protected] or [email protected]
BIOLOGICAL SOCIETY OF PAKISTAN Biological Laboratories, GC University, Lahore, Pakistan
www.biosoc.pk

BIOLOGIA (PAKISTAN)
PK ISSN 0006-3096 (Print) ISSN 2313-206X (Online) Volume 60, June 2014 Number 1
CONTENTS Hussain, A., Sulehria, A. Q. K., Ejaz, M. and Maqbool, A., Assessment of water quality of a flood plain reservoir for the development of aquaculture in Pakistan
1
Ajaib, M., Khan, Z. and Zikrea, A., Ethnobotanical survey of some important herbaceous plants of District Kotli, Azad Jammu & Kashmir
11
Khan, A. R., Saeed, M., Shahwani, M. N., Ahmed, N., Raza, A. M. and Kakar, M. A. Ecophysiology of seed germination in native and exotic Labiates of Balochistan
23
Mahmood, A., Wahla, A. J., Mahmood, R., Ali, L. and Nawaz, M., Impact of sowing time on yield parameters of selected wheat cultivars under rice-wheat cropping system of District Sheikhupura, Punjab
31
Akhtar, T., Sheikh, N., Abbasi, M. H. and Abbas, A. S. Effects of Nerium oleander leaves extract against Thioacetamide induced Liver injury
37
Faiz, A. H., Ghufarn, M. A., Mian, A. and Akhtar, T., Floral Diversity of Tolipir National Park (TNP), Azad Jammu and Kashmir, Pakistan
43
Maqbool, A., Sulehria, A. Q. K., Ejaz, M., and Hussain, A., Density, diversity and abundance of Copepods in a pond
57
Ajaib, M. and Khan, Z., Ethnobotanical studies of useful trees of District Kotli, Azad Jammu and Kashmir
63
Hussain,A., Sulehria, A. Q. K., Ejaz, M., Maqbool, A.and Mirza, M. R., Temporal variations in Commercial Fish Community of a Floodplain of the River Ravi, Pakistan
73
Saleem, F., Sadiq, R., Adalat, R., Hussain, A., and Qazi, J. I., Prevalence of acid and antibiotic resistant Coliform bacteria in yogurt and oriental snacks sampled from markets of Lahore, Pakistan
81
Shakir, H. A., Shazadi, K., Qazi, J. I. and Hussain, A.,Planktonic diversity in gut contents of Labeo rohita from Ravi, Pakistan reflecting urban loads on the river
87
Ali, N. M., Mazhar, B., Hayat, S., Mazhar, A. and Shahzad, H., Antimicrobial Activity of Honey on Bacteria Isolated from Diabetic’s Foot Wounds
93
Shad, H. A., Khan, Z. I., Ahmad, K., Rizwan, Y. and Tahir, H. M., Human health hazards caused by heavy metals accumulation in wheat Variety “Sehar-2006” irrigated with domestic sewage water
99
Iqbal, Z. and Rehaman B. G., Parasitic Infestation of an ornamental fish comet, Carassius auratus L. Imported to Pakistan
103
Ali, S., and Raza, M., Prevalence and physiological assessment of deafness in district Ghanche (Gilgit-Baltistan), Pakistan (An audiometry based study)
109
Afzal, M., Rana, S. M., Babar, M. H., Haq, I., Iqbal, Z. and Saleem, H. M., Comparative Efficacy of new Insecticides against Whitefly, Bemisia tabaci (Genn.) and Jassid, Amrasca devastans (Dist.) on Cotton, Bt-121
117
Ali, A., Hayat, S., Ahmed, M. S., Elahi, N., Saghir, A., Ali, H., and Khan, W. A., Prevalence of Lernaeid Ectoparasites in some Culturable Fish species from different Nurseries of Punjab.
123
Hussain, S., Malik, Z. H., Malik, N. Z., and Ajaib, M., Life Form and Leaf Spectra Reported from India Morr District Kotli, Azad Jammu & Kashmir
129
Abbasi, M. H., Fatima, S. and Sheikh, N., Histological comparison of natural lung injury in Rattus norvegicus induced by a natural herb (Nerium oleander) and a known carcinogen (thioacetamide)
135
Sheikh, N., Younas, N., Akhtar, T., Effect of Carica papaya leaf formulation on Hematology and Serology of normal rat
139
Qazi, J. I., and Iqtedar, M., Epiphytic Bacteria as Indicators of Nosocomial Infections
143
Mirza, M. R., and Mirza, Z. S., Longitudinal Zonation in the Fish Fauna of the Indus River in Pakistan
149
Zafar, M. and Asmatullah, Some Studies on Histopathological and Cranio-Facial Structures in Mice on Co-Gestational Exposure of Bifenthrin
153
Hasan, Z., Khan, W., Khan, M. A., Latif-Ur-Rehman, Khan, J. and Sanaullah, Comparative Abundance of Fish Fauna of Different Streams of Bajaur Agency, Khyber Pakhtunkhwa, Pakistan
159
Ahmed, A., Anwar, A., Remzan, H., Kazmi, S. M. Z. and Shah, A. H., Application of Apical bud culture technique for Shoot proliferation of Solanum tuberosum L.
165

BIOLOGIA (PAKISTAN) 2014, 60 (1), 1- 9 PKISSN 0006 – 3096 (Print) ISSN 2313 – 206X (On-Line)
*Corresponding author: [email protected]. Cell: 03008042280
Assessment of water quality of a flood plain reservoir for the development of aquaculture in Pakistan
ALTAF HUSSAIN1, ABDUL QAYYUM KHAN SULEHRIA2, MUHAMMAD EJAZ1 & ASMA MAQBOOL1
1Department of Zoology, GC University, Lahore, Pakistan
2 Department of Zoology, Govt. Islamia College, Civil Lines Lahore, Pakistan
ABSTRACT
This study was carried out to evaluate the water quality of a flood plain reservoir on River Ravi near Balloki Headworks to explore the possibilities for strengthening the prevailing conditions of aquaculture in Pakistan. Different statistical techniques such as One-Way ANOVA, Pearson’s Correlation, Hierarchical Cluster Analysis (HCA) and Principal Component Analysis (PCA) were used to analyze the data. ANOVA showed that statistically significant difference was present in different variables measured among different months. Pearson correlation showed that Atmospheric temperature, Water temperature, pH, Electrical conductivity, Total dissolved solids, and Turbidity were positively correlated among themselves but negatively correlated with Dissolved oxygen, Visibility and Chlorides were positively correlated among themselves. Total hardness and total alkalinity showed either positive or negative relationships with respect to all the other parameters of water. Three different groups among months were formed on the basis of Cluster analysis. The Principal Component Analysis (PCA) showed that the eigenvalues of the first 2 components accounts for 78.58% of the total variations. Keywords: Water quality, Flood plain reservoir, Hierarchical Cluster Analysis, Principal Component Analysis
_______________________________________________________________________________________
INTRODUCTION
Rivers and reservoirs always play an important role in agricultural, fishery and electricity production. So protection of water quality is a vital issue in these water bodies. It should be kept at acceptable levels (Quyang et al., 2006). Water quality refers to the chemical, physical and biological properties of water. Water quality assessment generally involves analysis of physicochemical, biological and microbiological parameters and addresses abiotic and biotic status of the ecosystem (IAAB, 1998; Kulshrestha & Sharma, 2006; Mulani et al., 2009). Different factors that determine the water quality of a reservoir include seasonal and climatic changes (Chapman, 1996; Barik et al., 2010), precipitation, wind action, geologic origin of the catchment basin and pattern of hydrological cycle in dam (Tundisi & Straskraba, 1999).
Anthropogenic impacts such as urban, industrial and agricultural activities and natural processes i.e., precipitation inputs, erosion, etc., diminish the surface water quality and lower the use for drinking, agricultural and other purposes (Carpenter et al. 1998). Pollution in rivers and reservoirs affect aquatic life directly and indirectly. The change in concentrations of different physicochemical parameters and nutrients can cause various problems such as loss of oxygen, fish deaths and change in biodiversity along with the negative effects on human health. In a well-
balanced aquatic ecosystem quality of water always play a critical role between the organisms and the environment as it is very important for the health of the ecosystem (Vousta et al., 2001; Ntengve, 2006). Therefore, a monitoring program providing a representative and reliable estimation of the quality of surface water is necessary (Dixon & Chrisswell, 1996). In such a program, the data sets include rich information regarding the behavior of the water resources on spatial, temporal and seasonal basis. The assessment of the water quality can be done by classification, modeling, and interpretation of the monitored data (Simeonov et al., 2003; Boyacýðlu, 2006).
Statistical techniques such as Analysis of Variance (ANOVA), Pearson’s correlation, Hierarchical Cluster Analysis (HCA) and Principal Component Analysis (PCA) interpret the monitored data. They help to better understand the behavior of the water body, water quality, pollution sources, and ecological situation of the studied area and management of the water resources. They also provide solution to the pollution problems (Vega et al., 1998; Lee et al., 2001; Simeonov et al., 2003; Shrestha & Kazama, 2007). The flood plain of River Ravi near Balloki Headworks is an important reservoir in Pakistan from fisheries point of view. There are different factors including sewage, agricultural and industrial wastes which are posing threat on water quality of the sampling areas. Although there has been a few studies about the water quality of rivers but there are no studies on

2 A. HUSSAIN ET AL BIOLOGIA (PAKISTAN)
the water quality of flood plain reservoir in Pakistan. The purpose of this study was to apply various statistical techniques such as HCA, PCA, Pearson’s correlation and ANOVA to evaluate the seasonal variations of the water quality parameters, and to determine the temporal and spatial variations in water quality.
MATERIALS AND METHODS Study area
The floodplain under study is situated on River Ravi near Balloki Headworks in District Kasur, Pakistan. It is at a distance of 65 Km from Lahore, having a Latitude: 31° 11' 25" North and Longitude: 73° 52' 40" East. The total area of the floodplain is about 8.6 Km. It has distinct tropical climate with a marked monsoonal effect with an average atmospheric temperature ranging from a minimum of 5oC in winter to a maximum of 50oC in summer, rainfall 52.01mm and humidity 70.40%. Water level varies in different months of the year, being highest in summer (July to August) and lowest in winter (October to April) every year.
Sampling Monthly variations of physicochemical
characteristics of water were studied at monthly intervals from January to December, 2012. Atmospheric and water temperature ((°C), pH, dissolved oxygen (mg/l), electrical conductivity (US/cm), total dissolved solids (mg/l), turbidity (FTU) and transparency (cm) were measured on the spot at sampling site. Temperature and DO were measured by DO meter (DO200 Ecosence), electrical conductivity and total dissolved solids were measured by conductivity meter (EC300 Ecosence), pH was measured by pH meter (PH100 Ecosence), turbidity was measured by turbidity meter (Hi 93703 HANNA). Transparency was measured by Secchi disc plate of 20 cm in diameter, painted with alternate black and white quadrates. For the determination of total hardness (mg/l ), total alkalinity (mg/l ) and chlorides (mg/l ), water samples were taken in one litre sampling bottles and brought to the Laboratories at Govt. College University, Lahore, for further processing (APHA, 2005; Hach, 2003). Statistical analysis A variety of statistical techniques such as Analysis of variance (ANOVA), Correlation matrix (Pearson’s correlation), Hierarchical Cluster Analysis (HCA) and Principal Component Analysis (PCA) were used to evaluate the water quality of the flood plain. XLSTAT 2013 and SPSS 16 (statistical
package) programs were used in analyzing the data sets.
RESULTS
Summary statistics of different water quality
parameters recorded during the whole year are shown in Table 1 whereas Table 2 shows the output of the ANOVA. According to ANOVA there was a statistically (highly) significant difference in different physicochemical parameters of water recorded between different groups i.e., months.
Pearson’s correlation matrix (Table 3) was used to find correlation between different variables. Atmospheric temperature, water temperature and pH showed similar trends having positive correlation with electrical conductivity, total dissolved solids, turbidity, total hardness, total alkalinity and negative correlation with Dissolved oxygen, Visibility and Chlorides. A positive correlation was also present among these three variables also. Dissolve oxygen shows positive correlation with Visibility and Chloride but negative correlation with all other variables. Similarly Electric conductivity, Total dissolved solids and Turbidity also have positive correlation with Atmospheric and Water temperature, pH, Total hardness and Total alkalinity and negative correlation with Dissolved oxygen, Visibility and Chlorides. A positive correlation also existed among these three variables. Visibility showed positive correlation with Dissolved oxygen, Total hardness, Total alkalinity and Chlorides and negative correlation with all other variables. Total hardness had negative correlation with Dissolved oxygen whereas positive correlation with all other variables. Total alkalinity had negative correlation with Dissolved oxygen and Turbidity and positive correlation with rest of the variables. Chlorides shows positive correlation with Dissolved oxygen, Visibility, Total hardness and Total alkalinity and negative correlation with Atmospheric and water temperature, pH, Electrical conductivity, Total dissolved solids and turbidity.
Table 4 and Figure 1 show the Hierarchical Cluster Analysis (Dendrogram) of observations measured in various months. The dotted line represents the automatic truncation, leading to three groups. All the three groups had same size, comprising four months. Group 1 is composed of November, December, January and February. Group 2 consisted of the months of March, April, May and June. Similarly group 3 consisted of the months of July, August, September and October.

VOL. 60 (1) WATER QUALITY OF A FLOOD PLAIN RESERVOIR 3
The months in each group had almost similar values of different parameters.
Table 5 shows the different components and eigenvalues calculated by the Principal Component Analysis (PCA). Figure 2 shows the scree plot between eigenvalues and cumulative variances (%). The first component accounted for half of all the variance in the data (52.15%). Second component accounted for about 26% of the total variance. First two components accounted for 78.58% in total variance whereas first four components accounted for almost 93% of the total variance. Rest of the components accounted for about 7% of the total variance only. Scree plot in figure 2 explains the eigenvalues of different components and the cumulative variability (%). Biplot or Correlation Circle (Figure 3) showed a projection of the initial variables in the factor space. Variables on right side showed positive correlation among themselves but negative correlation with the factors on left side. Similarly the variables on left side of the correlation circle showed positive correlation among themselves but negative correlation with the variables on right sides.
DISCUSSION
In this study, variety of statistical methods including One-Way ANOVA, Correlation matrix (Pearson’s Correlation), Principal Component Analysis (PCA), and Hierarchical Cluster Analysis (HCA) were applied to a data set obtained from the flood plain.
One-way ANOVA was performed to determine the differences among different months of the years and sites for the 11 variables. Analysis of Variance performed showed a significant difference among months for different variables measured. These variations may be due to the different seasons prevailing in Pakistan. It was revealed that seasonal and climatic changes played an important role in changing the concentrations of different variables in the region. Air temperature had a controlling effect on changing the concentrations of different parameters. Similarly Rain fall in monsoon and inflow of flood water during this season resulted in dilution of stagnant water in flood plain, changing the concentration of various inorganic components in water. This phenomenon was also observed by Hidetoshi (2002), who reported that there was a positive correlation between air and water temperatures. This observation was also in agreement with the findings of Kolo and Oladimeji (2004) and Caldwril (2003). Caldwril in 2003 reported that water temperature varied with season,
climatic condition, elevation and geographic location of the area and was also influenced by stream flow, stream side vegetation, ground water inputs and water effluent from industrial activities.
Correlation Matrix (Pearson’s correlation) in Table 3 showed that atmospheric and water temperature, pH, electrical conductivity, total dissolved solids and turbidity expressed almost similar trends having positive correlation among themselves but negative correlation with dissolved oxygen, visibility and chlorides. Similarly dissolved oxygen, visibility and chlorides showed positive correlation with themselves and negative correlation with all the other parameters. On the other hand, total hardness and total alkalinity showed different trends than the parameters discussed above.
According to the Hierarchical Cluster Analysis three different groups were formed among months. These three different groups showed different behavior with respect to different variables. These groups were mainly formed on the basis of climatic conditions in the area. First and third groups depicted the impact of temperature whereas the second group was mainly affected by monsoon and flood in the area. The dendrogram showed that first four months (November to February) have similar range of data, but different to other groups. Similarly group 2 and 3 had similar data within groups but different from other groups. First two groups were more homogeneous than the third one (It is flatter on the dendrogram). It was an indication that third group had more variations among data than first two groups. It was confirmed by looking at the class variations (Table 5). The difference in variation of data was mainly due to different seasons/climatic conditions prevailing in Pakistan.
Principal Component Analysis (PCA) is a mathematical procedure that transforms a large number of possibly correlated variables into a group of uncorrelated variables called principal components. It explains the variances of a large dataset of inter-correlated variables with a smaller set of independent variables (Simeonov et al. 2003). Biplot or Correlation circle (Figure 3) is useful in interpreting the meaning of the axes. The main objective of the PCA analysis was to determine the hidden factors responsible for the data structure when whole set of data set was considered. Principal Component Analysis performed on the data, categorized the different variables into five components depending on the basis of related and unrelated variances. Among these, first component accounted for the largest variance i.e., 52.15%. The second component had a share of 26% in total variance. The first two components in this way

4 A. HUSSAIN ET AL BIOLOGIA (PAKISTAN)
accounted for 78.588% of the total variance in cumulative. The rest of the eight components had least interference in total variance.
The physico-chemical characteristics of water quality analyzed during the study period from January 2012 to December 2013 of the flood plain revealed that due to different anthropogenic activities like discharge of municipal, agricultural wastes and effluents from industries the quality of water is being deteriorated day by day. The studied parameters were high during summer as compared to winter in the present flood plain. Therefore there is an urgent need to properly manage the different wastes discharged from cities and industries and
control and monitor human activities in these areas in order to ensure minimized effects of these parameters on aquatic life in river. This study showed that statistical techniques such as ANOVA, Pearson’s Correlation, PCA and HCA could be successfully used to deduce information from the data set about the possible influences of different environmental factors on water quality. Taking into consideration the results one can suggest various measures for the conservation of water bodies and to save the aquatic life from their damaging effects. Authorities may be proposed to take prompt actions to prevent water bodies from pollution.
Table 1: Summary statistics of Water quality parameters recorded during the period of studies.
Variables Obser
vations
Obs. With missing
data
Obs. Without missing
data
Minimum Maximum Mean Std.
deviation
AT 12 0 12 16.620 40.320 28.378 7.752
WT 12 0 12 14.150 33.890 25.468 6.468
PH 12 0 12 6.820 8.530 7.748 0.520
DO 12 0 12 5.000 9.460 6.943 1.551
EC 12 0 12 232.760 330.000 265.663 28.025
TDS 12 0 12 148.966 211.200 170.024 17.936
TU 12 0 12 4.620 63.700 16.377 17.458
VIS 12 0 12 30.480 150.000 87.335 31.472
TH 12 0 12 120.000 160.000 143.333 11.048
TA 12 0 12 100.000 119.000 113.043 5.171
CL 12 0 12 20.000 34.930 28.113 3.745

VOL. 60 (1) WATER QUALITY OF A FLOOD PLAIN RESERVOIR 5
Table 2: ANOVA of water quality parameters between different months.
Sum of Squares df
Mean Square F Sig.
AT Between Groups 9916.472 11 901.497 187.746 .000
Within Groups 806.684 168 4.802
Total 10723.157 179
WT Between Groups 6902.300 11 627.482 376.484 .000
Within Groups 280.004 168 1.667
Total 7182.304 179
PH Between Groups 44.962 11 4.087 48.965 .000
Within Groups 14.024 168 .083
Total 58.987 179
DO Between Groups 889.192 11 80.836 66.564 .000
Within Groups 204.021 168 1.214
Total 1093.212 179
EC Between Groups 123454.386 11 11223.126 121.446 .000
Within Groups 15525.272 168 92.412
Total 138979.658 179
TDS Between Groups .059 11 .005 354.023 .000
Within Groups .003 168 .000
Total .061 179
TU Between Groups 50019.506 11 4547.228 16.289 .000
Within Groups 46897.417 168 279.151
Total 96916.923 179
VIS Between Groups 163455.650 11 14859.605
7.574E31
.000
Within Groups .000 168 .000
Total 163455.650 179
TH Between Groups 131926.067 11 11993.279 13.336 .000
Within Groups 151090.133 168 899.346
Total 283016.200 179
TA Between Groups 7269.244 11 660.840 4.238 .000
Within Groups 26198.667 168 155.944
Total 33467.911 179
CL Between Groups 2310.911 11 210.083 13.256 .000
Within Groups 2662.400 168 15.848 Total 4973.311 179

6 A. HUSSAIN ET AL BIOLOGIA (PAKISTAN)
Table 3: Correlation matrix (Pearson’s Correlation). Values in bold are different from 0 with a significance level alpha=0.05
Table 4: RESULTS OF DENDROGRAM BY CLASS.
Class 1 2 3
Objects 4 4 4
Sum of weights 4 4 4
Within-class variance 998.499 1608.288 2143.854
Minimum distance to centroid 14.796 15.897 31.113
Average distance to centroid 25.332 31.881 39.181
Maximum distance to centroid 39.860 52.334 53.347
Jan Mar Jul
Feb Apr Aug
Nov May Sep
Dec Jun Oct
Table 5: Components and eigenvalues.
F1 F2 F3 F4 F5 F6 F7 F8 F9 F10
Eigenvalue 5.737 2.908 1.040 0.519 0.353 0.268 0.115 0.032 0.024 0.003 Variability (%)
52.154
26.434 9.457 4.722 3.211 2.440 1.047 0.291 0.220 0.024
Cumulative %
52.154
78.588
88.045
92.766
95.977
98.418
99.465
99.756
99.976
100.000
Variables AT WT PH DO EC TDS TU VIS TH TA CL AT 1 0.946 0.712 -0.895 0.516 0.516 0.476 -0.538 0.490 0.399 -0.239 WT 0.946 1 0.798 -0.925 0.548 0.548 0.604 -0.697 0.330 0.297 -0.455 PH 0.712 0.798 1 -0.625 0.438 0.438 0.596 -0.703 0.263 0.232 -0.301 DO -0.895 -0.925 -0.625 1 -0.713 -0.713 -0.445 0.560 -0.485 -0.408 0.317 EC 0.516 0.548 0.438 -0.713 1 1.000 0.077 -0.201 0.601 0.720 -0.057 TDS 0.516 0.548 0.438 -0.713 1.000 1 0.077 -0.201 0.601 0.720 -0.057 TU 0.476 0.604 0.596 -0.445 0.077 0.077 1 -0.763 0.128 -0.082 -0.335
VIS -0.538 -0.697 -0.703 0.560 -0.201 -0.201 -0.763 1 0.009 0.199 0.546 TH 0.490 0.330 0.263 -0.485 0.601 0.601 0.128 0.009 1 0.806 0.591 TA 0.399 0.297 0.232 -0.408 0.720 0.720 -0.082 0.199 0.806 1 0.365 CL -0.239 -0.455 -0.301 0.317 -0.057 -0.057 -0.335 0.546 0.591 0.365 1

VOL. 60 (1) WATER QUALITY OF A FLOOD PLAIN RESERVOIR 7
Fig., 1: Hierarchical Cluster Analysis (Dendrogram) of variables and observations.
Fig., 2: Scree plot of eigenvalues and cumulative variability (%).

8 A. HUSSAIN ET AL BIOLOGIA (PAKISTAN)
Fig., 3: Biplot of variables and observations.
REFERENCES
APHA (American Public Health Association), 2005. Standard Methods for the Water And Waste Water (19th ed). American Water Works Association and Water Pollution Control Federation, New York, USA.
Boyaciaglu, H., 2006. Surface water quality assessment using factor analysis. Water S.A., 32 (3): 389-393.
Caldwril, B. A., 2003. Watershed Protection. Plan Development Guide book, Northeast Georgia Regional Development centre. (www.gaepd.org/Files_PDF/techguide/wpb/devwtrplan).
Barik, A., Basu, M. & Roy, N., 2010. Seasonal abundance of net zooplankton correlated with physicochemical parameters in a fresh water ecosystem. Int. J. Lakes Rivers, 3: 67-77.
Chapman, D. V., 1996. Water quality assessments: A guide to the use of biota, sediments, and water in environmental monitoring (2nd ed.). Published by E&FN Spon, an imprint of Chapman & Hall, Washington D.C. 1268 pp.
Carpenter, S. R., Caraco, N. F., Correl, D. L., Howarth, R. W., Sharpley, A. N. & Smith, W. H., 1998. Nonpoint pollution of surface
waters with phosphorus and nitrogen. Ecol. Appl., 8(3):559-568.
Dixon, W. & Chriswell, B., 1996. Rewiew of aquatic monitoring program design. Water Res., 30: 1935-1948.
IAAB., 1998. Methodology for water analysis. IAAB Editorial Board, Hyderabad.
Hach, 2003. Water analysis handbook: Hach Chemical Company, Loveland, Colorodo, USA. 1268pp.
Hidetoshi, M., Shuji, H., Koichi, S. & Jiro, A., 2002. Variations in environmental factors and their effects on biological characteristics of meromictics Lake Abashiri. The Japanese journal of Limnology, 3: 97-105.
Kolo, R.J. & Oladimeji, A.A., 2004. Water quality and some nutrient levels in Shiroro Lake, Niger State, Nigeria. J.Aquat. Sci., 19 (2): 99-106.
Kulshrestha, H. & Sharma. S., 2006. Impact of mass bathing during Ardhkumbh on water quality status of river Ganga. J. Environ Biol., 27: 437-440.
Lee, J.Y., Cheon, J.Y., Lee, K.K., Lee, S.Y., Lee, M.H., 2001. Statistical evaluation of geochemical parameter distribution in a ground water system contaminated with petroleum hydrocarbons. J. Environ. Qual., 30: 1548-1563.

VOL. 60 (1) WATER QUALITY OF A FLOOD PLAIN RESERVOIR 9
Mulani, S.K., Mule, M.B. & Patil, S.U., 2009. Studies on water quality and zooplankton community of the Panchganga river in Kolhapur city. J. Environ. Biol., 30: 455-459.
Ntengwe, F.W., 2006. Pollutant loads and water quality in streams of heavily populated and industrialized towns. Phys. Chem. Earth, 31: 832-839.
Quyang, Y., Nkedi-Kizza, P., Wu, Q.T., Shinde, D. & Huang, C.H., 2006. Assessment of seasonal variations in surface water quality. Water Res., 40: 3800-3810.
Simeonov, V., Stratis, J.A., Samara, C., Zachariadis, G., Voutsa, D., Anthemidis, A., Sofoniou, M., & Kouimtzis, T., 2003. Assessment of the surface water quality in Northern Greece. Water Res., 37: 4119-4124.
Shrestha, S. & Kazama, F., 2007. Assessment of surface water quality using multivariate statistical techniques: A case study of the Fuji River basin, Japan. Environ. Modell. Softw., 22: 464-475.
Tundisi, J. G. & Straskraba, M., 1999. Theoretical reservoir ecology and its applications. International Institute of Ecology, Brazilian Acad. of Sciences. 585pp.
Vega, M., Pardo, R., Barrato, E. & Deban, L., 1998. Assessments of seasonal and polluting effects on the quality of river water by explorers' data analysis. Water Res., 32: 3581-3592.
Voutsa, D., Manoli, E., Samara, C., Sofoniou, M., & Stratis, I., 2001. A study of surface water quality in Macedonia, Greece: Speciation of nitrogen and phosphorus. Water, Air, Soil Pollut., 129: 1-20.

BIOLOGIA (PAKISTAN) 2014, 60 (1), 11-22 PKISSN 0006 – 3096 (Print) ISSN 2313 – 206X (On-Line)
*Correspondenig author: <[email protected]>
Ethnobotanical survey of some important herbaceous plants of District Kotli, Azad Jammu & Kashmir
*MUHAMMAD AJAIB1, ZAHEER-UD-DIN KHAN1 & ANNAM ZIKREA1
Department of Botany, GC University Lahore, Pakistan
ABSTRACT
The ethnobotanical data on the herbaceous plants of District Kotli, Azad Kashmir was documented
during 2010 to 2011 by interviewing the local inhabitants through a questionnaire. A total of 93 herbaceous species belonging to 46 families of Angiosperms were recorded. It was noticed that beside the usages of herbs as fodder and vegetable, the people in the area were found using herbs for curing human diseases like hypertension, jaundice, gonorrhea, eczema, rheumatism, impotency, etc. and in cattle such as hemorrhagic septicemia, hemoglobinurea, prolepsis, anemia, etc. It was disclosed that 58.06% herbs were in use as whole plant, 36.56% as leaves, 6.45% as stem & fruit each, 10.75% as flower, 18.27% as root, 13.97% as seed and 1.07% as inflorescence. It was observed that people in the area were using 52.68% herbs for single purpose, 37.63% for double purpose, 7.52% for three and 2.15% for multipurpose. The most common herbs found in the area were including 11 species of Family Poaceae, 8 species of Labiatae, 7 species of Asteraceae and 4 species of Family Amaranthaceae. Key words: Ethnobotany, Herbs, District Kotli, Azad Jammu & Kashmir
_______________________________________________________________________________________
INTRODUCTION
Ethnobotany is the affiliation between aboriginal people and plants encompassing folk perception of their classification, their usage and their habitation (Berlin et al., 1973). The ethnobotanical studies carried out so far had enclosed the entire association between people and plants but, are mostly concentrated on the plants utilized in medication and foodstuff (Jain, 1965; Martin, 1995; Rao, 1981; Bye, 1981). Plants have influenced the human civilization. The humankind has witnessed the increasing scientific and commercial curiosity in therapeutical plants chiefly due to their massive economic prospective and the prevalent intellectual adequacy of plant based products. Ethnobotanical information regarding curative plants and their uses by indigenous traditions is valuable not merely in the protection of conventional cultures and biodiversity, but also for community health care and drug development (Farnsworth, 1993).
District Kotli, previously a sub-division of Mirpur Azad Jammu & Kashmir was given the status of district in September 1975. It is divided into Kotli, Khuiratta, Sehnsa, Fatehpur and Nikyal Tehsils. The average height of District Kotli is about 1000m and is bounded on the Eastern side by Indian Occupied Kashmir, Western side by Rawalpindi (Pakistan), Southern side by Mirpur District and Northern side by District Poonch. The population is 0.558 million according to census 1998 with an area of 1862km2. The investigated area lies between longitude 73 6’
to 74 7’ east and latitude 33 20’ to 33 40’ north (Topo sheet No. 43G /15). The annual rainfall in district Kotli is 1227.9mm, maximum during July and August, i.e. 306.9mm and 256.5mm, respectively while low during winter. Thus, average monthly rainfall is 102.33mm. Humidity is low during the daytime as compared to night. Months of January, February, August and September are more humid than May and June (Anonymous, 2008).
MATERIALS AND METHODS
The material mandatory in the field area
included: Notebook, Pencil, Polythene bags, Blotting paper, Toposheet & Plant presser, area maps, digital camera (Canon 1000D), GPS (Nuvi, Gamen), etc. The methodology used in the present study included: Assortment of relevant information from the City
District Government, District Kotli Field survey and Market assessment.
During the field survey, 120 local inhabitants of 30 villages of District Kotli, viz:
Mera Nakiyal, Khanara, Mohra, Panagh, Jandrot, Karela,Holar, Khori, Prandan, Sehr Mandi, Gul Pur, Sarsawah, Andralla, Kotera, Sohana Nidi, Phalni, Bandli, Darguti, Seri, Brooth, Dahana, Dana, Anda, Khajurla, Dungi, Manssoh hills, Domass, Panjani & Saney Baney hills were interviewed using a questionnaire to document the ethnobotancial data on the plant resources, quantities of plant species available

12 M. AJAIB ET AL BIOLOGIA (PAKISTAN)
and their utilization by the drug dealers, shopkeepers, timber dealers, fuel wood sellers, farmers, but priority was given to hakims (Herbal practitioners) and local elderly people usually with the age of more than 70 years (Table 1). In each village 4 informants (respondents) were selected.
Plant collection, preservation and identification
Plant specimens collected both from the wild and cultivated areas were subsequently dried, pressed and mounted appropriately on herbarium sheets and identified with the help of Flora of Pakistan: Nasir & Ali (1970-1989), Ali & Nasir (1990-1992), Nasir & Rafiq (1995) and Ali & Qaiser (1992-2012) and were submitted to Dr. Sultan Ahmad Herbarium (SAH), GC University, Lahore, Pakistan after pasting voucher numbers
Preparation of Ethnobotanical Inventory
The ethnobotanical record acquired was thus compared was previously presented or available literature on the uses of plants (Haq & Hussain, 1995; Jain, 1995; Alexiades, 1996; Cotton, 1996; Cunningham, 2001; Yusuf et al., 2006 and 2007; Ajaib et al., 2010 and 2012; Mohiuddin et al., 2012). Ultimately, the ethnobotanical catalog with family names, vernaculars and local uses was prepared.
RESULTS
The age and gender wise allocation of the
informants was summarized in Table 1. Out of total informants (n=120), 68.3% were males and 31.7% females. No relation was ascertained between these two parameters except that the old aged inhabitants were found having more information than younger generations.
In the investigated area, a total of 93 herbaceous species of 46 Angiospermic families were documented in alphabetical order alongwith their families, local names and their utility by natives of the study area (Table 2). Out of 93, 11 species belonged to family Poaceae, 8 to Labiatae, 7 to Asteraceae and 4 to family Amaranthaceae.
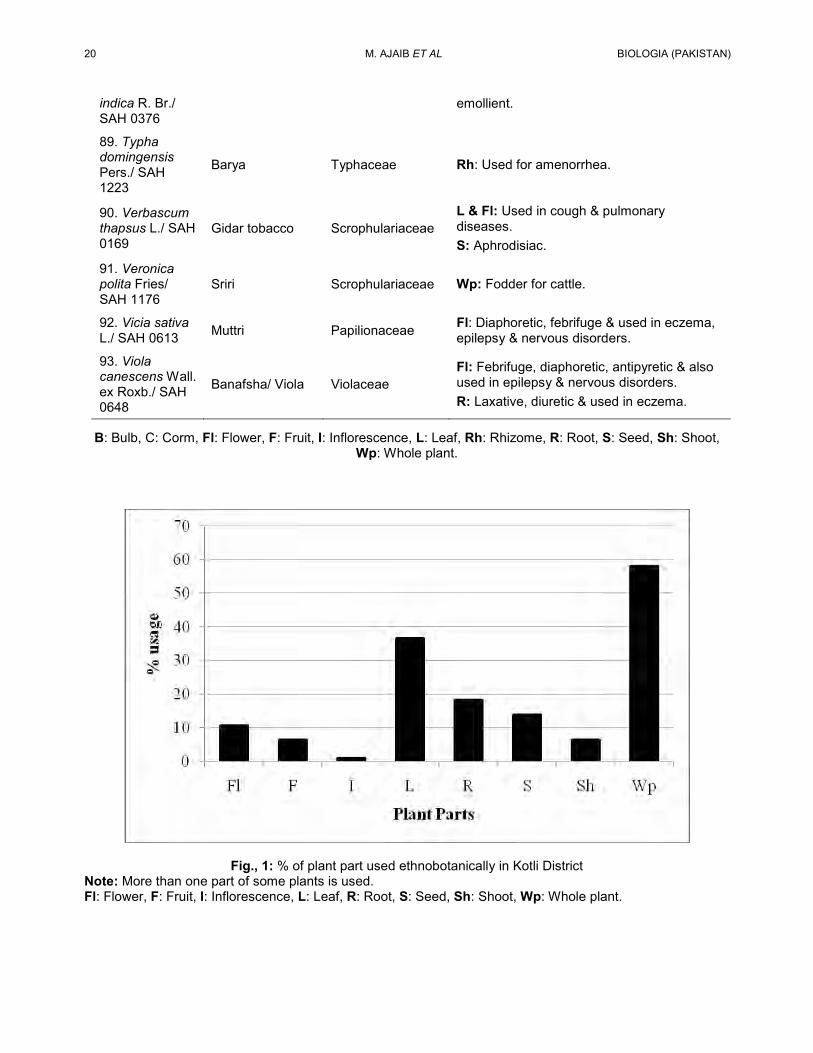
The whole plant of 54 species was found in ethnobotanical utility, i.e. about 58.06% of the total plant species, while leaves of 34 plants, i.e. about 36.56% were recorded in use for conventional purposes, Fruits, shoots (including rhizomes) of 6 herbs, i.e., about 6.45%, flowers of 10 plants accounting to 10.75%, roots (including bulbs & corms) of 17 plants, i.e., 18.27% while seeds of 13 herbs making up 13.97% and inflorescence of only 1 plant, i.e. 1.07% were found to be important in
terms of usage by the inhabitants of study area (Figure 1).
The local people of District Kotli had developed deep bond with the plants of their area. Out of the total 93 plants, 79 plants (84.94%) were used as medicinal, 13 herbs (13.97%) as vegetables, 5 plants (5.37%) as spices & condiments, 30 herbs (32.25%) as fodder for cattle while some of the plants were found offering miscellaneous benefits to mankind. It was also observed that 49 herbs (52.68%) were reported in use only for single purpose, 35 (37.63%) for double-purpose, 7 (7.52%) for three purposes and 2 (2.15%) for multipurpose (Figure 2).
DISCUSSION
The frequently occurring herbs in the region
belonged to Family Poaceae (11 species), Labiatae (8 species), Asteraceae (7 species) and Amaranthaceae (4 species).
The affiliation between people and plants is natural because plants supply food, fodder & forage for our domestic animals, fuel wood for burning, flowers for aesthetics and merriment. The other raw materials of plants were found in use for numerous industries, timber for construction & for countless other beneficial activities especially medication. It is undoubtedly the proven fact that the remedial plants are indispensable for the preparation of a broad range of drugs and curing diseases as affirmed by Qureshi et al. (2007); Hanif et al. 2013. Although, this affiliation had fallen into comparative neglect as a result of phenomenal success of chemotherapeutic drugs, but has been gradually gaining ground and nowadays is dwelling at its previous position of eminence, as stressed by Baquar (1989). A number of countries are engaged in research on medicinal plants and their cultivation, propagation and manufacture of pure medicinal drugs. The American consumers had paid 3 million dollars for the period of 1959-74 for drugs derived exclusively from higher plants. China is acknowledged to be the leading country in the exploitation of herbs in the therapeutic preparations with exceptionally unique diversity of medicinal plants. The updated documentation and inventory of Chinese medicinal plants consists of 11,146 species (Pei, 2003).
During present study, it was discerned that the local inhabitants of the district Kotli were employing the above mentioned herbs to treat a variety of ailments like diabetes, hypertension, jaundice, gonorrhea, eczema, rheumatism, and impotency as well as against hemorrhagic septicemia, hemoglobinurea, prolepsis, anemia in

VOL. 60 (1) HERBACEOUS PLANTS OF DISTRICT KOTLI 13
cattle. Mentha royleana Benth. and Mentha spicata L., were reported to be effective against gastrointestinal disorders (like constipation, vomiting, diarrhea, dysentery, dyspepsia, etc.). Comparable uses of these plants had also been stated by Baquar (1989); Badshah et al. (1996); Ajaib et al. 2013; Zareen et al. 2013; Ajaib et al. 2014. Plants exploited as cooling agent, refrigerant, diuretic and useful remedies in urinary tract diseases (jaundice) encompassed Berginea cilliata (Haw.) Sternb., Solanum nigrum L., Taraxacum oficinale Weber. and Viola canescens Wall. ex Roxb.
In the hilly areas of District Kotli, it was investigated that the local children, while grazing their animals in the mountains, collect every probable available fraction of the profitable medicinal plants as an additional source of income. Commonly, women were found concerned with the course of drying them at home, subsequently after scattering the plants on roof, on mats or on exposed rocks, for nearly a week. The dried assembled plants were then sold directly to the regional drug dealers. Similar observations were also made by Khan et al. (2011) whilst working on the ethnomedicinal assessment of plants of Hindu-Kush Himalaya. As the local residents had modest information about the species and appropriate time of their collection, they form the poorest linkage in the trade of remedial plants. Hersch (1995) and Khan & Khatoon (2007) had also revealed similar circumstances during ethnobotanical studies in Mexico and Pakistan. Moreover, the hakims also employ these plants but according to their conventional awareness. There are roughly 50,000 registered hakims (herbal healers) in Pakistan (William & Zahoor, 1999) that provide cheaper
herbal drugs and are often acknowledged by lots of people. A single plant can frequently be used to treat several illnesses for example Ajaib et al. (2010) had documented such comparable findings while analyzing the ethnobotany of the valuable shrubs of District Kotli. They concluded that approximately every single shrub species was utilized as a valuable pharmaceutical agent. This data also matches with that of Basu (1991) on the medicinal uses of Indian plants.
Humans are using these natural assets very ruthlessly in some parts of the earth, such as in Nepal and Hindu Kush Himalayas region, where these natural resources are deteriorating more speedily than several other global regions, but had acquired little attention internationally as compared to some other ecosystems. It is the need of an hour to realize that the conventional knowledge and management schemes are as imperative as the requirements to commence the modern innovative approaches to sustainable development and administration of the natural wealth for the sake of sustainable livelihood of traditional civilizations, as cited in ICIMOD (1993) Nepal report. Comparable state of affairs prevailed during the study of District Kotli. Natives were found using flora in countless traditions throughout their daily life. The natural vegetation of the vicinity was under serious biotic and abiotic pressure as a consequence of overpopulation, overexploitation of plants especially the curative vegetation, overgrazing, illicit cutting, unabated urbanization and unauthorized collection of medicinal plants and alteration of forest land to agricultural land. Although plants had varied ethnobotanical applications, yet they were unmanaged.
Table 1: Age and gender wise distribution of questionnaire among local informants
Age group Gender No. of questionnaires
Old (50+) Male 40
Female 20
Middle age (+25) Male 35
Female 15
Youngsters Male 7
Female 3 Total = 120

14 M. AJAIB ET AL BIOLOGIA (PAKISTAN)
Table 2: List of plants of Kotli District alongwith their vernaculars, family names and ethnobotanical importance
Botanical
name/ Voucher no.
Local name Family Uses
1. Abelmoschus esculentus (L.) Moench/ SAH 1110
Bhindi/ Okra, Lady finger Malvaceae
F: Used as vegetable. S: Aphrodisiac, anti-inflammatory, anti-gonorrhea & for thickening of sperm.
2. Achyranthes aspera L./ SAH 0176
Puth kanda / Prickly chaff Amaranthaceae Wp: Diuretic, analgesic & against prolepses
in cattle.
3. Ajuga bracteosa Wall. ex Benth./ SAH 0388
Kauri Booti/ Bugle Labiatae Wp: Anti-icteric, anti-pyretic analgesic, anti-
hypertensive & anti-ulcer.
4. Allium cepa L./ SAH 0709 Piaz/ Onion Alliaceae
L: Diuretic, aphrodisiac, expectorant, anti-nicotine poisoning & also used as salad, spices & condiments. B: Stimulant.
5. Allium jaquemontii Kunth./ SAH 0710
Jangli Piaz Alliaceae B & I: Anti-inflammatory & pain killer.
6. Allium sativum L./ SAH 0711
Lahsan / Garlic Alliaceae
B & L: Antiseptic, Anti-asthmatic, anti-pertussis & is used for cardiac diseases. Besides, It is also used as flavoring agent, carminative, aromatic & as spices.
7. Alternanthera pungens Kunth./SAH 0167
Itsit Te Phakra/ Khaki weed Amaranthaceae R: Used for eye tumor.
L: Diuretic & blood purifier.
8. Amaranthus viridis L./ SAH 0384
Ganar/ Amaranth Amaranthaceae Wp: Used as vegetable. L: Used for snake bite & scorpion sting. R: Anti-menorrhagia.
9. Anagallis arvensis L./ SAH 077
Neeli Booti/ Red chick weed Primulaceae
Wp: Used as fodder for cattle. L: Anti-inflammatory, anti-fungal & wormicidal.
10. Anisomeles indica (L.) O. Kuntze/ SAH 1186
Sankhia/ Indian Catmint Labiatae Wp: Blood purifier, anti-icteric, anti-
cancerous & anti-HBV.
11. Argyrolobium roseum (Camb.) Jaub. & Spach/ SAH 0612
Makhni Booti Papilionaceae Wp: Used as fodder for cattle. L: Anti-ulcer, anti-icteric, Appetizer & used for weight gain & stomach diseases.
12. Asparagus gracilis Royle/ SAH 0693
Shah Gandal / Asparagus Asparagaceae Wp: Used as vegetable.
R & F: Aphrodisiac.
13. Asphodelus tenuifolius Cavan./ SAH 1214
Piazi/ Asphodel Asphodelaceae Wp: Diuretic, edible for animals & man, used as condiment & ornamental.
14. Barleria Chekal Acanthaceae L: Stops abortion in animals & used for

VOL. 60 (1) HERBACEOUS PLANTS OF DISTRICT KOTLI 15
cristata L./ SAH 0420
prolepses.
15. Bergenia ciliata (Haw.) Sternb./ SAH 0146
Zakhm-e-Hyat/ Stonebreaker Saxifragaceae
L: Anti-pyretic, anti-icteric, tonic, given for liver disorder, wound healing & muscular pain.
16. Boerhavia procumbens Banks./ SAH 0155
Snati, Itsit/ Hog weed Nyctaginaceae Wp: Tonic, aphrodisiac & remove iron
deficiency.
17. Brachiaria reptans (L.) Gardner & Hubbard/ SAH 1252
Sair/ Bird Seed grass, Creeping Panic Grass
Poaceae Wp: Used as fodder for cattle. L: Laxative & diuretic.
18. Buglossoides arvensis (L.) Johnston/ SAH 0639
Kalu/ Corn Gromwell Boraginaceae Wp: Fodder for cattle.
L: Sedative.
19. Campanula pallida Wall./ SAH 0409
Beli Flower Campanulaceae Wp: Anti-dysentery & used as fodder for goat.
20. Cannabis sativa L./ SAH 0369
Bhang/ Soft Hemp Cannabaceae
R: Used for liver disorders. Fl: Sedative, anodyne & narcotic. L: Anti-constipation, anti-hemorrhoid, aphrodisiac, anti-amenorrhea & used for stomach diseases, whooping cough & muscle contraction. S: Used to stop releasing sperms.
21. Capsella bursa-pastoris (L.) Medik/ SAH 0607
Phuman/ Shepherd Purse Brassicaceae Wp: Anti-hydropic & used as Fresh fodder.
22. Celosia argentea L./ SAH 0383
Lolar Sita/ Cock’s comb Amaranthaceae Wp: Used as fodder for cattle.
23. Centaurea iberica Trev.ex Sprengel/ SAH 1148
Kandiyara/ Chicory Asteraceae Fl: Tonic, demulcent & aphrodisiac.
24. Chenopodium album L./ SAH 0210
Bathwa/ Fat Hen, Goose foot Chenopodiaceae L & F: Used as vegetable & fodder.
L: Laxative & anthelmintic.
25. Cichorium intybus L./ SAH 1143
Kasni / Chicory Asteraceae Wp: Blood purifier & diuretic. L & S: Anti-pyretic, anti-emetic & anti-diarrhea.
26. Commelina benghalensis L./SAH 0212
Chura/ Day Flower, Dew Flower
Commelinaceae Wp: Used as fodder for cattle. L: Laxative, anti-inflammatory, anti-leprosy & used as vegetable.
27. Convolvulus arvensis L./SAH 0349
Hiranpadi/ Bind weed Convolvulaceae Wp: Used as fodder for cattle.
R: Purgative & diuretic. 28. Conyza canadensis (L.)
Kali Buti/ Horseweed Asteraceae Wp: Diuretic, haemostatic, anti-diarrhea &
anti-dysentery.

16 M. AJAIB ET AL BIOLOGIA (PAKISTAN)
Cronquest/SAH 0338 29. Cuscuta reflexa Roxb./SAH 0577
Neela Dhari/ Dodder Cuscutaceae
Wp: Anti-lice, anti-anemia & also used in skin diseases & other weaknesses of children.
30. Cynodon dactylon (L.) Pers./ SAH 1234
Khabal/ Lawn Grass Poaceae Wp: Diuretic, anti-toxin, heal bone fracture &
also used as fodder for cattle.
31. Cyperus rotundus L./ SAH 0153
Muthri/ Nut grass, Purple nut sedge Cyperaceae
Wp: Anti-inflammatory, anti-pyretic, anti-emetic, pain reliever, muscle relaxant & also used as Fodder for cattle.
32. Dactyloctenium aegyptium (L.) Beauv./ SAH 0379
Madhana Ghass/ Beach wiregrass Poaceae Wp: Fodder for cattle & also have healing
properties.
33. Desmostachya bipinnata (L.) Stapf/ SAH 0253
Dhib/ Haifa Grass Poaceae Wp: Diuretic, anti-amenorrhea & used also as fodder for cattle & making ropes.
34. Dichanthium annulatum (Forssk.) Stapf/ SAH 0214
Ghass/ Ringed Dichanthium, Sheda grass
Poaceae Sh: Used as fodder & forage.
35. Dicliptera bupleuroides Nees/ SAH 1180
Kaali buti Acanthaceae Wp: Used as fodder for cattle.
36. Duchsnea indicia (Andr.) Focke/ SAH 1131
Surkh Akhra Rosaceae L & F: Used for stomach diseases. F: Edible, nerve tonic, astringent & slightly laxative.
37. Eremostachys superba Royle ex Benth./ SAH 0634
Gurganna Labiatae S: Used for fish poisoning.
38. Erioscirpus comosus (Wall.) Palla/ SAH 1239
Babya Cyperaceae Wp: Used for severe abdominal & kidney pain & also for making ropes.
39. Erodium cicutarium (L.) Herit/ SAH 0700
Moni jamain Geraniaceae Wp: Used as fodder for cattle.
40. Eruca sativa Garsault/ SAH 0606
Tara mera Brassicaeae
Wp: Blood purifier & also used as fodder for cattle, oil for cooking, massage & to remove dandruff in hair. L: Used as vegetables.
41. Euphorbia prostrata Ait./ SAH 0197
Dudhli, Hazar Dani Euphorbiaceae Wp: Dermatocides, anti-diarrhea & also used
in skin diseases. 42. Euphorbia helioscopia L./ Doodal Euphorbiaceae R: Anthelmintic.
S: Anti-constipation & purgative.

VOL. 60 (1) HERBACEOUS PLANTS OF DISTRICT KOTLI 17
SAH 0635 43. Euphorbia hirta L./ SAH 0444
Dudhli Euphorbiaceae Wp: Diuretic, expectorant, cough and other pulmonary disorders. Its heavy doses cause vomiting.
44. Fumaria indica (Hausskn.) Pugsley/ SAH 0209
Papra Fumariaceae Sh: Blood purifier, diaphoretic, anti-pyretic & also used as fodder for cattle.
45. Galium aparine L./ SAH 0656
Lahndra Rubiaceae Wp: Anti-dropsy, anti-oxidant, diuretic, cure urinary bladder & kidney infection.
46. Geranium ocellatum Camb./ SAH 1120
Jandorunu Geraniaceae Wp: Astringent, diuretic & also used as fresh fodder for cattle.
47. Geranium rotundifolium L./ SAH 0563
Jandorunu Geraniaceae Wp: Astringent, diuretic & also used as fresh fodder for cattle.
48. Gloriosa superba L./ SAH 1215
Sanp booti Colchicaceae Wp: Sexual stimulant, rheumatic & also used as ornamental, but high dosage is very toxic & may cause death.
49. Heteropogon contortus L./ SAH 0198
Suryalla ghass Poaceae Wp: Used as fodder for cattle.
50. Imperata cylindrica (L.) Beauv./ SAH 0193
Kulfi Ghass Poaceae Wp: Used as fodder for cattle. L & R: Diuretic, astringent, febrifuge, styptic, antibacterial, antifungal & tonic.
51. Ipomoea hederacea Jacq./ SAH 1172
Neeli bail Convolvulaceae Wp: Used as an ornamental. S: Anthelmintic, purgative, tonic, aphrodisiac & promote menstruation.
52. Iris aitchisonii (Bakar) Boiss/ SAH 0701
Sanp Buti Iridaceae B: Diuretic, cathartic, but is toxic & should be used very carefully.
53. Lamium amplexicaule L./ SAH 0633
Motcapra Labiatae Wp: Used as fodder for cattle. L: Used as vegetable.
54. Lathyrus aphaca L./ SAH 0213
Jangli Phali Papilionaceae Wp: Used as fresh fodder for cattle.
55. Launea procumbens Roxb./ SAH 0696
Hannd Asteraceae Wp: Used as Fodder for cattle.
56. Leucas cephalotes (Roth) Spereng./ SAH 0974
Chatra Labiatae Wp: Used as fodder for cattle. L: Used as vegetable.
57. Linum usitatissimum L./ SAH 0346
Alsi Linaceae S: Anti-oxidant, anti-diabetic, anti-arthritic, anti-asthmatic, anti-allergic, anti-inflammatory & also Used for heart diseases,

18 M. AJAIB ET AL BIOLOGIA (PAKISTAN)
vitality, adrenal stress, sperm formation, retinal function, breathing difficulties, behavior problems (schizophrenia, depression) & addiction (drugs or alcohol). Used for cattle feed as well.
58. Malva parviflora L./ SAH 0352
Sonchul Malvaceae L: Anthelmintic & also Used as vegetable.
59. Malvastrum coromandelianum (L.) Garcke/ SAH 0394
Bean golden Malvaceae L & Fl: Aphrodisiac.
60. Martynia annua L./ SAH 0717
Bichhu-butti Martyniaceae L & F: Wormicidal, anti-epileptic, anti-pharyngitis, anti-rheumentic & also used in scorpion & snake bite.
61. Mentha royleana Benth./ SAH 0530
Jangli Podina Labiatae L: Stimulant, carminative, anti-dyspeptic, mouth freshener & also used for making sauce, salads, spice.
62. Mentha spicata L./ SAH 1188
Podina Labiatae L: Stimulant, aromatic, anti-spasmodic, anti-dyspeptic, stomachic & carminative.
63. Micromeria biflora Benth./ SAH 0257
Boine Labiatae Wp: Anti-emetic, anti-constipation & diuretic.
64. Oenothera rosea L.Herit.ex Ait./SAH 0284
Seh Davi Onagraceae Wp: Used as fodder for cattle & also reduces thrombosis, menopause & other degenerative diseases.
65. Oxalis corniculata L./ SAH 1121
Khati Oxalidaceae Wp: Used as fodder for cattle. L: Used as vegetable, anti-pyretic & anti-dysentery.
66. Papaver dubium L./ SAH 0622
Koko-kanga Papaveraceae Fl: Slightly sedative.
67. Papaver hybridum L./ SAH 0597
Koko-kanga Papaveraceae Fl: Slightly sedative.
68. Papaver somnifera L./ SAH 0129
Afeem Papaveraceae Fl: Sedative, narcotic, anti-dysentery, brain tonic, expectorant & strong aphrodisiac.
69. Physalis divaricata D. Don/ SAH 0123
Wild tomato Solanaceae Wp: Used as fresh fodder for cattle. F: Diuretic & tonic.
70. Plantago lanceolata L./ SAH
Isbagol Plantaginaceae L: Sore & wound healing property. S: Anti-diarrheic & anti-dysentery.
71. Plantago major L./ SAH 1190
Isbagol Plantaginaceae L: Sore & wound healing property. S: Anti-diarrheic & anti-dysentery.
72. Potamogeton nodosus Poir./ SAH 1222
Jujuli Potamogetonaceae
Wp: Excellent bio-fertilizer. L: Used for skin irritation & constipation.
73. Ranunculus muricatus L./ SAH 0676
Kor kandoli Ranunculaceae Wp: Heal snake & scorpion bite, but is also toxic plant & can be fatal to cattle.
74. Rumex Herfli Polygonaceae L: Diuretic, astringent & also soothes

VOL. 60 (1) HERBACEOUS PLANTS OF DISTRICT KOTLI 19
dentatus L./ SAH 0708
irritation caused by Urtica dioica.
75. Saccharum spontaneum L./ SAH 1225
Kai Poaceae Wp: Used as fodder for cattle, for making ropes & for roof thatching.
76. Sauromatum venosum (Ait.) Schott./ SAH 1217
Sanp Ki Makai Araceae C: Used for hemorrhagic septicemia & hemoglobin urea in buffalos & healing snakebite & tumors but it is a toxic plant.
77. Sesamum orientale L./ SAH 0195
Til Pedaliaceae S: Used in soap, hair oil & cooking the food.
78. Silene conoidea L./ SAH 0395
Dabbri Caryophyllaceae Sh: Used as vegetable. F: Edible. S & L: Used for whitening skin.
79. Silybum marianum (L.) Gaertnor/ SAH 1146
Kandyara Asteraceae S: Anti-oxidant & appetizer.
80. Solanum nigrum L./ SAH 0522
Kach Mach Solanaceae
Wp: Abortifacient. Sh: Anti-dropsy & anti-icteric. L: Used in kidney disorders & healing wound.
81. Solanum surratense Burm./ SAH 0523
Mohkri Solanaceae Wp: Expectorant, diuretic, anti-gonorrhea, anti-pyretic, stomachic & also used for cough & pain in chest.
82. Sonchus asper Vill./ SAH 1144
Dodal Asteraceae Wp: Fodder for cattle & also applied on wounds.
83. Sorghum halepense Pers./ SAH 0275
Baru Poaceae
Wp: Used to protect maize from rain & also as fodder for cattle. R: Used for serious abdominal pain, snake & scorpion bite but it is very toxic.
84. Taraxacum officinale Weber/ SAH 0335
Hund Asteraceae
L & Sh: Tonic, diuretic, anti-icteric, anti-constipation & for chronic disorders of liver & kidney. R: Used as fodder for cattle.
85. Thalictrum foliolosum DC./ SAH 0110
Beni Ranunculaceae Wp: Anti-pyretic & blood purifier.
86. Themeda anathera (Nees.) Hack/ SAH 1226
Bhari ghass Poaceae Wp: Used as fodder for cattle.
87. Tribulus terrestris L./ SAH 1119
Pakhra Zygophyllaceae F & R: Aphrodisiac & also used in urinary disorders, chronic cystitis & for curing impotence.
88. Trichodesma
Gao Zuban Boraginaceae Fl: Tonic for refreshment of brain. L & R: Used as diuretic, depurative &
20 M. AJAIB ET AL BIOLOGIA (PAKISTAN)
indica R. Br./ SAH 0376
emollient.
89. Typha domingensis Pers./ SAH 1223
Barya Typhaceae Rh: Used for amenorrhea.
90. Verbascum thapsus L./ SAH 0169
Gidar tobacco Scrophulariaceae L & Fl: Used in cough & pulmonary diseases. S: Aphrodisiac.
91. Veronica polita Fries/ SAH 1176
Sriri Scrophulariaceae Wp: Fodder for cattle.
92. Vicia sativa L./ SAH 0613 Muttri Papilionaceae Fl: Diaphoretic, febrifuge & used in eczema,
epilepsy & nervous disorders.
93. Viola canescens Wall. ex Roxb./ SAH 0648
Banafsha/ Viola Violaceae Fl: Febrifuge, diaphoretic, antipyretic & also used in epilepsy & nervous disorders. R: Laxative, diuretic & used in eczema.
B: Bulb, C: Corm, Fl: Flower, F: Fruit, I: Inflorescence, L: Leaf, Rh: Rhizome, R: Root, S: Seed, Sh: Shoot,
Wp: Whole plant.
Fig., 1: % of plant part used ethnobotanically in Kotli District Note: More than one part of some plants is used. Fl: Flower, F: Fruit, I: Inflorescence, L: Leaf, R: Root, S: Seed, Sh: Shoot, Wp: Whole plant.

VOL. 60 (1) HERBACEOUS PLANTS OF DISTRICT KOTLI 21
Fig., 2: % of plant consumption purpose used ethnobotanically by people in Kotli District (n=93)
REFERENCES
Ajaib, M., Haider, S.K, Zikrea, A. & Siddiqui, M.F.,
2014. Ethnobotanical Studies of Herbs of Agra Valley Parachinar, Upper Kurram Agency, Pakistan. Int. J. Biol. Biotech., 11 (1): 71-83.
Ajaib, M., Khan Z., Khan N. & Wahab, M., 2010. Ethnobotanical Studies on useful Shrubs of District Kotli, Azad Jammu & Kashmir, Pakistan. Pak. J. Bot., 42(3): 1407-1415.
Ajaib, M., Khan, Q. & Khan, Z., 2013. A contribution to the ethnobotanical studies of some plants of Loralai District, Baluchistan. Biologia (Pakistan), 59(2): 323-327.
Ajaib, M., Khan, Z. & Siddiqui, F.M., 2012. Ethnobotanical Study of Useful Climbers/twiners of District Kotli, Azad Jammu & Kashmir. Int. J. Biol. & Biotech. 9(4): 421-427.
Alexiades, M.N., 1996. Selected guidelines for ethnobotanical research: A field manual. New York, NY, USA: The New York Botanical Garden.
Ali, S.I. & Nasir, Y.J., 1990-92. Flora of Pakistan. No. 191-193. Islamabad, ISL, Pakistan: University of Karachi and National Herbarium, PARC.
Ali, S.I. & Qaiser, M., 1992-2012. Flora of Pakistan. Nos. 194-219. Islamabad, ISL, Pakistan: University of Karachi and National Herbarium, PARC.
Anonymous, 2008. Annual rainfall, relative humidity and temperature of District Kotli, Azad Jammu & Kashmir 2004-2010. Pakistan Metrological Department, Jail Road, Lahore.
Badshah, L, Hussain, F. & Mohammad, Z., 1996. Floristic and Ethnobotanical study on some plants of Pirgarh Hills, South Waziristan Agency, Pakistan. Pak. J. Bot. 2(2): 167-177.
Baquar, S.R., 1989. Medicinal and Poisonous Plants of Pakistan. Karachi, KHI, Pakistan: Printas.
Basu, B.D., 1991. Indian Medicinal Plants. Vol. 1-4. Delhi, DL, India: Periodical Experts Book Agency.
Berlin, B., Breedlove, D.E. & Raven, H.P., 1973. General principle of classification and nomenclature of folk Biology. Amer. Antropol. 75: 214-242.
Bye, R.A., 1981. Quelites-ethnoecology of edible green-past, present and future. J. Ethnobiol. 1: 109-123.
Cotton, C.M., 1996. Ethnobotany: Principles & Applications. London, LDN, UK: John Wiley.
Cunningham, A.B., 2001. Applied Ethnobotany: People, wild plant use and conservation. London, LDN, UK: Earthscan.
Farnsworth, N.R., 1993. Ethnopharmacology and future drug development: the North American experience. J. Ethnopharmacol. 38: 145-152.
22 M. AJAIB ET AL BIOLOGIA (PAKISTAN)
Hanif, U., Mushtaq, S., Ajaib,M. & Ishtiaq, S., 3013. Ethnobotanical studies on some wild plants of head Qadirabad and adjoining areas, Pakistan. Int. J. Phytomed., 5(3): 373-377.
Haq, I. & Hussain, Z., 1995. Medicinal plants of Palandri, District Poonch (Azad Kashmir). Pak. J. Sci., 1: 115-126.
Hersch, M.P., 1995. Commercialization of wild medicinal plants from Pueba, Mexico. Econ. Bot., 49(2): 197-206.
ICIMOD, 1998. Minutes of First Steering Committee Meeting of the HKH-FRIEN, 11-12 May 1998, Katmandu.
Jain, S.K., 1965. Medicinal plants- Lore of Tribal of Bastar. Econ. Bot., 19: 236-250.
Jain, S.K., 1995. A Manual of Ethnobotany. Jodhpor, JDH, India: Scientific Publishers.
Khan, S.W. & Khatoon, S., 2007. Ethnobotanical studies on useful trees and shrubs of Haramosh and Bugrote Valleys, in Gilgit Northern Areas of Pakistan. Pak. J. Bot., 39(3): 699-710.
Khan, N., Ahmed, M., Shaukat, S.S., Wahab, M., Ajaib, M., Siddiqui, F.M. & Nasir, M., 2011. Important Medicinal Plants of Chitral Gol National Park, (CGNP) Pakistan. Pak. J. Bot., 43(2): 797-809.
Martin, J.G., 1995. Ethnobotany: A methods manual. New York, NY, USA: Chapman and Hall.
Mohiuddin, M., Alam, M.K., Basak, S.R. & Hossain, M.K., 2012. Ethno-Medico botanical study among the four indigenous communities of Bandarban, Bangladesh. Bangladesh J. Plant Taxon. 19(1): 45-53.
Nasir, E. & Ali, S.I., 1970-89. Flora of Pakistan. No. 1-190. Islamabad, ISL, Pakistan: University of Karachi and National Herbarium, PARC.
Nasir, Y.J. & Rafiq, A.R., 1995. Wild Flowers of Pakistan. Karachi, KHI, Pakistan: Oxford University Press.
Pei, S., 2003. Diversity and modernization of traditional medicines in China. In: Proceedings of International Workshop on Medicinal and Aromatic plants, Islamabad, Pakistan, pp. 13-21.
Qureshi, R.A., Gilani, S.A. & Ghufran, M.A., 2007. Ethnobotanical studies of plants of Mianwali District Punjab, Pakistan. Pak. J. Bot., 39(7): 2285-2290.
Rao, R.R., 1981. Ethnobotany of Meghalaya: Medicinal plants used by Khasi and Garo tribes. Econ. Bot., 35: 4-9.
William, J.T. & Zahoor A., 1999. Priorities for medicinal Plants Research and Development in Pakistan. New Dalhi, ND, India.
Yusuf, M., Wahab, M.A. & Chowdhury, J.U., 2006. Ethno-medico-botanical knowledge from Kauhkali Proper and Betbunia of Rangamati District. Bangladesh J. Plant Taxon. 13(1):55-61.
Yusuf, M., Wahab, M.A., Yousuf, M., Chowdhury, J.U. & Begum, J., 2007. Some tribal medicinal plants of Chittagong Hill Tracts, Bangladesh. Bangladesh J. Plant Taxon., 14(2): 117-12.
Zareen, A., Khan, Z. & Ajaib, M., 2013. Ethnobotanical evaluation of the shrubs of Central Punjab, Pakistan. Biologia (Pakistan), 59(1): 139-147.

BIOLOGIA (PAKISTAN) 2014, 60 (1), 23-29 PKISSN 0006 – 3096 (Print) ISSN 2313 – 206X (On-Line)
*Corresponding author: Email: [email protected] Tel: +923337808665
ECOPHYSIOLOGY OF SEED GERMINATION IN NATIVE AND EXOTIC LABIATES OF BALOCHISTAN
AFROZ R KHAN2
, *MUHAMMAD SAEED1, MUHAMMAD N. SHAHWANI1.
NAZEER AHMED1, AGHA M. RAZA1 & MUHAMMAD A. KAKAR1
1Faculty of Life Sciences, Balochistan University of Information Technology Engineering & Management Sciences, Quetta 2
2Department of Botany, SBK Women’s University Quetta, Pakistan.
ABSTRACT
The effect of light and temperature on seed germination was investigated in three species of Labiatae found in Balochistan namely, Lallemantia royleana Benth. Ocimum basilicum L. and Ziziphora tenuior L. The experiments were performed at constant temperature under white light, darkness, and far-red light. The role of phytochrome in seed germination was also investigated, for this purpose the imbibed seeds were irradiated with pulses of red and far-red light of various durations. The seeds of L. royleana germinated optimally at 20 °C and were capable of germinating within a range of 15 to 25 °C, however at 15 and 25 °C a slight suppression in germination was observed under far-red light. The white light resulted in promotion of seed germination of O. basilicum while the germination was suppressed under darkness and far-red light in cooler temperatures, i.e., below 25°C. The optimum temperature for seed germination of Z. tenuior was observed to be 15 °C. The seed germination in the species was suppressed by far red light at warmer temperatures whereas white light promoted the germination. A single red light pulse was unable to promote the seed germination in all three species, however, intermittent pulses of red light promoted the seed germination in L. royleana and Z. tenuior this effect was reversed when red light was followed by far-red light. On the basis of this reversal effect the involvement of phytochrome in the seed germination of L. royleana and Z. tenuior is proposed. Key words: Balochistan, far-red light, Labiatae, phytochrome, seed germination.
_______________________________________________________________________________________
INTRODUCTION
The effect of light and temperature on seed germination was investigated in three species of Labiatae found in Balochistan namely, Lallemantia royleana Benth. Ocimum basilicum L. and Ziziphora tenuior L. The two species namely L. royeleana and Z. tenuior are the wild herbs growing in some parts of Balochistan, while an exotic variety “Greek Yevani” of O. basilicum was examined in this study. The Labiatae is an important family with about 210 genera and 3200 species. It is cosmopolitan in distribution, especially abundant in the Mediterranean region. Various species of Labiatae have been reported in different localities of Pakistan which include Chitral, Wazirstan, Parachinar, Rawalpindi, Sibi, Makran, Quetta, Zobe, Zairat and Kalat (Hedge, 1990). The plants are predominantly annual or perennial herbs and sometimes shrubs. The seeds are enclosed in one seeded nutlets and generally exhibit dormancy (Ellis et al., 1985). Seeds sense a number of environmental signals and tend to germinate when these signals provide indication of favorable conditions for seedling establishment and completion of the life cycle. The light environment of the seeds, which is perceived
by photoreceptors, plays a widely acknowledged role in this regard. The control of seed germination by light is one of the earliest documented processes; this control is manifested through phytochrome which is known to be a small family of photoreceptors (Casal & Sánchez, 1998). Phytochromes possess two photo-interconvertible forms: the red light (r) absorbing form (Pr) and the far-red light (Fr) absorbing form (Pfr). Absorption maxima of Pr and Pfr are around 660 and 730 nm, respectively. The plants examined in the present study have economic and ecological significance yet very little is known about how light and temperature affect the germination of these plants; such information plays a significant role in predicting the regeneration of these species in nature. Most of the scientific work carried out on the family relates to allelopathic effects of the plants and medicinal importance of the family (Jambere et al., 1995) with few exceptions where ecophysiology and effect of light on seed germination of Labiatae has been explored (Ellis et al., 1985; ISTA 1993; Thanos & Doussi, 1995; Thanos et al., 1995). The information regarding temperature and influence of quality of light on seed germination of the species under study is scarce, therefore these parameters are investigated in present work and results have been

24 A. KHAN ET AL BIOLOGIA (PAKISTAN)
correlated with conditions prevailing in their respective habitat.
MATERIALS AND METHODS
The seeds were obtained from Arid Zone Research Center (AZRC) Quetta, Pakistan. Following the method adopted by Doussi & Thanos (2002) the germination tests were performed with 5 replicates of 20 seeds per petri dish of 9 cm diameter. Each petri dish was lined with two layers of filter paper and moistened with 8 ml of distilled water. The criterion of seed germination was visible radicle protrusion. Final germination percentage and T50 was calculated. T50 was used to determine the speed of germination; T50 is the number of days taken to germination of 50% of all germinated seeds (Saatkamp et al., 2011).
Light sources
The red and far-red broad band irradiations were produced by a bank of tube lights (Philips 20W); the light was filtered through a combination of colored Plexiglas sheets. The red light was obtained by using single 3 mm thick red Plexiglas filter, while far-red was obtained by using two 3 mm thick blue and one 3 mm thick red Plexiglas filter. The φ, ζ and I under identical light conditions were measured with a spectroradiometer (Licor 1800, LICOR, USA); by Saeed (2000). (The φ denotes phytochrome photostationary state ratio which is [Phytochrome in fr form] / [Phytochrome in total], the ζ denotes 660/730 nm photon ratio, while I is the total fluence mol m-2 s-1). The values of φ, ζ and I are given in table 1. In case of exposure to a single pulse of light the seeds imbibed for 12 h in darkness were exposed for only one time to a 15 min of red light and 15 min red light followed by 15 min far-red light before incubation in growth chamber under dark. For intermittent pulses the treatment mentioned above was repeated every 24 h during the course of experiment, after each irradiation the seeds were returned to growth chamber. All manipulations of seeds were carried out under dim, green safe light (constructed by filtering the light of one fluorescent tube, 10 W Philips, through two Plexiglas sheets, one red-orange, and one green). Growth chamber
The experiments were performed in plant growth chamber having three compartments; each equipped with four fluorescent tubes of 20 watts, the chamber maintained temperature within ± 1 °C.
Statistical analysis The effects of light and temperature on the
percentage germination were analyzed with ANOVA models using statistical package SigmaStat 3.5. Pairwise multiple comparison procedures were performed with the Tukey’s test.
Table 1: The measured values of φ, ζ, and I under different experimental light conditions.
Light Condition
φ ζ I, μmol m -2 s-1
White Light 0.64 1.04 72.59
Far red Light 0.04 0 19.8
Red Light 0.58 1.08 45.2
RESULTS
The seeds of L. royleana, O. basilicum and
Z. tenuior were incubated at constant temperatures of 15, 20, and 25 °C, and under white light, far-red light and darkness. The response of all three species varied in relation to experimental light and temperature conditions. Significant interaction was found between light and temperature among all three species (P <0.001).
Time courses of seed germination of L. royleana, O. basilicum and Z. tenuior were obtained under darkness and 16h white light and far-red light. The final germination results are summarized in table 1. Seed germination of L. royleana.
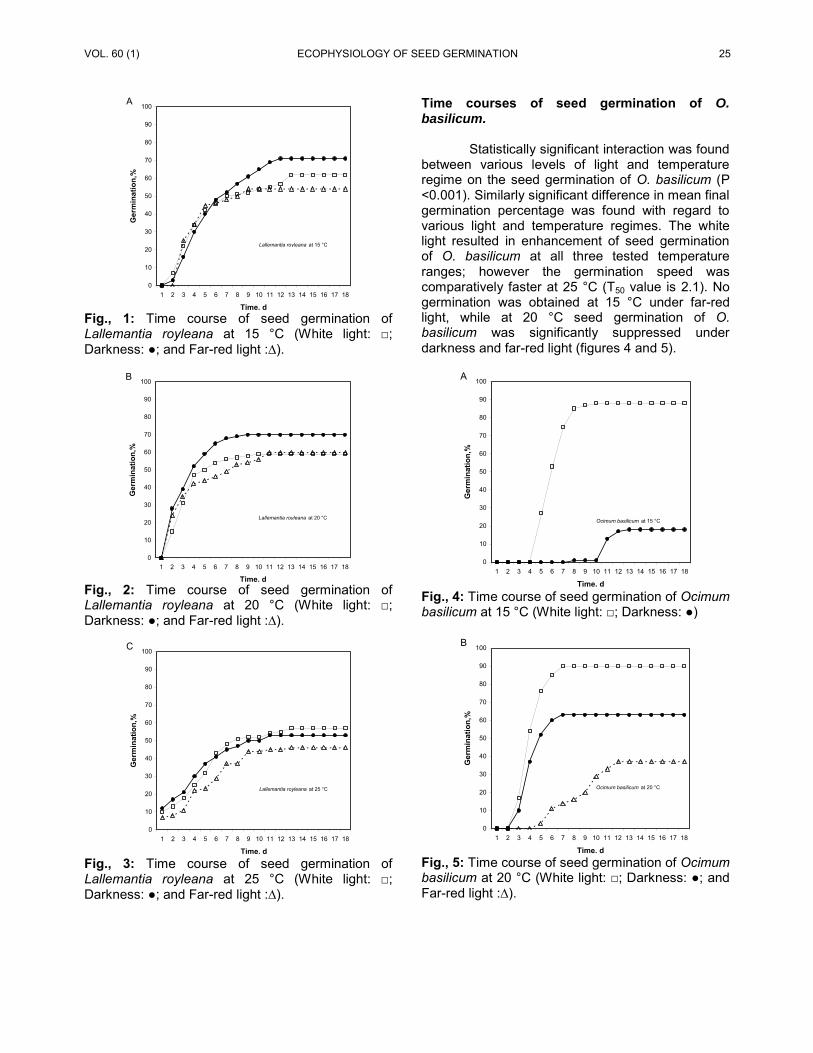
In L. royleana no significant difference in mean value of final germination percentage was observed among darkness, white light, or far-red light at 15 and 20 °C, where final germination percentage ranged from 54 to 71 %. On the other hand, at 25 °C a slight decrease was observed in the rate and final germination percentage under all three experimental light regimes, however this suppression of germination was not statistically significant (P > 0.05). The time course of seed germination of L. royleana is presented in Figures 1, 2, and 3.
VOL. 60 (1) ECOPHYSIOLOGY OF SEED GERMINATION 25
0
10
20
30
40
50
60
70
80
90
100
1 2 3 4 5 6 7 8 9 10 11 12 13 14 15 16 17 18
Time. d
Ger
min
atio
n,%
Lallemantia royleana at 15 °C
A
Fig., 1: Time course of seed germination of Lallemantia royleana at 15 °C (White light: □; Darkness: ●; and Far-red light :∆).
0
10
20
30
40
50
60
70
80
90
100
1 2 3 4 5 6 7 8 9 10 11 12 13 14 15 16 17 18
Time. d
Ger
min
atio
n,%
Lallemantia royleana at 20 °C
B
Fig., 2: Time course of seed germination of Lallemantia royleana at 20 °C (White light: □; Darkness: ●; and Far-red light :∆).
0
10
20
30
40
50
60
70
80
90
100
1 2 3 4 5 6 7 8 9 10 11 12 13 14 15 16 17 18
Time. d
Ger
min
atio
n,%
Lallemantia royleana at 25 °C
C
Fig., 3: Time course of seed germination of Lallemantia royleana at 25 °C (White light: □; Darkness: ●; and Far-red light :∆).
Time courses of seed germination of O. basilicum.
Statistically significant interaction was found between various levels of light and temperature regime on the seed germination of O. basilicum (P <0.001). Similarly significant difference in mean final germination percentage was found with regard to various light and temperature regimes. The white light resulted in enhancement of seed germination of O. basilicum at all three tested temperature ranges; however the germination speed was comparatively faster at 25 °C (T50 value is 2.1). No germination was obtained at 15 °C under far-red light, while at 20 °C seed germination of O. basilicum was significantly suppressed under darkness and far-red light (figures 4 and 5).
0
10
20
30
40
50
60
70
80
90
100
1 2 3 4 5 6 7 8 9 10 11 12 13 14 15 16 17 18
Time. d
Ger
min
atio
n,%
Ocimum basilicum at 15 °C
A
Fig., 4: Time course of seed germination of Ocimum basilicum at 15 °C (White light: □; Darkness: ●)
0
10
20
30
40
50
60
70
80
90
100
1 2 3 4 5 6 7 8 9 10 11 12 13 14 15 16 17 18
Time. d
Ger
min
atio
n,%
Ocimum basilicum at 20 °C
B
Fig., 5: Time course of seed germination of Ocimum basilicum at 20 °C (White light: □; Darkness: ●; and Far-red light :∆).

26 A. KHAN ET AL BIOLOGIA (PAKISTAN)
0
10
20
30
40
50
60
70
80
90
100
1 2 3 4 5 6 7 8 9 10 11 12 13 14 15 16 17 18
Time. d
Ger
min
atio
n,%
Ocimum basilicum at 25 °C
C
Fig., 6: Time course of seed germination Ocimum basilicum at 25 °C (White light: □; Darkness: ●; and Far-red light :∆). Time courses of seed germination of Z. tenuior.
The seeds of Z. tenuior germinated to their
maximum capacity at 15 °C under white light and darkness (97 ± 2.0 % under both light conditions), with faster rate of germination (T50 value 3.1 and 3.7 under white light and darkness respectively), while rate and final germination was significantly suppressed by far red light at 15 °C ( (figure. 7). The germination at 20 °C was enhanced under white light; however darkness resulted in suppression of germination. The seed germination was totally inhibited by far-red light at 20 °C (figure 8). The seed germination of Z. tenuior was completely suppressed at 25 °C.
0
10
20
30
40
50
60
70
80
90
100
1 2 3 4 5 6 7 8 9 10 11 12 13 14 15 16 17 18
Time. d
Ger
min
atio
n,%
Ziziphora tenuior at 15 °C
A
Fig., 7: Time course of seed germination Ziziphora tenuior at 15 °C (B) (White light: □; Darkness: ●; and Far-red light :∆).
0
10
20
30
40
50
60
70
80
90
100
1 2 3 4 5 6 7 8 9 10 11 12 13 14 15 16 17 18
Time. d
Ger
min
atio
n,%
Ziziphora tenuior at 20 °C
B
Fig., 8: Time course of seed germination Ziziphora tenuior at 20 °C (White light: □; Darkness: ●; and Far-red light :∆). Seed germination after single and intermittent 15 min pulses of red and fared light.
The results of seed germination after single 15 min pulse of light are represented in fig. 9 (A). The seeds of three species were incubated at 20 °C after irradiation with a) a single 15 min pulse of red light and b) a single pulse of red light followed by 15 min single pulse of far-red. A single 15 min pulse of red light was unable to replace the germination enhancement caused by white light in all three species, likewise a single 15 min pulse of far-red was unable to suppress the seed germination in the species, however slightly different results were obtained when seeds were irradiated with 15 min of intermittent red light followed by 15 min far-red light. In O. basilicum and Z. tenuior intermittent red light resulted in promotion of seed germination and this effect was slightly suppressed by intermittent pulse of far-red light these results are shown in fig. 9 (B).
DISCUSSION
Labiatae is predominantly a Mediterranean
family and has characteristically been known to have relatively colder range of seed germination temperature ranging from 5 to 20 °C which has been described as “Mediterranean” temperature range (Thanos & Doussi, 1995). In present studies the species have exhibited varied responses to different germination conditions. The seeds of L. royleana were non photodormant. The seed germination in O. basilicum was promoted by light, while the light favored germination of Z. tenuior only at higher temperatures, whereas cooler temperature encouraged the germination regardless of light conditions.

VOL. 60 (1) ECOPHYSIOLOGY OF SEED GERMINATION 27
Table 2. Final seed germination %, ± standard error and (T50, days) under various temperatures and light regimes
0
10
20
30
40
50
60
70
80
90
100
Red R-Far-Red Darkness
Ger
min
atio
n, %
Lalimantia royleana
Osimum basilicum
Ziziphora teniour
A
0
10
20
30
40
50
60
70
80
90
100
Red R-Far-Red Darkness
Ger
min
atio
n, %
Lallemantia royleana
Osimum basilicum
Ziziphora tenuior
B
Fig., 9. Final germination of seeds at 20 °C and incubated under darkness after exposure to a single pulse of 15 min red and single 15 min red followed by far-red pulse (A), and (B) final germination after intermittent pulse of 15 min red and 15 min red followed by far-red pulse given every 24 h. S.E. (±) is indicated by vertical bar.
The seeds of L. royleana have a broad
range of germination temperature. The species is additionally characterized by almost similar final germination at a variety of light and temperature conditions.
No photodormancy was observed in seed germination of L. royleana as seeds were capable of germinating under 16 h white light, darkness, and under far-red light. This suggests that the species is adapted to germinate under a variety of conditions; for example in gaps where direct sunlight is available, and even if seed is buried. The tolerance to the far-red light further suggests that it may germinate under the shade of other plants where value of red to far-red ratio i.e. 660/730 nm photon ratio (R: FR) is low.
The white light promoted the seed germination of Ocimum basilicum in temperature range of 15-25 °C. The germination was slightly suppressed under far-red at 20 and 25 °C, but at lower temperature of 15 °C the suppression was more profound under darkness and far-red light, suggesting that the covered seeds of O. basilicum remain dormant at 15 °C. The effect of far-red light was more prominent under suboptimal temperature. The white light has been observed to promote the seed germination of O. basilicum under all temperature levels. The germination was much quicker at 25 °C under white light as indicated by lower value of T50. The requirement of white light for seed germination in O. basilicum may be an adaptation for regeneration in gaps, the seeds having requirement of white light for germination indicate that these species may be able to form a large persistent seed bank (Kettenring et al., 2006).
Unlike earlier two species the germination of Ziziphora tenuior was favored by cooler spring
Plant 15 °C 20 °C 25 °C Light Darkness Far-red Light Darkne
ss Far-red Light Darkn
ess Far-red
Lallemantia royleana
62 ± 4.8 (4.2)
71 ± 3.3 (5.3)
45 ± 2.7 (3.3)
59 ± 4 (4.0)
70 ± 4.2 (2.7)
60 ± 6.5 (2.3)
57 ± 9.4 (2.4)
53 ± 4.3 (3.2)
46 ± 6.4 (1.8)
Ocimum basilicum
88 ± 4.6 (6.0)
18 ± 2.5 (7.6)
-- 90 ± 2.7 (4.9)
63 ± 8.0 (5.0)
37± 12.7 (3.1)
97 ± 2.0 (2.1)
86 ± 8.6 (2.4)
65 ± 9.6 (2.5)
Ziziphora tenuior
97 ± 2.0 (3.1)
97 ± 2.0 (3.7)
65 ± 10.8 (1.82)
94 ± 3.7 (4.1)
5 1± 7.9 (6.1)
-- 15 ± 13.8 (6.11)
-- --

28 A. KHAN ET AL BIOLOGIA (PAKISTAN)
temperature. The seeds germinated to full capacity at 15 °C under white light and darkness. At 20 °C white light promoted germination, whereas far-red light has completely suppressed the germination. The seed germination was completely suppressed under all light regimes at higher temperature. While working on endemic Labiates of Crete, Thanos & Doussi (1995) have observed that suboptimal temperatures (which were. 5 and 25 °C in their study) inhibited germination in some species without inducing secondary dormancy. Further investigation is needed in case of Z. tenuior to exclude or to confirm the induction of such dormancy. The germination behavior of Z. tenuior resembles typical Mediterranean one; which is characterized by seed germination at lower temperature it also implies that seed germination may occur in the beginning of spring season which is marked by low temperature and available rainfall for seedlings to establish before the onset of dry and hot summer.
A single pulse of red light did not result in enhancement of germination in all three species. The seed germination in some instances is not enhanced by a single red pulse, and continuous light or repeated pulses are needed (Hsiao & Vidaver, 1984, Grubišić & Konjević, 1990). The seeds responded differently to the exposure to intermittent red light which slightly increased the seed germination of all three species. This effect was marked in Z. tenuior and O. basilicum and was not distinct in L. royleana. Though not completely reversed; this effect was however slightly suppressed by intermittent exposure to far-red light in O. basilicum and Z. tenuior. The results imply that germination of the two species will be inhibited under canopies having low R: FR. It was also observed that exposure to intermittent red light pulse did not seem to replace the effect of 16 h white light. One reason for that might be the beneficial effect of white beyond the effect of pytochrome, the other might be the lower fluence rate of red light (as proposed by Kettenring et al,. 2006). The involvement of phytochrome in the seed germination of L. royleana and O basilicum is being proposed on the basis of effects of red light and reversal of this effect by far-red light.
The varied responses of species to different light and temperature conditions correspond to their respective climatic conditions. The seeds of L. royleana and O. basilicum have broad range of germination temperature and light requirement, L. royleana seems to be adapted to variety of habitat. The covered seeds of O. basilicum remain dormant at 15 °C. At higher temperature seed germination of Z. tenuior was suppressed which suggest the early emergence of seedlings in the field and light
requirement suggest the inhibition of germination under low R: FR environment of under canopy.
ACKNOWLEDGMENTS The cooperation of Dr. Sarfaraz Ahmed of PARC (Pakistan Agriculture Research Council), Islamabad, Pakistan is acknowledged for providing seeds and information regarding plants.
REFERENCES
Casal, J.J. & Sánchez, R.A., 1998. Phytochromes
and seed germination. Seed Sci Res. 8:317–329.
Doussi, M.A. & Thanos, C.A., 2002. Ecophysiology of seed germination in Mediterranean geophytes. 1. Muscari spp. Seed Sci. Res. 12:193–201.
Ellis, R.H., Hong, T.D. & Roberts, E.H., 1985. Handbook of Seed Technology for Genebanks.Vol. 2. Compendium of specific germination information and test recommendations. International Board for Plant Genetic Resources, Rome.
Grubišić, D. & Konjević, R., 1990. Light and nitrate interaction in phytochrome-controlled germination of Paulownia tomentosa seeds Planta. 181: 239–243.
Hedge, I.C., 1990. Labiatae. In:Flora of Pakistan. No.192. (Eds.): S.I. Ali and Y.J. Nasir. Department of Botany University of Karachi and National Herbarium, Pakistan Agricultural Research Council, Islamabad.
Hsiao, A.I. & Vidaver, W., 1984. Effects of temperature and various red or far-red irradiations on phytochrome and gibberellin A3-mediated germination control in partially hydrated lettuce seeds. J Exp. Bot. 35: 1771–1781.
ISTA (International Seed Testing Association)., 1993. International rules for seed testing. Rules and annexes. Seed Sci. Technol. Suppl. 21: 1-288.
Jembere, B., Obeng-ofori, D. & Hassanali, A., 1995. Products derived from the leaves of Ocimum kilimandscharicum (Labiatae) as post-harvest grain protectants against the infestation of three major stored product insect pests. Bull. Entomol. Res. 85: 361-367.
Kettenring, K.M., Gardner, G. & Galatowitsch, S.M., 2006. Effect of light on seed germination of eight wetland Carex species. Ann. Bot. 98: 869–874.

VOL. 60 (1) ECOPHYSIOLOGY OF SEED GERMINATION 29
Saatkamp A. Affre, L. Dutoit, T. & Poschlod P., 2011. Germination traits explain soil seed persistence across species: the case of Mediterranean annual plants in cereal fields. Ann. Bot., 107:415-426.
Saeed, M., 2000. Comparative physiology and ecophysiology of regeneration (germination, reproduction, reproductive potential) of genus Pinus. PhD thesis. National and Kapodestrian University of Athens, Greece.
Thanos, C.A. & Doussi, M., 1995. Ecophysiology of seed germination in endemic Labiates of Crete. Israel. J. Plant Sci. 43: 227-237.
Thanos, C.A., Kadis, C.C. & Skarou, F., 1995. Ecophysiology of germination in the aromatic plants thyme, savory and oregano (Labiatae). Seed Sci. Res. 5: 161-170.

BIOLOGIA (PAKISTAN) 2014, 60 (1), 31-36 PKISSN 0006 – 3096 (Print) ISSN 2313 – 206X (On-Line)
*Corresponding author’s: [email protected]
Impact of Sowing Time on Yield Parameters of Selected Wheat Cultivars under Rice-Wheat Cropping System of District Sheikhupura, Punjab
AZHAR MAHMOOD1, ANWAR JAVAID WAHLA1, RASHID MAHMOOD2*, LIAQAT ALI1 AND
MUHAMMAD NAWAZ1
1Adaptive Research Farm, Sarwar Shaheed Road, Sheikhupura
2Institute of Agricultural Sciences, University of the Punjab, Lahore,
ABSTRACT
A field study was carried out during 2010-11 to find appropriate sowing time for different wheat cultivars under rice-wheat cropping system of district Sheikhupura, Punjab, Pakistan. The experiment included six sowing dates starting from 1st November to 20th December and five wheat cultivars viz., Seher-2006, Fareed-2006, Lasani-2008, Faisalabad-2008 and Uqab-2000. Sowing time and cultivar significantly (P ≤ 0.05) affected number of fertile tillers, 1000-grains weight and grain yield of wheat. However, in case of grain yield the interaction of both the factors was non-significant. In case of each cultivar number of tillers was found maximum when sowing was done at or before 20th, particularly at 10th November, 2010. In the same way, regarding 1000-grains weight, cultivars performance was the best at sowing dates of 1st and 10th November. Among all the cultivars, maximum grain yield (2957 kg ha-1) was noted when Lasani-2008 was sown at 10th November followed by Seher-2006. All other cultivars also performed the best with sowing dates of 10th and 20th November, 2010. Keywords: Wheat cultivars, Sowing time, Grain yield, Fertile tillers, 1000-grains weight
_______________________________________________________________________________
INTRODUCTION
Wheat (Triticum aestivum L.) is an important crop cultivated for food and feed under a wide range of agro-climatic conditions. In Pakistan, it is grown on an area of 9132 thousand hectares with an annual production of 23311 thousand tons and average yield of 2553 kg per hectare (Anonymous, 2009). Owing to number of manageable problems, per hectare yield is far below than the inherent potential of wheat varieties sown in Pakistan. Among the constraints, sowing of the crop at sub-optimal time is of great importance because it does not ensure favorable environmental conditions and proper duration for each growth stage (Iqbal et al., 2001). Sowing at improper time not only affects wheat germination and growth but also disturbs grain development (Haq & Khan, 2002). Late sowing and sub-optimum temperature at sowing affects uniform stand establishment of wheat crop which results in yield reduction (Farooq et al., 2008). A serious decline in grain yield of wheat due to delay in sowing is reported by a number of researchers (Kumar et al., 2000; Subhan et al., 2004; Sial et al., 2005).
The optimum time of sowing of wheat varies with agro-ecological location. For instance, it was noted that grain yield of three long duration wheat varieties was improved when sowing date was advanced from November 15 to October 25 (Randhawa et al., 1981). Whereas, in another area
wheat sown between November 15-30 gave more grain yield (Akhtar et al., 2002; Ali et al., 2004; Tanweer et al., 2009; Khokhar et al., 2010). Inamullah et al., (2007) concluded in a field study that grain yield of different wheat varieties was decreased from 45.2% (PR-83) to 59% (PR-86) when sowing was delayed from November 25th to December 5th. Likewise, Ali et al. (2010) revealed that significantly higher wheat grain yield was obtained by sowing at November 10 followed by same variety sown on November 20.
As planting time is a crucial factor for obtaining desirable wheat yield from some specific agro-ecological zone. Therefore, a need was felt to study growth and yield behaviour of five wheat varieties at six sowing dates under irrigated conditions of Sheikhupura in rice-wheat cropping system.
MATERIALS AND METHODS
The study was carried out during 2010-11 to
evaluate the impact of sowing date on yield parameters of five wheat varieties under agro-climatic conditions of Sheikhupura, Punjab, Pakistan (31° 42° N; 73° 59° E; 209.57 m high above sea level). Wheat varieties selected for study were Seher-2006, Fareed-2006, Lasani-2008, Faisalabad-2008 and Uqab-2000. These varieties were sown at November 1, 10, 20 and 30, and December 10 and 20, 2010. The trial was laid out according to split plot design with three replications;

32 A. MEHMOOD ET AL BIOLOGIA (PAKISTAN)
by allotting sowing date to main plot and varieties to sub-plot. Plot size was set at 9.5 m x 3.2 m. Recommended dose of NPK (128-114-62 kg ha-1) was applied through urea, di-ammonium phosphate (DAP) and sulfate of potash (SOP). All P and K, and half N were applied at sowing time and remaining half N with first irrigation. The first irrigation was given 18 days after emergence and subsequent irrigations were applied according to the need of the crop.
At maturity an area of 1 m2 was randomly selected at three places in each plot, tillers with spikes were counted and averages were used in statistical analysis. All the plots were harvested at April 21, 2011 and wheat plants from each plot were tied into bundles and left for sun drying. The bundles were weighed and threshed separately. Grains from each plot were weighed and weights were converted to grain yield in kg ha-1. For 1000-grains weight, one thousand grains were randomly taken up from the grains of each plot and weights were recorded in gram on electrical balance.
Data were analyzed for analysis of variance by using the Statistex 6.1 software. Treatment means were compared by using HSD test at p ≤ 0.05.
RESULTS AND DISCUSSION
Effect of sowing time on number of fertile tillers of selected wheat cultivars
Number of fertile tillers of wheat was affected by time of sowing and genotype (cultivar), and interaction of both the factors was also found significant at P ≤ 0.05 (Table 1). In Seher-2006, maximum number of tillers was noted when the cultivar was sown at 10th or 20th November 2010, whereas tillering was reduced significantly at early or late sowing of the crop from the Nov. 10th or 20th, respectively (Table 2). Tillering in Fareed-2006 wheat cultivar was reduced significantly when sown at or after 20th of November and decline was even more with sowing at 10th or 20th of December. Similar response of fertile tillers was noted in Lasani-2008 and Faisalabad-2008, where number was also found maximum with sowing at 1st and 10th November (Table 2). Maximum number of tillers was noted when Uqab-2000 was sown in November, however, tillering was significantly reduced in December sowing of the cultivar (Table 2). Among the five wheat cultivars, tillering in Seher-2006 and Fareed-2006 was least affected by time of sowing. On average, wheat cultivars produced maximum number of fertile tillers when sown at 10th of November, 2010.
Table 1: Analysis of variance for some yield parameters of five wheat cultivars sown at six sowing times.
Source of Variation d.f. Mean square value No. of tillers 1000-grains wt. Grain yield
Replication (R) 2 165 1.47 25523 Sowing time (ST) 5 4227** 644** 2395722** Error (R x ST) 10 57 1.28 42207 Wheat Cultivar (WC) 4 135** 103** 105479** ST x WC 20 151** 42** 12945ns Error 48 28.43 1.30 17316 Table 2: Effect of sowing time on number of fertile tillers (m-2) of different wheat cultivars under agro-
climatic conditions of district Sheikhupura, Punjab, Pakaistan.
Sowing Time (2010) Wheat Cultivars
Mean Seher-2006 Fareed-2006 Lasani-
2008 Faisalabad-
2008 Uqab-2000
Nov. 1 283.7 b* 305.0 a 306.3 ab 303.0 a 301.7 a 299.9 B Nov. 10 310.7 a 312.7 a 315.0 a 312.0 a 305.7 a 311.2 A Nov. 20 305.3 a 302.7 a 287.3 bc 279.7 b 289.0 ab 292.8 C Nov. 30 281.7 b 272.7 b 275.7 cd 274.0 b 275.7 bc 275.9 D Dec. 10 279.3 b 267.7 b 264.0 d 266.7 b 271.0 c 269.7 E Dec. 20 273.3 b 272.3 b 262.7 d 263.7 b 263.0 c 267.0 E
Mean 289.0 A 288.8 A 285.2 B 283.2 B 284.3 B *Means sharing common letter(s) in a column or last row do not differ significantly at p ≤ 0.05

VOL. 60 (1) IMPACT OF SOWING TIME ON YIELD PARAMETERS OF WHEAT CULTIVARS 33
The number of fertile tillers in wheat obviously depends upon germination count, tillering and booting stages of the crop. These stages are sensitive to temperature and water availability (Shah & Akmal, 2002). A rapid decrease in maximum and minimum temperature from Nov. to Dec., 2010 may make the temperature conditions sub-optimal for the germination of wheat seeds (Figure 1a). At the mid of January, 2011, when the crop, that was sown after 20th of Nov., 2010, was at tillering stage the minimum temperature was as low as 2˚C. These temperature conditions may result in less number of tillers in late sown cultivars. Other researchers also reported a negative impact of late sowing of wheat on tillering (Aslam et al., 2003; Nazir et al., 2004; Shah et al., 2006; Inamullah et al., 2007; Qasim et al., 2008).
Effect of sowing time on 1000-grains weight of selected wheat cultivars
In case of cultivars Fareed-2006, Lasani-2008 and Faisalabad-2008, thousand grains weight was found maximum when crop was sown at Nov. 1 or 10, 2010. After that thousand grains weight was gradually decreased with late sowing of the cultivars. Seher-2006 wheat cultivar produced grains with maximum weight when it was sown at 10th of November. Early and late sowing than November 10, significantly reduced 1000-grains weight and minimum was noted in 20th December sowed Seher cultivar (Table 3). In case of Uqab-2000 thousand grains weight was decreased with delay in sowing time and compared to other sowing dates; it was significantly minimum and maximum in those treatments where the cultivar was sown at Nov. 1 and Dec. 30, respectively. Irrespective of sowing date, compared to others wheat cultivars, Lasani-2008 produced grains with maximum 1000 grains weight. Regarding 1000-grains weight, Nov. 1 and 10 were found the best dates of sowing wheat cultivars (Table 3).
Table 3: Effect of sowing time on 1000-grains weight (g) of different wheat cultivars under agro-
climatic conditions of district Sheikhupura, Punjab, Pakaistan. Sowing Time (2010) Wheat Cultivars
Mean Seher-2006 Fareed-2006 Lasani-
2008 Faisalabad-
2008 Uqab-2000
Nov. 1 34.43 b 39.13 a 39.23 a 39.97 a 41.23 a 38.80 A Nov. 10 38.40 a 36.03 a 36.57 a 37.63 a 35.00 b 36.73 B Nov. 20 28.87 c 29.87 b 31.17 c 31.97 b 31.83 bc 30.74 C Nov. 30 30.70 c 27.93 b 31.27 c 28.40 b 29.17 c 30.49 C Dec. 10 30.33 c 16.63 c 31.27 bc 21.37 c 25.30 d 25.98 D Dec. 20 24.70 d 14.60 c 27.77 c 20.70 c 18.17 e 21.19 E
Mean 32.07 B 27.37 D 33.71 A 30.01 C 30.12 C *Means sharing common letter(s) in a column or last row do not differ significantly at p ≤ 0.05
It can be seen from the meteorological data
that the atmospheric temperature increased from the mid of January to onward (Figure 1a). It is thus obvious that the late sown wheat has to face comparatively high temperature at grain filling than that sown earlier. Grain filling, particularly pre and post anthesis stages are thought to be very sensitive to high temperature (Ortiz-Monasterio et al., 1994). A heat stress at post anthesis stage may result in loss of grain weight of wheat (Wardlaw, 1990). Differences in 1000-grains weight of wheat cultivars seem to be due to their genotypic variations (French et al., 2005). These results are coinciding with those of other trials conducted on
wheat in various parts of the country (Shahzad et al., 2002; Said et al., 2012).
Effect of sowing time on grain yield of selected wheat cultivars
Grain yield of wheat was significantly (P ≤ 0.05) influenced by the sowing time and genotype. However, the interaction of these factors did not affect the grain yield (Table 1). Wheat cultivars produced statistically similar grain yield when sown in November and yield was significantly decreased with late sowing in December (Table 4). Except Seher-2006, all the wheat cultivars produced maximum grain yield when sown at 20th of November. However, Seher-2006 gave maximum

34 A. MEHMOOD ET AL BIOLOGIA (PAKISTAN)
yield when sown at November 10, 2010. Irrespective of the date of sowing, more and statistically similar grain yield was noted in Seher,
Lasani and Faisalabad than Fareed and Uqab wheat cultivars (Table 4).
Table 4: Effect of sowing time on grain yield (kg ha-1) of different wheat cultivars under agro-climatic conditions of district Sheikhupura, Punjab, Pakaistan. Sowing Time (2010) Wheat Cultivars
Mean Seher-2006 Fareed-2006 Lasani-
2008 Faisalabad-
2008 Uqab-2000
Nov. 1 2613 ab 2420 ab 2667 ab 2567 ab 2383 ab 2530 B Nov. 10 2907 a 2663 a 2957 a 2817 a 2610 a 2791 A Nov. 20 2760 ab 2687 a 2763 a 2827 a 2683 a 2744 A Nov. 30 2420 b 2167 bc 2300 bc 2220 bc 2113 b 2244 C Dec. 10 1920 c 2007 cd 1967 c 1947 c 1913 c 1951 D Dec. 20 1970 c 1733 d 1933 c 1920 c 1853 c 1882 D
Mean 2432 A 2280 BC 2431 A 2383 AB 2259 C *Means sharing common letter(s) in a column or last row do not differ significantly at p ≤ 0.05
Grain yield is an accumulative effect of
germination count, tillering, booting, grain fell and grains weight. Early or late sowing from optimum time affects more or less all the yield contributing parameter of wheat. Late-sown crop takes less number of Growing Degree Days (GDD) due to which yield components decrease and hence the economic yield of the crop suffers negatively (Lone et al., 1999). Results showed that, in rice-wheat cropping system of district Sheikhupura, Punjab, wheat cultivars express maximum yield potential when sown at 10th or 20th November. These results are in line with the findings of a number of other
researchers ( Spink et al., 2000; Aslam et al., 2003; Qasim et al., 2008; Tanweer et al., 2009; Khokhar et al., 2010; Refay, 2011; Lak et al., 2013; Yajam & Madani, 2013).
CONCLUSION
It is concluded from the results that, under agro-climatic conditions of district Sheikhupura, maximum yield potential of wheat cultivars Seher-2006, Fareed-2006, Lasani-2008, Faisalabad-2008 and Uqab-2000 may be obtained if sown from 10 to 20 November.
Fig., 1: Meteorological information of the research area; minimum and maximum temperature (a) relative humidity and rainfall (b) during the growth period of the wheat crop.
VOL. 60 (1) IMPACT OF SOWING TIME ON YIELD PARAMETERS OF WHEAT CULTIVARS 35
REFERENCES
Akhtar, M., Cheema, M. S., Ali, L. & Jamil, M., 2002. Sowing date cum varietal trial on wheat. Asian J. Plant Sci., 5: 550-551.
Ali, M. A., Ali, M. & Mohy-Ud-Din, Q., 2004. Determination of Grain Yield of Different Wheat Varieties as Influenced by Planting Dates in Agro-Ecological Conditions of Vehari. Pak. J. Life Soc. Sci., 2(1): 5-8.
Ali, M. A., Ali, M., Sattar, M. & Ali, L., 2010. Sowing date effect on yield of different wheat varieties. J. Agric. Res., 48(2): 157-162.
Anonymous 2009. Pakistan Economic Survey 2008-09, Government of Pakistan, Finance Division, Economic Advisor’s Wing, Islamabad. 24 pp.
Aslam, M., Hussain, M., Akhtar, M, Cheema, M. S. & Ali, L., 2003. Response of wheat varieties to sowing dates. Pak. J. Agron., 2(4): 190-194.
Farooq, M., Basra, S. M. A., Rehman, M & Saleem, B. A., 2008. Seed priming enhances the performance of late sown wheat by improving chilling tolerance. J. Agron. Crop Sci., 194: 55-60.
French, R. J., Schultz, J. E. & Rudd, C. L., 2005. Effect of time of sown on wheat phenology in South Australia. Austral. J. Exp. Agric. Anim. Husb., 19(96): 89-96.
Haq, N. U. & Khan, M., 2002. Effect of planting date, chlortoluran + MCPA and wheat varieties on weed control and wheat yield. Sarhad J. Agri., 18(2): 443-447.
Inamullah, Shah, N. H., Haq, Z. & Khan, F. U., 2007. An analysis of the planting dates effect on yield and yield attributes of spring wheat. Sarhad J. Agric., 23(2): 269-275.
Iqbal, M. S., Yar, A., Ali, A., Anser, M. R., Iqbal, J. & Akram, H. M., 2001. Effect of sowing dates ad seed rate on grain yield of wheat. J. Agric. Res., 39(3&4): 217-221.
Khokhar, Z., Hussain, I., Khokhar, B. & Sohail, M., 2010. Effect of planting date on yield of wheat genotypes in sindh. Pakistan J. Agric. Res., 23(3&4): 103-107.
Kumar, S., Bangarwa, A. S. & Kadian, V. S., 2000. Response of wheat varieties to sowing dates and nitrogen levels. Ann. Agric. Bio. Res., 5(1): 99-103.
Lak, M., Farnia, A. & Shaban, M., 2013. Effact of different sowing dates on yield components of wheat (Triticum aestivum L.) cultivars in Lorestan provience, Iran. Adv. Agri. Biol., 1(4): 89-93.
Lone, A. H., Shah, M. H. & Bali, A.S., 1999. Yield and economic analysis of different wheat varieties grown on different sowing dates. App. Biol. Res., 1: 155-157.
Nazir, A. & Ullah, F., 2004. Effect of different seeding rates, sown dates and weed control on grain yield of wheat. Pak. J. Weed Sci. Res., 11(3&4): 19-23.
Ortiz-Monasterio, J. I. R., Dhillon S. S. & Fischer, R. A., 1994. Date of sowing effects on grain yield and yield components of irrigated spring wheat cultivars and relationships with radiation and temperature in Ludhiana, India. Field Crops Res., 37: 169-184.
Qasim, M., Qamar, M., Fareedullah & Alam, M., 2008. Sowing date effect on yield and yield components of different wheat varieties. J. Agric. Res., 46(2): 135-140.
Randhawa, A. S., Dhillon S. S. & Dingh, D., 1981. Productivity of wheat varieties influenced by time of sowing. J. Res. Pb. Agri. Univ., 18(3): 227-233.
Refay, 2011. Yield and yield component parameters of bread wheat genotypes as affected by sowing dates. Middle-East J. Sci. Res., 7(4): 484-489.
Said, A., Gul1, H., Saeed, B., Haleema, B., Badshah N. L., & Parveen, L., 2012. Response of wheat to different planting dates and seeding rates for yield and yield components. ARPN J. Agric. Biol. Sci., 7(2): 138-140.
Shah, S. M. & Akmal, M., 2002. Effect of different sowing dates on yield and yield components of wheat varieties. Sarhad J. Agric., 18(2): 143-149.
Shah, W. A., Bakht, J., Ullah, T., Khan, A. W., Zubair, M. & Khakwani, A., 2006. Effect of sowing dates on yield and yield components of different wheat varieties. J. Agron., 5(1): 106-110.
Shahzad, K., Bakht, J., Shah, W. A., Shafi, M. & Jabeen, N., 2002. Yield and yield components of various wheat cultivars as affected by different sowing dates. Asian J. Plant Sci., 1(5): 522-525.
Sial, M. A., Arain, M. A., Khanzada, S. D., Naqvi, M. H., Dahot, M. U., & Nizamani, N.A., 2005. Yield and quality parameters of wheat genotypes as affected by sowing dates and high temperature stress. Pak. J. Bot., 37(3): 575-584.
Spink, J. H., Semere, T., Sparkes, D. L., Whaley, J. M., Foulkers, M. J., Clare, R. W. & Scott, R. K., 2000. Effect of sowing date on plant
36 A. MEHMOOD ET AL BIOLOGIA (PAKISTAN)
density of winter wheat. Ann. App. Biol., 137: 179-188.
Subhan, F., Ahmad, M., Anwar, N. H., Shah, M., Siddiq, I., Ali, J., Rahman & Sajjad, T., 2004. Response of newly developed wheat cultivars/advance lines to planting dates in the central Agro-ecological zones of NWFP. Asian J. Plant Sci., 3(1): 87-90.
Tanveer, S. K., Hussain, I., Asif, M., Mujahid, M. Y., Muhammad, S., Qamar, M. & Asim M., 2009. Performance of different wheat varieties/lines as affected by different planting dates and seeding rates under high rainfall area of potohar. Pak. J. Agri. Sci., 46(2): 102-106.
Wardlaw, I. F., Sofield, I. & Cartwright, P. M., 1980. Factors limiting the rate of dry matter accumulation in the grain of wheat grown at high temperatures. Aust. J. Plant Physiol., 7: 387-400.
Yajam, S. & Madani, H. 2013. Delay sowing date and its effect on Iranian winter wheat cultivars yield and yield components. Ann. Biol. Res., 4(6): 270-275.

BIOLOGIA (PAKISTAN) 2014, 60 (1), 37-41 PKISSN 0006 – 3096 (Print) ISSN 2313 – 206X (On-Line)
*Corresponding author:[email protected]
Effects of Nerium oleander leaves extract against Thioacetamide induced Liver injury
TASLEEM AKHTAR1, NADEEM SHEIKH1*, MUDDASIR H. ABBASI1,2 AND AFSHAN S. ABBAS1
1Department of Zoology, University of the Punjab, Q-A Campus, Lahore, 2Department of Zoology, Govt. College of Science Wahdat Road, Lahore.
ABSTRACT
Various serum proteins are synthesized in the liver. Their serum levels may reduce or elevate due to
liver disorders. Thioacetamide (TAA) is a powerful hepatotoxicant, multiple protein systems have been revealed to be injured, counting those present in the mitochondrial respiration, endoplasmic reticulum, and stress response proteins. The study was conducted to evaluate the hepatoprotective potentials of aqueous extracts of Nerium oleander leaves against thioacetamide induced liver damage in rats. Densitometric analysis revealed that the protein bands of ceruloplasmin and transferrin in TAA treated group are less dense as compared to respective bands in control sample while the group received additional 7 days N. oleander treatment showed more or less similar band densities as compared to control sample. N. oleander extract also attempted to reverse or at least minimized the effect of TAA on protein fractions of molecular weight 38, 46 and 110 KDa. Elevated level of C-reactive protein was also observed in all experimental groups as compared to control. The results obtained in the above study suggested that N. oleander extract possesses a significant hepatoprotective activity against TAA induced hepatotoxicity. More research is required to derive an optional therapeutic dose. Keywords: Thioacetamide, Hepatoprotection, Antioxidant, Hepatotoxicant, Hypoproteinemia
INTRODUCTION Liver is the main organ in the body and
plays a significant role in a variety of responsibilities mandatory to maintain homeostasis of the body. It has acquired its own significance in the physiological system (Ravichandra et al., 2013). It is concerned in nearly all biochemical pathways including overall growth, fighting against disease, nutrient supply, energy provision and reproduction. Metabolism of ingested substances like carbohydrate, lipids, proteins, storage of vitamins, and immunomodulation are the prime role of the liver (Ahsan et al., 2009; Rajesh & Latha, 2004). Most of the time liver injury is connected with disruption of these metabolic functions and consequences into disturbance in homeostasis of the body (Ramachandra et al., 2007). Liver diseases have turned out to be one of the main reasons of morbidity and death throughout the globe. But till now there is no really acceptable liver protective drug in the contemporary system of medicine, which is effective and safe. Liver injury due to drugs is the foremost contributory aspect that poses a main clinical and regulatory challenge (Russmann et al., 2009). Regardless of marvelous scientific innovation in the area of hepatology in the modern era, liver problems are getting higher (Anbarasu et al., 2012).
Plants play a vital role for the survival of life in the universe. Herbal drugs are contributing a vital role in health care programs throughout the world, primarily owing to the universal faith that they are
devoid of any side effects, in addition, being cheap and locally accessible (Singh & Abrar, 1990). The healing advantage of medicinal plants is recognized by almost every society today (Sheeja et al., 2006). Due to lack of trustworthy liver protective drugs in modern system of medicine, a huge quantity of herbal products are suggested for the cure of liver disorders (Chatterjee, 2000) and a few of them are very useful. Efforts are being made worldwide to find scientific confirmations for these traditionally documented herbal preparations (Anbarasu et al., 2012).
Nerium oleander Linn. (Family Apocynaceae), commonly known as “Kaner”, is native to Indo-Pak subcontinent (Rashan et al., 2011). This plant has been reported having noxious effects because of its number of components that may show signs of toxicity by inhibiting plasma lemma Na+, K+-ATPase (Barbosa et al., 2008). Despite its well-recognized toxic potential, all parts of plant are reputed therapeutic agents and have been used in folklore in a variety of ailments, including dermatitis, cardiac disorders, eczema, cancer, skin and heat diseases etc., (Haq et al., 1999; Singhal & Gupta, 2011; Sugimoto et al., 2000). N. oleander extract induces apoptosis in different tumor cells and this outcome is accomplished through inhibition of Na-ATPase with consequently increased level of intracellular calcium, release of mitochondrial cytochrome-C, activation of the caspase cascade, and Poly ADP

38 T. AKHTER ET AL BIOLOGIA (PAKISTAN)
Ribose polymerase (PARP) cleavage (McConkey et al., 2000). In addition, the capacity of oleandrin to obstruct activation of NF-kB (Nuclear Factor-KappaB) possibly will also add to the antitumor effect (Manna et al., 2000).
About 5% of all hospital admittance and 50% of all acute liver failure has been associated to chemical and drug induced liver injury. Thioacetamide is an organosulfur compound endowed with liver damaging and carcinogenic activity (Low et al., 2004). TAA is a model hepatotoxicant, consumed to stimulate acute and chronic liver injury due to its effects on protein synthesis, RNA, DNA and Gamma-glutamyl transpeptidase activity (Yang et al., 1998). TAA undergoes a two-step bioactivation to sulfine, and afterward to sulfene, a reactive metabolite (Amali et al., 2006; Chilakapati et al., 2005). Sulfine is accountable for the enlargement of nucleoli, increase in nuclear volume and intracellular concentration of Ca+2, change in cell permeability, and inhibit mitochondrial activity (Gupta and Dixit, 2009; Prabha et al., 2012). At the same time Sulfene is responsible for the release of nitric oxide synthase and NF-jB directing to centrilobular necrosis, protein denaturation and lipid peroxidation (Caballero et al., 2001; Lee et al., 2003; Rahman & Hodgson, 2003).
The current experimental work was carried
out to examine the hepatoprotective action of aqueous extracts of N. oleander leaves against thioacetamide (TAA) produced liver damage in wistar rats.
MATERIALS AND METHODS
Animals Healthy wistar rats (about 175±25g) were
acquired from the Department of Zoology, University of the Punjab Lahore (Pakistan), housed in wire-bottomed well-ventilated hygienic cages in an animal room under standard conditions with 12-h light/dark cycles with 25±2°C temperature. All the animals were given ad libitum access to standard laboratory pellets and drinking water. Dose preparation & administration
Dose of TAA (Sigma-Aldrich, Switzerland) was prepared by dissolving 200mg of TAA in 1L of distilled water and stirred well until all crystals were dissolved. N. oleander leaves extract (distilled water based) was purchased from commercially available source. Rats were alienated into four groups, Con
group for control animals and group I, group II and group III for experimental animals. Con group was given with normal drinking water, among the experimental groups, group I was provided with TAA (200mg/L) in drinking water for 18 weeks. Group II was given TAA (200mg/L) in drinking water for 18 weeks plus additional 7 days oral intake of N. oleander leaves extract and group III was provided with 7 days oral intake of N. oleander leaves extract. Blood sampling and processing
All the animals were anesthetized with intra-peritoneal injection of ketamine – distilled water mixture (1:1), (50 mg/ml of ketamine) and scarified. The dissections were done in aseptic conditions to draw the blood through direct cardiac puncture. 6ml of the blood was transferred to vacutainers (without any clotting factor) to separate the serum. Blood samples were kept for 2-3 hours at room temperature and after that centrifuged for 20 minutes at 4000 rpm. The serum was saved in new marked eppendorf cups and was stored at-20°C until used for Sodium Dodecyl Sulfate Polyacrylamide Gel Electrophoresis (SDS-PAGE). Evaluation of serum proteins variations
Laemmli method was used to prepare Polyacrylamide gel (Laemmli, 1970). 12% gel was used to resolve low molecular weight proteins. Low molecular weight Fermentas PageRulerTM unstained protein ladder # SM0661 was used as standard. The density of bands in a specific well was used to generate the densitometric graph to infer increase or decrease and appearance or disappearance of particular protein fractions as well as new protein fraction in comparison to control group. Gene Genius Bio-imaging Gel Documentation System was used to determine the molecular weight of the protein fractions of the samples.
RESULTS
The protein bands on the SDS-PAGE gel
were analyzed and their densities were recorded. The densitometric analysis of protein bands revealed that the protein bands of group I are less dense as compared to respective bands in control sample while the group II and group III showed more or less similar band densities as compared to control sample in term of protein density. Different bands present in the gel and variations in the normalized volume of all sera samples against molecular weight were shown in Fig.,1 a and b.

VOL. 60 (1) EFFECTS OF NERIUM OLEANDER LEAVES EXTRACT 39
Fig., 1(a): Representation of all the lanes present in the gel, (b) Electropherogram showing the variations
in Normalized volume of all sera samples against Molecular weight (kDa).
The decreased density of the protein band 4 in group I indicated the low level of Ceruloplasmin (Fig., 2a), at the same time the level of ceruloplasmin in group II was higher than group I but low as compared to control group (Fig., 2b). While ceruloplasmin level in group III was roughly similar as in control group (Fig., 2c). Transferrin (protein band 7) revealed low level in group I (Fig., 2a) and elevated level in group III as compared to control animals (Fig., 2c). While
group II showed very negligible change in Transferrin level in comparison to Con group (Fig2b). On the other side C-reactive protein (protein band 17) showed elevated level in group I and group III as compared to control animals (Fig., 2a and b). N. oleander extract seems to reverse or at least minimize the effect of TAA on protein fractions of molecular weight 38, 46 and 110 KDa (Fig., 2a and b).
Fig., 2: Electropherogram showing the comparison of, a; Group I and Control with Vol on the Y-axis and Molecular weight (KDa) on X-Axis, b; Group II and Control with Vol on the Y-axis and Molecular weight (KDa) on X-Axis, c; Group III and Control with Vol on the Y-axis and Molecular weight (KDa) on X-Axis.

40 T. AKHTER ET AL BIOLOGIA (PAKISTAN)
DISCUSSION
Hypoproteinemia condition was seen in animals treated with thioacetamide. The decreased serum protein values were usually concurrent with reduction in albumin concentration. The total protein level was down in hepatotoxic situation owing to trouble in the carbohydrate, lipid and protein metabolism or perturbed protein biosynthesis in the cirrhotic liver (Schwartz et al., 1974). Ceruloplasmin (glycoprotein) has ferroxidase activity oxidizing Fe(2+) to Fe(3+) without releasing radical oxygen species. It is involved in iron transport across the cell membrane and provides Cu2+ ions for the ascorbate-mediated deaminase degradation of the heparan sulfate chains of GPC1 (Heijnen et al., 2006). In this study N.oleander enhance the ceruloplasmin level which was initially low as compared to control animals owing to TAA treatment. The deccrease in the ceruloplasmin level of TAA group is a consequence of thioacetamide induced cellular toxicity which affected the synthetic capacity of liver. Interestingly, plant extract preserved the synthetic capacity of the liver as evident from the results. The majority of cells in the living being obtain iron from transferring, a plasma glycoprotein. Uptake of iron from transferrin engaged the transferrin binding to the transferrin receptor, transferrin internalization inside an endocytic vesicle through receptor-mediated endocytosis, and followed by a decrease in endosomal pH resulting release of iron from the protein (Ponka et al., 1998). Low transferin level in group one might be due to adverse effect of TAA on iron regulatory genes. Decreased level of transferrin in TAA treated group than N. oleander treated and control groups further indicating the hepatoprotective potential of the N. oleander extract. C-reactive protein exhibits numerous functions linked with host defense: it promotes agglutination, phagocytosis and complement fixation due to its calcium-dependent binding to phosphoryl choline. C-reactive protein also has the ability to interact with cytokines, Leptin Precursor, Endothelin-1 Precursor, Oxidized low-density lipoprotein receptor 1 and tumor necrosis factor-alpha (Nunez et al., 1991). Rise in the level of C-reactive protein in group II and III indicate acute inflammation resulting from N. oleander extract.
CONCLUSION Taken together these findings, it can be
concluded that N. oleander extract has the potential to reverse or at least minimize the liver
injury caused by TAA due to its potential anti carcinogenic effect. However, purification of different chemical components from N. oleander extract without having inflammation belongings is required before the extract can be used for any kind of protective treatment.
REFERENCES
Ahsan, M.R., Islam, K.M., & Bulbul, I.J., 2009.
Hepatoprotective activity of methanol extract of some medicinal plants against carbon tetrachloride-induced hepatotoxicity in rats. Eur J Sci Res., 37: 302-310.
Amali, A.A., Rekha, R.D., Lin, C.J., Wang, W.L., Gong, H.Y., Her, G.M., & Wu, J.L., 2006. Thioacetamide induced liver damage in zebrafish embryo as a disease model for steatohepatitis. J. Biomed. Sci., 13: 225-232.
Anbarasu, C., Rajkapoor, B., Bhat, K., Giridharan, J., Amuthan, A.A., & Satish, K., 2012. Protective effect of Pisonia aculeata on thioacetamide induced hepatotoxicity in rats. Asian Pac. J Trop. Biomed, 2: 511-515.
Barbosa, R.R., Fontenele-Neto, J.D., & Soto-Blanco, B., 2008. Toxicity in goats caused by oleander (Nerium oleander). Res. Vet. Sci., 85: 279-281.
Caballero, M.E., Berlanga, J., Ramirez, D., Lopez-Saura, P., Gozalez, R., Floyd, D.N., Marchbank, T., & Playford, R.J., 2001. Epidermal growth factor reduces multiorgan failure induced by thioacetamide. Gut, 48: 34-40.
Chatterjee, T.K., 2000. Medicinal plants with hepatoprotective properties in herbal options. In: Herbal Options, Books and Allied (P) Ltd, Calcutta, 135 pp.
Chilakapati, J., Shankar, K., Korrapati, M.C., Hill, R.A., & Mehendale, H.M., 2005. Saturation toxicokinetics of thioacetamide: role in initiation of liver injury. Drug Metab Dispos., 33: 1877-1885.
Gupta, N.K., & Dixit, V.K., 2009. Hepatoprotective activity of Cleome viscosa Linn. extract against thioacetamide-induced hepatotoxicity in rats. Nat. Prod. Res., 23: 1289-1297.
Haq, M.M., Jabbar, A., Rashid, M.A., & Hasan, M., 1999. A novel antibacterial and cardiac steroid from the roots of Nerium oleander. Fitoterapia, 70: 5-9.

VOL. 60 (1) EFFECTS OF NERIUM OLEANDER LEAVES EXTRACT 41
Heijnen, B.H., Straatsburg, I.H., Padilla, N.D., Van Mierlo, G.J., Hack, C.E., & Van Gulik, T.M., 2006. Inhibition of classical complement activation attenuates liver ischaemia and reperfusion injury in a rat model. Clin. Exp. Immunol., 143: 15-23.
Laemmli, U.K., 1970. Cleavage of structural proteins during the assembly of the head of bacteriophage T4. Nature, 227: 680-685.
Lee, J.W., hin, K.D., ee, M., Kim, E.J., Han, S.S., Han, M.Y., Ha, H., Jeong, T.C., & Koh, W.S., 2003. Role of metabolism by flavin-containing monooxygenase in thioacetamide-induced immunosuppression. Toxicol. Lett., 136: 163-172.
Low, T.Y., Leow, C.K., Salto-Tellez, M., & Chung, M.C., 2004. A proteomic analysis of thioacetamide-induced hepatotoxicity and cirrhosis in rat livers. Proteomics, 4: 3960-3974.
Manna, S.K., Sah, N.K., Newman, R.A., Cisneros, A., & Aggarwal, B.B., 2000. Oleandrin suppresses activation of nuclear transcription factor-kappaB, activator protein-1, and c-Jun NH2-terminal kinase. Cancer Res., 60: 3838-3847.
McConkey, D.J., Lin, Y., Nutt, L.K., Ozel, H.Z., & Newman, R.A., 2000. Cardiac glycosides stimulate Ca2+ increases and apoptosis in androgen-independent, metastatic human prostate adenocarcinoma cells. Cancer Res., 60: 3807-3812.
Nunez, D.J., Taylor, E.A., Oh, V.M., Schofield, J.P., & Brown, M.J., 1991. Endothelin-1 mRNA expression in the rat kidney. Biochem. J., 275: 817-819.
Ponka, P., Beaumont, C., & Richardson, D.R., 1998. Function and regulation of transferrin and ferritin. Semin. Hematol., 35: 35-54.
Prabha, S.P., Ansil, P.N., Nitha, A., Wills, P.J., & Latha, M.S., 2012. Preventive and curative effect of methanolic extract of Gardenia gummifera Linn. f. on thioacetamide induced oxidative stress in rats. Asian Pac J Trop Dis., 2(2)90-98.
Rahman, T.M., & Hodgson, H.J., 2003. The effects of early and late administration of inhibitors of inducible nitric oxide synthase in a thioacetamide-induced model of acute hepatic failure in the rat. J. Hepatol, 38: 583-590.
Rajesh, M.G., & Latha, M.S., 2004. Preliminary evaluation of the antihepatotoxic activity of
Kamilari, a polyherbal formulation. J. Ethnopharmaco, 91: 99-104.
Ramachandra, S.S., Quereshi, A.A., Viswanath Swamy, A.H., Patil, T., Prakash, T., Prabhu, K., & Veeran, G.A., 2007. Hepatoprotective activity of Calotropis procera flowers against paracetamol-induced hepatic injury in rats. Fitoterapia, 78: 451-454.
Rashan, L.J., Franke, K., Khine, M.M., Kelter, G., Fiebig, H.H., Neumann, J., & Wessjohann, L.A., 2011. Characterization of the anticancer properties of monoglycosidic cardenolides isolated from Nerium oleander and Streptocaulon tomentosum. J. Ethnopharmacol, 134: 781-788.
Ravichandra, V.D., Ramesh, C., & Sridhar, K.A., 2013. Hepatoprotective potentials of aqueous extract of Convolvulus pluricaulis against thioacetamide induced liver damage in rats. Biomedicine and Aging Pathology, 3: 131-135.
Russmann, S., Kullak-Ublick, G.A., & Grattagliano, I., 2009. Current concepts of mechanisms in drug-induced hepatotoxicity. Curr. Med. Chem., 16: 3041-3053.
Schwartz, W.L., Bay, W.W., Dollahite, J.W., Storts, R.W., & Russell, L.H., 1974. Toxicity of Nerium oleander in the monkey (Cebus apella). Vet. Pathol., 11: 259-277.
Sheeja, K., Shihab, P.K., & Kuttan, G., 2006. Antioxidant and anti-inflammatory activities of the plant Andrographis paniculata Nees. Immunopharmacol. Immunotoxicol., 28: 129-140.
Singh, V.K., & Abrar, M., 1990. Medicinal plants and folklores: a strategy towards conquest of human ailments.. Today and tomorrow printers and publishers, New dehli. 1-250 pp.
Singhal, K.G., & Gupta, G.D., 2011. Some Central Nervous System Activities of Nerium Oleander Linn (Kaner) Flower Extract . Trop J Pharm Res, 10(4): 455-461.
Sugimoto, H., Kataoka, T., Igarashi, M., Hamada, M., Takeuchi, T., & Nagai, K., 2000. E-73, an acetoxyl analogue of cycloheximide, blocks the tumor necrosis factor-induced NF-kappaB signaling pathway. Biochem. Biophys. Res. Commun., 277: 330-333.
Yang, J.M., Han, D.W., Xie, C.M., Liang, Q.C., Zhao, Y.C., & Ma, X.H., 1998. Endotoxins enhance hepatocarcino-genesis induced by oral intake of thioacetamide in rats. World J. Gastroenterol., 4: 128-132.

BIOLOGIA (PAKISTAN) 2014, 60 (1), 43-55 PKISSN 0006 – 3096 (Print) ISSN 2313 – 206X (On-Line)
*Corresponding author: [email protected] Contact No. 0334-9768419
Floral Diversity of Tolipir National Park (TNP), Azad Jammu and Kashmir, Pakistan
ABU-UL-HASSAN FAIZ1, MOHAMMAD ASAD GHUFARN2, AFSAR MIAN3 AND TANVEER AKHTAR1
1Department of Zoology, University of Punjab, Lahore, Pakistan.
2Department of Environmental Science, International Islamic University, Islamabad, Pakistan 3Bioresource Research Centre (BRC), 34-Bazar Road, G-6/4, Islamabad, Pakistan
ABSTRACT
The present paper describes the floral diversity of the Tolipir National Park to develop the base line
information about species composition and community structure . Survey of the floral diversity of that area was conducted in summer 2012. According to this survey, 35 tree species, 19 shrubs, 3 epiphytes, 4 climbers, 75 herbs, 10 ferns, 1 moss and 1 lichen species were recorded. The present results suggested a relatively long list of plant species (158) for an area of 50 Km2, yet such a diversity can be expected under diversity in the physical conditions and hence the associated habitat conditions, i.e., variation in altitudes (1,367 – 2,617 m asl.), diversity in land exploitation pattern (arable terrace agriculture interspersed with the wild forested vegetation and ecotone effect), topographic diversity (hill slopes and plain hill tops having grasslands, and ravines with different degree of moisture conditions) and moisture conditions (deeper ravines with thick forested vegetation cover, hardly receiving the sun light, to open mountain ridges). The study suggested that the park area was rich in floral diversity, which needed rapid conservation measures. In future, further detailed studies can add some other rare species into this list. Keywords: Tolipir National Park, species composition, community structure.
_______________________________________________________________________________________
INTRODUCTION
Plants clearly respond to environmental gradient, and plant distribution is believed to be a result of interactions among local environmental factors, physiographic tolerances and competitive dynamics (Palmer, 1994). Mountains are the most remarkable land forms on earth surface with prominent vegetation zones. Almost every type of climate can be found in mountains and a wide variety of flora form a gradient from tropical vegetation to alpine meadows. Vegetation types differ with changes in altitude and altitudinal patterns of plant species diversity have long been attracting the attention of ecologists (Adhikari et al., 1992, Fang, 2004).
Plants in nature occur in repeating groups of associated plants, called communities. The structure of a community is determined mainly by the dominating plant species and not by other characteristics (Odum, 1971).Plant association is stable plant group in equilibrium with the surrounding environment and characterized by certain dominant species revealing a particular ecology (Blanquet, 1928).The community structure and distribution patterns are poorly understood, because they have not been given due attention by plant ecologists to date (Peer et al., 2007).
The Himalayan forest vegetation ranges from tropical dry deciduous forests in the foothills to
alpine meadows above timberline (Singh, 1992). Numerous studies about distribution of plants communities in Himalayas are present (Champion et al., 1965; Beg 1975; Malik et al., 1990, 1994, 2004, 2005,2007 ; Nazir et al.,2012) which have reported vegetation of different areas of the Azad Jammu and Kashmir. Some work has been undertaken on the vegetation on one hill of Tolipir (Hamayun, 2010).
The area under the state of Azad Jammu and Kashmir (AJK) is under tremendous pressure of overexploitation of medicinal plants due to local economic uplift, animal treatment and herbal doctors (Ahmed, 1999; Khan, 1951). Different areas of (AJK) from the botanical point ofview, have been investigated by different workers, such as, Neelum valley (Qamar & Minhas, 2006), Samahni valley (Ishtiaq et al., 2006; Khan et al., 2004), Ponch valley (Khan, 1985; Sidique, 1991), and Palandri (Haq & Hussain, 1995). Tolipir area, from the botanical point of view, is one of the least investigated area of the (AJK) with exception of a few contributions made (Hamayun, 2010).
Present study was designed to investigate the floral diversity of Tolipir National Park. Local wisdom on ethno-botany was also collected.
MATERIALS AND METHODS
Tolipir (33o NL, 73o E, top altitude some
2,621 meter) gets its name from a mausoleum
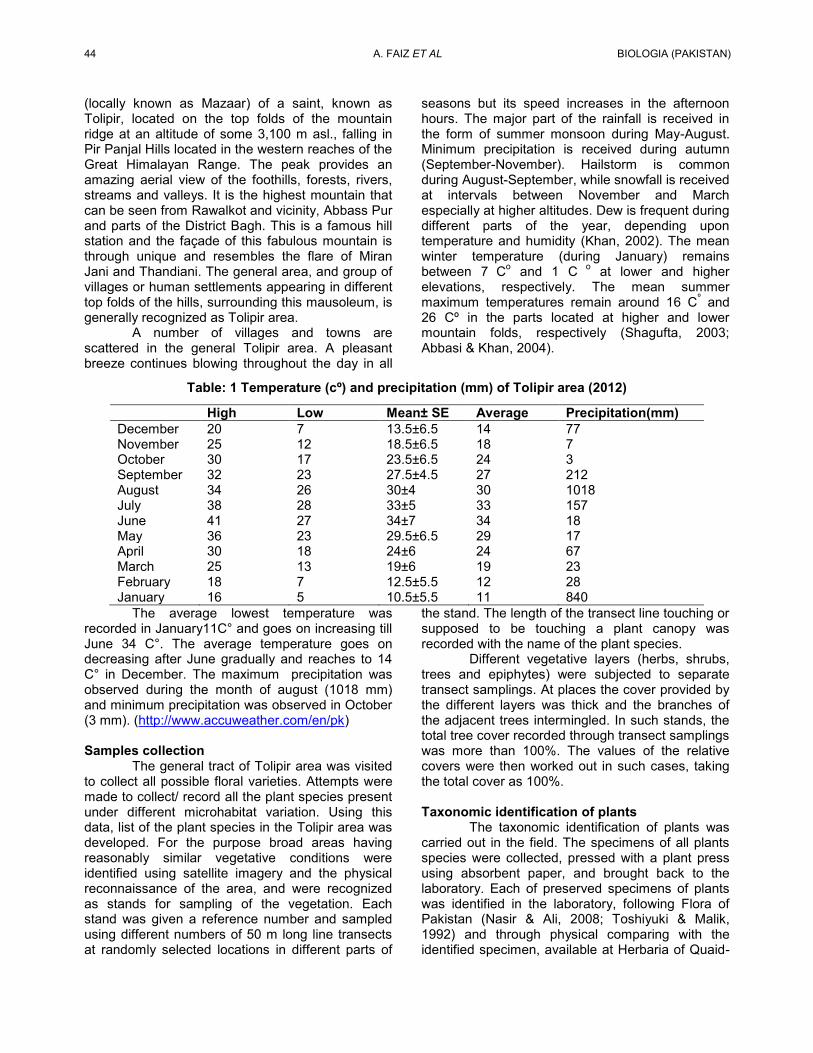
44 A. FAIZ ET AL BIOLOGIA (PAKISTAN)
(locally known as Mazaar) of a saint, known as Tolipir, located on the top folds of the mountain ridge at an altitude of some 3,100 m asl., falling in Pir Panjal Hills located in the western reaches of the Great Himalayan Range. The peak provides an amazing aerial view of the foothills, forests, rivers, streams and valleys. It is the highest mountain that can be seen from Rawalkot and vicinity, Abbass Pur and parts of the District Bagh. This is a famous hill station and the façade of this fabulous mountain is through unique and resembles the flare of Miran Jani and Thandiani. The general area, and group of villages or human settlements appearing in different top folds of the hills, surrounding this mausoleum, is generally recognized as Tolipir area.
A number of villages and towns are scattered in the general Tolipir area. A pleasant breeze continues blowing throughout the day in all
seasons but its speed increases in the afternoon hours. The major part of the rainfall is received in the form of summer monsoon during May-August. Minimum precipitation is received during autumn (September-November). Hailstorm is common during August-September, while snowfall is received at intervals between November and March especially at higher altitudes. Dew is frequent during different parts of the year, depending upon temperature and humidity (Khan, 2002). The mean winter temperature (during January) remains between 7 Co and 1 C o at lower and higher elevations, respectively. The mean summer maximum temperatures remain around 16 Cº and 26 Cº in the parts located at higher and lower mountain folds, respectively (Shagufta, 2003; Abbasi & Khan, 2004).
Table: 1 Temperature (cº) and precipitation (mm) of Tolipir area (2012)
High Low Mean± SE Average Precipitation(mm) December 20 7 13.5±6.5 14 77 November 25 12 18.5±6.5 18 7 October 30 17 23.5±6.5 24 3 September 32 23 27.5±4.5 27 212 August 34 26 30±4 30 1018 July 38 28 33±5 33 157 June 41 27 34±7 34 18 May 36 23 29.5±6.5 29 17 April 30 18 24±6 24 67 March 25 13 19±6 19 23 February 18 7 12.5±5.5 12 28 January 16 5 10.5±5.5 11 840
The average lowest temperature was recorded in January11C° and goes on increasing till June 34 C°. The average temperature goes on decreasing after June gradually and reaches to 14 C° in December. The maximum precipitation was observed during the month of august (1018 mm) and minimum precipitation was observed in October (3 mm). (http://www.accuweather.com/en/pk)
Samples collection
The general tract of Tolipir area was visited to collect all possible floral varieties. Attempts were made to collect/ record all the plant species present under different microhabitat variation. Using this data, list of the plant species in the Tolipir area was developed. For the purpose broad areas having reasonably similar vegetative conditions were identified using satellite imagery and the physical reconnaissance of the area, and were recognized as stands for sampling of the vegetation. Each stand was given a reference number and sampled using different numbers of 50 m long line transects at randomly selected locations in different parts of
the stand. The length of the transect line touching or supposed to be touching a plant canopy was recorded with the name of the plant species.
Different vegetative layers (herbs, shrubs, trees and epiphytes) were subjected to separate transect samplings. At places the cover provided by the different layers was thick and the branches of the adjacent trees intermingled. In such stands, the total tree cover recorded through transect samplings was more than 100%. The values of the relative covers were then worked out in such cases, taking the total cover as 100%.
Taxonomic identification of plants
The taxonomic identification of plants was carried out in the field. The specimens of all plants species were collected, pressed with a plant press using absorbent paper, and brought back to the laboratory. Each of preserved specimens of plants was identified in the laboratory, following Flora of Pakistan (Nasir & Ali, 2008; Toshiyuki & Malik, 1992) and through physical comparing with the identified specimen, available at Herbaria of Quaid-

VOL. 60 (1) FLORAL DIVERSITY OF TOLIPIR NATIONAL PARK 45
e-Azam Campus University of Punjab (Lahore), Pakistan Natural History Museum, Islamabad and Bio Resource Research centre (BRC) Islamabad (Pakistan).
The transect data was suitably pooled to develop estimates on the vegetative cover occupied by different plant species and the total vegetative cover of the stands. The stand data was subject to computer based ordination to develop vegetation types, based upon the stand similarities in the vegetative composition. The distribution of different phyto-sociological communities was placed on the digitized map of Tolipir area, taking the help of satellite imagery.
Data collection from local community
The possible use of the plant species was determined through the information gathered from the local population (after taking the information consent) and the literature searched. The data was collected through formulated questionnaire based on interviews by resident of different villages of Tolipir area to obtain information on possible uses of each plant species. Meetings were also arranged with village heads or elected councilors. Oral Interviews using questionnaires were organized during summer (May-September, 2012). People from different socio-economic background from each locality were interviewed including herdsmen, plant collectors, hakims, social activists, traditional healers, ethnic groups and market dealers about presence and use and harvesting of medicinal plants in the area. During interview of people, the women were concentrated more than other fractions of population due to their regular and strong relationship with indigenous knowledge practices.
RESULTS
Species Diversity The plant survey, carried out during April-
May, 2012, identified a total of 158 plant species (35 tree species (including gymnosperm), 19 shrubs, 3 epiphytes, 4 climbers,75 herbs,10 ferns, one moss and one lichen species) distributed in different parts of Tolipir area (Table 2). Phyto-sociology
The association analysis on the stand data on the vegetative cover occupied by different plant species, using Wards’s (linkage) and Euclidian methods ( measure of distance) identified three main vegetative types, based upon 80% similarity index, occupying different parts of Tolipir area is shown in Table 3.The association analysis is presented in dendrogram in Fig., 2. The percentage relative cover shared by different plant species in
different vegetative types have been presented in Table 4. The general distribution of these vegetation types in the Tolipir area has been mapped in Figure 1. Aesculus indica is the only species of trees present in all the vegetative types, contributing different vegetative covers in different vegetation types, ranging between as low as 1% in a vegetative type and 98% in other vegetative types. The species emerges as the dominant species in three and subdominant in one vegetative type. Achellia millefolium, Artemisia dubia, Senecio chrysanthemoides and Adiantum capillus-veneris are four other species, which show their presence in all the vegetation types, created under the present analysis.
Ethno-botany
Almost all the plant species of Tolipir area are being traditionally exploited by the local populace in one way or the other, i.e., medicine, fodder, forage, timber and furniture wood, human food, fuel wood, construction material, decoration, vegetable and flavoring agents, etc., to different degrees. Most of the species are exploited in more than one way. The use of plants as traditional medicine is widespread throughout the world. Many species of the study area are known to be used in treatment of different ailments.
Majority of human population depends on traditional medicine for their primary health and needs. The world market for herbal products based on traditional knowledge is now estimated to be worth US $ 60 million WHO (2002). A growing awareness of this new contributor to the foreign exchange reserves of several national treasuries is beginning to emerge. To satisfy growing market demands, surveys are being conducted to unearth new plant sources of herbal remedies and medicines (Hoareau, 1999). Hamalayas, has rich diversity of plant species and has been regarded as a treasure of medicinal plants. The study area of Poonch valley is also gifted with a variety of herbsand medicinal plant resources. Medicinal plants had continued to be used extensively as a major source of drugs for the treatment of many ailments.
The people of Tolipir area like other people has dependent upon plant resources for their medicinal requirements and in this way a traditional system of folk recipes had evolved in the area over a period of time. As discovered in present research, people use plant species for curing different ailments.
Different plant species are being exploited traditionally for different uses.The fruit of Aesculus indica is used for rheumatic pains, and parts of

46 A. FAIZ ET AL BIOLOGIA (PAKISTAN)
Albizia lebbek to cure piles, diarrhea, dysentery, gonorrhea, skin diseases and leprosy. Nerium oleander has a value in treating snakebite cases. Artemisia dubia and Dioscorea deltoidea are used as vermicide. The diluted aqueous root extracts of Berberis lyceum is used as an eye lotion and blood purifier; and for the treatment for skin diseases, chronic diarrhea and piles. Euphorbia helioscopia has a value in curing for cholera; Mentha royleana for stomach disorder, gas trouble, indigestion, vomiting, cholera, fever and cough; Ficus palmata in diseases of lungs and the urinary bladder; Fumaria indica fever, constipation, pimples and skin infections to purify blood. Fresh leaves of Hedera nepalensis are used in the treatment of diabetes. The oil of Juglans regia is used to treat the rheumatic pain. Fruits of Myrsine africana are used as an anthelmintic, carminative, stomachic, laxative in dropsy and colic. Ointment prepared from it is considered effective against worms and skin diseases. Leaves of Plantago lanceolata and Rumex dentatus are applied to treat wounds and cutaneous infections. The leaves and shoots of Sarcococca saligna are boiled and applied on swollen joints and pains. Taraxacum officinale is used to treat the jaundice, kidney and liver disorder. Trichodesma indicum is used to cure diarrhea, dysentery, stomach inflammation, joint swelling, to make wound soft, stomach disorder and to kill intestinal worms in cattle. Verbascum thapsus is used to cure diarrhea and dysentery of cattle; an analgesic and antiseptic agents, piles, healing the wounds and ring worms. Valeraina jatamansi and V. Pyrolifolia have aromatic oil which is used in preparation of tranquilizers and remedy for suppression of urine. A number of species, including, Viola canscens, V. pilosa, Adiantum capillus-veneris and Rumex hastatus are effective at the cold, cough and asthma. Zanthoxylum armatum are used to cure gas trouble, cholera, stomach disorder, piles, mouth gum, toothache and indigestion. A number of species are used as food/ fruit, which includes Pyrus malus, P. pashia, Prunus armeniaca, P. persica, Ficus palmata, Duchesnea indica and Fragaria nubicola. Juglansregia the “Kaghzi” variety of walnut is valued for its thin shell and edible fruit. Leaves are also used as fodder for cattle, goats, and sheep; the plant is used as firewood when dry. Punica granatum is used as fruit; leaves are used as fodder for goats and sheep; as fuel wood. The fruits of Viburnum grandiflorum and Rubus fruticosus are edible; leaves and branches are used as fodder for livestock and as a fuel wood.
Six tree species, i.e., Abies pindrow, Pinus roxburgii, Pinus wallichiana, Populus ciliata and
Juglans regia, are frequently exploited as timber wood; used for construction of building and preparation of furniture. Juglans regia has a special value in furniture industry; while its bark is used as dye, which is good for carving and for gunstocks. The bark is also good for the gums and sold in the local market under the name “Dandasa” which is used for cleaning the teeth. Pinus roxburgii leaves are used as mud roof thatching and as anti-racking agent in mud plasters. It is valuable for its resin extract, which is used in the varnishes and Turpin.
The prominent fuel wood species, like, Aesculus indica, Clematus grata, Salix acmophylla, Dicliptera bupleuroides and Cederala serrata are widely used in cooking and warming the houses. Both the wood and branches are used as fuel wood. The wood of Quercus incana is used as firewood and for making charcoal.
Plants are important as livestock fodder. Aesculus indica, Albizia lebbek and Prunu spersica leaves are lopped off and used as fodder for livestock. Viburnum grandiflorum and Myrsine africana leaves and branches are used as fodder and as a fuel wood. Other plant species lies Adiantum capillus-veneris, Celtis caucasica, Hedera nepalensis,Oenothera rosea, Rumex hastatus,Trifolium repens and Urtica dioica are used as fodder.Gerbera gossypina leaves and rhizome are given as fodder to milk producing (cattles) to increase milk products. Branches of Indigofera heterantha are used for preparation of sweeping material and making roof of huts and houses. It is also used as a fodder for the livestock.
DISCUSSION
The present results suggested a relatively
long list of plant species (158) for an area of some 50 km2, yet such a diversity can be expected under diversity in the physical conditions and hence the associated habitat conditions, i.e., variation in altitudes (1,367 – 2,617 m asl.), diversity in land exploitation pattern (arable terrace agriculture interspersed with the wild forested vegetation and ecotone effect), topographic diversity (hill slopes and plain hill tops having grasslands, and ravines with the different degree of moisture conditions) and moisture conditions (deeper ravines with thick forested vegetation cover, hardly receiving the sun light, to open mountain ridges).
The present list of the plants is based upon a rapid phyto-diversity assessment, undertaken during spring. Therefore, more detailed sampling, carried out during different parts of the year, may add some other species into this list, especially the monsoon ephemerals and the rare ones. The

VOL. 60 (1) FLORAL DIVERSITY OF TOLIPIR NATIONAL PARK 47
present phyto-diversity also does not include the plants belonging to lower taxonomic groups, i.e., soil algae and fungi, and aquatic flora associated with the water bodies or the moist soils. No previous survey on the plant diversity is available specifically attempting Tolipir area. A recently conducted Ph.D. research is available on the biodiversity and ethno-botany of the general Poonch valley (AJK), which records a total of 169 plant species for the valley (Khan, 2008). The present list of plants is not directly comparable with the one presented previously which can be expected under the difference in nature and focus of the two studies. The list of Khan (loccit) caters a much wider area (which also includes the general Tolipir area) and concentrates mainly on the species having appreciable known ethno-botanical use. The present list, on the other hand, deals with the general phytodiversity of the tract falling under Tolipir area. The list of Khan (loccit), however, runs inconsiderable proximity to the present one, and keeping to the size of the area, the Tolipir area can be regarded as holding a rich phyto-diversity, attributable to diversity in the habitat conditions.
One species of gymnosperm (conifers), i.e., Abies pindrow (partal or silver fir) is the dominant species in selected patches while Pinus wallichiana (biar or blue pine) and P. roxbeghii (Chir) have wider distribution but distributed in different patches in association with Abies pindrow. Amongst 32 other angiosperm tree species, eight, i.e., Dalbergia sisso (Sheesham), Pyrus malus, Albizia lebbek (Shirin), Eriobotrya japonica (louquat), Populus cilita (poplar or Safaida), Prunus armeniaca (Hari or apricot), P. domestica (plum) and P. persica (peach) are distributed in/ around cultivations or human settlements and have been planted by the inhabitants for their domestic exploitation. Large economically exploitable orchards/ plantations are not present in the area. Quercus baloot, Q. dilatata,Acer pentapomicum and Aesculus indica are more prominent under wild, while the others have scattered appearances in different parts of Tolipir area. Among the shrubs Viburnum, Sarcoccoca, Indigofera, Rubus, Berberis and Skimmia laureola are relatively common, while the others exhibit scattered distributions. Moss (Bryophyte) and lichen species remain unidentified and appeared in places having higher moisture and shade.
The Tolipir area presents a typical Himalayan moist temperate character, with tree cover varying at different places depending upon the topography and levels of human exploitation in different parts.
Phytosocoiolgy There is a remarkable variation in the
vegetative cover available in different vegetative types, ranging between 35% and 113% (complete with multiple cover layers at places). Three well defined layers, along with epiphytes have been exhibited in all the vegetative types, yet there is a remarkable variation in the size of different layers. Tree layer ranges between 14% and 100% (tree providing more than one overlapping layers). The shrub layer is not very well defined and is almost absent in some vegetative types, yet in others it may provide a cover of up to 9%. The herb layer is regular, appearing in all the vegetative types, providing covers falling between 12% and 46%. The vegetation types, identified under the present analysis, can be described as:
1. Celitis caucasica: The vegetative type exhibits the widest distribution in the Tolipir Area, represented in 52% of the stands. The community have a very open tree canopy (average = 13.7%), associated with scattered distribution of shrubs (vegetative cover = 8.5%) and herbs (vegetative cover = 12.2%). Ferns are present at some isolated spots, holding higher soil moisture (deep ravines, cover 0.02%). The epiphytes (cover < 1%) appear in association with trees. The vegetation type appears in the open areas having a lower vegetative cover (35.5%) with Himalayan moist forests standards. Thicker herb/ grass cover is expected to appear in these patches after the summer monsoon. The dominant cover in this vegetation type is although, shared between three plant species (Celitis caucasica = 5.9%, Lagustrum lucidam = 2.3% and Ailanthus altissima = 2.2%), yet the community presents an association of 61 species, presenting the highest species’ diversity in comparison with the other vegetative types established in Tolipir area. The high phyto-diversity in the vegetation type can partially be attributed to its wide distribution and variation in the available habitat conditions. The vegetation type is represented by stretches of grasslands, with almost no tree and shrub cover, limited to almost leveled valleys located at higher altitudes, in the northeastern parts, represented by eight stands (15% of the sampled area). In the other parts, holding this vegetation type the shrubs and trees appear in different densities, yet the canopy remains very open. The major part of the vegetation is

48 A. FAIZ ET AL BIOLOGIA (PAKISTAN)
associated with the agriculture and human settlements, agricultural fields appearing as terraces.
2. Aesculus indica: The vegetation type where Aesculus indica provide the omint cover can be further divided into three sub-types, depending upon decreasing cover provided by the dominant species, and its association with the other subdominants. a.Achellia millefolium: The vegetative type is represented in five stands (some 10% of the sampling units) appearing in three isolated patches, located in the higher altitudes in the north-western, central and eastern parts of Tolipir area. The vegetation type presents an association of a minimum of 22 species, though the predominant cover (88-98% of the total cover) is provided by the Aesculus indica. The vegetative type bears a very thick cover of tree layer (103%, providing multiple layers). All the other species share a relatively minor cover. The shrub layer is rather scanty providing only about 2% of the total cover, while the herb layer is relatively rich (9% of the total cover). The ferns share relatively higher vegetative cover (0.43%), attributable to availability of the lower temperature and higher soil moisture under the thicker tree cover. Epiphytes also appear in relatively higher frequencies, under higher tree cover available in the vegetative type. The vegetative type presents very thick vegetation, where the overlapping layers provide an overall vegetative cover of around 113%. b. Anemone tetrasepala: The vegetation type is represented by three stands (6% of the sampled stands), appearing in two patches located in central and southern parts of Tolipir Area. The vegetation type has an open tree canopy, providing 55% cover. Shrubs, ferns and epiphytes do not contribute the appreciable cover. The rest of some 46% of the cover is provided by herbs. The vegetative cover in this vegetation type is almost complete. One species of trees, i.e., Aesculus indica, and a species of herb, i.e., Anemone tetrasepala, collectively share the major part of the vegetative cover in the vegetation type. The vegetation type has a relatively low phytodiversity, represented by seven
species, which can be attributed to the limited distribution of the vegetation type in two patches having special habitat conditions with little microhabitat diversity. Among the other five species, Acellia millefolium and Artemisia dubia share higher vegetative cover. c. Ailanthus altissima: This is another association of 43 species, where Aesculus indica provides the dominant cover. The vegetation type has been recognized in 12 stands (23% of the sampled stands), yet it is present in limited tracts located in the north-western parts of the Tolipir Area, falling at higher altitudes. The vegetation type has high species diversity, indicating a larger variation in the microhabitat. The overall cover in the vegetation typeremains low (some 58%), which is mainly contributed by 15 tree species (49%), of which Aesculus share the major cover (37%) and Ailanthus contributes a very low vegetative cover (4%). The other 13 species have very small contribution in the total cover, and are associated with human habitations or agricultural fields. Twenty two (22) species of herbs have a higher contribution in the total cover (8%), while shrubs, ferns and epiphytes have very scattered appearances.
3. Abies pindrow: The vegetation type has an open canopy, yet relatively thick forested vegetation (84%), mainly shared by trees (72%), in association with herbs (12%), ferns (0.12%), and shrubs (0.03%). No epiphyte species has been recorded in the vegetation type. The vegetation type has been represented in five stands (10% of the sampled stands), and is present in two patches falling in the northern parts of the Tolipir Area, located at higher altitudes.
The vegetation type represents an association of 18 species, i.e., 10 trees, one shrub (Viburnum grandiflorum), and six herbs and one fern (Adiantum capillus-veneris). The tree cover is mainly contributed by Abies(57%), though Aesculus (8%) also has an appreciable share in the total cover. Among other tree species, Ficus palmata has a wider distribution and providing a higher cover (3%). Pinus wallichiana and P. roxburghii exhibit scattered appearance.

VOL. 60 (1) FLORAL DIVERSITY OF TOLIPIR NATIONAL PARK 49
Table 2. List of plant species diversity in Tolipir area
Sr. No
Scientific name Scientific name Scientific name Scientific name
Tree 44 Isodon rugosus 88 Hypericum perforatum 133 Viola pilosa 1. Abies pindrow 45 Jasminum mesnyi 89 Iris milesii Grasses 2. Acer pentapomicum 46 Lagustrum lucidam 90 Launia secunda 134 Brachiaria spp. 3. Aesculus indica 47 Myrsine africana 91 Lespedeza juncea 135 Dactyloctenium aegyptium 4. Albizia lebbek (Linn.) 48 Rosa brunonii 92 Malvestrum
coromendelianum 136 Desmostachya bipinnata
5. Castanea sativa 49 Rubus fruticosus 93 Medicago minima 137 Koeleria spp. 6. Cedrella serrata 50 Rubus niveus 94 Melilotus alba Desr 138 Oplismenus spp. 7. Celtis caucasica 51 Rumex hastatus 95 Mentha royleana Benth 139 Phalaris minor 8. Dalbergia sissoo 52 Sarcococca saligna 96 Nepeta erecta 140 Phragmites karka 9. Elaeagnus angustifolia 53 Sophora mollis (Royle) 97 Nepeta laevigata 141 Poa nepalensis 10. Elaeagnus umbellata 54 Vibernum nervosum 98 Nepeta nervosa 142 Pogonatherum spp. 11. Eriobotrya japonica 55 Viburnum cotinifolium 99 Oenothera rosea 143 Stipa sibirica 12. Ficus carica Linn. 56 Viburnum grandiflorum 100 Parthenium hysterophorus 144 Themeda spp. 13. Ficus palmate 57 Zanthoxylum armatum 101 Pimpinella stewartii Ferns 14. Juglans regia Linn. Herbs 102 Plantago lanceolata Linn. 145 Adiantum capillus-veneris 15. Nerium oleander 58 Achellia millefolium 103 Podophyllum emodi 146 Adiantum incisum 16. Pinus roxburgii Roxb 59 Ajuga bracteosa 104 Polygonatum multiflorum 147 Adiantum venustum 17. Pinus wallichiana 60 Allium griffithianum 105 Primula denticulata 148 Athyrium tenuifrons 18. Pistacia chinensis 61 Alysicarpus
bupleurifolius 106 Prunella vulgaris 149 Niogramme rosthornii
19. Populus ciliata 62 Anaphalis adnata D.C 107 Ranunculus arvensis 150 Dryopteris juxtaposita 20. Prunus armeniaca 63 Androsace rotundifolia 108 Ranunculus hirtellus 151 Equisetum arvense Linn. 21. Prunus domestica 64 Anemone tetrasepala 109 Ranunculus muricatus 152 Polystichum squarrosum 22. Prunus persica 65 Aquilegia pubifoera 110 Rumex dentatus L. 153 Pseudophagopteris
pyrrhorhachis 23. Punica granatum 66 Artemisia absinthium L. 111 Salvia hians 154 Pteris cretica 24. Pyrus malu 67 Artemisia maritime L. 112 Salvia lanata Epiphytes 25. Pyrus pashia 68 Artemizia dubia 113 Salvia moorcroftiana 155 Clematus grata 26. Quercus baloot 69 Asparagus filicinus 114 Sambucus wightiana 156 Hedera nepalensis 27. Quercus dilatata 70 Bergenia ciliata 115 Saussurea candolleana 157 Momordica dioica 28. Quercus glauca 71 Caltha alba 116 Senecio chrysanthemoides 158 Smilax glaucophylla 29. Quercus incana 72 Campanula benthamii 117 Seseli libanotis 30 Robinia pseudo-acacia 73 Cirsium falconeri 118 Swertia ciliata 31 Salix acmophylla 74 Conyza bonariansis 119 Taraxacum officinale 32 Salix denticulate 75 Dicliptera bupleuroides 120 Thalictrum pedunculatum 33 Sapindus mukorossi 76 Dioscorea bulbifera L. 121 Thymus liniaris

50 A. FAIZ ET AL BIOLOGIA (PAKISTAN)
Table 3: Relative vegetative cover (% ±) shared between different plant species in different vegetative types established in Tolipir vicinity by Ward’s method
Names Vegetative Type
Celitis caucasica Aesculus indica
Anemone tetrasepala
Ailanthus altissima
Abies pindrow
Constancy
AV ± S.E AV ± S.E AV ± S.E AV ± S.E AV ± S.E % Class Abies pindrow 57.48 ±6.13 - - - - 9.61 I Aesculus indica 7.83 ± 2.00 1.01 ± 0.67 98.02 ± 5.54 54.20 ± 5.02 36.93 ± 3.89 9.61 I Ailanthus altissima 0.30 ± 0.30 2.17 ± 1.23 0.16 ± 0.16 - 3.42 ± 1.16 9.61 I Albizia lebbek - 0.03 ± 0.03 - - 1.40 ± 0.73 5.77 I Cederala serrata 0.06 ± 0.06 0.88 ± 0.40 0.10 ± 0.10 - 1.09 ± 0.48 9.61 I Celtis caucasica 0.32 ± 0.20 5.89 ± 1.58 3.49 ± 2.59 0.44 ± 0.00 3.23 ± 0.64 1.92 I Dalbergia sissoo - - - - 0.47 ± 0.17 3.85 I Ficus palmate 2.53 ± 0.22 0.06 ± 0.04 - - 0.24 ± 0.09 13.4
6 I
Juglens rigia 0.97 ± 0.40 0.15 ± 0.07 - - 0.15 ± 0.07 1.92 I Pinus roxburghii 0.14 ± 0.06 0.03 ± 0.02 - - 0.25 ± 0.09 5.77 I Pinus wallichiana 0.90 ± 0.09 0.06 ± 0.03 0.18 ± 0.18 - 0.13 ± 0.05 55.7
7 III
Populus ciliata 0.86 ± 0.16 0.30 ± 0.12 0.34 ± 0.34 - 0.24 ± 0.09 7.69 I Pyrus malus - - - - 0.06 ± 0.03 5.77 I Pyrus pashia 0.62 ± 0.16 0.21 ± 0.10 - - 0.30 ± 0.12 9.61 I Quercus incana - 0.41 ± 0.41 - - 0.03 ± 0.02 25 II Robinia pseudoacacia - 0.97 ± 0.67 0.26 ± 0.26 - 0.63 ± 0.43 7.69 I Salix acmophylla - 0.11 ± 0.06 - - - 7.69 I Smilax glaucophylla - 0.53 ± 0.29 - - - 3.85 I
34 Skimmia laureola (DC.) 77 Dioscorea deltoidea 122 Trichodesma indicum 35 Ziziphus spp 78 Duchesnea indica 123 Triufolium repens
Shrubs 79 Epilobium tibetanum 124 Urtica dioica 36 Berberis lycium 80 Euphorbia helioscopia 125 Valeraina jatamansi 37 Clematis buchananiana 81 Euphorbia wallichii 126 Valeriana pyrolifolia 38 Clematus connate 82 Fragaria nubicola 127 Verbascum Thapsus 39 Clematus montana 83 Fumaria indica 128 Veronica beccabunga 40 Debregeasia salicifolia 84 Gallium aparine L. 129 Veronica biloba Linn. 41 Desmodium
podocarpum 85 Gallium asperifolium 130 Veronica melissifolia
42 Heracleum cachemiricum
86 Gerbera gossypina 131 Vincetoxicum hirundinaria
43 Indigofera heterantha 87 Heracleum candicans 132 Viola canscens

VOL. 60 (1) FLORAL DIVERSITY OF TOLIPIR NATIONAL PARK 51
Ziziphus spp - 0.88 ± 0.44 - - - 9.61 I Berberis lycium - 0.08 ± 0.08 - - - 71.1
5 IV
Isodon rugosus - 1.01 ± 0.37 - - - 1.92 I Jasminum mesnyi - - 1.52 ± 1.52 - - 3.85 I Lagustrum lucidam - 2.29 ± 0.37 - - - 1.92 I Myrsine africana - 1.22 ± 0.64 - - - 1.92 I Nerium oleander - 0.92 ± 0.64 0.48 ± 0.48 - - 57.6
9 III
Punica granatum - 1.27 ± 0.88 - - 0.80 ± 0.46 9.61 I Rosa brunonii - 0.46 ± 0.22 - - - 38.4
6 II
Rubus fruticosus - 0.05 ± 0.04 - - - 21.15
II
Sarcococca saligna - 0.77 ± 0.46 - - - 50 III Skimmia laureola - 0.02 ± 0.02 - - - 11.5
4 I
Viburnum grandiflorum 0.03 ± 0.03 0.12 ± 0.12 - - - 57.69
III
Vincetoxicum hirundinaria
- 0.23 ± 0.23 - - - 3.85 I
Zanthoxylum armatum - 0.08 ± 0.08 - - - 7.69 I Achellia millefolium 1.88 ± 1.29 1.33 ± 0.41 3.80 ± 0.98 3.94 ± 0.00 0.94 ± 0.25 7.69 I Anaphalis adnata - 0.95 ± 0.81 0.95 ± 0.95 - - 34.6
2 II
Androsace rotundifolia - 0.21 ± 0.09 1.50 ± 1.21 - 0.19 ± 0.15 3.85 I Anemone tetrasepala - 4.93 ± 1.82 0.72 ± 0.29 38.40 ± 0.00 2.37 ± 0.68 1.92 I Aquilegia pubifoera - - - 0.66 ± 0.00 0.12 ± 0.07 5.77 I Artemisia dubia 9.59 ± 0.66 1.39 ± 0.57 1.23 ± 0.45 3.18 ± 0.00 1.55 ± 0.87 19.2
3 I
Clematus grata - 0.31 ± 0.21 - - - 5.77 I Conyza bonariansis 0.10 ± 0.04 - - - 0.06 ± 0.06 5.77 I Dicliptera bupleuroides - - - - 0.02 ± 0.02 1.92 I Dioscorea deltoidea - 0.03 ± 0.03 - - - 5.77 I Elaeagnus angustifolia 0.06 ± 0.02 0.00 ± 0.00 - - - 7.69 I Euphorbia helioscopia - 0.02 ± 0.01 0.04 ± 0.04 - - 1.92 I Euphorbia wallichii - 0.16 ± 0.10 - - - 3.85 I Fragaria nubicloa - - - - 0.01 ± 0.01 32.69 II

52 A. FAIZ ET AL BIOLOGIA (PAKISTAN)
Fumaria indica - - - - - 5.77 I Lespedeza juncea - 0.01 ± 0.01 - - 0.15 ± 0.10 3.85 I Medicago minima - - 0.06 ± 0.06 - 0.63 ± 0.61 7.69 I Mentha royleana - - - - - 5.77 I Oenothera rosea - - - - 0.03 ± 0.02 7.69 I Pimpinella stewartii - - 0.06 ± 0.06 - 0.02 ± 0.01 1.92 I Plantago lanceolata - - - - 0.01 ± 0.01 1.92 I Pteris cretica - 0.03 ± 0.02 - - 0.04 ± 0.02 32.69 II Ranunculus hirtellus - 0.05 ± 0.05 - - 0.79 ± 0.53 38.46 II Ranunculus muricatus - 0.17 ± 0.10 - - - 30.77 II Rumex dentatus - - 0.08 ± 0.08 - - 46.15 III Rumex hastatus - - - - 0.03 ± 0.02 5.77 I Salvia lanata 0.33 ± 0.33 0.77 ± 0.26 - - 0.49 ± 0.18 1.92 I Saussurea candolleana 0.13 ± 0.13 0.18 ± 0.10 0.23 ± 0.02 0.18 ± 1.96 0.07 ± 0.04 3.85 I Senecio chrysanthemoides
- 0.55 ± 0.47 - - - 5.77 I
Swertia ciliate - - - - 0.09 ± 0.06 3.85 I Taraxacum officinale - 0.06 ± 0.04 - - - 5.77 I Thymus liniaris - 0.16 ± 0.11 - - - 7.69 I Trichodesma indicum - - - - 0.02 ± 0.02 1.92 I Trifolium repens - 0.03 ± 0.03 - - 0.02 ± 0.01 13.46 I Urtica dioica - 0.21 ± 0.11 - - - 32.69 II Valeriana pyrolifolia - 0.01 ± 0.01 - - - 3.85 I Verbascum thapsus - 0.14 ± 0.07 - - 0.05 ± 0.05 1.92 I Veronica melissifolia - 0.04 ± 0.04 - - - 13.46 I Viola pilosa - 0.01 ± 0.01 - - - 3.85 I Adiantumcapillus-veneris
0.12 ± 0.12 0.01 ± 0.01 0.43 ± 0.12 - - 23.08 II
Athyrium tenuifrons - - - - 0.03 ± 0.02 5.77 I Thalictrum pedunculatum
- - - - 0.01 ± 0.01 3.85 I
Hedera napalensis - 0.05 ± 0.04 - - 0.13 ± 0.06 13.46 II Galium aparine - 0.04 ± 0.04 0.11 ± 0.11 - - 3.85 I
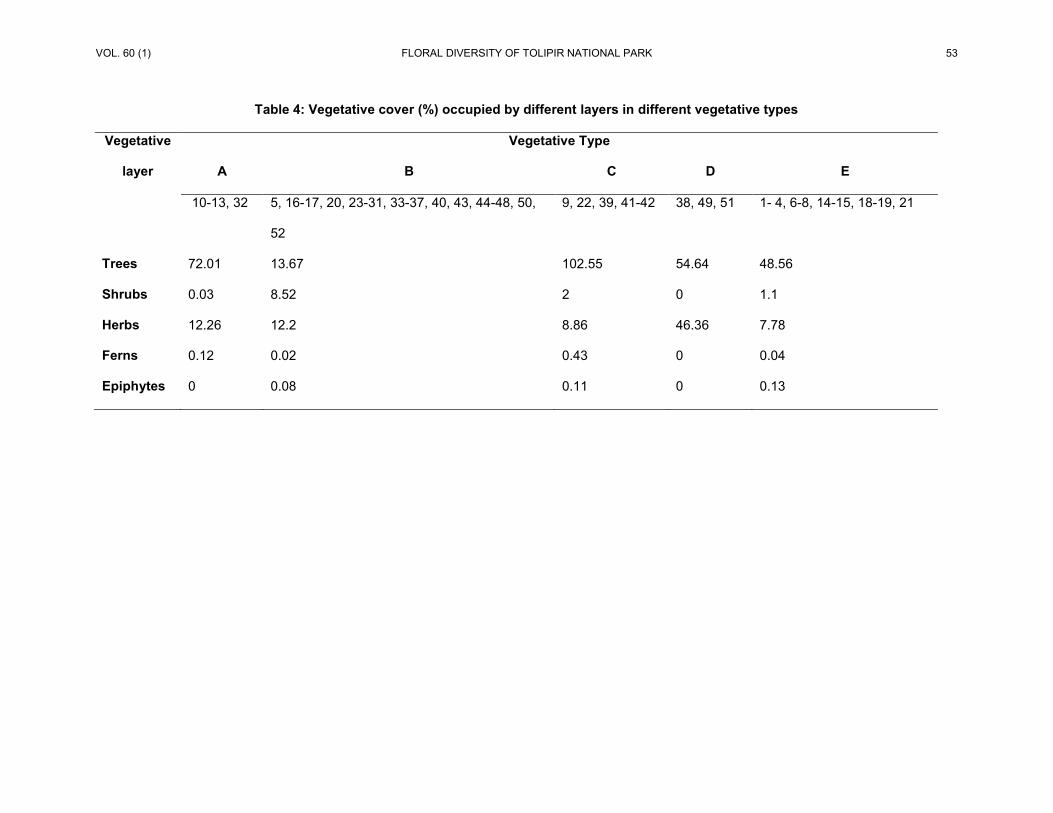
VOL. 60 (1) FLORAL DIVERSITY OF TOLIPIR NATIONAL PARK 53
Table 4: Vegetative cover (%) occupied by different layers in different vegetative types
Vegetative
layer
Vegetative Type
A B C D E
10-13, 32 5, 16-17, 20, 23-31, 33-37, 40, 43, 44-48, 50,
52
9, 22, 39, 41-42 38, 49, 51 1- 4, 6-8, 14-15, 18-19, 21
Trees 72.01 13.67 102.55 54.64 48.56
Shrubs 0.03 8.52 2 0 1.1
Herbs 12.26 12.2 8.86 46.36 7.78
Ferns 0.12 0.02 0.43 0 0.04
Epiphytes 0 0.08 0.11 0 0.13

54 A. FAIZ ET AL BIOLOGIA (PAKISTAN)
REFERENCES
Adhikari, B.S., Joshi, M., Rikhari, H.C. & Rawat, Y.S., 1992. Cluster Analysis (Dendrogram) of high altitude (2150-2500 m) forest vegetation around Pindari glacier in Kumaun Himalaya. J. Envi Bio. 13: 101-105.
Ahmad, H., 1999. Issues regarding medicinal plants of Pakistan. Udyana Today.,6(3): 6-7.
Ali, S.I. & Qaiser, M., 1993–2012. Flora of Pakistan. Karachi, PK: University Press.
Behera, M. D. & Kushwaha, S. P. S., 2007. An analysis of altitudinal behavior of tree species in Subansiri district, Eastern Himalaya. Biodivers.Conserv.,16(6): 1851-1865.
Beg, A. R., 1975. Wildlife habitats of Pakistan. Bull, no. 5. Pak. Forst. Inst., Peshawer.
Braun Blanquet, J., 1928. Pflanzensoziologiegrundzuge der vegetationskunde. Springer, Berlin. Translated 1932. Plant Sociology; the study of plant communities. Mc Graw Hill, New York, 439pp.
Champion, H. G., Seth, S. K., & Khattack, G. H. 1965.Forest types of Pakistan. Pakistan Forest Institute.
Fang, J. Y., 2004. Exploring altitudinal patterns of plant species diversity of China’s mountains. Biodiv Sci.,12: 1–4.
Gupta, A. L. 1963. Annual precipitation and vegetation of de dry temperate coniferous region of North West Himalay. Jou. Int. Bot. Soc., 42:(2).
Haq, I. & Hussain, Z., 1995. Medicinal plants of Palandri, District Poonch (Azad Kashmir). Pak.J. Sci.,1: 115-126
Hamayun, S., 2010. Structural diversity, vegetation dynamics and anthropogenic impact on lesser Himalayan subtropical forests of bagh district Kashmir. Pak. J. Bot.,43(4): 1861-1866.
Hoareau, L. & Da-Silva, E. J., 1999. Medicinal plants: A re-emerging health aid. Elect. J. Biotechnol.,2: 1-7
Ishtiaq, M., Hanif, W. & Khan, M.A., 2006. Ethnoveterinary Medicinal Uses of Plants of from SamahniValley District Bhimber, (Azad Kashmir) Pakistan. Asian J. Plant Sci., 5(2): 390-396.
Ishtiaq, M., Wajahat, H., Khan, M.A., Ashraf, M. & Butt A. M., 2007. An Ethnomedicinal Survey and Documentation of Important Medicinal Folklore Food Phytonims of Flora of
Samahni Valley, (Azad Kashmir) Pakistan. Pak. J. Biol. Sci., 10(13): 2241-2256.
Khan, M. A. 2008. Biodiversity and Ethnobotany of Himalayan Region Poonch Valley, Azad Kashmir Pakistan. Ph.D Thesis. Quaid-i-Azam University Islamabad, Pakistan. 241pp.
Khan, Z. S., Khuroo, A. A., & Dar, G. H., 2004.Ethno medicinal survey of Uri, Kashmir Himalya. Indian J. Traditional Knowledge,3(4): 351-357.
Khan, A. A., 1985. Suvey of crude drug markets in Pakistan. Biol. Sci. Research Division, Bulletin 7, Pakistan Forest Institute, Peshawar.
Khan, A.H., 1951. The medicinal plants, their past and present. Pak. J. Forest.1: 353-367.
Kharkwal, G., Mehrotra P, Rawat, Y. S. & Pangtey, Y. P. S., 2005.Phytodiversity and growth form in relation to altitudinal gradient in the Central Himalayan (Kumaun) region of India. Curr. Sci., 89: 873-878.
Malik, N. Z. & Malik, Z. H., 2004. Present status of sub–tropical chir pine vegetation of Kotli Hills, Azad Jammu and Kashmir. J. Res. Sci., 15: 85–90.
Malik, Z. H. and Hussain, F., 1990. Phytosociology of some parts of Kotli Hills, Azad Kashmir J. Sci. Tech.,14: 119–23.
Malik, Z. H., Ahmed, S. & Hussain, F., 1994. Present status of sub tropicalchirpine vegetation of Samani Hills, Azad Kashmir. Sci. Khyber.,7: 51–8.
Malik, Z. H., 2005. Comparative study on the vegetation of Ganga Chotti andBedori hills District Bagh, Azad Jammu and Kashmir with special reference to Range conditions. Ph.D. Thesis, University of Peshawar.
Nafeesa Z.M., Arshad, M. & Sarwat, N.M., 2007. Phytosociological Attributes of Different Plant Communities of Pir Chinasi Hills of Azad Jammu and Kashmir. Int. J. Agric. & Biol., 9(4): 569–574.
Nasir, E. & Ali. S. I., 2008. Flora of Pakistan.National Herbarium, Islamabad.
Nazir, A., Malik, R. N. & Ajaib, M., 2012. Phytosociological Studies of the vegetation of Sarsawa Hills District Kotli, Azad Jammu & Kashmir. 58(1&2), 123-133
Odum, E. P., 1971. Fundamentals of Ecology, 3rd edition. W. B. Saunders Co. Philadelphia. 574 pp.
Palmer, M. W., 1994. Variation in species richness: towards a unification of hypotheses. Folia Geobot and Phytotax, Praha, 29: 511-530.

VOL. 60 (1) FLORAL DIVERSITY OF TOLIPIR NATIONAL PARK 55
Peer, T., Gruber, J. P., Millangard, A. & Hussain, F., 2007.Phytosociology, structure and diversity of the steppes vegetation in the mountains of Northern Pakistan. Phytocoenologia., 37:
1-65. Qamar, Z. & Minhas, R. A., 2006. Important
medicinal plants and their indigenous knowledge in Machiara National Park. PAMP-Machiara. Muzaffarabad, AJK (in Urdu). 61 pp.
Siddqui, K. M. & Khan, A., 1991. Proceedings of workshop on “Promotion of medicinal plants". PFI, Peshawar.
Singh, J. S., & Singh, S. P., 1992. Forest of Himalaya. Nainital: Gyanodaya Prakashan. 257 pp.
Stewart, R. R., 1972. Flora of West Pakistan An Annotated Catalogue of the Vascular Plants
of West Pakistan and Azad Kashmir by Nasir, E. & S. I. Ali. Fakhri Printing Press Karachi. 1028 pp.
Toshiyuki, N. & Malik, S., 1992. Cryptogamic Flora of Pakistan. National Science Museum Tokyo in collaboration with Pakistan Museum of Natural History, Islamabad. Vol I: 316 pp.
Valdiya, K. S. 2002. Emergence and evolution of Himalaya: reconstructing history in the light of recent studies. Prog.Phys.Geogr., 26:360–399.
WHO. 2002.World Health Organization Traditional Medicine Strategy. Geneva.
Yang, Q. & Zheng, D., 2004.Tibetan Geography. China Intercontinental Press.Yasin and Shunder. Pak. J. For.,26: 93-104

BIOLOGIA (PAKISTAN) 2014, 60 (1), 57-62 PKISSN 0006 – 3096 (Print) ISSN 2313 – 206X (On-Line)
*Corresponding author: [email protected]
Density, diversity and abundance of Copepods in a pond
*ASMA MAQBOOL1, ABDUL QAYYUM KHAN SULEHRIA2, MUHAMMAD EJAZ1, AND ALTAF HUSSAIN1
1Department of Zoology, Government College University, Lahore, Pakistan
2Department of Zoology, Govt. Islamia College, Civil Lines, Lahore, Pakistan
ABSTRACT
The present study was conducted to determine the density, diversity and abundance of copepods in a pond. Study was carried out in pre-monsoon, monsoon and post-monsoon (May 2012 to October 2012). During the study period temperature ranged from 27.97 ºC to 32.98 ºC, pH ranged from 6.97 to 7.15, DO ranged from 5.93 mg/l to 7.37 mg/l, conductivity ranged from 339.67 µS/cm to 574 µS/cm, total hardness ranged from 269.34 mg/l to 246.25 mg/l and total dissolved solids ranged from 1404.5 mg/l to 1541.3 mg/l. Sixteen species of copepods were found, among which Mesocyclop edax was dominant in pre-monsoon and post-monsoon and Eucyclop agilis was dominant in monsoon. Density of Skistodiaptomus pallidus, Microcyclop varicans and Skistodiaptomus oregonesis was low in premonsoon, monsoon and postmonsoon respectively. Density of copepods was positively correlated with temperature, conductivity, total hardness and TDS while negatively correlated with pH and DO. Different types of diversity indices such as Shannon’s diversity index (2.621-2.753), Simpson index (0.065-0.074), Pielou’s evenness index (0.974 -0.993), and Margalef index (1.258-1.449) were calculated. Key Words Zooplanktons, Physico-chemical parameters, Biological activities, Biotic factors, Predatory activities.
_______________________________________________________________________________________
INTRODUCTION
Various studies have shown that physico-chemical conditions of water body determine the density and diversity of flora and fauna of that water body (Ayodele & Adeniyi, 2006; Abdul–Razak et al., 2009). In natural waters and ponds copepods are the food source for larval and juvenile fish that link pelagic food web (Vandroomme et al., 2010; Bi et al., 2011). It is reported that in many countries failure of fishery was due to the decrease in zooplankton specially copepods (Stottrup, 2000). Copepods are abundantly present in fresh waters and constitute major component of planktonic communities. Distribution and abundance of copepods is found to be dependent on hydrographical conditions. They are considered as indicator species for water quality (Thor et al., 2005; Hwang et al., 2009). Copepods are found to be the consumers of bacteria (Wroblewski, 1980) and phytoplanktons (Calbet et al., 2000). Kazmi (2004) prepared a checklist of copepods from Arabian Sea Karachi, Pakistan. From mangrove creek area along Karachi coast, Pakistan twenty one species of copepods were recorded by Naz et al. (2012). Shah et al. (2013) studied distribution, diversity and abundance of copepods of Walnur lake, Kashmir Himalaya. No work has been done on density, diversity and abundance of copepods in Punjab, Pakistan Therefore, the present work was done to find out density, diversity and abundance of
copepods and their correlation with different parameters of water in Aroop village.
MATERIALS AND METHODS
Present study was conducted during pre-monsoon, monsoon and post-monsoon (May 2012 to October 2012) in a pond located in village Aroop, District Gujranwala Pakistan. Gujranwala is located at 32.16° north and 74.18° east of Punjab (Pakistan). Study area
The village Aroop is located on the eastern side of the city, 10 km away from Gujranwala, on Sialkot-Daska Road. Climatic conditions of Gujranwala change throughout the year. Highest rainfall is observed in the months of July and August, when monsoon hits the Punjab, Pakistan. Water Sampling
Water samples were collected monthly from three selected sites of the water body from May 2012 to October 2012. Water samples were taken separately in one liter plastic bottle for the evaluation of physicochemical parameters. Water temperature (ºC), DO (mg/l), pH, electrical conductivity (µS/cm) and TDS (mg/l) were measured on the spot.
Water temperature was measured with thermometer (HANNA HI-8053). DO was measured by DO meter (YSI- ECO Sence DO 200). pH was measured by pH meter (YSI-ECO Sence pH 100).

58 A. MAQBOOL ET AL BIOLOGIA (PAKISTAN)
For measuring the conductivity and total dissolved solids, conductivity meter (YSI-ECO Sence EC 300) was used. For the determination of total hardness water samples were analyzed by methods mentioned in APHA (2005). Copepods Sampling
Copepods were collected by passing 50 L water through planktonic net having mesh size 70µm. The contents collected in the net were put in 50 ml plastic bottles and then preserved in 5% formalin. Identification of Copepods
Copepods were identified with the help of different keys (Ward & Whipple, 1959; Pennak, 1978; Yunfang, 1995). Photographs of specimens were taken by LAICA HC 50/50 microscope with 5 megapixel camera fitted on it. Copepods were counted by using Sedgwick rafter cell. Diversity indices and statistical analysis
Shannon–Weaver and Simpson diversity indices were used to study abundance and diversity of copepods. Species richness (SR) and Species evenness or equitability (E) was calculated. Pearson correlation was used to find the relationship between copepods and physico-chemical parameters of water. Pearson correlation was calculated using the software the Minitab. Graphs were plotted with the help of MS Excel 2007.
RESULTS
During present study sixteen species of
copepods belonging to seven genera were found viz., Diacyclop bicuspidatus, Diacyclop nanus, Eucyclop agilis, Eucyclop macrurus, Eucyclop serrulatus, Ectocyclop pheleratus, Macrocyclop albidus, Macrocyclop fuscus, Mesocyclop,
aspericornis, Mesocyclop edax, Mesocyclop leukarti, Microcyclop rubellus, Microcyclop varicans, Microcyclop bicolor, Skistodiaptomus oregonesis, and Skistodiaptomus pallidus.
Density of copepods was high in pre-monsoon period and lowest in post-monsoon period (Fig., 1). Mesocyclop edax was the dominant species in pre-monsoon and post-monsoon having relative percentage 7.98% and 9.14% respectively while Eucyclop agilis was the dominant species in monsoon with relative percentage of 9.76%. In the present study density of Skistodiaptomous pallidus, Microcyclop varicans and Skistodiaptomous oregonesis was low in pre-monsoon, monsoon and post-monsoon, respectively (Fig., 2). Value of Shannon-Weaver diversity index (Shanon & Weaver, 1949) ranged between 2.621 to 2.753 being lowest in October and highest in June. Simpson diversity index (Simpson, 1949) ranged from 0.065 to 0.074. Species richness (Margalef, 1951) ranged between 1.258 to 1.449 being high in September 2012 and low in October 2012. Species Evenness (Pielou, 1966) ranged from 0.974 to 0.993 (Fig., 3). Temperature ranged from 27.97 ± 0.47ºC to 32.98 ± 3.36ºC, pH ranged from 6.97 ± 0.20 to 7.15 ± 0.18, DO ranged from 5.93 ± 0.17 mg/l to 7.37 ± 0.14 mg/l, conductivity ranged from 339.67 ± 8.69 µS/cm to 574 ± 63.19 µS/cm, total hardness ranged from 269.34±6.08 mg/l to 246.25 ± 12.02 mg/l, TDS ranged from 1404.5 ± 23.57 mg/l to 1541.34 ± 5.04 mg/l (Table 1). Temperature, conductivity, total hardness and pH were high in pre monsoon, TDS was high in monsoon and DO was high in post monsoon. Temperature, conductivity total hardness and, TDS showed positive correlation with copepods density while DO and pH showed negative correlation with copepods density (Table 2, Fig., 4 & 5).
Table 1: Variation of different Physico-chemical parameters during different seasons.
Parameters Premonson Monson Postmonson
Temperature (oC) 32.98±3.36 30.42±0.52 27.97±0.47
pH 7.15±0.18 6.97±0.20 7.10±0.10
Dissolved oxygen (mg/l) 5.93±0.17 6.28±0.16 7.37±0.14
Conductivity (µS/cm) 574±63.19 468.5±44.30 339.67±8.69
Total hardness (mg/l) 269.34±6.08 246.25±12.02 263.86±12.14
TDS (mg/l) 1486.5±46.64 1541.34±5.04 1404.5±23.57 TDS=Total Dissolved Substances

VOL. 60 (1) DENSITY, DIVERSITY AND ABUNDANCE OF COPEPODS 59
Table 2: Pearson correlation between copepods and water parameters.
Copepods Temp. pH DO Cond. TDS
Temp 0.947
pH -0.568 -0.335
DO -0.804 -0.798 0.138
Cond 0.908 0.914 -0.245 -0.948
TDS 0.715 0.672 -0.364 -0.769 0.655
T.H 0.303 0.289 -0.310 -0.005 0.283 -0.414
Temp=Temperature; DO=Dissolved oxygen; TDS=Total Dissolved Substances; Cond= Conductivity;
T.H=Total Hardness
Fig., 1: Seasonal Variation in density of copepods.

60 A. MAQBOOL ET AL BIOLOGIA (PAKISTAN)
Fig., 2: Relative percentage of copepods in Pre-monsoon, Monsoon and Post-monsoon.
Fig., 3: Monthly variations in diversity indices.
Fig., 4: Negative correlation between Copepods and Dissolved oxygen.

VOL. 60 (1) DENSITY, DIVERSITY AND ABUNDANCE OF COPEPODS 61
Fig., 5: Positive correlation between Copepods and Temperature.
DISCUSSION
The results of present study indicated that the value of pH was high in pre-monsoon season then decreased in monsoon and again increased in post monsoon. This can be attributed to rainfall in monsoon, which resulted in dilution of water. Basu et al. (2013) had reported the similar findings
Value of dissolved oxygen was high in post-monsoon when temperature was low, while dissolved oxygen was low in pre-monsoon when temperature was high. The solubility of oxygen increased with decrease in temperature. Low DO retaining capacity of water was attributed to increase in organism demand on high temperature. Similar observation was recorded by Hussain et al. (2013).
Values of TDS were greater in monsoon. This can be explained by the fact that decaying process increased with increase in temperature leading to an increase in TDS in water. This may also be due to the incoming surface runoff and drainage water containing mud. These results are in accordance with work done by Ahmed et al. (2011). Conductivity was high during pre-monsoon. This was due to high temperature in pre-monsoon when evaporation rate became high. These results agree with the findings of Badsi et al. (2010).
Total hardness was maximum in pre-monsoon and minimum in monsoon. This might be due to the evaporation at higher temperature in pre-monsoon while lower values during monsoon might be attributed to dilution of water body by rain water. Similar results were reported by Ahmed et al. (2011) and Basu et al. (2013).
During present study temperature was high in pre-monsoon and low in post-monsoon. Temperature was one of the most important factors affecting the density of copepods. The production of copepods increased with increase in temperature. This may be due to the fact that high temperature increased the biochemical, biological activities and increased the growth of micro-organisms, so pre-monsoon maxima of copepods was correlated with high temperature and food availability while decrease in population density of copepods in monsoon was attributed to decreased photosynthetic activity by primary producers. Similar results were found by Jhoshi (2011).
It was observed that density of copepods was high in pre-monsoon then decreased in monsoon and low density of copepods was recorded in post-monsoon. Amount of rain fall affected the density of zooplanktons. These findings agree with the work of Carter (1960).
REFERENCES APHA, 2005. Standard Methods for the examination
of water and waste water (21st Ed). American Public and Health Association, Washington, D. C., U.S.A.
Ayodele, H. A. & Adeniyi, I. F., 2006. The zooplankton fauna of six impoundments on the river Osum, Southern Nigeria. The Zoologist., 1(4): 49-67.
Abdul-Razak, A., Asiedu, A. B., Entsua-Mensah, R. E. M. & deGraft-Johnson, K. A. A., 2009. Assessment of water quality of the Oti River in Ghana. West. Afr. J. Appl. Ecol., 15: 45-60.

62 A. MAQBOOL ET AL BIOLOGIA (PAKISTAN)
Ahmad, U., Parveen, S., Khan, A. A., Kabir, H. A., Mola, H. R. A. & Ganai, A. H., 2011. Zooplankton population in relation to physico-chemical factors of a sewage fed pond of Aligarh (UP), India. Research Article Biology & Medicine, 3(2): 336-341.
Badsi, H., Ali, H. O., Loudiki, M., Hata, M. E. I., Chakli, R. & Aamiri., A., 2010. Ecological factors affecting the distribution of zooplankton community in The Massa lagoon (Sauthern Morocco). Afri. Jour. Enviro. Sci. and Tech., 4(11): 751-762.
Basu, A., Mondal, D., Roy, S., Choudury, S., Datta, S., & Roy, S., 2013. The composition, diversity and population dynamics of zooplankton in river Ichamati, West-Bengal (India). Int. J. Adv. Lif. Sci., 6: 380-389.
Bi, H., Peterson, W. T., Lamb, J. & Casillas, E., 2011. Copepods and salmon: characterizing the spatial distribution of juvenile salmon along the Washington and Oregon coast, U S A. Fish Oceanogr., 20: 125-138.
Carter, G. S., 1960. Tropical Climates and biology. Nature. 187:843.
Calbet, A., Landry, M. R., Scheinberg, R. D., 2000. Copepod grazing in a subtropical bay: Species-specific responses to a midsummer increase in nanoplankton standing stock. Mar. Ecol. Prog. Ser., 193: 75-84.
Hussain, A., Sulehria, A. Q., Ejaz, M. & Maqbool, A., 2013. Monthly variations in physicochemical parameters of a flood plain reservoir on River Ravi near Balloki Headworks (Pakistan). Biologia (Pakistan). 59(2): 371-377
Hwang, J. S., Kumar, R. & Kuo, C. S., 2009. Impact of predation by the copepod, Mesocyclops pehpeiensis, on life table demography and population dynamics of four cladoceran species: A comparative laboratory study. Zool. Stud., 48: 738-752.
Joshi, P. S. 2011. Studies on zooplanktons of Rajura Lake of Buldhana district, Maharashtra India. Sci. Res. Reporter., 1(3): 132 -137.
Kazmi, Q. B., 2004. Copepods from shore and offshore waters of pakistan. J. Mar. Sci. and Tech., 12(4): 223-238.
Margalef, R.,1951. Diversidad de especies en las comunidales naturales. Publ. Inst. Biol. Apl. 9: 5-27.
Naz, F., Qureshi, N. A. & Sehar, N. U., 2012. Temporal and spatial variations in the species composition, distribution and abundance of copepods in mangrove creek area along the Karachi coast, Pakistan. Indian J. Mar. Sci., 41(1): 61-69
Pennak, R. W., 1978. Freshwater invertebrates of the United State. 2nd Ed., John W and Sons, New York. 803 pp.
Pielou, E. C., 1996. The measurement of diversity in different types of biological collections. J. Theoret. Biol. 13: 131-144.
Shannon, C. E. & W. Weaver, 1949. The mathematical theory of communication.Urban. Univ. Illinois Press. Illinois. 125 pp.
Shah, J. A., Pandit, A. K. & Shah, G. M. 2013. Distribution, diversity and abundance of copepod zooplankton of Wular Lake, Kashmir Himalaya. J. Ecol. Nat. Environ., 5(2): 24-29.
Simpson, E. H., 1949. Measurement of diversity. Nature. 163:688.
Stottrup, J. G., 2000. The elusive copepods. Their production and suitability in marine aquaculture. Aquaculture Res., 31: 703-711.
Thor, P., Nielson, T. G., Tiselius, P., Juul-Pederson, T., Michel, C., Møller, E F., Dahl, K.,Selander, E. & Gooding, S., 2005. Post-spring bloom community structure of pelagic copepods in the Disko Bay, Western Greenland. J. Plankt. Res., 27: 341-356.
Vandromme, P., Schmitt, F G., Souissi S., Buskey, E J., Strickler, J R., Wu, C H., Iang, S. & Hwang, J S. 2010. Symbolic analysis of plankton swimming trajectories: Case study of Strobilidium sp. (Protista) helical walking under various food conditions. Zool. Stud., 49: 289-303.
Yunfang, H. M. S., 1995. Atlas of Fresh-Water Biota in China. Yauton University, Fishery College, China Ocean Press, Beijing. 375 pp.
Ward, H. B. & Whipple, G. C., 1959. Fresh Water Biology. 2nd ed John Wiley and Sons. New York. 1248 pp.
Wroblewski, J.S., 1980. A simulation of the distribution of Acartia clausi during Oregon upwelling, August, 1973. - J. Plankton Res., 2(1): 43-68:

BIOLOGIA (PAKISTAN) 2014, 60 (1), 63-71 PKISSN 0006 – 3096 (Print) ISSN 2313 – 206X (On-Line)
*Correspondence author: <[email protected]> [
Ethnobotanical Studies of Useful Trees of District Kotli, Azad Jammu and Kashmir
*MUHAMMAD1 AJAIB & ZAHEER-UD-DIN KHAN1
Department of Botany, GC University Lahore
ABSTRACT
The ethnobotanical studies on trees of District Kotli, Azad Jammu and Kashmir revealed traditional uses
of 50 tree species, belonging to 39 genera and 24 families with Moraceae, the most common family having 9 species. Among these, gymnosperms were represented by a single species of family Pinaceae, while rests of 47 tree species were dicot and 2 monocot species representing Angiosperms. Almost all the tree species were found having multi-usages especially medicinal and fuel. The most common usages of trees were medicinal, fuel and fodder/forage. Overexploitation, deforestation, browsing, house-thatching, fuel wood are major biotic interferences which causes severe decline of tree resource. The phenological studies showed that 65% of the tree species flowered during the months of February to June in spring or summer season, whereas 34% tree species flowered from the month of August onward or in winter season. Key words: Trees, Ethnobotany, District Kotli, Azad Kashmir, Phenology.
_______________________________________________________________________________________
INTRODUCTION
People living close to their flora, depend on them or its products for their needs such as food, forage/fodder for their cattle, housing, timber, fuel, furniture, agricultural tools, protection of fields from erosion, household utensils, fences, medicines, ornamental and religious purposes. These people are suffering rapid cultural, social and economic changes. These people have a great understanding of the properties of their local flora because of particular intuitive and inherited interaction with them. Ethnobotany, an interaction of people and plants is meant for recording the unique knowledge of plant wealth and for searching new resources of herbal drugs, edible plants, and other aspects of plants. The major benefits of ethnobotany are preservation and improvement in traditional knowledge, community development, conservation and development of wild crop species and the endangered useful plants (Ajaib et al., 2010, 2012 & 2014).
Pakistan is rich in plant resources, particularly the medicinal plants (Ali et al., 2001). More than 6,000 species of higher plants are recognized and established here. At least 1,000 medicinal plant species are reported from Pakistan of which 500 species are commonly used in health care practice and 350 are traded for billions of rupees to the national and international markets. Most of the medicinal plants available in the market or supplied directly to the pharmaceutical industries are extracted from the rural forests (Baquar, 1989; Hanif et al., 2013). Fuel-wood consumption in Pakistan is more than 565 million cubic meters per
year and constantly increasing. A preliminary survey showed that more than 70% of the people all over the tribal area use timber as fuel wood; 10% use animal dung cakes for domestic use; 10% use natural gas, 4% use kerosene oil and less than 4% use electricity. These people have no alternative but to cut these plants to cook their meals (Shinwari et al., 1995).
Ajaib et al. (2010) carried out the ethnobotanical study of useful shrubs of District Kotli, Azad Kashmir and reported 38 species of 36 genera belonging to 25 families. Most of the shrubs were found useful in everyday life of local inhabitants as medicinal, fuel, shelter, fodder/forage and in making agricultural tools, most of the shrubs were noticed having more than one ethnobotanical uses.
District Kotli is divided into Kotli, Khuiratta, Fatehpur, Sehnsa and Nikyal Tehsils. The average height of District Kotli is 1000 m. It is bounded on the eastern side by Occupied Kashmir, Western side by Rawalpindi (Pakistan), Southern side by Mirpur and Northern side by District Poonch. The population is 0.558 million, according to census 1998. Its area is 1862 sq.km. The investigated area lies between longitude 73
6′ to 74 7′ East and
latitude 33 20′ to 33 40′ North (Topo sheet No. 43
G/15). The annual rainfall of District Kotli is 1227.91 mm, maximum during July and August, i.e. 306.93 mm and 256.53 mm, respectively, while low during winter. Thus average monthly rainfall is 102.32 mm. Humidity is low during the day time as compared to night. January, February, August and September are more humid months than May and June (Ajaib et al., 2010).

64 M. AJAIB & Z. KHAN BIOLOGIA (PAKISTAN)
MATERIAL AND METHODS
The socioeconomic and ethnobotanical profile of the people of 20 villages was studied, on the basis of plant resources. Information about the plants surrounding these villages was collected from the local inhabitants of these villages. The information collected from the local people included local names, local uses, parts used, occurrence, marketing. The plants of District Kotli, Azad Jammu and Kashmir were classified according to their economic value in that area (medicinal, fodder, vegetables, thatching, food, fuel wood) through interviewing to different people and filling in questionnaire from drug dealers, shopkeepers, timber dealers, fuel wood sellers, local hakims and farmers. Priority was given to local elderly people and Hakims who had a lot of information about the plants and their traditional uses. Plant specimens collected from the area were dried, pressed and mounted properly on standard herbarium sheets. They were identified with the help of available literature comprising: Parker (1921), Stewart (1972), Ali & Nasir (1990-1992), Nasir & Ali (1970-1989) Nasir & Rafiq (1995) and Ali & Qaisar (1992-2009). The plant specimens were submitted to Dr. Sultan Ahmad Herbarium (SAH), GC University, Lahore, Pakistan with their voucher numbers.
RESULTS AND DISCUSSION
A total of 50 tree species belonging to 24
families of 39 genera were collected with Moraceae as the most common family having 9 species, Mimosaceae with 4 species, Meliaceae, Euphorbiaceae, Rutaceae and Ulmaceae 3 species each; Boraginaceae, Flacourtiaceae, Papilionaceae, Palmae, Rhamnaceae and Tiliaceae with 2 species each, while other 14 families had one species each. The local inhabitants used these plants to treat various ailments such as dysentery, diabetes, diarrhea, scabies, antiseptic cough, kidney infection, leprosy, gonorrhea, throat irritation, tumor, skin diseases, toothache, etc.
Most of the trees were found being used as medicinal and fuel along with other miscellaneous uses such as fodder, food, thatching, agricultural tools, house construction, honey bee keeping, furniture, household utensils, sports goods, fencing and vegetable.
The record of phenological studies revealed that 65.71% of the tree species flowered during the months of February to June in spring or summer season, whereas 34.29% tree species flowered from the month of August onward or in the winter season. The tree species having ethnobotanical importance with flowering period were documented and details are given in Table 1. The present study provides information about the medicinal and miscellaneous uses of 50 recorded tree species of Kotli. Many tree species are claimed to be quite effective as tonic, blood purifier, anthelmetic, antispasmatic, purgative, repellent, diuretic, muswak, laxative, bio-fertilizer, etc. The traditional use of plants for curing various diseases and health problems is one of the major utilities. documented traditional knowledge about the medicinal plants used to treat a range of health problems including hydrophobia, dysentery, earache, epilepsy, eye and liver complaints, fever, hair loss, snake bites, toothache and many other ailments in various parts of Bangladesh, India and Pakistan has been documented by Nadkarni (1954), Chopra et al. (1949), Behl and Srivastava (2002), Sharma (2003), Ahmad (2007), Ibrar et al. (2007), Khan et al. 2011, Zareen et al. 2013. Similarly, ethnobotanical studies of some trees such as Azadirachta indica A. Juss., Bauhinia variegata L., Butea monosperma O. Ktz., Dalbergia sissoo Roxb. and Mangifera indica L. were reported by Sardar and Khan (2009). They recorded trees as being used by local inhabitants by various purposes such as fuel, fodder, furniture, timber, medicinal and vegetable in Shakagarh, District Narowal, Pakistan. Phenological behavior of Plants was recorded from February to June and July to January, 2011. This study indicates a relationship between climate and growing period of plants and this type of study is essential for regeneration, conservation and aforestation. The vegetation varied in different altitudes in a zone. The present study shows that the growing season started from February where few trees initiated vegetative growth. The majority of trees species flowered from February to June. The flowering reaches to the peak during April. The phenological studies by Quershi et al. (2007) reported similar findings in Sudhan Gully and Ganga Chotti Hills, District Bagh, Azad Kashmir.

VOL. 60 (1) ETHNOBOTANICAL STUDIES OF USEFUL TREES 65
Table 1. List of ethnobotanically useful trees with flowering period of District Kotli, AJK
Species and Voucher No.
Family Local name Traditional local uses and Flowering period
1. Acacia modesta Wall. (SAH 0249)
Mimosaceae
Plai Gum collected from tree bark is used as tonic. Leaves are used as fodder for goat. Bundles of branches are used for threshing of wheat by oxen. Flowers are used for honey bee collection. Wood is used as fuel; the branches are used for fencing the fields. Fl. Per. March-May.
2. Acacia nilotica (L.) Delile (SAH 0645)
Mimosaceae Kikar Hard wood is durable and is used for the construction of homes, fuel wood and for making agricultural tools. Leaves and legumes are used as fodder for goats and oxen to increase weight. Legume is used as tonic, and for treating dysentery and diabetes. Seeds are also used for making wine. Fl. Per. March-August.
3. Ailanthus altissima (Mill.) Swingle (SAH 0858)
Simaroubaceae Jangli Toon Leaves are anthelmintic and repellant. Wood is used as fuel and for making furniture. Bark mixed with milk is used for curing dysentery and diarrhea. Fl. Per. July-August.
4. Albizia lebbeck Benth. (SAH 0646)
Mimosaceae Sreeia Seeds are used for curing the severe kidney infection. Leaves provide shade, which is considered as sacred for the treatment of various diseases. Wood is used as fuel wood and for making milk stirrer. Leaves are also palatable and weight increasing in cattle. Fl. Per. April-May.
5. Azadirachta indica A. Juss. (SAH 0730)
Meliaceae Neem Leaves and fruits are dried and make tablets and used for fever, diabetic, blood purification and as tonic. Fl. Per. April-May.
6. Bauhinia variegata L. (SAH 0620)
Caesalpiniaceae
Katchnar
Leaves used as fodder. Flower buds are used as vegetable (Saag). Bark is useful for skin diseases and leprosy. Wood is used as fuel, also cultivated as ornamental plant. Fl. Per. Feb.-April.
7. Bombax ceiba L. (SAH 0607)
Bombacaceae
Simbal
Bark is aphrodisiac, used to soften the tumors. Wood is used for making sports goods such as cricket bats & wickets. Fruit (matures) excretes silky cotton used for making pillows. Fl. Per. December-March.
8. Broussonetia papyrifera (L.) L’Herit. ex Vent. (SAH 0361)
Moraceae
Jangli Toot Wood is used as fuel and leaves are moderate palatable for goat. Plant is toxic and cause allergy. Fl. Per. March-August.

66 M. AJAIB & Z. KHAN BIOLOGIA (PAKISTAN)
9. Butea monosperma O. Ktz. (SAH 0617)
Papilionaceae
Chechra, Kamarkas
Leaves are palatable for goats and wood is used as fuel wood. Gum is mixed with sugar and milk used as tonic and also given for backache after birth in women. Fl. Per. March-April.
10. Casearia tomentosa Roxb. (SAH 0643)
Flacourtiaceae Chella Wood is used as fuel where fruit juice is used for fish poisoning. Fl. Per. March-April.
11. Cedrela toona Roxb. ex Willd. (SAH 0750)
Meliaceae Toon The wood is used as timber and fuel. The bark is used for the treatment of dysentery and ulcers. Fl. Per. March-April.
12. Celtis eriocarpa Dcne. (SAH 0657)
Ulmaceae Khrick Seeds and leaves are used as fodder for goat and sheep. Wood is used as fuel wood. Bark is ground and mixed to form powder to use for tumor, scabies and other skin diseases. Seeds are also used in dysentery. Fl. Per. February-April.
13. Citrus medica L. var. acida Brandis (SAH 0304)
Rutaceae Khatta
Used as an ornamental plant and for bordering the fields. Fl. Per. April.
14. Dalbergia sissoo Roxb. (SAH 0282)
Papilionaceae
Tali/Shesham Decayed leaves provide excellent bio fertilizer. Wood is used for making furniture especially black wood of old trees. Wood is also used as fuel wood and house construction. Wood boiled with water is used as blood purifier, irritation, tumors and pimples and leprosy. Washing the hair with leaves increase the length of hairs and make them healthy. Ground leaves are bandaged on mammary glands to remove pain. Branches are used as Muswak (Tooth brush) and kill worms in the teeth. Fl. Per. March-May.
15. Ehretia laevis Roxb. (SAH 0904)
16. Ehretia serrata Roxb.
Boraginaceae Boraginaceae
Sakkar Puna
Leaves, fruit and root extract is used chest infections. Fl. Per. March-April. Leaves are used as fodder and wood as fuel. Fl. Per. Sept.-Dec. (Pl. 1q)
17. Engelhardtia colebrookeana Lindl. (SAH 0973)
Juglandaceae Samma Wood is used for making furniture where root and leaves used as antiseptic and are rubbed on teeth and gums to make healthy. Fl. Per. March-April.
18. Ficus auriculata Lour. (SAH 0731)
Moraceae
Tussa Leaves are used as fodder for goat. Fruit is edible and laxative. It soothes the bee sting by simple rubbing on the skin. Wood is hard and used for making household utensils. It is also used as fuel. Fl. Per.

VOL. 60 (1) ETHNOBOTANICAL STUDIES OF USEFUL TREES 67
April-August.
19. Ficus palmata Forssk. (SAH 0173)
Moraceae
Phugwara Leaves are used as fodder for goat. Fruit is edible and laxative. It soothes the bee sting by simple rubbing on the skin. Wood is hard and used for making household utensils. It is also used as fuel wood. Fl. Per. May-October.
20. Ficus religiosa L. (SAH 0588)
Moraceae
Pipal Bark decoction is given in gonorrhea and scabies. Fruit is edible and laxative. Wood is used as fuel. Fl. Per. March-April.
21. Ficus semicordata Buch.-Ham. ex Smith. (SAH 0853)
Moraceae
Joharphal, Kandrol
Leaves are used as fodder for cattle, goat and sheep. Bark fibre is used to make ropes. Fruit is edible. Fruit and root juice is used for abdominal and bladder diseases. Fl. Per. March-May.
22. Flacourtia indica (Burm.) Merrill. (SAH 0789)
Flacourtiaceae Kanju, Kakoh Fruit is edible and also used as tonic where wood is used as fuel. Fl. Per. March-April.
23. Flueggea virosa (Roxb. ex Willd.) Voigt (SAH 0776)
Euphorbiaceae
Path Geri
Leaves paste (warm) is excellent wound healer and shoots are used as walking sticks, fruit is edible. Fl. Per. April-June.
24. Grewia asiatica
L. (SAH 0343)
Tiliaceae
Phalsa Leaves are used as fodder for goat. Leaf paste is applied on pustules. Stem bark is used for making ropes. Fruit is edible, stomachic and cooling agent. Fl. Per. March-August.
25. Grewia optiva Drummond ex Burret (SAH 0582)
Tiliaceae
Dhaman Leaves are highly palatable for goat. The outer bark and fruit are soaked in water yield a gelatinous material which after drying, is used to make tablets that are used as aphrodisiac. Wood is used as fuel wood. Fl. Per. March-September.
26. Juglans regia L. (SAH 0852)
Juglandaceae Khor Wood is used for making furniture, roots and leaves used as antiseptic. Dried root locally called “Sacra” is rubbed on teeth to make lips and gums red, healthy and strong. Fruit used as dry fruit. Wood is used as fuel. Leaf decoction is antispasmodic. Fruit also removes stone in gall bladder and aphrodisiac. Fl. Per. February-April.
27. Lannea coromandelica (Houtt.) Merrill (SAH 0706)
Anacardiaceae
Kamlai, Wood and branches are used as timber and fuel. Fl. Per. March-April.
28. Leucaena leucocephala
Mimosaceae Vilayti Kikar, Kubabhal
The leaves with pods are used as an excellent fodder for cattle, goat and

68 M. AJAIB & Z. KHAN BIOLOGIA (PAKISTAN)
(Lam.) de Wit. (SAH 0487)
sheep. Pods and seeds are good tonic. Fl. Per. June-December.
29. Mallotus philippensis (Lam.)Muell.Arg. (SAH 0509)
Euphorbiaceae
Kamella Wood is used as fuel. Dried fruits are powdered, mixed with yogurt and used as purgative and anthelmintic for animals, especially for tape-worms. Fruit powder is used for skin diseases. Young leaves are edible. Fl. Per. March-May.
30. Melia azedarach (L.) Pers. (SAH 0293)
Meliaceae Draik Leaves are palatable for goat. Wood is used as a fuel. Leaves and fruit powder are used as blood purifier, antipyretic and anti-diabetic. Fl. Per. March-April.
31. Morus alba L. (SAH 0590)
Moraceae
Shehtoot Leaves are palatable and used as fodder for goat and silk worms. Fruit is dried and sold in market as a dry fruit. Fresh fruit ground and used as tonic and throat irritation. Wood is used for making agricultural tools and furniture. Wood is also used as fuel. Fl. Per. April-September
32. Morus macroura Miq. (SAH 0591)
Moraceae
Shehtoot Leaves are palatable and used as fodder for goat and silk worms. Fruit is dried and sold in market as a dry fruit. Fresh fruit ground and used as tonic and throat irritation. Wood is used for making agricultural tools and furniture. Wood is also used as fuel. Fl. Per. March-April.
33. Morus nigra L. (SAH 0854)
Moraceae
Kal Toot Leaves are used as fodder for goat and silk worms. Fruit is dried and sold in market as a dry fruit. Fresh fruit is ground and used as tonic and for cough and throat irritation. Wood is used for making agricultural tools and furniture. Wood is also used as fuel. Fl. Per. March-July
34. Morus serrata Roxb. (SAH 0002)
Moraceae
Kartut The tree is usually heavily lopped for sheep, goat and silkworm feeding. The plant wood is also used for making furniture, carving and agricultural tools. Fruit is edible and used in cough and throat irritation. Fl. Per. March-May
35. Olea ferruginea Royle, (SAH 0555)
Oleaceae
Kao Wood is very hard and used for making sticks and agricultural tools. Wood is also used as fuel wood. Leaves served as fodder for goat and sheep. Leaves decoction is used for toothache and gonorrhea. Leaves are also used for making coffee which is a blood purifier. Bark is used to refresh the mouth and curing mouth infections. The branches are used for Muswak (Tooth brush). Fl. Per. April-May.
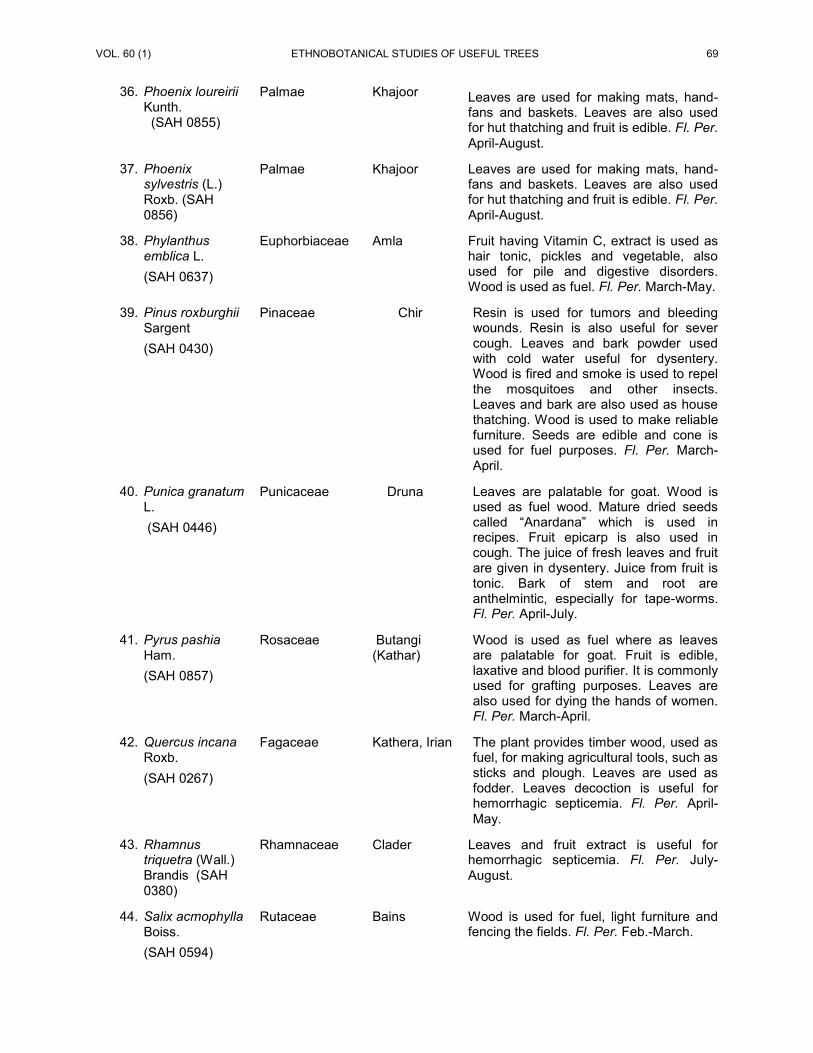
VOL. 60 (1) ETHNOBOTANICAL STUDIES OF USEFUL TREES 69
36. Phoenix loureirii Kunth. (SAH 0855)
Palmae
Khajoor Leaves are used for making mats, hand-fans and baskets. Leaves are also used for hut thatching and fruit is edible. Fl. Per. April-August.
37. Phoenix sylvestris (L.) Roxb. (SAH 0856)
Palmae
Khajoor Leaves are used for making mats, hand-fans and baskets. Leaves are also used for hut thatching and fruit is edible. Fl. Per. April-August.
38. Phylanthus emblica L. (SAH 0637)
Euphorbiaceae
Amla
Fruit having Vitamin C, extract is used as hair tonic, pickles and vegetable, also used for pile and digestive disorders. Wood is used as fuel. Fl. Per. March-May.
39. Pinus roxburghii Sargent (SAH 0430)
Pinaceae
Chir Resin is used for tumors and bleeding wounds. Resin is also useful for sever cough. Leaves and bark powder used with cold water useful for dysentery. Wood is fired and smoke is used to repel the mosquitoes and other insects. Leaves and bark are also used as house thatching. Wood is used to make reliable furniture. Seeds are edible and cone is used for fuel purposes. Fl. Per. March-April.
40. Punica granatum L. (SAH 0446)
Punicaceae Druna Leaves are palatable for goat. Wood is used as fuel wood. Mature dried seeds called “Anardana” which is used in recipes. Fruit epicarp is also used in cough. The juice of fresh leaves and fruit are given in dysentery. Juice from fruit is tonic. Bark of stem and root are anthelmintic, especially for tape-worms. Fl. Per. April-July.
41. Pyrus pashia Ham. (SAH 0857)
Rosaceae Butangi (Kathar)
Wood is used as fuel where as leaves are palatable for goat. Fruit is edible, laxative and blood purifier. It is commonly used for grafting purposes. Leaves are also used for dying the hands of women. Fl. Per. March-April.
42. Quercus incana Roxb. (SAH 0267)
Fagaceae Kathera, Irian The plant provides timber wood, used as fuel, for making agricultural tools, such as sticks and plough. Leaves are used as fodder. Leaves decoction is useful for hemorrhagic septicemia. Fl. Per. April-May.
43. Rhamnus triquetra (Wall.) Brandis (SAH 0380)
Rhamnaceae Clader Leaves and fruit extract is useful for hemorrhagic septicemia. Fl. Per. July-August.
44. Salix acmophylla Boiss. (SAH 0594)
Rutaceae Bains Wood is used for fuel, light furniture and fencing the fields. Fl. Per. Feb.-March.

70 M. AJAIB & Z. KHAN BIOLOGIA (PAKISTAN)
45. Ulmus villosa Brandis ex Gamble (SAH 0984)
Ulmaceae Mannu Commonly planted for shade. Leaves are palatable for goat and sheep. Fl. Per. Feb.-April.
46. Ulmus wallichiana Planch. (SAH 0859)
Ulmaceae Kain, Mareen Leaves are used as fodder for goat and sheep. Wood is used for making furniture. Bark is used for digestive problems. Fl. Per. March-April.
47. Vitex negundo L. (SAH 0860)
Verbenaceae Banna The fresh leaves are aromatic, tonic, febrifuge, diuretic and anthelmintic. Dried leaves are smoked for relief of headache. Branches are used as a fuel wood. The flowers are astringent and tonic. Fl. Per. Almost round the year.
48. Wendlandia exerta (Roxb.) DC. (SAH 0443)
Rubiaceae Ukan, Pansara
Wood is used for thatching and fuel wood. Leaf powder has wound healing properties. Leaves and fruit decoction are useful for amenorrhea, febrifuge and antispasmodic. Fl. Per. March-April.
49. Zanthoxylum armatum DC. (SAH 0598)
Rutaceae Timbur Wood is used as fuel wood. Ground leaves used for digestion. The fruit is aromatic, carminative and condiment and is used in sauce. Young shoot is useful in gum diseases and used as tooth brushes. Fruit is also used for the treatment of pile. Pile is also cured by keeping its stick in hands. The plant is also used as a hedge plant. Fl. Per. March-April.
50. Ziziphus mauritiana Lamk. (SAH 0381)
Rhamnaceae Jand-beri Wood is used as a fuel wood. It is also used in local furniture like beds. The leaves are used for fodder for goat. Fruit is edible, blood purifier and used in indigestion. Fruit and leaves decoction is excellent hair wash. Bark is mixed with milk and honey to use in diarrhea and dysentery. It serves as honey bee species. Fl. Per. June-July.
REFERENCES
Ahmad, S.S., 2007. Medicinal wild plants from
Lahore-Islamabad Motorway (M-2), Pakistan. Pak. J. Bot. 39(2):355-375.
Ajaib, M., Haider, S.K, Zikrea, A. & Siddiqui, M.F., 2014. Ethnobotanical Studies of Herbs of Agra Valley Parachinar, Upper Kurram Agency, Pakistan. Int. J. Biol. Biotech., 11 (1): 71-83.
Ajaib, M., Khan, Z. & Siddiqui, F.M., 2012.Ethnobotanical Study of Useful Climbers/twiners of District Kotli, Azad Jammu & Kashmir. Int. J. Biol. & Biotech., 9(4): 421-427.
Ajaib, M., Khan, Z., Khan, N. & Wahab, M., 2010. Ethnobotanical Studies on useful Shrubs of District Kotli, Azad Jammu & Kashmir, Pakistan. Pak. J. Bot., 42(3): 1407-1415.
Ali, S.I., Omer, S. & Qaisar, M., 2001. Flora of Pakistan: In Mohammad Afzal and Shehzad A Mufti (Eds). Natural History Research in Pakistan. PASTIC, Islamabad.
Ali, S.I. & Nasir, Y.J. (Eds), 1990-92. Flora of Pakistan. No. 191-193. Department of Botany, University of Karachi and National Herbarium, PARC, Islamabad.

VOL. 60 (1) ETHNOBOTANICAL STUDIES OF USEFUL TREES 71
Ali, S.I. & Qaisar, M. (Eds), 1992-2009. Flora of Pakistan. No. 194-216. Department of Botany, University of Karachi and National Herbarium, PARC, Islamabad.
Baquar, S.R., 1989. Medicinal and Poisonous Plants of Pakistan. Printas, Karachi, Pakistan.
Behl, P.N. & Srivastava, G., 2002. Herbs Useful in Dermatological Therapy. CBS Publishers & Distributors, 11 Darya Ganj New Delhi-110002 India. 163pp.
Chopra, R.N., Badhwar, R.L. & Ghosh, S., 1949. Poisonous Plants of India. Vol. I. Indian Council of Agricultural Research, Scientific Monograph no. 17. New Delhi, India. 763pp.
Hanif, U., Mushtaq, S., Ajaib,M. & Ishtiaq, S., 2013. Ethnobotanical studies on some wild plants of head Qadirabad and adjoining areas, Pakistan. Int. J. Phytomed., 5(3): 373-377.
Ibrar, M., Hussain, F. & Sultan, A., 2007. Ethnobotanical studies on plant resources of Ranyal hills, District Shangla, Pakistan. Pak. J. Bot. 39(2): 329-337.
Khan, N., Ahmed, M., Shaukat, S.S., Wahab, M., Ajaib, M., Siddiqui, F.M. & Nasir, M., 2011. Important Medicinal Plants of Chitral Gol National Park, (CGNP) Pakistan. Pak. J. Bot., 43(2): 797-809.
Nadkarni, A.K. 1954. Dr. K.M. Nadkarni’s Indian Materia Medica. Vol. I (pp. 1319) & Vol. II (pp. 968) Popular Book Depot, Bombay, India.
Nasir, E. & Ali, S.I. (Eds), 1970-89. Flora of Pakistan. No. 1-190. National Herbarium, PARC, Islamabad and Department of Botany, University of Karachi.
Nasir, Y.J. & Rafiq, R.A. 1995. Wild Flowers of Pakistan. Oxford University Press, Karachi.
Parker, R.N. 1921. A Forest Flora for the Punjab with Hazara and Delhi. Superintendent, Government Printing, West Pakistan.
Qureshi, R.A., Ghufran, M.A., Gilani, S.A., Sultana, K. & Ashraf, M., 2007. Ethnobotanical Studies of Selected Medicinal Plants of Sudhan Gully and Ganga Chotti Hills, District Bagh Azad Kashmir. Pak. J. Bot., 39(7): 2275-2283.
Sardar, A.A. & Khan, Z., 2009. Ethnomedicinal Studies on Plant Resources of Tehsil Shakargarh, District Narowal, Pakistan. Pak. J. Bot., 41(1):11-18.
Sharma, R., 2003. Medicinal Plants of India, An Encyclopedia. Daya Publishing House Delhi, India: 302.
Shinwari, M.I., Shinwari, Z.K.& Khan, B.A., 1995. Ethnobotany of Kaghan Velley (Mansehra). Poceedings of Ethnobotany Workshop, NARC, Islamabad, Pakistan: 94-103.
Stewart, R.R., 1972. Flora of West Pakistan, An Annotated Catalogue of the Vascular Plants of West Pakistan and Kashmir. E. Nasir and S.I. Ali, (Eds), Department of Botany, University of Karachi.
Zareen, A., Khan, Z. & Ajaib, M., 2013. Ethnobotanical evaluation of the shrubs of Central Punjab, Pakistan. Biologia (Pakistan), 59(1):136-146.

BIOLOGIA (PAKISTAN) 2014, 60 (1), 73-80 PKISSN 0006 – 3096 (Print) ISSN 2313 – 206X (On-Line)
*Corresponding author: [email protected]
Temporal variations in Commercial Fish Community of a Floodplain of the River Ravi, Pakistan
*ALTAF HUSSAIN1, ABDUL QAYYUM KHAN SULEHRIA2, MUHAMMAD EJAZ1, ASMA MAQBOOL1 &
MUHAMMAD RAMZAN MIRZA1
1Department of Zoology, GC University, Lahore, Pakistan 2Department of Zoology, Govt. Islamia College, Civil Lines Lahore, Pakistan
ABSTRACT
Temporal distribution of commercial fish community of a floodplain lake situated on River Ravi near Balloki Head Works was investigated. Survey was conducted by taking monthly samples from August 2012 to May 2013. In total, 1703 fishes were collected and identified which belonged to 19 species, 14 genera, 8 families and 7 orders. Cypriniformes was the most abundant order with a largest number of representatives. The most abundant species were Labeo rohita (229), Wallago attu (225) and Cirrhinus mrigala (214) whereas Xenentodon cancila was present in lowest number (5). Shannon- Weaver index (H) was highest in December (2.67581) and lowest in May (1.80945), Simpson index of dominance (D) was highest in May (0.21893) and lowest in December (0.08306), Simpson index of diversity (1-D) was highest in December (18.9169) and lowest in May (18.781). Species richness (SR) was maximum in February (3.4206) and minimum in April (2.1722) while Species evenness (E) was highest in August (0.95691) and lowest in May (0.82351). Key words: Floodplain, River Ravi, Balloki Headworks, Density of fishes, Diversity of fishes.
_______________________________________________________________________________________
INTRODUCTION Floodplains of many tropical rivers are
receiving scientific as well as conservational interest as they are essential feeding, breeding and rearing places of a majority of freshwater fish species (Keddy, 2010). Floods provide connections between lake and main river channel. Periodic flooding facilitates nutrient exchange between the river and floodplain, helps in sediment deposition in floodplain habitats, and homogenizes fish communities by allowing mixing of river and floodplain water (Miranda, 2005; Schramm & Eggleton 2006). Floodplains inundated during monsoons are nutrient rich and play a significant role as nurseries for many larvae and juvenile fish species (Ramberg, et al., 2006; Lindholm, et al., 2007). Floodplains generally accumulate and store nutrients during low flow seasons and release these nutrients into the main river during high flows and floods. Floodplains also help in decreasing the impacts of seasonal flood events by spreading large amounts of water over large spatial areas (Walbridge, 1993). Some fish species use floodplain channel as spawning grounds during high water flow periods whereas juveniles utilize them as nursery grounds (Shaeffer & Nickum, 1986; Copp, 1989).
Fish species richness in floodplain lakes is positively correlated with degree of flooding and with linear distance between the floodplain and the main river channel. Improved connectivity between mainstream and floodplain habitats and increased
inundation of floodplains has been shown to increase some fish populations (Rood, et al., 2003). Changes in the natural flow regimes of main rivers and alterations to the floodplain channel mainstream connectivity may lead to decreased diversity of fishes in river ecosystems. Disrupting connections between river and its floodplain channel may impact fish communities by disrupting food, spawning and rearing resources required by riverine fish populations (Bayley, 1995; Grift, et al., 2001).
Seasonal inundations are supposed to increase the natural productivity and animal diversity of floodplain ecosystem (Junk, et al., 1989). Seasonal inundation has been linked with the increased yield of fishes in riverine systems (Bayley, 1991; Agostinho & Zalewski, 1995). The growth of fish in floodplain is fast and strongly related to flood season (Dudley, 1972). Growth of fish can vary significantly between years and is correlated with flooding intensity and duration (Halls, 1998; Halls, et al., 1999).
Few studies are available for the spatio-temporal distribution of adult fishes in floodplain in relation to their improved spawning behaviour. As demand for water resources has increased, the importance of floodplain for fish spawning and juveniles nursery has also been increased to a large extent. In the present studies, the importance of floodplain of River Ravi near Balloki Head Works was investigated for density and diversity of cultureable fishes. The floodplain on River Ravi is a highly dynamic environment. The main emphasis of

74 A. HUSSAIN ET AL BIOLOGIA (PAKISTAN)
this study was to explore the importance of floodplain for the development of aquaculture in Pakistan.
MATERIALS AND METHODS
Study area The floodplain under study is situated on
the River Ravi near Balloki Headworks in District Kasur, Punjab Pakistan, and 65 Km away from Lahore. It is lying at a Latitude: 31° 11' 25" North, and at Longitude: 73° 52' 40" East. The total area of the floodplain, under study, comprises about 8.6 Km. It has distinct tropical climate with a marked monsoonal effect with an average rainfall of 52.01mm, humidity 70.40% and average atmospheric temperature ranges from a minimum of 5oC in winter to a maximum of 50oC in summer. Water level varies in different months of the year, being highest in summer (May to August) and lowest in winter (October to April) every year.
Fish Sampling Fish fauna of the study area was collected
on monthly basis from August 2012 to May 2013, using a variety of fishing nets like cast net, drag net and gill nets of various mesh sizes (Bhat, 2003). The samples were fixed in 10 percent buffered commercial grade formalin. Samples were packed separately with appropriate labels indicating the date, time, locality, and the name of collector. Sampling in the months of June and July was not done, due to ban imposed by Fisheries Department on fishing activities in breeding season. This corresponded to our temporal scale of analysis.
Identification and Classification The specimens were identified and
classified on the basis of morphometry using the standard keys (Mirza & Sharif, 1996; Mirza & Sandhu, 2007).
Diversity Indices and Cluster Analysis The data was analyzed by using the
Shannon-Weaver index (H’), Simpson index of dominance (D) and Simpson index of diversity (1-D) to calculate the species diversity. To study the distribution of fish species and type of food chain, the species richness (SR) and evenness (E) was calculated. Cluster Analysis was performed to observe and sort the different sets of species. Species Abundance curve was plotted to know the most abundant and rare species present in the specific locality (Sulehria et al., 2009a, 2009b).
RESULTS The fishes collected from the reservoir are shown in Table 1. Total number of fishes varied widely during
current period of study in this reservoir. In total, 1703 fish specimens were collected which belonged to 19 species, 14 genera, 8 families and 7 orders (Table 2). Labeo rohita showed the highest catch with a total number of 229 (13.5 ± 4.3 %) specimens. Wallago attu showed the second largest catch with a total number of 225 (13.2 ± 1.8 %) fishes and Cirrhinus mrigala stood at number three with a total count of 214 (12.6 ± 3.6 %) throughout the period of study. Xenentodon cancila showed the lowest catch of only 5 (0.29 ± 0.3 %) fishes during the whole period of studies. No species numerically dominated in the present reservoir. Species wise order of catch from highest to lowest is Labeo rohita˃ Wallago attu˃ Cirrhinus mirigala˃ Labeo calbaso ˃Oreochromis mossambicus ˃Sperata sarwari˃ Cirrhinus reba˃ Notopterus notopterus˃ Channa marulia˃ Channa punctata˃ Catla catla˃ Labeo boga˃ Cyprinus carpio˃ Chitala chitala˃ Ctenopharyngodon idella˃ Hypophthalmichthys molitrix˃ Mastacembelus armatus˃ Mastacembelus pancalus˃ Xenentodon cancila. It was observed that large number of fishes were present during winter i.e., in the months of low water level (From October to December) than summer i.e., the months of high water level. The results showed that highest catch of 309 fishes was recorded in the month of December whereas the lowest catch of 26 was recorded in the month of May (Table 1).
Month wise relative percentage of fishes is shown in figure 1. Highest percentage of fishes (18%) was found in the month of December. In October 14% fishes were found. Lowest percentage of fishes (1.5) was found in May. The contribution of some exotic fishes, Hypophthalmichthys molitrix, Ctenopharyngodon idella and Oreochromis mossambicus has also been shown during the present period of studies, which confirmed the overflow of water from River Ravi during the flooding season. Numerically the most abundant order was Cypriniformes represented by 47.37% of the total individuals followed by Osteoglossiformes, Siluriformes, Channiformes, Mastacembeliformes was represented by 10.53% and Biloniformes and Perciformes were represented by 5.26% respectively (Table 2, Figure 2). Taxonomically the most abundant family was Cyprinidae which was represented by six genera, followed by Notopteridae represented by two genera and Bagridae, Siluridae, Beloninidae, Channidae, Cichlidae and Mastacembelidae each represented by one genera.
The rank abundance curve of fish species was plotted to display the relative species abundance of the fish species collected (Figure 3). According to this Labeo rohita (229) stood first in rank i.e., found in large number, Wallago attu (225)

VOL. 60 (1) COMMERCIAL FISH COMMUNITY OF A FLOODPLAIN 75
stood second and Cirrhinus mirigala (214) was third. According to this curve Xenentodon cancila (5) was present at last stage in rank with the lowest number. The species rank abundance plot showed a greater proportion of intermediate abundant species.
In order to show the sampling similarities in different species, the data was subjected to Multivariate Cluster Analysis for preparation of Dendrogram using Euclidian distance. The results (Figure 4) showed that at Eucladian distance of almost 16, all the fish species were arranged in five different groups on the basis of their abundance and similarities. Labeo boga, Cyprinus carpio, Notopterus notopterus, Ctenopharyngodon idella and Hypophthalmichthys molitrix formed the first group with less number of fishes. Xenentodon cancila, Mastacembelus armatus and Mastacembelus puncalus formed second group in this particular reservoir. Lowest number of fishes was found in this group. Xenentodon cancila was represented by only 5 individuals throughout the year. Catla catla, Channa marulia, Channa punctata, Chitala chitala and Cirrhinus reba formed the third group with moderate number of fishes in the present studies. Labeo calbaso, Sperata sarwari and Oreochromis mossambicus formed the fourth group. Labeo rohita, Wallago attu and Cirrhinus mrigala formed the last cluster with highest number of fishes in the present studies.
The value of Shannon-Weaver index was highest in December (2.67581) and lowest in May (1.80945). Similarly Simpson index of dominance (D) was highest in May (0.21893) and lowest in December (0.08306). Simpson index of diversity (1-D) was highest in December (18.9169) and lowest in May (18.781). The species richness (SR) was highest in February (3.4206) and lowest in April (2.1722) and species evenness (E) was highest in August (0.95691) and lowest in May (0.82351) (Table 3).
The total discharge of water (Cusecs) in River Ravi at Balloki Headworks was measured by Flood and Drainage division, Punjab Irrigation Department, Lahore. The highest discharge was in August (45370 Cusecs) whereas the lowest discharge was in the month of January (6614) in the River Ravi at Balloki Headworks (Figure 5).
DISCUSSION
Seasonal fluctuations of water level in
floodplains seemed to influence the fish composition in the floodplain. The greater number (309) of individual fish caught and species composition were observed during the low water season i.e., in the month of December. The lowest catch (26) was
recorded in the month of May when water level started to increase with the onset of melting of ice on mountain caps. The water level was highest in the month of August when floods were at their peak during Monsoon in Pakistan. In present studies an inverse relationship was seen between the water level and the total number of fishes caught (Figure 5). Boujard (1992) reported that the behaviour of freshwater fishes from French Guiana was supposed to be strongly influenced by seasonal variations in water level. Renato, et al. (2000) studied that fish abundance and species richness at the upper Juru´a were greater in the dry season. During that season, fishes might be concentrated due to the low water level being more easily caught by gillnets whereas during high water level, the fishes probably dispersed along the inundated floodplain. Goulding, et al., (1988) also reported the similar results for other Amazonian Rivers. In general the amount of total commercial fish catches inversely followed the pattern of water fluctuation in the floodplain. Flood water recession reduced the availability of aquatic habitats for fish resulting in fish densities and biotic interactions (Winemiller, 1989; Rodr’iguez & Lewis, 1994; 1997).
Our floodplain is situated on River Ravi near Balloki Headworks. During monsoon when water level was highest in river, water flowed in the adjacent floodplain areas. From July to August the floodplain was well connected with the river. This allowed the influx of large number of fishes from river to the present floodplain. Miranda (2005) hypothesized that lakes with higher degrees of connectivity (i.e., greater flooding) are expected to contain a lotic and lentic species that periodically mixed during flood pulses, whereas lakes with lower degrees of connectivity would contain mostly lentic species. There was some evidence of this possibility in the present study. For example, our Major carps Labeo rohita, Cirrhinus mrigala, and Catla catla and the Chinese carps Hypophthalmichthys molitrix and Ctenopharyngodon idella are mostly lotic species and are in the habit to lay their eggs in running water (Mirza, 2004). The presence of these fishes in lentic system indicated that these fishes migrated from nearby river i.e., lotic system through Flood pulse.
Relative % age representation of fishes in the monthly catches showed that the different species of fishes were present in moderate to large number. Diversity indices were found highest in low water level seasons i.e., from October-December. Highest value of Shannon-Weaver index (H), and Simpson index of diversity (1-D) are an indication of greater distribution of fishes in the months of October, November, and December. Highest value

76 A. HUSSAIN ET AL BIOLOGIA (PAKISTAN)
of species richness (SR) in the month of February expressed high food chain. Highest value of species evenness in August represented even distribution of fishes in this month. These results showed that the flood plain was rich in fish communities and all the species were evenly distributed throughout the floodplain.
The rank abundance curve expressed that the fish fauna was diverse in this specific reservoir. The curve had relatively steep slope. It further showed the Labeo rohita, Wallago attu and Cirrhinus mrigala were the most common species represented by 13.44%, 13.21% and 12.56% respectively. Similarly Xenentodon cancila is a rare species with least representation of only 0.29% only. Lowe-McConnell (1987) said that seasonal environments tended to have diverse fish communities with a few dominant species. The high numerical dominance of some fish species in the present reservoir might be related to seasonal disturbances, such as large and unpredictable variations in water level during May to June and temperature difference that favoured some species better adapted to such conditions. Similar results had been reported by Jepsen (1997).
The Multivariate Cluster Analysis performed for the sampled fishes had arranged them in five different groups (Figure 4). There might be different reasons assigned to these groupings, including the similarity of feeding, breeding and living habits.
There are different factors which were responsible for controlling the distribution and diversity of fishes in the flood plains. Rainfall was one of them which played a significant role in deceasing and increasing water level in the Flood plain. The hydrological cycles of the lake also affected the distribution and abundance of fishes in floodplains. The hydrological cycle in Pakistan mostly started in May which raised the water level in rivers, thereby filling the lake quickly. The maximum level reached in August when the floods were in full swing. After that the water level began to fall slowly
and reached to minimum in December. There was no increase in water level from December to May. Additionally, a number of other factors also played their role in the alteration of ecological conditions of the reservoir during the last two decades. These were the increased sewerage/industrial pollution, sedimentation, over-fishing and introduction of exotic species in the reservoir.
Discussions with some fishermen revealed that the population of these fishes had drastically declined during the last decade or so, owing to the increasing level of pollution in River Ravi. Apparently, these factors individually or in concert manner may have caused the changes in ecology of the flood plain resulting in the changes in fish fauna and commercial catches (Mirza, et al., 2012). The fishing contractor was solely responsible for the exploitation of the fisheries resources of the water body for the period leased out. It was observed that in order to maximize his profits, the fishing contractor tried to scoop maximum quantities of fish during the year especially in the months of low/dead water level which decreased the monthly catch in preceding months.
Increasing human population and urbanization are continuously posing threats to the already fragile fisheries resources. Strengthening of existing facilities and proper implementation of fisheries rules are needed to increase the natural productivity of the floodplains. It is recommended that further studies regarding the controlling factor should be carried out to increase the potential of fish production in the present floodplain of River Ravi near Balloki Headworks.
ACKNOWLEDGEMENTS
The authors are thankful to Fisheries
Department Punjab, Lahore for providing help in sampling and Punjab Irrigation Department for providing the valuable flood data.

VOL. 60 (1) COMMERCIAL FISH COMMUNITY OF A FLOODPLAIN 77
Table 1: Density and diversity of fish species in a flood plain of River Ravi.
Species Au S O N D J F Mr Ap Ma Total % age MEAN STDV VAR SEM
Notopterus notopterus 0 0 8 10 20 0 0 0 0 38 2.23 3.8 7.1 50 2.3
Chitala chitala 0 3 7 18 20 15 17 3 0 0 83 5 8.3 8.27 68 2.6
Labeo rohita 25 24 30 35 45 33 17 10 7 3 229 13.5 22.9 13.5 183 4.3
Labeo calbaso 15 21 21 20 25 21 16 12 10 1 162 9.51 16.2 7.07 50 2.2
Labeo boga 10 8 4 5 7 6 3 7 0 0 50 2.94 5 3.3 11 1
Catla catla 10 8 6 7 10 9 6 4 2 0 62 3.64 6.2 3.36 11 1.1
Cirrhinus mrigala 15 18 25 30 43 30 21 20 9 3 214 12.6 21.4 11.4 130 3.6
Cirrhinus reba 15 11 17 15 17 15 3 2 0 0 95 5.58 9.5 7.34 54 2.3
Cyprinus carpio 6 3 5 4 7 6 4 3 3 1 42 2.47 4.2 1.81 3.3 0.6
Ctenopharyngodon idella 8 3 4 2 5 3 2 3 0 0 30 1.76 3 2.36 5.6 0.8
Hypophthalmichthys molitrix 5 7 3 2 5 2 1 0 0 1 26 1.53 2.6 2.37 5.6 0.8
Sperata sarwari 11 7 15 20 25 17 10 8 5 5 123 7.22 12.3 6.75 46 2.1
Wallago attu 20 23 25 28 30 27 23 20 19 10 225 13.2 22.5 5.72 33 1.8
Xenentodon cancila 0 1 0 0 3 0 1 0 0 0 5 0.29 0.5 0.97 0.9 0.3
Channa marulia 10 13 8 9 10 8 7 6 3 1 75 4.4 7.5 3.5 12 1.1
Channa punctata 15 15 10 6 15 3 3 2 2 1 72 4.23 7.2 5.96 36 1.9
Oreochrmis mossambicus 30 21 50 5 12 8 8 4 3 0 141 8.28 14.1 15.6 242 4.9
Mastacembelus armatus 0 2 3 5 5 0 1 1 0 0 17 1 1.7 2 4 0.6
Mastacembelus pancalus 0 0 0 1 5 3 2 3 0 0 14 0.82 1.4 1.78 3.2 0.6
Total 195 188 241 222 309 206 145 108 63 26 1703 100 170.3
Percentage 11 11 14 13 18 12 9 6.3 4 1.5 100
Au=August; S=September; O=October; N=November; D=December; J=January; F=February; Mr=March; Ap=April; Ma=May
Table 2: Relative % representation of fish orders in present floodplain
No. No. Of Orders No. Of
families
No. of
genera
No. of
species
Relative % representation
of order
1 Osteoglossiformes 1 1 2 10.53
2 Cypriniformes 1 6 9 47.37
3 Siluriformes 2 2 2 10.53
4 Beloniformes 1 1 1 5.26
5 Channiformes 1 1 2 10.53
6 Perciformes 1 1 1 5.26
7 Mastacembeliformes 1 1 2 10.53
Total 7 8 14 19 100

78 A. HUSSAIN ET AL BIOLOGIA (PAKISTAN)
Table 3: Seasonal fluctuations of diversity indices, Species richness and Species evenness of fish species in the present studies.
Months Shannon-Weaver
Index (H)
Simpson Index of
Dominance (D)
Simpson Index of Diversity
(1-D)
Species Richness
(SR)
Species Evenness (E)
Aug.12 2.52534 0.08865 18.9113 2.4653 0.95691
Sep.12 2.57466 0.08725 18.9127 3.0555 0.90874
Oct.12 2.54227 0.10081 18.8991 3.0925 0.87956
Nov.12 2.58898 0.091 18.909 3.1362 0.89572
Dec.12 2.67581 0.08306 18.9169 3.1413 0.90876
Jan.13 2.48265 0.10001 18.8999 3.0058 0.87626
Feb.13 2.48652 0.10146 18.8985 3.4206 0.86027
Mar.13 2.36139 0.11649 18.8835 2.799 0.89478
Apr.13 2.03085 0.16402 18.8359 2.1722 0.88198
May.13 1.80945 0.21893 18.781 2.4554 0.82351
Fig., 1: Month wise relative % of fish species in the flood plain during the present studies.
Fig., 2: Percentage contribution of different orders
during the current period of study

VOL. 60 (1) COMMERCIAL FISH COMMUNITY OF A FLOODPLAIN 79
Fig., 3: Rank abundance curve of fish species in a flood plain during the period of studies.
0 1.2 2.4 3.6 4.8 6 7.2 8.4 9.6 10.8 12 13.2 14.4 15.6 16.8 18 19.2Fish species
144
136
128
120
112
104
96
88
80
72
64
56
48
40
32
24
16
8
Eucl
idia
n di
stan
ce
L. bogaC. ca
rpio
N. notopterus
C. idella
H. molitri
x
X. cancila
M. armatus
M.pancalus
C. catla
C. marulia
C. punctata
C. chitala
C. reba
L. calbaso
S. sarwari
O. mossa
mbicus
L. rohita
W. attuC. m
rigala
Fig., 4: Dendrogram of fish species in a flood plain
during the period of studies.
Fig., 5: Seasonal fluctuations in the Number of fishes/Month and total discharge (Cusecs) in the
present studies.
REFERENCES
Agostinho, A. & Zalewski, M., 1995.The dependence of fish community structure
and dynamics on floodplain and riparian ecotone zone in Parana River, Brazil. Hydrobiologia, 303: 141–148.
Bayley, P., 1991. The flood pulse advantage and the restoration of riverfloodplain systems. Regul. River., 6: 75–86.
Bayley, P. 1995. Understanding large river floodplain ecosystems. Bioscience, 45: 153–158.
Bhat, A., 2003. Diversity and Composition of Fresh water Fishes in River systems of Central Western Ghats, India. Environ. Biol. Fishes., 68(1): 25-38.
Boujard, T. 1992. Space-time organization of riverine fish communities in French Guiana. Env. Biol. Fishes., 3: 235–246.
Copp, G., 1989. The habitat diversity and fish reproductive function of floodplain ecosystems. Environ. Biol. Fishes, 26: 1–27.
Dudley, R. G., 1972. Growth of Tilapia of the Kafue floodplain, Zambia: predicted effects of the Kafue Gorge Dam. Trans. Am. Fish. Soc. 2: 281–291.
Goulding, M., Ferreira, E. J. G. & Carvalho, M. L., 1988. Rio Negro, rich life in poor waters. SBP Academic Publ., The Hague. 189 pp.
Grift, R., Buijse, A., Van Densen, W. & Klein, B., 2001. Restoration of the river-floodplain interaction: benefits for the fish community in the river Rhine. Archiv für Hydrobiologie. Supplementband. Large Rivers, 12: 173–185.
Halls, A. S., 1998. An assessment of the impact of hydraulic engineering on fisheries and species assemblages in Bangladesh. PhD Thesis, University of London, UK.
Halls, A. S., Hoggarth, D. D. & Debnath, K., 1999. Impacts of hydraulic engineering on the dynamics and production potential of floodplain fish populations in Bangladesh. Fisheries Manag. Ecol., 6: 261–285.
Jepsen, D.B., 1997. Fish species diversity in sand bank habitats of a neotropical river. Env. Biol. Fishes., 49: 449–460.
Junk, W., Bayley, P. & Sparks, R., 1989. The flood pulse concept in river-floodplain systems. Can. J. Fish. Aquat. Sci, 106: 110–127.
Keddy, P. A., 2010: Wetland ecology, principles and conservation. Cambridge University Press, New York, pp. 497.
Lindholm, M., Hessen, D., Mosepele, K. & Wolski, P., 2007. Food webs and energy fluxes on a seasonal floodplain: the influence of flood size. Wetlands, 27: 775–784.

80 A. HUSSAIN ET AL BIOLOGIA (PAKISTAN)
Lowe-Mcconnell, R. H., 1987. Ecological studies in tropical fish communities. Cambridge University Press, Cambridge. 382pp.
Miranda, L. E., 2005. Fish assemblages in oxbow lakes relative to connectivity with the Mississippi River. T. Am. Fish. Soc., 134:1480–1489.
Mirza, M. R., 2004. Pakistan Main Taza Paani ki Macchlian. Urdu Science Board, Lahore. pp 93-148.
Mirza, M. R., & Sandhu, I. A., 2007. Fishes of the Punjab, Pakistan. Polymer Publications, Urdu bazaar Lahore, Pakistan.
Mirza, M. R. & Sharif, H. M., 1996. A Key to the fishes of Pakistan. Ilmi Kitab Khana, Lahore, Pakistan.
Mirza, Z. S., Nadeem, M. S., Beg, M. A., Sulehria, A. Q. K. & Shah, S. I., 2012. Current status of fisheries in the Mangla Reservoir, Pakistan. Biologia (Pakistan), 58 (1&2): 31-39.
Ramberg, L., Hancock, P., Lindholm, M., Meyer, T., Ringrose, S., Sliva, J., Van, A. & Vanderpost, C., 2006. Species diversity of the Okavango Delta, Botswana. Aquat. Sci-Research across boundaries, 68: 310–337.
Renato, A. M., Benedito, S., Amaralc, D. & Oyakawad, O. T., 2000. Spatial and temporal patterns of diversity and distribution of the Upper Juru´a River fish community (Brazilian Amazon). Environ. Biol. Fishes, 57: 25–35.
Rodr´Iguez, M. A. & Lewis, W. M., 1994. Regulation and stability in fish assemblages of Neotropical floodplain lakes. Oecologia, 99: 166–180.
Rodr´Iguez, M. A. & Lewis, W. M., 1997. Structure of fish assemblages along environmental gradients in floodplain lakes of the Orinoco River. Ecol. Monogr., 67: 109–128.
Rood, S., Gourley, C., Ammon, E., Heki, L., Klotz, J., Morrison, M., Mosley, D., Scoppettone, G., Swanson, S. & Wagner, P., 2003. Flows for floodplain forests: a successful riparian restoration. Bioscience, 53: 647–656.
Schramm, H. L., & Eggleton. M. A., 2006. Applicability of the flood-pulse concept to temperate floodplain river ecosystems: thermal and temporal components. River Res. Applic., 22:543–553.
Shaeffer, W. & Nickum, J., 1986. Backwater areas as nursery habitat for fishes in pool 13 of the upper Mississippi River. Hydrobiologia, 36: 131–140.
Sulehria, A. Q. K., Qamar, M. F., Anjum, R. F., Ejaz, M. & Hussain, A., 2009a. Seasonal fluctuations of Rotifers in a fish pond at District Bahawalnagar, Pakistan. Biologia (Pakistan), 55(1&2):21-28.
Sulehria, A. Q. K., Qamar, M. F., Haider, S., Ejaz, M. & Hussain, A., 2009b. Water quality and Rotifer diversity in the fish pond at District Mianwali Pakistan. Biologia (Pakistan). 55(1&2):79-85.
Walbridge M., 1993. Functions and values of forested wetlands in the southern United States. J. Forest., 91: 15–19.
Winemiller, K.O., 1989. Ontogenetic diet shifts and resource partitioning among piscivorous fishes in the Venezuelan Llanos. Environ. Biol. Fishes., 26: 177–199.

BIOLOGIA (PAKISTAN) 2014, 60 (1), 81-85 PKISSN 0006 – 3096 (Print) ISSN 2313 – 206X (On-Line)
*Corresponding author: [email protected]
Prevalence of acid and antibiotic resistant coliform bacteria in yogurt and oriental snacks sampled from markets of Lahore, Pakistan
FAIZA SALEEM1, RAKHSHANDA SADIQ2, ROOMA ADALAT1, ALI HUSSAIN3 & *JAVED IQBAL QAZI3
1Department of Biotechnology & Microbiology, Lahore College for Women University, Lahore, Pakistan.
2Department of Environmental Sciences, Lahore College for Women University (54000), Lahore, Pakistan. 3Department of Zoology, University of the Punjab (54590), Lahore, Pakistan.
ABSTRACT
Coliform bacterial contamination plays an important role in the decline of human health. The present
study reports isolation of E. coli, Klebsiella, Shigella, Salmonella and Enterobacter spp. from dahi bhallay, fruit chat and yogurt samples collected from markets in Lahore. Isolates obtained from dahi bhallay showed resistance (10 minutes exposure) to pH 2, 3 and 4 at 37°C. While, isolates from two other food stuffs (fruit chat and yogurt) couldn’t tolerate the acid exposures. Cell wall inhibitor antibiotics appeared as the most effective ones against which different strains showed sensitivity at varying levels. While several of the isolates expressed resistance to other categories of the antibiotics applied. Antibiotic resistances of the coliform bacteria isolated from the food items, brought an indication that the human population might had been experiencing bacterial infections. Key words: Acid tolerance, Coliforms, Vendor’s food, Yogurt.
_______________________________________________________________________________________
INTRODUCTION
Food borne pathogens are highly deleterious to human health due to their direct entry into the human gastrointestinal tract following ingestion of food. A significant proportion of ready to eat foods is sold as street foods and is usually consumed at low profiled socio-economic brackets in developing countries (Mensah, et al., 2002). Ready-to-eat foods including cut fruits, salad, sprouts and vegetables are well known for implication in outbreaks of food borne diseases in both developed and developing countries (Beuchat, 1998; Kumar, et al., 2006). Enteric pathogens such as Escherichia coli, Salmonella and Shigella spp. are of great concerns during food-related outbreaks and the middle one is thought to be a major cause of food poising worldwide (Buck, et al., 2003). Association of these pathogens with different food products and their health effects have been reported by various researchers (Kumar, et al., 2011; Elnawawi, et al., 2012; Hussain, et al., 2013).
Acid resistance is a defence offering attribute of various microorganisms and enables the enteric pathogens to thrive in the low pH environment of stomach. The phenomenon has been extensively studied in E. coli. Whilst the acid resistant phenotype of S. flexneri has been described in fewer instances and tolerance of E. coli to the extreme acidic condition (pH 2-3) has been investigated (Gorden & Small, 1993; Waterman & Small, 1996).
Different food materials are sold under unhygienic conditions especially in developing countries and thus, causing various food borne diseases to consumers. Outbreaks of human infections have been increased following consumptions of such types of foods in spite of their nutritional and health benefits. Keeping in view these facts, purpose of the present study was to investigate the prevalence of the acid and antibiotic resistant coliform bacteria in yogurt and two popular types of street foods (dahi bhallay and fruit chat).
MATERIALS AND METHODS
Sample collection
Samples of yogurt, dahi bhallay and fruit chat were taken in triplicates from different locations of the Lahore city, Pakistan. The samples were brought to the laboratory as early as possible and processed for microbiological assays. Eosin methylene blue (EMB) agar medium was used for the detection, isolation and enumeration of coliforms. Processing of the samples
Under aseptic conditions, each sample was diluted by thoroughly mixing 1 ml of a given food slurry in 9 ml of distilled water in sterile containers. Further serial dilutions were made similarly by mixing a previous dilution in sterile water. Then 0.1 ml of each dilution from each sample was spread on

82 F. SALEEM ET AL BIOLOGIA (PAKISTAN)
the EMB agar and all the plates were incubated at 37˚C for up to 24 hrs. Characterization of the bacterial colonies
After 24 hrs of incubation, the plates having 30 to 300 colonies were selected for estimating colony forming units (C.F.U.). Cultural characteristics i.e., elevation, margin, consistency and opacity of bacterial colonies were recorded. Isolation of acid resistant coliform bacteria
One ml of a given sample was suspended in 9 ml of sterile water with pH adjusted at 2, 3, and 4. After 30 minutes exposure to the acidic conditions, 0.1 ml of each dilution thus, treated sample was spread on EMB agar plates and incubated at 37˚C for 24 hrs. Pure culture of a representative bacterial colony from the original EMB plates was established by screening the growths through the nutrient agar and then re-cultivating the pure cultures on EMB agar plates. The slants were covered with sterile paraffin oil and stored at 4ºC for further analysis.
Antibiotic resistance / susceptibility Fresh culture of the bacterial isolates was
spread over the surface of the solidified nutrient agar. Then antibiotic sensitivity discs (Oxoid) were impregnated on the surface of the plates, which were subsequently incubated at 37oC for 24 hrs. The plates were then observed and diameters of growth inhibition zones were recorded. The antibiotics including streptomycin, erythromycin, lincomycin, rifampicin, nalidixic acid vancomycin, ceftriaxone and cephalexin were used in this study.
RESULTS AND DISCUSSION
Fruit chat sample contained coliform
contents upto 2900 C.F.U./ml of which 880 were identified as E.coli, 1180 as Salmonella / Shigella, while, 840 as Klebsiella. Dahi bhallay sample contained coliform contents of 6446 C.F.U./ml, of which 38390 were E. coli, 20900 were Salmonella / Shigella and 5170 were Klebsiella. The yogurt sample contained coliforms upto 6839 C.F.U./ml, of which 3880 represented Klebsiella sp. (Fig., 1).
Fig., 1: Prevalence of coliform bacteria in dahi
bhallay, fruit chat and yogurt samples. Acid resistant bacteria
The coliform bacterial contents of the food samples included E. coli, Salmonella, Shigella and Klebsiella. Some of these bacteria could resist highly acidic pH (upto 2). Acid tolerant bacteria could resist acidic pH of human stomach and thus cause various food related diseases. The isolates, in general, grew well in acidic pH, except the three strains 3D2, 4 F1 and 4F2 (Table 1). Overnight incubation at 37˚C on nutrient agar plates was permitted for pure cultures to record their colony morphologies. All the isolates made creamy color colonies, most of them had flat elevation, except the 2D2, 4D, 4Y1 and 2Y2 which showed raised colonies while, that of 2Y1were convex (Table 1).
Antibiotics resistance of the acid resistant isolates
Antibiotic sensitivity test was applied on the acid resistant coliform isolates. The resultant growth inhibition zones were measured on the plates around the antibiotic discs that represented the sensitivity of those strains to the particular antibiotic. Cell wall inhibiting antibiotics such as CRO 30 and CL 30 were appeared the most effective as mostly strains were sensitive to them (Table 2).

VOL. 60 (1) ACID AND ANTIBIOTIC RESISTANT COLIFORM BACTERIA 83
Table 1: Colony forming units (C.F.U.) of acid resistant coliforms (upto 4) /ml of dahi bhallay, fruit chat and yogurt samples and colonies’ morphologies of their pure cultures.
Sr. No.
Sample type
Strain code
C.F.U./ml Colony characteristics
Colour Configuration Elevation Margin Optical clarity
Surface
1.
Dhabi bhallay
2D1 517 Creamy Round with leading margin
Flat Branching Opaque Little shiny
2D2 1015 Creamy Round Raised Smooth Translucent Shiny
3D1 2704 Creamy Irregular with raised margin
Flat Irregular Translucent Dull
3D2 -- -- -- -- -- -- --
4D1 1135 Creamy Irregular with raised margin
Raised Smooth Translucent Dull
4D2 1075 Creamy Round with irregular margin
Flat Irregular Opaque Little shiny
2. Fruit chat
2F1 84 Creamy Irregular with raised margin
Flat Irregular Opaque Dull
2F2 108 Creamy Irregular with raised margin
Flat Lobate Translucent Little shiny
3F1 88 Creamy Round Flat Wavy Opaque Dull
3F2 10 Creamy Round Flat Smooth Translucent Little shiny
4F1 -- -- -- -- -- -- --
4F2 -- -- -- -- -- -- --
3. Yogurt 2Y1 466 Creamy Irregular and speeded
Convex Smooth Opaque Dull
2Y2 459 Creamy Round Raised Wavy Opaque Dull
3Y1 1394 Creamy Round with leading margin
Flat Smooth Opaque Dull
3Y2 816 Creamy Round Flat Smooth Translucent Little shiny
4Y1 2020 Creamy Round Raised Smooth Translucent Shiny
4Y2 1684 Creamy Round Flat Smooth Translucent Little shiny

84 F. SALEEM ET AL BIOLOGIA (PAKISTAN)
Table 2: Antibiotics resistance of acid resistant coliform bacterial isolates from dahi bhallay, fruit chat and yogurt samples.
Sr. No.
Sample type
Strain code
Growth inhibition zones (mm)
Protein inhibitor Nucleic acid inhibitor
Cell wall inhibitor
S 10 E 15
MY 10
NA 30 RD 5 VA 30
CRO 30
CL 30
1. Dahi bhallay
2D1 1.4 1.5 0.8 1.8 1.6 2.1 -- 0.8 2D2 -- -- -- -- -- -- -- -- 3D1 1.4 -- -- 1.9 1.2 1.9 0.6 1.4 4D1 2 1.6 -- 1.4 1.8 1.7 0.6 -- 4D2 1.7 1.5 -- 1.7 1.3 1.8 -- --
2. Fruit chat 2F1 1.4 1.3 -- 1.7 1.5 2 -- -- 2F2 1.4 1.5 0.8 1.7 1.5 2.2 -- 1.3 3F1 2 1.6 -- 1.5 1.3 1.7 -- -- 3F2 -- -- -- -- -- -- -- --
3. Yogurt 2Y1 0.6 2.3 1.3 1.3 0.9 1.4 -- -- 2Y2 0.7 1.4 1.7 0.8 0.9 1.4 -- -- 3Y1 1.9 1.2 -- -- 0.9 1.2 -- -- 3Y2 -- -- -- -- -- -- -- -- 4Y1 -- 1.9 0.6 1.5 1.4 1.6 0.6 0.7 4Y2 -- -- -- -- -- -- -- --
S 10, Streptomycin; E 15, Erythromycin; MY, Lincomycin; RD 5, Rifampicin; NA 30, Nalidixic acid; VA 30, Vancomycin; CRO 30, Ceftriaxone; CL 30, Cephalexin.
Eighty three percent of the coliform isolates
of this study appeared acid resistant. While, 46% were resistant to various antibiotics used in this study. These attributes indicated their anthropogenic source as well as involvement in the spread of enteric infections. E. coli, Klebsiella, Shigella, Salmonella and Enterobacter are diverse forms of coliform species and they were isolated from the samples of dahi bhallay, fruit chat and yogurt. Number of enteric infections is highly suspected in that part of population of our country, who is used to eat these foods routinely, which is extremely dangerous. Foods might get contaminated in the fields during handling, processing and marketing (Beuchat & Ryu, 1997; Beuchat, 2002; Ledenbach & Marshall, 2009). It has been shown that food contaminated with sewage water consists of disease causing bacteria, viruses, nematodes and protozoa (Bryan, 1998). Presence of bacterial pathogens that can be transmitted through poor handling and processing of yogurt, fruits and vegetables can be detected with high C.F.U./ml values of coliforms. Hazards Analyses Critical Count Points and Total Quality Management (HACCP-TQM) technical guidelines lay down the
microbial quality for raw food containing <104, 104 to 5×10⁶, 5×10⁶ to 5×10⁷ and ˃5×10⁷ C.F.U./g (aerobic plates count) are rated as good, average, poor and spoiled food, respectively. In this study quality of all the samples were regarded as average. HACCP-TQM technical guidelines also give threshold and quality levels for food borne disease hazards. For this, volunteer feeding test of healthy people for E. coli is referred. The estimated illness dose is 106 -1010 C.F.U. and the suggested level of E. coli for purchasing is 10 C.F.U./g. Hygienic conditions during the production, harvesting, transport and distribution of raw fruits and vegetables from some countries may not always meet minimum hygienic requirements, thus facilitating contamination on arrival in another country.
It is noticeable that coliform content of the sample worked out in this city was much higher than the permissible limits. As high the chances of any food of containing enteric pathogens high are the health risks for the consumers. Moreover, the remarkable resistance of the coliform isolates to antibiotics is strongly suggestive to speculate that many other potential pathogens might had been travelling along the foods. In order to minimize the

VOL. 60 (1) ACID AND ANTIBIOTIC RESISTANT COLIFORM BACTERIA 85
chances of food contamination, biologically treated and approved effluents having a coliform level of no more than 100/100 ml in 80% of the sample should be used, for irrigation of crops (Blumenthal, et al., 2000). Most probably sewage water is implicated as remarkably important source of pathogenic microorganisms contaminating the vegetables. It is strongly recommended that local public health authorities should take seriously implement appropriate regulations to control the enteric infections spread through such contaminated foods.
REFERENCES
Beuchat, L.R. & Ryu, J.H., 1997. Producing,
handling and processing practices: emerging infectious diseases transmitted by foods contamination by wastewater. J. Food Prot., 40: 45-56.
Beuchat, L.R., 1998. Surface decontamination of fruits and vegetables eaten raw: a review. Food Safety Unit, World Health Organization, Geneva.
Beuchat, L.R., 2002. Ecological factors influencing survival and growth of human pathogens on fruits and vegetables. Microbes Infect., 4(4): 413-423.
Blumenthal, U.J., Mara, D.D., Peasey, A., Ruiz-Palacios, G. & Stott, R., 2000. Guidelines fosr the microbiological quality of treated waste water used ion agriculture: recommendations for revising WHO guidelines. Bull. World Health Organ., 78(9): 1104-1116.
Bryan, F.L., 1998. Risks of practices, procedures and processes that leads to outbreaks of food borne diseases. J. Food .Prot., 51(8): 663-673.
Buck, J.W., Walcott R.R. & Beuchat, L.R., 2003. Recent trends in microbiological safety of fruits and vegetables. Online. Plant Health Progress. doi:10.1094/PHP-2003-0121-01-RV.
Elnawawi, F.A., Attala, O.A. & Saleh, S., 2012. Enteropathogens of public health importance in imported frozen meat and chicken. Intl. J. Microbiol. Res., 3(1): 59-63. doi: 10.5829/idosi.ijmr. 2012.3.1.62124
Gorden, J. & Small, P.L., 1993. Acid resistant in enteric bacteria. Infect. Immun., 61(1): 364-367.
Hussain, A., Ali, S., Shakir, H.A., Qazi, J.I., Ali, K. & Nadeemullah., 2013. Prevalence of Escherichia coli in milk and different milk products sold under market conditions at Lahore. J. Livestock Prod., 1(1): 11-15. doi: 10.14196/jlp.v1i1.67
Kumar, H., Sharma, D., Palaha, R., Sharma, P. & Sonkusale, S., 2011. Isolation of Escherichia Coli from indigenous sweet milk products in relation to public health sold at sweet-meat shops of Jalandhar city, India. Food Safety, 13: 332-335.
Kumar, M., Agarwal, D., Ghosh, M. & Ganguli, A., 2006. Microbiological safety of street vended fruit chats in Patiala city. Indian J. Medical Microbiol., 24(1): 75-76.
Ledenbach, L.H. & Marshall, R.T., 2009. Microbiological spoilage of dairy products. In: Compendium of the microbiological spoilage of foods and beverages, Food microbiology and food safety (eds. Sperber, W.H. & Doyle, M.P.), Springer, pp: 41-67.
Mensah, P., Yeboah-Manu, D., Owusu-Darko K. & Ablordey, A., 2002. Street foods in Accra, Ghana: how safe are they? Bull. World Health Organ., 80(7): 546-554.
Waterman, S.R. & Small, P., 1996. Identification of sigma S-dependent genes associated with the stationary phase acid resistance phenotype of Shigella flexneri. Mol. Microbial., 21(5): 925-940.

BIOLOGIA (PAKISTAN) 2014, 60 (1) 87-92 PKISSN 0006 – 3096 (Print) ISSN 2313 – 206X (On-Line)
*Corresponding author. [email protected]
Planktonic diversity in gut contents of Labeo rohita from Ravi, Pakistan reflecting urban loads on the river
HAFIZ ABDULLAH SHAKIR1, KIRAN SHAZADI2, *JAVED IQBAL QAZI3 & ALI HUSSAIN4
1,2,3,4Microbial Biotechnology Laboratory, Department of Zoology, University of the Punjab, Lahore-
ABSTRACT
Planktonic contents in the gut of Labeo rohita sampled from four localities (A=Lahore Siphon (upstream); B= Shahdera; C= Sunder; D= Balloki headworks) during post monsoon flow season of the river Ravi were determined to assess the effects of urbanization on the river biota. Nine specimens of comparable size ranges were sampled from each site. After dissection and morphometric measurements, weighed fish gut contents were saved in 10% formalin. Microscopic analysis of the gut contents revealed that both phytoplankton genus richness (10.62) as well as diversity (7.84) were maximum at upstream site A. Among phytoplanktons, Eudorina and Denticula indicated direct relationship with intensity of pollution as these genera were entirely absent at known highly polluted site C. However, the genera Anabaena, Euglena, Phacus and Chlymadomonas showed considerable tolerance and were present at all the sites. The site wise order of genus richness for zooplankton was A > B > C>D. While genus diversity order was site A > site B > site D > site C. Among the zooplankton, Cyclops and Diaptomus were almost absent at polluted sites and be of predictive value too for assessing the growth and their consumers. The present investigation reveals that select planktonic genera may serve as indicators of pollution in natural water bodies and provides an easier approach by recording genus richness as well as diversity as the fish navigate riverine environment and concentrate the planktonic organisms in the form of gut contents. Key words: Anthropogenic pressures, Plankton genus richness and diversity, Major carps, The Ravi, Urbanization.
_______________________________________________________________________________________
INTRODUCTION
Pollution of aquatic ecosystems is alarming in Pakistan and represents a fastly growing problem. Owing to the large quantities of domestic and industrial effluents discharged into water bodies, aquatic organisms particularly fish are suitable indicator for environmental pollution as they can accumulate pollutants directly from contaminated water and also through food. In fact plankton diversity and fluctuation are widely used as biological determinates of water quality in freshwater resources (Shubert, 1884; Hamed et al., 2013; Ling et al., 2013; Shakir et al., 2013b).
Planktonic organisms are important sources of primary and secondary producers and integral components of aquatic food webs. They have been studied from diverse freshwater ecosystems since long. Diversity, distribution and variation in the biotic parameters provide a good indication of energy turnover in aquatic environments (Forsberg, 1982; Choudhary & Singh, 2001; Sharma, 2012). However, there is limited information available regarding the diversity of phytoplankton from waterbodies in Pakistan (Baloch et al., 2008; Sulehria et al., 2009; Munir et al., 2012; Sulehria & Malik, 2012).
Maximum diversity of planktons is obtained
when the physico-chemical factors are at optimum levels (Sinha & Srivastava, 1991; Muhammad et al., 2005). Genus composition of planktonic community is an efficient bio-indicator for water quality (Peerapornpisal et al., 2004). Normally, it is found that any slight alteration in environmental status can change diversity until there is no adaptation or gene flow from non-adaptive sources. High diversity count informs a healthy ecosystem; the reverse of this suggests a degraded environment. Due to environmental stress, only a few organisms can be capable to survive and flourish (Ghosh et al., 2012). Natural water bodies get contaminated with pollutants due to discharges of industrial and municipal effluents in developing countries like Pakistan. The hazardous and untreated effluents going into the river Ravi from Lahore (second largest city of Pakistan) has been estimated up to 729 tons per day. According to another estimate, about 1308 tons of untreated solid waste is going into Ravi on daily basis (Yasar et al., 2010; Shakir & Qazi, 2013).
The aim of present study was to evaluate impact of industrial and municipal waste discharges on phytoplankton and zooplankton profiles in gut contents of Labeo rohita sampled from three polluted downstream site and compared with

88 H. A. SHAKIR ET AL BIOLOGIA (PAKISTAN)
respective data from a less polluted upstream location of the river Ravi. The planktonic diversity in the gut contents of Labeo rohita could be used as indicator of the pollution status of the water body. The planktonic frequencies were examined with reference to variations in genus diversity, genus richness and relative abundance.
MATERIALS AND METHODS
The selected part of the River Ravi, Pakistan which is contaminated by agricultural, industrial and municipal effluents of Lahore was used for sampling the fish from four localities; A (Lahore Siphon), B (Shahdera), C (Sunder) and D (Balloki headworks). The site A (31° 41′ N, 74° 25′ E) which had no urban and industrial effluents’ discharge was considered as control. The site B (31° 36′N, 74° 18′ E) receives domestic sewage discharges while site C (31° 21′N, 74° 3′E) is affected by both domestic and industrial discharges. At site D (31° 13′ N, 73° 52′ E), the river water carries mainly the pollutants received at sites B and C, however, it gets diluted by receiving flows from the Qadir Abad-Balloki (Q.B) Link Canal.
Nine specimens of comparable sizes of L. rohita were collected during high flow seasons (Sep. – Oct.) of the river Ravi. Details of the fish sampling and processing in a laboratory and morphometric measurements have been reported elsewhere (Shakir et al., 2013a; Shakir & Qazi, 2013). Soon after collection, the specimens were transported to the lab, dissected and their digestive tracts were removed and preserved in 10% formalin. Gut contents of each specimen were studied microscopically. Phyto as well as zooplanktons were identified by recognizing the samples organism’ microscopic morphologies with the microorganism up to generic level using 10X and 40X objectives of light microscope followed by Malik & Sulehria (2003 & 2004); Witty (2004) and Janse-Van-Vooren (2006). For qualitative analysis a 40X objective was used. Each morphological distinct category of planktons was enumerated with the help of Neubaeur haemocytometer. The numbers of plankton were then calibrated and expressed as number per gram (wet weight) of gut content.
Genus diversity (Ds) was calculated using Simpson diversity index after Wilham & Dorris (1968):
Where; N = total number of individuals.
ni = the number of individuals of each genus Ds = genus diversity in bits of information per individual.
The Simpson’s diversity index (Ds) indicates the diversity (as relative abundance of genus dependence function) and the unit is bit i.e., a particular numerical value. Genus richness (GR) was calculated according to Gleason (1992).
GR=N
Slog
1
Where; S = the number of genera representing a particular sample. N = the natural logarithm of the total number of individuals of all the genera within the sample. Statistical analysis
The data were statistically analyzed using general linear model to find the effect of site on frequency of planktons. The effects were declared highly significant if P<0.001, very significant if P<0.01 and significant if P<0.05. Tukey’s post-hoc test was used if there were more than two means to compare for their significant differences at P<0.05.
RESULTS AND DISCUSSION
The genus richness index (GR) is a
measure of the richness of planktonic genera with a linear correlation between the number of genera and the logarithm of the number of individuals. Gut content analyses of L. rohita revealed 23 genera of planktons including 15 genera of phytoplanktons. The latter genera belonging to four taxonomical divisions were chlorophyta (seven genera), bacillariophyta (four genera), euglenophyta (three genera) and myxophyta (one genus). Some genera appeared exclusivly at one sampling site. For example Synedra and Denticula was recorded only at site A, Haemotocoocus at C and Navicula and Cyclotella at site D. Gut contents of samples from site B showed similar genera as those found at site A except Synedra. Among chlorophyta, Characium and Eudorina were absent in gut content of fish specimen sampled at site C. Regarding the bacillariophyta, Euglena was most abundant but number of Trachelomonas was less. Bacillariophyta were entirely absent in gut contents sampled at site C (Table 1). The trend of changes in planktonic genera richness and diversity appeared responsive to the downstream locations and showed a decrease up to site C. The change stabilized more

VOL. 60 (1) PLANKTONIC DIVERSITY IN GUT CONTENTS OF FISH AND WATER POLLUTION 89
or less at site D and rather showed a recovery as compared to the values obtained for the samples at site C. Zooplanktons were represented by eight genera belonging to two phyla i.e., rotifera and crustacea. Each of which included four genera
(Table 2). All the genera of crustacea except Diaptomus were observable in samples from site B and D. While Polyphemus was the only genus found in gut contents of L. rohita sampled from all sites.
Table 1: Mean number of phytoplankton/gram of gut contents of Labeo rohita sampled from the river
Ravi.
Phylum Genus Sampling localities SEM and significance A B C D
Chlorophyta Ulotrix 37.56a 2.89b 10.67b 0.00 3.455*** Characium 98.33a 20.11b 0.00 12.89bc 4.332*** Oedogonium 44.78a 31.78ab 17.78bc 0.00 5.460*** Eudorina 53.56a 41.22a 0.00 0.00 3.526*** Chlaymadomonas 11.22b 9.89b 6.78b 189.0a 17.506*** Coelastrum 0.00 25.56a 19.22a 17.89a 4.270** Haemotocoocus 0.00 0.00 2.78a 0.00 0.772*
Bacillariophyta Synedra 38.44a 0.00 0.00 0.00 2.590*** Denticula 50.11a 25.78b 0.00 0.00 4.696*** Navicula 0.00 0.00 0.00 22.22a 2.192*** Cyclotella 0.00 0.00 0.00 28.78a 2.626***
Euglenophyta Euglena 149.44a 83.78b 13.56c 77.11b 4.325*** Phacus 90.44a 30.89b 15.00b 17.89b 4.620*** Trachelomonas 44.00a 15.67b 0.00 5.67bc 3.261***
Myxophyta Anabaena 28.00a 15.67a 17.22b 0.00 3.504*** Sampling localities: A, Siphon; B, Shahdera; C, Sunder; D, Balloki.
Means within the same row with the same letters did not differ significantly (P>0.05), here *, ** and *** represent significance at P<0.05, P<0.01 and P<0.001, respectively.
Table 2: Mean number of zooplankton/gram of gut contents of Labeo rohita sampled from different
localities of the river Ravi.
Phylum Genus Sampling localities SEM and
significance A B C D Crustacea Polyphemus 41.89a 25.11b 15.00b 24.44b 3.714***
Daphnia 39.78a 30.33ab 0.00 19.44b 4.919*** Diaptomus 20.11a 20.22a 0.00 0.00 4.196** Cyclops 16.33a 6.78b 0.00 3.56b 2.203***
Rotifera Keratella 47.78a 30.89b 0.00 8.00c 3.387*** Brachionus 39.67a 38.22a 8.44b 7.78b 4.218*** Mytilina 91.11a 80.89a 14.78b 15.00b 3.143*** Euchalanis 0.00 0.00 16.44b 41.22a 3.288*** Sampling localities: A, Siphon; B, Shahdera; C, Sunder; D, Balloki.
Means within the same row with the same letters did not differ significantly (P>0.05), here *, ** and *** represent significance at P<0.05, P<0.01 and P<0.001, respectively.
Among rotifers, Euclanis were not traced in
the gut contents of L. rohita sampled from the sites A and B. While Keratella was absent in samples of site C. The present results are in line with the finding of Ubaidullah (2003) that Eudorina showed direct relationships with intensity of pollution as these genera were almost absent in highly polluted
tributaries. However, Anabaena, Cyclotella, Euglena, Navicula, Phacus and Synedra showed considerable tolerance against heavy metals pollution. The metals concentrations were measured highest in water sampled from site C as compared to other studied sites (Table 4). For example, the mean Hg concentrations in water approached 0.12
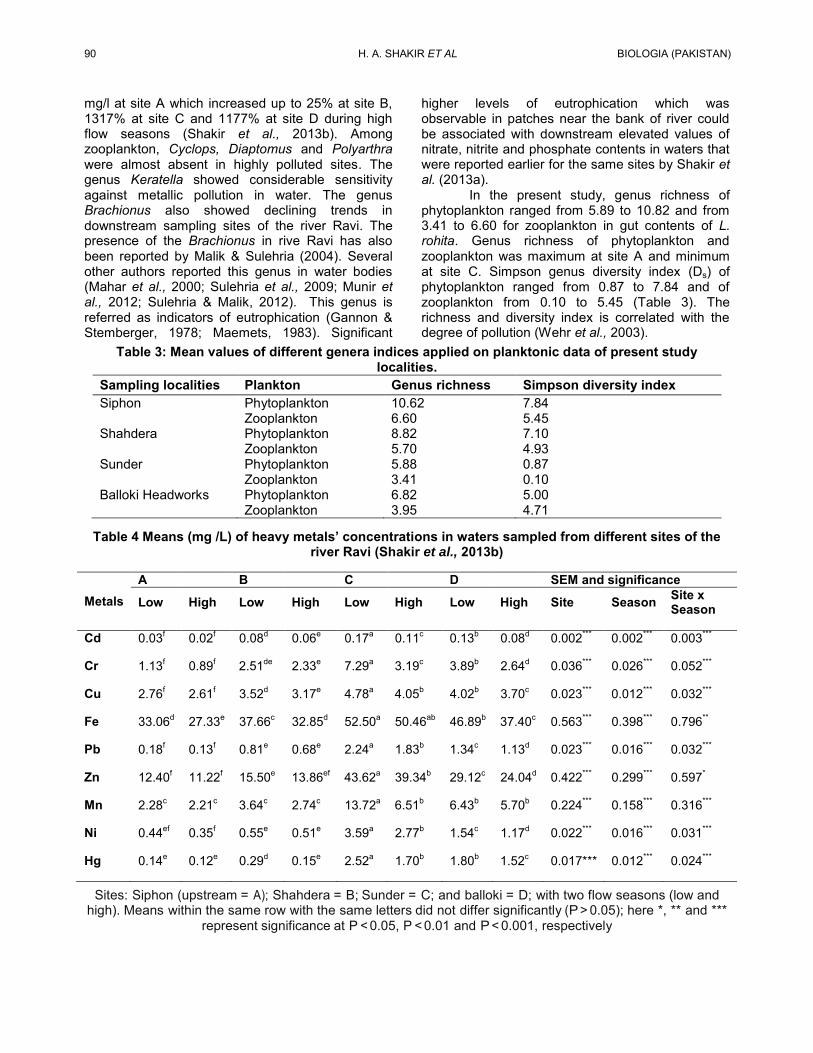
90 H. A. SHAKIR ET AL BIOLOGIA (PAKISTAN)
mg/l at site A which increased up to 25% at site B, 1317% at site C and 1177% at site D during high flow seasons (Shakir et al., 2013b). Among zooplankton, Cyclops, Diaptomus and Polyarthra were almost absent in highly polluted sites. The genus Keratella showed considerable sensitivity against metallic pollution in water. The genus Brachionus also showed declining trends in downstream sampling sites of the river Ravi. The presence of the Brachionus in rive Ravi has also been reported by Malik & Sulehria (2004). Several other authors reported this genus in water bodies (Mahar et al., 2000; Sulehria et al., 2009; Munir et al., 2012; Sulehria & Malik, 2012). This genus is referred as indicators of eutrophication (Gannon & Stemberger, 1978; Maemets, 1983). Significant
higher levels of eutrophication which was observable in patches near the bank of river could be associated with downstream elevated values of nitrate, nitrite and phosphate contents in waters that were reported earlier for the same sites by Shakir et al. (2013a).
In the present study, genus richness of phytoplankton ranged from 5.89 to 10.82 and from 3.41 to 6.60 for zooplankton in gut contents of L. rohita. Genus richness of phytoplankton and zooplankton was maximum at site A and minimum at site C. Simpson genus diversity index (Ds) of phytoplankton ranged from 0.87 to 7.84 and of zooplankton from 0.10 to 5.45 (Table 3). The richness and diversity index is correlated with the degree of pollution (Wehr et al., 2003).
Table 3: Mean values of different genera indices applied on planktonic data of present study localities.
Sampling localities Plankton Genus richness Simpson diversity index Siphon Phytoplankton 10.62 7.84 Zooplankton 6.60 5.45 Shahdera Phytoplankton 8.82 7.10 Zooplankton 5.70 4.93 Sunder Phytoplankton 5.88 0.87 Zooplankton 3.41 0.10 Balloki Headworks Phytoplankton 6.82 5.00 Zooplankton 3.95 4.71
Table 4 Means (mg /L) of heavy metals’ concentrations in waters sampled from different sites of the
river Ravi (Shakir et al., 2013b)
Metals A B C D SEM and significance
Low High Low High Low High Low High Site Season Site x Season
Cd 0.03f 0.02f 0.08d 0.06e 0.17a 0.11c 0.13b 0.08d 0.002*** 0.002*** 0.003***
Cr 1.13f 0.89f 2.51de 2.33e 7.29a 3.19c 3.89b 2.64d 0.036*** 0.026*** 0.052***
Cu 2.76f 2.61f 3.52d 3.17e 4.78a 4.05b 4.02b 3.70c 0.023*** 0.012*** 0.032***
Fe 33.06d 27.33e 37.66c 32.85d 52.50a 50.46ab 46.89b 37.40c 0.563*** 0.398*** 0.796**
Pb 0.18f 0.13f 0.81e 0.68e 2.24a 1.83b 1.34c 1.13d 0.023*** 0.016*** 0.032***
Zn 12.40f 11.22f 15.50e 13.86ef 43.62a 39.34b 29.12c 24.04d 0.422*** 0.299*** 0.597*
Mn 2.28c 2.21c 3.64c 2.74c 13.72a 6.51b 6.43b 5.70b 0.224*** 0.158*** 0.316***
Ni 0.44ef 0.35f 0.55e 0.51e 3.59a 2.77b 1.54c 1.17d 0.022*** 0.016*** 0.031***
Hg 0.14e 0.12e 0.29d 0.15e 2.52a 1.70b 1.80b 1.52c 0.017*** 0.012*** 0.024***
Sites: Siphon (upstream = A); Shahdera = B; Sunder = C; and balloki = D; with two flow seasons (low and high). Means within the same row with the same letters did not differ significantly (P > 0.05); here *, ** and ***
represent significance at P < 0.05, P < 0.01 and P < 0.001, respectively
VOL. 60 (1) PLANKTONIC DIVERSITY IN GUT CONTENTS OF FISH AND WATER POLLUTION 91
The highest total number of individuals and genera of both phytoplankton and zooplankton in the gut contents were registered at site A (upstream) while least scores were recorded at site C. Diversity indices are good indicators of pollution in aquatic ecosystem and the value of diversity index of community in less polluted waters will be higher (Ali et al., 2003). In the present study, values of richness and diversity indices showed that site A was less polluted followed by site B, D and C. This site wise pollution trend for the same sampling localities of the river Ravi was reported earlier by Shakir et al. (2013a). Water flow is also one of the major parameters controlling the plankton variations in running waters (Brown et al., 1989; Baranyi et al., 2002).
The studied specimens, Labeo rohita locally called Rohu is a water column feeder and feeds mainly on plankton. Due to change in planktonic diversity and richness, fish growth might be affected. Reduction in fish growth due to the aquatic pollution in river Ravi for the reported localities has earlier been reported by Shakir & Qazi (2013). Differentiated response of the different planktonic genera to the varying degrees of pollution discharge in terms of genus richness and diversity indices indicate their importance as indicator of water health and contamination(s) loads’ levels. As for example, the genus Polyphemus was found comparatively resistant to the present levels of the river pollution. While, the genera Characium and Eudorina were absent from the highly polluted site C but made their presence recordable at other less polluted localities.
REFERENCES
Ali, M., Salam, A., Jamshaid, S. & Zahra, T., 2003.
Studies on biodiversity in relation to seasonal variations in water of river Indus at Ghazi Ghatt, Pakistan. Pak. J. Bio. Sci., 21: 1840-1844.
Baloch, W.A., Soomro, A.N. & Buledi, G.H., 2008. Zooplankton, especially Rotifer and Cladoceran Communities of the spring and rainwater streams Nai) in Kirthar range, Sindh, Pakistan. Sindh Uni. Res. J., 40: 17-22.
Baranyi, C., Hein, T., Holarek, C., Keckeis, S. & Schiemer, F., 2002. Zooplankton biomass and community structure in a Danube River floodplain system: effects of hydrology. Fresh Water Biol., 47: 473-482.
Brown, A.V., Limbeck, R.L. & Schram, M.D., 1989. Trophic importance of zooplankton in streams with alluvial riffle and pool
geomorphometry. Arch. Hydrobiol., 114: 349-367.
Choudhary, S. & Singh, D.K., 2001. Phytoplankton population of Boosra Lake (Gaighat block, Muzaffarpur, Bihar). Environ. Ecol., 19: 171-174.
Forsberg, C., 1982. Limnological research can improve and reduce the cost of monitoring and control of water quality. Hydrobiol., 86: 143-146.
Gannon, J.E. & Stemberger, R.S., 1978. Zooplankton (especially crustaceans and rotifers) as indicator of water quality. Trans. Am. Micros. Soc., 97(1): 16-35.
Ghosh, S., Barinova, S. & Keshri, J.P., 2012. Diversity and seasonal variation of phytoplankton community in the Santragachi Lake, West Bengal, India. Q Sci. Conn., 3: 1-19.
Gleason, H.A., 1992. On the relation between species and area. Ecology, 3: 156-162.
Hamed, Y.A., Abdelmoneim, T.S., Elkiki, M.H., Hassan, M.A. & Berndtsson, R., 2013. Assessment of heavy metals pollution and microbial contamination in water, sediments and fish of Lake Manzala, Egypt. Life Sci. J., 10: 86-89.
Janse-Van-Vooren, S., Taylor, J. & Van-Ginkel, C., 2006. Easy identification of the most common freshwater algae. A guide for the identification of microscopic algae in South African freshwaters. Resource Quality Services (RQS), Private Bag X313, Pretoria 0001. ISBN 0-621-35471-6.
Ling, M.P., Wu, C.C., Yang, K.K. & Hsu, H.T., 2013. Differential accumulation of trace elements in ventral and dorsal muscle tissues in tilapia and milkfish with different feeding habits from the same cultured fishery pond. Ecotoxicol. Environ. Safety, 89: 222-230.
Maemets, A., 1983. Rotifers as indicators of lake types in Estonia. Hydrobiologia, 10: 357-361.
Mahar, M.A., Baloch, W.A. & Jafri, S.I.H., 2000. Diversity and seasonal occurrence of planktonic rotifers in Manchar Lake, Sindh, Pakistan. Pak. J. Fish., 1: 25-32.
Malik, M.A., & Sulehria, A.Q.K., 2003. Seasonal variation, density and diversity of planktonic rotifers in Jallo lake. Biologia (Pakistan), 49: 77-88.
Malik, M.A. & Sulehria, A.Q.K., 2004. Seasonal variation, density and diversity of planktonic rotifers in river Ravi. Biologia (Pakistan), 50: 5-17.
92 H. A. SHAKIR ET AL BIOLOGIA (PAKISTAN)
Muhammad, A., Abdus, S., Sumayya, I., Tasveer, Z.B. & Kamran, A.Q., 2005. Studies on monthly variations in biological and physico-chemical parameters of brackish water fish Pond, Muzaffar Garh, Bahauddin Zakariya University, Multan, Pakistan. Pak. J. Res. Sci., 16: 27-38.
Munir, M., Qureshi, R., Arshad, M., Chaudhry, A.K. & Larhari, M.K., 2012. Taxonomic study of Bacillariophyta from Kallar Kahar lake Chakwal, Punjab, Pakistan. Pak. J. Bot., 44: 1805-1814.
Peerapornpisal, Y., Chaiubol, C., Pekko, J., Kraibut, H., Chorum, M., Wannathong, P., Ngearnpat, N., Jusakul, K., Thammathiwat, A., Chuanunta, J. & Inthasotti, T., 2004. Monitoring of water quality in Ang Kaew reservoir of Chiang Mai University using phytoplankton as bioindicator from 1995-2002. Chiang Mai. J. Sci., 31: 85-94.
Shakir, H.A., Chaudhry, A.S. & Qazi, J.I., 2013a. Impact of anthropogenic activities on physico-chemical parameters of water and mineral uptake in Catla catla from river Ravi, Pakistan. Environ. Monit. Assess., 185: 2833-2842.
Shakir, H.A., Qazi, J.I. & Chaudhry, A.S., 2013b. Monitoring the impact of urban effluents on mineral contents of water and sediments of four sites of the river Ravi, Lahore, Environ. Monit. Assess., 185: 9705-9715.
Shakir, H.A. & Qazi, J.I., 2013. Impact of industrial and municipal discharges on growth coefficient and condition factor of major carps from Lahore stretch of Ravi. JAPS., 23: 167-173.
Sharma, B.K., 2012. Phytoplankton diversity of a floodplain lake of the Brahmaputra river basin of Assam, north-east India. Indian J. Fish., 59: 131-139.
Shubert, L.E., 1984. Algae as ecological indicators. Department of Biology, University of North Dakota, Grand Forks, USA.
Sinha, V.R.P. & Srivastava, H.C., 1991. Aquaculture Productivity. Oxford and IHB Publishing Co. Pvt. Ltd. New Delhi.
Sulehria, A.Q.K. & Malik, M.A., 2012. Population dynamics of planktonic rotifers in Balloki headworks. Pakistan J. Zool., 44(3): 663-669.
Sulehria, A.Q.K., Qamar, M.F., Anjum, R.F., Ijaz, M. & Hussain, A., 2009. Water quality and Rotifer diversity in the fish pond at district Mianwali, Pakistan. Biologia (Pakistan), 55: 79-86.
Ubaidullah, M., 2003. Studies on heavy metal toxicity of water, sediments, phytoplankton and fish in river Ravi stretch from Balloki headworks to Sidhnai barrage. Ph.D. thesis. University of Agriculture, Faisalabad, Pakistan.
Wehr, J.D. & Sheath, R.G., 2003. Freshwater algae of North America: Ecology and classification. Academic Press, USA.
Wilham, J.L. & Dorris, T.C., 1968. Biological parameters for water quality criteria. Bioscience, 18: 447-481.
Witty, L.M., 2004. Practical guide to identifying freshwater crustacean zooplankton. Cooperative Freshwater Ecology Unit. Department of Biology, Laurentian University, 935 Ramsey Lake Road, Sudbury, Ontario, Canada.
Yasar, A., Fawad, A., Fateha, A., Amna, I. & Zainab, R., 2010. River Ravi potentials, pollution and solutions: an overview. World Environment, 39: 39-40.

BIOLOGIA (PAKISTAN) 2014, 60 (1), 93-98 PKISSN 0006 – 3096 (Print) ISSN 2313 – 206X (On-Line)
*Corresponding author: [email protected]
Antimicrobial Activity of Honey on Bacteria Isolated from Diabetic’s Foot Wounds
NAZISH MAZHAR ALI, BUSHRA MAZHAR, SADIA HAYAT, ABDULLAH MAZHAR & HIRA SHAHZAD
Microbiology laboratory, Zoology Department, GCU Lahore
ABSTRACT
The present research work was carried out to find bacterial fauna of diabetic foot wound samples of
diabetic patients and to study the antibacterial activity of honey on these bacterial strains. The honey samples were collected from local sources and diabetic foot wound samples were collected from patients that were under treatment in Fatima Memorial Hospital, Lahore. Five honey samples were used to study the antimicrobial activity against bacteria that were isolated from diabetic foot wounds. Five bacterial strains isolated from wound samples were identified as E. coli, Staphylococcus sp. and Pseudomonas sp. All the bacteria identified were pathogenic because they showed hemolysis on blood agar. Staphylococcus sp. (SH3) showed maximum resistance against honey samples. The antibiotic resistance and heavy metal resistance were also studied. The Pseudomonas sp. (SH4) showed more resistance against antibiotics teicoptanin, carbenicillin, amoxicillin and ampicillin and showed sensitivity against polymyxin and zone of inhibition was 2mm. The E. coli (SH1) showed maximum resistance against heavy metals and Staphylococcus spp. (SH3 & SH5) showed minimum resistance against heavy metals. Key words: Honey, Bacterial pathogens, Antibiotic resistance, Antibacterial action
____________________________________________________________________________________
INTRODUCTION
Honey is a sweet food. Honey bees prepare honey by using nectar from flowers of different plants. Honey bees belong to genus Apis. Different varieties of honey are produced by different species of honey bees and these are collected by bee keepers. It is consumed by humans. Some people prefer honey over sugar and other sweeteners (Tonelli et al., 1990). Honey is sugar rich compound having the following constituents as glucose 38.19%, fructose 21.28%, maltose and other sugars 8.81%, enzymes and pigments 2.21%, ash 1.0% and water 17.20% (Finlay et al., 2003).. Honey has low water content due to which most of the microorganisms do not grow in honey. In 1892, Van Ketel first recognized the antibacterial property of honey (Dustmann, 1979). Its antibacterial activity is only due to osmotic effect of its high sugar content. But when it is used to repair wound or to control infection, it causes reduction in osmolarity. A well-known antimicrobial agent hydrogen peroxide is present, in small concentration, in honey (Puritt & Reiter, 1985). Antibacterial activity of honey is dependent on amount of hydrogen peroxide (Molan & Allen, 1996). Honey is acidic and pH lies between 3.2 to 4.5 which inhibits the growth of a number of pathogens. But some wound infecting species are able to grow at this pH range, such as E. coli, Salmonella sp. and Pseudomonas sp.
Microorganisms that are found in honey are very low in numbers. Botulinum endospores are naturally present in honey. Honey should not be given to the children under one year of age because their digestive system is not well developed and they are not able to destroy the spores (Snowdon & Cliver, 1996). Bacillus circulans is another species that is present in honey and produces lipases in honey (Elwan et al., 1983; Nasir et al., 2010).
Wounds are common injuries that are produced due to different reasons e.g., accidents and road traffic (Armstrong & Athanasius, 1998). A wound is type of physical injury in which the skin is torn, cut or punctured and injured and which cause damage in the dermis of the skin (Bakker, 1998). In present study, antibacterial effect of honey on wound of diabetic person was studied.
MATERIALS AND METHODS Sample Collection
The honey samples were collected from local sources. These were collected in screwed capped bottles and stored in laboratory. The wound samples were collected from patients, which were under treatment in surgical ward of Fatima Memorial Hospital Lahore. The samples were taken from diabetic’s foot wound with the help of cotton swabs (Benson, 2002). The samples were immediately put in screw capped bottles containing transport medium.

94 N. M. ALI ET AL BIOLOGIA (PAKISTAN)
Transport Medium For transport of wound samples from hospital to laboratory, Amies Transport Medium was used (Effem, 1988). This transport medium is used to avoid loss of bacterial strain during transfer of samples from hospital to laboratory as it takes at least 2-3 hours. Culture Media Nutrient agar media was used to check the primary growth of bacterial strain (Prasad, 2000). 100ml of distilled water was taken in a flask and 2.3g nutrient agar was mixed in it. A cotton plug was placed on flask mouth and wrapped with aluminum foil. Then the media was sterilized in autoclave at 121˚C for 15-20 minutes using 15lb pressure. Procedure Honey was diluted in autoclaved distilled water (20 minutes at 121˚C in capped bottles). In Laminar Air Flow Cabinet 1ml of each honey sample was poured in different petriplates. Then 20ml of medium was poured in each petriplate. The petriplates were then rotated clockwise and anti-clockwise on the smooth surface of Laminar Air Flow to mix the honey and medium. After the medium solidified the wound samples were spread on the petriplates. The petriplates were then incubated for 24 hours at 37˚C. Colonies developed after overnight incubation. Next day the growth was observed. The colonies were again streaked with increasing concentration of each honey sample. The process was repeated until the minimum inhibitory concentration (MIC) for each honey sample was determined (Benson, 2002). Characterization of Bacterial Isolates Morphological Tests For morphological characterization Gram's staining, Endo-spore staining and Acid fast staining were performed. Biochemical Tests Biochemical tests were performed to identify the unknown aerobic and anaerobic bacteria that were isolated from wound samples. Following biochemical tests were performed: catalase test, urease test, hydrogen sulphide production test, gelatin hydrolysis test, MRVP test, carbohydrate fermentation test, litmus milk test, triple sugar iron test, citrate test, oxidase test, indole test, MacConkey agar test and blood agar test. Antibiotic Resistance of Isolates 5 nutrient agar plates were prepared and then the bacterial isolates were spread on these with the help of spreader. Different antibiotic discs were then placed at different regions on the plate with the help of sterilized forceps. The antibiotics
used were Teicoplanin (Tec 30ug), Polymyxin B (PB 300 units), Carbenicillin (CAR 100ug), Amoxycillin (AMC 30ug) and Ampicillin (AMP 10ug). The plates were then incubated for 24 hours at 37ºC. Sensitivity of isolates was shown by the clear area around the antibiotic disc and resistance was shown by the presence of growth around antibiotic disc. Ruler was used to measure the zone of inhibition. The antibiotic Teicoplanin (Tec 30ug) showed maximum effect on bacterial strains. While Ampicillin (AMP 10UG) showed minimum effect on strains. Heavy Metal Resistance The ability of wound bacteria to resist heavy metals such as Zinc, Ferrous, Copper, Nickel and mercury was also checked. The stock solutions of salts of these metals were prepared, filtered and sterilized. The bacterial isolates were then streaked on nutrient agar plates containing 10-100ug of these metals. The plates were incubated for 24 hours at 37˚C. Next day the growth was observed. The colonies were again streaked with increasing concentration of each metal. The process was continued until the minimum inhibitory concentration (MIC) for every metal was determined. Growth on Selective and Differential Media To identify the genera of isolated bacteria Pseudomonas selective medium, EMB agar medium and Staphylococcus selective medium were used.
RESULTS
In the present study effects of honey were seen on different bacterial species that were isolated from diabetic’s foot wound sample. The bacteria that were isolated from foot wound were later identified as Pseudomonas sp, E. coli, and Staphylococcus sp. Bacterial Strain 1 (SH1) SH1 was isolated from diabetic foot wound sample. This bacterial strain was identified as E. coli (Table 2). It is a Gram’s negative short rod bacteria. It causes diseases especially in children. It enters the body through gut and cause diarrhoea. It is catalase and indole positive (Table 3). On EMB agar it showed greenish pink growth. The antibacterial resistance of strain SH1 was observed by using 5 different honey samples. E. coli showed minimum resistance against honey sample 2 and 4 and showed maximum resistance against honey sample 1 (Table 1). Then antibiotic resistance of strain SH1 was observed. It showed maximum resistance against Carbenicillin, Amoxycillin and Ampicillin and showed maximum sensitivity against teicoptanin and zone of inhibition is 8.5mm (Table 4). Then

VOL. 60 (1) ANTIMICROBIAL ACTIVITY OF HONEY 95
heavy metal resistance was also observed and it showed maximum resistance against Zn2+ and Fe2+ and showed minimum resistance against Hg2+, Cu2+ and Ni2+ (Table 5). Bacterial Strain 2 (SH2) SH2 isolated from diabetic foot wound sample was identified as Staphylococcus sp. (Table 2). It is Gram’s positive cocci. It is citrate and indol positive (Table3). It is common disease causing bacteria. Every human once in life is infected certainly with the staphylococcus causing minor or major infection. Then checked the antibacterial activity of SH2. It showed minimum resistance against honey sample 1 and showed maximum resistance against honey sample 5 (Table 1). Then antibiotic resistance of strain SH2 was observed. It showed maximum resistance against Carbenicillin and Ampicillin and showed minimum sensitivity against Polymyxin and zone of inhibition was 2.5mm and maximum sensitivity against teicoptanin and zone of inhibition was 8.75mm (Table 4). Then heavy metal resistance was also observed and it showed maximum resistance against Zn2+ and showed minimum resistance against Hg2+, Cu2+ and Ni2+ (Table 5).
Tabl
e 1:
Ant
ibac
teria
l act
ivity
of h
oney
(in
ml)
agai
nst b
acte
rial
isol
ates
SAM
PLE
5 (m
l) 2 2 1 1 2
ml =
milli
lite
r
SAM
PLE
4 (m
l) 1 1.5
1.5
1.5 2
SAM
PLE
3 (m
l) 1.5
1.5 2 2 1.5
SAM
PLE
2 (m
l) 1 1 2 1 1.5
SAM
PLE
1 (m
l) 2 1 1.5 1 2
BA
CTE
RIA
L ST
RA
IN
E. c
oli
Sta
phyl
ococ
cus
sp.
Sta
phyl
ococ
cus
sp.
Pse
udom
onas
Sta
phyl
ococ
cus
sp.
Bacterial Strain 3 (SH3) SH3 was isolated from diabetic’s foot wound sample. This bacterial strain was identified
as Staphylococcus sp (Table 2). It is Gram’s positive cocci. It is citrate, urease and indole positive (Table3). It is common disease causing bacteria. It showed minimum resistance against honey sample 5 and showed maximum resistance against honey sample 2 and 3 (Table 1). Then antibiotic resistance of strain SH3 was observed. It showed maximum resistance against Carbenicillin, Amoxycillin and Ampicillin and showed minimum sensitivity against Polymyxin and zone of inhibition was 1.5mm and maximum sensitivity against Teicoptanin and zone of inhibition was 7.5mm (Table 4). Then heavy metal resistance was also observed and it showed resistance against Zn2+, Fe2+, Hg2+, Cu2+ and Ni2+ (Table 5).
Tabl
e 2:
Phy
sica
l cha
ract
eris
tics
of b
acte
ria is
olat
ed fr
om
diab
etic
’s fo
ot w
ound
sam
ples
GEN
US
IDEN
TIFI
ED
E. c
oli
Sta
phyl
ococ
cus
sp
Sta
phyl
ococ
cus
sp
Pse
udom
onas
sp
Sta
phyl
ococ
cus
sp
AC
ID
FAST
ST
AIN
ING
VE
VE
VE
VE
VE
END
OSP
OR
E ST
AIN
ING
VE
VE
VE
VE
VE
GR
AM
’S
STA
ING
IN
G VE
VE
VE
VE
VE
STR
AIN
SH1
SH2
SH3
SH4
SH5
Bacterial Strain 4 (SH4) SH4 was isolated from diabetic foot wound sample. This bacterial strain was identified as Pseudomonas sp (Table 2). It is Gram’s negative rod. It is citrate and indol positive (Table3). Then checked the antibacterial activity of SH4. It showed minimum resistance against honey sample 1, 2 and 5 and showed maximum resistance against honey sample 3 (Table 1). Then antibiotic resistance of strain SH4 was observed. It showed maximum resistance against Teicoptanin, Carbenicillin, Amoxycillin and Ampicillin and showed sensitivity

96 N. M. ALI ET AL BIOLOGIA (PAKISTAN)
against Polymyxin and zone of inhibition was 2mm (Table 4). Then heavy metal resistance was also observed and it showed maximum resistance against Fe2+ and showed minimum resistance against Hg2+, Zn2+, Cu2+ and Ni2+ (Table 5).
Bacterial Strain 5 (SH5) SH5 was isolated from diabetic foot wound sample. This bacterial strain was identified as Staphylococcus sp (Table 2). It is Gram’s positive cocci. It is citrate, urease and indol positive (Table3). It is common disease causing bacteria. It
showed minimum resistance against honey sample 2 and 3 and showed maximum resistance against honey sample 1, 4 and 5 (Table 1). Then antibiotic resistance of strain SH5 was observed. It showed maximum resistance against Carbenicillin and Ampicillin and showed minimum sensitivity against Polymyxin and zone of inhibition was 1.25mm and maximum sensitivity against Teicoptanin and zone of inhibition was 8.75mm (Table 4). Then heavy metal resistance was also observed and it showed resistance against Zn2+, Fe2+, Hg2+, Cu2+ and Ni2+ (Table 5).
Table 3: Physical characteristics of bacterial isolates.
TEST SH1 SH2 SH3 SH4 SH5
INDOLE +VE +VE +VE +VE +VE
LITMUS MILK Acidic+ Coagulation
Acidic+ Coagulation
Acidic+ Coagulation
Acidic+ Coagulation
Acidic+ Coagulation
CARBOHYDRATE
FERMENTATION
+VE +VE -VE +VE +VE
UREASE -VE +VE +VE +VE -VE OXIDASE -VE -VE -VE -VE -VE
MR +VE -VE +VE +VE -VE VP +VE -VE -VE -VE +VE
GELATIN HYDROLYSIS
+VE +VE +VE +VE +VE
HYDROGEN SULPHIDE
-VE +VE +VE -VE -VE
CITRATE +VE +VE +VE +VE +VE EMB AGAR +VE -VE -VE -VE -VE CATALASE -VE +VE +VE +VE +VE
BLOOD AGAR -VE -VE -VE -VE -VE PSEUDOMON
AS
-VE -VE -VE +VE -VE
TSI +VE +VE +VE +VE +VE MAC-CONKEY
AGAR -VE -VE -VE -VE -VE
STAPHYLOCO
CCUS
-VE +VE +VE -VE +VE

VOL. 60 (1) ANTIMICROBIAL ACTIVITY OF HONEY 97
Tabl
e 4:
Ant
ibio
tics
resi
stan
ce o
f iso
late
d ba
cter
ial s
trai
ns a
gain
st d
iffer
ent a
ntib
iotic
s.
STR
AIN
TEIC
OPT
AN
INTE
C (3
0µg)
(mm
)
POLY
MYX
INPB
(300
µg)
(mm
)
CA
RB
ENIC
ILLI
NC
AR
(100
µg)
(mm
)
AM
OXY
CIL
LIN
AM
C (3
0µg)
(m
m)
AM
PIC
ILLI
NEA
MP
(10µ
g)
(mm
)
mm
= m
illi m
eter
, S=
sens
itive
, R=
resi
stan
t
SH1
S (8
.5)
S (2
.5)
R (0
)
R (0
)
R (0
)
SH2
S (8
.75)
S (1
.5)
R (0
)
S (1
.75)
R (0
)
SH3
S (7
.5)
S (2
)
R (0
)
R (0
)
R (0
)
SH4
R (0
)
S (2
)
R (0
)
R (0
)
R (0
)
SH5
S (8
.75)
S (1
.25)
R (0
)
S (1
.75)
R (0
)
Tabl
e 5:
Hea
vy m
etal
resi
stan
ce o
f bac
teria
l iso
late
s.
ST
RA
IN
TEIC
OPT
AN
INTE
C (3
0µg)
(m
m)
POLY
MYX
INPB
(300
µg)
(mm
)
CA
RB
ENIC
ILLI
NC
AR
(100
µg)
(mm
)
AM
OXY
CIL
LIN
AM
C (3
0µg)
(m
m)
AM
PIC
ILLI
NEA
MP
(10µ
g)
(mm
)
µg =
mic
ro g
ram
SH1
S (8
.5)
S (2
.5)
R (0
)
R (0
)
R (0
)
SH2
S (8
.75)
S (1
.5)
R (0
)
S (1
.75)
R (0
)
SH3
S (7
.5)
S (2
)
R (0
)
R (0
)
R (0
)
SH4
R (0
)
S (2
)
R (0
)
R (0
)
R (0
)
SH5
S (8
.75)
S (1
.25)
R (0
)
S (1
.75)
R (0
)
DISCUSSION
In the present work the antibacterial activity of honey samples against pathogenic bacteria isolated from diabetic’s foot wound was observed. Honey has been known since ancient times for its antimicrobial properties. The main antimicrobial agent in honey is hydrogen peroxide. In one of the experiments, it was shown that when honey leather was regularly chewed by patients of gingivitis it caused a decrease in inflammation of gums. When honey was taken orally it might have a slight laxative effect and also increased the body's ability to metabolize alcohol, thereby limiting intoxication and more rapidly reducing blood alcohol levels. Honey also improved cholesterol level and blood

98 N. M. ALI ET AL BIOLOGIA (PAKISTAN)
sugar levels. Consumption of honey can reduce symptoms of hay fever (Shenoy et al., 2012).
A small study of 40 patients suggested that topical use of honey may help prevent development of oral mucositis (painful inflammation of mucus membranes in the mouth) in patients having radio chemotherapy for head and neck cancer. When used topically to treat burns, honey is generally applied either directly to the wound in a thin coat, or in the form of a honey-soaked dressing. Oral dosages of honey for medicinal purposes range from 1 to 5 tablespoons several times daily. As a widely consumed food, honey is believed to be quite safe. However, infants younger than 12 months should not consume honey, due to the risk of infant botulism because their digestive system is not well developed. Honey may contain small amount of pollen. However, it appears that allergy to honey is uncommon among pollen-allergic people (Kiistala et al., 1996).
Pathogenic bacteria isolated and were biochemically identified as E. coli, Staphylococcus sp. and Pseudomonas sp. Minimum inhibitory concentration (MIC) method was used to check the antibacterial activity of honey (Table 1). Minimum MIC value was 1ml while maximum value was 2ml. All honey samples showed antibacterial activity against pathogenic bacteria. Molan (1996) reported in earlier research that honey can accelerate many diseases healing and also had bactericidal properties. Some of these bacterial isolates were antibiotic resistant (Table 4). This is why in recent times the significance of honey in medical treatments has been renounced and it is being widely used as a topical antibacterial agent for treatment of wounds, burns and skin ulcers (McInerney, 1990; Molan, 2001). So, it was observed that honey is a natural product which has antibacterial activity with no harmful side effects.
REFERENCES
Armstrong, D.G. & Athanasius, 1998. The edge
effect: how and why wounds grow in size and depth. Clin. Podiatr. Med. Surg., 15: 105-108.
Bakker, D.J., 1998. Severe trauma and infectious. Anaethesia., 53: 65-67.
Benson, H.J., 2002. Microbiology Applications. 8th
ed. Mc- Graw Hill, New York. pp: Dustmann, J. H., 1979. Antibacterial effect of
honey. Apiacta, 14(1): 7-11.
Effem, S.E., 1988. Clinical observations on the wound healing properties of honey. Br. J. Surg., 75: 679-681.
Elwan, S.H., Hoseiny, M.M., Ammar, M.S. & Mustafa, M.A., 1983. Lipase production by Bacillus circulans under mesophilic and osmophilic conditions, Factors effecting lipase production. Bacteriol Virol Immunol., 76(7-12): 17-18.
Finlay, J., Miller, L. & Poupard, J.A., 2003. A review of antimicrobial activity of clavulanate. J. Antimicrob chemother., 52: 18-23.
Kiistala, R., Hannuksela, M. & Kiljunen, N., 1996. Honey allergy is rare in patients sensitive to pollens. Allergy., 50: 831-835.
McInerney, R. J., 1990. Honey - a Remedy Rediscovered. J Royal Soc Med., 83: 127-130.
Molan, P.C., 1996. Honey for the treatment of infection. Bee-Informed., 3: 6-7.
Molan, P.C., 2001. Potential of honey in the treatment of wounds and burns. American J Clin Dermatol., 2: 13-16.
Molan, P.C. & Allen K.L., 1996. The effect of gamma radiation on the antimicrobial activity of honey. J. Pharm. Sci., 48(11): 1206-1209.
Nasir N. A., Halim, A. S., Singh, K. K., Dorai, A. A. & Haneef, M. N., 2010. Antibacterial properties of tualang honey and its effect in burn wound management: a comparative study. BMC Complement Altern Med., 10:31.
Prasad, S.N., 2000. Applied Microbiology. 1st ed. Campus Books International. pp: 467-470.
Puritt, K.M. & Reiter, B., 1985. Biochemistry of peroxide system: antimicrobial effects. New York: Marcel Dekker. pp: 144-178.
Shenoy, V.P., Shivananda, P.G. and Bairy, I., 2012. Honey as an Antimicrobial Agent Against Pseudomonas Aeruginosa Isolated from Infected Wounds. J Glob Infect Dis., 4(2): 102–105.
Snowdon, J.A. & Cliver, D.O., 1996. Review article: Microorganisms in honey, Int. J. Food Microbiol., 31: 1–26.
Tonelli, D., Gattavecchia, E., Ghini, S., Porrini, C., Celli, G. & Mercuri, A.M., 1990. Honey bees and their products as indicators of environmental radioactive pollution. J. Radioanal. Nucl. Chem., 141(2): 427-436.

BIOLOGIA (PAKISTAN) 2014, 60 (1), 99-102 PKISSN 0006 – 3096 (Print) ISSN 2313 – 206X (On-Line)
*Corresponding author: address: [email protected]
Human health hazards caused by heavy metals accumulation in wheat Variety “Sehar-2006” irrigated with domestic sewage water
*HAZOOR AHMAD SHAD1, ZAFAR IQBAL KHAN2, KAFEEL AHMAD2, YASAR RIZWAN 2
& HAFIZ MUHAMMAD TAHIR2
1Department of Chemistry, University of Sargodha, Pakistan
2Department of Biological Sciences, University of Sargodha, Pakistan
ABSTRACT
An experimental study was carried out to investigate the effect of heavy metals (lithium, sodium, potassium, magnesium, calcium, molybdenum, cobalt, arsenic and selenium) present in domestic sewage water on a wheat variety “Sehar-2006”. Seeds of Sehar-2006 were sown at the end of November, 2011 and irrigated with domestic sewage water. Five control pots treated with canal water were also established for comparing the results with experimental pots. Obtained results were compared with the upper permissible limit for any possible threat to human health. Results of the present study showed that arsenic concentration in soil was affected significantly by sewage water. Sewage water also affected the levels of Na and K significantly in the plants shoots and Na and Mg in grains. Sewage water significantly affected the values of transfer factor from soil to shoots for Na, K, Mg, Ca As and Se. We concluded that the untreated domestic sewage water may cause heavy metal toxicity in humans if the food crops are grown in it. Keywords: Heavy metals: domestic sewage water: Sehar-2006: Maximum tolerable limits.
_______________________________________________________________________________________
INTRODUCTION
Although sewage water contains lot of potentially harmful substances that may cause various diseases in humans or in animals but it is being used for irrigation in many parts of the world. The ingredients present in wastewater affect the nature of soil and growth of various plants (Al-Yemeni et al., 2011). Waste water especially from industries contains heavy metals that can persist in an ecosystem for longer time due to their long half-life. There are many diseases which are caused, either through mineral deficiencies or with heavy metal toxicity found in foods grown in such waste water (Ahmad et al., 2008; Al-Yemeni et al., 2011).
Requirement of various minerals in the animal body may range from very large to trace amount for the proper and healthy growth. Batra & Seth (2002) have studied that the deficiency of any micronutrient may cause a major health problem in many areas of world especially in developing countries. To assess the dietary intake and adequacy of minerals, collection of detailed and comprehensive information about various elements in foods, diets and water is necessary (Rao & Rao, 1981; Simsek & Aykut, 2007). In the present study we investigated the effect of short term use of sewage water on the heavy metal accumulation in wheat variety “Sahar-2006”. This study will be
helpful for analyzing the possible threat (if any) to human beings consuming this specific wheat crop.
MATERIALS AND METHODS
Present study was conducted at
Department of Biological Sciences, University of Sargodha, Sargodha. For the study, seeds of wheat variety “Sahar-2006” were grown at the end of November, 2011 in plastic pots (15 cm in height and 20 cm in diameter). About 2.5 kg of soil, sieved through a 4 mm sieve, was added into each pot. The experimental pots were irrigated with domestic sewage water, taken from sewage waste pipe/nulla along Faisalabad road, 1.5 Km from the University of Sargodha, Pakistan while control pots with the canal water. Harvesting was done at the end of April, 2012. We collected the shoot samples of plants before harvesting. After harvesting, the seed samples were taken out from each pot. Soil samples were taken out from each pot at the depth of 5cm. The grains samples from each pot were separated from husks and ground in a domestic grinder to obtain a wheat grain powder. Plant and seed samples were washed with distilled water and then with dilute HCl to remove dust particles and other impurities. The samples were dried in open air and then placed in oven at 105 0C for 4 days to get completely dried samples. After 4 days, samples were removed from oven and digested by “wet digestion method”.

100 H. A. SHAD ET AL BIOLOGIA (PAKISTAN)
Detection of metal concentrations Atomic Absorption Spectrophotometer
(AAS) was used to analyze the concentration of lithium, calcium, magnesium, potassium and sodium. However, the concentrations of molybdenum and cobalt were determined using Graphite Furnace Atomic Absorption Spectrophotometer. Selenium was analyzed by the fluorometric method while the concentration of arsenic was determined by AAS-GF-HG (Perkin Elmer). A calibration curve for each metal was constructed by preparing several concentrations of metals from a standard stock solution of 1,000 mg l−1. Statistical Analyses
Before analyzing the data, the normality of the data was assessed. Non-parametric tests we applied on the data if it deviated from normal distribution. Mann-Whiteney U test was used to compare the concentration of different heavy metal between control and experimental plants. SPSS software was used to analyze the data. Transfer factor is used to find out the concentration of metals which is accumulated in an organism through food
chain. This factor is used to detect the transfer of metal from growing media to plant and then in animals. Transfer factor was calculated by using following formulas;
RESULTS
Results of the present study showed that arsenic concentrations in soil were affected significantly by sewage water (Table 1). However, sewage water affected the levels of Na and K significantly in the plants shoots (Table 2) and Na and Mg in grains (Table 3). Sewage water treatment significantly affected the values of Transfer factor from soil to shoots for Na, K, Mg, Ca, As and Se (Table 4). Similarly significant difference in the values of Transfer factor from shoots to grain was observed for K, Mg, Co and As (Table 5).
Table 1: Mean heavy metal concentrations (mg/kg) in soil during canal and sewage water treatments.
Treatment Li Na K Mg Ca Mo Co As Se
Canal water 28.5 562.53 703 105.23 703.66 8.5 5.23 7.17 2.23 Sewage water 28.53 626.33 726 105.6 746.66 7.46 5.33 9.92 2.33
Significance NS S* NS NS NS NS NS S* NS Note: NS = Non –significant difference, S* = significant difference
Table 2: Mean heavy metal concentrations (mg/kg) in wheat shoot during canal and sewage water
treatments.
Treatment Li Na K Mg Ca Mo Co As Se
Canal water 2.82 0.04 0.6 0.09 0.23 7.68 0.13 1.78 0.32 Sewage water 2.81 0.08 0.81 0.11 0.34 7.27 0.2 1.82 0.54 Significance NS S* S* NS NS NS NS NS NS
Table 3: Mean heavy metal concentrations (mg/kg) in wheat grains during canal and sewage water
treatments.
Treatment Li Na K Mg Ca Mo Co As Se
Canal water 2.66 0.05 0.71 0.08 0.24 7.51 0.23 1.53 0.33 Sewage water 2.65 0.08 0.8 0.14 0.37 6.23 0.15 1.88 0.55 Significance NS S* NS S* NS NS NS NS NS
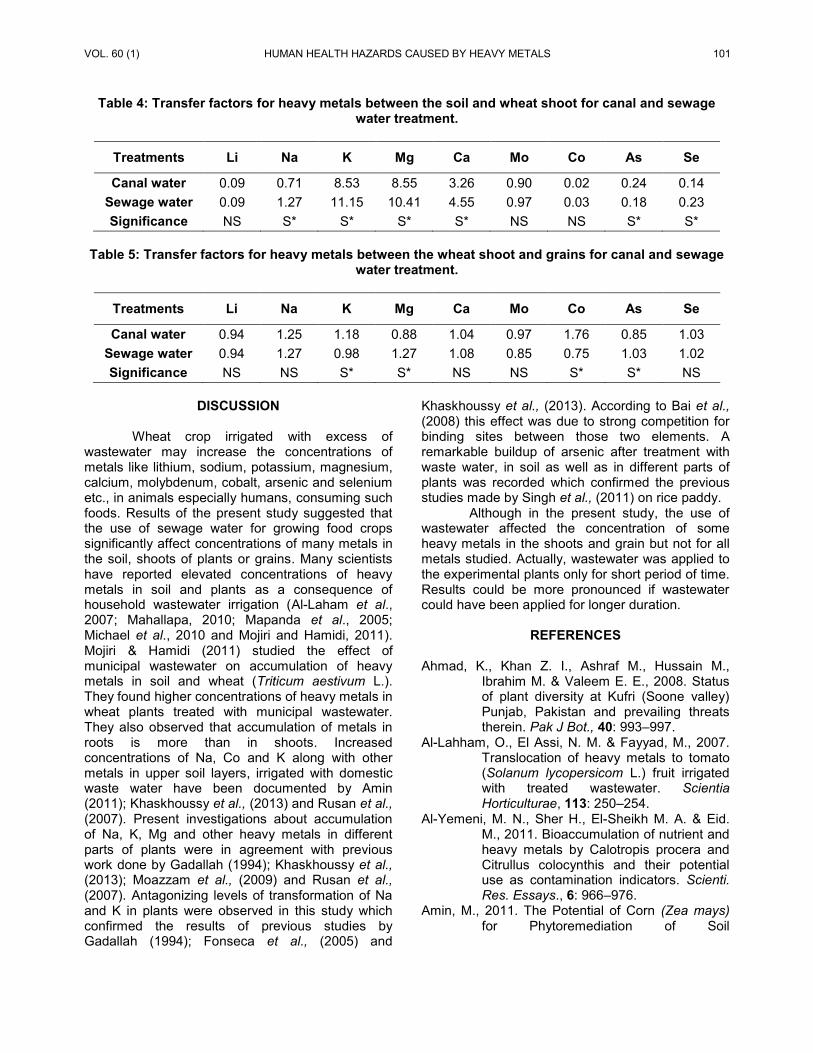
VOL. 60 (1) HUMAN HEALTH HAZARDS CAUSED BY HEAVY METALS 101
Table 4: Transfer factors for heavy metals between the soil and wheat shoot for canal and sewage water treatment.
Treatments Li Na K Mg Ca Mo Co As Se
Canal water 0.09 0.71 8.53 8.55 3.26 0.90 0.02 0.24 0.14 Sewage water 0.09 1.27 11.15 10.41 4.55 0.97 0.03 0.18 0.23 Significance NS S* S* S* S* NS NS S* S*
Table 5: Transfer factors for heavy metals between the wheat shoot and grains for canal and sewage
water treatment.
Treatments Li Na K Mg Ca Mo Co As Se
Canal water 0.94 1.25 1.18 0.88 1.04 0.97 1.76 0.85 1.03 Sewage water 0.94 1.27 0.98 1.27 1.08 0.85 0.75 1.03 1.02 Significance NS NS S* S* NS NS S* S* NS
DISCUSSION
Wheat crop irrigated with excess of
wastewater may increase the concentrations of metals like lithium, sodium, potassium, magnesium, calcium, molybdenum, cobalt, arsenic and selenium etc., in animals especially humans, consuming such foods. Results of the present study suggested that the use of sewage water for growing food crops significantly affect concentrations of many metals in the soil, shoots of plants or grains. Many scientists have reported elevated concentrations of heavy metals in soil and plants as a consequence of household wastewater irrigation (Al-Laham et al., 2007; Mahallapa, 2010; Mapanda et al., 2005; Michael et al., 2010 and Mojiri and Hamidi, 2011). Mojiri & Hamidi (2011) studied the effect of municipal wastewater on accumulation of heavy metals in soil and wheat (Triticum aestivum L.). They found higher concentrations of heavy metals in wheat plants treated with municipal wastewater. They also observed that accumulation of metals in roots is more than in shoots. Increased concentrations of Na, Co and K along with other metals in upper soil layers, irrigated with domestic waste water have been documented by Amin (2011); Khaskhoussy et al., (2013) and Rusan et al., (2007). Present investigations about accumulation of Na, K, Mg and other heavy metals in different parts of plants were in agreement with previous work done by Gadallah (1994); Khaskhoussy et al., (2013); Moazzam et al., (2009) and Rusan et al., (2007). Antagonizing levels of transformation of Na and K in plants were observed in this study which confirmed the results of previous studies by Gadallah (1994); Fonseca et al., (2005) and
Khaskhoussy et al., (2013). According to Bai et al., (2008) this effect was due to strong competition for binding sites between those two elements. A remarkable buildup of arsenic after treatment with waste water, in soil as well as in different parts of plants was recorded which confirmed the previous studies made by Singh et al., (2011) on rice paddy.
Although in the present study, the use of wastewater affected the concentration of some heavy metals in the shoots and grain but not for all metals studied. Actually, wastewater was applied to the experimental plants only for short period of time. Results could be more pronounced if wastewater could have been applied for longer duration.
REFERENCES
Ahmad, K., Khan Z. I., Ashraf M., Hussain M.,
Ibrahim M. & Valeem E. E., 2008. Status of plant diversity at Kufri (Soone valley) Punjab, Pakistan and prevailing threats therein. Pak J Bot., 40: 993–997.
Al-Lahham, O., El Assi, N. M. & Fayyad, M., 2007. Translocation of heavy metals to tomato (Solanum lycopersicom L.) fruit irrigated with treated wastewater. Scientia Horticulturae, 113: 250–254.
Al-Yemeni, M. N., Sher H., El-Sheikh M. A. & Eid. M., 2011. Bioaccumulation of nutrient and heavy metals by Calotropis procera and Citrullus colocynthis and their potential use as contamination indicators. Scienti. Res. Essays., 6: 966–976.
Amin, M., 2011. The Potential of Corn (Zea mays) for Phytoremediation of Soil

102 H. A. SHAD ET AL BIOLOGIA (PAKISTAN)
Contaminated with Cadmium and Lead. J. Biol. Environ. Sci., 5(13): 17–22.
Bai, J., Cui, B., Wang, Q., Gao, H. & Ding, Q., 2008. Assessment of heavy metal contamination of roadside soils in Southeast China. Stochastic Environ. Res. Risk Assess., 23: 241–247.
Batra, J & Seth P. K., 2002. Effect of iron deficiency on developing rat brain. Ind. J. Clinic. Biochem., 17(2): 108–114.
Fonseca, A. F., Melfi, A. J. & Montes, C. R., 2005. Maize growth and changes in soil fertility after irrigation with treated sewage effluent. II. Soil acidity, exchangeable cations, and sulfur, boron and heavy metals availability. Commun. Soil Sci. Plant Analy., 36: 1983–2003.
Gadallah, M.A.A., 1994. Effects of industrial and sewage waste water on the concentration of soluble carbon, nitrogen, and some mineral elements in sunflower plants. J. Plant Nutri., 17: 1369–1384.
Khaskhoussy, K., Hachicha, M., Kahlaoui, B., Messoudi-Nefzi, B., Rejeb, A., Jouzdan, O. & Arselan, A., 2013. Effect of treated wastewater on Soil and Corn Crop in the Tunisian Area. J. App. Sci Res., 9(1): 132–140.
Mahallapa, N. J., Mohan, V. K. & Pravin, R. P., 2010. Flux of Heavy metals in Soil Irrigated with Urban Wastewaters. American-Eurasian J. Agric. and environ. Sci., 8(5): 487–493.
Mapanda, F., Mangwayana, E. N., Nyamangara, J. & Giller, K. E., 2005. The effect of long-term irrigation using wastewater on heavy metal contents of soils under vegetables in Harare, Zimbabwe. Agric. Ecosyst. and Environ., 107: 151–165.
Micheal, J. T., Alit, W. S., Noam, W., Eilon, A. & Amit, G., 2010. Grey water reuse for irrigation: Effect on soil properties. Sci. Total Envior., 408: 2501–2508.
Moazzam, A., Khan, S., Shahid, S. & Khan, M. A., 2009. Growth, yield and nutrient content of Sunflower (Heliantus Annuus L.) using treated wastewater from waste stabilization ponds. Pak. J. Bot., 41(3): 1391–1399.
Mojiri, A. & Hamidi, A. A., 2011. Effects of municipal wastewater on accumulation of heavy metals in soil and wheat (Triticum aestivum L.) with two irrigation methods. Roman Agri. Res., 28: 2067–5720.
Rao, C. N. & Rao, B. S. N., 1981. Trace element content of Indian foods and the dietaries. Ind. J. Med. Res., 73: 904–909.
Rusan, M. M. J., Hinnawi, S., & Rousan, L., 2007. Long term effect of wastewater irrigation of forage crops on soil and plant quality parameters. Desalination, 215: 143–152.
Simsek, A. & Aykut, O., 2007. Evaluation of the microelement profile of Turkish hazelnut (Corylus avellana L) varieties for human nutrition and health. Int. J. Food Scie. Nutri., 58: 677–688.
Singha, J., Upadhyay, S. K., Pathak, R. K. & Gupta, V., 2011. Accumulation of heavy metals in soil and paddy crop (Oryza sativa), irrigated with water of Ramgarh Lake, Gorakhpur, UP, India, Toxicol. Envir. Chem., 93: 462– 473.

BIOLOGIA (PAKISTAN) 2014, 60 (1), 103-107 PKISSN 0006 – 3096 (Print) ISSN 2313 – 206X (On-Line)
*Corresponding author: [email protected]
Parasitic Infestation of an ornamental fish comet, Carassius auratus L. Imported to Pakistan
*ZAFAR IQBAL1 AND BEENISH GUL REHAMAN1
Department of Zoology, University of the Punjab, Quaid-I-Azam Campus, Lahore
ABSTRACT
The present study was designed to investigate parasitic infestation in an imported ornamental fish
comet, a variety of goldfish, Carassius auratus. Fifty fishes were examined, of which 46 fishes showed parasitic infection (prevalence 92%). Five species of parasites; two monogenean (Dactylogyrus extensus Muller and Van Cleave 1932 (86.0%), Gyrodactylus Von Nordmann (32%); two protozoan (Ichthyophthiris multifiliis Fouquest, 1876 (14%), Trichodina Ehrenberg 1831 (4%) and a crustacean, fish louse Argulus foliaceus Muller, 1785 (16%) were recorded from fish. Dactylogyrus extensus infection was highest (mean intensity 19.04). No difference in the infection of left and right gills by D. extensus (χ² = 1.02, df = 42, p = 0.05) was found. Severe damage to gill filaments and secondary gill lamellae was observed due to D. extensus attack. Infection of Gyrodactylus sp. on skin and fins caused minor pathological changes. There was no difference in the infection on fins and skin of fish by this fluke (χ² = 2.28, df =16, p=0.05). The prevalence of I. multifiliis was moderate on fins and gills. There was no difference in the infection of fins and gills by I. multifiliis (χ² = 6.03, df = 6, p=0.05). The comet, had high rate of infection (92%). The occurrence of five species of parasites showed that infection to these fishes occurred in the country of origin prior to shipment to Pakistan. The introduction of exotic pathogenic parasites along with their host must be checked so as to, minimize transmission of these parasites into the country. Key words: comet, imported fish, parasitic diseases, gills, fin, skin infection.
____________________________________________________________________________________
INTRODUCTION
Ornamental fishes are kept as pet worldwide and this is an emerging multimillion dollar industry. Thousands of types of pet fish are kept by hobbyists. The largest part of aquarium fish industry is freshwater aquarium fish sector (Helfman, 2007). Many rural communities in Africa, South America and South East Asia are benefited from this industry. In 2006, the world export of ornamental fish was 282.6 million US$ (FAO, 2007). Goldfish is the most popular ornamental fish in the world. Many goldfish varieties such as; shubunkin, bubble eye, pearl scale, red cap oranda, telescope eye, lion head, celestial, comet, fantail, veiltail and black moor are produced and available for the hobbyist (Ahilan et al., 2009). Ahmad (1996) reported that 20 species of ornamental fishes are imported live into Pakistan from South East Asian countries and sold at the pet shops to the hobbyists. Although, pet fish trade is beneficial to many countries, yet it may have adverse effects as a result of the introduction of nonnative species and spread of different disease agents (Andrews, 2006). Ornamental fish pathogens such as:, protozoans, Ichthyobodo necatrix I. multifiliis, Trichodina pediculatus., Piscinodinium pillulare, Chilodonella piscicola; mongenean Dactylogyrus vastator, D. extensus, Gyrodactylus sp. like G. crysoleucas, G. elegens, digenean Posthodiplostomum cuticola, crustacean, fish louse Argulus foliaceus and Lernaea cyprinacea spread
very quickly in the world because of the commercial gains of the host. It is generally known that external parasites comprise the largest group of pathogens in warm water fish (Snieszko & Axelrod, 1971). The occurrence of parasites and other pathogens on ornamental fishes and their transmission to other places and countries has been reported worldwide; Australia (Evans & Lester, 2001), Korea (Kim et al., 2002), Sri Lanka (Thilakaratne et al, (2003) Brazil (Pizza et al., 2006; Tavares-Dias et al., 2010); Pakistan (Iqbal et al., 2012; Iqbal & Sajjad, 2013; Iqbal and Mumtaz, 2013; Iqbal & Hussain, 2013; Iqbal et al., 2013a; Iqbal et al., 2013b); Turkey (Kayis et al., 2013). The most common parasites of freshwater fishes are two monogeneans; which are parasites on gills and skin and are narrowly host specific. Dactylogyrus extensus and D.vastator Nybelin 1924 are gill parasites while Gyrodactyus salais Malmberg 1957, G. turnbulli Harris 1986, infect skin and fins. Some protozoan parasites of freshwater fishes are; I. multifiliis, Trichodina sp. Chilodonella sp. Stand 1928; Tetrahymena sp. Ichthyobodo necator Henneguy 1883. Most of the ectoparasitc protozoa are commensal but many produce serious diseases and mortality in young fish. Copepod parasites such as: Argulus foliaceus and Lernaea cyprincea L. are common on freshwater fishes and are distributed worldwide (Bond, 2004; Noga, 2007; Rasouli et al., 2012). The present study was aimed to investigate and identify

104 Z. IQBAL & B. G. REHMAN BIOLOGIA (PAKISTAN)
protozoans and metazoan parasites of a freshwater ornamental fish comet, imported to Pakistan.
MATERIALS AND METHODS
The experimental fish comet was purchased
from pet shop in Lahore on monthly basis from July to December 2012. The fishes were brought live in sterilized polyethylene bag and kept in glass aquarium in aerated water in Fish Disease and Health Management Lab. The fish were weighed and measured and examined within four hours of arrival in the Lab. for the presence of any parasites or lesions visible to naked eye. The mucus from skin, gills, fins and operculum was scraped with glass slide and then spread carefully with cover slip separately for examination of protozoan and monogenean skin fluke, under compound microscope at x10 and x40 magnification. The fish gills were cut and examined under microscope for monogenean gill fluke. The specimens were preserved in 10% buffered formalin and 70% ethonal for storage before further studies. The crustacean parasites were collected from fins cleaned in saline and preserved in 70% alcohol. The fresh mount preparation technique was applied to observe the motile parasites (Post, 1987). The identification of parasites was done after Kabata (1985) and Lome & Dykova (1992). Chi-square test was applied to check difference in infection level on gills, skin and fins.
RESULTS
A total of 50 fishes were examined for parasitic infection. The total length and body weight of the fish ranged from 6.50-10.40cm and 5.35-11.30g. Out of 50 fish, the number of infected fish varied for each type of parasitic infection (Table 1). Five species of parasites belonging to three groups, monogenean: (Dactylogyrus extensus, Gyrodactylus sp.), protozoans (Ichthyophthiris multifiliis, Trichodina sp.) and a crustacean (Argulus foliaceus) were recovered from the fish. The site of infection varied for each species of parasite. The prevalence, mean intensity and total number of parasite of each species are given in Table 1. High prevalence and mean intensity was observed for D. extensus. The maximum D. extensus recorded from one fish was 105 and a total of 819 parasites were recovered from gills. Left gills carried 389 and right side gills carried 430 parasites. There was no difference in infection site in both gills (χ² = 1.02, df=42, p = 0.05). Infection caused mild to serious gill pathology in infected fishes. There was localized damage on gills at the point of attachment of the parasites. The
primary and secondary lamellae were severely damaged. Uniform hyperplasia was observed in secondary lamellae. The prevalence of Gyrodactylus sp. was lower than that of D. extensus. Both fins and skin were attacked by Gyrodactylus sp. No inflammatory response was observed on skin. However, mild erosion at the tips of caudal fins of fish was observed. There was no difference in infection of fins and skin by Gyrodactylus (χ² = 2.28, df=16, p=0.05). The prevalence of I.multifiliis was low on gills and high on skin (Table 1). There was no difference in infection of gills and skin by I. multifiliis (χ² = 6.03, df = 6, p=0.05). The prevalence of A. foliaceus was low and the infection was very mild and not serious to the fishes. Trichodina sp. was recorded from caudal fins of two fish. Infection was not pathogenic. The species wise parasitic attack on fish was variable. There were 22 cases of single species infection on a fish; of which 19 ceases were of D. extensus; 3 cases were of I. multifiliis. Two parasites species infection on one host comprised 16 cases, which formed three combinations like: D. extensus - Gyrodactylus sp., (9 cases); D. extensus – A. foliaceus (5 cases). D. extensus - Trichodina sp. (2 cases). Concurrent infection of three parasites on one host (D. extensus - Gyrodactylus sp. - I. multifiliis) comprised four cases (Table 2). It was very clear that D. extensus load was maximum followed by I. multifiliis, Gyrodactylus sp., A. foliaceus and Trichodina sp.
DISCUSSION
In the present study comet fish was examined for parasitic infection. Dactylogyrus extensus showed the highest prevalence and mean intensity, which may be associated with high reproductive rate of this parasite. It has direct life cycle, which facilitates it to spread rapidly in fish ponds and aquariums. The transmission of these parasites increase in those fishes which are reared under poor ponds conditions (Thilakaratine et al., 2003; Woo, 2006). Dactylogyrus extensus infection on gill damages the gill epithelium and make opening for secondary infections (Post, 1987). Heavy gill infection by Dactylogyrus produces multiple symptoms on gills such as; injuries on gill surface, mucus production and lamellar hyperplasia. The gill infection causes impairment of respiration by gills and in such condition fish become very stressful. Shamsi et al., (2009) reported 18 species of genus Dactylogyrus including D. extensus, D.vastator from introduced and imported cyprinid fishes in Iran. The infection of D. extensus in comet may also be attributed to its low host specificity and high tolerance to a wide range of temperature and

VOL. 60 (1) PARASITIC INFESTATION OF CARASSIUS AURATUS L 105
salinity. Being least host-specific species it is recorded from 19 genera of fish species. Gyrodactylus sp. showed low infection in comet and is less pathogenic compared to Dactylogyrus sp. Hence, the damage to scales and epithelium may be considered as mild. However, the fish infected by Gyrodactylus sp. may develop whitish area of mucus on the skin. The results of present study are comparable to Tavares-Dias et al., (2010), Chanda et al., (2011); Iqbal & Hussain (2013).
Ichthyophthirius multifiliis prevalence was low but mean intensity was high. Gill infection by I. multifiliis results in damage to gill tissue and respiratory stress (Raissy et al., 2010). This parasite is widely spread in the world and almost all the fish are susceptible to infection. Tavares-Dias et al, (2010), Chanda et al., (2011), Iqbal & Hussain (2013) also recorded high mean intensity of I. multifiliis in ornamental fishes. However, Iqbal & Hussain (2013) reported I. multifiliis in shubunkin from gills only. Being a low host specific parasite I. multifiliis is wide spread. Trichodina sp. was found with lowest prevalence and mean intensity. It is very common pathogenic parasite of both freshwater and marine fish (Thomas & Wellborn, 1967). Thilakaratine et al., (2003) reported that Trichodina is neither host nor site specific. In contrast to our findings, high mean intensity of Trichodina sp. was reported by Thilakaratine et al, (2003), Tavares-Dias et al, (2010) and Iqbal & Hussain (2013) in
ornamental fishes. High infection is associated with its reproduction by binary fission (Ogut & Palm, 2005). Argulus foliaceus is a common parasite of cyprinids and very low infection was observed in comet. Infection causes ulceration on the skin of the host and facilitates other pathogens to attack the host through ulcers. Iqbal et al., (2013a) reported low prevalence and mean intensity of A. foliaceus in koi, Cyprinus carpio and black moor C. auratus. Attack of 800-1000 Argulus per C.carpio may cause mortality even in this fish and other carps (Pekmezic et al., 2009; Chanda et al., 2011).
Infection of comet by different species of parasites may be explained by variable susceptibility of host to each parasite species. It is assumed that the infected fish might have accidentally escaped into the imported fish consignment. Moreover, probably the checking of fishes for overseas destination is not done carefully. The import of infected ornamental fish may create critical situation for the local pet fish and growing fish farming industry in Pakistan. Therefore, it is strongly suggested that strict regulations on import of live fish must be implemented. Fish quarantine system and inspection of imported fish must be made mandatory. ACKOWLEDGEMENT
We are grateful to the University of the Punjab for providing funds for this study under faculty development Program 2012-13.
Table 1: Parasitic infection in comet, Carassius auratus
S. No
Parasite Fish Infect.
Prev. (%)
Total and rang of parasites
Mean intensity
Site of infection Gills Skin Fins
1 D. extensus 43 86.0 819 (1-105) 19.04 819 - - 2 Gyrodactylus sp. 16 32.0 37 (1-5) 2.31 - 12 25 3 I. multifiliis 07 14.0 15(2-3)
41(5-7) 2.14 5.85
15 -
- -
- 41
4 A. foliaceus 8 16.0 10(1-2) 1.25 - 10 - 5 Trichodina sp. 2 4.0 2 1.0 - - 2
Table.2: Different combinations of mixed parasitic infection in comet, Carassius auratus
S. No
No. Parasite sp./fish
No. of Fish
D.extensus Gyrodactylus sp.
Trichodina sp. A. foliaceus I. multifiliis
Rg. Lg. Skin fins Fins Fins gills skin 1 0 8 - - - - - 2 1 19 190 207
3 - - - - 6 21 3 2 9 80 87 12 23
5 76 98 - - 12 - 2 34 27 - 2 - -
4 3 4 09 11 2 9 20 Total 50 389 430 12 25 2 12 15 41

106 Z. IQBAL & B. G. REHMAN BIOLOGIA (PAKISTAN)
REFERENCES
Ahilan, B., Felix, N. & Jamesson, J. D., 2009. Goldfish. Daya Publishing House, Delhi, India. 87 pp.
Ahmed, N., 1996. Extraction, Exploration and Demand forecasting for aquarium fishes from Pakistan. Ph.D. Thesis. University of Karachi. Pakistan. 225 pp.
Andrews, C., 2006. The Ornamental Fish Trade and Fish Conservation. J. F. Biol, 37: 53-59.
Bond, N. R., 2004. Observations on the effect of introduced parasite Lernaea cyprinacea, on a low land population of a small native fish, mountain Galaxias olidus. Victorian Naturalist., 121:194-198.
Chanda, M., Paul, M., Maity, J., Dash, G., Gupta, D., Gupta, S. & Patra, B. C., 2011. Ornamental fish goldfish, Carassius auratus related parasites in three district of West Bengal, India. Chron Young Sci. 2:51-4.
Evans, B. B. & Lester, R. J. G., 2001. Parasites of ornamental fish imported to Australia. Bull. Eur. Assoc. Fish Pathol., 21: 51–55.
FAO, 2007. Year Book. Fishery and Aquaculture statistics. FAO Rome, Italy.Gibson, D.I., Timofeeva T. A. & Gerasev, P.L.A., 1996. Catalogue of the nominal species of the monogenean genus Dactylpgyrus Diesing, 1850 and their host genera. Syst. Parasitol., 35:3-48.
Helfman, G. S., 2007. Fish Conservation. Island Press. Washington, DC. 233 pp.
Iqbal, Z., Sheikh,U. & Mughal, R., 2012. Fungal Infection in Some Economically Important FreshWater Fishes. Pak. Vet. J., 32(3):422-426.
Iqbal, Z. & Sajjad, R. 2013. Some Pathogenic Fungi Parasitising Two Exotic Tropical Ornamental Fishes. Int. J. Agri. Biol. 15(3):595-598.
Iqbal, Z & Mumtaz, R. 2013. Some Fungal Pathogens of an Ornamental fish, black moor (Carassius auratus L.). European J. Vet. Medicine., 2(1): 1-10.
Iqbal, Z. & Hussain, U., 2013. Parasitic infection of an ornamental fish, Shubunkin,Carassius auratus L. Imported to Pakistan. Biologia (Pakistan): 59(2), 281-286.
Iqbal, Z., Mumtaz, R. & Sajjad, R., 2013a. Argulosis, in some Ornamental Fishes Imported to Lahore, Pakistan. Euro. J. Vet. Medicine., 2(3): 171-178.
Iqbal, Z., Hussain, H., Bark, M.A. & Rehman, B.G., 2013b. Incidence of White spot disease in Freshwater ornamental Fishes Imported to
Pakistan. Biologia (Pakistan): 59(2): 227-231.
Kabata, Z., 1985. Parasites and Diseases of fish cultured in Tropics. Taylor and Francis, London. 318 pp.
Kayis, S., Balta, F., Serezli, R. & Er. A., 2013. Parasites on different Ornamental Fish Species in Turkey. J. Fisheries Sci. Com., 7(2):114-120.
Kim, Jeong-Ho., Hayward., C.J., Joh Seong-Joh & Heo, Gang Joan., 2002. Parasitic infection in live Fresh water tropical fishes imported to Korea. Dis. Aquat. Org. 52: 169-173.
Lom, J. & Dykova, I., 1992. Protozoan parasites of Fishes .1. Elsevier. Amsterdam.315 pp.
Noga, E. J 2007. Fish Diseass: Diagnosis and Treatment. 2nd ed. Wiley-BlackWell. USA. 519 pp.
Ogut, H. & Palm, H.W., 2005. Seasonal Dynamics of Trichodina spp. on whiting (Merlangius merlangus) in relation to organic pollution on the eastern Black Coast of Turkey. Parasitol. Res. Berlim., 96: 149-153.
Pekmezic, G. Z., Yardimi, B., Bolukbas, C.C., Beyhan, Y. E. & Umur, S., 2009. Mortality due to heavy infestation of Argulus foliaceus (L, 1758) in pond-reared carp, Cyprinus carpio L.1758 (Pisces). Crustaceana., 84(5-6): 533-537.
Pizza, R. S., Martins, M. L., Guiraldelli, L. & Yamashita, M. M., 2006. Parasitic Diseases of Freshwater Ornamental Fishes Commercialized in Florianopolis Santa Catarina, Brazil. B. Inst. Pesca, Sao Paulo., 32(1): 51-57.
Post. G., 1987. Text Book of Fish Health. TFH Publication, Neptune City NJ, 288pp.
Raissy, M., Ansari, M., Lashkari, A. & Jalali, B., 2010. Occurrence of parasites in selected fish species in Gandoman Lagoon, Iran. Iranian J. Fish. Sci., 9(3): 464-471.
Rasouli, S., Nekuifard, A., Azadikhah, D., Ahari, H., Anvar, A.A., Khodadadi, A. & Ghasemi, A., 2012. Ectoparasitic infection of Carassius auratus in water resources of West Azerbijan. Iran. Iran. J. Fish. Sci. 11(1): 156-164.
Shamsi, S. B., Jalali, B. & Aghazadeh Meshgi, M., 2009. Infection with Dactylogyrus spp., among introduced cyprinid fishes and their geographical distribution in Iran. Shiraz Uni. Iranian J. Vet. Res., 10(1): 70-74.
Snieszko., S. F. & Axelrod, R., 1971. Diseases of Fishes. TFH Publication. New Jersey. USA. Southgate, P. 1994. Laboratory Diagnosis of Fish Disease. In Practice. 9:252-255.

VOL. 60 (1) PARASITIC INFESTATION OF CARASSIUS AURATUS L 107
Tavares-Dias M., Lemos. G. R. J. & Martin. L. M., 2010. Parasitic fauna of eight species of ornamental freshwater fish species from the middle Negro River in the Brazilian Amazoan Region. Rev. Bras. Parasitol. Vet. Jabotical., 19(2): 29-33.
Thilakaratne, I. D., Rajapaksha, G., Hewakopara, A., Rajapakse, R. P. & Faizal, A.C., 2003. Parasitic infections in freshwater ornamental fish in Sri Lanka. Dis. Aquat. Org.,54: 157-162.
Thomas, L. & Wellborn. J. R., 1967.Trichodina (Ciliata: Urceolariidae) of freshwater fishes of Southeastern United States. J. Eukaryot Microbiol. 14(3): 399-412. doi:10.1111/j. 1550-7408.1967.tho2017.x.
Woo, P. T. K., (2006). Fish Diseases and Disorders. Vol. 1: Protozoan and Metazoans, 2nd ed., CABI Publication. Oxford. UK. 791 pp.

BIOLOGIA (PAKISTAN) 2014, 60 (1), 109-115 PKISSN 0006 – 3096 (Print) ISSN 2313 – 206X (On-Line)
Corresponding author: [email protected]
Prevalence and physiological assessment of deafness in district Ghanche (Gilgit-Baltistan), Pakistan (An audiometry based study)
*SHUJAAT ALI1 & MUHAMMAD RAZA2
1Department of Biological Sciences, Karakoram International University (KIU), Gilgit-Baltistan, Pakistan 2Department of Physics, Karakoram International University (KIU), Gilgit-Baltistan, Pakistan
ABSTRACT
Gilgit-Baltistan (GB) is located in Northern Mountain Regions of Pakistan. This study was conducted in
Surmo village (Ghanche district) of GB during June 2005 to June 2006. Audiograms were obtained by using pure tone air conduction audiometry. 256 ears (both left and right) of deaf individuals from 16 targeted families belonging to same ethnic group i.e., Balti, and complicated consanguinity, maximizing the deafness gene concentration in small population, as there is high ratio of cousin marriages. Audiograms of both ears of 16 deaf were taken at eight different frequencies i.e. (16 deaf x 2 ears, left and right x 8 frequencies at 0.25 kHz, 0.5 kHz, 1 kHz, 2 kHz, 3 kHz, 4 kHz, 6 kHz and 8 kHz) total 256. One sample t-test of the mean of averages of all samples differs significantly from normal hearing i.e. 20 dB and even 40dB. The two-tailed P value obtained is < 0.0001, considered extremely significant confirming that the differences are sampled from a Gaussian distribution (normal distribution). The Kolmogorov-Smirnov distance (KS) is 0.17 and The P value is >0.10 and the data passed the normality test with P>0.05. The significant finding are 53.91% profound (> 90dB = 138 ears), 32.81% severe (71 - 90dB = 84 ears), 3.13% moderately severe (56-70 dB=8 ears), 5.47% moderate (41-55dB=14 ears) and 4.69% mild (<40 dB=14 ears). Pedigrees of these 11 families showed there was no case of autosomal dominance inheritance. All were autosomal recessive. Four syndromic deafness were also recorded (2 mentally retarded, 1 goiter and 1 with balance problem). Keywords: Gilgit-Baltistan, Audiogram, Deafness, Decibel
_______________________________________________________________________________________
NTRODUCTION
Hearing is the process by which the ear transforms sound vibrations in the external environment into nerve impulses that are conveyed to the brain, where they are interpreted as sounds. Audiometry can be applied for the detection of severity of hearing loss in different age groups including children (Karanja et al., 2014). Sound is the physical phenomenon that stimulates the sense of hearing vibrations of frequencies from around 15 hertz to about 20,000 hertz, when reach the inner ear of human being (Redmond, 2008).
The human ear is an extremely complicated organ, which performs the dual function of balancing and perceiving sound. It is made up of three discrete parts, the outer, middle and inner ears, which function as a unit. The outer ear is composed of pinna and external auditory canal; forming the first distinct part of the ear. The middle ear is the cavity, which lies behind the ear drum; filled with air and with a lining of mucous membrane. It has a chain of three ossicles (bones). The malleus is the most lateral (toward the side of the head) of the three ear bones (ossicles) in the middle ear. The long process of the malleus (manubrium) is attached to the tympanic membrane. Tympanic membrane vibrates in response to sound, causing malleus to vibrate in concert. Attached to the malleus is a series of two ossicles, the incus and the
stapes, which inturn is attached via a footplate to the oval window of the cochlea. The inner ear contains six mechano-receptive structures: three semicircular canals, utricle, saccule and the cochlea. It simultaneously regulates two sensory systems; the auditory system for hearing and the vestibular system for spatial orientation and equilibrium. The cochlea, specialized for detection of sounds, regulates the auditory system. The inner ear consists of two parts; the osseous or bony labyrinth and the membranous labyrinth. The osseous labyrinth is a series of cavities with the petrous portion. Information about the pathology of genetic deafness was based upon light microscopy so it could be explained by the degeneration of sensory hair cells (Steel & Brown, 1996).
Four types of hearing loss may be described. The first, conductive hearing loss is caused by diseases or obstruction in the outer or middle ear and usually is not severe. A person with a conductive hearing loss generally can be helped by a hearing aid. Often conductive hearing losses can also be corrected through surgical or medical treatment. The second kind of deafness, sensorineural hearing loss, results from damage to the sensory hair cells or the nerves of the inner ear and can range in severity from mild to profound deafness. Such loss occurs in certain sound frequencies more than in others, resulting in

110 S. ALI & M. RAZA BIOLOGIA (PAKISTAN)
distorted sound perceptions even when the sound level is amplified. A hearing aid may not help a person with a sensorineural loss. The third kind, mixed hearing loss, is caused by problems in both the outer or middle ear and the inner ear. Finally, central hearing loss is the result of damage to or
impairment of the nerves. Deafness in general can be caused by illness or accident, or it may be inherited. Continuous or frequent exposure to noise levels above 85 dB can cause a progressive and eventually severe sensorineural hearing loss (Redmond, 2008).
Fig., 1: Illustration of Noise Intensities of Common Sounds (Hearing Disability Assessment, Nov. 1997, Department. of Health and Children, Ireland)
The temporal bone and membranous labyrinth is a series of communicating sacs and ducts, which lie within the bony labyrinth (Hudspeth, 1989). In the brain, sound is processed in cerebral cortex of the opposite temporal bone. The cells are thought to recover from the stimulus by pumping out the potassium through gap junctions and voltage gated potassium channels (Petit, 1996). Hearing impairment can result if any pathway in this chain is disturbed, either by birth or later on in life, due to some injury or drug usage. High proportions of hearing loss cases are due to outer hair cell abnormalities (Kossal, 1997). Hearing impairment may be partial or total inability to hear. It has long been known that deafness is the most common and perhaps one of the most distressing disorders affecting humanity. Family history (pedigree) is the earliest way to diagnose either the deafness is genetic or not (Smith & Robin, 2002) because genetic diseases proliferate by Mandalian
inheritance pattern (Burchard, 2003). Mutations in one gene, connexin 26 (CX26GJB2), are responsible for most cases of recessive non-syndromic deafness, accounting for 30–40% of all childhood genetic deafness in some populations (Tekin et al., 2001).
The main aim of the study is to extract some result by comparing the global prelingual deafness cases (1/1000) (Morton, 1991) with the special case in Surmo (1/100).
MATERIALS AND METHODS
This study was conducted during June 2005
and June 2006 in Surmo, a populous village in Ghangche district of Gilgit-Baltistan (GB), Pakistan. Its geographical coordinates are 35° 10' 0" North, 76° 25' 0" East (Google Earth, 2014). Shiyok River runs in the north of Surmo. On the other side of the

VOL. 60 (1) PREVALENCE AND PHYSIOLOGICAL ASSESSMENT OF DEAFNESS 111
river, Mashabrum Peak and Siachen Glacier are located. Haldi is also situated in this side. Khaplu and Youchung are situated in the west. In the east, Lunkha, Dawa and Frano are present. South is covered by mountain ranges.
Audiometery: An earphone, connected to an electronic oscillator capable of emitting pure tones ranging from low frequencies to high frequencies was used. The instrument was calibrated so that the zero intensity level of sound at each frequency was the loudness that can barely be heard by the normal person, based on previous studies of normal persons. However, a calibrated volume control was used to increase or decrease the loudness of each tone above or below the zero level.
The lowest intensity heard by the patient was recorded e.g. at 1000Hz the patient responds to 20dB but not 15dB so 20dB at 1000Hz is recorded. Generally, if a person can hear as low as 25 dB at the test frequencies, his/her hearing was considered acceptable. Pure-tone audiometry (air and bone conduction) involves determination of the lowest intensity at which an individual "hears" a pure tone, as a function of frequency (or pitch). In performing a hearing test using an audiometer, one tests approximately 6-8 frequencies (250, 500, 1000, 2000, 3000, 4000, 6000, 8000) covering the auditory spectrum and hearing loss is determined for each of these frequencies. Hearing is measured in decibels (dB). These values were drawn on a graph paper showing the frequencies in Hz on horizontal axis and intensity in dB on vertical axis using Free Hand Software. This graph is known as an audiogram. These audiograms may be from one individual at different times, but more frequently they are from different members of the same family segregating deafness usually in an autosomal dominant fashion. Severity includes Mild (26-40 dB), Moderate (41-55 dB), moderately severe (56-70 dB), Severe (71-90 dB) and Profound (>90dB) while frequencies of hearing loss is designated as: Low (<500 Hz), Middle (501-2000 Hz) and High (>2000 Hz). GraphPad, DataPilot and PAST softwares (Hammer et al, 2001) were used for statistical data analysis.
RESULTS 16 deaf belonging to 16 families with 256
ears (16x2x8) were applied audiometry and constructed audiograms for analysis using Free Hand software for physiological study. The prevalence of the deafness in the targeted district (Ghangche) was found to be very high (1/100) as compared to the global deafness birth rate (1/1000). Air conduction audiometry of sixteen deaf individuals from targeted families of Gilgit-Baltistan (Pakistan) selected for this study. Audiograms of both ears of 16 deaf at 8 different frequencies (total 256 ears i.e. 16x2x8) indicated that the ratio of hearing loss are: 53.91% profound (>90dB=138 ears), 32.81% severe (71-90dB=84 ears), 3.13% moderately severe (56-70dB=8 ears), 5.47% moderate (41-55dB=14 ears) and 4.69% mild (<40dB=12 ears) as shown in fig., 2. Statistical Analysis:
One sample t-test was applied to check either the mean of averages of all samples differ significantly from normal i.e. 20 dB. The two-tailed P value obtained is < 0.0001, considered extremely significant. (t = 159.67 with 7 degrees of freedom. 95% Confidence interval) One sample t test (Current cases vz normal ears i.e. 20 dB)
Mean difference = 69.043 (Mean of Averages of all samples minus 20 dB) The 95% confidence interval of the difference: 68.020 to 70.066 Assumption test: Are the data sampled from a Gaussian distribution (Normal distribution)? The one sample t test assumes that the differences are sampled from a Gaussian distribution. This assumption is tested using the method of Kolmogorov and Smirnov: The Kolmogorov-Smirnov distance (KS) is 0.17 The P value is >0.10The data passed the normality test with P>0.05.

112 S. ALI & M. RAZA BIOLOGIA (PAKISTAN)
Table 1: The levels of HL at different frequencies using air conduction audiometry
Sr No.
Family Code
Ears (Left/Right)
Frequencies (in Hz)
Seve
rity
0f H
earin
g Lo
ss (i
n dB
)
250 500 1000 2000 3000 4000 6000 8000
1 GBDF01
Left Ear 100* 100 100 100 100 100 100 100
Right Ear 100 100 100 100 100 100 100 100
2 GBDF02
Left Ear 100 100 100 100 100 100 100 100
Right Ear 90 100 100 100 100 100 100 100
3
GBDF03 Left Ear 100 100 100 100 100 100 100 100
Right Ear 100 100 100 100 100 100 100 100 4
GBDF04 Left Ear 100 100 100 100 100 100 100 100
Right Ear 100 100 100 100 100 100 100 100
5
GBDF05 Left Ear 40 45 40 55 45 40 60 55
Right Ear 45 40 40 45 40 60 60 55
6 GBDF06
Left Ear 100 100 90 90 100 90 90 90
Right Ear 100 90 100 100 100 100 90 100
7 GBDF07
Left Ear 100 100 100 100 100 100 100 100
Right Ear 100 100 100 100 100 100 100 100
8 GBDF08
Left Ear 90 100 100 100 100 100 90 100
Right Ear 85 90 90 90 90 90 90 90
9 GBDF09
Left Ear 90 90 100 90 90 90 100 100
Right Ear 100 100 90 90 100 90 90 90
10 GBDF10
Left Ear 100 100 80 75 75 80 75 90
Right Ear 100 100 65 75 85 90 90 90
11 GBDF11
Left Ear 90 90 100 100 100 100 100 100
Right Ear 90 90 100 100 100 100 100 100
12 GBDF12
Left Ear 80 85 75 90 90 90 90 90
Right Ear 100 100 90 90 90 90 90 90
13 GBDF13
Left Ear 100 100 100 100 100 100 100 100
Right Ear 100 100 100 100 100 100 100 100
14 GBDF14
Left Ear 40 45 40 55 45 40 60 55
Right Ear 45 40 40 45 40 60 60 55
15 GBDF15
Left Ear 75 75 90 90 90 90 90 85
Right Ear 70 75 90 85 90 90 90 90
16 GBDF16
Left Ear 100 100 90 90 85 90 100 100
Right Ear 75 85 90 90 80 85 80 85 Keys: * All 100 dB values are assumed because of failure of responding at 90dB, dB=Decibel (the unit of hearing loss), GBDF=Deaf from Gilgit-Baltistan, Hz=Hertz

VOL. 60 (1) PREVALENCE AND PHYSIOLOGICAL ASSESSMENT OF DEAFNESS 113
Fig., 2: Comparison of deafness levels (ML=Mild <40dB, MO=Moderate 41-55dB, MS=Moderately Severe
56-70dB, SE=Severe 71-90dB and PR=Profound >90dB).
One sample t test (Current cases vz partial deafness i.e. 40 dB) Does the mean of averages of all samples differ significantly from 40 dB? P value The two-tailed P value is < 0.0001, considered extremely significant. t = 113.42 with 7 degrees of freedom. 95% Confidence interval Mean difference = 49.043 (Mean of Averages of all samples minus 40 dB) The 95% confidence interval of the difference: 48.020 to 50.066 Assumption test: Are the data sampled from a Gaussian distribution (Normal distribution)? The one sample t test assumes that the differences are sampled from a Gaussian distribution. This assumption is tested using the method of Kolmogorov and Smirnov: The Kolmogorov-Smirnov distance (KS) is 0.17 The P value is >0.10The data passed the normality test with P>0.05.
Summary of Data: Cum. Mean: 89.043, No of points: 8, Std deviation: 1.223, Std error: 0.4324,
Minimum: 87.500, Maximum: 90.938, Median: 88.828,
Lower 95% CI: 88.020, Upper 95% CI: 90.066
DISCUSSION
Hearing impairment is presented as a major health problem universally. Cases with recessive mode of inheritance for congenital deafness are more prevalent in Pakistan due to consanguineous marriages. Cousin marriages decrease the proportion of shared genes in families with increase in degree of consanguinity, making them an excellent resource material for conventional linkage analysis and hence are suitable for identification of new loci, genes and mutations. In a study of
consanguinity, caste and deaf-mutism in Punjab in 1921, it was resulted that similar levels of inter-caste differences in disease frequency currently exist due to overwhelming majority of Hindu marriages continue to be within-caste. It was also inferred that the lower level of inter-biraderi variation among Muslims is probably indicative of the dissolution of pre-existing caste boundaries and the resultant gene pool mixing that followed the large-scale conversion of Hindus to Islam during Muslim rule in North India from the 13th to the 19th centuries (Bittles et al., 2004). Average deafness in dB and

114 S. ALI & M. RAZA BIOLOGIA (PAKISTAN)
degree of deafness in percentage (%) are 50-53 dB (20%), 61-66 dB (40%) and 96-105 dB (90%) at common audible frequencies i.e. 1, 2 and 3 kHz (Social Welfare, 1983). High degree of deafness in this case is due to complicated consanguinity as there are so many cousin marriages in the same family in district Ghanche, due to which most of the ears shown high concentration of genes causing 54% profound deafness. For a cousin couple before marriages, it is recommended strongly to screen atleast three generations from both sides to avoid any possible deafness gene. The hearing levels 53.91% profound (>90dB=138 ears), 32.81% severe (71-90dB=84 ears), 3.13% moderately severe (56-70dB=8 ears), 5.47% moderate (41-55dB=14 ears) and 4.69% mild (<40dB=12 ears) predicts that most of the deaf person in district Ghanche suffer from
profound hearing loss. Generally, if a person can hear as low as 25 dB at the test frequencies, his/her hearing was considered acceptable. The threshold or 0 dB mark for each frequency refers to the level at which normal young adults perceive a tone burst 50% of the time. Pedigrees of these 16 families having same ethnic group and high ratio of consanguineous marriages showed that there was no case of autosomal dominance inheritance. All cases were autosomal recessive. Abnormal translation of connexin 26 protein from gapjunction protein beta 2 (GJB2) gene, was the first gene to be implicated in nonsyndromic hearing loss, and mutations in this gene are associated nonsyndromic hearing loss e.g. one is DFNB1, the most common form of nonsyndromic autosomal recessive hearing loss (Willems, 2000).
Fig., 3: Audiogram average values of all ears at all frequencies among different families from GBDF001 to GBDF016; arrows indicate normal (at 20 dB), partial deafness (at 40 dB) and profound deafness (at 90 dB)
respectively.
Gap junction is a region of intimate cell contact that enables passage of small molecules (%1 kDa) between cells (e.g. ions, metabolites and second messengers). Gap junction channels form
by the docking of two hemichannels, the connexons, present on two neighbouring cells. Connexons are hexamers of connexins (Petit, 2006). About 90 GJB2 mutations leading to abnormal Cx26

VOL. 60 (1) PREVALENCE AND PHYSIOLOGICAL ASSESSMENT OF DEAFNESS 115
(mutation) expression have been reported and linked to deafness (Apps et al, 2007). The negative aspect of autosomal recessive is that it is most difficult to investigate because the large number of genes known to produce a similar phenotype (Brown & Steel, 1994). The recorded 4 syndromic deafness (2 mentally retarded, 1 goiter and 1 with balance problem) may increase the genetic concentration of deafness genes in district Ghanche, if the people were not avoided from cousin marriages. A pleasant aspect in deafness gene therapy is the recent advances in therapies for hearing loss have resulted in more specific and less traumatic strategies aimed at functional restoration of the auditory system (Hildebrand et al, 2007).
CONCLUSIONS
Frequent cousin marriages causing
profound deafness which run in generations in district Ghanche, so need to be discourage in affected families. Awareness regarding genetic diseases is significant in remote areas, so role of NGOs may be fruitful in such matters. A few chances of presence of hidden radioactive Uranium and other elements in mountains may also contribute in deafness mutations, are still the blind aspect of research, and need to be explored.
REFERENCES
Apps, S. A., Rankin, W. A. & Kurmis, A. P. 2007.
Connexin 26 mutations in autosomal recessive deafness disorders: A review, Int. J. Aud., 46(2):75 – 81.
Bittles, A. H., Sullivan, S. G. & Zhivotovsky, l. A. 2004. Consanguinity, caste and deaf-mutism in Punjab, 1921. J. biosoc. Sci. 36:221-234.
Brown. S.D.M. & Steel, K.P. 1994. Genetic deafness-progress with mouse models. Hum. Mol. Genet. 3:1453-1456.
Burchard, E.G., Ziv, E., Coyle, N., Gomez, S.L., Tang, H., Karter, A.J., Mountain, J.L., Pérez-Stable, E.J., Sheppard, D. & Risch, N., 2003. The importance of race and ethnic background in biomedical research and clinical practice. N. Engl. J.Med. 348:1170–1175.
Hammer, Ǿ, Harper, D.A.T. & Ryan, P.D., 2001. PAST: Palaeontological Statistics software package for education and data analysis, Palaeontologia Electronia 4(1): 9 pp
Hildebrand, M.S., Newton, S.S., Gubbels, S.P., Sheffield, A.M., Kochhar, A, de Silva, M.G., Dahl, H.H.M., Rose, S.D., Behlke, M.A. &
Smith, R.J.H. 2007. Advances in Molecular and Cellular Therapies for Hearing Loss, Molecular Therapy. 16(2):224-236, www.moleculartherapy.org.
Hudspeth, A. J. 1989. How the Ear’s Works. Nature. 341:397-404.
Karanja, B.W., Oburra, H.O., Masinde, P. & Wamalwa, D. 2014. Prevalence of hearing loss in children following bacterial meningitis in a tertiary referral hospital. B.M.C. Research Notes. 7:138
Kossal, M. 1997. Sound emissions from cochlear filters and foveae-Does the auditory sense organ makes sense. Naturwissenchaften. 84:9-16.
Morton, N.E. 1991. Genetic epidemiology of hearing impairment. Ann. N. Y. Acad Sci. 630:16-31.
Petit, C. 2006. From deafness genes to hearing mechanisms: harmony and counterpoint. TRENDS in Molecular Medicine. 12(2):57-64.
Petit, C. 1996. Genes responsible for Human Hereditary Deafness: sympony of a thousand. Nat Genet. 14:385-391.
Redmond, W.A. 2008. Deafness and Sound. Microsoft® Encarta® 2009 [DVD] Microsoft Corporation.
Smith, R.J.H. & Robin, N.H. 2002. Genetic testing for deafness-GJB2 and SLC6A4 as cause of deafness. J. Communication Disorders. 35:367-377
Social Welfare (Occupational Injuries). Assessment of the Extent of Occupational Deafness. Regulation No. 2-1983, S.I.391 of 1983.
Steel, K.P. & Brown, S.D.M. 1996. Genetics of deafness, Neurobiol. 6:520-525.
Tekin, M., Arnos, K.S., & Pandya, A. 2001. Advances in hereditary deafness. Lancet. 358:1082–1090.
Willems, P.J. 2000. Genetic causes of hearing loss, The New Eng. J. Med., 342:1101-1109.

BIOLOGIA (PAKISTAN) 2014, 60 (1), 117-121 PKISSN 0006 – 3096 (Print) ISSN 2313 – 206X (On-Line)
*Corresponding author: [email protected]
Comparative Efficacy of new Insecticides against Whitefly, Bemisia tabaci (Genn.) and Jassid, Amrasca devastans (Dist.) on Cotton, Bt-121
*MUHAMMAD AFZAL1, SHAHID MAHBOOB RANA1, MUHAMMAD HUSSNAIN BABAR2,
IBRAR-UL-HAQ2, ZAFAR IQBAL2 & HAFIZ MUHAMMAD SALEEM2
1Department of zoology, Government College University, Faisalabad-Pakistan 2Entomological Research Institute, Faisalabad
ABSTRACT
The study was conducted to determine comparative efficacy of new insecticides against whitefly,
Bemisia tabaci (Genn.) and jassid, Amrasca devastans (Dist.) on cotton Bt- 121 grown at farmer field on 25th May, 2009 at Chak No. 253/R.B, Faisalabad. The insecticides viz., diafenthiuron (polo 50%SC), thiamethoxam (actara 25%WG), acetamiprid (diamond 20%SP), imidacloprid (confidor 20%SL) and thiacloprid (calypso 24% OD) at the rate of 200 ml, 24gm, 125gm, 250ml and 250ml/ acre, respectively, were sprayed when population of whitefly and jassid reached to economic threshold level (ETL) i.e. jassid 1-1.5/ leaf and whitefly 4–5/ leaf. Imidacloprid, diafenthiuron, acetamiprid and thiamethoxam proved to be the most effective insecticides against whitefly up to seven days after application. While, Imidacloprid, diafenthiuron and acetamiprid proved to be the most effective against jassid up to seven days after application. Key words: whitefly, jassid, insecticides, efficacy, cotton (Bt-121)
_______________________________________________________________________________________
INTRODUCTION
Cotton (Gossypium hirsutum L.) is the most important cash crop in Pakistan, which is cultivated on 2.879 million hectares and is the source of large amount of foreign exchange, contributing about 7.0 percent of value added in agriculture and about 1.5 percent of GDP and contributes about 66.50% share in national oil production (Anonymous, 2013). Cotton seed cake is an important animal feed and organic manure (Chidda, 1997). In spite of large acreage, yield of cotton is very low because of severe attack by bollworms (Aslam et al., 2004). According to an estimate, cotton bollworms and sucking insect pests cause about 20-40% yield losses in Pakistan (Ahmad, 1999). A few years ago, bollworms were serious problems to cotton crop causing heavy loss to cotton crop but with the introduction of Bt-cotton, the problem of bollworms has been reduced to some extent except armyworm. Now the main problem to cotton crop is the attacks of sucking insect pests especially jassid and whitefly (Ellsworth et al., 2001). Whitefly causes great damage to the cotton crop, by sucking the cell sap from under surface of leaves, it secrets the honey dews, as a result sooty mold grows which reduces the photosynthetic area of leaves and transmitting the viral diseases to cotton crop (Khan & Ahmad, 2005). In case of cotton jassid it has been reported that it causes up to 23.67% reduction in cotton yield (Razaq et al., 2005).
The chemical control is the one of the rapid methods and is an integral part and tool of
integrated pest management (IPM) program to reduce the losses caused by sucking insect pests to the cotton crop (Gogi, et al., 2006). Various researchers have conducted the research regarding the effectiveness of different insecticides against sucking insect pests of cotton crop (Saleem et al., 2001; Aslam et al., 2004; Khattak et al., 2006; Shah et al., 2007).
In Pakistan, pesticides worth more than 10 billion rupees are imported, out of which about 70-80% are sprayed against cotton pests (Anonymous, 2008). It is the dire need to use the new insecticides which not only control the target insect pest but also protect the beneficial insects like ladybird beetle, spider, Chrsoperlla spp, Trichogramma spp and human being also. Present study was, therefore, conducted to compare the efficacy of new-insecticides at different time intervals, against whitefly and jassid, under the field conditions on cotton (Bt-121) crop.
MATERIALS AND METHODS
Experiments on comparative efficacy of new
insecticides against whitefly, B. tabaci (Genn.) and jassid, A. devastans (Dist.) on cotton (Bt-121) were conducted on field grown cotton (Bt-121) at Chak No. 253/R.B, Faisalabad. To conduct the study 6 rows of cotton crop (75 cm apart) were selected keeping the net plot size 10 x 5m for each treatment including untreated check. Two rows were left as non-experimental area between the treatments. There was also distance of 2m between the

118 M. AFZAL ET AL BIOLOGIA (PAKISTAN)
replicas. The population of A. devastans and B. tabaci was recorded by leaving one row on each side of the treatment early in the morning. For this purpose 15 plants were selected randomly. Insects were counted from the upper leaves of 1st plant, middle leaves of 2nd plant and lower leaves of 3rd plant and so on (Razaq et al., 2003). Insecticides (Table 1) were sprayed in recommended doses when the population of jassids and whiteflies reached economic threshold level (ETL) i.e. jassid 1-1.5/ leaf and whitefly 4–5/ leaf, respectively
(Ahmad, 1999). Insecticides were dissolved in water to prepare insecticide solutions on v/v and w/v basis. The crop was sprayed in the morning before 9 a. m. The data regarding the population of A. devastans and B. tabaci were recorded from each plot before spray and 24, 72 hours and 1 week after application of insecticides and mean percentage mortality was calculated. The data were analyzed by using analysis of variance techniques (Steel et. al., 1997). The treatment means were compared by applying Tukey’s HSD test. at 5% significance level.
Table 1: List of selected insecticides applied
against whitefly and jassid at the recommended doses
Sr.# Common Name Trade Name Dose/acre
1 Diafenthiuron Polo 50%SC 200ml 2
Thiamethoxam Actara 25%WG 24gm
3 Acetamiprid
Diamond 20%SP 125gm
4 Imidacloprid
Confidor 20%SL 250ml
5 Thiacloprid
Calypso 24% OD 250ml
6 Check (control)
RESULTS AND DISCUSSION
B. tabaci (Genn.) The mean percentage mortality of whitefly
was recorded at different time intervals after the
application of five insecticides viz. diafenthiuron (polo 50%SC), thiamethoxam (actara 25%WG), acetamiprid (diamond 20%SP), imidacloprid (confidor 20%SL) and thiacloprid (calypso 24% OD). The results in Table 2 revealed that all the treatments caused significant mortality of whitefly even at 168 hours after spray. After 24 hours of spray, the mean value data reveal that confidor proved highly effective insecticide with maximum mortality 86.66% followed by polo (82.74%) and diamond (77.42%). While Actara and calypso were, statistically at par with each other, having mortality of 70.63% and 69.97%, respectively. After 72 hours of application, the efficacy increased, as Confidor, gave maximum mortality (90.87%) followed by Polo, diamond, actara and calypso with mortality of 85.42%, 80.86%, 78.12%, and 75.39%, respectively against whitefly. While after 7 days of application, efficacy decreased as Confidor gave 78.64% mortality, followed by Polo diamond, actara and calypso with mortality of 73.74%, 70.71%, 68.96% and 66.79%, respectively.
Table 2: Mean percentage mortality of whitefly after different time intervals of treatment with different insecticides
Treatments
Dose per Acre
1 Day Before Spray
Mean percentage mortality of whitefly
Trade Names Common name After 24 hrs. After 72 hrs After 7 days
Diafenthiuron Polo 50%SC 200ml. 12.40 82.74±1.35 b
(2.36) 85.42±0.94 b (2.13)
73.74±1.29ab (4.03)
Thiamethoxam Actara 25%WG 24gm. 13.93 70.63± 1.33d
(4.03) 78.12±0.62cd (3.21)
68.96± 1.31bc (4.76)
Acetamiprid Diamond 20%SP 125gm. 13.60 77.42±0.87 c
(3.11) 80.86±1.46 c (2.80)
70.71±1.33 bc (4.50)
Imidacloprid Confidor 20%SL 250ml. 12.93 86.66±1.31 a
(1.83) 90.87±1.55 a (1.33)
78.64±1.39 a (3.28)
Thiacloprid Calypso 24%OD 250ml 12.06 69.97±1.61 d
(4.12) 75.39±0.61 d (3.61)
66.79±1.39 c (5.1)
Check (Control) - - 13.20 0.00 e(13.72) 0.00 e(14.63) 0.00 d(15.36) LSD 3.3198 3.1496 4.9265
Means sharing similar letters in each column are not different significantly (Tukey’s HSD, P>0.05).

VOL. 60 (1) COMPARATIVE EFFICACY OF NEW INSECTICIDES 119
The findings of present study showed that confidor gave the best results (90.87% mortality after 72 hours of application) among all the insecticides used in the current study which are in accordance with that of Mohan & Katiyar (2000) who found that Confidor significantly suppressed whitefly population in cotton. Khattak, et al. (2004) also reported similar results they found that Confidor and polo showed significant reduction in the whitefly population at 24 hours, 72 hours and even 120 hours after spray. Tayyib et al. (2005) also showed that Confidor was the most effective insecticide against whitefly. In current study, Polo gave 73.74% mortality of whitefly which is matched with the previous study conducted by Mustafa (2000) who reported that Confidor and Polo gave almost 72.6% mortality of whitefly. Asi et al. (2008) concluded that Confidor and Polo were highly effective against sucking insect pests of cotton. Mohammad et al. (2008) reported that confidor gave 87.82% control against whitefly even 7 days after treatment. Our results were also supported by the work of Shivanna et al. (2011) who reported that confidor gave the most effective control against cotton whitefly. Abbas et al. (2012) also confirmed that Confidor, Actara and diamond proved to be highly effective against whitefly. But our results were contrary to Parrish (2001) & Aslam et al. (2003) who observed significant mortality of whitefly with the application of acetamiprid.
A. devastans (Dist.) The results presented in Table 3 revealed
that after 24 hours of application Confidor proved highly effective with mortality of 85.86% of jassid, followed by Polo diamond, actara and calypso with mortality of 80.28%, 77.27%, 68.96% and 66.79%, respectively. While after 72 hours of application Confidor and Polo were statistically at par with each other with 92.68 and 90.48% mortality, respectively; followed by diamond, actara and calypso with mortality of 87.92%, 86.83% and 80.60% respectively. After 7 days of application maximum mortality of jassid was recorded (79.64%) where confidor was applied, followed by Polo and diamond, with mortality of 76.43% and 71.42%, respectively. While actara and calypso were less effective with mortality of 67.14% and 64.28% respectively.
Findings of present study showed that confidor proved best chemical insecticide among different insecticides used in our study followed by Polo and Actara. This was supported by the previous studies (Mustafa,1996; Hameed et al.,1997; Yazdani et al., 2000; Aslam et al., 2004; Khattak et al., 2004; Tayyib et al., 2005; Asi et al ., 2008 Mohammad et al., 2008; Akbar, et al., 2012; Awan & Saleem, 2012) they reported that Confidor, Polo and Actara were highly effective against cotton jassid after 24 hours , 72 hours and 7 days after treatment. While Abbas et al. (2012) also confirmed that Confidor, Actara and diamond proved to be highly effective chemical insecticides against cotton jassid.
Table 3: Mean percentage mortality of jassid after different time intervals of treatment with various insecticides
Treatments Dose per Acre
1 Day Before Spray
Mean percentage mortality of jassid
Trade Names
Common Names
After 24 hours
After 72 hours
After 7 days
Diafenthiuron Polo 50%SC 200ml 2.23 80.28±1.12 b
(0.46) 90.48±1.17 ab(0.26)
76.43±1.08 b (0.66)
Thiamethoxam Actara 25%WG
24gm 2.20 74.29±0.76 c (0.60)
86.83±1.36 c (0.36)
67.14±0.69 d (0.92)
Acetamiprid Diamond 20%SP
125gm 2.26 77.27±0.94 bc (0.53)
87.92±1.15 bc (0.33)
71.42±0.78 c (0.80)
Imidacloprid Confidor 20%SL
250ml 2.06 85.86±1.12 a (0.33)
92.68±1.10 a (0.20)
79.64±0.89 a (0.57)
Thiacloprid Calypso 24% OD
250ml 2.26 65.71±1.30 d (0.81)
80.60±0.92 d (0.53)
64.28±0.90 e (1.00)
Check (Control) - - 2.26 0.00 e (2.33)
0.00 e (2.73)
0.00 f (2.80)
LSD 3.1722 2.6233 1.9536 Means sharing similar letters in each column are not different significantly (Tukey’s HSD, P>0.05). Our results
were different from Khan (2011) who observed that Rani 20 SL and Acetamiprid 20 SP were more effective against the sucking insect pests
120 M. AFZAL ET AL BIOLOGIA (PAKISTAN)
REFERENCES
Abbas, Q., Arif, M. J., Gogi, M. D., Abbas, S. K &
Karar, H., 2012. Performance of imidacloprid, thiomethoxam, acetamaprid and a biocontrol agent (Chrysoperla carnea) against whitefly, jassid and thrips on different cotton cultivars, W. J. Zool. 7(2): 141-146.
Ahmad, Z., 1999. “Pest Problems of Cotton, A Regional Perspective”, Proc. Regional Consultation, Insecticide Resistance Management in Cotton, Pakistan Central Cotton Committee, Pakistan, pp. 5-21.
Akbar, M.F., Haq, M.A. & Yasmin, N., 2012. Effectiveness of bio-insecticides as compared to conventional insecticides against jassid (Amrasca devastans Dist.) on okra (Abelmoschus esculentus L.) crop. Pak. Entomol., 34(2): 161-165.
Anonymous, 2008. “Economic survey of Pakistan”, Ministry of Food and Agriculture, Islamabad. pp. 17-37.
Anonymous, 2013. “Economic survey of Pakistan”, Ministry of Food and Agriculture, Islamabad. pp. 17-33.
Asi, M. R., Afzal, M., Anwar, S.A. & Bashir, M.H., 2008. Comparative efficacy of insecticides against sucking insect pests of cotton, Pak. J. Life Soc. Sci.., 6(2): 140-142.
Aslam, M., Razzaq, M., Rana, S. & Faheem, M. 2003. Efficacy of different insecticides against sucking insect-pests on cotton. Pak. Entomol., 25: 155-159.
Aslam, M., Razaq, M., Shah, S.A. & Ahmad, F. 2004. Comparative efficacy of different insecticides against sucking pests of cotton. J. Res. Sci., 15: 53-58. Aslam, M., M. Razzaq, S. Rana & M. Faheem, 2004. Efficacy of different insecticides against sucking our results of imidalcloprid. insect-pests on cotton. Pakistan. Entomol, 25: 155-159.
Awan D. A. & Saleem, M. A., 2012. Comparative efficacy of different insecticides on sucking and chewing insect pests of cotton, Acad. Res. Intern. 3 (2): 210-217.
Chidda, S. 1997. “Modern Techniques of Raising Food Crops”, Oxford and IBH Publishing Co. (Pvt.) Ltd., New Dehli, pp. 344-357.
Ellsworth, P. C., Matheo, R.L. & Martinez, C. J. L., 2001. IPM for Bemisia tabaci; a case study from North America. Crop Protect., 20(9):853-869.
Gogi, M.D., R.M. Sarfraz, L.M. Dosdall, M.J. Arif, A.B. Keddie & M. Ashfaq 2006. Effectiveness of two insect growth regulators against Bemisia tabaci and Helicoverpa armigera and their impact on population densities of arthropod predators in cotton in Pakistan. Pest Management, Sci., 62: 982-990.
Hameed, M., Murtaza, M.A., &. Bhatti, M.A., 1997. Management. Outlook Pest Management, 16: 78-84. Relative efficacy of new insecticides against insect pest complex of cotton. Pak. Entomol, 19(1- 2): 70-72.
Khan, S.M., 2011. Varietal performance and chemical control used as tactics against sucking insect pests of cotton. Sarhad. J. Agric. 7(2): 255-261.
Khan, J.A. & J. Ahmad 2005. Diagnosis, monitoringand transmission characteristics of cotton leaf curl virus. Current Sci., 88: 1803-1809.
Khattak, M.K., Rashid, M., Hussain. S.A.S. & Islam, T. 2004. Comparative effect of neem (Azadirachta indica) oil, neem seed water extract and baythroid TM against whitefly, jassids, and thrips on cotton. Pak. Entomol., 28(1): 31-37.
Mohammad R.A., Afzal, M., Anwar, S.A. & Bashir, M.H., 2008. Comparative Efficacy of Insecticides against Sucking Insect Pests of Cotton. Pak. j. life soc. sci., 6: 140-42.
Mohan, M. & Katiyar, K.N. (2000). “Impact of different insecticides used for bollworm control on the population of jassid and whitefly in cotton”, J. Pesticide Research, 12(1): 99-102.
Mohyuddin, A.I., Jilani, G., Khan, A.G., Humza, A.I. & Mehmood, Z., 1997. “Integrated pest management of major cotton pests by conservation, redistribution and augmentation of natural enemies”, Pak. J. Zool., 29(3): 293.298.
Mustafa, G., 2000. Annual Report. Entomology Section, Ayub Agric. Res. Institute, Faisalabad. pp. 1-14.
Mustafa, G., 1996. Ann. Rept. Entomol. Section, Ayub Agriculture. Research. Institute, Faisalabad, pp: 12-13.
Parrish, M.D. & Assail, T. M. 2001. A new tool for insect pest management in cotton. Proc. Belt-wide Cotton Conferences. National Cotton Council, Memphis TN. USA. 1: 46-47.
Razaq, M., Aslam, M., Sharif, K., Salman, B. & Aleem, M. F. 2003. Evaluation of

VOL. 60 (1) COMPARATIVE EFFICACY OF NEW INSECTICIDES 121
insecticides against cotton whitefly, Bemisia tabaci (Genn.) (Homoptera: Aleyrodidae). J. Res. Sci., (BZU, Multan, Pak.), 14(2): 1012-1021.
Razaq, M., A. Suhail, M. Aslam, M.J. Arif. M.A. Saleem & M.H.A. Khan, 2005. Evaluation of pymerrozine neonicotinoids and conventional insecticides against cotton jassid, Amrasca devastans (Dist.) and cotton whitefly, Bemisia tabaci (Genn.) Entomol, 27(1): 75-78.
Saleem, M.A., Mustafa, K. & Hussain, R. 2001. Relative efficacy of some insecticides against some sucking insect pests of CIM-443 cotton. Pak. Entomol., 23(1-2):91-92.
Shah, M.J., Ahmad, A., Hussain, M., Yousaf, M.M. & Ahmad, B. 2007. Efficacy of different insecticides against sucking insect pest complex on the growth and yield of mungbean (Vigna radiata L.) Pak. Entomol., 29(2) 83-85.
Shivanna, B.K., Gangadhara Naik, B., Nagaraja, R., Basavaraja, M. K., Kalleswara Swamy, C. M. & Karegowda, C., 2011. Bio efficacy of new insecticides against sucking insect pests of transgenic cotton, I.J.S.N., 2(1): 79-83.
Steel, R. G. D. & Torrie, J. H., 1997. “Principles and Procedures of Statistics with Special Reference to the Biological Sciences”, McGraw Hill Book Co. Inc. New York, pp. 481.
Tayyib, M., Sohail, A., Shazia, Murtaza, A. & Jamil, F.F., 2005. Efficacy of some new chemistry insecticides for controlling the sucking insect pests and mites on cotton. Pak. Entomol., 27(1): 63-66.
Yazdani, M.S., Sohail, A., Razaq, M. & Khan, H. A., 2000. Comparative efficacy of some insecticides against cotton Jassids, (Amrasca devastans Dist.) and their on effect nontarget insects in cotton. Intl. J. Agric. Biol., 2(1): 19-20.

BIOLOGIA (PAKISTAN) 2014, 60 (1), 123-127 PKISSN 0006 – 3096 (Print) ISSN 2313 – 206X (On-Line)
*Corresponding Author: [email protected]; [email protected]
Prevalence of Lernaeid Ectoparasites in some Culturable Fish species from different Nurseries of Punjab.
ASIF ALI 1, SIKENDER HAYAT 1, MOHAMMAD SHAFIQ AHMED 2, NOOR ELAHI 1, ATIFA SAGHIR 1 ,
HASSAN ALI 3, AND WASEEM AHMED KHAN 4
1Fisheries Research and Training Institute, Manawan, Lahore, Pakistan 2Department of Zoology, University of the Punjab Lahore, Pakistan
3WWF- Pakistan, Ferozpur Road, Lahore, Pakistan. 4Pakistan Wildlife Foundation, Islamabad, Pakistan
ABSTRACT
During the present study 960 specimens of four culturable fish species viz., Rohu (Labeo rohita), Mori
(Cirrhinus mrigala), Thaila (Catla catla) and Grass Carp (Ctenopharyngodon idella), collected from different fish seed hatcheries and nurseries of Punjab Province, were examined for Lernaeid ectoparasite. Out of all specimens, only 192 fishes were found infested with Lernaea cyprinacea and Lernaea polymorpha. Among the infested 192 fishes, 162 were infested with Lernaea cyprinacea and 30 were infested with Lernaea polymorpha. The overall prevalence of L. cyprinacea and L. polymorpha remained 16.88% and 3.12%, respectively. The highest prevalence of Lernaea was observed in weight group <500 g which was 25.93%. Among four fish species, thaila was the most infested in all weight groups and showed highest prevalence that was 40.10% and lowest infestation was observed in Cirrhinus mrigala which was 16.70%. While comparing the sampling sites highest prevalence (35%) was recorded in fish samples collected from Muzaffargarh, second highest (31.7%) was from Mian Channu and the lowest infestation (4.2%) was recorded in the fish samples collected from Ganda Singh Wala. Key words: Lernaea cyprinacea, Lernaea polymorpha, culturable fish species, lernaeid prevalence
_______________________________________________________________________________________
INTRODUCTION
Fish health research generally includes the study of environmental stressors associated with genetics, histopathology and pathogens (Riley et al., 2008; Iwanowicz, 2011). Pathogens, associated with fish diseases, can be overlooked in many fish health assessments when a fish is healthy and are considered only when they cause diseases and detrimental effects to the economy by damaging commercial fishery (Iwanowicz, 2011).
Parasites abound in the aquatic environment and survive in a dynamic equilibrium with their host (Marcogliese, 2005; Iwanowicz, 2011). Changes in the environment, both anthropogenic and environmental, can change the parasite/host balance and cause disease/mortality in fishes. Parasites can cause physical, physiological and reproductive damage to fish (Ahmed & Shahid, 2000; Buchmann & Lindstrom, 2002; Knudsen et al., 2009; Al-Jahdali & Hassanine, 2010; Iwanowicz, 2011). Therefore it is necessary to have sufficient knowledge of various parasites particularly crustacean (copepods) and their communities within a given fish population.
Lernaeid or anchor worms are common parasites in freshwater aquaculture of cyprinids and
to a lesser extent of salmonids including other fish species (Woo, 2002). The economic losses due to lernaeid ectoparasites has increased during several epizootics occurring among the most important farmed fishes world-wide (Kir, 2007). The adult Lernaeid are harmful to large fish because of their large size, mode of attachment and feeding. These parasites damage the eyes and cause blindness. They cause gill infections leading to intense epithelial proliferation which seriously impair gaseous exchange and also support spread of bacterial infection. They can also penetrate the visceral cavity, including heart and resulting peritonitis and death (Kabata, 1985; Shariff et al., 1986; Ahmed & Shahid, 2000; Jalali & Barzegar, 2006).
A few studies have been conducted to find out prevalence of lernaeid ecotoparasites in culturable fish species throughout Pakistan. These studies have revealed the presence of four to six species of Lernaeid ectoparasites and Lernaea cyprinacea and Lernaea polymorpha were most prevalent among all larnaeid ectoparasites found so far (Ahmed et al., 2001; Tasawar et al., 2007, 2009,a 2011; Iqbal, et. al., 2012; Kanwal et al., 2012). Therefore, the present study was conducted to investigate the prevalence of lernaeid ectoparasite (Lernaea cyprinacea and Lernaea

124 A. ALI ET AL BIOLOGIA (PAKISTAN)
polymorpha) in some culturable fish species cultured in some nurseries and hatcheries of Punjab, Pakistan. This research will provide baseline data about the lernaeid infections and be helpful in designing treatment strategy to save economic losses to fisheries industry.
MATERIALS AND METHODS
Fish sample comprising 960 fish specimens
of four fish species viz., Rohu (Labeo rohita), Mori (Cirrhinus mrigala), Thaila (Catla catla) and Grass Carp (Ctenopharyngodon idella) were collected from different fish seed nurseries and hatcheries of Punjab Fisheries Department located at Mian Channu (Khanewal), Manga (Lahore), Muzaffargarh, Farooqabad (Sheikhupura), Ganda Singh Wala (Kasur), Kotli Araian (Sialkot), Phalia (Mandi Bahauddin) and Chenawan (Gujranwala) (Fig. 1).
Fig., 1: Map showing the sampling locations for the
current study The fishes were netted and kept alive in a
water container. After fish species identification, they were examined for the presence of Lernaea species. The parasites were removed with the help of fine forceps and placed in Bouin’s fixative. After measuring wet body weight of each fish, they were released to its respective pond. The collected parasites were brought to the Pathology Laboratory of Fisheries Research and Training Institute, Manawan, Lahore.
The permanent mounts of the parasites were prepared. For this purpose, the parasites were washed with distilled water to remove excess fixative. The washed specimens were kept in 10% potassium hydroxide until their bodies became transparent. Then the parasites were washed in distilled water to remove alkali. After washing, the
Lernaea species were slowly dehydrated in various grades of alcohol according to Cable (1985). Following dehydration the Lernaea samples were placed in xylene and observed under microscope for identification of Lernaea species. Results were expressed in terms of percentage following Chaudhry & Kamal (2000).
RESULTS AND DISCUSSION
Out of 960 fish specimens, only 192 were
found infested with Lernaea cyprinacea and Lernaea polymorpha. Among the infested 192 fishes 162 were infested with Lernaea cyprinacea and 30 were infested with Lernaea polymorpha. The overall prevalence of L. cyprinacea and L. polymorpha remained 16.88% and 3.12%, respectively (Table 1). Among four fish species, Catla catla showed highest prevalence of Lernaeid ectoparasites (40.1%) while Ctenopharyngodon idella, Labeo rohita, Cirrhinus mrigala showed 24%, 19.3% and 16.7%, respectively (Table 2). Tasawar et al. (2009 a & b) reported four species of Lernaeid ectoparasites from the fish samples collected from fish seed hatchery at Mian Channu and L cyprinacea was the most prevalent (26.67%) among the other Lernaeid ectoparasites. Similarly, Ahmed et al. (2001) and Parveen & Ullah (2013) during their study on ectoparasites among indigenous and exotic freshwater carps, reported L. cyprinacea as the most prevalent ectoparasite.
Table 1: The overall prevalence of Lernaeid
ectoparasites Sr. No.
Parasite species
No. of fish
examined
No. of infested
fish
Prevalence (%)
1. Lernaea cyprinacea
960 162 16.88
2. Lernaea polymorpha
960 30 3.13
Total 960 192 20.00
Table 2: Prevalence of Lernaeid ectoparasites
with reference to fish species S. No.
Fish species Prevalence (%)
1 Catla catla 40.1 2 Ctenopharyngodon idella 24.0 3 Labeo rohita 19.3 4 Cirrhinus mrigala 16.7

VOL. 60 (1) PREVALENCE OF LERNAEID ECTOPARASITES IN SOME CULTURABLE FISH 125
Relationships between body weight and
Lernaeid ectoparasites showed that Lernaea spp. had the highest prevalence (25.93%) in weight group of <500g while in weight groups 501-1000g and >1000g its prevalence was 20.62% and 13.43% respectively (Table 3). Among the four studied species, Catla catla was found more infested in all weight groups. Lernaeid ectoparasites prevalence in Catla catla was 45%, 30% and 21.25% in the weight groups <500g, 501-1000g and >1000g, respectively (Table 3). The results of Kanwal et. al., (2012) showed the relationship between body weight and Lernaeid ectoparasites, which showed that L. cyprinacea had highest prevalence (38.86%) in weight group of 501-1000g, while lowest prevalence
(0%) was recorded in weight group of >2900g. The overall prevalence of lernaeid ectoparasites of Catla catla has also been reported previously by Tasawar et al., (2009b) which revealed the prevalence of L. cyprinacea and L. polymorpha as 26.67% and 25.83% respectively. Labeo rohita (23.75%) and Cirrhinus mrigala (15%) showed highest prevalence of Lernaeid ectoparasites in the weight group of 501-1000g while in the weight groups <500g and >1000g it was 12.50% and 10%, respectively for Labeo rohita and 12.5% each for Cirrhinus mrigala. In case of Ctenopharyngodon idella highest prevalence (33.75%) was in the weight group <500g while 20.62% and 13.43% prevalence was observed in the weight groups 501-1000g and >1000g, respectively.
Table 3: Prevalence of Lernaeid ectoparasites with reference to fish body weights.
Fish species
Weight (g) groups < 500 501-1000 >1000
Tota
l fis
h ex
amin
ed
Infe
cted
Fis
h
Prev
alen
ce (%
)
Tota
l fis
h ex
amin
ed
Infe
cted
Fis
h
Prev
alen
ce (%
)
Tota
l fis
h ex
amin
ed
Infe
cted
Fis
h
Prev
alen
ce (%
)
Labeo rohita 80 10 12.50 80 19 23.75 80 08 10.00
Cirrhinus mrigala 80 10 12.50 80 12 15.00 80 10 12.50
Catla catla 80 36 45.00 80 24 30.00 80 17 21.25
Ctenopharyngodon idella 80 27 33.75 80 11 13.75 80 08 10.00
Total 320 83 25.93 320 66 20.62 320 43 13.43
Climatic factors and environmental
conditions play a considerable role in the prevalence of Lernaeid ectoparasites at different locations (Ahmed et al., 2001; Buchmann & Lindenstrom, 2002). During present study highest prevalence (35%) was recorded from the fish samples collected from Muzaffargarh, second highest (31.7%) was from Mian Channu (Khanewal) while lowest infestation (4.2%) was recorded in fish samples collected from Ganda Singh Wala (Kasur) (Table 4). Prevalence of Lernaeid ectoparasites was recorded as 23.3%, 20%, 18.3%, 15.8% and 11.7% from Farooqabad (Sheikhupura), Kotli Araian
(Sialkot), Manga (Lahore), Phalia (Mandi Bahauddin) and Chenawan (Gujranwala), respectively (Table 4). According to Anjum (1986) water temperature play a significant role for Lernaea propagation as lernaeids parasites are normally found in warm waters. High prevalence of Lernaea in Muzaffargarh and Mian Channu (Khanewal) may be related to their hot climate compared to the central and upper parts of Punjab Province. It can also be correlated with poor hygienic conditions prevailing at such nurseries and fish seed hatcheries where lernaeid ectoparasites prevalence is high.

126 A. ALI ET AL BIOLOGIA (PAKISTAN)
Table 4: Prevalence of Lernaeid ectoparasites in different areas of Punjab Province.
Locations Total no. of fish samples
Infested Healthy
Mian Channu (Khanewal) 120 31.7% (38) 68.3% (82) Manga (Lahore) 120 18.3% (22) 81.7% (98) Muzaffargarh 120 35% (42) 65% (78) Farooqabad (Sheikhupura) 120 23.3% (28) 76.7% (92) Ganda Singh Wala (Kasur) 120 4.2% (05) 95.8% (115) Kotli Araian (Sialkot) 120 20% (24) 80% (96) Phalia (Mandi Bahauddin) 120 15.8% (19) 84.2% (101) Chenawan (Gujranwala) 120 11.7% (14) 88.3% (106) Total 960 20% (192) 80% (768)
REFERENCES
Ahmed, M. S. and Shahid A., 2000. Histological studies of infected skin, affected by Lernea cyprinacea infection in a freshwater fish, Cirrhina mrigala. Pakistan J. Fish. 1(2): 59-64.
Ahmed, M. S., Kausar, M. and Khan, W. A., 2001. Prevalence of Lernea cyprinacea (Crustacean: Copepoda) in Indian major carps. Sci. Int. (Lahore) 13(1): 83-85.
Al-Jahdali, M. O. & El-S Hassanine. R. M., 2010. Ovarian abnormality in a pathological case caused by Myxidium sp. (Myxozoa, Myxosporea) in onespot snapper fish Lutjanus monostigma (Teleostei, Lutjanidae) from the Red Sea. Acta Parasitologica, 55: 1-7.
Anjum, R., 1986. Carp diseases and their control. Progressive Farming Pakistan, 6: 48-56.
Buchmann, K. & Lindenstrom, T., 2002. Interaction between monogenean parasites and their fish hosts. Int. J. of Parasitology, 32: 309-319.
Cable, R. M., 1985. An Illustrated Laboratory Manual of Parasitology. 5th ed. Surjeet Publication Dehli. 242-246 pp.
Iqbal, Z., Shafqat, A & Haroon, F., 2012. Lernaea diversity and infection in Indian and Chinese carps under semi-intensive culture conditions in Lahore, Punjab. The Journal of Animal & Plant Sciences, 22(4): 923-926
Iwanowicz, D. D., 2011. Overview on the Effects of Parasites on Fish Health. In: Proceedings of the Third Bilateral Conference between Russia and the United States, 12-20 July,
2009, held in Shepherdstown, West Virginia. Landover, Maryland, USA. Khaled bin Sultan Living Oceans Foundation. R.C. Cipriano, A.W. Bruckner, & I.S. Shchelkunov (Eds.), Bridging America and Russia with Shared Perspectives on Aquatic Animal Health. pp. 176-184.
Jalali, B. & Barzegar, M., 2006. Fish Parasites in Zarivar lake. J. Agri. Tech., 8: 47-58.
Kabata, Z., 1985. Parasite and Diseases of fish cultured in the Tropics. Taylor and Francis, London, UK. 318 pp.
Kanwal, N., Siraj, Z., Tasawar, Z., Mushtaq, F. & Lashari, M. H., 2012. The Lernaeid Parasites of Catla catla. Acta Parasitologica Globalis, 3(2): 16-19.
Kir, I., 2007. The effects of parasites on the growth of the crucian carp (Carassius carassius L., 1758) inhabiting the Kovada Lake. Turkiye Parazitol. Derg, 31(2): 162-166.
Knudsen, R., Amundsen, P. A., Jobling, M. & Klemetsen, A., 2009. Differences in pyloric caeca morphology between Arctic charr Salvelinus alpines ecotypes: adaptation to trophic specialization or parasite-induced phenotypic modifications? Journal of Fish Biology, 73:275-287
Marcogliese, D. J., 2005. Parasites of the super-organism: Are they indicators of ecosystem health? Int. J. of Parasitology, 35: 705-7616.
Parveen, F. & Ullah, H., 2013. Ectoparasites of indigenous and exotic freshwater carp fish (Cypriniformes: Cyprinidae) from Charbanda and Tarbela, Khyber Pakhyunkhwa, Pakistan. Amer., J. of Res Comm., 1(9): 255-269.
VOL. 60 (1) PREVALENCE OF LERNAEID ECTOPARASITES IN SOME CULTURABLE FISH 127
Riley, S. C., Munkittrick, K. R., Evans, A. N. & Krueger, C. C., 2008. Understanding the ecology of disease in Great Lakes fish populations. Aquatic Ecosystem Health and Management, 11: 321–334.
Shariff, M., Kabata, Z. & Sommerville, C., 1986. Host susceptibility to Lernaea cyprinacea and its treatment in a large aquarium system. J. Fish Dis., 9: 393–401.
Tasawar, Z., Umer, K. & Hayat, C S., 2007. Observations on Lernaeid parasites on Catla catla from a fish hatchery, Muzaffargarh, Pakistan. Pakistan Vet J., 27(1): 17-19.
Tasawar, Z., Zafar, S., Lashari, M. H. & Hayat, C. S., 2009a. The prevalence of lernaeid ectoparasites in grass carp (Ctenopharyngodon idella). Pakistan Vet. J., 29(2): 95-96.
Tasawar, Z., Naz, F., Lashari, M. H., Hayat, C. S., Benish Ali, S. H., Naeem, M. & Shaheen, R., 2009b. Incidence of lenaeid parasite in Catla catla on a fish farm. Sarhad J. Agric. 25(2): 285-289.
Tasawar, Z., Riaz, S., Lashari, M. H., & Aziz, F., 2011. The incident of lernaeid ectoparasites of Labeo rohita at local fish farms of Tehsil Kot Addu. Pak. J. Agri., Agril. Engg., Vet. Sci., 27(2): 185-191.
Woo, P. T. K., 2002. Fish Diseases and Disorders. CABI International Wallingford Oxfordshire OX10 8DE, UK. 808 pp.

BIOLOGIA (PAKISTAN) 2014, 60 (1), 129-133 PKISSN 0006 – 3096 (Print) ISSN 2313 – 206X (On-Line)
*Corresponding aouthor:[email protected], [email protected]
Life Form and Leaf Spectra Reported from India Morr District Kotli, Azad Jammu & Kashmir
*SHOUKAT HUSSAIN1, ZAHID HUSSAIN MALIK1, NAFEESA ZAHID MALIK1 & MUHAMMAD AJAIB2
1Department of Botany, University of Azad Jammu & KashmirMuzaffarabad, Azad Kashmir,
2Department of Botany, GC University Lahore
ABSTRACT
An inventory of plant communities was prepared during monsoon. The investigated area comprised of 49 plant species belong to 29 families. Leaf spectra showed dominance of Leptophylls and Nanophylls due to aridity and dry conditions in the area. Leptophylls and Nanophylls are the characteristic of hot desserts. Its soil has low moisture and low organic matter with basic pH that is why Leptophylls and Nanophylls were dominant. Phanerophyte, Hemicryptophyte and Therophytes were also abundant. Hemicryptophytes are characteristic of temperate region and Therophytes are characteristic of desert climate. The study area falls into dry subtropical type, which clearly indicates the important features of climate. Key words: Leaf size, Life Form, India Morr
_______________________________________________________________________________________
INTRODUCTION
The Biological spectrum is defined as percentage ratio of life form of plant present in any area. It is an important physiognomic attribute that has been extensively used in vegetation studies. Life form spectrum describes about the climate of area (Sarmiento & Monasterio, 1983; Meher-Homeji, 1981; Danin & Orshan, 1990).
Yemeni & Sher (2010) studied the biological spectrum of vegetation of Asir mountain of Saudi Arabia. Malik et al. (2007) described the life form and leaf spectra of Ganga Chotti and Bedori hills, Azad Kashmir. Ajaib et al. (2008) recorded biological spectrum of Saney Baney hills District Kotli, Azad Kashmir. Plants of same life form grow together to compete directly for space (Muller & Ellenberg, 1974).
India Morr lies in District Kotli which is 15Km in the North of Kotli city. District Kotli is administratively divided into six Tehsils, viz. Kotli, Sehnsa, Nikyal, Khuiratta, Charhoi, and Doliya. It stretches over an area of 1862sq.kms (Ajaib et al., 2010) and its population is 0.570 million according to population census 1998. In the east of District Kotli lies District Rajuauri of occupied Kashmir. It is surrounded in southern side by Mirpur & Bhimber Districts, western side by Mirpur & Rawalpindi (Pakistan) and in northern side by Sudhnooti & Poonch Districts Azad Kashmir (Nazir et al., 2012). The height of study area is 710m to 925m. The investigated area lies between Longitudes 73°53 to 73°60 n and Latitude 33°44 to 33°60 E (Topo sheet No. 43G /15).
Climatically the study area falls in Subtropical type. The average rainfall of the year was 93.85mm. The maximum rainfall occurs during the months of August and March while minimum rainfall occurs during the months of May and November. July and June were the hottest months of year with the temperature being 38.0°C and 37.9°C respectively. Minimum temperature was recorded during January and December which was 2.4°C and 4.3°C respectively. Maximum humidity occurs during the months of August, September and February, i.e. 85%, 82%, and 82% respectively. While minimum humidity was recorded during May which was 23% (Anonymous, 2012). Two main rivers viz. River Jehlum and River Poonch flow from District Kotli and join Mangla Lake.
MATERIALS AND METHODS
The investigated area was divided into 10 stands on the basis of altitude, which varied from 710m to 925m. Quadrat method was used for sampling the vegetation. Trees, Shrubs and Herbs were sampled by 10×2m, 5×2m, and 1m2 quadrat respectively (Malik et al., 2007). Life form was calculated after Raunkiaer (1934) and plants were classified into seven life form classes such as Megaphanerophytes, Nanophanerophytes, Chamaephytes, Hemicryptophytes, Therophytes, Geophytes, and Lianas. Leaf spectra were calculated by using leaf size diagram after Raunkiaer (1934).

130 S. HUSSAIN ET AL BIOLOGIA (PAKISTAN)
RESULTS
A. Life form 1. Pinus roxburghii Community: This community consisted of 17 plant species. Nanophanerophytes were 29.4%. Megaphanerophytes, therophytes and chamaephytes were 23.52%, 17.64% and 5.88% respectively, while hemicryptophytes and geophytes have equal share of 11.76% each. Nanophanerophyte were dominant (Table 1). 2. Acacia-Themeda Community: At an altitude of 735m, 15 species were reported. Nanophanerophytes were dominant with 33.33%. therophytes were 26.66% while megaphanerophytes and geophyte have equal share of 13.33% each. Therophytes and hemicryptophytes also have equal share of 6.66% each (Table 1). 3. Themeda-Ficus-Mallotus Community: In this community Megaphanerophytes and Nanophanerophytes have equal share of 31.25% each. Hemicryptophytes, Therophytes and Geophyte were 18.75%, 12.15% and 6.25%, respectively (Table 1). 4. Themeda-Carissa Community: This community was harbored at an elevation of 770m consisted of 15 species. Megaphanerophytes were 26.66%, Nanophanerophytes and Hemicryptophytes had equal share of 20% each. Therophytes and Geophytes have also equal share of 13.33% each while Chamaephytes were 6.66%. Megaphanerophytes were dominant (Table 1). 5. Themeda-Dalbergia-Carissa Community: This community was reported at an altitude of 795m with 13 species. Megaphanerophytes and Hemicryptophytes have equal share of 30.76% each. Nanophanerophytes were 23.07% while Geophytes and Chamaephytes have equal share of 7.69%. Megaphanerophytes and Hemicryptophytes were collectively dominant species (Table 1).
6. Myrsine-Carissa-Themeda Community: This community was recorded with 15 species at an altitude of 815m. Megaphanerophytes were 33.33%. Therophyte, Nanophytes, Chamaephytes and Hemicryptophytes were 26.66%, 20%, 13.33% and 6.66%, respectively. Megaphanerophytes were dominant species (Table 1). 7. Themeda-Carissa-Mallotus Community: This community comprises of 18 species. Megaphanerophytes, Nanophanerophytes and Therophytes have equal share of 22.22% each and were collectively dominant. Chamaephytes and Geophytes were 11.11% & 6.55%, respectively (Table 1). 8. Themeda-Dodonaea-Pinus Community: At an altitude of 860m Themeda-Dodonaea-Pinus community was recorded with 13 species. Nanophanerophytes were 30.76%. Therophytes and Hemicryptophytes have equal share of 23.07% each. Megaphanerophytes and Geophytes were 15.38% & 7.69%, respectively. Nanophanerophytes were dominant species (Table 1). 9. Olea-Taraxacum Community: At an altitude of 885m this community was recorded with 19 species. Hemicryptophytes were 26.31%. Nanophanerophytes and Therophytes had equal share of 21.05% each, while Megaphanerophytes, Geophytes and Chaemaephytes were 15.87%, 10.52% and 5.26% respectively. Hemicryptophytes were dominant (Table 1). 10. Pinus-Themeda Community: At an altitude of 925m Pinus-Themeda Community was recognized with 14 species. Therophytes were 42.98%. Hemicryptophytes were 21.42%. Nanophanerophytes and Chamaephytes had equal share of 14.28%. Megaphanerophytes were 7.14%. Therophytes were dominant (Table 1). As a whole in the study area, Nanophanerophytes and Megaphanerophyte were dominant as compared to other life forms (Fig. 1).
0
5
10
15
20
25
MP NP CH H Th L G
Fig., 1: Life Form of India Morr District Kotli

VOL. 60 (1) LIFE FORM AND LEAF SPECTRA 131
Table 1: Life Form of Plant Communities recorded from India Morr Kotli, AJK.
Sr.No.
Communities Height
(m) Total
species MP % NP % CH % H % TH % L % G %
1 Pinus roxburhii Community 710 17 23.52 29.41 5.88 11.76 17.64 - 11.76
2 Acacia-Themeda Community 735 15 13.33 33.33 6.66 26.66 6.60 - 13.33
3 Themeda-Ficus-Mallotus Community
755 16 31.25 31.25 - 18.75 12.50 - 6.25
4 Themeda-Carissa Community 770 15 26.66 20.00 6.66 20.00 13.33 - 13.33
5 Themeda-Dalbergia-Carissa Community
795 13 30.76 23.07 7.69 30.76 26.66 - 7.69
6 Myrsine-Carissa-Themeda Community
815 15 33.33 20.00 13.33 6.66 22.22 - 5.55
7 Themeda-Carissa-Mallotus Community
835 18 22.22 22.22 11.11 16.66 23.07 - 7.69
8 Themeda-Dodonaea-Pinus Community
860 13 15.38 30.76 - 23.07 21.05 - 10.52
9 Olea-Taraxacum Community 885 19 15.78 21.05 5.26 26.31 42.98 - -
10 Pinus-Themeda Community 925 14 7.14 14.28 14.28 21.42 18.70 - 7.74
Total 155
Average 21.93 24.51 7.09 20.00 18.70 0.00 7.74
Key: Megaphenerophytes (MP), Nanophenerophytes (NP), Hemicryptophytes (H), Therophytes (Th), Chamaephytes (Ch), Geophytes (G), Liana (L)
B. Leaf spectra
1. Pinus roxburghii Community: This community comprised of 17 species out of which Leptophylls and Nanophylls had equal share of 41.17% each, while Microphylls and Mesophylls were 13.33% and 6.66% respectively, (Table 2). 2. Acacia-Themeda Community: Acacia-Themeda Community consisted of 15 species out of which Leptophylls were dominant with 46.66% while Nanophylls, Microphylls and Mesophylls were 33.33%, 13.33%, 6.66%, respectively (Table 2). 3. Themeda-Ficus-Mallotus Community: There were 43.75% Nanophylls, 25% were Mesophylls, 18.75% were Leptophylls and 12.5% were Microphylls. Nanophylls were the dominant plants of the community (Table 2). 4. Themeda-Carissa Community: This community comprised of 15 species out of which 46.66% were
Nanophylls. Microphylls and Mesophylls have equal share of 13.33% each while Leptophyll were 26.66% (Table 2). 5. Themeda-Dalbergia-Carissa Community: Themeda-Dalbergia-Carissa Community consisted of 13 species. Out of 13 species Leptophylls and Nanophylls had equal share of 38.46% each, while Microphylls and Mesophylls were 15.83% and 7.69%, respectively. Leptophylls and Nanophylls were collectively dominant species (Table 2). 6. Myrsine-Carissa-Themeda Community: This community was found at an elevation of 815m. Leptophylls and Nanophylls had equal share of 40% each, while Microphylls and Mesophyll were 13.33% and 6.66%, respectively. Leptophylls and Nanophylls were collectively dominant species (Table 2).

132 S. HUSSAIN ET AL BIOLOGIA (PAKISTAN)
7. Themeda-Carissa-Mallotus Community: Out of 18 species Leptophyll were 44.44%, Nanophylls and Microphylls had equal share of 22.22% respectively while Mesophylls were 11.11%. Leptophylls were dominant (Table 2). 8. Themeda-Dodonaea-Pinus Community: This Community was recorded at an altitude of 860m out of 13 species Leptophylls and Nanophylls had equal share of 38.46% each while Microphylls were 23.07% (Table 2). 9. Olea-Taraxacum Community: Olea-Taraxacum Community consisted of 19 species. Leptophylls
were 57.89%, Nanophylls 31.57% while Microphylls and Mesophylls had equal share of 5.26% each. Leptophylls were the dominant species of the community (Table 2). 10. Pinus-Themeda Community: This community comprised of 14 species, out of which 64.28% were Leptophylls, while Nanophylls and Microphylls were 21.42% and 14.28%, respectively. Leptophyllous species were dominant (Table 2). As a whole Leptophylls were the dominant species of the investigated area followed by the Nanophylls, Microphylls and Mesophylls.
Nanophanerophytes, Hemicryptophytes and Therophytess were recorded to be high. According to Cain & Castro (1959) and Shimwell (1971) Hemicryptophytes are characteristic of temperate region and Therophytes are characteristic of desert climate. The study area had dry subtropical climate, which clearly indicated the important feature of climate having the high percentage of Nanophanerophytes, Hemicryptophytes and Therophytes.
Phanerophytes decrease gradually from lower elevation to higher. Therophytes decrease from the base 710m to 795m and then start increasing from 815m to 925m. Hemicryptophytes are the indicator of degraded vegetation where as Therophytes are the indicator of unfavorable environment. Cain (1950) stated that the Therophytes developed especially in an area where natural vegetation had been disturbed.
Since the climate of the area is dry, subtropical and degraded, high representation of Nanophanerophytes and Therophytes occur. Similarly, Hemicryptophytes habits have the prevailing type in the grazing pasture. The present study support the concept of Cain (1950) that dry
climate, overgrazing and trampling tend to increase the percentage of Hemicryptophytic and Therophytic slowly with the introduction of grasses and forbs. The relative deficiency of Chamaephytes is because these plants are more commonly found in cold region of higher altitudes.
As regard the leaf size spectra, Leptophylls and Nanophylls were the dominant which are the characteristic of hot desserts. Leptophylls decreases from 710m to 770m and then start increasing from 815m to 925m. Nanophylls increasing in first six communities while declining in last four communities. The investigated area is dry hence normally leptophylls and nanophylls would be dominant due to small leaves prevailing in almost all communities. The study area had low moisture and low organic matter with basic pH that is why Leptophylls and Nanophylls became dominant. Species diversity of the area is the reflection of different factors, such as deforestation, overgrazing and erosion. From the investigation of that area it was concluded the if the forest remain protected for about 50 years or more the natural vegetation of the area might be recovered.
Table 2: Leaf Spectra of Plant Communities recorded from India Morr District Kotli, AJK.
S.# Communities Height
(m) Total
species L % N % Mi % Me %
1 Pinus roxburghii Community 710 17 41.17 41.17 5.88 11.76 2 Acacia-Themeda Community 735 15 46.66 33.33 13.33 6.66 3 Themeda-Ficus-Mallotus Community 755 16 18.75 43.75 12.50 25.00 4 Themeda-Carissa Community 770 15 26.66 46.66 13.33 13.33
5 Themeda-Dalbergia-Carissa Community 795 13 38.46 38.46 15.38 7.69
6 Myrsine-Carissa-Themeda Community 815 15 40.00 40.00 13.33 6.66 7 Themeda-Carissa-Mallotus Community 835 18 44.44 22.22 22.22 6.66 8 Themeda-Dodonaea-Pinus Community 860 13 38.46 38.46 23.07 0.00 9 Olea-Taraxacum Community 885 19 57.89 31.57 5.26 5.26 10 Pinus-Themeda Community 925 14 64.28 21.42 14.28 0.00 Total 155 Average 41.93 35.48 13.54 9.03
Key: Leptophylls (L), Nanophylls (N). Microphylls (Mi), Megaphylls (Me)

VOL. 60 (1) LIFE FORM AND LEAF SPECTRA 133
REFERENCES
Ajaib, M., Khan, Z., Khan, N. & Wahab, M., 2010.
Ethnobotanical Studies on useful Shrubs of District Kotli, Azad Jammu & Kashmir, Pakistan. Pak. J. Bot., 42(3):1407-1415.
Ajaib, M., Khan, Z., Muhammad, S. & Mahmood, R., 2008. Biological Spectra of Saney Baney Hills District Kotli Azad Jammu & Kashmir. Pak. J. Science, 60(1-2): 53-58.
Anonymous, 2012. Rain fall, Humidity, Temperature of District Kotli. Pakistan Meteorological Department Jail Road Lahore, Pakistan.
Cain, S. A. & Castro, G.M.D., 1959. Manual of vegetation analysis. Harper and Brother, Pub. New York. 355pp.
Cain, S.A., 1950. Life forms and phytoclimates. Bot. Rev., 16: 1-32.
Danin, A. & Orshan, G., 1990. Desert rocks as plant refugia in the near east. The Bot. Rev., 35:93-170.
Malik, N. Z., Hussain, F. & Malik, Z. H., 2007. Life form and leaf size spectra of plant communities harboring at Ganga Chotti and Bedorii hills. Int. j. Agri. Bio., 15(6): 833-838.
Meher-Homji, V.M., 1981. Environmental implication of life-form spectra from India. J. eco. & Tax. Bot., 2: 23-30.
Muller, D. B. & Ellenberg, H., 1974. Aims and Methods of Vegetational Ecology. John Wiley and Sons, New York. 547pp.
Nazir, A., Malik, R. N. & Ajaib, M., 2012. Phytosociological Studies of the vegetation of Sarsawa Hills District Kotli, Azad Jammu & Kashmir. Biologia (Pakistan), 58 (1&2), 123-133.
Raunkiaer, C., 1934. The Life Form of Plants and Statistical Plants Geography. Clarendon Press Oxford. 623pp.
Sarmiento, G. & Monasterio, M., 1983. Life form and phenology, F. Bourliere (ed.) In: Ecosystem World; Tropical Savannas, Elsevier, Amsterdam. pp: 79-108.
Shimwell, D. W., 1971. The description and Classification of Vegetation. Sedgwick & Jackson, London. 332pp.
Yemani, M. & Sher, H., 2010. Biological spectrum with some other ecological attributes of the flora and vegetation of the Asir Mountain of South West, Saudi Arabia. A. J. Biotec., 9(34): 5550-5559.
BIOLOGIA (PAKISTAN) 2014, 60 (1), 135-138 PKISSN 0006 – 3096 (Print) ISSN 2313 – 206X (On-Line)
*Corresponding author: [email protected]
Histological comparison of natural lung injury in Rattus norvegicus induced by a natural herb (Nerium oleander) and a known carcinogen (thioacetamide)
MUDDASIR HASSAN ABBASI1, SANA FATIMA2 AND *NADEEM SHEIKH3
1Department of Zoology, Govt. College of Science, Wahdat Road, Lahore
2University of Health Sciences, Lahore. 3Cell and Molecular Biology Lab, Department of Zoology, University of the Punjab, Lahore.
ABSTRACT
Plant extracts have extensively been studied to look for the treatment of various diseases but their
poisoning effects have also been reported. The current study was undertaken with the objective of comparing acute toxic effect of Thioacetamide (TAA), a proven toxicant and Nerium oleander (N. oleander), a herb reported to have multiple therapeutic properties including anti-inflammatory, antifungal, antibacterial and antioxidative effects using histological parameters. Animals in group A were treated with 10 ml/kg of aqueous decoction of leaves of the plant while 300mg/kg of TAA was administered in group B and control (Con.) did not receive any treatment (n=3). Histological alterations in the lungs were then studied after 6 hours of respective treatment. There was an onset of more or less similar destruction of the tissue in both the experimental groups. Disruption of bronchus mucosal folds and alveolar cells along with significant nodule like accumulation of macrophages and mononuclear cells around arteriole were noticed. These results indicated that use of ethno-medicines, like N. oleander caused similar histological alterations in lungs as that of known carcinogen TAA. Thus, application of N. oleander may pose a serious risk for health. Keywords. Lung, Nerium oleander, Thioacetamide.
____________________________________________________________________________________
INTRODUCTION
Plants are the largest source of herbal medicines worldwide and these have the potential to be both therapeutic and harmful but still masses of population rely on such remedies. Nerium oleander, (N. oleander), (Apocynaceae) an ornamental shrub commonly known as “Kaner”, has been used as a traditional medicine and is reputed to have wide spectrum of bioactivities including pharmaceutical products (Anvirzel), molluscicide, rodenticide and insecticides (Wang et al., 2000; Adome et al., 2004; Turan et al., 2006; Derwich et al., 2010). But poisoning action of this plant has also been reported with significant time-dependent cytotoxic effects in cattle, goat, man and other experimental animal models (Langford & Boor, 1996; Aslani & Rezakhani, 2000; Hughes et al., 2002; Smith et al., 2003; Barbosa et al., 2008; Abbasi et al., 2013b). Animals exposed to the plant are often found suddenly dead owing to cardiac dysfunction. Oral doses of N. oleander proved fatal to animals within 1 to 24 hours with clinical toxicosis (Aslani et al., 2007).
Thioacetamide (TAA) a proven carcinogen has been extensively reported to produce toxic effects in animals and is suitable for studying and comparing the histological alterations (Abbasi et al., 2013a).
The aim of this study was to compare acute toxic effect of TAA and N. oleander produced histological variations in lungs of albino rats and to find out whether the injury caused by TAA resembles with N. oleander induced injury.
MATERIALS AND METHODS
Animals Male wistar rats of about 200g body
weights, were kept in a well ventilated hygienic animal house under standard conditions with 12-h light/dark cycles and access to fresh water and food pellets ad libitum. All the animals were acclimatized for a period of 2 weeks before the experiment.
Plant Material Fresh leaves of N. oleander were collected
from Govt. College of Science (GCS), Lahore, Pakistan. The plant material was identified by comparing with the reference collection available in the Herbarium of GCS, Lahore, Pakistan and had been preserved in Department of Botany, GCS for further reference. Extraction protocol
Air-dried leaves were processed according to the method of Rashan et al., 2011, with modifications. Briefly, the leaves decoction was

136 M. HUSSAN ET AL BIOLOGIA (PAKISTAN)
prepared by boiling in 0.9 % NaCl solution (1:1, w/v) for 3h by steam distillation. The decoction was filtered and used for the experimental animals.
Experimental design The rats were grouped into three viz. A, B
and control (Con.) (n=3); A: was injected intramuscularly (i.m) with 10 ml/kg of N. oleander leaves decoction, B: 300mg/kg of TAA was administered intraperitoneally (i.p) and Con. did not receive any treatment. After 6h of administration, all the animals were anesthetized with i.p injection of ketamine–distilled water mixture (1:1).
Tissue Sampling and Histological Examination Lungs of all the animals were excised, immediately after sacrifice, rinsed with physiological sodium saline and portion was fixed in 10% formalin for histological studies. The fixed tissue specimens were sectioned by standard methods and stained with Hematoxylin and Eosin (H & E) for detecting the degree of damage.
Microscopic Analyses To assess organ damage, microscopic
images were captured using a trinocular IRMECO-GmbH model 1M-910, 21493 Schwarzenbek/ Germany displayed on a computer via a Scope Tek® (scope photo 3.0).
RESULTS AND DISCUSSION The present study investigated the
histopathological changes in the lung tissues of Wistar rats that were treated with N. oleander leaves extract and TAA separately. Since lung is a target organ of many toxicants, an understanding of pulmonary architecture in health and disease is of paramount importance.
H&E stained lung sections of control group showed normal histological architecture; numerous clear alveoli (A) with thin inter-alveolar septa and alveolar sacs (AS). A bronchus (Br) with mucosal folds in a close proximity to blood vessel can also be seen in the section (Fig., 1).
Alterations in the pulmonary architecture were observed in group A with evident disruption of bronchus mucosal folds. Alveolar cells with extreme widening of lumen of the bronchiole and significant signs of vascular lesions were also noticed (Fig., 2).
Fig., 1: Hematoxylin–Eosin (H&E) staining of lung section of control (Con.; a= 100x &b=400x). The normal architecture of section showing numerous clear alveoli (A) and alveolar sacs (AS). Bronchus
(Br) with mucosal folds in a close proximity to blood vessel can also be seen in the section.
Fig., 2: Section of lung tissue stained with H&E
compared after 6h of N. oleander (A) and TAA (B) administration in wistar rats. Widening of lumen of
the bronchiole with significant signs of vascular lesions is evident in group A while massive cell
infiltration in sections of the TAA treated animals is shown by black arrow (x100).
The damage observed might be due to an
oxidative stress produced by toxicants, oleanderin and neriine, cardiac glycosides (cardenolides) which can be isolated from all parts of the N.oleander and are similar to the toxin in foxglove (Digitalis) (Al-Farwachi et al., 2008).These toxins may lead to an imbalance in the production/consumption level of reactive oxygen species (ROS).
There was an onset of more or less similar destruction of the tissue in group B with the damage of alveolar cells along with significant nodule like

VOL. 60 (1) HISTOLOGICAL COMPARISON OF NATURAL LUNG INJURY 137
accumulation of macrophages and mononuclear cells around arteriole (Fig., 2B). It may be explained that during inflammatory response, accumulation of macrophages occurs which ultimately release some chemotactic factors that attract neutrophils which is evident in the sections. Influx of inflammatory cells plays a major role in increasing the permeability of alveolar capillary barrier providing the cellular toxicity. Neutrophils together with other inflammatory cells must frequently found in the broncho-alveolar region in the current study. Sheikh & Javed, 2009 observed similar changes along with pulmonary edema in lung sections of swiss albino mice, exposed to 0.5% dilution of cypermethrin in an inhalation chamber. Similar histopathological changes in the sections of lungs were observed during Fenvalerate (Fen), a synthetic pyrethroid exposed rats with influx of mononuclear cells admixed with a few giant cells in alveolar lumen (Mani et al., 2001). More pronounced histological changes were noted in pesticide mixture inhaled rats for consecutive 28 days (Noaishi et al., 2013).
CONCLUSION
Taking into consideration these observations, it could be concluded that indiscriminate use of natural herbs for therapeutic purposes could lead to the tissue destruction with subsequent abnormality in function.
REFERENCES
Abbasi, M.H., Akhtar, T., Malik, I.A., Fatima, S., Khawar, B., Mujeeb, K.A., Mustafa, G., Hussain, S., Iqbal, J. & Sheikh, N., 2013a. Acute and Chronic Toxicity of Thioacteamide and Alterations in Blood Cell Indices in Rats. J. Cancer Therap.., 4:251-259.
Abbasi, M.H., Fatima, S., Naz, N., Malik, I.A. & Sheikh, N., 2013b. Effect of Nerium oleander (NO) Leaves Extract on Serum hepcidin, Total Iron, and Infiltration of ED1 Positive Cells in Albino Rat. BioMed. Res. Int.., 2013:1-8.
Adome, R.O., Gachihi, J.W., Onegi, B., Tamale, J. & Apio, S.O., 2004. The cardiotonic effect of the crude ethanolic extract of Nerium oleander in the isolated guinea pig hearts. Afr. Health Sci.., 3: 77-82.
Al-Farwachi, M.I., Rhaymah, M.S. & Al-Badrani, B.A., 2008. Acute toxicity of Nerium
oleander aqueous leaf extract in rabbits. Iraqi J. Vet. Sci.., 22: 1-4.
Aslani, M.R., Movassaghi, A.R., Janati-Pirouz, H. & Karazma, M., 2007. Experimental oleander (Nerium oleander) poisoning in goats: a clinical and pathological study. Iran J. Vet. Res., 8: 58-63.
Aslani, M.R. & Rezakhani, A., 2000. A case report of oleander (Nerium oleander) intoxication in cattle. Int. J. Trop. Agri.., 18: 185-187.
Barbosa, R.R., Fontenele-Neto, J.D. & Soto-Blanco, B., 2008. Toxicity in goats caused by oleander (Nerium oleander). Res. Vet. Sci.., 85: 279-281.
Derwich, E., Benziane, Z. & Boukir, A., 2010. Antibacterial activity and chemical composition of the essential oil from flowers of Nerium oleander. Elec. J. Env., Agricult.Food Chem.., 9: 1074-1084.
Hughes, K.J., Dart, A.J. & Hodgson, D.R., 2002. Suspected Nerium oleander (Oleander) poisoning in a horse. Aust. vet. j.., 80: 412-415.
Langford, S.D. & Boor, P.J., 1996. Oleander toxicity: an examination of human and animal toxic exposures. Toxicol.., 109: 1-13.
Mani, U., Islam, F., Prasad, A.K., Kumar, P., Maji, B.K.& Dutta, K.K., 2001. Pulmonary toxicity of a formulated preparation of fenvalerate in rats subchronically exposed by nose only inhalation for 90 days. Biomed.& Environ. Sci., 14(4):333-40.
Noaishi, M. A., Afify, M. M. M. & Abd Allah, A. A., 2013. Study of inhalation exposure effect of pesticide mixture in white rat. Nat. & Sci. 11 (7): 45-54.
Rashan, L.J., Franke, K., Khine, M.M., Kelter, G., Fiebig, H.H., Neumann, J. & Wessjohann, L.A., 2011. Characterization of the anticancer properties of monoglycosidic cardenolides isolated from Nerium oleander and Streptocaulon tomentosum. J. Ethnopharmacol.., 134: 781-788.
Sheikh, N. & Javed, S., 2009. Histological study of the liver and lung tissues of pyrethroid exposed mice. Z. Gastroenterol.., 47: 2-35.
Smith, P.A., Aldridge, B.M. & Kittleson, M.D., 2003. Oleander toxicosis in a donkey. J. vet. intern. med.., 17: 111-114.
Turan, N., Akgun-Dar, K., Kuruca, S.E., Kilicaslan-Ayna, T., Seyhan, V.G., Atasever, B., Merili, F. & Carin, M., 2006. Cytotoxic effects of leaf, stem and root extracts of Nerium oleander on leukemia cell lines and role of

138 M. HUSSAN ET AL BIOLOGIA (PAKISTAN)
the p-glycoprotein in this effect. J Exp Ther Oncol., 6: 31-38.
Wang, X., Plomley, J.B., Newman, R.A. & Cisneros, A., 2000. LC/MS/MS Analyses of an Oleander Extract for Cancer Treatment. Anal. Chem.., 72: 3547-3552.

BIOLOGIA (PAKISTAN) 2014, 60 (1), 139-142 PKISSN 0006 – 3096 (Print) ISSN 2313 – 206X (On-Line)
*Corresponding author: [email protected]
Effect of Carica papaya leaf formulation on Hematology and Serology of normal rat
*NADEEM SHEIKH1, NEELAM YOUNAS1 & TASLEEM AKHTAR1
Department of Zoology, University of the Punjab, Q-A Campus, Lahore,
ABSTRACT
Thrombocytopenia is a disorder in which there is a thrombocyte count of less than 150×10³/µL.
Thrombocytopenia is life threatening in many diseases particularly in dengue which is an escalating problem in the world. There was an outbreak of dengue in 2011 in Lahore, Pakistan and it was public opinion that Carica papaya leaf extract helps in recovery of platelet count. The aim of present study was to investigate the effect of Carica papaya leaf extract on blood chemistry specifically thrombocyte count of rats. Local syrup of papaya leaf extract was used for experimentation. Six animals were used for experiment, 3 as control and 3 experimental. The dose given to experimental animals was 0.5 ml of papaya leaf extract for 7 consecutive days which were at fasting for 4 hours before dose administration. There was a significant increase in mean platelet count, Mean Cell Haemoglobin (MCH) and Mean Corpuscular Volume (MCV) (p<0.05) of the treated animals as compared to control after seven days treatment with Carica papaya (CP) leaf formulations. The results described the need for isolation and identification of the C. papaya substances responsible for the release and/or production of thrombocytes. From the experimentation it can be concluded that C. papaya leaf extract is associated with rapid increase of platelet count. Keywords: Carica papaya, MCH; MCV;
_______________________________________________________________________________________ .
INTRODUCTION
Thrombocytopenia is a disorder with platelet count of less than 150×10³/µL. It is the most common cause of defective primary hemostasis that can lead to significant bleeding (Consolini, 2011). As platelet counts are above 20,000/µL, clinical symptoms are often limited to easy bruising; however, below 10,000/µL, the risk of spontaneous mucocutaneous bleeding increases rapidly. Significant quantitative or qualitative platelet dysfunction causes mucocutaneous bleeding (Sekhon & Roy, 2006). Thrombocytopenia stimulates thrombopoiesis, presumably due to thrombopoietin as a result of increased proportion of large young platelets in the peripheral circulation (George & Terrell, 2008). The most common causes of thrombocytopenia are; defective production of platelets by the bone marrow, diminished platelet survival and sequestration of the platelets by the spleen, leptospirosis associated with platelet destruction and bone marrow suppression and sepsis. A combination of above facts also can lead to thrombocytopenia (Li et al., 2001; Rothman & Ennis, 1999; Sheu et al., 2000;Wong & Glader, 2004).
Plants have the main advantage of still being the most effective and cheaper alternate source of drugs. In addition to the nutritional value
of its fruit, the leaves of Carica papaya (CP) possess medicinal properties and are frequently used in traditional medicines. The antifertility effects of CP seeds in rats and rabbits have been investigated (Lohiya et al., 1994; Lohiya et al., 2000). The leaves of papaya have been shown to contain many active components such as papain, chymopapain, cystatin, tocopherol, ascorbic acid, flavonoids, cyanogenic-glucosides and glucosinolates that can increase the total antioxidant activity in blood and reduce lipid peroxidation level (Otsuki et al., 2010). The alkaloids, flavonoids, saponins, tannin, and glycosides are related with anti-inflammatory activity. CP leaf extract was also found to have antibacterial effect (Romasi & Karina, 2011), antitumor, and immunomodulator activities (Otsuki et al., 2010).
The leaves also contain cardiac glycosides, anthraquinones, carpaine, pseudocarpaine, phenolic compounds (Owoyele et al., 2008; Zunjar et al., 2011). The contraceptive of CP leaves had been contributed by increased oxidative stress either due to increased free radical release or the decreased antioxidant defense system as well as an associated derangement of protein content of the testes (Kusemiju et al., 2012). An increase in platelet count in mice was reported by Sathasivam et al. (2009). Ahmad et al. (2011) reported that a 45 years old man with dengue fever got increase

140 N. SHEIKH ET AL BIOLOGIA (PAKISTAN) in platelet, leucocyte, and neutrophil count after oral intake of 25 ml water extract of CP twice daily for 5 consecutive days, compared with before treatment. The use of CP for dengue fever patient in Sri lanka had shown increased platelet and leucocyte count of 12 patients in 24 hours after administration of 5 ml CP leaf extract twice daily (Hettige, 2008).
Thrombocytopenia is life threatening in many diseases particularly in dengue which is an escalating problem in the world. Of the available methods for treating thrombocytopenia, the treatment method mainly depends on the disease severity. Nevertheless, due to certain side effects and the costs involved, the availability of treatment for thrombocytopenia is limited. Present work was done to investigate the effect of leaf extract of Carica papaya on hematology and serology of Wistar rats specifically on Thrombocyte count.
MATERIALS AND METHODS
Materials
Commercially available syrup of CP leaves was used for current study. The study was carried out during November 2011 to June 2012. Experimental Animals
Colony of the Wistar Rats was reared in the animal house of Department of Zoology, University of the Punjab, Lahore-Pakistan. The animals were kept in fully aerated room at room temperature (RT) 23-24°C and maintained with ad libitum access to water and food. All experiments were approved by the institutional animal care and use committee.
Effect of Carica papaya Leaf extract on Blood chemistry
Six Wistar rats were divided in two groups. Three animals were used as control and three as experimental. The dose given to the experimental animals was 0.5 ml of papaya leaf extract when their weight was 150±25 for 7 consecutive days which were at fasting for 4 hours before dose administration. The animals were kept under constant observation to study their behavior. After 7 days blood was collected. Hematological (CBC) and serological (LFT, LP) analysis were performed in the Clinical Health Center Laboratory of the University of the Punjab.
Statistical analysis
The data was presented in terms of mean and SEM, analyzed by descriptive and analytical (student t test) statistics, and P value of less than 0.05 was considered statistically significant. All analyses were made using Graph Pad Prism (version 5.00).
RESULTS Complete Blood Count (CBC)
The observations made during the study were quite interesting. The mean total platelet count, MCH and MCV of rats treated with CP leaf formulation were significantly higher (780.00±14.05), (15.2±0.12), and (47.27±0.18) as compared to control receiving distilled water (637.00±40.93), (41.80±1.15), (14.2±0.31) respectively. There was a non-significant (p> 0.05) increase in the WBC, hemoglobin (HGB) and hematocrit (HCT) recorded for rats in the test groups relative to that observed in the control group (Table 1).
Table 1. Effect of oral administration of Carica papaya leaf extract on hematology and serology of rat.
Complete blood count Liver function test
Parameters Mean ± SEM Parameters Mean ± SEM Control Treatment Control Treatment PLT(×109/l) 637.00±40.93 780.00±14.05* Bilirubin (mg/dl) 0.41±0.01 0.43±0.03 MCV (fl) 41.80±1.15 47.27±0.18* ALT (u/ml) 37.67±1.20 30.50±2.50 MCH(pg) 14.2±0.31 15.2±0.12* ALP (u/l) 58.67±4.41 194.00±4.36*** RBC(×1012/l) 7.26±0.51 7.15±0.31 Lipid Profile WBC(×109/l) 5.13±0.84 7.10±1.01 Cholesterol
(mg/dl) 82.33±4.33 119.67±2.67**
HCT % 30.37±2.07 33.80±1.53 Triglycerides (mg/dl)
63.00±4.98 65.33±2.85
HGB (g/dl) 12.83±0.92 13.43±0.62 V.L.D.L (mg/dl) 18.33±1.76 10.33±.33* Values are expressed as mean ± standard error of mean. PLT; platelet count, MCV; Mean Corpuscular Volume, MCH; Mean Cell Haemoglobin, RBC; Red Blood Cell, WBC; White Blood Cell, HCT; Hematocrit, HGB; Haemoglobin, ALP; Alkaline Phosphatase, ALT; Alanine Amino-transferase , *p & **p value less than 0.05, (p < 0.05) significant value, ***p value significant (p<0.0001).

VOL. 60 (1) EFFECT OF CARICA PAPAYA LEAF FORMULATION ON HEMATOLOGY AND SEROLOGY 141
Effect of C. papaya leaf extract on Liver function test
Serum activity of ALK-Phosphatase, biomarker of liver toxicity was significantly elevated in treated group (194.00±4.36 U/L) when compared to control (58.67±4.41U/L) (p< 0.0001) (Table 1), while other two markers of liver toxicity, bilirubin and ALT had non-significant rise 0.43±0.03, 30.50±2.50 as compared to controls 0.41±0.01, 37.67±1.20 respectively (Table 1). Effect of C. papaya leaf extract on Lipid profile
Serum cholesterol and Very low density lipids (V.L.D.L) in CP leaf extract treated rats showed a significant rise (119.67±2.67), (10.33±.33) in comparison to control (82.33±4.33), (18.33±1.76), respectively (Table 1). There was a slight increase observed in triglycerides (65.33±2.85) compared with control (63.00±4.98) but this increase was non-significant (p>0.05) (Table1).
DISCUSSION
Herbal medicines are used because of the
fact that plants contain natural ingredients that can promote health and alleviate illness (Komal et al., 2010). They make an enormous contribution to primary health care and have shown great potential in modern phytomedicine against numerous infirmities and the complex diseases and ailments of the modern world. There will always be risks when appropriate regulations do not handle the appropriate formulation of the remedies or when self-medication fosters abuse (Mukesh et al., 2010).
The CP leaf extract was well tolerated by rats showing no overt signs of stress, aversive behavior or behavioral changes. Previous observations have shown no adverse effects or mortality under acute toxic condition due to orally administered CP leaf extract at 2000 mg/kg body weight (Afzan et al., 2012). Present study showed statistically significant rise in the mean Thrombocyte count values of rats after oral administration of Carica papaya leaf extract relative to the rats in the control group receiving distilled water. Mean MCV, and MCH values also increased. These results are in agreement with previous observations of increase in platelet count after treatment with leaf extract of Carica papaya. CP leaf extract has been found to accelerate the increase in platelet count, and shortened the hospitalization period (Yunita et al., 2012). A significant increase in the platelet counts has been observed after oral administration of freshly prepared, mature leaf concentrate of C. papaya. Both mature and immature leaves of C. papaya, have the potential to be developed as a plant based therapeutic agent for thrombocytopenia
(Gammulle et al.,, 2012). Juice consumption during the course of dengue infection had the potential to induce the rapid production of platelets (Subenthiran et al., 2013).
Liver function test to explore the hepatotoxicity had shown a significant rise in ALK-Phosphatase activity which indicated some kind of abnormality in bile duct. Level of cholesterol and very low density lipids were also increased significantly, which had an associated risk for cardiovascular disease. One previous study had described safety for oral consumption of CP leaf extract over a period of 3 days without hepatotoxicity, renal toxicity, haematotoxicity and neurotoxicity. Hepatotoxicity in present experiment might be due to administration of dose for longer period of time although dose used in the experiment (0.5ml) was lower than used in other experiment (0.72ml/100g) (Gammulle et al., 2012).
The platelet increasing effect after 7 days oral adminsteration of the CP leaf extract was evident from the present study that illustrated an exact mechanism of Thrombocyte formation from megakaryocyte as under normal healthy body conditions, platelets are produced from megakaryocytes within 4 to 6 days (Choi et al., 1995). From this it could be concluded that increased platelet production may be due to megakarypoietic stimulatory activity.
Increased platelet production by C. papaya leaf extract might be due to Vitamin C present in CP leaf (Nwofia & Ojimelukwe, 2012). Vitamin C is a powerful antioxidant and high doses of it might prevent free-radical mediated damage of the platelets (Olas & Wachowicz, 2002).
It can be concluded from the present study that Carica papaya leaf extract might be associated with the increase of thrombocyte count but consumption for longer period could cause hepatotoxicity and risk for cardiovascular disease.
REFERENCES
Afzan, A., Abdullah, N.R., Halim, S.Z., Rashid, B.A.,
Semail, R.H., Abdullah, N., Jantan, I., Muhammad, H., & Ismail, Z., 2012. Repeated dose 28-days oral toxicity study of Carica papaya L. leaf extract in Sprague Dawley rats. Molecules., 17 (4): 4326-4342.
Ahmad, N., Fazal, H., Ayaz, M., Abbasi, B.H., Mohammad, I., & Fazal, L. 2011. Dengue fever treatment with Carica papaya leaves extracts. Asian Pac. J. Trop. Biomed., 1 (4): 330-333.
Choi, E.S., Nichol, J.L., Hokom, M.M., Hornkohl, A.C., & Hunt, P., 1995. Platelets generated
142 N. SHEIKH ET AL BIOLOGIA (PAKISTAN)
in vitro from proplatelet-displaying human megakaryocytes are functional. Blood, 85(2):402-413.
Consolini, D.M., 2011. Thrombocytopenia in Infants and Children. Pediatr. Rev., 32(4):135-151
Gammulle A., Ratnasooriya W.D., Jayakody J.R.A.C., Fernando C., Kanatiwela C., & Udagama P.V., 2012. Thrombocytosis and Anti-inflammatory Properties, and Toxicological Evaluation of Carica papaya Mature Leaf Concentrate in a Murine Model. Online Int. J. Med. Plants Res., 1(2):21-30.
George, J.N. & Terrell, D.R., 2008. Novel thrombopoietic agents: a new era for management of patients with thrombocytopenia. Haematologica, 93(10):1445-1449.
Hettige, S., 2008. Salutary Effect of Carica papayaleaf extract in dengue fever patients- a pilot study. Sri Lankan Family Physician, 29: 17-19
Komal, M., Khadabadi, S.S., Deokate, U.A., & Deore, S.L., 2010. Caesalpinia bonducella FGÇôAn Overview. Report and Opin., 2(3):83-90
Kusemiju, T.O., Yama, O.E., &, & kanlawon, A.O., 2012. Effect ofCarica papayabark extract on oxidative stress parameters in testes of male albino mice. Int. J. Appl. Res. in Nat. Prod., 4(4):1-6.
Li, J., Yang, C., Xia, Y., Bertino, A., Glaspy, J., Roberts, M., & Kuter, D.J., 2001. Thrombocytopenia caused by the development of antibodies to thrombopoietin. Blood, 98(12):3241-3248.
Lohiya, N.K., Goyal, R.B., Jayaprakash, D., Ansari, A.S., & Sharma, S.. 1994. Antifertility Effects of Aqueous Extract of Carica papaya Seeds in Male Rats. Planta Med., 60(05):400-404.
Lohiya, N.K., Pathak, N., Mishra, P.K., & Manivannan, B., 2000. Contraceptive evaluation and toxicological study of aqueous extract of the seeds of Carica papaya in male rabbits. J. Ethnopharmacol., 70(1):17-27.
Mukesh, K.S., Kushagra, N., & Tripathi1, D.K., 2010. Potential Analgesic & Anti-Pyretic Herbal drugs: A Comparative Review of Marketed Products. Int. J. Phytomed., 2:197-209.
Nwofia, G.M. & Ojimelukwe, P., 2012. Variability in proximate, mineral and vitamin contents of Carica papaya (L.) leaves, fruit pulp and seeds. Int. J. Med. Arom. Plants., 2 (1): 90-96
Olas, B. & Wachowicz, B., 2002. Resveratrol and vitamin C as antioxidants in blood platelets. Thromb. Res., 106(2):143-148.
Otsuki, N., Dang, N.H., Kumagai, E., Kondo, A., Iwata, S., & Morimoto, C., 2010. Aqueous extract of Carica papaya leaves exhibits anti-tumor activity and immunomodulatory effects. J. Ethnopharmacol., 127(3):760-767.
Owoyele, B., Adebukola, O., Funmilayo, A., & Soladoye, A., 2008. Anti-inflammatory activities of ethanolic extract of Carica papaya leaves. Inflammopharmacol, 16(4):168-173.
Romasi, E.F., Karina, J. & Parhusip, A.J.N. 2011. Antibacterial activity of papaya leaf extracts against pathogenic bacteria. MakaraTeknologi, 15(2):173-177.
Rothman, A.L. & Ennis, F.A., 1999. Immunopathogenesis of Dengue Hemorrhagic Fever. Virol., 257(1):1-6.
Sathasivam, K., Ramanathan, S., Mansor, S.M., Haris, M.R., & Wernsdorfer, W.H., 2009. Thrombocyte counts in mice after the administration of papaya leaf suspension. Wien Klin Wochenschr, 121(3):19-22.
Sekhon, S.S. & Roy, V., 2006. Thrombocytopenia in Adults: A Practical Approach to Evaluation and Management. South. Med. J., 99(5): 491-8
Sheu J.R., Lee C.R., Lin C.H., Hsiao G, Ko W.C., Chen Y.C., & Yen M.H.,2000. Mechanisms involved in the antiplatelet activity of Staphylococcus aureus lipoteichoic acid in human platelets. J. Thromb. Haemost., 83(5):777-784.
Subenthiran, S., Choon, T.C., Thayan, R., Teck, M.K., Muniandy, P.K., Afzan, A., & Ismail, Z., 2013. Carica papaya leaves juice significantly accelerates the rate of increase in platelet count among patients with dengue fever and dengue haemorrhagic fever. Evid. -Based Complement. Alternat. Med., 2013:1-7.
Wong, W. & Glader, B., 2004. Approach to the Newborn Who Has Thrombocytopenia. NeoReviews, 5: (10): e444-e450.
Yunita, F., Endang, H., & Jusuf, K., 2012. The effect of Carica papaya L. leaves extract capsules on platelets count and hematocrit level in dengue fever patient. Int. J. Med. Arom. Plants, 2(4):573-578.
Zunjar, V., Mammen, D., Trivedi, B.M., & Daniel, M., 2011. Pharmacognostic, physicochemical and phytochemical studies on Carica papaya Linn. leaves. Pharmacog. J., 3:5-8.

BIOLOGIA (PAKISTAN) 2014, 60 (1), 143-148 PKISSN 0006 – 3096 (Print) ISSN 2313 – 206X (On-Line)
*Corresponding author: [email protected]; [email protected];
Epiphytic Bacteria as Indicators of Nosocomial Infections
JAVED IQBAL QAZI1 & *MEHWISH IQTEDAR2
1Environmental Microbiology Lab., Department of Zoology, University of the Punjab, Lahore. 2Department of Biotechnology, Lahore College for Women University, Lahore.
ABSTRACT
Microbial picture of a given atmosphere reflects microorganisms of local origin as well as those brought
about by air currents from other areas. In the present study leaves of the tree Melia azedarach were directly imprinted on nutrient, eosin methylene blue (EMB) and mannitol salt phenol red agar media. Direct surface contact and spread plate method were used to enumerate the microbial count. Upper surfaces of the leaves expressed in general higher bacterial colony forming units (C.F.U.) than those obtained from their lower surfaces. Estimates of C.F.U. as well as bacterial species’ diversity varied for a given sample processed by the two methods. In general, the leaves from hospitals of the city indicated more diversity of coliforms and Staphylococcus aureus as compared to the situation found for Quaid-e-Azam campus, University of the Punjab, Lahore. Direct leaf imprints of samples from Sir Ganga ram hospital, expressed five isolates each of Staphylococcus and coliforms species, respectively. While for the Quaid-e-Azam campus, the corresponding figures were three and two. Similar trend appeared with dilution spread method where higher frequencies of haemolytic and antibiotic resistant bacterial isolates appeared from the Sheikh Zaid hospital as compared to those isolated from the University campus area and are thus indicative of nosocomial infectious spread, in the hospitals’ environments. The present survey indicates that the microbial fallout and its deposition upon the surfaces occur at high frequencies in hospital environments than the far situated areas. Keywords: Atmospheric bacterial C.F.U., epiphytic coliform, epiphytic Staphylococcus aureus.
_______________________________________________________________________________________
INTRODUCTION
Atmospheres of big cities carries suspended particulate matter (SPM) of varying nature. Amounts of SPM are different in different locations of a city and depend upon a number of factors; industrial activities, traffic load, wind and plantation etc. SMP is involved in harbouring different types of airborne microorganisms and is also responsible for their dispersal (Pelczar et al., 1986). Atmosphere of Lahore city is heavily loaded with SPM, where amount and size of particles have been found in co-relation with the bacteria they harbour (Qazi et al., 2002, Qazi & Yasin, 2003, Qazi & Tahir, 2005). Due to highly mobile nature of atmosphere, the bacterial profile obtained from direct air sampling may not necessarily be indicative of their origin(s) concerning a particular locality. Surfaces of leaves of trees of an area, however, may harbour high percentage of bacteria originated from their surrounding environment(s). This paper reports bacterial count following inoculants from surface(s) of leaves of Melia azedarach on nutrient, EMB and mannitol salt agar media. The leaves were collected from lawns of Jinnah, Sir Ganga ram, Mayo and Sheikh Zahid Hospitals as well as one kilometer far from the latter hospital within Quaid-e-Azam Campus, University of the Punjab, Lahore.
The bacterial isolates were also assessed for the antibiotic sensitivity pattern and haemolytic nature.
MATERIALS AND METHODS
Collection of Samples Five locations within the city of Lahore,
namely the Quaid-e-azam campus, University of the Punjab, Sheikh Zaid, Jinnah, Sir Ganga ram and Mayo hospitals were selected for the sampling. From each of the localities; four (5x2 cm sized) leaves of Melia azedarach (Neem) from a height of 6.5 feet were taken aseptically and placed in separate sterilized glass containers. The samples were immediately transported to the laboratory and processed for plate count and direct surface contact methods employing nutrient, EMB and mannitol salt agar media. Plate count method
One of leaf of a sample was processed for spread plate bacterial counting, as described by Pelczar et al. (1986) & Benson (1994). The leaf was allowed to remain immersed in 100 ml of autoclaved water for 20 minutes on a shaker at 100 rpm. Two dilutions were made by mixing one ml of a previous suspension with 99 ml of sterile water. From each dilution 0.1 and 0.5 ml were spread onto nutrient, EMB and mannitol salt agar plates. Inoculated plates were incubated at 37˚C for 48 hrs. Colony

144 J. I. QAZI & M. IQTEDAR BIOLOGIA (PAKISTAN)
forming units (C.F.U.) were then counted and calibrated as per ml for a given dilution and as per cm2 of leaf’s surface area, taking into account upper leaf surface area (ULSA) and lower leaf surface area (LLSA) together. Direct surface contact method
Three leaves of each sample were employed for direct surface contact method (DSCM). Each leaf’s dorsal side was applied on the surface of a given medium and the ventral side on a separate plate. For maximum contact of leaf surface on an agar plate, a centrally notched spreader was used to press the leaf. The notch was kept over the midrib of the leaf during passing it from proximal towards distal end of the leaf. After imprinting both sides of leaves, nutrient, EMB and mannitol salt agar plates were incubated at 37˚C for 48 hrs. C.F.U. were then counted as calibrated as per cm2 for a given leaf’s surface area. Antibiotic sensitivity and Haemolytic activity of the bacterial isolates
Some representative colonies were pure cultured and evaluated for their haemolytic activity and antibiotic susceptibility. Haemolytic activity of the isolates was determined as described by Collins (1995). Haemolysis was examined after 48 hrs. of aerobic growth at 37°C on blood agar base supplemented with 5% (v/v) sterile rabbit blood. Bacterial strains were tested for their antibiotic susceptibility by employing commercially available antibiotic discs (Oxide) for ampicillin, chloramphenicol, erythromycin, novobiocin, norfloxacin, rifampicillin, naladixic acid, bacitracin and vancomycin. Bacterial isolates were identified according to their phenotypic characteristics as described by Bergey & Holt (1994). Statistical Analysis
t-test, paired was applied to the data to compare the differences between the means of the values obtained for each microorganism sampled from two different locations. Significant difference was observed at P ≤ 0.05.
RESULTS AND DISCUSSION
Imprints of leaves of Melia azedarach collected from different locations of the city Lahore, and screened on nutrient, EMB and mannitol salt agar media that indicated higher C.F.U. value for
the upper leaf surface as compared to the lower leaf surface (Fig. 1). This trend clearly indicated atmospheric fall out source of the epiphytic viable bacterial content (Maron et al., 2005). There is also likelihood that the locally generated bacterial contaminations had been depositing on the tree leaves more frequently than the non-point sources (Mainelis et al., 2001). The study indicated higher C.F.U. /cm2 from the leaves (lower surface) taken from the hospitals locality as compared to the corresponding figures obtained for the University campus area on different media. This is an indication of infectious dust generated from within the hospitals environment.
Processing of imprints of the leaves collected from Quaid-e-azam campus, University of the Punjab, Lahore on nutrient agar revealed 36.36% and 63.63% viable bacterial counts for ULSA and LLSA, respectively. For Sheikh Zaid hospital, highest percentage of the C.F.U. / cm2 i.e., 69.56% was obtained among all the sampling areas for the ULSA. Similarly, for Jinnah hospital a percentage of 63.29 C.F.U. / cm2 was obtained for ULSA. While 60.71 and 45.79 % of microbial counts obtained were from ULSA of Sir Ganga ram and Mayo hospital, respectively (Table 1, Fig.,1).
0
20
40
60
80
100
120
NU
T
EM
B
MA
N
NU
T
EM
B
MA
N
NU
T
EM
B
MA
N
NU
T
EM
B
MA
N
NU
T
EM
B
MA
N
Campus Sheikh Zaid hospital
Jinnah hospital
Ganga ram hospital
Mayo hospital
% C
.F.U
.
Sampling areas and Medias
ULS
LLS
Fig.,1: Percent distribution of bacterial C.F.U from upper/(ULS) and lower collected from the different
localities and surfaces (LLS) of leaves of Melia azedarach applied on nutrient, (NUT) EMB and
mannitol salt (MAN) agar media

VOL. 60 (1) BACTERIA AS INDICATORS OF NOSOCOMIAL INFECTIONS 145
Table 1: Colony forming units (C.F.U.) of different bacteria isolated fromleaves surfaces of Melia azedarach, sampled from different areas, by direct surface contact and dilution spread plate method
on different media.
Sampling area
Medium of isolation & LSA(cm)2
Direct surface contact method Dilution(s) spread method %
distribution Bacterial isolates c.f.u/
cm2 Bacterial isolates
c.f.u/cm2
Campus
M 8.8(2.5)a S.aureus d S.aureus 0.68×10⁶ 17.6
S.epidermis d S.epidermis 32×106 81.9 Enterococcus d Proteus 0.16×10⁶ 0.4
E 2.1(2.5) Enterobacter d Salmonella 1.904
Fungal colonies 9.52 N 2.5(2.5)
Sheikh Zaid
Hospital
M 2.8(4.3) S.aureus 1.428 S.aureus 1.36×10⁶ 98.5 Proteus 0.357 S.epidermis 0.02×10⁶ 1.94
E2.3(4.3)
E.coli 0.434 Enterococcus 5.5×10⁶ 33.8 Fungal colonies 2.608 Bacillus 2.7×10⁶ 16.6
Enterobacter 5.3×10⁶ 33 Klebsiella 2.6×10⁶ 16.5
N 3.3(4.3)
Jinnah Hospital
M 8.0(4.2)
S.aureus 1.125 S.aureus 0.02×10⁶ 50 S.epidermis 0.625 S.epidermis 0.02×10⁶ 50
Enterococcus 0.125 Proteus 0.375
E 4.0(4.2)
Salmonella 2.75 Salmonella 0.011×10⁶ 2.03 Shigella 1 Shigella 0.11×10⁶ 96.1
Enterobacter 0.25×10⁶ 0.9 E.coli 12.0×10⁶ 0.9
N 4.0(4.2)
Sir Ganga Ram
Hospital
M 3.1(4.7)
Proteus 10.64 Proteus 0.20×10⁶ 1.47 S.epidermis 3.22 S.epidermis 6.7×10⁶ 49.26
S.aureus 4.19 S.aureus 6.7×10⁶ 49.26 E.coli 0.645
Enterococcus 0.645
E 4.8(4.7)
Salmonella 4.79 Salmonella d C E.coli 5.833 E.coli 43×106 C
Enterobacter 0.625 Enterobacter d C Shigella 0.416 Shigella d C
Klebsiella 0.416 Bacillus d C N 4.1(4.7)
Mayo Hospital
M 2.5(5.7)
S.epidermis 2 S.epidermis 0.77×10⁶ 0.65 E.coli 16.4 E.coli 0.014×10⁶ 0.65
S.aureus 20.4 S.aureus 1.54×10⁶ 65.79 Proteus 4.4 Proteus 0.014×10⁶ 32.89
Enterococcus 72.8
E 4.1(5.7)
Klebsiella 2.195 Bacillus 0.91×10⁶ 10.6 Enterobacter 1.707 E.coli 0.77×10⁶ 89.38 Salmonella 10
Shigella 1.707 N 2.7(5.7)

BIOLOGIA (PAKISTAN) 2014, 60 (1), 143-148 PKISSN 0006 – 3096 (Print) ISSN 2313 – 206X (On-Line)
*Corresponding author: [email protected]; [email protected];
The alphabet M, E and N indicates Mannitol salt phenol red agar, Eosin methylene blue and Nutrient agar, respectively. LSA: leaf surface area, ULSC: upper leaf surface count, LLSC: lower leaf surface count, a: the figure indicate the surface area of leaf and that in parenthesis shows the area of the leaf which was immersed in 100 ml of sterile water. C: for experiments expressing to too numerous to count (TNTC) % distribution was not worked out. d: the figure refers to too numerous to count colonies of a sample on a given medium, for the samples yielding TNTC total C.F.U. were not calculated.
Imprints on mannitol salt agar plates indicated too numerous to count (TNTC) bacterial colonies per cm2 for ULSA, while only 9 C.F.U./cm2 from LLSA of Quaid-e-azam campus. Imprints of leaf collected from Sheikh Zaid hospital expressed 5 C.F.U./cm2 for ULSA but none for LLSA. From Jinnah and Ganga Ram hospitals 37.5 and 47.61% C.F.U./cm2 of Staphylococcus sp. were obtained from ULSA, respectively, while 64.34 % from ULSA of Mayo hospital samples.
Processing of the sample collected from the University campus, on EMB agar expressed TNTC for ULSA and 2 C.F.U./cm2 for LLSA. Only one C.F.U./cm2 from ULSA and none from LLSA of Sheikh Zaid hospital. For Jinnah hospital 60% of count appeared from ULSA while samples of Ganga ram hospital revealed highest percentage i.e. 80.26% from ULSA. While Mayo hospital vicinity showed 55% of C.F.U./ cm2 from LLSA (Table 1, Figs., 1).
Washings of leaves collected from the University campus, expressed 46.5×10⁵ C.F.U.∕cm2 leaf on nutrient agar. For EMB and mannitol salt agar media, 0.004×10⁵ and 10.73×10⁵ C.F.U. were recorded, respectively. For Sheikh Zaid hospital area 9.3×10⁵ C.F.U./cm2 was obtained on nutrient agar medium, while for EMB and mannitol salt agar media,1.7×105 and 0.23×10⁵ C.F.U./cm2 were counted, respectively. From Jinnah hospital vicinity 41.6×10⁵, 6.6×10⁵ and 4.0×10⁵ C.F.U/ cm2 were expressed on nutrient, EMB and mannitol salt agar media, respectively. For Sir Ganga ram hospital 11.06×10⁵ C.F.U./ cm2 on nutrient agar medium was obtained, while 40.42×10⁵ and 6.43×10⁵ colonies were observed on EMB and mannitol salt agar media, respectively. Leaves sampled from the Mayo hospital area revealed 2.9×10⁵, 9.21×10⁵ and 22.1×10⁵ C.F.U./cm2 on nutrient, EMB and mannitol salt agar media, respectively (Table 1).
Standard plate count method of C.F.U. enumerating is an established technique for both environmental as well as laboratory level
microbiological assays. Inasmuch as the DSCM is concerned, in general, far less number of C.F.U./leaf was recorded as compared to the standard plate count method (Table, 1). However, present results indicated that some of the bacterial species/strains may escape visualization by one of the methods. For instance, DSCM revealed the presence of Enterococcus sp. on mannitol salt agar, and Klebsiella, Enterobacter, Salmonella and Shigella spp. on EMB agar for Mayo hospital. On the contrary, Bacillus and E. coli species appeared on EMB agar medium, when the water dilutions were processed, whilst these species did not manifest their presence by DSM. Thus the two methods may not be considered alternative to each other (Table, 1). Each method, sharing although much in common depicted specific type of information. Obviously by DSCM, microbial deposition in crevices or depression of the leaves surfaces escaped their screening. While in immersing of leaves followed by SPCM bacteria from many such locations would have also been visualized. However, differences appeared highly varied for the different samples. It may be speculated that different abiotic pollutant depositions on different sampling areas might had an effect on the viability and bacterial transfer onto the media. It is important to note that not only the total number of C.F.U./cm2 differed for the samples collected from different study areas, but percent distribution of specific species of bacteria also varied greatly, for different areas (Table 1). For example, by DSM about 82% of the isolates were represented by S. epidermis on mannitol salt agar medium for the leaves collected from the University campus, while the corresponding figure approved 99% for the sample collected from Sheikh Zaid hospital (Table 1) on same medium. Similarly, for other media and sampling areas differences were prominent (Table 1).
Soil, water and air constitute a standard model environments for studies concerning with the characterisation of the microbial diversity and their importance towards its surrounding. In previous studies a lot of focus was laid upon the microbial toxicity, allergies and general medical implications in specific indoor environments such as hospital premises (Bauer et al., 1990), homes and offices (Pastuszka et al., 2000), animal houses (Wilson et al., 2002b; Chang et al., 2001) and processing plants (Dutkiewicz et al., 2001, 2002; Kotula & Kinner, 1964). Whereas, bacteria present in the outdoor atmosphere is also of utmost importance regarding ecological and medical importance. Changes brought about by air currents represent an

VOL. 60 (1) BACTERIA AS INDICATORS OF NOSOCOMIAL INFECTIONS 147
important way to create diversity for microorganisms that later colonises remote environments (Bauer et al., 2002; Bovallius et al., 1978). These airborne microbes, whether related to human, animal or plants, spread over wide areas from natural point of sources thus affecting the local inhabitants (Maron et al., 2005).
Atmospheric bacterial profiles are greatly influenced by the natural phenomenon such as anthropogenic activities including crowded masses, heavy traffic especially involving dilapidated vehicles, and emissions of pollutants of industrial origin. It is well known that microbial profile of atmosphere is dependent upon the nature and distribution of suspended particulate matter (SPM). However, atmosphere is a highly labile and ever changing habitat, the air sampled for microbiological investigation will usually represent immediate picture (Sanca et al., 2002; Goodman, et al., 2008; Carling & Barley, 2010). Therefore, for public health assessment periodic and frequent sampling is required. Kolmos (2012) described that microorganisms may be transmitted in a hospital environment by direct and indirect contact, and by the airborne route. The present work was carried out to assess atmospheric prevalence of some kinds of bacteria employing leaves of plant Melia azedarach collected from height of 6.5 ft collected from the study areas. The idea was that depending upon the viability of bacteria, these natural aerial
samplers may indicate the bacterial dispersion of immediate past. Higher C.F.U. obtained from upper surface clearly indicated dissemination of the microbes through SPM and aerosols, which obviously settle down more on upper leaf surfaces as compared to the surfaces facing the ground. Higher C.F.U./cm2 of E. coli, Staphylococcus sp., and Shigella sp. etc. for the hospital environments as compared to the University campus is reflective of their origin from hospitals.
Beraradi & Leoni (1993) while studying indoor air climate and microbiological airborne: contamination in various hospital areas, reported that air microbial counts were higher in the hospital wards than in the offices and laboratories. These workers further narrated that coagulase-positive Staphylococci were present, in particular, only in the air of patients’ room. Conclusively higher C.F.U./cm2 of different bacteria from the leaves collected from the vicinity of different hospitals as compared to those collected from the University campus indicate, their origin from the hospital environments. It is alarming to note all that the bacterial isolates which were screened for haemolytic activities were found positive and many appeared resistant to several antibiotics too (Table II). In light of the present results incidence of nosocomial infection for the said hospitals cannot be ruled out these observations dictate the hospital authorities for maintaining strict hygienically controlled atmosphere.
Table 2: Antibiogram and haemolytic activity of some of the bacterial isolates.
Sampling area
Bacterial isolate
Hemo-
lysis test
Antibiotics C 30
E 15
VA 30
NV 5
NOR 10
RD 5
AMP 10 NA 30 B 10
A Staphylococcus aureus α 1.4
8a R 1.41 1.35 2.14 1.3 0.93 0.85 R
B
Enterococcus sp. β R R 2 1.6 2.42 1.97 R R R
Enterococcus sp. β 2.4 R 1.88 2.16 2.85 3.26 1.4 1.12 2.7
Bacillus sp. β 2.77
2.43 2.22 1.78 2.49 2 2.17 R 2.9
Bacillus sp. α 2.76 3.2 2.1 2.15 2.55 2.37 2.8 2.38 1.14
Enterococcus sp. α 2.4
4 1.34 R 1.5 3.33 2.07 R 2.96 0.96
Staphylococcus aureus α 1.4
8 R 1.41 1.35 2.14 1.3 0.93 0.85 R
REFERENCES
Bauer, T.M., Ofner, E., Just, H. & Daschner, F.D.,
1990. An epidemiological study assessing
the relative importance of airborne directcontact transmission of microorganisms in a medical intensive care unit. J. Hosp. Infect. 4: 301–309.

148 J. I. QAZI & M. IQTEDAR BIOLOGIA (PAKISTAN)
Bauer, H., Kasper-Giebl, A., Loflund, M., Giebl, H., Hitzenberger, R., Zibuschka, F. & Puxbaum, H., 2002. The contribution of bacteria and fungal spores to the organic carbon content of cloud water, precipitation and aerosol. Atmos. Res. 64: 109–119.
Benson, H.J., 1994. Microbiological application: Laboratory manual in general microbiology. W.M.C. Brown. Publishers, Dubuque, U.S.A.
Berardi, B.M. & Leoni, E., 1993. Indoor air climate and microbiological airborne: contamination in various hospital areas. Zbl. Hyg. Umweltmed.194:405-18.
Bergey, D. H. & Holt, J. G., 1994. Bergey’s Manual of Determinitive Bacteriology 9th ed. Lippincott Williams & Wilkins, USA.
Bovallius, A., Bucht, B., Roffey, R. & Anas, P., 1978. Long-range air transmission of bacteria. Appl. Environ. Microbiol. 35: 1231–1232.
Chang, C.W., Chung, H., Huang, C.F. & Su, H.J.J., 2001. Exposure of workers to airborne microorganisms in openair swine houses. Appl. Environ. Microbiol. 67: 155–161.
Collins, C.H., Lyne, P.M. & Grange, J.M., 1995. Collins and Lyne’s Microbiological Methods. Butterworth-Heinemann Ltd., Oxford.
Dutkiewicz,J., Krysinska-Traczyk, E., Skorska,C., Sitkowska, J., Praz˙mo, Z. & Golec, M., 2001. Exposure to airborne microorganisms and endotoxin in herbprocessing plants. Ann. Agric. Environ. Med. 8: 201–211.
Dutkiewicz, J., Krysinska-Traczyk, E., Skorska, C., Cholewa, G. & Sitkowska, J., 2002. Exposure to airborne microorganisms and endotoxin in a potato processing plant. Ann. Agric. Environ. Med. 9: 225–235.
Kolmos, H.J., 2012. Health care associated infections: Sources and routes of transmission, infection control- updates, Dr. Christopher Sudhakar (Ed.), ISBN: 978-953-51-0055-3, Intech.
Kotula, A.W., Kinner, J.A., 1964. Airborne microorganisms in broiler processing plants. Appl. Microbiol. 12: 179–184.
Mainelis, G., Willeke, K., Baron, P., Reponen, T., Grinshpun, S.A., Gorny, R.L., Trakumas, S., 2001. Electrical charges on airborne microorganisms. Aerosol Sci. 32: 1087–1110.
Pastuszka, J.S., Kyaw Tha Paw, U., Lis, D.O., Wlazlo, A. & Ulfig, K., 2000. Bacterial and fungal aerosol in indoor environment in upper Silesia, Poland. Atmos. Environ. 34: 3833–3842.
Pelczar, M.J. Jr., Chan, E.C.S. and Krieg, N.R., 1986. Microbiology. McGraw Hill Book Company, New York, U.S.A.
Qazi, J.I., Yasin, M. & Shahjan, S., 2002. Atmospheric bacterial profiles and suspended particulate matter of Lahore city. Pak. J. Zool., 17:1-13.
Qazi, J. I. & Yasin, M., 2003. Effect of water and acetone extracts of atmospheric suspended particulate matter collected from Lahore on bacterial and yeast growth. Pak. J. Zool., 35: 78-81.
Qazi, J.I. & Tahir, R., 2005. Occurance of Amphibacillus and Bacillus endospores in the atmospheric suspended particulate matter of Lahore city. Pak. J. Zool., 36:187-191.
Maron, P.A., Lejon, D.P.H., Carvalho, E., Bizet, K., Lemanceau, P., Ranjard, L. & Mougel, C., 2005. Assessing genetic structure and diversity of airborne bacterial communities by DNA fingerprinting and 16S rDNA clone library. Atmos. Environ. 39: 3687–3695.
Sanca, S., Asan, A., Otkun, M.T & Ture, M., 2002. Monitoring indoor airborne fungi and bacteria in different areas of Trakya University Hospital, Edrine, Turkey. Indoor Built. Environ. 11:285-292.
Wilson, S.C., Morrow-Tesch, J., Straus, D.C., Cooley, J.D., Wong, W.C., Mitlohner, F.M. & McGlone, J.J., 2002b. Airborne microbial flora in a cattle feedlot. Appl. Environ. Microbiol. 68: 3238–3242.
KolmosHJ, Lyon H, Matzen P ... J Hepatobiliary Pancreat Surg. 2007; 14:59–67. doi

BIOLOGIA (PAKISTAN) 2014, 60 (1), 149-152 PKISSN 0006 – 3096 (Print) ISSN 2313 – 206X (On-Line)
*Coressponding author: [email protected]
Longitudinal Zonation in the Fish Fauna of the Indus River in Pakistan
*MUHAMMAD RAMZAN MIRZA1 and ZAHID SHARIF MIRZA2
1Department of Zoology, GC University, Lahore, Pakistan 2Fisheries Research and Training Institute, PO Batapur, Lahore, Pakistan
ABSTRACT
More than 180 species of freshwater fishes are found in the river Indus in Pakistan. The species of the river change gradually from the headwaters to mouth of the Indus. In the paper changes in the families and genera have been discussed. The longitudinal zonation of genera of fish has been highlighted. Keyword: Ichthyofauna, Indus, Longitudinal Zonation, Pakistan, River Continuum Concept.
_______________________________________________________________________________________
INTRODUCTION The River Continuum Concept hypothesizes
that in large rivers, from headwaters to mouth, the riverine ecosystem present a continuous gradient of physical conditions that lead to changes in structural and functional characteristics of the fluvial environment resulting in changes in biotic communities along the length of a river(Vannote et al., 1980).The distribution of the biota along the length of river Indus provides a typical example of the River Continuum Concept. The present paper describes the changes in fish fauna along the length of River Indus in Pakistan.
River Indus originates near Mount Kailas (6,714 masl) in the Gangdise Range of Tibet and drains into the Arabian Sea covering about 3,000 km along its course. With an area of 863,508 km2, Indus River Basin is the major drainage of the northwest Himalayas, the Karakoram mountains and the western half of the Indo-Gangetic Plain. The headwater tributaries of river Indus include Shingo, Shyok, Shigar, Hunza, Gilgit and Kabul Rivers. In the Punjab Plains, the Jhelum, Chenab, Ravi and Sutlej rivers also drain into the Indus. About 398-km3 of water falls in the Indus Basin in the form of rain and snow out of which the river an estimated 53 km3 of water per year while the remainder is returned to the atmosphere by evapotranspiration (Karim & Veizer, 2002).The detailed features of the river have been described elsewhere (Mirza, 2003).
The fish fauna of the river Indus and its tributaries had always been of interest and several important pieces of literature are available describing the ichthyological diversity of the mighty river (Ahmad et al., 2010; Day, 1880; Hussain & Mirza, 2007; Mirza, 1989, 1994, 2006; Mirza & Hussain, 1998; Mirza & Jan, 1993; Mirza & Khan, 1983; Mirza et al., 2011; Rafique, 2001; Rafique et al., 2003). Almost 180 species of fishes have been
reported from different parts of the river and its tributaries during its journey from northern area, Punjab plains, Sindh and finally to the Indus Delta (Mirza, 2003). The present paper describes the longitudinal zonation of fish fauna in the river Indus as ascertained from review of the available literature especially the contributions of the senior author. Upper Indus Region
There is gradual change in the fish fauna of the Indus river from its head waters to the mouth. In the northern mountain areas of Pakistan and Kashmir, the fish fauna is composed of the snow-carps (Family Cyprinidae, subfamily Schizothoracinae), the loaches of the genus Triplophysa (Family Nemacheilidae), and the catfish Glyptosternon reticulatum (Family Sisoridae). These three groups extend downstream along the main Indus river upto Besham Qila. Here the Indus Golden Mahseer, Tor macrolepis, and the loaches of genus Schistura (Family Nemacheilidae) make their appearance. At Thakot, there are Aspidoparia, Crossocheilus, Schizothorax, Racoma (Family Cyprinidae), Schistura and Acanthocobitis (Family Nemacheilidae) (Hussain & Mirza, 2007)
In the Tarbela lake, the Cyprinid genera Aspidoparia, Barilius, Crossocheilus, Garra, Puntius, Nemacheilus, and Acanthocobitis are added in addition to the snow-carps and the Indus Mahseer. The catfish genera Gagata and Glyptothorax (Family Sisoridae), the snakeheads (Family Channidae), the spiny eel Mastacembelus armatus and glassfish Chanda nama (Family Chandidae) are also added. In the Khalabat Pocket of Tarbela lake, there are also Chela cachius, Salmophasia bacaila (Family Cyprinidae), Acanthocobitis botia (Family Nemacheilidae) in addition to several exotic species. This fauna is also represented in the feeding streams, viz. the river Brandu, the river Unar, the river Siran etc. The

150 M. R. MIRZA & Z. S. MIRZA BIOLOGIA (PAKISTAN)
catfish Glyptosternum reticulum has not been reported downstream from Besham Qila. The other elements are also found downstream of Tarbela Dam. The snow-carp genus Schizopygopsis is restricted in Baltistan and upstream in headwaters of the Indus. The genera Diptychus and Ptychobarbus are also found in Baltistan in addition to Schizopygopsis. But these two genera (Diptychus and Ptychobarbus) extend downstream in various streams of Northern Areas upto Gilgit mainly in the trans-Himalayan areas but also in the Deosai Plateau in the Himalayan areas. the snow-carp genera Racoma, Schizothorax and Schizopyge are widely distributed in the trans-Himalayan areas, Himalayan areas, and even in sub-montane Indus areas upto Attock Khurd. Schizopyge esocinus has been collected upto Dekhner a few kilometers downstream of Attock Khurd. Schizothorax plagiostomus and Racoma labiate have also been collected from downstream of Jinnah Barrage. Racoma labiate has also been even collected from Chashma Lake (Mirza & Hussain, 1998; Mirza & Khan, 1983).
The fish fauna of the Indus and its tributaries between Tarbela Dam and the Kabul-Indus confluence is quite rich. All the species found in the Tarbela lake are present also in this area. In addition there are Cyprinid genera Securicula, Devario, Esomus, Rasbora, Cirrhinus, Labeo, Osteobrama, Systomus (Family Cyprinidae), loaches of genera Botia, Lepidocephalus (Family Cobitidae), Acanthocobites, Nemacheilus, Triplophysa (Family Nemacheilidae); catfish genera Mystus, Sperata (Family Bagridae), Ompok, Wallago (Family Siluridae), Clupisoma (Family Schilbeidae),and Heteropneustes (Family Heteropneustidae), Gagata, Glyptothorax (Family Sisoridae) the garfish genus Xenentodon (Family Xenentodotidae); glassfish genus Parambassis (Family Chandidae); Gulu or the freshwater goby genus Glossogobius (Family Gobiidae).
In the upper Indus upto Qila Besham, there are only three native families viz., Cyprinidae, Nemacheilidae, and Sisoridae. In the Indus between Besham and Tarbela Dam, the number of fish families is six viz., Cyprinidae, Nemacheilidae, Sisoridae, Channidae, Mastacembelidae, and Chandidae. Downstream from Tarbela Dam upto Kabul Indus confluence, the number of families is 12 viz., Cyprinidae, Cobitidae, Nemacheilidae, Sisoridae, Siluridae, Bagridae, Schilbeidae, Heteropneustidae, Gobiidae, Channidae, Mastacembelidae, and Chandidae.
The vale of Peshawar is quit rich. All the above mentioned genera and families found in the Indus between Besham Qila and Attock Khurd are
present. In addition, there are Gudusia (Family Clupeidae), Amblypharyngodon, Danio, Naziritor (Family Cyprinidae), Eutropiichthys, Pseudeutripichtys (Family Schilbeidae), Lepidocephalus (Cobitidae), Colisa (Family Belontidae), and Nandus (Nandidae). In Afghanistan part of the Kabul river, Schizocypris has also been reported from Jalalabad (Banarescu & Nalbant, 1975).
The Indus river between Attock Khurd and Garyala passes through a narrow gorge. Most of the genera mentioned above are recorded except the genus Naziritor (Family Cyprinidae) and Triplophysa (Family Nemacheilidae) which have not been recorded from this part of the Indus and downstream (Mirza, 1997; Ahmed et al., 2010). Batasio pakistaniscus has also been collected (Ahmed et al., 2010).
Some genera are added: Notopterus (Family Notopteridae); Cyprinion (Family Cyprinidae); Batasio, Rita (Family Bagridae); and Bagarius (Family Sioridae) (Ahmad et al., 2010). The genus Macrognatus (Family Mastacebelidae) has been recorded in the river Haro. From Garyala, the Indus takes a U-turn towards west and then cuts through the Kala Chitta Range towards south. Here, it receives the river KohatToi and Teri Toi from the West and the river Soan from the East. In the river Soan, the genus Securicula (Family Cyprinidae), the catfish genus Sisor (Family Sisoridae) and the spiny-eel genus Macrognatus (Family Mastacebelidae) are added. The west Asiatic genus Cyprinion (Family Cyprinidae) is well represented in the KohatToi and the river Soan and its tributaries and the endemic species Barilius naseeri is restricted to the Soan. The Indus Mahseer Tor macrolepis becomes common and the snow carps (Family Cyprinidae) are rare. Punjab Plains
The part of the Indus between the Jinnah Barrage and the Chashma Barrage is very important. Several elements are added with the Major carps becoming quite common. The genus Nangra (Family Sisoridae) makes its appearance downstream of Jinnah Barrage. Another important addition is the Mugilid genus Sicamugil (Family Mugilidae) which makes its appearance in the Chashma Lake for the first time and is found upto the mouth of the Indus. There are at least 49 genera, 16 families, and 9 orders of native fishes represented in Chashma Lake. In river Kurram which falls into the Chashma Lake, the snow-carp genus Schizocyprisis well represented in addition to Schizothorax and Racoma. The genus Schizopyga is absent. The Zhobi Mahseer Naziritor zhobensis has been recorded. Excepting the family Mugilidae,

VOL. 60 (1) FISH FAUNA OF THE INDUS RIVER 151
all these groups are also represented in the Jinnah Barrage areas (Mirza & Jan, 1993; Rafique et al., 2003). Downstream of Chashma Barrage, the Indus is quite slow and there is little change in the fish fauna. However, there are several species of the Indus plain distributed almost uniformly.
In rivers Shahur, Gomal-Zhob and Kundar that fall into the Indus from the west, the snow carps and the Indus Mahseer and the Zhobi Mahseer are quite common. The headwaters of the rivers Nari and Bolan in northeastern Balochistan also harbor the snow carps and the Indus Mahseer in addition to other fishes.
In the Punjab Plains, two more genera are added, viz, Monopterus (Family Synbranchidae) and Badis (Family Badidae) both represented by only one species each. Monopterus cuchia has been collected in the vicinity of Lahore and Sialkot, and Badis badis has been recorded from the Jammu Tawi and the river Jhelum near Chelianwala (District Mandi Bahauddin) (Bleeker, 1854; Tiak, 1971). Due to the construction of various link canals, the fish fauna of the Punjab is mostly uniform. Lower Indus Plains
In the Sindh plains, there are no snow carps and the Indus Mahseer is rare. Bu there is one important species, the Palla of Sind (Tenualosa ilisha, Family Clupeidae) which was recorded even from Multan and Muzaffargarh before the construction of Sukhar Barrage. Now it is restricted to the Sindh Province in Pakistan (Jafari, 1994). The top Minows (Families Cyprinodontidae and Aplocheilidae of the Order Cyprinodontiformes) are represented by two genera, Aphanius and Aplocheilus in Sindh plains. In the lower part of the Indus downstream of Thatta the catfish genus Clarias (Family Clariidae) has been recorded and several species of marine origin are found in addition. The systematics and distribution of these peripheral fishes have not been properly worked out so far and hence are not discussed in this paper.
The fish fauna of the Sindh-Balochistan hills is primarily characteristic of the Indus with the Indus Mahseer, minor carps, the loaches, the catfishes, the spiny eels, and snakeheads. These streams fall into the Indus during floods only. The west Asiatic genus Cyprinion is well represented.
The fishes collected from Nulli-ni in winter by Day in 1871 (Day, 1880) contained Aplocheilus panchax and Chanda nama in addition to other fishes. But there was no Cyprinion. The other species were Salmophasia bacaila, Barilius vagra, Devariodevario, Cirrhinus reba, Labeo calbasu, L. rohita, L. diplostomus, Systomus sarana, Puntius ticto, Tor macrolepis, Channa gachua, C. striata, and Mastacembelus armatus.All these species are
found in the Indus plains. Tor macrolepis and Labeo diplostomus are hill-stream fishes. There is not any specimen of Catla catla and Cirrhinus mrigala. The major carps are represented by Labeo rohita only. Apocheilus panchax, and Chanda nama have not been recorded from any other place in Balochistan, not even from Hab river. In the Indus delta, all the species are represented. In addition there are several species of marine fishes entering fresh water for a variable distance.
REFERENCES
Ahmad, Z., Ahmad, I., Ayub, M., & Mirza, M. R.,
2010. Fishes of River Attock Gorge, with new record of Batasio pakistanicus. Proc. Pak. Cong. Zool., 30(1-10).
Banarescu, P. & Nalbant, T. T., 1975. Collection of Cyprinoidei from Afganistan and Pakistan with description of a new species of Cobitidae (Pisces, Cypriniformes). Mitt. Hamburg. Zool. Mus. Inst., 72:241-248.
Bleeker, P., 1854. Natuurkd. Tӱdschr. Indie., 6:516-519.
Day, F., 1880. On the fishes of Afghanistan. Proc. Zool. Soc. London(224-232).
Hussain, S., & Mirza, M. R., 2007. Fish and fisheries of Tarbela Reservoir and the river Indus upto Behsam Qila. Biologia, 53(1): 15-24.
Jafari, S. I. H., 1994. The anadromous Shad, Tenualosa ilisha: an overview of its fishery in Pakistan. Proc. 1st Symp. Fish & Fisheries, Pakistan (1991):33-42.
Karim, A., & Veizer, J., 2002. Water balance of the Indus River Basin and moisture source in the Karakoram and western Himalayas: Implications from hydrogen and oxygen isotopes in river water. J. Geophys. Res., 107(D18): 4362.
Mirza, M. R., 1989. Ichtyogeography of Pakistan and adjoining areas. Sci. Int. (Lahore), 1(3): 199-207.
Mirza, M. R., 1994. Geograhpical distribution of freshwater fishes in Pakistan: A review. Punjab Univ. J. Zool., 9: 93-108.
Mirza, M. R., 1997. Biodiversity of the fishes of the River Indus and its tributaries between Tarbela dn Kalabagh. In: Biodiversity of Pakistan (eds S. A. Mufti, C. A. Woods & S. A. Hasan), pp. 325-333. Islamabad: Pak. Mus. Nat. Hist. Islamabad & Fl. Mus. Nat. Hist. USA.
Mirza, M. R., 2003. Checklist of freshwater fishes of Pakistan. Pakistan J. Zool. Suppl. Series No. 3: 1-30.

152 M. R. MIRZA & Z. S. MIRZA BIOLOGIA (PAKISTAN)
Mirza, M. R., 2006. Revised ichtyogeography of Pakistan and adjoining areas. Biologia, 52(2): 105-115.
Mirza, M. R., & Hussain, S., 1998. A note on the fish fauna of Chashma Lake, Pakistan, with the record of Racoma labiata McCelland (Pisces: Cyprinidae). Punjab Univ. J. Zool., 13: 55-57.
Mirza, M. R., & Jan, M. A., 1993. Fish fauna of Kalabagh, Pakistan. Biologia, 38: 17-22.
Mirza, M. R., & Khan, S. A., 1983. Report on a fishery survey of the Northern Areas, Pakistan, conducted during the Northren Areas Science Expedition, 1974. Biologia, 29: 265-276.
Mirza, Z. S., Mirza, M. R., Mirza, M. A., & Sulehria, A. Q. K., 2011. Ichtyofaunal diversity of
River Jhelum, Pakistan. Biologia, 57(1&2): 23-32.
Rafique, M., 2001. Fish fauna of the Himalaya in Pakistan with comments on the origin and dispersal of its High Asian Elements. Pak. J. Zool., 33(4): 279-288.
Rafique, M., Akhtar, S., & Niazi, M. H. K., 2003. Fish Fauna of Jinnah Barrage and adjoining areas. Pak. J. Zool., 35(2): 95-98.
Tilak, R., 1971. The fishes of river Tawi and its tributaries (Jammu Kahmir State) with notes on ecology. Rec. Zool. Surv. India., 65:183-217.
Vannote, R. L., Minshall, G. W., Cummins, K. W., Sedell, J. R., & Cushing, C. E., 1980. The River Continuum Concept. Can. J. Fish. Aquat. Sci., 37(1): 130-137.

BIOLOGIA (PAKISTAN) 2014, 60 (1), 153-158 PKISSN 0006 – 3096 (Print) ISSN 2313 – 206X (On-Line)
*Corresponding Author: [email protected]
Some Studies on Histopathological and Cranio-Facial Structures in Mice on Co-Gestational Exposure of Bifenthrin
MUHAMMAD ZAFAR*1 & ASMATULLAH*
*Department of Zoology, University of the Punjab, Lahore, Pakistan.
ABSTRACT
Bifenthrin was tested for feto-toxicological manifestations on histology and skeletal anatomy in mice at four maternally sub-toxic doses 0.00, 6.00, 12.00 and 24.00 mg/kg body weight. Each group was further divided into single, (gestation day 6), double (gestation day 9 and 12), triple (gestation day 6, 9 and 12) and multiple (gestation day 6 to 12) subgroups (categories). Dams in 0.00 mg/kg body weight group were treated with vehicle (distilled water only). Fetuses were exteriorized on gestation day 18. Various histopathological and craniofacial abnormalities were observed in fetuses exposed to bifenthrin. The histological studies showed effects related to brain, lever, kidney, heart and lungs, like tissue necrosis of liver and lung, intestinal loops, poorly developed choroid plexus, renal dysplasia, hypoplasia in ventricular walls of heart and non-glandular stomach. Dose dependent decrease in skeletal ossification of cranio-facial, caudal and sacro-limbic regions were observed. Key words: Bifenthrin, Cranio-facial, Skeletal ossification, Histopathological studies
______________________________________________________________________________________
INTRODUCTION
For more than 30 years pyrethroids account for approximately one-fourth of the world insecticide market. These have been used in agricultural and home formulations. After dermal contacts that have led to acute pyrethroid poisonings there have been cases of accidental and occupational exposures (Casida & Quistad, 1998).
In agriculture, pyrethroids have been widely considered as ideal insecticides (Hossain et al., 2001). These are used as mosquito repellent in the form of liquid vaporizer, aerosol, mats and coils in our houses. These are also used to control ectoparasites on both farm animals and pets (Sinha et al., 2006).
From the stand point of mammalian toxicity, pyrethroids that were once known to be the safest insecticide group have now been fairly reported to be genotoxic (Patel et al., 2006), mutagenic, neurotoxic (Sayim et al., 2005), toxic for different aspects of endocrinology, behavioral modulators, reproduction along with their effects as aging enhancing substances and carcinogenic (WHO, 1989).
Srivastava et al. (2005) based on occupational users of bifenthrin developed a single, short-term epidemiologic study. Ten healthy males wearing protective gear sprayed 25 mg/m2 of bifenthrin on interior walls six hours daily for five consecutive days. Prior to exposure and on days four and seven following exposure, biochemical and clinical tests were conducted. Tests including hepatic function, nerve conduction, electromyogram and lung function but no significant differences were
found in pre and post exposure statistically. This study did not address potential impacts of longer term, chronic exposure but was strictly a short term study.
As very limited work has been carried on histopathological and cranio-facial aspects related to bifenthrin, the present research work is conducted on albino mice (Mus musculus) to obtain the embryotoxicological results for developing guidelines which may be considered for the future use of this insecticide to the human development especially in the country Pakistan.
MATERIALS & METHODS
Swiss Webster strain of albino laboratory
mice, Mus musculus were kept under the standard protocol of 12-hour day and night (light/dark) cycles, in 12” x 18” steel cages with room temperature 25±20C. Three females were caged with one male. For the identification of successful coitus, the females were carefully observed daily. Pregnant females were separated from the males with vaginal plug and that was considered day zero of gestation. Under the approved animal treatment conditions, Ethics Committee of University of the Punjab, Lahore, Pakistan, the above cited protocol was used. Bifenthrin under the brand name TALSTAR prepared by FMC United (Pvt.) Pakistan Ltd. was purchased from the local market. Different concentrations of bifenthrin were prepared through dilutions in water in such a way that each 0.1 ml of the solution contained the desired amount of insecticide.

154 M. ZAFAR & ASMATULLAH BIOLOGIA (PAKISTAN)
The pregnant females were divided into four groups and each group contained forty animals. Then each group was further divided into four different categories, such as single, double, triple and multiple. Doses of bifenthrin dissolved in distilled water containing 6.00 12.00 and 24.00 mg/kg were given to experimental animals. While the animals in vehicle treated (control) group received 0.1ml distilled water only.
The treated dams were anaesthetized with anaesthetic ‘Ether’ on the day 18 of gestation. By giving surgical incision to the anaesthetized dams, intact gravid uteri were dissected out carefully. After that uteri were opened along the inner curvature and developing fetuses were recovered. Then these fetuses were fixed in Bouin’s fixative for 48 hours (Carson, 1992) and then these fetuses were preserved in 70% alcohol (Carson 1992). The preserved fetuses were subjected to histological and skeletal observations.
For histological studies serial sections were prepared through routine histological procedure. Then the serial sections of kidney, brain, liver, heart, eyes and lungs were stained with the help of Ehrlich’s Hematoxylin stain (Ehrlich, 1886) and Eosin stain (Conn, 1930). With the help of Canada balsam (AFIP, 1968), these stained slides were made permanent and brain, spinal cord, eyes, liver, kidneys, lungs and heart were carefully examined for histopathological changes. Fetal skeletons were prepared by the process of Kawamura et al. (1990). For this method fetuses from each dose group, one from each litter size were selected randomly and then preserved in 95% ethanol. Through a small abdominal incision, these fetuses were eviscerated and all thoraco-abdominal organs (heart, lung, liver, kidneys, stomach and intestines) were removed carefully. To remove the flesh for clear skeleton studies, the fetuses were placed in 1% KOH solution. Before preserving the stained specimens in 50% ethanolic glycerol for microscopic and macro photographic studies, these fetuses were also placed for about 30 minutes in Alizarin’s Red S (i.e. 1% aqueous solution made alkaline by adding 3-4 drops of 1% KOH solution) and then again in 1% KOH solution.
By placing the slides of serial sections (histopathological studies) and skeleton (skeletal studies) of fetuses under binocular microscope and placing a Panasonic Lumix TZ15 camera micro and macro photographs were taken.
The labelling of deformities was done in Corel Draw 9 and these labelled photographs were pasted in Microsoft Word file of describing and supporting results.
RESULTS
Histological studies through head and different regions were carried out to determine the histological defects. Well-developed right and left ventricles, diencephalon and mesencephalon, left lung, right lung, wall of right ventricle and wall of left ventricle were observed from selected section of vehicle control group (Fig. 5a & Fig. 5b). Sections from dose group 6.00mg/kg BW showed necrosis of liver, lung necrosis and degenerated trabecular zone of heart (Fig. 5c & Fig. 5d). The dose group 12.00mg/kg BW showed abnormalities, like poorly developed choroid plexus and herniated lateral ventricles (Fig. 5e), renal dysplasia, intestinal loops, necrosis of liver, lumen of stomach and prostate (Fig. 5f), middle lope of lung, hypoplasia in ventricular wall of heart, atrophied body musculature, emphysema of lung and fibrosis of dorsal muscles (Fig. 5g). Histological section observed in dose group 24.00mg/kg BW showed defects, like herniated third and fourth ventricles and herniated lateral ventricle (Fig. 5h), hypoplasia of ventricular walls, middle lobe of lung and dorsal muscles (Fig. 5i).
Well ossified appendicular and axial skeletal i.e. nasal bone, mandible, radius, ulna, parietal bone, exoccipital bone, ribs, vertebral bodies (centra) of lumbar vertebrae, coccygeal vertebrae, right femur, tibia and fibula were seen in the control group (Fig. 6a). Reduced ossification in cranio-facial region was found in dose group 6.00mg/kg BW of bifenthrin (Fig. 6b). In 12.00mg/kg BW dose group of bifenthrin reduced ossification in caudal region (Fig. 6c) while in dose group 24.00mg/kg BW of bifenthrin reduced ossification in cranio-facial and sacro-limbic regions was seen (Fig. 6d).
Fig., 5a: Selected section of an 18 days old fetus
recovered from the pregnant mother of control group before treatment. T. S. through cranial region.
Note: right ventricle (Red Arrow-A), left ventricle (Blue Arrow-B), mesencephalon (Yellow Arrow-C)
and diencephalon (Green Arrow-D).

VOL. 60 (1) HISTOPATHOLOGICAL AND CRANIO-FACIAL STRUCTURES IN MICE 155
Fig., 5b: Selected section of an 18 days old fetus
recovered from the pregnant mother of control group before treatment. T. S. through lung and heart
regions. Note: Left lung (Red Arrow-A), right lung (Green
Arrow-B), wall of right ventricle (Blue Arrow-C), and wall of left ventricle (Yellow Arrow-D).
Fig., 5c: Selected section from an 18 days old fetus recovered from the pregnant mother after treatment with 6.00 mg/kg BW (single) Bifenthrin. T.S. through
hepatic region. Note: Necrosis of liver tissue (Red Star-A).
Fig., 5d: Selected section of an 18 days old fetus
recovered from the pregnant mother after treatment with 6.00 mg/kg BW (triple) Bifenthrin. T.S. through
heart region. Note: lung necrosis (Blue Arrow-A), degeneration of trabecular zone of heart (Red Arrow-B), phalanges
(Green Arrow-C).
Fig., 5e: Selected section of an 18 days old fetus
recovered from the pregnant mother after treatment with 12.00 mg/kg BW (double) of Bifenthrin. T.S.
through cranial region. Note: herniated lateral ventricle (Red Arrow-A) and
poorly developed choroid plexus (Blue Arrow-B).
Fig., 5f: Selected section from an 18 days old fetus recovered from pregnant mother after treatment with 12.00 mg/kg BW (triple) of Bifenthrin. C.S. through
kidney and liver regions. Note: renal dysplasia (Kd), intestinal loops (In), necrosis of liver (Lv), lumen of stomach (St) and
prostate (Pr).
Fig., 5g: Selected section of an 18 days old fetus
recovered from the pregnant mother after treatment with 12.00mg/kg BW (multiple) Bifenthrin. T.S.
through hepatic and cardiac regions. Note: middle lobe of lung (Purple Arrow-A), fibrosis
of dorsal muscles (Blue Arrow-B), hypoplasia in ventricular wall of heart (Green Arrow-C), atrophied body musculature (Red Star-D), emphysema of lung
(Orange Arrow-E).

156 M. ZAFAR & ASMATULLAH BIOLOGIA (PAKISTAN)
Fig., 5h: Selected section of an 18 days old fetus
recovered from the pregnant mother after treatment with 24.00 mg/kg BW (triple) of Bifenthrin. T.S.
through cranial region. Note: Herniated fourth ventricle (HV4), Herniated third ventricle (HV3) and herniated lateral ventricle
(HLV).
Fig., 5i: Selected section of an 18 days old fetus
recovered from the pregnant mother after treatment with 24.00 mg/kg BW (multiple) of Bifenthrin. T.S.
through heart region. Note: hypoplasia of ventricular walls (Green Arrow-A), middle lobe of lung (Yellow Arrow-B) and dorsal
muscles (Purple Arrow-C).
Fig., 6a: A macrophotograph showing normal fetal
skeletal ossification in vehicle control group.
Note: Well ossified appendicular and axial skeletal (A: nasal bone, B: mandible, C: radius, D: ulna, E:
parietal bone, F: exoccipital bone, G: ribs, H: vertebral bodies (centra) of lumbar vertebrae, I:
coccygeal vertebrae, J: right femur, K: tibia and L: fibula).
Fig., 6b: A macrophotograph of fetal skeletal showing slightly reduced ossification in D-I
(6.00mg/kg BW of Bifenthrin). Note: Reduced ossification in craniofacial region (A: reduced eye, B: reduced parietal bone, C: reduced
exoccipital bone).
Fig., 6c: A macrophotograph of fetal skeletal showing slightly reduced ossification in D-II
(12.00mg/kg BW of Bifenthrin). Note: reduced ossification in caudal region (A: reduced vertebral bodies (centra) of coccygeal
vertebrae).

VOL. 60 (1) HISTOPATHOLOGICAL AND CRANIO-FACIAL STRUCTURES IN MICE 157
Fig., 6d: A macrophotograph of fetal skeletal showing slightly reduced ossification in D-III
(24.00mg/kg BW of Bifenthrin). Note: reduced ossification in craniofacial and sacro-
limbic regions.
DISCUSSION
In target organisms, synthetic pyrethroids are known as neurotoxicants and that is their mode of action. When a nerve cell is excited in mammals, the mechanism of action of neurotoxicity of pyrethroids results from interference with the sodium gate. For hundreds of years, pyrethrins have been used as insecticides (EPA, 2012).
The present study was aimed to discover the toxicological effects of bifenthrin in relation with pregnancy and to report all sorts of developmental abnormalities at histopathological and skeletal levels but not much anomalies were found. However, necrosis of liver, kidney and lung were seen. In some cases ventricles of heart and poorly developed choroids plexus were also observed.
In an experiment on rats exposed to the concentration of bifenthrin no signs of toxicity were observed on kidneys, heart and liver (Peter & Yeboah – Gyan, 2011). When during a study the fish Oreochromits niloticus was given insecticide to test toxicity at histological level, it damaged the tissues particularly liver (Velisek et al., 2009). Bifenthrin is considered to cause liver necrosis in mice (Gammon et al., 2011).
Available information indicated that during some animal studies, decreased liver weights, congestions, hepatocellular hypertrophy and other microscopic signs of liver changes at intermediate and chronic oral exposure to pyrethrins or pyrethroids (bifenthrin, permethrin and deltamethrin) particularly at dose levels also resulting in histopathological sings of neurotixicity (IRIS 2003). In a study by Schoenig (1995) decreased kidney weight and tubular degeneration in rats consuming pyrethrins (from pyrethrum extracts) in diet at
concentrations resulting in dose levels 320mg/kg/day for 90 days were seen.
In an experiment neuro-developmental and neuro-degenerative diseases with chronic exposure to bifenthrin in rats were seen (Nandi et al., 2006). Herniated ventricles were found during this study. These ventricles were confirmed by Shepard & Lemire (1996) in a rat histological study.
Geiger (1986) investigated the bronchiolar-alveolar adenocarcinoma and adenoma in a chronic toxicity study in mice exposure to bifenthrin. In some experimental study Reed (1991) also showed the histopathology of liver and lung in mice fetus due to bifenthrin.
He et al. (1989) find out ventricular ectopics and conjuntival recesses due to exposure of pyrethroids (bifenthrin, deltamethrin and cypermethrin) in a study on mice.
During the present study the fetuses recovered from bifenthrin exposed showed reduced ossification. EPA (1999) reported the developmental toxicity in rats, in which there was decreased fetal body weight and increased incomplete ossification in selected bones. At 5mg/kg/day of bifenthrin, the developmental toxicity based on delayed ossification of the forelimb and hindlimb of digits was seen.
CONCLUSION
On the basis of these findings, it is concluded
that oral exposure of bifenthrin is teratogenic and embryotoxic in pregnant mice especially when given at the time of organogenesis even on dose level as low as 6.00mg/kg/day. Bifenthrin damages the vital organs like kidneys, eyes, liver, lungs and nervous system at histopathological level. Furthermore, it also reduces the skeletal and cranio-facial ossification.
The present observations give a strong caution to use this insecticide under a strict control. Furthermore, as the use of bifenthrin in Pakistan is common as insecticide, the children and pregnant women must kept away from this insecticide. Finally the insecticide marketers should label these cautions prominently on the packaging of the insecticide.
ACKNOWLEDGEMENTS
Department of Zoology, University of the Punjab and Government College Bosan Road, Multan have the credit to facilitate this research work for which the authors are highly thankful to these institutes.

158 M. ZAFAR & ASMATULLAH BIOLOGIA (PAKISTAN)
REFERENCES
AFIP, 1968. Mannual of histological staining techniques. NY. McGraw-Hill Publication 3rd Ed.
Carson, F., 1992. Histotechnololgy: a self-Instructional text. ASCP. 1st ed. p.19.
Casida, J.E. & Quistad, G.B., 1998. Golden age of insecticide research: past, present, or future? Annu. Rev. Entomol., 43:1-16.
Conn, H.S., 1930. The history of staining aniline dyes in histology. Stain Technol., 53: 12.
Ehrlich, P., 1886. Hematoxylinlosung, Z. Swiss Micro., 3:150.
EPA. 2012. Types of Pesticides (http://www.epa.gov/opp00001/about/types.htm) Last updated on May 09, 2012.
EPA., 1999. Federal Registration 63:245 (Notices). Gammon, D. 2011. Additional clarifying information
supporting non-classification as R40 (CLP Care 2- H351): Historical control data. FMC Report Number P4129B. March 3, 2011.
Geiger, L. E. 1986. Oncogenicity study in mice (Swiss-Webster derived, Tac (SW) fBR). FMC Study No. A83-974. DPR Vol. 50429-057, -064, -112, # 42418-42425 # 75162.
He, F., Wang, S., Lice, L., Chen, S., Zhang, Z. & Sun, J., 1989. Clinical manifestations and diagnosis of acute pyrethroid poisoning. Arch. Toxicol., 63: 54-8.
Hossain, M.M., Awal, M.A., Kobayashi, H. and Talukder, M.H., 2001. Therapeutic evaluation of cypermethrin against ticks and lice with their haematobiochemical changes in cattle. Bangladesh Vet. J., 35: 39-43.
Kawamura, S., Kirohashi, A., Kato, T. & Yasuda, M., 1990. Coe-staining technique for fetal rate specimens without skinning and removing adipose tissue. Cong. Anom., 30:93-95.
Nandi. A., Chandi. D., Lechesa. R., Pryor. S., Mclaughlin. A., Bonventre. J., Flynn. K., & Weeks. B., 2006. Bifenthrin causes neurite retraction in the absence of cell death: A model for pesticide associated neurodegeneration. MedSci. Monit. 12(S): BR 169-173.
Patel, S., Pandey, A. K., Bajpayee, M., Parmar, D. & Dhawan. A. 2006. Cypermethrin-induced DNA damage in organs and tissues of the mouse. Evidence from the comet assay. Mutat. Res. 607: 176-183.
Peter, B. & Yeboah-Gyan, K. 2011. A study of the effects of chemicals used to control diseases and pests of coca on the users. A case study of atwiwa nwabiagya district.
Reed, N. R. 1991. Bifenthrin (capture 2EC) Risk characterization document. California Department of Food and Agriculture.
Sayim, F., Yavasoglu, K. N. U., Uyanikgil, Y., Aktug, H., Yavasoglu, A. & Turgut, M. 2005. Neurotoxic effects of cypermethrin in Wistar rats: A Haematological, biochemical and histopathological study. J. Health. Sci. 51(3): 300-307.
Schoenig, G. P. 1995. Mammalian toxicology of pyrethrum extract. In. Casida. J. E., Quistad, G. B., eds. Pyrethrum flowers. Production, Chemistry, Toxicology and uses. New York: Oxford University Press. pp:249-257.
Shepard, J. H. & Lemire, R. J. 1996. Mobius syndrome: a possible teratogenic mechanism. Teratology. 53:86.
Sinha, C., Seth, K., Islam, F., Kumar, R., Shukla, S., Mathur, N., Srivastana, N. and Agarwal, A.K., 2006. Behavioral and neurochemical effect induced by pyrethroid based mosquito repllent exposure in rat offspring during early prenatal and postnatal period. Neurotoxicology and Teratology, 28(4): 472-881.
Srivastava, H. C., Kumar, G. P., Hassan, A., Dabhi, M., Pant, C. S. & Yadav, R. S., 2005. Evaluation of possible health effects of pyrethroid insecticides, bifenthrin 10% WP, and deltamatherin 25% WG, on spraymen exposed in the field trial in India. Bull Environ Contam Toxicol 75 (3): 413-420.
Velisek, J., Svobodova, Z. & Piackova, V. 2009. Effects of acute exposure of bifenthrin on some haematological, biochemical and histopathological parameters of rainbow trout (Oncorhynchus mykiss). Veterinarni Medicina, 54 (3): 131-137.
WHO. 1989. Environmental health criteria 82: Cypermethrin Genevas. World Health Organization. pp: 154.

BIOLOGIA (PAKISTAN) 2014, 60 (1), 159-163 PKISSN 0006 – 3096 (Print) ISSN 2313 – 206X (On-Line)
*Corresponding author: [email protected]
Comparative Abundance of Fish Fauna of Different Streams of Bajaur Agency, Khyber Pakhtunkhwa, Pakistan
*ZAIGHAM HASAN1, WISAL KHAN1, MUNEER AHMAD KHAN2 LATIF-UR-REHMAN3, JEHANGIR
KHAN4 & SANAULLAH1
1Department of Zoology, University of Peshawar, Pakistan
2Lecturer, Govt. College, Sabirabad, Karak 3Social organizer, RAHA, UNDP (FATA)
4Asst. Director Fisheries, Bajaur& Mohmand Agency
ABSTRACT
A study on the fishes of Bajaur agency was conducted from 2004 to 2010. A total of sixteen (16) fish species were identified belonging to 4 orders, 5 families and 12 genera. Family Cyprinidae was the richest family represented by nine species viz, Puntius ticto, Puntius conchonius, Barilius modestus, Barilius pakistanicus, Barilius vagra, Crossocheilus diplocheilus, Salmophasia punjabensis, Carassius auratus and Schizothorax plagiostomus. Family Nemacheilidae was represented by three species Triplophysa naziri, Schistura alepidota and Naemacheilus pakistanicus whereas two species Channa gachua and Channa punctatus of Family Channidae were also identified. Family Mastacembelidae and Sisoridae were represented by a single specie viz, Mastacembelus armatus, and Glyptothorax punjabensis respectively. Most fishes collected from this area are of great economic importance and local people rely on them as a source of cheap, rather cost free protein. Keywords: Ichthyofauna, Bajaur, Swat, conservation, stream, diversity index, Cyprinidae, Nemacheilidae.
_______________________________________________________________________________________
INTRODUCTION
The importance of fish in human diet is now well established. Various studies have shown that low fat fish meat is better than beef, mutton and even poultry for human health (Ali, 1993). Fish also contains important fatty acids which are antioxidants and increase the body resistance against cancer (Norrish et al., 1999).
Studying fish fauna of an area is a very important task as it provides base line information about the species used for human consumption. Mostly people depend only on a few important species as food; hence faunistic studies could identify actual food and market potential of an area or a water body. This type of study also provides information about the availability, abundance, population dynamics and conservation status of fish species of an area. Strategies can be developed on the basis of these studies to conserve and to culture a species from certain environment.
According to Rankhamb (2011) Ichthyodiversity refers to variety of fish species depending on context and scale i.e. it may either refer to alleles or genotypes within a fish community or to species or life forms across aqua regimes. Early and basic work was done on the fish fauna of N.W.F.P. (Now called Khyber Pakhtunkhwa) by Dr. Nazir Ahmad, the first director of the Department of fisheries, West Pakistan. He was the pioneer in studying fish fauna of various parts of Pakistan.
After him the major work was done by researchers like Dr. M.R. Mirza, Professor (R), Government College, Lahore. He is one of the most prominent taxonomists of the world. In a recent publication Mirza (2003) has described 183 freshwater fish species from the whole Pakistan. According to Khan et al. (2008) there are more than 186 freshwater species described from freshwater bodies in Pakistan. Butt (1986) reported 94 species of fishes from the whole province of N.W.F.P. Ali (1993) enlisted about 165 fish species from the freshwater of whole Pakistan.
Many scientists like Russell (1803), Heckel (1838), McClelland (1842), Lagler et al. (1977), Ehrlich & Wilson (1991), Talwar & Jhingran (1991), Ubarhande et al. (2011), Rankhamb (2011) and Mirza et al. (2013) also worked on fish taxonomy and other aspects of fishes and made valuable contribution to fisheries in different parts of the world.
Bajaur Agency is bound on its north-east by District Dir, on its south-east by the Malakand Agency, on its south by Mohmand Agency and on its west and south-west by Afghanistan. The Agency lies between 34˚- 10 to 34˚- 58/ North latitudes and 71˚- 00 to 71˚- 450 East longitudes. The area of Bajaur Agency is 1,290 square kilometers (www.thebajaur.com).
Three major streams namely Mamund stream, Salarzai stream and Nawagai stream were selected for fish collection. Nawagai stream

160 Z. HASAN ET AL BIOLOGIA (PAKISTAN)
originates from Zorbandar and flows parallel to various villages of Utman Khel and is situated at a distance of about one Km from Khar (Head Quarter of Bajaur Agency). It joins with Mamund stream near the Agency Head Quarter. These streams flow into river Punjkora in Dir District which then flows into river Swat. The total length of Nawagai stream is about 15 kilometers. Salarzai stream originates from two points; Gabar spring and Afghan mountain. Both these channels meet near Pashat and make a single stream which flows through the whole District and joins Nawagai and Mamund stream at Jar.
Mamund stream originated from Kharki in the past but due to climatic changes now the stream has dried up to Sesei Afghan refugees’ camp. The entire length is about 13 kilometers before it joins with Nawagai stream near Khar. Water of these streams is clean and is used for different purposes like cooking, washing, agriculture especially cultivation of rice, wheat and maize crops.
MATERIALS AND METHODS The fishes were collected from all the
three streams of Bajaur Agency namely Salarzai stream, Nawagai stream and Mamund stream from 2004 to 2010. Main catch efforts were made in the two years i.e., 2004 and 2010, whereas sporadic collections were made by the students (of Bajaur) of Fisheries section of the Department of Zoology, University of Peshawar every year as part of their laboratory work. In 2004, two streams Mamund and Nawagai were studied whereas, in 2010, the third major stream of the area called Salarzai stream was also included in the study.
Collected fishes were fixed in 10% formalin first and then shifted into 70% alcohol. Clean, well washed and disinfected bottles were used for preservation of fishes to avoid spoilage. The meristic and morphometric characters were studied and fishes were identified up to the species level with the help of standard Keys of Mirza & Sandhu (2007), Jayaram (2010) and Talwar & Jhingran (1991).
For the statistical analysis of the data the alpha diversity for the fishes of Bajaur Agency was calculated from two aspects, Shannon’s Index and Evenness. The Shannon’s Index was calculated as Hs = - (pi) (ln pi), Where pi = the decimal fraction or population proportion of total individuals belonging to the ith species and ln is the natural logarithm. The Evenness of fish abundance was calculated as E= Hs/lnS. Where S= number of species (Odum and Barrett, 2005).
RESULTS AND DISCUSSION
Fish fauna of Bajaur Agency was studied from 2004 to 2010 with intervals. In the present study 16 fish species were recorded from Bajaur Agency with a total catch of 1029. Following are the names of the species in alphabetical order. Barilius modestus, Barilius pakistanicus, Barilius vagra, Carassius auratus, Channa gachua, Channa punctatus, Crossocheilus diplocheilus, Glyptothorax punjabensis, Mastasembelus armatus, Nemacheilus pakistanicus, Puntius conchonius, Puntius ticto, Salmophasia punjabensis, Schistura alepidota, Schizothorax plagiostomus and Triplophysa naziri.
In 2004, only 9 species were reported but in 2010, 11 species were collected. Fishes which were recorded now and were not found previously are Barilius modestus, Barilius pakistanicus, Channa gachua, Carassius auratus, Glyptothorax punjabensis, Puntius conchonius and Schistura alepidota.
Some other fishes which were reported previously but are missing in present collection are Barilius vagra, Nemacheilus pakistanicus, Salmophasia punjabensis, Schizothorax plagiostomus and Triplophysa naziri.
In 2004, the highest percentage in the collection was that of Puntius ticto and Crossocheilus diplocheilus whereas in recent collection both these fishes have lost their abundance in the waters of Bajaur and instead other species like Barilius pakistanicus and Schistura alepidota have occupied these areas. The reason might be the change in food availability. Puntius and Crossocheilus are herbivorous (FishBase.org) whereas Barilius and Schistura are mainly carnivorous (seriouslyfish.com). This shift in species abundance may be correlated to the heavy pollution caused by the marble industries set in the area. Another source of pollution is the soil erosion due to deforestation which causes turbidity and limits the growth of phytoplankton by blocking the sunlight penetration which is the source of energy for the process of photosynthesis.
Another important correction is about the nomenclature of the fish Salmophasia punjabensis. Previously this fish was identified as Salmostoma punjabensis. Therefore they should not be considered different species as described by Mirza & Sandhu (2007).
It was observed that some fishes were distributed more abundantly as compared to the others throughout the study period, like: Puntius ticto, Crossocheilus diplocheilus, Barilius vagra,

VOL. 60 (1) FISH FAUNA OF BAJAUR 161
Nemacheilus pakistanicus and Mastacembelus armatus. It shows that all the environmental conditions are suitable for their survival. The existence of these species throughout the study period may be due to the reason that they can tolerate a wide range of water temperature.
Javed et al. (1996) collected 12 fish species named; Aspidoparia morar, Barilius pakistanicus, Puntius conchonius, Tor putitora, Crossocheilus diplocheilus, Schizothorax plagiostomus, Schistura alepidota, Schistura naseeri, Triplophysa naziri, Glyptothorax punjabensis, Channa gachua and Mastacembelus armatus from the streams of Bajaur Agency. Aspidoparia morar, Tor putitora and Schistura naseeri were not found in the present collection. Khan (1983) identified only four species namely Barilius vagra, Schizothorax plagiostomus, Nemacheilus turio, and Channa punctatus. During the present collection from the three streams of Bajaur Agency, six new species have been added for the first time to the account namely Puntius ticto, Barilius modestus, Carassius auratus, Salmophasia punjabensis and Nemacheilus pakistanicus. In the present survey of fish fauna four species; Nemacheilus turio, Tor putitora, Schistura naseeri and Aspidoparia morar are missing as compared to the past record of fish fauna of Javed et al. (1996) and Khan (1983). It seems that Khan’s (1983) identification of Nemacheilus turio was not correct as this fish is not found in Pakistan and according to Day (1889) it is confined to an area “Turi” present in Asaam (India). It was probably a misidentification of Nemacheilus pakistanicus done due to lack of literature and identification keys at that time. In different streams, during the study period, it was observed that some species were found in larger number as compared to others. In Mamund stream Puntius ticto, Crossocheilus latius, Nemacheilus pakistanicus and Mastacembelus armatus were found in large number, while Barilius vagra, Triplophysa naziri, Schizothorax plagiostomus, Channa punctatus and Salmophasia punjabensis were present in very less number. In Nawagai stream Crossocheilus diplocheilus, Puntius ticto, Barilius vagra, Nemacheilus pakistanicus, Schizothorax plagiostomus and Mastacembelus armatus were found in high percentage while Channa punctatus, Salmophasia punjabensis and Triplophysa naziri were present in lesser number (Table 1 & 2).
Alpha diversity depends on two aspects, the richness and evenness of the species in a community. These two aspects of alpha diversity can be measured by many proposed methods of population indices. The most commonly used index of heterogeneity is the Shannon’s Index of diversity which measures the mean value of uncertainty to predict the richness of species in a random sample of community. The uncertainty of species richness is directly proportional to the number of species present more evenly in a community. The Shannon’s index value for the streams of Bajaur for 2004 is 2.082 which shows high alpha diversity and shows the uncertainty of rich fish diversity with the 0.9483 value of evenness. Whereas for 2010 the Shannon’s index and evenness values of fish abundance were 2.354 and 0.9812 respectively, which shows more richness and evenness of species as compared to the alpha diversity of 2004.
Among the 5 families of the fishes identified from Bajaur Agency, the richest family on the basis of species diversity is Cyprinidae, represented by 10 species which are: Barilius modestus, Barilius pakistanicus, Barilius vagra, Carassius auratus, Crossocheilus diplocheilus, Puntius conchonius, Puntius ticto, Salmophasia punjabensis and Schizothorax plagiostomus. Among the rest 6 species, family Channidae is represented by 2 species that is Channa punctatus and Channa gachua, Sisoridae is represented by one species which is Glyptothorax punjabensis. The family Mastacembelidae and Nemacheilidae are represented by a single species each: Mastacembelus armatus and Schistura alepidota. Our results agreed with Ubarhande et al. (2011) who reported 27 fish species from Ambadi Dam, India, where Cyprinidae family is dominant over other families.
CONCLUSION
Present survey of fish fauna of Bajaur
Agency added six new records for the first time taking the total to sixteen. Diversity indices show a great diversity of fish in these streams which depicts the suitability of the water for fish survival. Fish culture could easily be promoted in this poverty stricken area for enhancing economic activity which may in turn improving the earnings and life quality of the people of this area.

162 Z. HASAN ET AL BIOLOGIA (PAKISTAN)
Tabl
e 1:
Rel
ativ
e ab
unda
nce
of d
iffer
ent f
ish
spec
ies
in 2
004.
% o
f Cat
ch
13.4
7
18.7
9
06.0
3
09.9
2
13.1
2
19.8
6
05.6
7
08.8
6
04.2
5
Tota
l
38
53
17
28
37
56
16
25
12
282
Naw
agai
Str
eam
21
30
9 12
18
29
8 13
5 145
Mam
und
Stre
am
17
23
8 16
19
27
8 12
7 137
Nam
e of
Fis
h Sp
ecie
s
Bar
ilius
vag
ra
Cro
ssoc
heilu
s di
ploc
heilu
s
Cha
nna
punc
tatu
s
Mas
tace
mbe
lus
arm
atus
Nem
ache
ilus
paki
stan
icus
Pun
tius
ticto
Sal
mop
hasi
a pu
njab
ensi
s
Sch
izot
hora
x pl
agio
stom
us
Trip
loph
ysa
nazi
ri
Tot
al
S/N
o
1 2 3 4 5 6 7 8 9
Tabl
e 2:
Rel
ativ
e ab
unda
nce
of d
iffer
ent f
ish
spec
ies
in 2
010.
% o
f Cat
ch
3.47
13.6
5
9.50
8.43
9.50
10.7
1
5.35
9.90
9.77
8.43
10.9
7
Tota
l
28
102
71
63
71
80
40
74
73
63
82
747
Naw
agai
St
ream
8 38
30
23
27
28
12
26
27
20
28
267
Mam
und
Stre
am
9 35
18
19
20
27
16
26
23
23
29
245
Sala
rzai
Str
eam
11
29
23
21
24
25
12
22
23
20
25
235
Nam
e of
Fis
h Sp
ecie
s
Bar
ilius
mod
estu
s
Bar
ilius
pak
ista
nicu
s
Cro
ssoc
heilu
s di
ploc
heilu
s
Car
assi
us a
urat
us
Cha
nna
gac
hua
Cha
nna
punc
tatu
s
Gly
ptot
hora
x pu
njab
ensi
s
Mas
tace
mbe
lus
arm
atus
Pun
tius
ticto
Pun
tius
conc
honi
us
Sch
istu
ra a
lepi
dota
Tota
l
S/ No
1 2 3 4 5 6 7 8 9 10
11

VOL. 60 (1) FISH FAUNA OF BAJAUR 163
REFERENCES
Ali, S.S., 1993. An introduction to freshwater fishery biology. University Grants Commission, Sector H-9, Islamabad. 330 pp.
But, J.A. 1986. Fish & fisheries of North West Frontier Province (NWFP) Pakistan. Biologia (Pakistan), Special Suppl., 21-34.
Day, F., 1889. The fauna of British India, including Ceylon and Burma. (Fishes, Vol. II).Taylor and Francis, London 509 pp.
FishBase.org. Food., & Feeding Habits: Diet Composition of Puntius ticto Ref. No. 13633
Ehrlich, P.R. & Wilson, E.O., 1991. Biodiversity studies; science and policy. Sci., 253: 758-762.
Heckel, J., 1838. Fische aus Caschmir. Carl Freiherm V. Hugel, Wien, Germany. 60 pp.
Javed, M.N., Rehman, H., & Sulehria, A.Q.K., 1996. Fishes of Bajour Agency. Biologia (Pakistan)., 42: 93-95.
Jayaram, K.C., 2010. The Freshwater Fishes of the Indian Region. Second Edition. Narendra Publishing House, Delhi. 616 pp.
Khan, N., 1983. Fishes of Bajour Agency and Dir District. M.Sc. Thesis report Dept. of Zoology, Univ. of Peshawar, Pakistan. 38 pp.
Khan, A.M., Shakir, H.A., Abid, M., & Mirza, M.R., 2008. Ichthyofaunal survey of some freshwater reservoirs in Punjab. J . Anim. PI. Sci., 18: 151-154.
Lagler, K.F., Bardach, J.E., & Miller, R.R., 1977. Ichthyology. 2nd ed. Jhon Willy and Sons, New York. 505 pp.
McClelland, J., 1842. On the freshwater fishes collected by Willium Griffith during his travels from 1824 – 1845, Calcutta, J.Nat. Hist., 2: 560-589.
Mirza, Z.S., Mirza, M.R., Nadeem, M.S., & Sulehria, A.Q.K., 2013. Revised checklist of fishes of Mangla Reservoir, Pakistan. Biologia (Pakistan), 59(1): 1-6.
Mirza, M.R., & Sandhu, A.A., 2007. Fishes of the Punjab, Pak. Polymer Publications, Rahat Market, Urdu Bazar, Lahore. 71 pp.
Mirza, M. R., 2003. Checklist of freshwater fishes of Pakistan. Pak. J. Zool., suppl. Ser.3: 1-30.
Norrish, A.E., Skeaff, C.M., Arribas, G.L., Sharpe, S.J., & Jackson, R.T., 1999. Prostate cancer risk and consumption of fish oils: a dietary biomarker-based case-control study.Br. J. Cancer., 81(7):1238-42.
Odum, E.P. & Barrett, G.W. 2005. Fundamentals of Ecology, 5th Edition. Cengage Learning Pvt Limited, India.598 pp.
Rankhamb, S.V., 2011. Ichthyofaunal Diversity of Godavari River at Mudgal Tq. Pathri, Dist. Parbhani. Recent Res. Sc. & Tech., 3(12): 11-13.
Russell, P., 1803. Descriptions and figures of two hundred fishes; collected at Vizagapatam on the coast of Coromandel (2 Vol). W. Bulmer and Co., Shakespeare Press, Cleveland-Row.156 pp.
Talwar, P.K., & Jhingran, A.G., 1991. Inland fishes of India and adjacent countries. Vol. I and II. Oxford and IBH publishing Co. Pvt. Ltd. New Delhi, Bombay. 1158 pp.
Ubarhande, S.B., Jagtap, J.T., & Sonawane, S.R., 2011. Ichthyofanal Diversity from Ambadi Dam, Taluka Kannad, District, Aurangabad (M.S.). Recent Res. Sc. & Tech., 3(6): 34-37.
www.thebajaur.com retrieved on 10-05-2014) http://www.seriouslyfish.com/profile.php?genus=Crossocheilus&species=latius&id=1325 retrieved on 10-10-2011
BIOLOGIA (PAKISTAN) 2014, 60 (1), 165-168 PKISSN 0006 – 3096 (Print) ISSN 2313 – 206X (On-Line)
*Corresponding author: [email protected]
Application of Apical bud culture technique for Shoot proliferation of Solanum tuberosum L.
AISHA AHMED1, ATTIYA ANWAR1, HAJRA REMZAN1, SYEDA MUTHIRA ZANIB KAZMI1,
& *ATHAR HUSSAIN SHAH1,
Department of Botany, GCU Lahore, Pakistan
ABSTRACT
Apical bud of Solanum tuberosum L. was subjected to different growth regulators (NAA, BAP, 2,4-D and Kinetin) for shoot regeneration. Kinetin 0.5 mg/L and 2,4-D 1.5 mg/L were found better for shoot regeneration. BAP and NAA both in solo and in combination with a few exceptions resulted in callus formation. 2,4-D and Kinetin combinations gave best results. Keyword: Solanum tuberosum, apical bud, shoot proliferation, growth regulators,
_______________________________________________________________________________________
INTRODUCTION Potato (Solanum tuberosum L.) is a versatile vegetable that is eaten all around the year. It is considered to be the fourth major food crop of the world following rice, wheat and maize (Mustafa et al., 2002). It contains about 79% water, 18% starch, 2% protein, 1% vitamins, minerals and many trace elements (Ahmad et al., 2011), but it is best known for its carbohydrate contents. The annual diet of an average global citizen in the first decade of the 21st century included about 33kg of potato (FAO, 2008).
Potato is not native to Pakistan. It was introduced in the late 16th century from Europe. In 1947, potato cultivation in Pakistan was restricted to a few thousand hectares and total annual output was less than 30,000 tons but now they are grown over an area of 149 thousand hectares with production at the rate of 19.4 tons per hectare (Abbasi et al., 2012). Potato yield per hectare in Pakistan is far less than other potato producing countries. Potato yield has been reported to reach 100 tons per hectare under ideal conditions although commercial production is very low in the worlds is about 50 tons per hectare (FAO Stat, 2009).
Conventionally, the crop is propagated asexually by tubers known as 'seed potatoes'. However, this vegetative propagation contaminates tubers by different diseases resulting in poor quality and yield. Pests and diseases are the major stresses to high yield production in potatoes. A disease, called late blights, is one of the most destructive diseases in potatoes. This results in reduction in farmer’s profit and increase in market price of potatoes.
Plant Tissue Culture, also called micropropagation, is a practice used to propagate plants under sterile conditions, often to produce clones of a plant. The controlled and aseptic environment of tissue culture laboratory provides optimum conditions for multiplication of plant cultures. In general, it is believed that larger the size of the meristem, better the chances of its survival in vitro, whereas smaller the size of meristems, better the chances of its being virus free (Wang & Hu, 2008).
The objective of present study was to develop the best possible combination of growth regulators (PGRs) for an efficient and rapid in vitro propagation of Solanum tuberosum using apical buds from local potato stock. The protocol developed can be used to exploit selected genotype for its mass multiplication and thus commercialization.
MATERIALS AND METHODS
Solanum tuberosum L. a member of family Solanaceae was selected as subject material. MS medium (Murashige & Skoog, 1962) was used throughout the study supplemented with different growth hormones.
The media were supplemented with the growth regulators 2,4-D (2.4-dichlorophenoxy acetic acid). NAA (Naphthalene acetic acid), BAP (6-Benzylaminopurine), and Kinetin. Media was solidified with 0.6% Agar and poured in jars, up to 20 ml per jar, and autoclaved under 15lbs/inch2 pressure for 20 minutes at 25°C. All the explants were transferred aseptically to the vessels containing sterilized media in laminar air flow cabinet. After inoculation, vessels containing explants were placed in 25°C at relative humidity
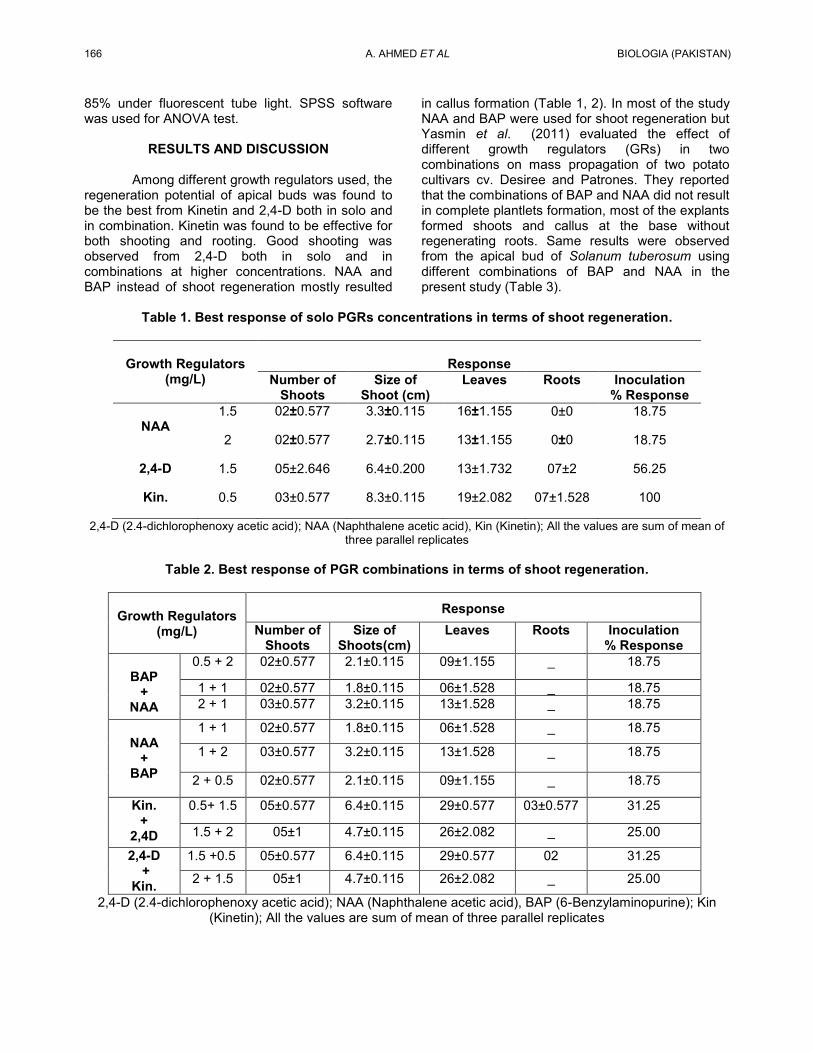
166 A. AHMED ET AL BIOLOGIA (PAKISTAN)
85% under fluorescent tube light. SPSS software was used for ANOVA test.
RESULTS AND DISCUSSION
Among different growth regulators used, the regeneration potential of apical buds was found to be the best from Kinetin and 2,4-D both in solo and in combination. Kinetin was found to be effective for both shooting and rooting. Good shooting was observed from 2,4-D both in solo and in combinations at higher concentrations. NAA and BAP instead of shoot regeneration mostly resulted
in callus formation (Table 1, 2). In most of the study NAA and BAP were used for shoot regeneration but Yasmin et al. (2011) evaluated the effect of different growth regulators (GRs) in two combinations on mass propagation of two potato cultivars cv. Desiree and Patrones. They reported that the combinations of BAP and NAA did not result in complete plantlets formation, most of the explants formed shoots and callus at the base without regenerating roots. Same results were observed from the apical bud of Solanum tuberosum using different combinations of BAP and NAA in the present study (Table 3).
Table 1. Best response of solo PGRs concentrations in terms of shoot regeneration.
Growth Regulators (mg/L)
Response
Number of Shoots
Size of Shoot (cm)
Leaves Roots Inoculation % Response
NAA
1.5 02±0.577 3.3±0.115 16±1.155 0±0 18.75
2 02±0.577 2.7±0.115 13±1.155 0±0 18.75
2,4-D 1.5 05±2.646 6.4±0.200 13±1.732 07±2 56.25
Kin. 0.5 03±0.577 8.3±0.115 19±2.082 07±1.528 100
2,4-D (2.4-dichlorophenoxy acetic acid); NAA (Naphthalene acetic acid), Kin (Kinetin); All the values are sum of mean of three parallel replicates
Table 2. Best response of PGR combinations in terms of shoot regeneration.
Growth Regulators (mg/L)
Response Number of
Shoots Size of
Shoots(cm) Leaves Roots Inoculation
% Response
BAP +
NAA
0.5 + 2 02±0.577 2.1±0.115 09±1.155 _ 18.75
1 + 1 02±0.577 1.8±0.115 06±1.528 _ 18.75 2 + 1 03±0.577 3.2±0.115 13±1.528 _ 18.75
NAA
+ BAP
1 + 1 02±0.577 1.8±0.115 06±1.528 _ 18.75
1 + 2 03±0.577 3.2±0.115 13±1.528 _ 18.75
2 + 0.5 02±0.577 2.1±0.115 09±1.155 _ 18.75
Kin. +
2,4D
0.5+ 1.5 05±0.577 6.4±0.115 29±0.577 03±0.577 31.25
1.5 + 2 05±1 4.7±0.115 26±2.082 _ 25.00
2,4-D +
Kin.
1.5 +0.5 05±0.577 6.4±0.115 29±0.577 02 31.25
2 + 1.5 05±1 4.7±0.115 26±2.082 _ 25.00
2,4-D (2.4-dichlorophenoxy acetic acid); NAA (Naphthalene acetic acid), BAP (6-Benzylaminopurine); Kin (Kinetin); All the values are sum of mean of three parallel replicates

VOL. 60 (1) APICAL BUD CULTURE TECHNIQUE FOR SHOOT PROLIFERATION 167
Nonsignficant
Fig., 1: Duncan test results.
Table 3. Concentrations that showed the best response in terms of Callus formation.
Growth Regulators(mg/L) Callus color Inoculation
% Response BAP 1.5 Green-Brown 18.75
BAP + NAA
0.5 + 0.5 Yellow-Brown 37.50 1.5 + 1.0 Yellow 18.75 2.0 + 2.0 Yellow-Light brown 18.75
NAA + BAP
1.0 + 1.5 Light yellow-Brown 18.75 1.5 + 0.5 Yellow 25.00 2.0 + 2.0 Yellow-Brown 18.75
NAA (Naphthalene acetic acid), BAP (6-Benzylaminopurine); All the values are sum of mean of three parallel replicates
A B
Plate.1: Plant regeneration from the apical bud of Solanum tuberosum L. A. Bud response in medium supplemented with 2.0 mg/L + 1.5 mg/L of 2,4-D + Kin. (x2) {Aerial view}. B. Bud response in medium supplemented with 0.5 mg/L + 0.5 mg/L of BAP + NAA (x2) {Lateral view}
For One-Way ANOVA, the results for number of shoots, shoot size and leaves were significant at p≤0.05. Duncan test results showed certain variations. The optimal value of Duncan for number of shoots were significant for different solo
concentrations of Kinetin, constant 0.5 mg/L and 1.5 mg/L Kinetin in combination with different concentrations of 2,4-D and constant 1.5 mg/L 2,4-D with different concentrations of Kinetin. The optimal value of Duncan for number of leaves were

168 A. AHMED ET AL BIOLOGIA (PAKISTAN)
significant for constant 0.5 mg/L BAP with different concentrations of NAA, constant 2 mg/L Kinetin with different concentrations of 2,4-D and constant 1.0 mg/L 2,4-D with different concentrations of Kinetin. For shoot size value of Duncan were non-significant for all concentrations used. (Figure 1)
REFERENCES
Abbasi, N.A., ahoor, M., Khan, H. & Qureshi, A. A.,
2012. Effect of Encapsulated calcium carbide application at different growth stages on potato (Solanum tuberosum L.), growth yield and tuber quality. Pak. J. Bot., 44(5):1543-1550.
Ahmad, N., Khan, A. A., Khan, N. A., Binyamin, R., & Khan, M. A., 2011. Identification of resistance source in potato germplasm against PVX and PVY. Pak. J. Bot., 43(6):2745-2749.
FAO. 2008. http://www.FAO.org.
FAO Stat. 2009. http://faostat.fao.org/site/567 Page ID = 567
Murashige, T. & Skoog, F., 1962. A revised medium for rapid growth and bioassays with tobacco tissue cultures. Physiol. Plant., 15: 473-497.
Mustafa, B.M. & Sarker, R.H., 2002. Regeneration and agrobacterium-mediated genetic transformation of two indigenous potato varieties of Bangladesh. Plant Tissue Cult., 12(1): 69-77.
Wang, P.J. & Hu, C.Y., 2008. Regeneration of virus free plants through in vitro culture. IN: A. Fiechter (Ed.) Advances in Biochemical Engineering. Springer-Verlag Publishers, Berlin. pp: 61-69.
Yasmin, A., Jalbani, A.A., & Raza, S., 2011. Effect of growth regulators on meristem tip culture of local potato cvs desiree and patrones. Pak. J. Agri., Agril. Engg., Vet. Sci., 27(2): 143-149.