BIOL 4120: Principles of Ecology Lecture 8: The Distribution and Spatial Structure of Populations...
52
Lecture 8: The Lecture 8: The Distribution and Distribution and Spatial Structure of Spatial Structure of Populations Populations Dafeng Hui Dafeng Hui Room: Harned Hall 320 Room: Harned Hall 320 Phone: 963-5777 Phone: 963-5777 Email: Email: [email protected] [email protected]
-
Upload
ashlee-briggs -
Category
Documents
-
view
219 -
download
3
Transcript of BIOL 4120: Principles of Ecology Lecture 8: The Distribution and Spatial Structure of Populations...

BIOL 4120: Principles of EcologyBIOL 4120: Principles of Ecology
Lecture 8: The Distribution Lecture 8: The Distribution and Spatial Structure of and Spatial Structure of
PopulationsPopulations
Dafeng HuiDafeng Hui
Room: Harned Hall 320Room: Harned Hall 320
Phone: 963-5777Phone: 963-5777
Email: [email protected]: [email protected]
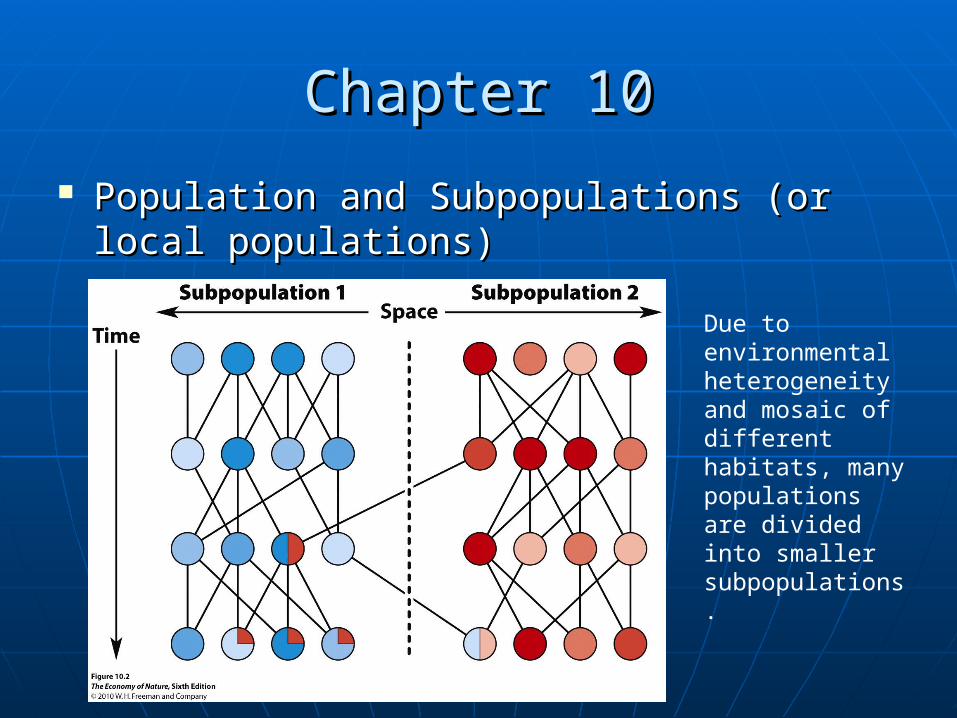
Chapter 10Chapter 10
Population and Subpopulations (or local Population and Subpopulations (or local populations)populations)
Due to environmental heterogeneity and mosaic of different habitats, many populations are divided into smaller subpopulations.

Properties of PopulationProperties of Population
Most important property is abundance of Most important property is abundance of population which is determined by its population which is determined by its distribution and density.distribution and density.
Populations have Populations have • Distribution: population extent, geographic area occupied Distribution: population extent, geographic area occupied
by a population (also called geographic range)by a population (also called geographic range)• Population size: Number of individuals in a population Population size: Number of individuals in a population
(varies with food supplies, predation rates etc.)(varies with food supplies, predation rates etc.)• Population Structure: encompasses a number of attributes, Population Structure: encompasses a number of attributes,
including density and spacing of individuals within suitable including density and spacing of individuals within suitable habitat and proportions individuals of each sex and age habitat and proportions individuals of each sex and age class (Spatial structure)class (Spatial structure)
Density: How to determine population density?Density: How to determine population density? Age structures and Different sex ratios along timeAge structures and Different sex ratios along time
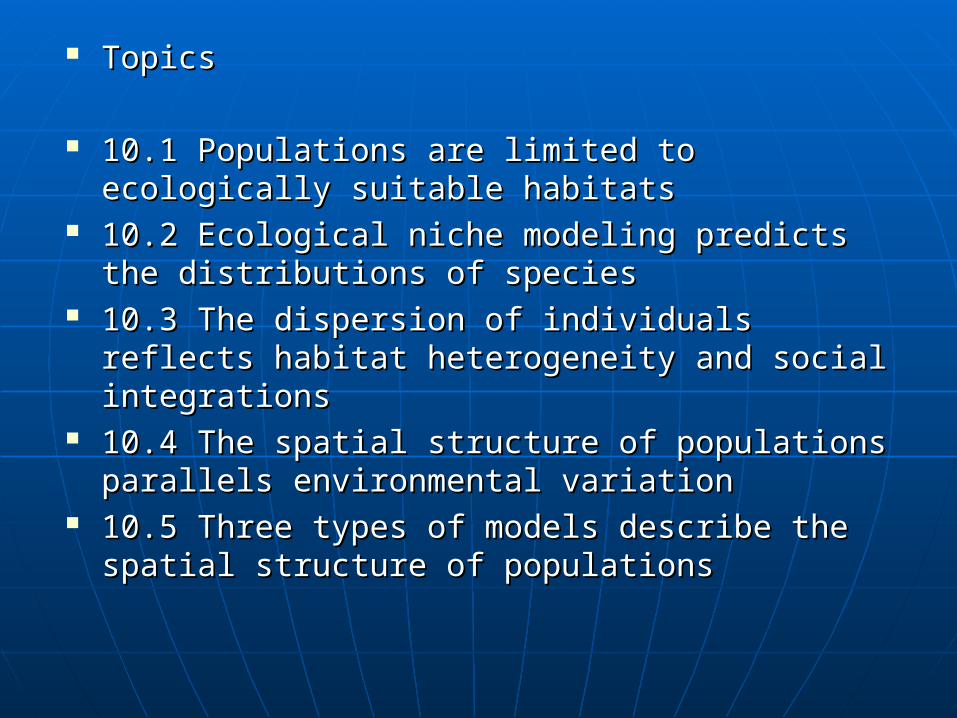
TopicsTopics
10.1 Populations are limited to ecologically 10.1 Populations are limited to ecologically suitable habitatssuitable habitats
10.2 Ecological niche modeling predicts the 10.2 Ecological niche modeling predicts the distributions of speciesdistributions of species
10.3 The dispersion of individuals reflects habitat 10.3 The dispersion of individuals reflects habitat heterogeneity and social integrationsheterogeneity and social integrations
10.4 The spatial structure of populations parallels 10.4 The spatial structure of populations parallels environmental variationenvironmental variation
10.5 Three types of models describe the spatial 10.5 Three types of models describe the spatial structure of populationsstructure of populations
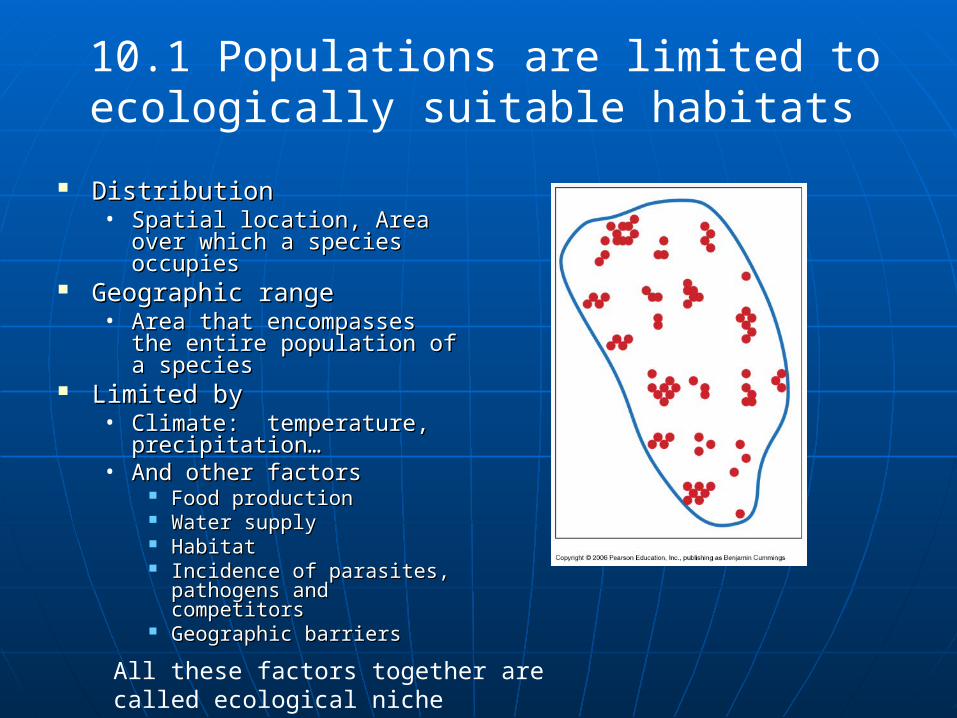
DistributionDistribution• Spatial location, Area over Spatial location, Area over
which a species occupieswhich a species occupies Geographic rangeGeographic range
• Area that encompasses Area that encompasses the entire population of a the entire population of a speciesspecies
Limited by Limited by • Climate: temperature, Climate: temperature,
precipitation…precipitation…• And other factorsAnd other factors
Food production Food production Water supply Water supply HabitatHabitat Incidence of parasites, Incidence of parasites,
pathogens and pathogens and competitorscompetitors
Geographic barriersGeographic barriers
10.1 Populations are limited to ecologically suitable habitats
All these factors together are called ecological niche

The distribution of a species is related The distribution of a species is related to ecological nicheto ecological niche
Fundamental nicheFundamental niche: The range of : The range of physical conditions over which physical conditions over which species can persistspecies can persist
Realized niche:Realized niche: Within the range of Within the range of conditions, predators, pathogens and conditions, predators, pathogens and competitions limit the distribution of competitions limit the distribution of a species to a smaller placea species to a smaller place
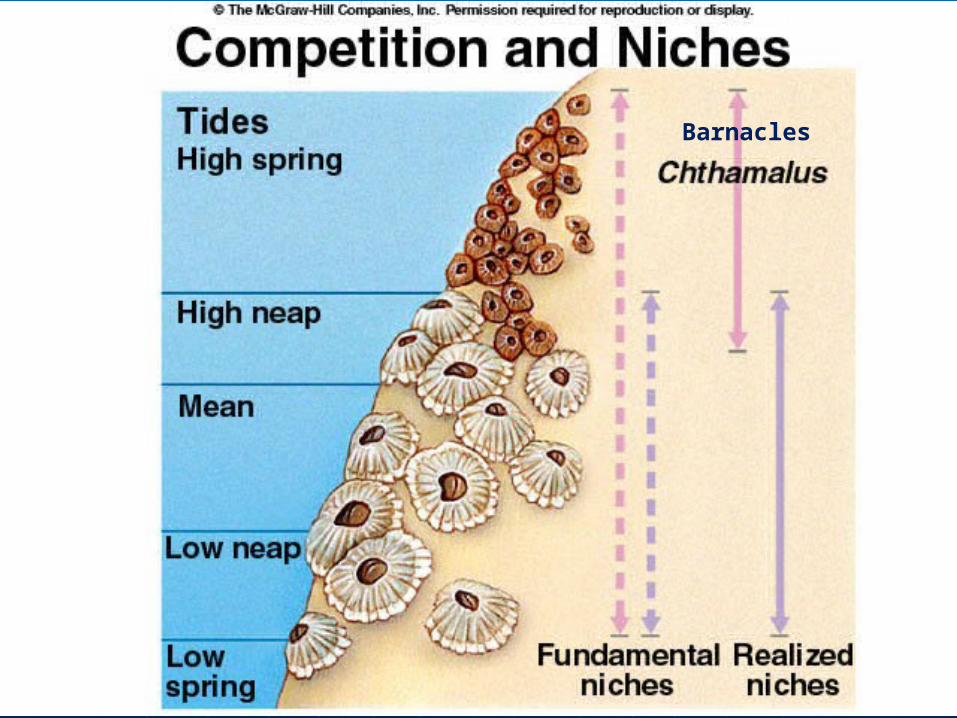
Barnacles

Distribution of a species varies at Distribution of a species varies at different spatial scalesdifferent spatial scales
Continental scale: climate suitability
Particular area: microclimate and stream banks (coniferous trees and abundance)
Within a particular locality: occupy stumps of conifer trees (pH is acidic)
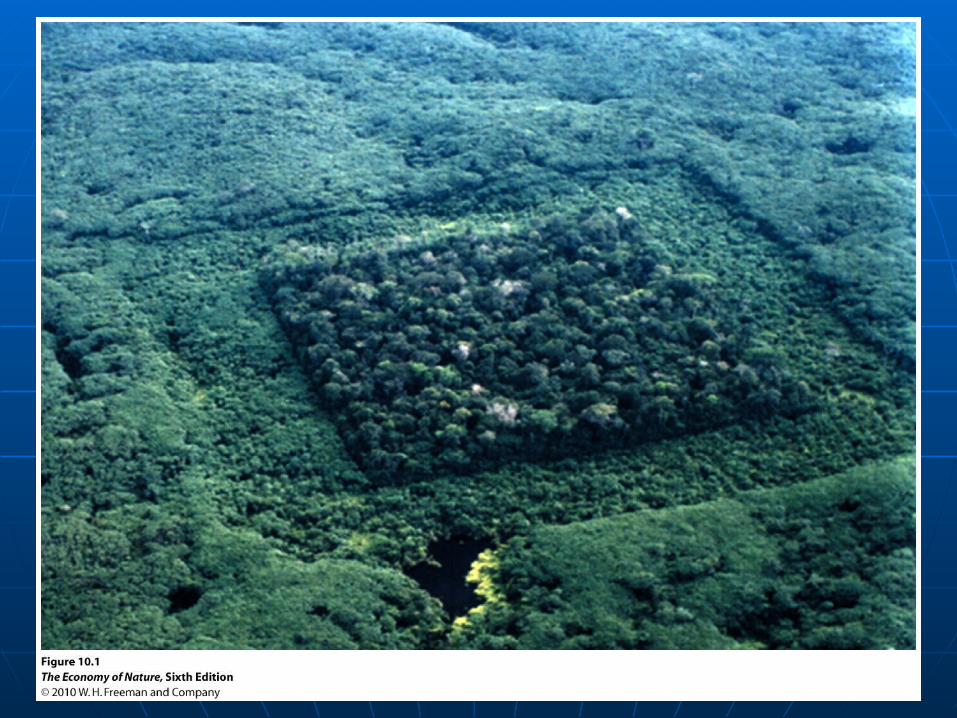
Local subpopulations
Distribution of moss Tetraphis
BIOL 4120: Principles of EcologyBIOL 4120: Principles of Ecology
Lecture 8: The Distribution Lecture 8: The Distribution and Spatial Structure of and Spatial Structure of
PopulationsPopulations
Dafeng HuiDafeng Hui
Room: Harned Hall 320Room: Harned Hall 320
Phone: 963-5777Phone: 963-5777
Email: [email protected]: [email protected]

RecapRecap
Population & MetapopulationPopulation & Metapopulation
Populations propertiesPopulations properties
Distribution, size, and structure (density, Distribution, size, and structure (density, spacing, age, sex etc)spacing, age, sex etc)
Niche: Fundamental nicheNiche: Fundamental niche
Realized nicheRealized niche
Distribution patterns at different scalesDistribution patterns at different scales

Distribution of the perennial shrub Clematis
Only in Jefferson county, Missouri
Dry and rocky soils
Further confined to suitable soil structure, moisture and nutrients

Individual fitness is highest within the natural distribution of a species
A transplant study by Amy Angert et al. of Michigan State University
Two species of monkeyflower, one grows in low and one in high elevations
Other factors influence species Other factors influence species distributionsdistributions
•Dispersal limitationDispersal limitation•MigrationMigration

Dispersal limitationDispersal limitation
Dispersal: movement of individuals in space. Dispersal: movement of individuals in space. Dispersal limitation: the absence of a population from suitable Dispersal limitation: the absence of a population from suitable
habitat because of barriers to dispersalhabitat because of barriers to dispersal Methods of dispersalMethods of dispersal
Passive dispersal (gravity, wind, water, animal) seeds of Passive dispersal (gravity, wind, water, animal) seeds of plants, small animals, fish, shrimp. fruits and seeds ate and plants, small animals, fish, shrimp. fruits and seeds ate and carried by animals (long distances)carried by animals (long distances)
Active dispersal: animal movement.Active dispersal: animal movement.
Barriers to long-distance dispersal often limit geographic ranges Barriers to long-distance dispersal often limit geographic ranges are overcome by human interventionare overcome by human interventionMove plants and animals around the world (invasive species)Move plants and animals around the world (invasive species)

Geographic range of a Geographic range of a population includes all population includes all the areas of its members the areas of its members occupy during their occupy during their entire life historyentire life history
Migration Migration –– A round trip, A round trip, perhaps involving perhaps involving matingmating
Red-necked ducks:Red-necked ducks:
Breeding in the northeastBreeding in the northeastWinter in South Carolina Winter in South Carolina
and Floridaand Florida
Gray whale:Gray whale:Winter in California,Winter in California,Summer in ArcticSummer in Arctic
Migratory pathways of Ring-necked ducks and gray whale.
Migration
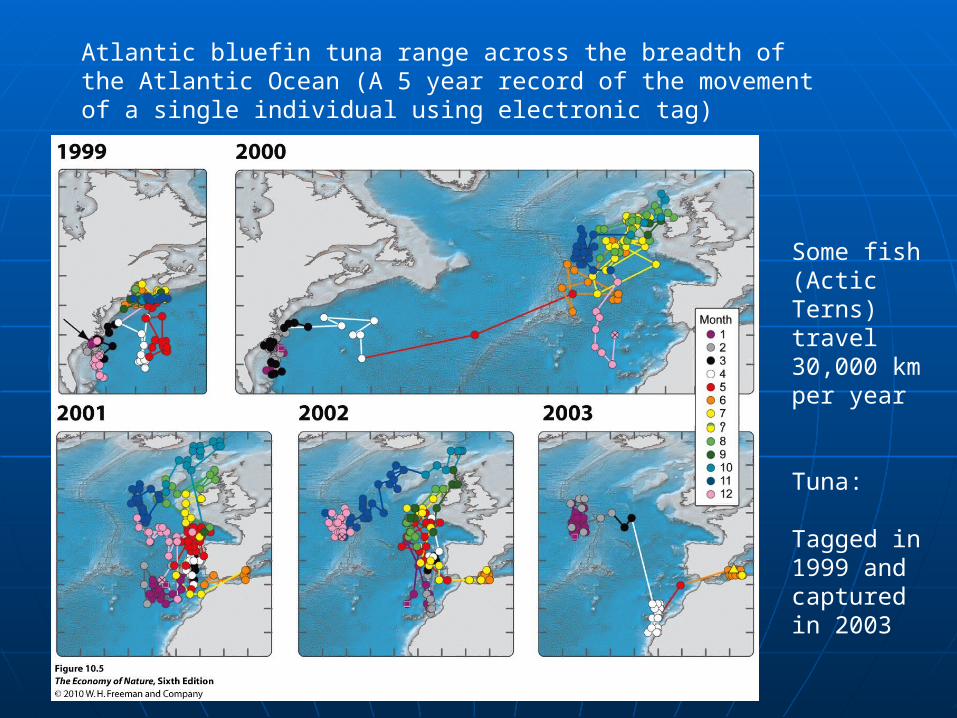
Atlantic bluefin tuna range across the breadth of the Atlantic Ocean (A 5 year record of the movement of a single individual using electronic tag)
Some fish (Actic Terns) travel 30,000 km per year
Tuna:
Tagged in 1999 and captured in 2003

Wildebeests in East Africa migrate long distances following the geographic pattern of seasonal rainfall and fresh vegetation

Some migratory movements are a response of occasional failure or depletion of local food supplies (Somalia, Africa, 1962)
e.g.: migratory locusts

How to predict the species distribution?How to predict the species distribution?
For ecological management purposes (species For ecological management purposes (species protection, conservation, new species introduction), we protection, conservation, new species introduction), we need to understand and predict species distributionneed to understand and predict species distribution
Ecological niche modeling: Ecological niche modeling: Using exist species Using exist species distribution knowledge and the related climatic factors to distribution knowledge and the related climatic factors to predict actual or potential species distribution under predict actual or potential species distribution under future climate conditionsfuture climate conditions
10.2 Ecological niche modeling predicts the distributions of species
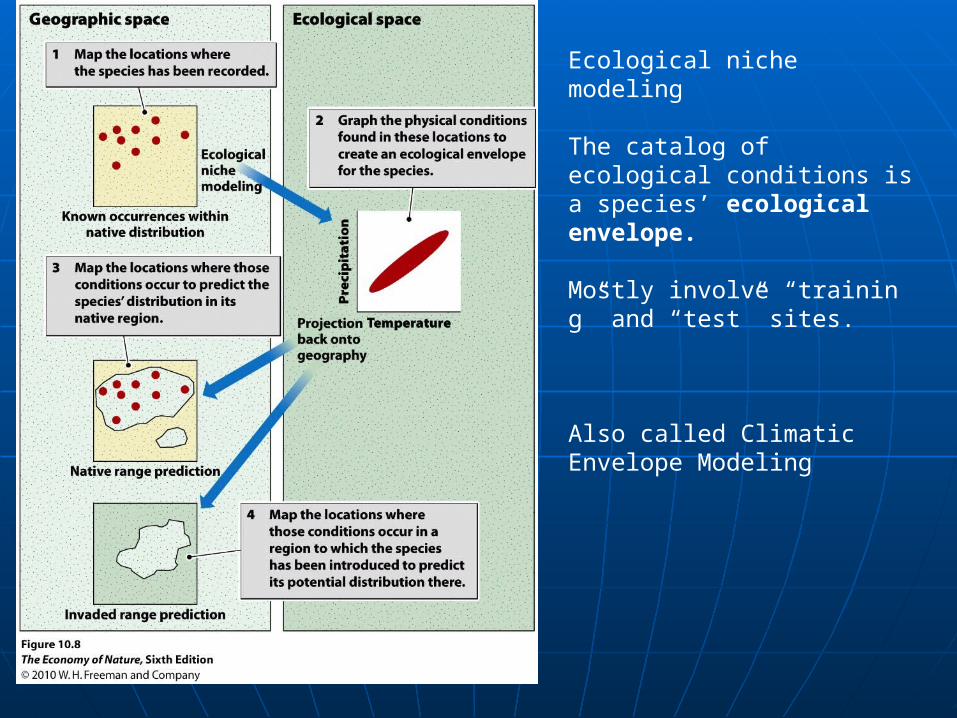
Ecological niche modeling
The catalog of ecological conditions is a species’ ecological envelope.
Mostly involve “training” and “test” sites.
Also called Climatic Envelope Modeling

Ecological envelopes of three species of Eucalyptus trees across 6,080 plots in southeastern New South Wales, Australia

Ecological envelopes can be used to predict the distributions of invasive species
Aquatic plant (Hydrilla) and Chinese bush clover (Lespedeza)
Native regions in Asia and new location in US

Global warming on the distribution of Anchovies: expanding their geographic ranges northward increased species richness in North Sea
Hiddink and ter Hofstede 2008
Increased species diversity, but decreased some commercial species.

DispersionDispersion• The spacing of individuals within respect to one The spacing of individuals within respect to one
another within the geographic range of a another within the geographic range of a populationpopulation
Not dispersalNot dispersal
10.3 The dispersion of individuals reflects habitat heterogeneity and social integrations
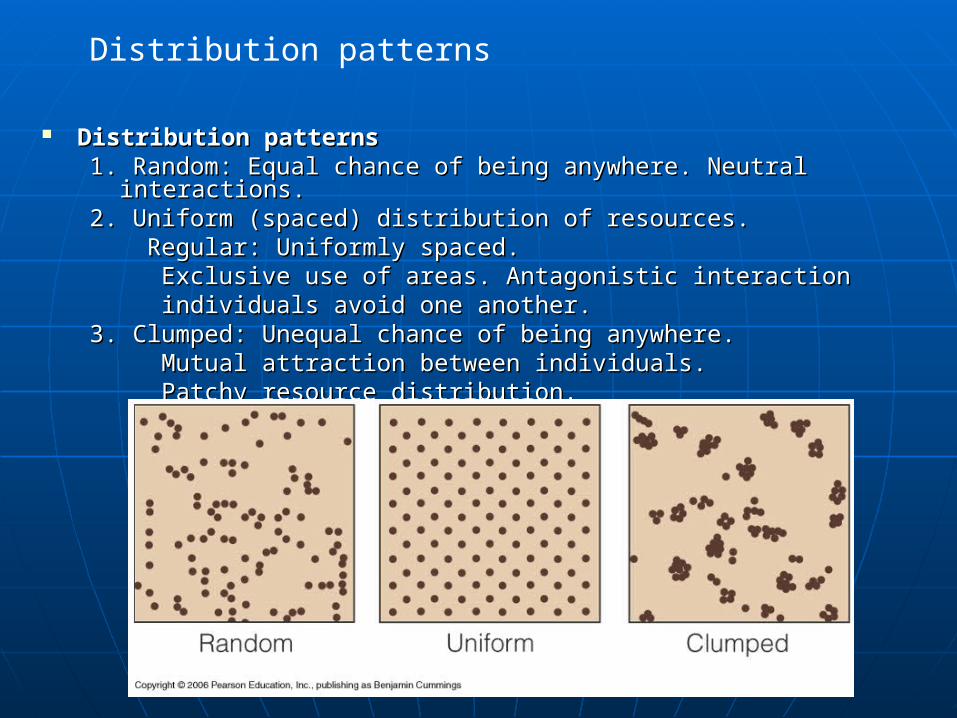
Distribution patternsDistribution patterns1. Random: Equal chance of being anywhere. Neutral interactions.1. Random: Equal chance of being anywhere. Neutral interactions.2. Uniform (spaced) distribution of resources.2. Uniform (spaced) distribution of resources. Regular: Uniformly spaced.Regular: Uniformly spaced. Exclusive use of areas. Antagonistic interactionExclusive use of areas. Antagonistic interaction individuals avoid one another.individuals avoid one another.3. Clumped: Unequal chance of being anywhere.3. Clumped: Unequal chance of being anywhere. Mutual attraction between individuals.Mutual attraction between individuals. Patchy resource distribution.Patchy resource distribution.
Distribution patterns

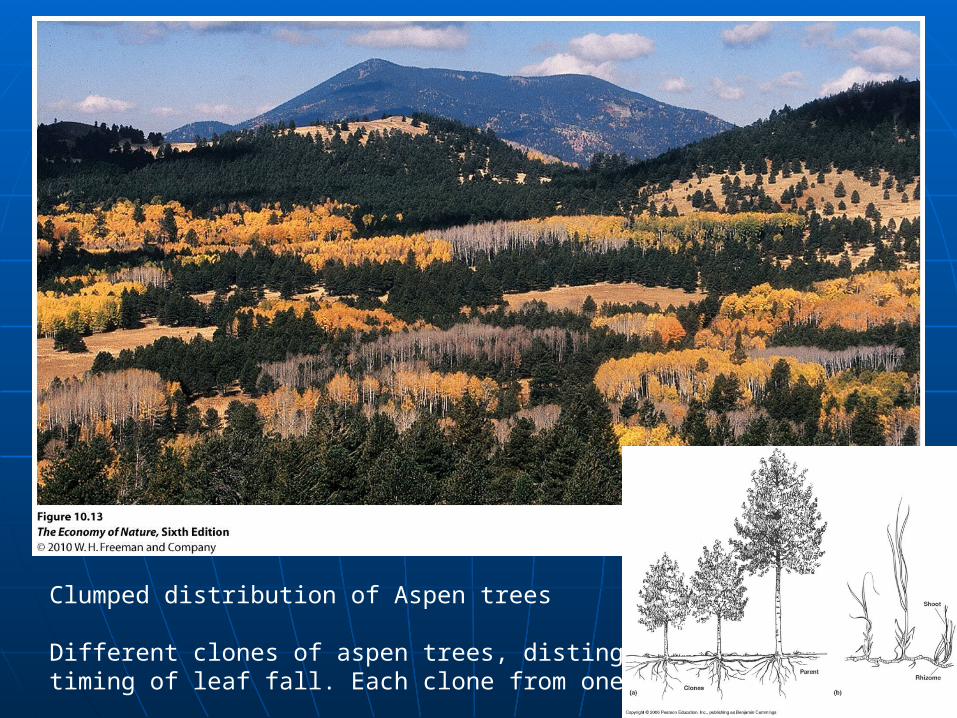
Clumped distribution of Aspen trees
Different clones of aspen trees, distinguished by timing of leaf fall. Each clone from one seed
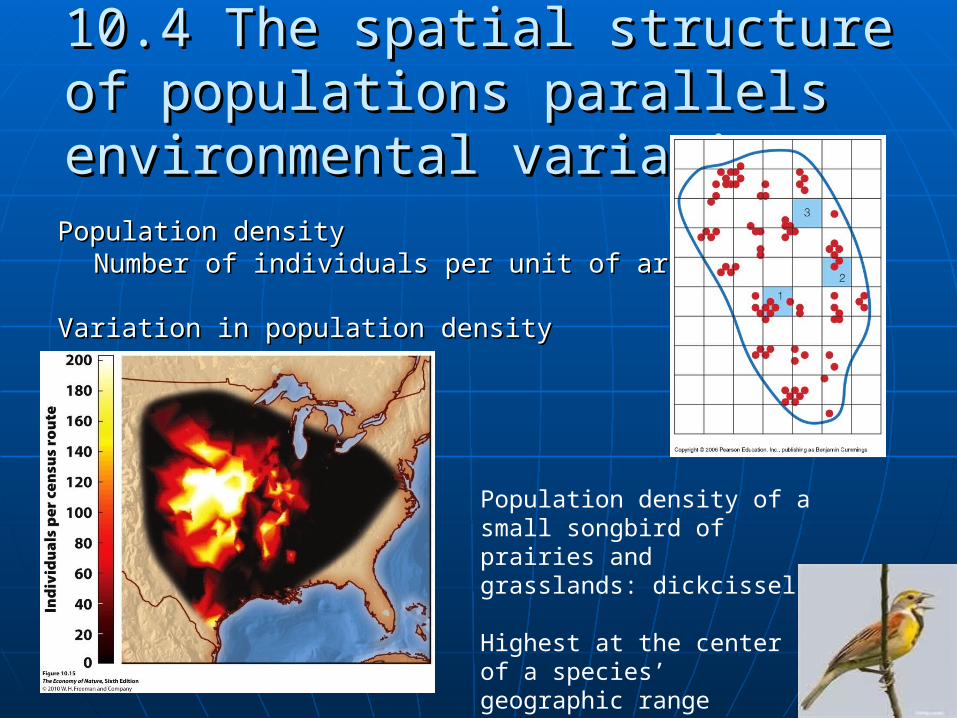
10.4 The spatial structure of 10.4 The spatial structure of populations parallels environmental populations parallels environmental variationvariationPopulation densityPopulation density
Number of individuals per unit of areaNumber of individuals per unit of area
Variation in population densityVariation in population density
Population density of a small songbird of prairies and grasslands: dickcissel
Highest at the center of a species’ geographic range

Influenced by available habitatInfluenced by available habitat Carolina wren: Carolina wren: Northwards -7Northwards -7ooC; Westward>52mmC; Westward>52mm
• When all environmental factors within its range of When all environmental factors within its range of tolerance, the organism can live in its habitattolerance, the organism can live in its habitat
Horned larkHorned lark• Avoids forestsAvoids forests• Available territoryAvailable territory
RecapRecap
Populations are limited to ecologically suitable Populations are limited to ecologically suitable habitatshabitats
Dispersal and migrationDispersal and migration
Spatial patternsSpatial patterns Ecological niche modeling predicts the Ecological niche modeling predicts the
distributions of speciesdistributions of species Ecological niche modelEcological niche model The spatial structure of populations parallels The spatial structure of populations parallels
environmental variationenvironmental variation

Ideal free distribution hypothesisIdeal free distribution hypothesisAll individuals seek good patch and good patch filled up quickly and eventually, becomes less favorable than poor patch.
The quality of these good patches decreases until poor patches become equally good choices.
In the end, individuals move from better to poorer patches until each patch has the same value for individual fitness, regardless of the intrinsic patch quality.

Dispersal from high-density to Dispersal from high-density to low density patcheslow density patches
Population distribution rarely reach Ideal Free Distribution
1. individuals do not know which patches are good patches 2. dominant individuals may forces subordinates to leave high-quality patches
Results: individuals in best habitats produce surplus individuals whereas in poor habitats, deaths exceeds births and populations can’t maintain their numbers

Dispersal from high-density to Dispersal from high-density to low density patcheslow density patches
Immigration from good to poor patches
One example: Blue tit (Parus caeruleus), a small songbird
Two habitats: Deciduous downy oak, more caterpillars as food, high density (90 pairs/100 ha), high reproduction (5.8/pair) Everygreen holm oak, low density (10 pairs/100 ha), low reproduction (3.6 /pair)
Immigration maintain poor patch subpopulations (otherwise, 13% decrease).
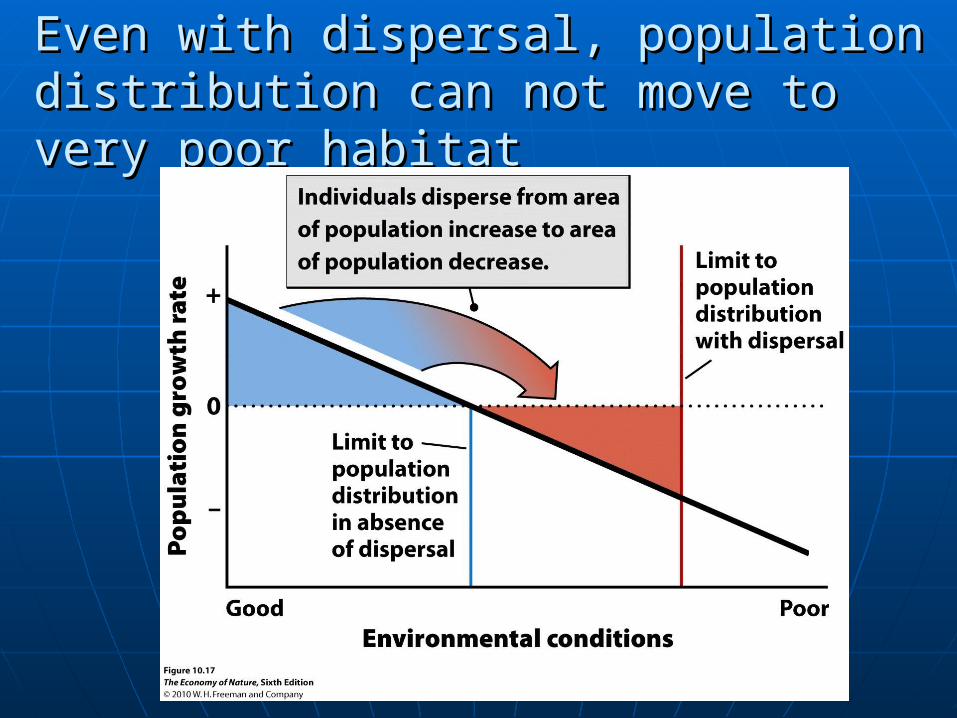
Even with dispersal, population distribution Even with dispersal, population distribution can not move to very poor habitatcan not move to very poor habitat

10.5 Three types of models describe 10.5 Three types of models describe the spatial structure of populationsthe spatial structure of populations

10.6 Dispersal is essential to the 10.6 Dispersal is essential to the integration of populationsintegration of populations
When individuals disperse throughout a population, they link different subpopulations together and make the whole population function and evolve as a single structure. When dispersal is limited, different subpopulations behave independently to each other.
Measurements of dispersal: Method: mark and recapture
Life time dispersal distance: how far an individuals move, on average, from their birthplace to where they reproduce.Life time dispersal area:Neighborhood size: number of individuals, defined by the life time dispersal area times the population density.
An example, 8 small songbird species:Life time dispersal distances: 344 to 1,681 meters
Population densities: 16 to 480 individuals per sq. km Neighborhood size: 151 to 7,697 individuals
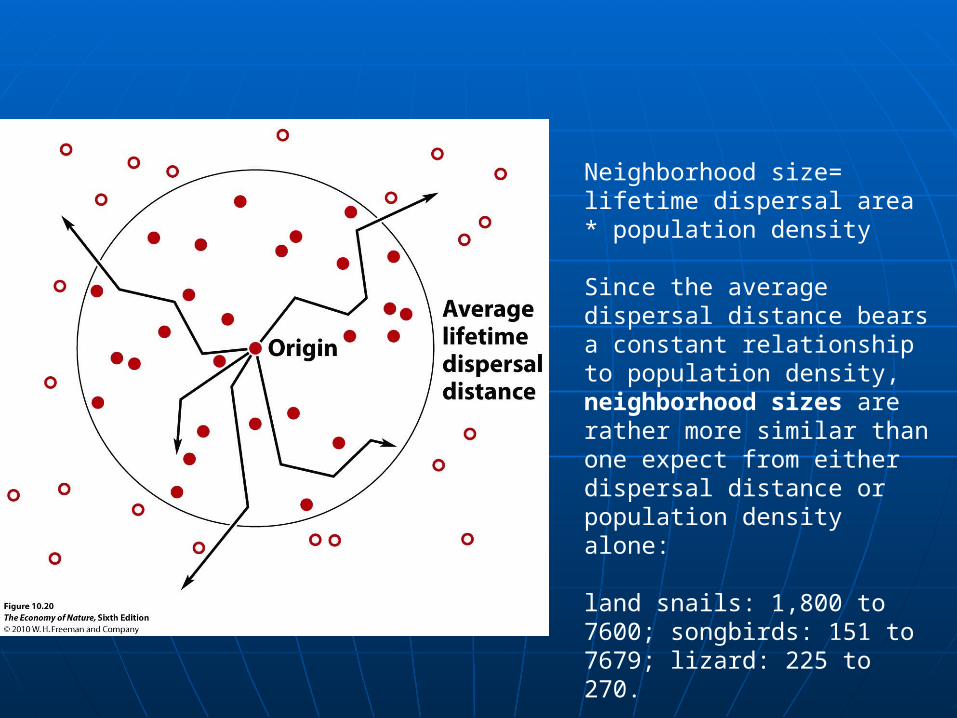
Neighborhood size= lifetime dispersal area * population density
Since the average dispersal distance bears a constant relationship to population density, neighborhood sizes are rather more similar than one expect from either dispersal distance or population density alone:
land snails: 1,800 to 7600; songbirds: 151 to 7679; lizard: 225 to 270.
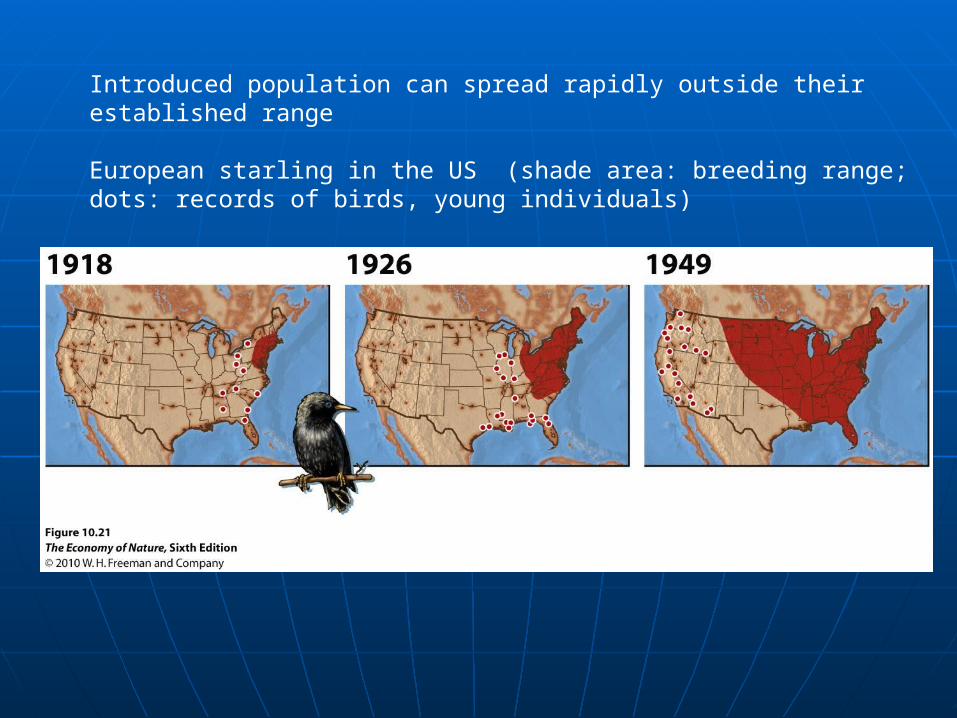
Introduced population can spread rapidly outside their established range
European starling in the US (shade area: breeding range; dots: records of birds, young individuals)

Invasive speciesInvasive species
Gypsy moth caterpillars
Defoliated oak forest$764 M loss in 1981

Invasive speciesInvasive species
Kudzu, an invasive species
Native to Asia, introduced to US as an ornamental vine in 1876
Used to control soil erosion in 1930s and 1940s
1950s, recognized as pest
Cover southeastern US, 2 million to 7 million acres

10.7 Macroecology addresses 10.7 Macroecology addresses patterns of range size and patterns of range size and
population densitypopulation density
Macroecology: study of relationships between organisms and environments at large spatial scales; to determine and explain the distribution patterns and population size of a particular species by large samples of species.
Macroecology addresses patterns Macroecology addresses patterns of range size and population of range size and population
densitydensity
James Brown, University of New Mexico
Distribution and population size of a species reflects the distribution of conditions to which individuals of the species were well adapted.
If these conditions are common and widespread, then the population should be common and wide-spread.
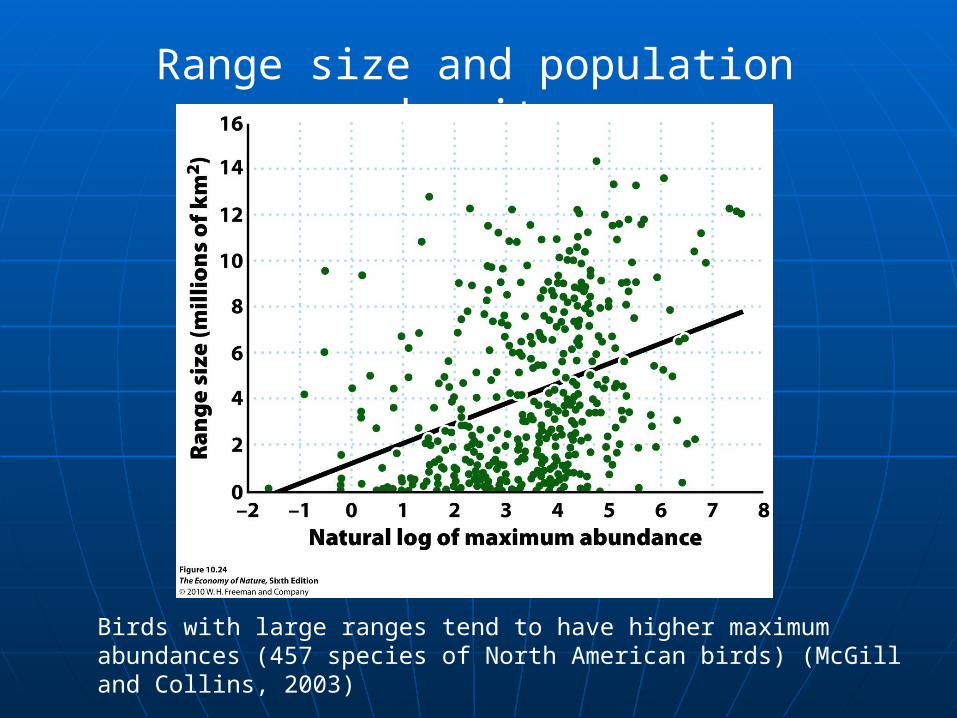
Range size and population density
Birds with large ranges tend to have higher maximum abundances (457 species of North American birds) (McGill and Collins, 2003)

Body size, distribution, and abundance
Population density to body size, a matter of size relative to spaceSample of herbivorous mammals, slope is -0.73. (Gaston and Blackburn 2000)

One example: Population density in carnivores is closely related to their body size
The density of population decreases as the -2/3 power of body mass of predator.
(Carbone and Gittleman 2002)
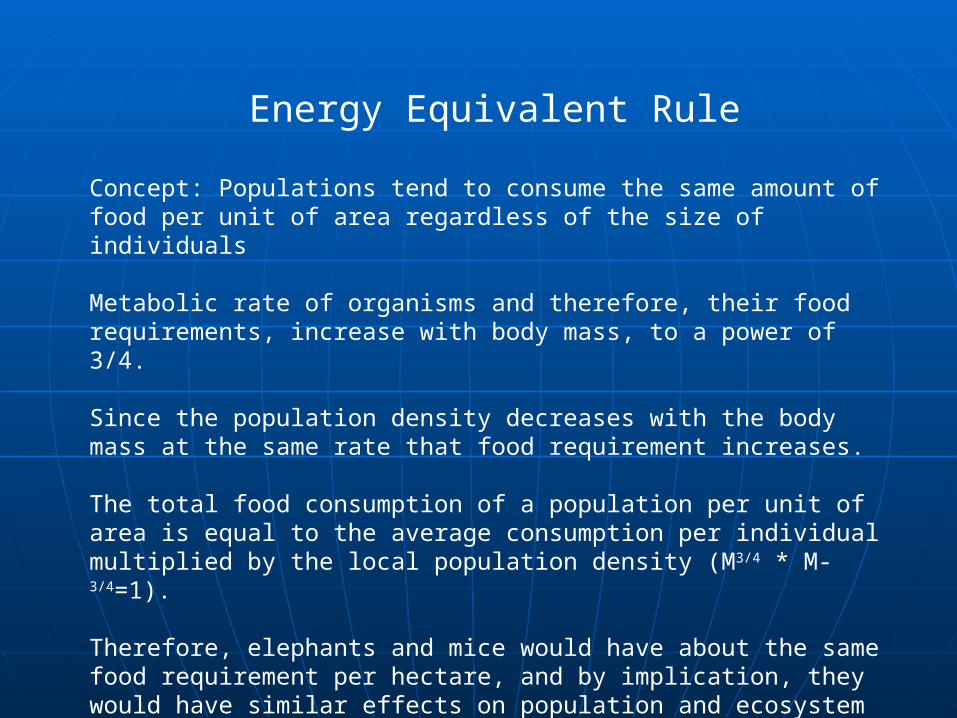
Energy Equivalent Rule
Concept: Populations tend to consume the same amount of food per unit of area regardless of the size of individuals
Metabolic rate of organisms and therefore, their food requirements, increase with body mass, to a power of 3/4.
Since the population density decreases with the body mass at the same rate that food requirement increases.
The total food consumption of a population per unit of area is equal to the average consumption per individual multiplied by the local population density (M3/4 * M-3/4=1).
Therefore, elephants and mice would have about the same food requirement per hectare, and by implication, they would have similar effects on population and ecosystem processes.

10.8 Variation in populations over space and time
Distribution of crop damage caused by chinch bugs in Illinois varied dramatically over the period between 1840 and 1939.
Yellow: low density of chinch bugsBlue: high density
Reasons: climate change, resources, predators and pathogens?
Population density change over time and space

The ENDThe END

Tiger Beetle of Cold ClimatesTiger Beetle of Cold Climates

RecapRecap
Populations are limited to ecologically suitable Populations are limited to ecologically suitable habitatshabitats
DistributionDistribution
Factors (niche)Factors (niche)
Spatial patternsSpatial patterns Ecological niche modeling predicts the Ecological niche modeling predicts the
distributions of speciesdistributions of species Ecological niche modelEcological niche model