Bioinformatics and Biomarker Discovery Part 1: Foundationswongls/courses/mci5004/mci08/part1... ·...
21
1 Bioinformatics and Biomarker Discovery Part 1: Foundations Limsoon Wong 28 August 2008 Copyright 2008 © Limsoon Wong Themes of Bioinformatics Bioinformatics = Data Mgmt + Knowledge Discovery + Sequence Analysis + Physical Modeling + …. Knowledge Discovery = Statistics + Algorithms + Databases Applications include diagnosis, prognosis, & treatment optimization, often thru biomarker discovery
-
Upload
trinhnguyet -
Category
Documents
-
view
215 -
download
0
Transcript of Bioinformatics and Biomarker Discovery Part 1: Foundationswongls/courses/mci5004/mci08/part1... ·...
1
Bioinformatics and Biomarker DiscoveryPart 1: Foundations
Limsoon Wong28 August 2008
Copyright 2008 © Limsoon Wong
Themes of BioinformaticsBioinformatics =
Data Mgmt + Knowledge Discovery +Sequence Analysis + Physical Modeling + ….
Knowledge Discovery =Statistics + Algorithms + Databases
Applications include diagnosis, prognosis, & treatment optimization, often thru biomarker discovery
2
Copyright 2008 © Limsoon Wong
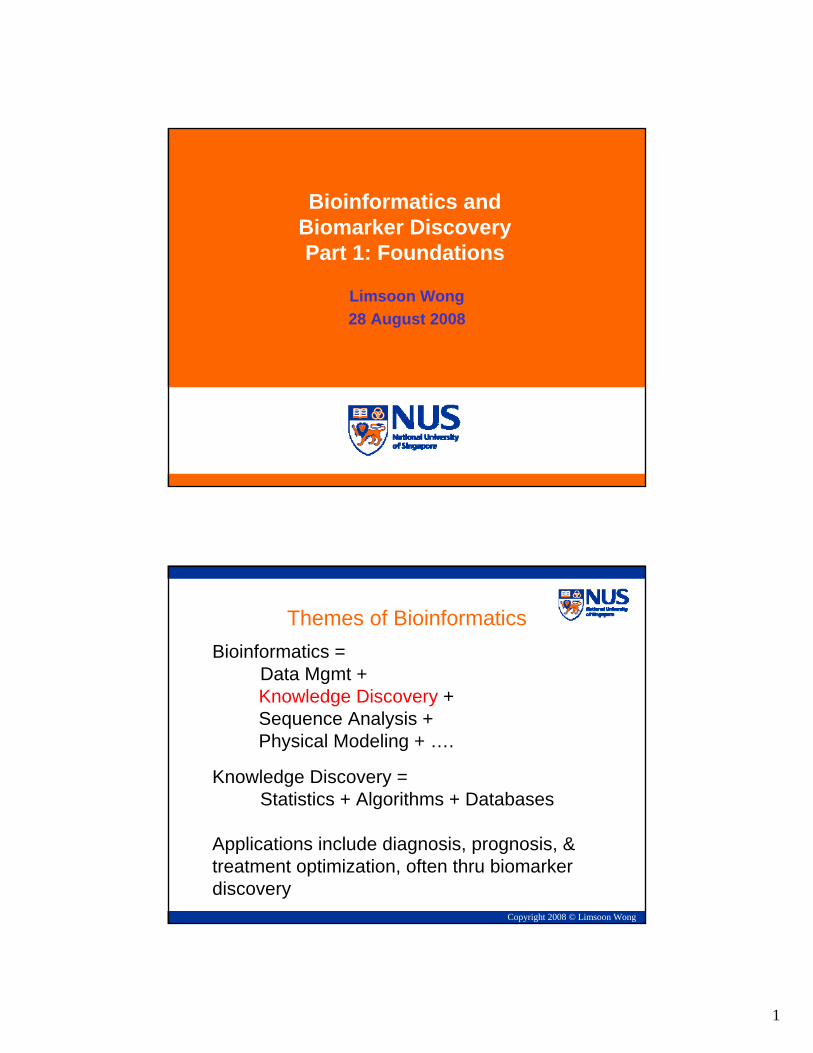
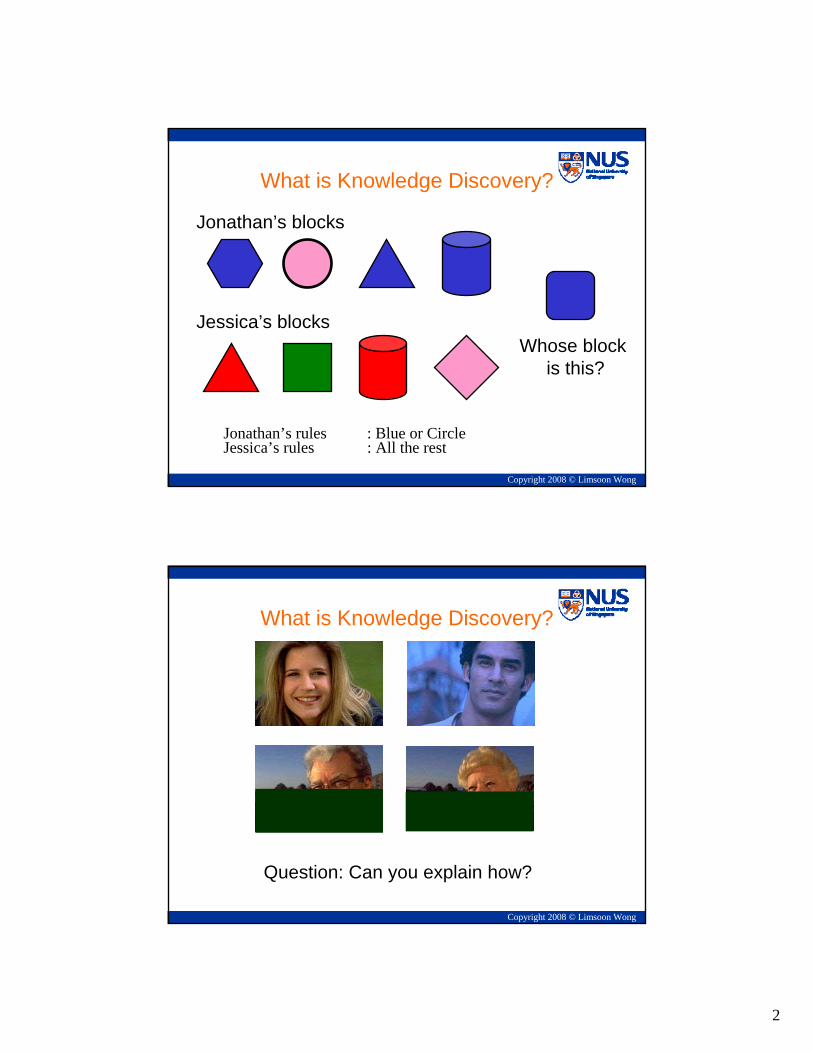
Jonathan’s rules : Blue or CircleJessica’s rules : All the rest
What is Knowledge Discovery?
Whose block is this?
Jonathan’s blocks
Jessica’s blocks
Copyright 2008 © Limsoon Wong
What is Knowledge Discovery?
Question: Can you explain how?
3
Copyright 2008 © Limsoon Wong
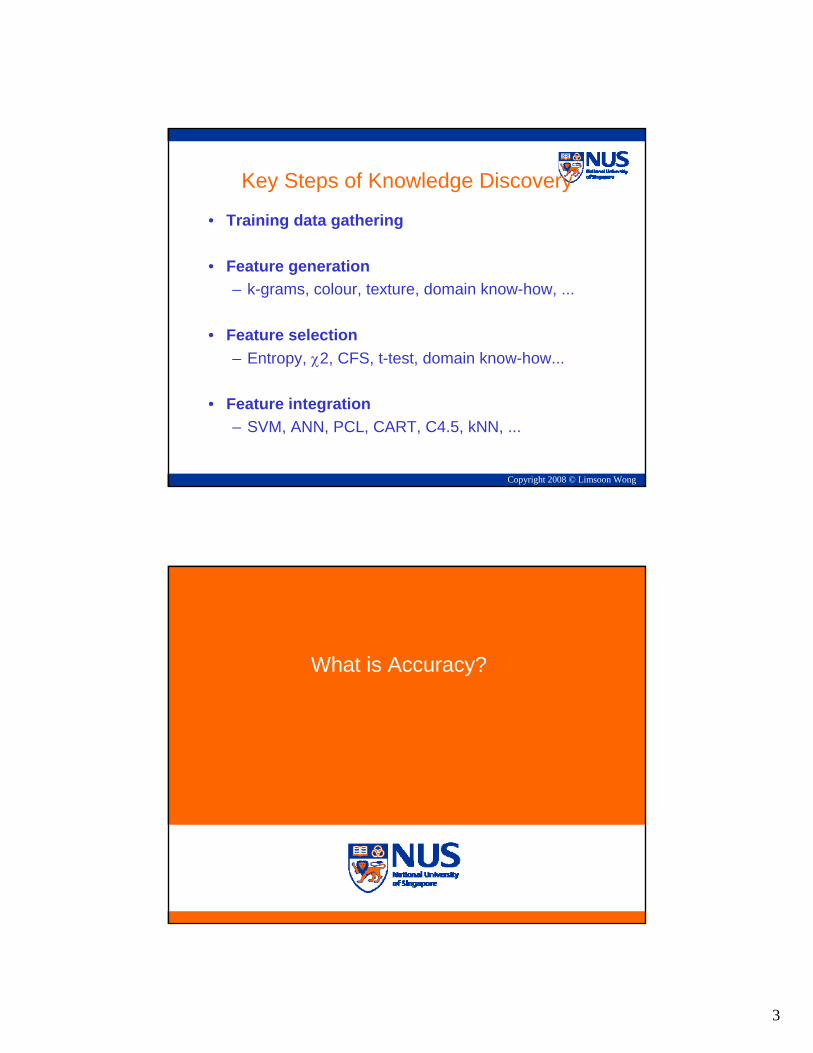
Key Steps of Knowledge Discovery
• Training data gathering
• Feature generation– k-grams, colour, texture, domain know-how, ...
• Feature selection– Entropy, χ2, CFS, t-test, domain know-how...
• Feature integration– SVM, ANN, PCL, CART, C4.5, kNN, ...
What is Accuracy?

4
Copyright 2008 © Limsoon Wong
What is Accuracy?
Accuracy =No. of correct predictions
No. of predictions
=TP + TN
TP + TN + FP + FN
Copyright 2008 © Limsoon Wong
Examples (Balanced Population)
• Clearly, B, C, D are all better than A• Is B better than C, D?• Is C better than B, D?• Is D better than B, C?
classifier TP TN FP FN AccuracyA 25 25 25 25 50%B 50 25 25 0 75%C 25 50 0 25 75%D 37 37 13 13 74%
Accuracy may nottell the whole story
5
Copyright 2008 © Limsoon Wong
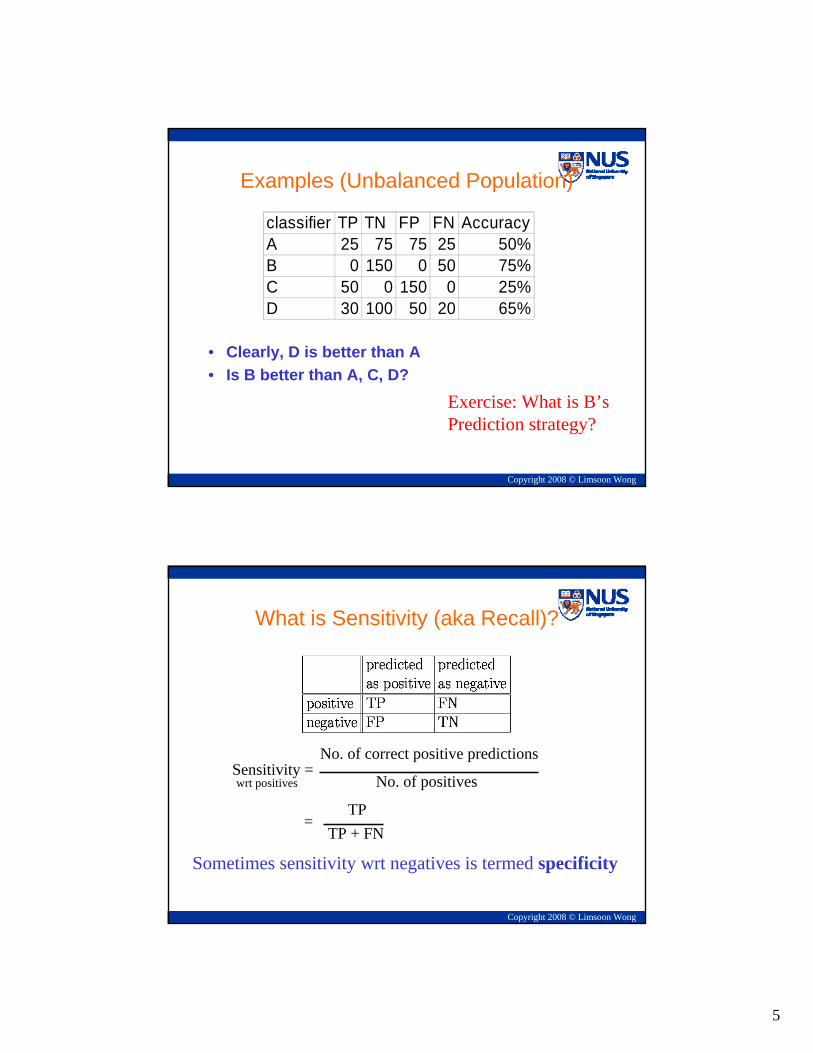
Examples (Unbalanced Population)
• Clearly, D is better than A• Is B better than A, C, D?
classifier TP TN FP FN AccuracyA 25 75 75 25 50%B 0 150 0 50 75%C 50 0 150 0 25%D 30 100 50 20 65%
Exercise: What is B’s Prediction strategy?
Copyright 2008 © Limsoon Wong
What is Sensitivity (aka Recall)?
Sensitivity =No. of correct positive predictions
No. of positives
=TP
TP + FN
wrt positives
Sometimes sensitivity wrt negatives is termed specificity
6
Copyright 2008 © Limsoon Wong
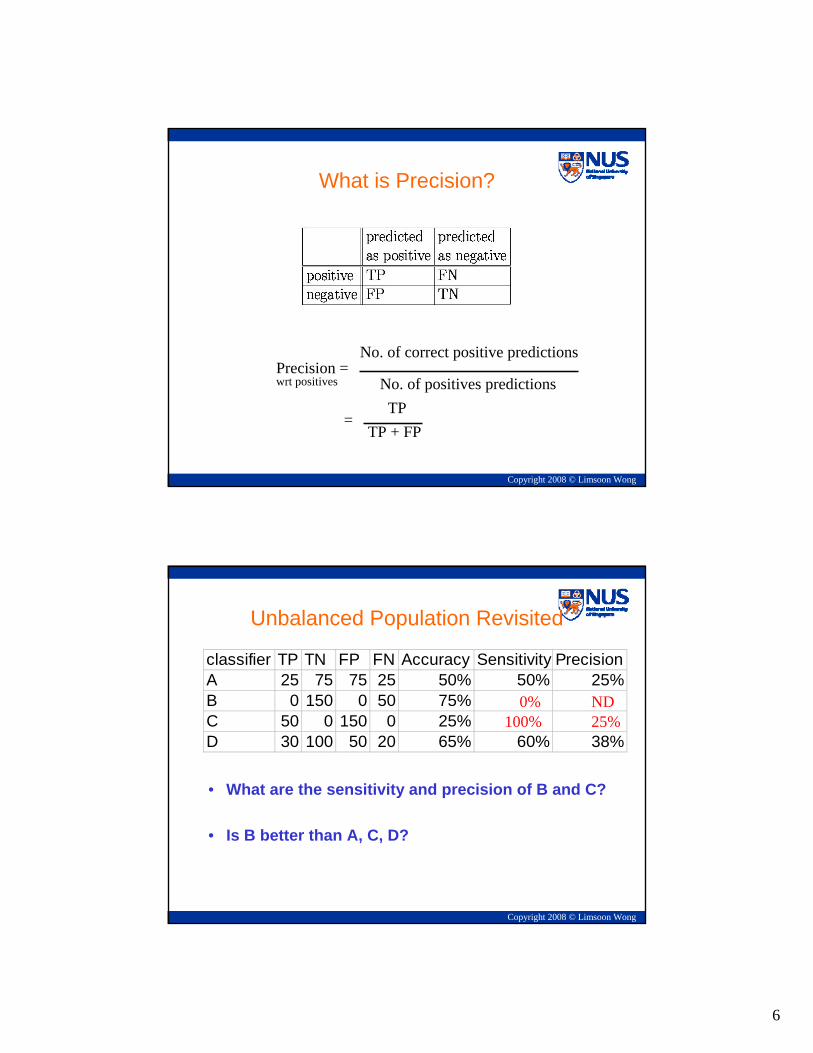
What is Precision?
Precision =No. of correct positive predictions
No. of positives predictions
=TP
TP + FP
wrt positives
Copyright 2008 © Limsoon Wong
Unbalanced Population Revisited
• What are the sensitivity and precision of B and C?
• Is B better than A, C, D?
classifier TP TN FP FN Accuracy Sensitivity PrecisionA 25 75 75 25 50% 50% 25%B 0 150 0 50 75%C 50 0 150 0 25%D 30 100 50 20 65% 60% 38%
0% ND100% 25%
7
Copyright 2008 © Limsoon Wong
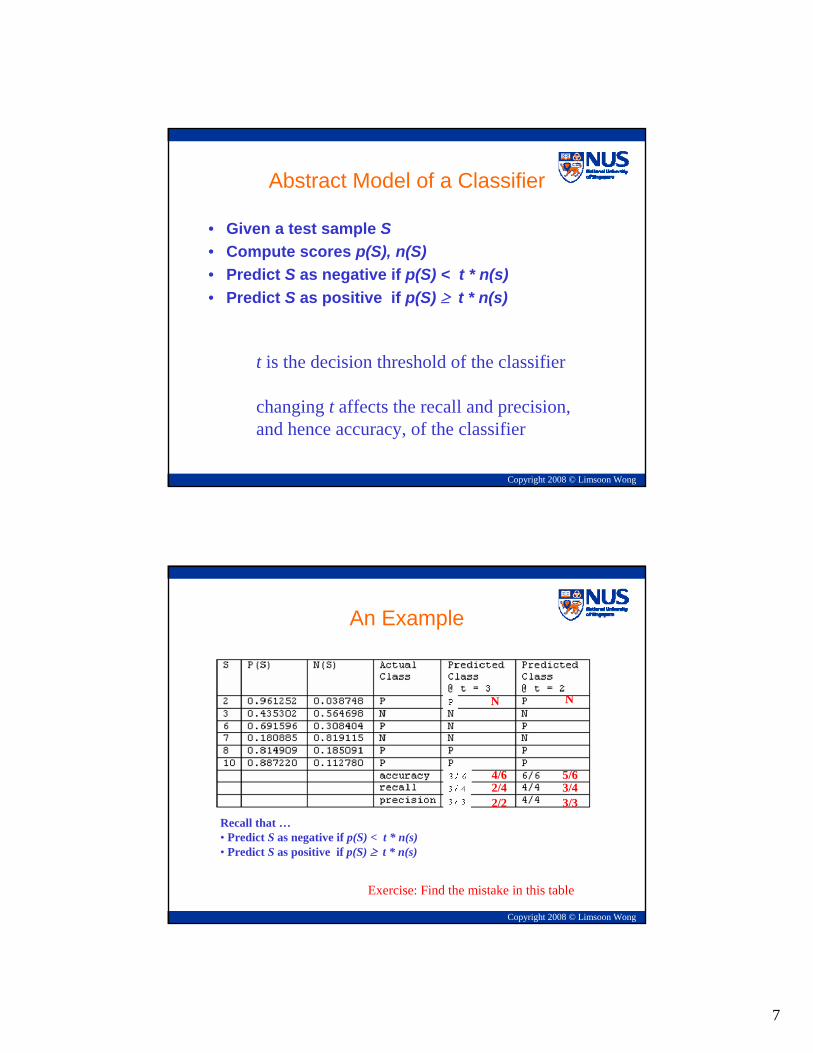
Abstract Model of a Classifier
• Given a test sample S• Compute scores p(S), n(S)• Predict S as negative if p(S) < t * n(s)• Predict S as positive if p(S) ≥ t * n(s)
t is the decision threshold of the classifier
changing t affects the recall and precision,and hence accuracy, of the classifier
Copyright 2008 © Limsoon Wong
An Example
Recall that …• Predict S as negative if p(S) < t * n(s)• Predict S as positive if p(S) ≥ t * n(s)
Exercise: Find the mistake in this table
N
4/62/42/2
N
5/63/43/3
8
Copyright 2008 © Limsoon Wong
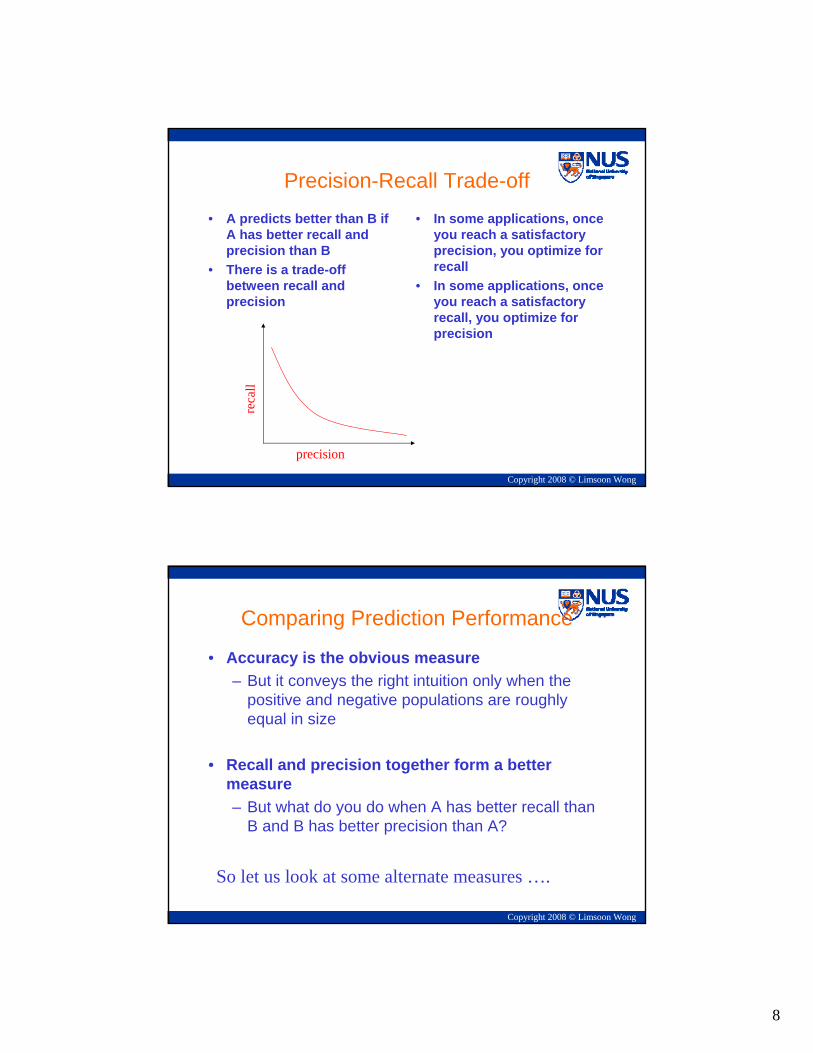
Precision-Recall Trade-off• A predicts better than B if
A has better recall and precision than B
• There is a trade-off between recall and precision
• In some applications, once you reach a satisfactory precision, you optimize for recall
• In some applications, once you reach a satisfactory recall, you optimize for precision
reca
ll
precision
Copyright 2008 © Limsoon Wong
Comparing Prediction Performance
• Accuracy is the obvious measure– But it conveys the right intuition only when the
positive and negative populations are roughly equal in size
• Recall and precision together form a better measure– But what do you do when A has better recall than
B and B has better precision than A?
So let us look at some alternate measures ….

9
Copyright 2008 © Limsoon Wong
Adjusted Accuracy
• Weigh by the importance of the classes
classifier TP TN FP FN Accuracy Adj AccuracyA 25 75 75 25 50% 50%B 0 150 0 50 75% 50%C 50 0 150 0 25% 50%D 30 100 50 20 65% 63%
Adjusted accuracy = α * Sensitivity β * Specificity+
where α + β = 1typically, α = β = 0.5
But people can’t always agree on values for α, β
Copyright 2008 © Limsoon Wong
ROC Curves• By changing t, we get a
range of sensitivities and specificities of a classifier
• A predicts better than B if A has better sensitivities than B at most specificities
• Leads to ROC curve that plots sensitivity vs. (1 –specificity)
• Then the larger the area under the ROC curve, the better
sens
itivi
ty
1 – specificity

10
What is Cross Validation?
Copyright 2008 © Limsoon Wong
Construction of a Classifier
Build ClassifierTrainingsamples Classifier
Apply ClassifierTestinstance Prediction
11
Copyright 2008 © Limsoon Wong
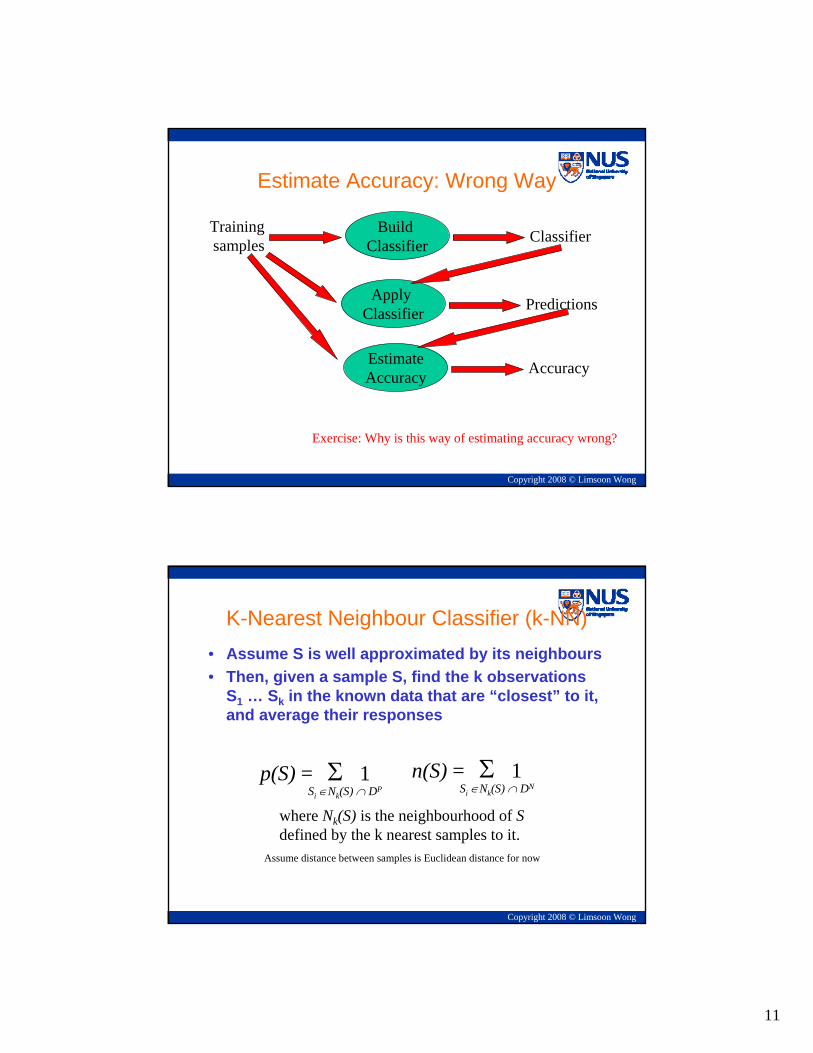
Estimate Accuracy: Wrong Way
Apply Classifier Predictions
Build Classifier
Trainingsamples Classifier
EstimateAccuracy Accuracy
Exercise: Why is this way of estimating accuracy wrong?
Copyright 2008 © Limsoon Wong
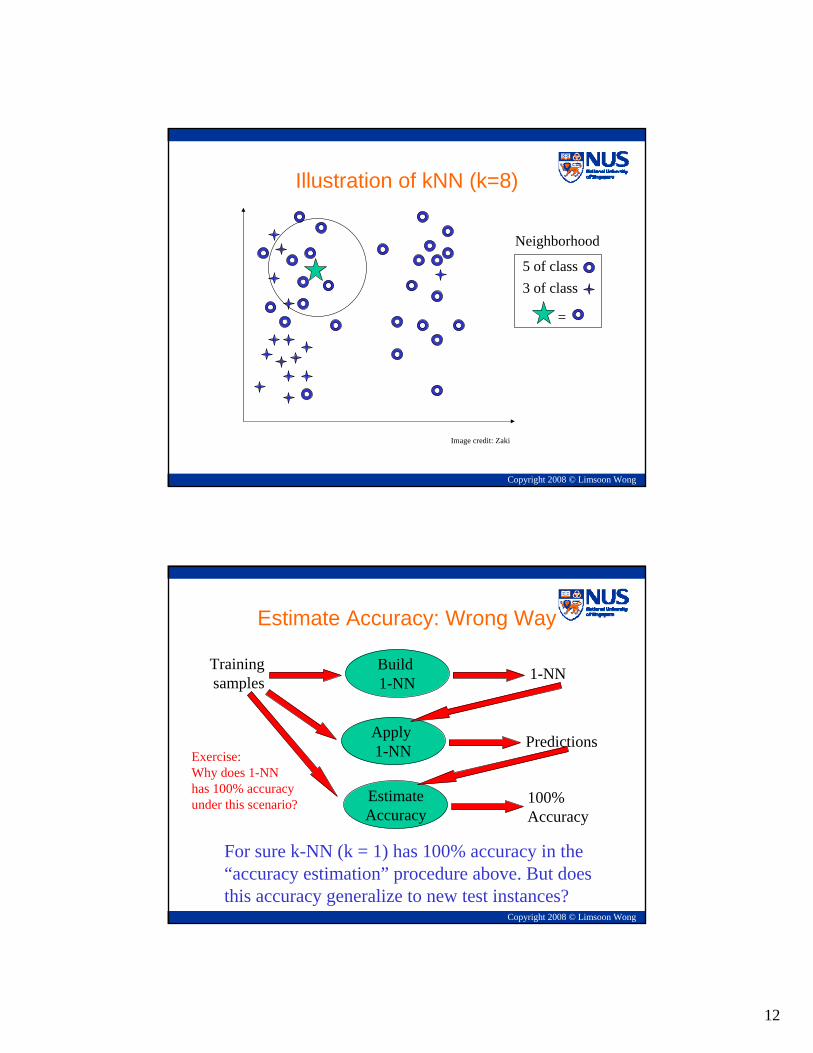
K-Nearest Neighbour Classifier (k-NN)• Assume S is well approximated by its neighbours• Then, given a sample S, find the k observations
S1 … Sk in the known data that are “closest” to it, and average their responses
p(S) = Σ 1Si ∈Nk(S) ∩ DP
n(S) = Σ 1Si ∈Nk(S) ∩ DN
where Nk(S) is the neighbourhood of Sdefined by the k nearest samples to it.
Assume distance between samples is Euclidean distance for now
12
Copyright 2008 © Limsoon Wong
Neighborhood
5 of class3 of class
=
Illustration of kNN (k=8)
Image credit: Zaki
Copyright 2008 © Limsoon Wong
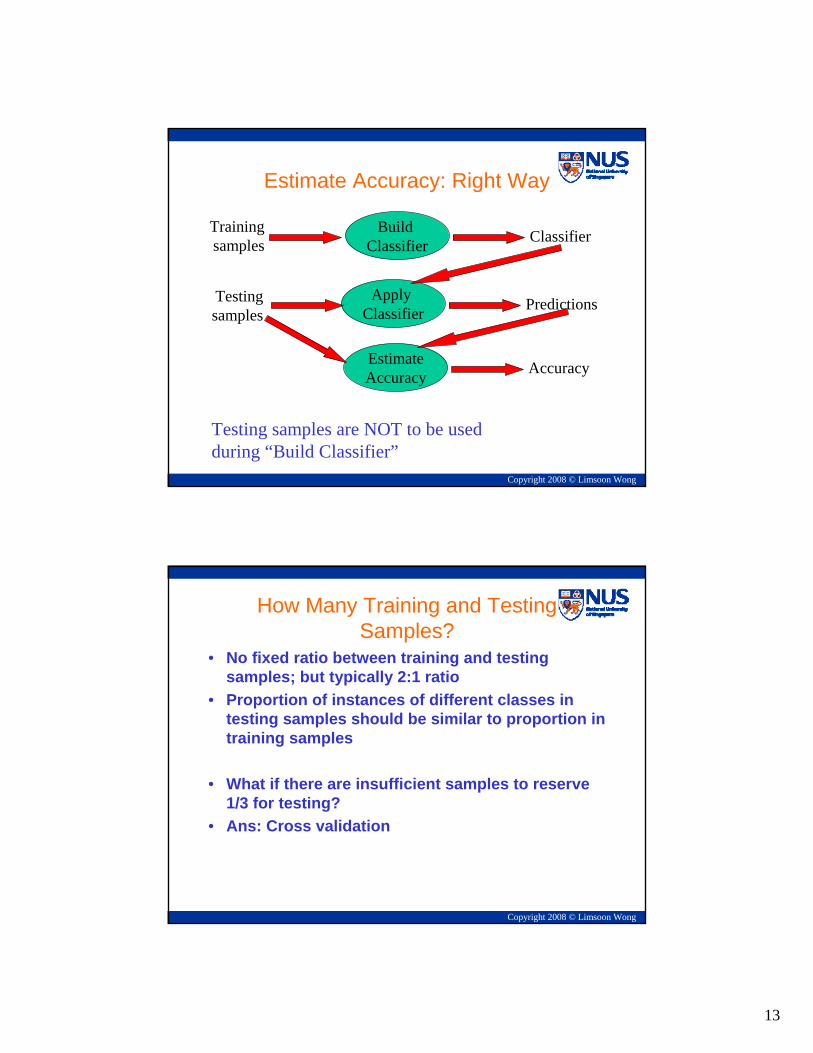
Estimate Accuracy: Wrong Way
Apply 1-NN Predictions
Build 1-NN
Trainingsamples 1-NN
EstimateAccuracy
100%Accuracy
For sure k-NN (k = 1) has 100% accuracy in the“accuracy estimation” procedure above. But doesthis accuracy generalize to new test instances?
Exercise: Why does 1-NNhas 100% accuracy under this scenario?
13
Copyright 2008 © Limsoon Wong
Estimate Accuracy: Right Way
Testing samples are NOT to be used during “Build Classifier”
Apply Classifier Predictions
Build Classifier
Trainingsamples Classifier
EstimateAccuracy Accuracy
Testingsamples
Copyright 2008 © Limsoon Wong
How Many Training and Testing Samples?
• No fixed ratio between training and testing samples; but typically 2:1 ratio
• Proportion of instances of different classes in testing samples should be similar to proportion in training samples
• What if there are insufficient samples to reserve 1/3 for testing?
• Ans: Cross validation
14
Copyright 2008 © Limsoon Wong
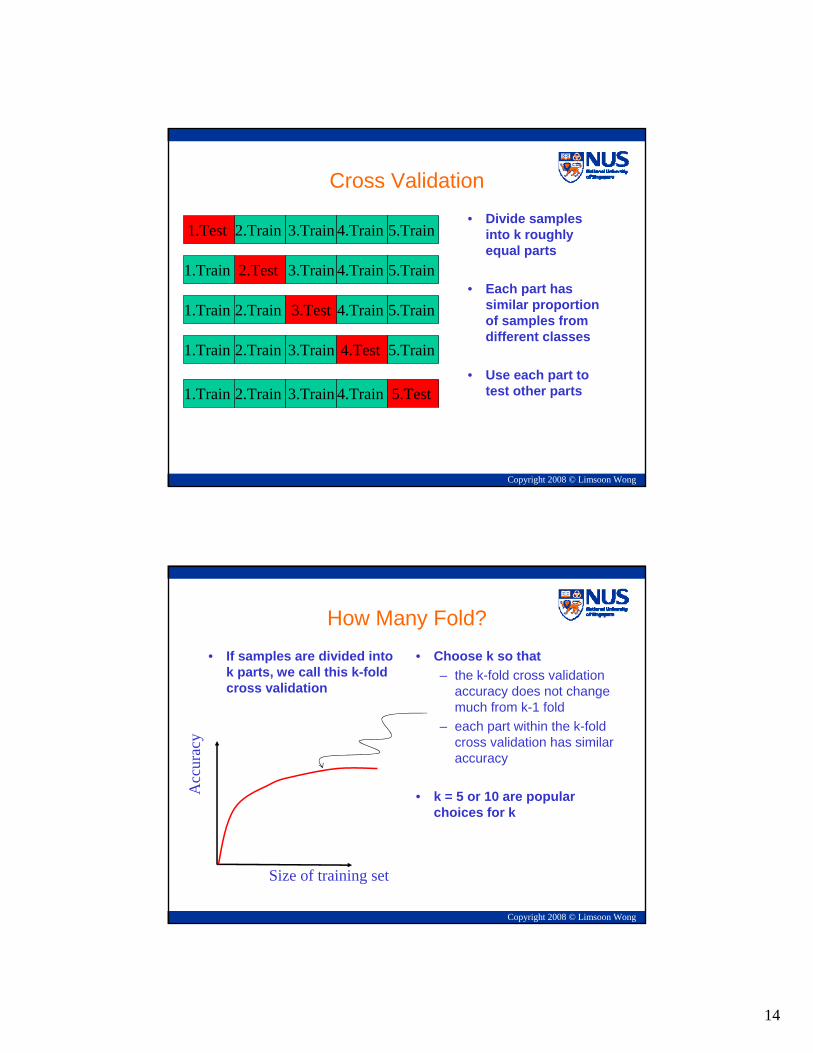
Cross Validation• Divide samples
into k roughly equal parts
• Each part has similar proportion of samples from different classes
• Use each part to test other parts
2.Train 3.Train 4.Train 5.Train 1.Test
2.Test 3.Train 4.Train 5.Train 1.Train
2.Train 3.Test 4.Train 5.Train 1.Train
2.Train 3.Train 4.Test 5.Train 1.Train
2.Train 3.Train 4.Train 5.Test 1.Train
Copyright 2008 © Limsoon Wong
How Many Fold?• If samples are divided into
k parts, we call this k-fold cross validation
• Choose k so that – the k-fold cross validation
accuracy does not change much from k-1 fold
– each part within the k-fold cross validation has similar accuracy
• k = 5 or 10 are popular choices for k
Size of training set
Acc
urac
y

15
Curse of Dimensionality
Copyright 2008 © Limsoon Wong
Curse of Dimensionality• How much of each
dimension is needed to cover a proportion r of total sample space?
• Calculate by ep(r) = r1/p
• So, to cover 10% of a 15-D space, need to sample (0.1)1/15 = 85% of each dimension!
00.10.20.30.40.50.60.70.80.9
1
p=3 p=6 p=9 p=12 p=15
r=0.01r=0.1
Exercise: Why ep(r) = r1/p?

16
Copyright 2008 © Limsoon Wong
Consequence of the Curse
• Suppose the number of samples given to us in the total sample space is fixed
• Let the dimension increase
• Then the distance of the k nearest neighbours of any point increases
• Then the k nearest neighbours are less and less useful for prediction, and can confuse the k-NN classifier (and other types of classifiers as well)
What is Feature Selection?

17
Copyright 2008 © Limsoon Wong
Tackling the Curse
• Given a sample space of p dimensions
• It is possible that some dimensions are irrelevant
• Need to find ways to separate those dimensions (aka features) that are relevant (aka signals) from those that are irrelevant (aka noise)
Copyright 2008 © Limsoon Wong
Signal Selection (Basic Idea)
• Choose a feature w/ low intra-class distance• Choose a feature w/ high inter-class distance
18
Copyright 2008 © Limsoon Wong
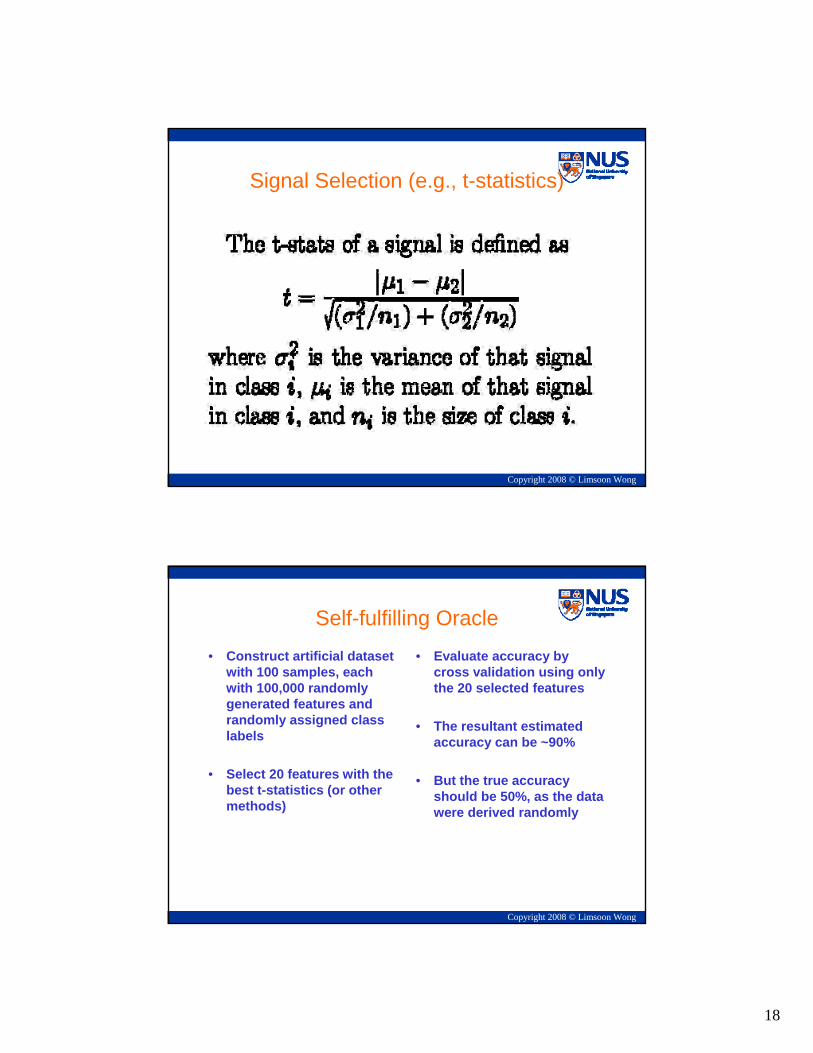
Signal Selection (e.g., t-statistics)
Copyright 2008 © Limsoon Wong
Self-fulfilling Oracle• Construct artificial dataset
with 100 samples, each with 100,000 randomly generated features and randomly assigned class labels
• Select 20 features with the best t-statistics (or other methods)
• Evaluate accuracy by cross validation using only the 20 selected features
• The resultant estimated accuracy can be ~90%
• But the true accuracy should be 50%, as the data were derived randomly
19
Copyright 2008 © Limsoon Wong
What Went Wrong?
• The 20 features were selected from the whole dataset
• Information in the held-out testing samples has thus been “leaked” to the training process
• The correct way is to re-select the 20 features at each fold; better still, use a totally new set of samples for testing
Concluding Remarks

20
Copyright 2008 © Limsoon Wong
What have we learned?
• Methodology of data mining– Feature generation, feature selection, feature
integration
• Evaluation of classifiers– Accuracy, sensitivity, precision– Cross validation
• Curse of dimensionality– Feature selection concept– Self-fulfilling oracle
Any Questions?

21
Copyright 2008 © Limsoon Wong
Acknowledgements
• The first two slides were shown to me 10+ years ago by Tan Ah Hwee
Copyright 2008 © Limsoon Wong
References• John A. Swets, Measuring the accuracy of diagnostic systems,
Science 240:1285--1293, June 1988
• Trevor Hastie et al., The Elements of Statistical Learning: Data Mining, Inference, and Prediction, Springer, 2001. Chapters 1, 7
• Lance D. Miller et al., Optimal gene expression analysis by microarrays, Cancer Cell 2:353--361, 2002
• David Hand et al., Principles of Data Mining, MIT Press, 2001
• Jinyan Li et al., Data Mining Techniques for the Practical Bioinformatician, The Practical Bioinformatician, Chapter 3, pages 35—70, WSPC, 2004