Control of Biogenic Amines in Food - Existing and Emerging Approaches
Faculty of Bioscience engineering
Academic year 2015 – 2016
Biogenic amines in food products on the Belgian market
Lisa Miclotte
Promotoren: Prof. dr. ir. Liesbeth Jacxsens & Frank Devlieghere
Tutor: Markus Eriksson
Master thesis submitted in partial fulfillment of the requirements for the
degree of Master of Science in bio-engineering - Food Science and
Nutrition

ACKNOWLEDGEMENTS
At the start of this master thesis, I was still a full blown student, in the sense that I knew how to
decipher courses and how to make sure I controlled the material completely by the time the exams
began. During the past year, however, I've had to learn to do so much more than to study courses.
This master thesis taught me so many aspects of what it means to be a researcher and it gave me a
glimpse of what an adult’s working life looks like. I have grown in so many different ways during the
course of this master thesis and have come into contact with so many expertized people, to whom I
owe my thanks.
First of all, I wish to thank my promotor professor Liesbeth Jacxsens, who has been a competent
mentor with great expertise in terms of risk assessment and food safety. She proposed the structure
of this thesis, gave constructive pieces of advice concerning lab experiments, presentations and
reporting and was always present to answer questions and give feedback on my writings. Equally, I
wish to thank professor Frank Devlieghere and Bruno Demeulenaere for their support of this project
and their fruitful cooperation.
Special and explicit thanks also to my tutor Markus Eriksson, who has been a more than competent
mentor and partner in the lab and whom I could always turn to for advice. I would always receive
more detailed explanations than I could ever have hoped or wished for. On the other hand, working
together in the lab frequently turned into tease and laughter, making it an enjoyable experience for
me and even my fellow thesis students. I consider you as a friend, Markus, and I wish you the best
with your new job, your wife and your soon-to-be-born first child.
I would also like to thank Emmanuel Abatih for lending me his time and his expertise in the field of
statistical analysis using R. Our frequent meetings at the close of this thesis resulted in valuable
outcomes, without which my dissertation would not have been complete. Moreover, his calm and
friendly character and his multicultural approach of work and life have resulted into very pleasant
conversations. Thank you, Emmanuel.
Furthermore, I also thank all members of staff in the chemical and microbial lab for their patience
with the clumsiness that is typical of all thesis students, for their help in finding lab materials, for
their advice and for the many interesting conversations, which were always proof of their support.
And lastly, I thank my friends and family for their continuous support throughout this year. They
listened to my nagging and my joys, they advised me where they could and encouraged me in all my
endeavours, within and outside of this thesis. Moreover, I thank my parents for making this 5-year
journey of study possible by supporting me both financially and morally. I can never thank them
enough.

Table of contents LIST OF ABREVIATIONS ............................................................................................................................. i
GLOSSARY .................................................................................................................................................ii
SUMMARY ................................................................................................................................................ v
SAMENVATTING ..................................................................................................................................... vii
1. INTRODUCTION ............................................................................................................................... 1
2. LITERATURE STUDY .......................................................................................................................... 4
2.1 BIOGENIC AMINES ................................................................................................................... 4
2.1.1 Occurrence in food .......................................................................................................... 4
2.1.2 Production by microorganisms........................................................................................ 5
2.1.3 Detection methods .......................................................................................................... 6
2.2 TOXICOLOGY ............................................................................................................................ 6
2.2.1 General ............................................................................................................................ 6
2.2.2 Detoxification .................................................................................................................. 6
2.2.3 Histamine ......................................................................................................................... 7
2.2.4 Tyramine and trace amines ............................................................................................. 8
2.2.5 Putrescine, cadaverine and polyamines .......................................................................... 9
2.3 QUALITY INDICATOR .............................................................................................................. 11
2.4 FORMATION OF EXOGENIC BIOGENIC AMINES .................................................................... 12
2.4.1 Substrate availability ..................................................................................................... 12
2.4.2 Presence of microorganisms ......................................................................................... 13
2.5 Conditions affecting MO-growth, decarboxylase production and decarboxylase activity ... 13
2.5.1 Temperature .................................................................................................................. 13
2.5.2 pH .................................................................................................................................. 14
2.5.3 Other factors ................................................................................................................. 14
2.6 CONTROL OF BA-CONTENTS .................................................................................................. 15
2.6.1 Raw material handling ................................................................................................... 16
2.6.2 Fermentation process.................................................................................................... 16
2.7 EXPOSURE AND RISK ASSESSMENT ....................................................................................... 17
3. MATERIALS AND METHODS .......................................................................................................... 20
3.1 EXPERIMENTAL OUTLINE ....................................................................................................... 20
3.1.1 Storage tests .................................................................................................................. 20
3.1.2 Screening tests .............................................................................................................. 21
3.2 EXPERIMENTAL ANALYSES ..................................................................................................... 23

3.2.1 Free amino acids ............................................................................................................ 23
3.2.2 Biogenic amines ............................................................................................................. 25
3.2.3 Microbiology .................................................................................................................. 28
3.3 STATISTICAL ANALYSES .......................................................................................................... 30
3.3.1 Objectives ...................................................................................................................... 30
3.3.2 Preparation of the database.......................................................................................... 30
3.3.3 Part 1: T-tests fermented vs. non-fermented and animal vs. plants ............................ 31
3.3.4 Part 2: ANOVA-tests for difference between food groups ............................................ 32
3.3.5 Part 3: Correlation analysis ............................................................................................ 32
4. RESULTS AND DISCUSSION ............................................................................................................ 34
4.1 INTRODUCTION ..................................................................................................................... 34
4.2 POTENTIAL FOR BA-FORMATION IN TUNA AND MARINATED PORK .................................... 35
4.2.1 Storage test tuna ........................................................................................................... 36
4.2.2 Storage test marinated pork ......................................................................................... 39
4.3 STORAGE TEST OF DIFFERENT TYPES OF MARINATED MEAT................................................ 43
4.4 SCREENING OF MEAT PRODUCTS AND PREPARATIONS FROM THE BELGIAN MARKET........ 47
4.4.1 Salami and dried sausages ............................................................................................. 47
4.4.2 Cooked hams ................................................................................................................. 50
4.4.3 Raw hams (dried and cured) ......................................................................................... 52
4.4.4 Meat preparations ......................................................................................................... 54
4.4.5 Concluding remarks on fresh meat, meat preparations and meat products ................ 56
4.5 DESCRIPTION OF BA-DATA ASSEMBLED FOR OTHER FOOD GROUPS ................................... 56
4.5.1 Fruit and vegetables ...................................................................................................... 57
4.5.2 Chocolate ....................................................................................................................... 57
4.5.3 Beer ............................................................................................................................... 57
4.5.4 Meat products and preparations .................................................................................. 58
4.5.5 Dairy .............................................................................................................................. 58
4.6 STATISTICAL ANALYSIS ........................................................................................................... 59
4.6.1 PART 1: T-tests fermented vs. non-fermented and animal vs. plants ........................... 59
4.6.2 PART 2: ANOVA-tests for difference between food groups .......................................... 61
4.6.3 PART 3: Correlation analysis .......................................................................................... 64
5. CONCLUSIONS ............................................................................................................................... 67
6. FUTURE INVESTIGATIONS .............................................................................................................. 69
7. REFERENCES .................................................................................................................................. 70

8. APPENDICES ................................................................................................................................... 74
Appendix 1: Design of the 9-day storage test for marinated pork................................................ 74
Appendix 2: Design of the 9-day storage test for 3 types of marinated meat, stored at 7°C and
MAP-packaged (70/30 O2/CO2). .................................................................................................... 74
Appendix 3: Reagents used during the chemical analyses. ........................................................... 75
Appendix 4: Materials and Machines used for the chemical analyses. ........................................ 76
Appendix 5: Tables required during the calculation of the BA-concentrations. ........................... 77
Appendix 6: Materials used during the microbial analyses. ......................................................... 78
Appendix 7: Pictures of tuna samples during 6-day storage test. ................................................. 80
Appendix 8: BA-concentrations on the last day of analysis of the storage test for marinated
pork:. Mean values of the two samples on the last day of analysis for each condition and each
BA are plotted. .............................................................................................................................. 82
Appendix 9: Pictures of marinated pork during the 9-day storage test. ....................................... 83
Appendix 10: Results of the screening tests on salami’s and dried sausages. .............................. 85
Appendix 11: Results of the screening tests on cooked hams. ..................................................... 87
Appendix 12: Results of the screening tests on raw dried and cured hams and beef products. .. 90
Appendix 13: Results of the screening tests on meat preparations. ............................................ 93
Appendix 14: Preparation methods of cooked and raw dried and cured ham samples as
designated on the package. .......................................................................................................... 97
Appendix 15: Overview of the BA-concentrations in different food groups and their subgroups.
....................................................................................................................................................... 99
Appendix 16: Box-plots of BA-concentrations belonging to Part 1 of the statistical analysis. ... 107
Appendix 17: Tables representing the p-values resulting from the mean comparisons (ANOVA) of
the BA-concentrations in the different food groups. .................................................................. 112
Appendix 18: Correlation triplots resulting from redundancy analyses (RDA) executed to analyze
the correlations between BA, FAA and microbial concentrations. ............................................. 115
Appendix 19: Results of the multiple linear regressions (MLR) executed during the analysis of the
correlations between FAA, BA and microbial counts. ................................................................. 123

i
LIST OF ABREVIATIONS
AA Amino acids
ACN Acetonitrile
AO Amino oxidase
BA Biogenic amines
BAI Biogenic amine indicator
CCP Critical control point
CE Capillary Elektrophoresis
DAO Diamino oxidase
FAA Free aminoacids
FSMS Food Safety Management System
GC Gas Chromatography
GHP Good Hygiene Practices
Gr +/- Gram positive /negative
GMP Good Manufacturing Practices
HACCP Hazard Analysis Critical Control Points
HPLC High Pressure Liquid Chromatography
LOD Limit Of Detection
LOQ Limit Of Quantification
MAO Monoamine oxidase
MAOI Monoamine oxidase inhibitors
MAP Modified atmosphere packaging
MLR Multiple linear regression
MO Microorganisms
MRS De Mann, Rogosa and Sharpe agar
MSA Mannitol Salt Agar
NOAEL No Observable Adverse Effect Level
OPA Ortho-Phtalic aldehyde
PA Pseudomonas Agar
PCA Plate Count Agar
PRP Prerequisite Program
RDA Redundancy analysis
RE Rapid Enterobacteriaceae agar
SB Slanetz and Bartley agar
SMS Safety management system
TLC Thin Layer Chromatography
VRBG Violet Red Bile Glucose agar

ii
GLOSSARY
24h-recall
Quantitative research method used in nutritional assessment in the form of an interview, in which individuals are asked to recall all foods and beverages they consumed in the twenty-four hours prior to the interview. It may be self-administered or administered by a trained professional.
Aminogenic Generating amino acids
Arrhythmia Cardiac arrhythmia is group of conditions in which the heartbeat is irregular, too fast, or too slow. It originates from a change from the normal sequence of electrical impulses.
Brachycardia A form of cardiac arrhythmia, in which the heartbeat is too slow (less than 60 beats per minute).
Brain hemorrhage A brain hemorrhage or cerebral hemorrhage is a type of stroke. It is caused by an artery in the brain bursting and causing localized bleeding in the surrounding tissues. This bleeding kills brain cells (= hemorrhagic stroke).
Bronchospasm Abnormal contraction of the smooth muscle of the bronchi, resulting in an acute narrowing and obstruction of the respiratory airways, which causes difficulty to breathe.
Catecholamines Organic compound containing a catechol (benzene with two hydroxyl side groups) and a side-chain amine. Examples are epinephrine (adrenaline), norepinephrine (noradrenaline), and dopamine, all of which are produced from phenylalanine and tyrosine
Cell proliferation The process that results in an increase of the number of cells, and is defined by the balance between cell divisions and cell loss through cell death or differentiation. Cell proliferation is increased in tumours.
Crohn's disease Crohn's disease is an inflammatory bowel disease (IBD). It causes inflammation of the lining of your digestive tract, which can lead to abdominal pain, severe diarrhoea, fatigue, weight loss and malnutrition. Inflammation caused by Crohn's disease can involve different areas of the digestive tract in different people.
Endogenous Originating or produced within an organism, tissue,or cell: endogenous hormones.
Exogenous Originating or produced from outside a cell, tissue,or organism: exogenous antioxidants.
Glucono-δ-lacton A food additive with the E-number E575, used as a sequestrant, an acidifier, or a curing, pickling, or leavening agent. GDL is neutral, but hydrolyses in water to gluconic acid which is acidic, adding a tangy taste to foods, though it has roughly a third of the sourness of citric acid.
Hypertensive crisis Hypertensive crisis is an umbrella term for hypertensive urgency and hypertensive emergency. These two conditions occur when blood pressure becomes very high (over 180 systolic or 110 diastolic), possibly causing organ damage.
Hypoxia Diminished availability of oxygen to the body tissues.
Immunomodulation Alteration of the body's immune response
Isoflavones Isoflavones are a type of often naturally occurring isoflavonoids, many of which act as phytoestrogens in mammals. Some are termed antioxidants because of their ability to trap singlet oxygen. Isoflavones are produced almost exclusively by the members of the Fabaceae (i.e., Leguminosae, or bean) family.
Lockjaw Trismus, or Lockjaw, refers to reduced opening of the jaws caused by spasm of the muscles of mastication, or may generally refer to all causes of limited mouth opening.
Lymphocytes A lymphocyte is one of the subtypes of white blood cell in a vertebrate's immune system. Lymphocytes include natural killer cells (NK-cells) which function in cell-mediated, cytotoxic innate immunity, T-cells (for cell-mediated, cytotoxic adaptive immunity), and B-cells (for humoral, antibody-driven adaptive immunity). They are the main type of cell found in lymph, which prompted the name lymphocyte.

iii
Mass spectrometry Mass spectrometry (MS) is an analytical technique that ionizes chemical species and sorts the ions based on their mass to charge ratio. In simpler terms, a mass spectrum measures the masses within a sample. Mass spectrometry is used in many different fields and is applied to pure samples as well as complex mixtures
Mast cell A type of white blood cell. Although best known for their role in allergy and anaphylaxis, mast cells play an important protective role as well, being intimately involved in wound healing, angiogenesis, immune tolerance, defence against pathogens, and blood–brain barrier function
Mesophilic A mesophile is an organism that grows best in moderate temperature, neither too hot nor too cold, typically between 20 and 45 °C (68 and 113 °F).
Oedema Oedema is the medical term for swelling. It is a general response of the body to injury or inflammation. Oedema results whenever small blood vessels become "leaky" and release fluid into nearby tissues. The extra fluid accumulates, causing the tissue to swell. Oedema can be isolated to a small area or affect the entire body. Medications, infections, pregnancy, and many medical problems can cause oedema.
Organoleptic Organoleptic properties are the aspects of food, water or other substances that an individual experiences via the senses—including taste, sight, smell, and touch.
Paresis Weak form of paralysis. It is condition typified by a weak or partial loss of voluntary movement or by impaired movement. When used without qualifiers, it usually refers to the limbs, but it can also be used to describe the muscles of the eyes (ophthalmoparesis), the stomach (gastroparesis), and also the vocal cords (Vocal cord paresis). Neurologists use the term paresis to describe weakness, and plegia to describe paralysis in which all voluntary movement is lost.
Pathogenesis The biological mechanism (or mechanisms) that lead to the diseased state.
Peripheral blood vessels
The peripheral vascular system consists of the veins and arteries not in the chest or abdomen (i.e. in the arms, hands, legs and feet). The peripheral arteries supply oxygenated blood to the body, and the peripheral veins lead deoxygenated blood from the capillaries in the extremities back to the heart.
Piperidine This heterocyclic amine consists of a six-membered ring containing five methylene bridges (-CH2-) and one amine bridge (-NH-).
Pyrrolidine Cyclic secondary amine, which is miscible with water and behaves alkalic.
Polycation Polymer whose repeating units contain at least one positive charge. DNA, as a polymer of nucleotides, is an example.
Potentiators Enhancers of a certain effect. In the context of biogenic amines: compounds which enhance the toxic effects of BA by enhancing their absorption and/or diminishing AO-activity.
Pruritus Itching
Psychrotropic Psychrotrophic bacteria are bacteria that are capable of surviving or even thriving in a cold environment.
Scombroid fish The Scombridae family of the mackerels, tunas, and bonitos includes many of the most important and familiar food fishes. Scombrids are generally predators of the open ocean. They contain a large amount of red muscle, which helps them maintain a high activity-level.
Sympathomimetic Sympathomimetic drugs are stimulant compounds which mimic the effects of agonists of the sympathetic nervous system such as the catecholamines (epinephrine (adrenaline), norepinephrine (noradrenaline), dopamine, etc.) Sympathomimetic drugs are used to treat cardiac arrest and low blood pressure, or even delay premature labor, among other things.
Tachycardia A form of cardiac arrhythmia, in which the heartbeat is too fast (more than 100 beats per minute).

iv
Ulcerative colitis A form of inflammatory bowel disease (IBD) that causes inflammation and ulcers in the colon. What sets it apart from Crohn's disease is that ulcerative colitis only affects the colon and rectum, rather than the whole GI tract.
Urticaria Commonly referred to as hives. It is a kind of skin rash notable for pale red, raised, itchy bumps. Hives may cause a burning or stinging sensation. It is frequently caused by allergic reactions, although there are also many non allergic causes.
Vasoconstriction Narrowing of the blood vessels resulting from contraction of the muscular wall of the vessels
Vasodilation Widening of blood vessels

v
SUMMARY
Currently, several biogenic amines (BA) are known cause food intoxication after ingestion of food
products containing excessive amounts. As such, histamine-poisoning (aka "scombroid poisoning")
and tyramine-poisoning ("cheese reaction") are well documented and their concentrations in the
most hazardous products (fish, cheese and fermented meat products) have been investigated before.
Nevertheless, little is known on the concentration of these biogenic amines in other, uncharacteristic
food groups. Likewise, insufficient information is available on the concentration of other biogenic
amines in different types of food, nor is there enough information on their harmful effects (1; 2).
When EFSA decided in 2010 to perform a risk assessment on biogenic amines present in all types of
food, the Belgian government was asked to provide data on the concentration of several biogenic
amines in food products on the Belgian market. As such data was insufficiently available, the
BIOGAMI-project was started in October 2013, a project aiming to assess the health risks associated
with biogenic amines in products part of the Belgian food market, via an elaborated risk assessment.
During this master thesis, a contribution to this envisioned risk assessment was made. As such, in a
first part of the thesis, the currently available toxicological data were investigated, as a part of the
hazard characterization. Then, in order to perform an exposure assessment (the third step in a risk
assessment), data on the concentration of 6 BA in food products on the Belgian market was gathered
via screening tests, according to a predefined sampling plan. These screening tests had started in
October 2014 and have been finished in April (2016) and during the course of this mater thesis
screenings were performed on yoghurt, beer, cheeses and meat (fresh meat, meat products and
meat preparations). Next to the screening tests, also some in depth storage tests have been
performed on fish and marinated meat to provide a preliminary view on the biogenic amine profile in
these animal products and on the influence of several storage conditions on the BA-formation during
storage. Subsequent to all these experimental analyses, statistical analysis of the results of the entire
body of screening tests were executed. First, some exploratory comparisons of the BA-profile were
made between different food groups, between fermented and non-fermented foods and between
animal and plant-based products. Furthermore, redundancy analysis combined with multiple linear
regression was performed in R, looking for the possible correlations between BA-concentrations,
microbial counts and concentrations of free amino acids. These last two types of data were gathered
during the screening tests as well.
The exploratory results of the storage tests showed that in tuna, histamine is the most dominant BA,
occurring in toxic concentrations when the product is misused (stored at too high temperatures). In
marinated meats (pork as well as chicken, beef and lamb), cadaverine and tyramine were the most
prominent BA. It was also concluded that MAP-packaging and refrigeration are effective techniques
to limit BA-formation.
The results of the screening tests for different meat products and preparations showed that tyramine
is always the most predominant BA in these kinds of products. The content of other BA depended
strongly on the type of product and its production method.
Screenings of food products in other food categories resulted in a database containing information
on their biogenic amine and free amino acid concentrations and their microbial contamination.
Exploratory investigation of these BA- data showed that the BA-profile differed strongly between
different food groups. Also some indications were found to state that in animal-based and fermented
products BA are formed differently than in plant-based and non-fermented products respectively.

vi
The subsequent correlation analyses studying the relationships between biogenic amines, free amino
acids demonstrated that higher contents of FAA might indeed lead to higher level of BA, although
further, more detailed investigations are required to confirm this statement. And lastly, the
correlation analysis between microbial counts and BA-concentrations showed that these correlations
were not that strong and no type of bacteria stood out as being more strongly related to BA-
formation than the others.

vii
SAMENVATTING
Van verschillende biogene aminen (BA) is geweten dat ze voedselintoxicaties kunnen induceren bij
te hoge consumptielevels. Histamine, bijvoorbeeld, veroorzaakt scombroïde vergiftiging en tyramine
kan het zogenaamde kaassyndroom ("cheese reaction") veroorzaken, gepaard gaande met een
stijgende bloeddruk en hoofdpijn. Deze twee intoxicaties werden reeds grondig bestudeerd en de
concentraties van histamine en tyramine in de meest risicovolle producten (vis, kaas en
gefermenteerde worst) werden tevens uitvoerig onderzocht. Anderzijds is er nog slechts weinig
informatie beschikbaar over hun concentratie in levensmiddelen waar deze intoxicaties minder vaak
mee geassocieerd worden. Daarenboven is er nog onvoldoende informatie beschikbaar over andere
BA in verschillende voedselgroepen, noch is er voldoende info over hun mogelijke toxische effecten.
Toen men bij EFSA in 2010 het besluit nam om een risicoanalyse te starten om de gezondheidsrisico’s
aangaande biogene amines in te schatten, werd aan de Belgische overheid gevraagd om
concentratiedata over deze stoffen in voedsel op de Belgische markt te voorzien. Deze data bleek
echter in onvoldoende mate beschikbaar. Daarom werd in oktober 2013 het BIOGAMI-project
opgestart, een studie met het doel om de gezondheidsrisico’s omtrent de blootstelling aan biogene
aminen voor de Belgische bevolking in te schatten via een sterk uitgewerkte risicoanalyse.
Tijdens deze masterproef werd aan de beoogde risicoanalyse een bijdrage geleverd. In een eerste
deel van deze thesis werd namelijk de beschikbare toxicologische data uit de literatuur geraadpleegd
en uiteengezet, ter karakterisatie van het risico dat biogene aminen vormen. Vervolgens werd de
concentratie van 6 biogene aminen bepaald in levensmiddelen op de Belgische markt via screening
testen en een vooropgesteld sampling plan. Deze data zouden gebruikt worden in een
blootstellingsanalyse, de derde stap in een risicoanalyse. De screening testen werden opgestart in
oktober 2014 en werden in april (2016) afgerond. Binnen de termijn van deze thesis werden
screenings uitgevoerd op stalen bier, yoghurt, kazen en vlees (vers vlees, vleesproducten en
vleesbereidingen). Naast deze screening testen werden eveneens enkele bewaartesten uitgevoerd
op vis en gemarineerd vlees, met als doel om een eerste zicht te krijgen op de biogene amines in
deze dierlijke producten en op de invloed van enkele bewaarcondities (temperatuur en MAP-
verpakking).
Volgend op al deze experimentele analyses werden statistische analyses uitgevoerd op een database
van 425 gescreende producten in totaal. Deze testen omvatten in de eerste plaats enkele
verkennende vergelijkingen van gemiddelde BA-concentraties tussen gefermenteerde en niet-
gefermenteerde stalen, stalen van dierlijke en plantaardige oorsprong en tussen verschillende
voedselgroepen. Daarna werden redundantieanalyses en een meervoudige lineaire regressies
uitgevoerd in R om de correlaties tussen de concentraties aan biogene amines en vrije aminozuren
en de microbiële tellingen te onderzoeken. Deze laatste twee datatypes (vrije aminozuren en
microbiële analyses) werden tevens tijdens de screening testen verzameld.
Uit de bewaartesten op tonijn en gemarineerd vlees bleek dat histamine het meest prominente
biogeen amine was in vis, zelfs oplopend tot extreem toxische concentraties wanneer de vis onder te
hoge temperaturen werd bewaard. In het gemarineerde vlees (zowel varkensvlees als kip-, lam- en
rundsvlees) werden tyramine en cadaverine als meest belangrijke biogene amines gevonden. Tevens
kon uit deze bewaartesten ook geconcludeerd worden dat MAP-verpakking en koeling effectieve
technieken zijn om vorming van biogene amines tegen te gaan.

viii
De resultaten van de screeningtesten voor verschillende vleesproducten en -bereidingen toonden
vervolgens aan dat tyramine het meest dominante BA is in deze categorieën voedsel. Het gehalte aan
andere biogene aminen bleek echter sterk per subcategorie te verschillen.
De database die volgde uit de screening testen van alle voedselcategoriëen samen bevatte
informatie over hun gehaltes aan biogene aminen, vrije aminozuren en microbiële contaminatie.
Verkenning van deze BA-concentraties toonde aan dat het BA-profiel sterk verschilde tussen de
verschillende voedselgroepen en dat gefermenteerde en dierlijke voeding een verschillend BA-profiel
vormen dan niet-gefermenteerde en plantaardige voeding respectievelijk. Uit de daaropvolgende
correlatieanalyse bleek verder er een positieve correlatie zou kunnen bestaan tussen het gehalte aan
vrije aminozuren op het moment van aankoop en de BA-gehalten op einde houdbaarheid. De
microbiële correlatieanalyses toonden tenslotte aan dat de correlaties tussen microbiële
concentratie en BA-gehalten heel wat minder sterk waren en dat in elk geval geen enkele groep
bacteriën een sterkere relatie met BA vertoonde dan de anderen.

1
1. INTRODUCTION
These days, the safety of our food is under strict control. However, this has not always been the
case. After some major food crisis’s in the 90’s, food safety became a hot topic and the need for an
integrated control system that would cover the whole food chain (farm-to-fork) started to show in
the EU (3). Over the past decades, EFSA has, following the principles of risk-analysis determined by
the General Food Law, been trying to asses and optimize the safety and the shelf life of our food (4).
The subject of food safety covers roughly everything that concerns food and its components and that
could form a hazard for human health. It has been defined by (5) as “the condition of the foodstuffs
in all stages of production, processing and distribution, required to guarantee protection of
consumer’s health, also taking into account normal circumstances of use and information available
for the foodstuff concerned. Food safety thus means the absence of biological, chemical or physical
agents (hazards) in concentrations/ quantities that can cause adverse health effects.” Specifically,
some of those hazards can be bacterial pathogens like Salmonella spp. and Listeria monocytogenes,
foodborne viruses, residues of pesticides, mycotoxins, nanomaterials, etc. (6). Also biogenic amines
form a hazard in the safety of our food. These last components will be the subject of this master
thesis.
Biogenic amines are organic nitrogenous compounds. They occur in plants, as well as in animals and
microorganisms (MO), where they are formed by endogenous pathways and where they perform
functions like growth regulator, neurotransmitter or mediator of infections (7). Furthermore, they
can be found in all foods that contain protein and/or free amino acids. They appear for example in
fish- and meat products, dairy, fruit and vegetables, nuts, chocolate, etc. In food products, the
presence of biogenic amines will mainly be the result of decarboxylation of free amino acids by
microorganisms. In order for this process to occur, three conditions must be met. Firstly, the
precursors of the biogenic amines, namely free amino acids, must be present. These will mainly be
produced by proteolysis of the protein in the food product. Secondly, decarboxylase active
microorganisms must be present. Lastly, the environmental conditions like temperature, pH etc.
must allow growth of these microorganisms and the activity of their decarboxylases (8; 9; 10).
The most prominent biogenic amines in food products, and so the ones that will be of importance in
this master thesis, are histamine, tyramine, tryptamine, putrescine, β-phenylethylamine and
cadaverine. Because biogenic amines are mainly the result of microbial activity, the highest
concentrations will be found in fermented foods on the one hand and spoiled foods on the other (8;
7; 2).
Knowing the concentrations of several biogenic amines in foods and their producing microorganisms
is of importance for several reasons. Firstly, due to their microbial origin, biogenic amines could
serve as a food spoilage parameter. Secondly, they can also serve as parameter for the hygiene or
the careful execution of the production process, and thus be a process parameter. Lastly, at high
intake levels, certain biogenic amines are toxic for the human body.
Until quite recently, Belgium did not possess sufficient data on the contents of biogenic amines in the
range of foodstuffs on the Belgian market. There was only sufficient data for fish. That is why, after a
request of EFSA for this kind of data, the BIOGAMI-project was initiated in 2014 (8; 7; 2). The goal of
the research project BIOGAMI is to perform a risk assessment for the Belgian population concerning
several biogenic amines, by analysing certain food groups and using the Belgian consumption data. In
order to do this, first, a method needed to be optimized to extract, detect and quantify these amines

2
in the food matrices. This had already been completed at the start of this thesis. Then the laboratory
analysis of the selected food groups would follow, in order to gain a view on which biogenic amines
appear in which foods and in which concentration. Simultaneously, the concentrations of the free
amino acids which are the precursors of the biogenic amines were determined and microbial
analyses were performed in order to see if there might be a relationship between the growth of
certain microorganisms and the production of biogenic amines. These analyses would result in a
database, which, together with the most recent Belgian consumption data, would be used to assess
the exposure of the Belgian population to these biogenic amines and to perform a risk-assessment
(2).
This Master dissertation has contributed to the BIOGAMI-project by taking part in the lab- analyses,
more particularly the screenings of the food groups, and by assessing their toxicity qualitatively.
Figure 1 shows an overview of the tasks to be performed during the course of the dissertation.
The lab experiments have been focused on fish and meat-based products, and were started by
executing exploratory storage tests: one on tuna, one on marinated pork and one on other types of
marinated meat. Other lab analyses comprised screening of food products on the Belgian market,
particularly meat products and preparations.
Figure 1: Outline of this master dissertation.
Part 1: Screening of meat, fish and
meat products
1) Storage tests for tuna and marinated meat to compare the BA-profile
of these products.
2) Storage tests on meat products to determine
which products to analyse further.
Determination of biogenic amines, free amino acids
and microorganisms
3) Screening of meat, fish and meat products
Part 2: Statistical analysis
4) Statistical analysis of the results to find correlations
between biogenic amins, free amino acids and microorganisms

3
The research questions proposed for this master thesis follow the general outline depicted in figure 1
and are:
1. Storage tests a. Which biogenic amines are dominant in the fish and meat products used? b. Which is the influence of MAP-packaging and storage temperature profiles on the synthesis of biogenic
amines and the development of microorganisms in tuna on the one hand and marinated meat on the other?
c. Is there a link between free amino acids at the start of storage and the BA-profile? d. Is there a link between the BA-profile and the microbial counts detected on the samples? e. Can BA-formation and possible BA-intoxication be masked by preparing meat in a certain way?
2. Screening tests a. Which biogenic amines are the most abundant and in which meat- based products? b. Is there a difference in type of biogenic amines formed between different types of meat-based products?
3. Statistical analysis a. Do fermented food products contain different BA-profiles than non-fermented food products? b. Do animal products contain different BA-profiles than plant-based products? c. Is the BA-profile different in different food groups? d. Is there a correlation between the initial amount of free amino acids and the concentration of biogenic
amines detected? e. Is there a correlation between the detected microorganisms and the concentration of biogenic amines?
In addition to the above-mentioned project, a literature study needed to be written. This study starts
with an overall view on the chemistry, the origins and the metabolic production of biogenic amines.
Subsequently, the toxicology of these amines is explained in detail and their role as a quality
indicator is delineated. The next part discusses which factors have an influence on the occurrence
and the concentration of biogenic amines in food and which tactics can be used to limit their
formation. Lastly, some aspects of the risk assessment process are explained, as this technique will
be used during the second part of this thesis (vide supra).

4
2. LITERATURE STUDY
2.1 BIOGENIC AMINES
Biogenic amines are low molecular weight organic nitrogen compounds. The structure of a biogenic
amine can be aliphatic (for putrescine, cadaverine, spermine and spermidine), aromatic (for tyramine
and phenylethylamine) or heterocyclic (for histamine and tryptamine) (11). These compounds are
part of the metabolism of plants, animals and microorganisms, where they play a role in growth
regulation (polyamines), neural transmission (catecholamines and histamine) and as mediators of
inflammation (histamine and tyramine) (7).
2.1.1 Occurrence in food
Any food product containing proteins or free amino acids (FAA) that is subjected to conditions that
favour microbial and/or biochemical activities, will contain BA (8). On the one hand, BA in food can
be of endogenous origin, which means that they were formed by metabolic pathways of the plant or
animal and are hence present in the raw material of the food. “Natural polyamines” (putrescine,
spermine and spermidine), for example, are formed by de novo polyamine synthesis (see further)
(12). Endogenous biogenic amines are usually present in low concentrations in unfermented foods
like fruits and vegetables, meat, fish and milk (7). On the other hand, when their origin is exogenous,
biogenic amines are the result of microbial decarboxylation (figure 2) of free amino acids and are
present in higher concentrations. The precursing amino acids are either the result of proteolysis of
protein or were already present in the raw materials (13). Being the result of microbial activity,
exogenous biogenic amines can be present in fermented foods, like yoghurt, dry sausages, chocolate,
olives, etc. on the one hand and in spoiled foods on the other hand (8; 11).
Figure 2: decarboxylation reaction of Histidine to Histamine(14).
The most frequently occurring biogenic amines in foodstuffs are histamine, tyramine, putrescine,
cadaverine, tryptamine, 2-phenylethylamine, which are products of histidine, tyrosine, ornithine,
lysine, β-phenylalanine respectively (7; 10; 12). Figure 3 shows the structures of these compounds.

5
Figure 3: Structure of the most important biogenic amines in food products(7).
2.1.2 Production by microorganisms
Biogenic amines can only be produced by MO that contain decarboxylase activity, which means they
can synthesize decarboxylases, the enzymes necessary for decarboxylation. Decarboxylase activity
has already been detected in strains of the genera Bacillus, Pseudomonas and Photobacterium, in
Enterobacteriaceae like Escherichia, Morganella morganii, Citrobacter, Salmonella, Shigella and
Proteus, in Micrococci like Micrococcus, Staphylococcus and Kocuria and in the lactic acid bacteria
Lactobacillus, Pediococcus, Leuconostoc and Streptococcus (8; 7; 10). Even some yeast strains are
believed to be able to produce these enzymes. It needs to be mentioned that the presence, the
activity, and the specificity of decarboxylases are strain-dependent characteristics and can thus differ
within one microbial species (10). This fact needs to be considered when trying to determine which
organism was responsible for the BA present in a certain food product.
The physiological role of biogenic amines in the producing microorganisms has not yet been fully
elucidated. According to some authors, BA-production could be some kind of defence mechanism
against stressing effects of temperature, acidic pH, salt or other biological and/or chemico-physical
factors (10). Other reasons for MO to carry out BA-production involve a contribution to energy-
generation and assistance in pathogenesis by promoting adhesion to host cells, by altering the hosts
physiology (vasodilating effect of histamine) or by promoting the production of a virulence factor (1).

6
2.1.3 Detection methods
As mentioned in the introduction, determination of BA-profiles of foods is important, because of
their toxicity and their possible role as spoilage indicators. For the qualitative and quantitative
detection of BA, various methods have already been developed. Most are based on some form of
chromatography like Thin Layer Chromatography (TLC), Gas Chromatography (GC), Capillary
Electrophoresis (CE) and High Performance Liquid Chromatography (HPLC). HPLC with pre- or post-
column derivatisation is the most frequently used technique. Detection has been performed by
mass spectrometry, electrochemical detection or fluorimetric detection, but usually, UV-detection
after derivatisation with dansyl chloride or ortho-phtalic aldehyde (OPA) is used (7). Figure 4 shows
how the UV-sensitive product of this derivatisation reaction is formed. It must be mentioned that the
extraction of the BA from the food matrix, preceding the HPLC-analysis is the most crucial step in the
procedure, because it is the most important cause of low recoveries (7).
Figure 4: Derivatisation reaction of biogenic amines with dansyl chloride (15).
2.2 TOXICOLOGY
2.2.1 General
The first reason why monitoring the BA-levels of food is important, is because excessive intake of
certain BA can have a toxic effect on the human body. Fish and cheese are the foods associated with
the highest number of BA-poisoning cases (12). Histamine is the BA causing the food poisoning most
frequently and histamine intoxication, posing allergy-like symptoms, is mostly associated with the
consumption of scombroid fish and cheese (1; 8). Tyramine intoxication is called “cheese reaction”
and is mainly associated with cheese and wine. Other biogenic amines, like putrescine, cadaverine,
spermine and spermidine, show only limited direct toxicity but can potentiate the toxicity of
histamine and tyramine (7; 1; 12).
Below, the overall detoxification mechanisms of BA will be discussed. Next, a discussion of the
toxicity of histamine, trace amines and polyamines will follow, as these are three groups with
distinctly different toxicity mechanisms.
2.2.2 Detoxification
The human body is able to detoxify BA, mainly by oxidation. Oxidation is carried out by specific
enzymes, called mono- (MAO) or diamine oxidases (DAO), depending on the number of amino
groups oxidized. Both MAO and DAO are present in the intestinal tract of mammals, where they
detoxify BA present in ingested foods (16; 13). Detoxification pathways might differ slightly between
different BA. Histamine, f.ex. is mainly detoxified by DAO, but tyramine detoxification is chiefly
carried out by MAO (17; 18). For histamine, another detoxifying pathway via methylation or
acetylation by histamine-N-methyltransferase (or -acetyltransferase) exists(18).
7
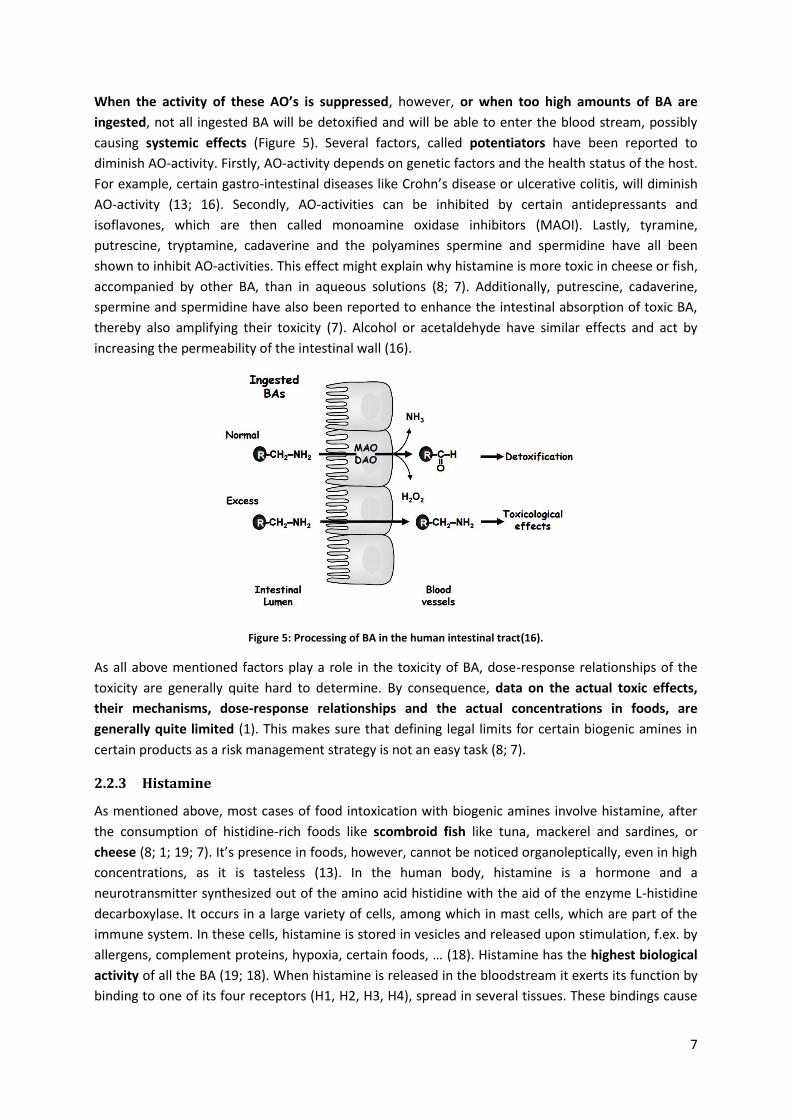
When the activity of these AO’s is suppressed, however, or when too high amounts of BA are
ingested, not all ingested BA will be detoxified and will be able to enter the blood stream, possibly
causing systemic effects (Figure 5). Several factors, called potentiators have been reported to
diminish AO-activity. Firstly, AO-activity depends on genetic factors and the health status of the host.
For example, certain gastro-intestinal diseases like Crohn’s disease or ulcerative colitis, will diminish
AO-activity (13; 16). Secondly, AO-activities can be inhibited by certain antidepressants and
isoflavones, which are then called monoamine oxidase inhibitors (MAOI). Lastly, tyramine,
putrescine, tryptamine, cadaverine and the polyamines spermine and spermidine have all been
shown to inhibit AO-activities. This effect might explain why histamine is more toxic in cheese or fish,
accompanied by other BA, than in aqueous solutions (8; 7). Additionally, putrescine, cadaverine,
spermine and spermidine have also been reported to enhance the intestinal absorption of toxic BA,
thereby also amplifying their toxicity (7). Alcohol or acetaldehyde have similar effects and act by
increasing the permeability of the intestinal wall (16).
Figure 5: Processing of BA in the human intestinal tract(16).
As all above mentioned factors play a role in the toxicity of BA, dose-response relationships of the
toxicity are generally quite hard to determine. By consequence, data on the actual toxic effects,
their mechanisms, dose-response relationships and the actual concentrations in foods, are
generally quite limited (1). This makes sure that defining legal limits for certain biogenic amines in
certain products as a risk management strategy is not an easy task (8; 7).
2.2.3 Histamine
As mentioned above, most cases of food intoxication with biogenic amines involve histamine, after
the consumption of histidine-rich foods like scombroid fish like tuna, mackerel and sardines, or
cheese (8; 1; 19; 7). It’s presence in foods, however, cannot be noticed organoleptically, even in high
concentrations, as it is tasteless (13). In the human body, histamine is a hormone and a
neurotransmitter synthesized out of the amino acid histidine with the aid of the enzyme L-histidine
decarboxylase. It occurs in a large variety of cells, among which in mast cells, which are part of the
immune system. In these cells, histamine is stored in vesicles and released upon stimulation, f.ex. by
allergens, complement proteins, hypoxia, certain foods, … (18). Histamine has the highest biological
activity of all the BA (19; 18). When histamine is released in the bloodstream it exerts its function by
binding to one of its four receptors (H1, H2, H3, H4), spread in several tissues. These bindings cause

8
various effects. As such, histamine plays a role in gastric acid secretion, immunomodulation, day-
night rhythm, cell growth and differentiation, attention and cognition (1; 18). Toxic symptoms,
however, are mainly the result of histamine binding causing intestinal smooth muscle cell contraction
and dilatation of peripheral blood vessels (1; 8).
Detoxification by DAO forms the main mechanism for histamine originating from foods. When high
amounts of histamine are ingested, DAO-detoxification is insufficient, and histamine intoxication
occurs, posing allergy-like symptoms like headaches, flushing, rashes, hypotension, bronchospasm,
tachycardia, arrhythmias, oedema, pruritus and asthma (8; 1; 13; 18). Incubation times range from a
few minutes to a few hours. Rapid reactions suggests that at least part of the amine can be absorbed
already in the mouth, where no detoxification system is present (8; 13).
The toxicity of histamine is dependent on its concentration in the blood. Concentrations of 0.3 to 1.0
ng/ml are considered normal. Table 1 shows which symptoms can be expected at several blood
concentrations.
Table 1: Effects of histamine on the human body according to its concentration in the blood (18)
Histamine level (ng/mL) Clinical effect
0-1 Reference
1-2 ↑ Gastric acid secretion ↑ Heart rate
3-5 Tachycardia, headache, flushing, urticaria, pruritus
6-8 ↓ Arterial pressure 7-12 Bronchospasm
≈ 100 Cardiac arrest
Parente et al (2001) have stated that intake levels of 8-40 mg, 40-100 mg and above 100 mg can
cause respectively slight, intermediate and severe poisoning (7). Also, EFSA has reported an NOAEL
of 50 mg. Some individuals, however, are histamine intolerant and have lower DAO-activity, either by
genetic predisposition or by the action of gastrointestinal diseases. Approximately 1% of the
population is believed to suffer from this condition (18; 1). For these individuals, NOAEL are below
the detection limits. Therapy of histamine intolerance consists of consumption of a histamine-free
diet or prescription of antihistamines (18). Finally, histamine is the only biogenic amine for which
legal limits exist. According to Regulation 2073/2005 a 3 class sampling plan with n = 9, c = 2, m =
100 mg/kg and M = 200 mg/kg, is used in control analyses for “fish species associated with high
amounts of histidine”(20). For other foods, the same levels are being suggested, while 2 mg/l is
suggested for alcoholic beverages (14).
2.2.4 Tyramine and trace amines
Tyramine, together with β-phenylethylamine and tryptamine, is part of a group of biologically active
amines called “trace amines”. They are functionally and structurally similar to catecholamines and
occur in the body only in trace amounts (nanomolar concentrations in the brain). Trace amines are
synthesized in the body by decarboxylation out of their earlier mentioned precursors. The highest
tyramine levels are mainly found in cheese and fermented meat products (hundreds of mg/kg are
possible). Especially in long-ripened cheeses made from raw milk, concentrations above 1000 mg/kg
can occur. Tyramine and β-phenylethylamine have also been associated with red wine and chocolate
(16; 17).

9
The physiological action of tyramine and the other trace amines is sympathomimetic. When entering
the vascular system, tyramine can be hydroxylated to octopamine, which subsequently displaces
noradrenaline in nerve cells. This release of noradrenaline causes vasoconstriction. Several recent
studies, however, state that the vasoconstricting effect of tyramine might also be partly due to its
binding to trace amine-associated receptors, located in the blood vessels. Lastly, tyramine also
causes a transient increase in blood pressure, by stimulating muscle contraction, thereby increasing
the cardiac output (16; 17).
Tyramine is metabolized by the action of MAO, located throughout the whole body. Toxic effects of
tyramine are mainly associated with consumption of tyramine-rich foods in combination with mono
amine oxidase inhibitory (MAOI) drugs. These MAOI-drugs inhibit MAO-activity not only in the
intestine, but throughout the whole body and as noradrenaline is also metabolized by MAO and
tyramine mediates its release, the resulting high amounts of noradrenaline in the blood can lead to a
life threatening situation, called a hypertensive crisis. Certain cases have been fatal due to brain
hemorrhage and heart failure. Less severe cases of tyramine intoxication, for example at high intake
levels or in a person with genetically lower MAO-activities, give rise to symptoms like headaches,
nausea and vomiting. Other trace amines, like β-phenylethylamine and tryptamine, have been
shown to exhibit similar effects (17).
Toxic levels of tyramine and trace amines are generally established by determining the tyramine
pressure response, i.e. the dose of amine to be administered in order to increase the blood pressure
by 30 mmHg (16). In healthy men, this dose has been reported to be 500 mg of orally administered
tyramine. As women appear more sensitive to tyramine, smaller doses might already give a similar
effect (16). NOAEL have been determined for tyramine and were established at 600 mg/meal for
healthy people, 50 mg/meal for persons taking third generation MAOI-drugs, but only 6 mg/meal for
individuals taking the classic MAOI-drugs. For phenylethylamine and tryptamine, insufficient data on
dose-response relationships are available (1). No legal limits have been set for the contents of
tyramine or the other trace amines in foods, but levels of 100 - 800 mg/kg for tyramine and 30 mg/kg
for phenylethylamine have been suggested as maximal allowable levels (7; 19).
2.2.5 Putrescine, cadaverine and polyamines
Cadaverine is derived from lysine by lysine-decarboxylase. The physiological role of this BA is not very
well known, but it has been shown to replace putrescine in some biological systems (1).
Putrescine (1,4-diaminobutane), together with spermine (N, N-bis-(3-aminopropyl)-1,4-
diaminobutane) and spermidine (N-(3-aminopropyl)-1,4-diaminobutane) is part of the group of the
polyamines. In the human body polyamines are either synthesized in human cells by de novo
polyamine synthesis, or they have been taken up from food products. Figure 6 shows the
biosynthetic pathways of these compounds. Putrescine can, firstly, be derived from ornithine by
decarboxylation by ornithine decarboxylase. A second pathway starts from arginine, which is first
decarboxylated to yield agmatine, and then further deaminated to putrescine (21; 7). In normal cells,
the level of polyamines is strictly regulated. Catabolism is carried out through acetylation and
subsequent oxidative deamination by DAO or PAO, the latter giving rise to the formation of H2O2
(22).

10
Figure 6: Biosynthetic pathway of putrescine, spermidine and spermine in mammals (ATP = adenosine triphosphate, MAT = methionine decarboxylase, AdoMetDC = S-adenolsymethionine carboxylase,ADC = arginine decarboxylase, ODC =
ornithine decarboxylase) (21).
Polyamines can be found in foods of both animal or plant origin. Foodstuffs of plant origin are usually
richer in spermidine compared to spermine, while the opposite is true for animal products (21). Also,
putrescine is usually the most abundant polyamine in foods of plant origin, at levels sometimes
higher than 40 mg/kg, while low levels (0-3 mg/kg) characterize animal products. The richest
polyamine source would be cheese, but certain fruits, meat, legumes, potatoes and vegetables may
also contain considerable amounts. Milk, eggs and yoghurt usually don’t contain very significant
amounts, but polyamines in human milk may still be of great importance for newborns (22).
Polyamines fulfil a variety of essential physiological roles. Most of their functions are related to the
fact that they are polycations at physiological pH and thus interact easily with negatively charged
molecules, like DNA and some membrane constituents (21). The most prominent function of
polyamines involves their participation in cell proliferation and growth, a role which they exhibit
through stabilization of DNA and cellular membranes, regulation of RNA transcription and protein
synthesis (8; 22). As such, high levels of polyamines have been reported in rapidly dividing cells and
they have been proven to play an important role in the development of the digestive system in
newborn animals, the maintenance of the epithelial barrier function in adults and in wound healing.
Several negative effects of polyamines, however, have also been described. As such, at high
concentrations, they have also been related to tumor development, which has made them subject of
rigorous medical and physiological studies (21). Furthermore, polyamines might be of importance in
the proliferation and differentiation of lymphocytes and the regulation of the inflammatory response
and thus regulate the immune system, preventing allergies or food intolerance (21; 22).
Toxic effects of polyamines and cadaverine are mainly indirect and generally much less potent than
those for histamine and tyramine. Symptoms which have been described are hypotension,
bradycardia, lockjaw and paresis of the extremities (23). Polyamines and cadaverine potentiate the
negative effects of histamine and tyramine on the human body, by impairing their oxidation by DAO
and MAO and by enhancing their adsorption by the intestinal tract (8).
Another way by which polyamines, cadaverine and also tyramine, might exert a toxic effect, is by
generation of nitrosamines (Figure 7). When subjected to heat, f.ex. during a cooking process for

11
cooked hams, these BA can form secondary amines. Cadaverine an putrescine, f.ex. form pyrrolidine
and piperidine upon heating (12). When these secondary amines interact with nitrosating agents
such as nitrite and nitrogen oxides during storage or cooking, they can give rise to the formation of
carcinogenic nitrosamines. This mechanism is of particular importance in some processed meat
products, to which nitrates and nitrites are added to preserve color (8; 12).
For polyamines, no legal limits in foods have been suggested. Toxic levels are difficult to pinpoint, as
there is a general absence of dose-response data for polyamines and cadaverine in food and studies
on humans. From studies on rats, however, the acute oral toxic levels of putrescine, spermine and
spermidine have been established at 2000, 600 and 600 mg/kg body weight per day. Similarly, NOAEL
were established at respectively 180, 83 and 19 mg/kg BW/day (1; 21). These exposure levels,
however, are way too high to be reached only by a normal consumption of food, because the normal
adult diet provides only between 350 and 500 micromoles per day ( = 31 – 44 mg putrescine or 36 –
51 mg cadaverine) (21; 22).
Figure 7: Mechanism of the formation of nitrosamine out of nitrite and an amine. In an acidic medium, a nitrosonium ion is formed, which reacts with an amine. In the case of biogenic amines, this last amine would be a secondary amine,
resultant from putrescine, cadaverine, spermine, spermidine or tyramine (24).
2.3 QUALITY INDICATOR
BA are not only important because of their toxicity, but also because, as they result out of growth
and metabolism of microorganisms, they can indicate the degree of spoilage of a food product, the
microbial quality of the raw materials or the hygiene of the production process (12). There is
evidence that, as the hygienic quality of a product decreases, the BA-contents increase (1).
During storage of food, the overall concentration of BA changes. In unfermented products, like f.ex.
fresh meat and fish, the levels of histamine, cadaverine and putrescine will typically increase. Levels
of spermine and spermidine, however, usually decrease. Microbial counts increase as well during
storage, thus the presence of BA could be linked to the presence of certain decarboxylase-positive
spoilage organisms. Indeed, good correlations have been found between microbial counts and, f.ex.,
the concentrations of putrescine and cadaverine. Therefore, a number of biogenic amine indexes
(BAI) have been suggested in order to determine the hygienic quality of a food product. The sum of
histamine, tyramine, putrescine and cadaverine has been used as an indicator of meat freshness by
Hernandez-Jover et al. (1996) (19; 9; 12). Table 2 gives a good view on which values of this index are
related to meat of good hygienic quality (9; 12). Other indexes have been based on just one biogenic
amine, or have been using combinations with other factors (1). One should note, however, that, as
not all spoilage organisms are able to produce biogenic amines (vide supra), the absence of biogenic
amines does not necessarily mean that a product is safe.

12
Table 2: BAI-values (sum of histamine, tyramine, putrescine and cadaverine) in relation to meat quality for fresh meats (12).
BAI-value (mg/kg) Hygienic meat quality
< 5 Good
5 – 20 Acceptable
20 - 50 Initial spoilage signs
> 50 Spoiled
In fermented food products, the use of BA-contents as a quality index is limited, because although
these products do contain high counts of microorganisms and very variable BA-levels, these are most
likely part of the starter culture and thus not always indicative of a spoiled product (see further: 5.2)
(12).
2.4 FORMATION OF EXOGENIC BIOGENIC AMINES
As was previously pointed out, biogenic amines can occur in every product that contains proteins or
free amino acids(8). Figure 8 shows a clear overview of how biogenic amines are generally formed.
First, proteins are broken down by either autolytic or bacterial proteolysis, delivering free amino
acids. Subsequently these free amino acids are converted to biogenic amines by decarboxylation,
which means that the carboxyl moiety of the amino acid is removed (9; 12).
Figure 8: Overview of the formation of BA starting from proteins (12)
The main prerequisites for the formation and accumulation of BA are: 1) the presence of FAA, the
substrate for decarboxylation 2) the presence decarboxylase positive bacteria and 3) suitable
environmental conditions that favor growth of these microorganisms, their enzyme production and
sufficient enzyme activity. Hence, all factors which have an influence on these three requirements,
will influence the formation of BA (1).
2.4.1 Substrate availability
The amount of AA present in a food product will mainly be determined by the extent of proteolysis
happening during storage, production or fermentation (12). This process can occur through both the

13
action of endogenous and microbial enzymes and is influenced by pH and NaCl-concentration (10).
Accelerated or enhanced proteolysis has been related to higher amounts of BA (1). Which and how
many AA are available for decarboxylation will also depend on the composition of the food product,
more specifically its protein content and AA-composition (10). As such, products with higher protein-
contents are more likely to yield high amounts of AA, and thus BA (think about the high BA-
contents of spoilt fish versus low contents in fruit and vegetables)(19)(23).
Inhibiting proteolysis can be a strategy to limit BA-formation in food (10). However, in fermented
products like cheese and fermented sausages, proteolysis is a vital part of the production process
and thus cannot be eliminated.
2.4.2 Presence of microorganisms
MO act as providers of the decarboxylase enzyme and thus play a fundamental role in the formation
of BA. It has been shown that in sterile products, no BA are formed, showing that microbial activity
is essential for BA-formation (12). Presence of MO in food products can be due to their presence in
the raw material or their addition during the production process, either willingly as a starter culture,
or unwillingly as a contamination (1).
Factors concerning MO determining the final BA-contents of food products are the type of MO and
the microbial load (8; 10; 12). The type of MO is important because not all bacteria are
decarboxylase positive. Only decarboxylase positive MO will be able to generate BA. The type of
decarboxylases can differ between MO, making each bacteria produce a different range of BA. As
such, certain amines can be associated with some groups of organisms. Putrescine and cadaverine
production, for example, can be linked to the presence of Enterobacteriaceae, while tyramine can
mainly be linked to Enterococci. Also, as mentioned before, the production of decarboxylases is
dependent on the strain, rather than on the species of MO present (1).
The microbial load of a product will firstly depend on the initial MO-contamination, and secondly on
their ability to grow, which in its turn is influenced by many factors (see further). At higher microbial
loads, higher concentrations of BA will be found (12).
2.5 Conditions affecting MO-growth, decarboxylase production and decarboxylase
activity
2.5.1 Temperature
The combination of time and temperature during storage is widely considered as very determining
for the BA-contents of food (8; 10). Being a major determinant of the growth of MO, higher
temperatures and longer storage times yield higher amounts of BA (1; 10). Indeed, it has been
demonstrated that Klebsiella pneumonia produced more cadaverine at 20°C than at 10°C (8). For
mesophilic bacteria, BA-production is optimal between 10°C and 37°C, and can thus be inhibited by
storage at lower temperatures. Psychrotrophic bacteria like Photobacterium phosphoreum and
Morganella psychrotolerans, however, are able to grow at refrigerator temperatures and can provide
for the accumulation of BA even below 5°C (1). Nevertheless, in general, the levels of BA will be
lower in refrigerated food compared to foods that have undergone temperature abuse (10).
For fermented products, the fermentation temperature is another factor of influence. During
fermentation, relatively high temperatures (24°C) will mostly favor the growth of the starter culture,
which then overgrow amine-positive non-starter MO, leading to lower BA-contents (10). Maijala et

14
al. (1995), however, have reported that the effect of fermentation temperature is highly dependent
on the starter used (25).
2.5.2 pH
The pH-level of a food product has a dual effect on BA-formation. On the one hand, it is considered a
major determinant of decarboxylase production and activity, which are both higher at slightly acidic
pH-values. Optimal pH-values for decarboxylase activity generally lie between 4.0 and 5.5 (8). On
the other hand, acidic pH-values inhibit the growth of MO, thereby lowering BA-production
indirectly. The final equilibrium between both mechanisms will eventually determine the true BA-
contents and is product- and decarboxylase-dependent. As such, tyramine-production in cheese has
been proven to be optimal at pH 5.0(26), yet production of histamine in skipjack tuna has shown and
optimum pH of 4.0 . Finally, adjusting the pH of a product is possible to limit BA-formation. Addition
of glucono-δ-lacton, for instance, will lower pH (8).
2.5.3 Other factors
Firstly, several compositional features of a product are worth mentioning here. NaCl-concentration,
for instance, has been shown to have an effect on BA-formation, allegedly by inhibiting both MO-
growth and decarboxylase activity. Santos (1996) has reported BA-inhibiting effects proportional to
the brine concentration even at 25°C. Other studies, however, have also shown enhanced BA-
forming capacity in halotolerant bacteria like Staphylococcus (1), thus the effect of NaCl is strain-
specific. Increasing fat contents have also been negatively related to BA-concentrations, owing to
lower water-activities, which inhibit MO-growth (12). Glucose in a food product has a dual relation to
BA-contents. On the one hand it forms a nutritional source for MO, stimulating growth and thus
enhancing BA-formation (8). Glucose concentrations of 0.5 – 2.0 % are reported as ideal for bacterial
growth and BA-formation. Levels above 3%, however, have shown inhibiting effect (8; 12). On the
other hand, in fermented foods, glucose (or other fermentable carbohydrates) are mostly used by
starter cultures, acidifying the product and overgrowing other BA-producing bacteria. This then
results in lower BA-concentrations (10).
Oxygen content also has a marked impact on BA-contents, but the effects are not straightforward. As
such, putrescine production by Enterobacter cloacae is cut in half in anaerobic conditions compared
to aerobic conditions (19), but Bover-Cid et al. (2006) reported no effect at all on formation of
histamine, cadaverine and putrescine (1). Also, many studies have shown successful application of
MAP-conditions in limiting BA-formation, but it should be noted that these effects are strongly
dependent on both the type of product and the specific spoilage flora (27).
It should also be noted that all above mentioned factors are strongly interrelated, which makes it
difficult to determine their isolated effects. Moreover, all effects appear strongly product-specific
(1). It is the combination of all these factors that will eventually determine the type and
concentration of biogenic amines (12). A severely simplified model is given in figure 9, in which the
influence of different factors is shown.

15
Figure 9: Simplified model of the influence of different factors on the formation of BA (figure adjusted from(12)).
2.6 CONTROL OF BA-CONTENTS
It has been proven that BA are present in many parts of our diet (8; 19; 1) and are thus practically
impossible to avoid, consuming a balanced diet. This and the fact that consumers are increasingly
aware of the safety and healthy image of their food and adjust their consumer behavior accordingly,
makes sure that increased attention is being paid to the presence of BA in food products. In order to
comply with evolving consumer demands, industries are looking for new and improved technologies
that will produce high quality products with biogenic amines at nontoxic levels. There is, therefore,
increased interest in studies that examine the toxicity of certain BA and the factors which influence
their concentration in food (12). A better understanding of these mechanisms contributes to the
development of strategies to prevent toxic levels of BA-formation (8). These strategies can then be
implemented in the food safety management system (FSMS) of the company, by defining and
applying relevant prerequisite programs (PRP’s) and defining critical control points (CCP’s).
Currently, the main tactics for control of BA-accumulation are (1):
1) Prevention of contamination with decarboxylase-positive MO by guarding the hygienic
quality of the product during raw material handling and processing,
2) Applying environmental conditions or production techniques which:
a. Inhibit or eliminate decarboxylating MO
b. Limit BA-formation by controlling MO-growth, decarboxylase production and activity
Application of these tactics is mainly focused on the production stages of a food product, more
specifically the raw material handling and the fermentation process (if present). During storage, BA-
accumulation is also possible, but mainly depends on how these previous stages were carried out (1).
Destruction of formed BA has been attempted as well, but this approach is not according to the
current food safety policy, which aims at prevention rather than elimination of problems. Elimination
of BA by normal cooking is not possible, as they are quite heat-resistant (1; 8). The use of amino
oxidase positive MO as a starter culture has also been investigated (27; 28; 10). Application of such
techniques can, however, possibly mask improper hygienic and manufacturing practices (1).

16
2.6.1 Raw material handling
In raw or unfermented products, controlling the level of BA mainly comes down to controlling the
microbial load of the product. This means 1) limiting contamination, 2) eliminating contaminating
bacteria and/or 3) inhibiting their growth.
The main strategy to prevent contamination with decarboxylase positive MO is the conscientious
application of an elaborate food quality and safety (SMS) management system relying on HACCP. In
this respect, spreading or addition of decarboxylating MO should be inhibited by application of good
health and manufacturing practices (GHP/GMP) and proper cleaning and disinfection, starting at
primary production (1). Eliminating contaminating MO can be done by using thermal treatments,
e.g. pasteurization of milk in cheese production (29). Some products, however, like fresh fish or
meat, do not allow the use of thermal treatments, due to damage of the raw materials. For these
commodities, alternative techniques like irradiation or hydrostatic pressure are an option, although
further research is still needed (1). Finally, in terms of growth-inhibition, the time/temperature
combination is considered to be the most important factor, both during production and storage (vide
supra) (12).
2.6.2 Fermentation process
Controlling the amounts of BA in fermented food products is typically more difficult than in
unfermented foods, as fermentation usually provides for an ideal environment for BA-formation.
The obligatorily present MO, for instance, who carry out the fermentation, can also show aminogenic
activity. Moreover, proteolysis and acidification - unavoidable parts of a fermentation process - both
favor the decarboxylation reaction. Hence, fermented food products usually contain higher amounts
of BA than unfermented foods (1). Also, their BA-contents tend to show more and extensive
variability (12; 1). It has, however, been proven possible to generate fermented products with low
amounts of BA, by careful control of the fermentation process (1).
First and foremost, in order to control BA-contents, the above mentioned tactics for raw material
handling (SMS-system, time/temperature management, …) should be applied for fermented products
as well. In fermented meat products, for instance, the hygienic quality of the raw materials has been
related to the high variability in BA-contents of the end products (30). Further control of the
fermentation process usually comprises the careful selection of a starter culture together with
environmental parameters like the composition of the product (sugar, salt, spices, additives, …) and
processing parameters (temperature, product shape, …), all in function of the specific product which
is aimed at. Careful fine-tuning of these factors for each type of product is vital to obtain optimal BA-
inhibition. The aim is usually to favor the growth of the fermentative non-aminogenic MO and to
limit the growth of non-desired aminogenic MO (1).
The most important BA-determining factor is the starter culture (31). Fermentation based on the
naturally present microbial flora is also being applied, but generally gives rise to more variable and
less controllable BA-contents (8). A starter culture can be an axenic culture or a mixture of bacteria,
in which lactic acid bacteria usually play a leading role (10; 32). If well chosen, starter cultures can
decrease BA-accumulation in fermented products by shortening the fermentation time and by
overgrowing the amine producing background flora (9). They can cause a rapid pH-decrease in the
food product, which has been related to lower levels of BA (10). In order to optimally limit BA-
production, careful selection of the starter culture is vital and should take into account their safety,

17
their competitiveness and their ability to influence the organoleptic properties of the product.
Ideally, starter cultures are decarboxylase negative and dominant towards amine producing MO (1).
2.7 EXPOSURE AND RISK ASSESSMENT
After discussing the kind of hazard biogenic amines form and the importance of controlling their
concentrations in food products, it is of equal importance to define precisely where the hazard of
these compounds lies (which food products, which BA, which concentration, ...) and what is the
actual risk run by a population (in this case, the Belgian population). This can be estimated by a
process called risk assessment. In the context of food safety, risk assessment is defined as the
assessment of health risks from a variety of compounds that can be present in food (33). It is a
scientific process comprising 4 steps: hazard identification, hazard characterization, exposure
assessment and risk characterization. Its goal is to provide a scientific basis for the implementation of
measures aiming at risk-reduction (34). Hazards are defined as biological, chemical or physical agents
that are able to cause an adverse health effect. Risks, on the other hand, are defined as the
probability of the occurrence of an adverse health effect and its severity (35).
In short, during hazard identification, one identifies what is the cause of a certain known adverse
health effect. In this thesis, identification of the hazard is elaborated under 2.1. Biogenic amines.
Hazard characterization then comprises further characterization of the symptoms and mechanisms
of the adverse health effect and the determination of the dose-response relationship (see 2.2
toxicology). Next, exposure assessment is aimed at defining (quantitatively or qualitatively) to how
much of the hazard a person is exposed during a certain period. Finally, risk characterization
combines the exposure and dose-response data in order to estimate the probability and severity of
the problem. In each step, variability’s and uncertainties should be identified (34; 35). This
knowledge can then be used by the authorities to define policy measures, such as legal limits,
monitoring or measures at company level (33).
Risk assessments can be executed qualitatively or quantitatively. Quantitative risk assessment
comprises mathematical analysis of numerical data and is usually preferred. In case of limited data or
time, however, one must conduct a qualitative risk assessment, which is a descriptive technique.
Qualitative risk assessments can also be applied as a first estimate of the food safety issue, in order
to determine if further, more detailed analysis is warranted (34).
An exposure assessment is performed by combining concentration and consumption data, in order to
define the level of exposure (Figure 10). Consumption data collected on an individual level ideally
stems from dietary records (food diary’s) or 24h-recalls. Next to information on the types and
amounts of food eaten, it should also contain additional information about the food products
(brands, packaging, preparation) and the consumer (age, body weight, nationality, …). Concentration
data usually originate from National monitoring programs (36).

18
Figure 10: Probabilistic risk assessment: exposure assessment for one hazard and one food type (own figure).
Exposure assessments can either be performed deterministically, using only single values (e.g. mean
values or P95-values) or probabilistically, using a Monte-Carlo simulation and resulting in an
exposure distribution. Exposure distributions provide a view on both the likelihood and the range of
exposure values and also directly display uncertainty and variability, which makes probabilistic
modelling the method of choice (35; 34).
Traditionally, risk assessment usually focused on only one hazardous compound in a particular food
product (37; 38). Nowadays, however, attempts are made to assess the risks associated with more
complex (and more realistic) situations. As such, cumulative risk assessment estimates the risks
associated with exposure to multiple hazards (compounds) related to a single adverse health effect
or target (Figure 11). On the other hand, aggregated risk assessment, is concerned with the risk
associated with exposure to one hazard via multiple routes/sources/pathways (Figure 11). The
Euromix (39) and Acropolis Project (40) are both examples of this more complex view on risk
assessment. They are both research projects which aim at assessing the risk of exposure to mixtures
of chemicals.
Figure 11: Illustration of the principles of cumulative (left) and aggregated (right) risk assessment (41).
Also for the BIOGAMI-project, the aim is to perform a risk assessment for multiple BA in multiple
classes of food, which might comprise the following steps. Firstly, for each combination of BA and
food class, a separate exposure assessment can be executed. Each of these distributions can then be
compared to the specific toxic levels known for each BA (vide supra). Secondly, for each individual
BA, the total exposure per meal or per day could be calculated by summation of exposure data over
all food classes (aggregate exposure assessment)(40). This can be done based on a previously

19
calculated average consumption pattern per day, or, as not all people consume all sources of BA
every day, on individual daily consumption data (1). These values of total exposure can equally be
compared to toxic amine-levels. Analysing the exposure data will also reveal which food classes offer
the biggest exposure levels of a certain BA and thus, which kinds of food offer the biggest risk. Risk
managers can then target these food groups in their development of policy measures (1).
Lastly, a cumulative exposure assessment could also be performed. Cumulative risk assessments aim
to assess the combined risk associated with multiple stressors (38). In the scope of this project, that
would mean looking at the combined effect of all BAs within one food group, keeping the
interactions between the different BA in mind. Considering the limited amount of quantitative
information on these interactions, and since the toxic mechanisms and dose-response relationships
differ for each BA, it would be no use to add up the exposure values of BA within one food group. A
qualitative comparison of the BA-profiles of different food groups would still be possible, though.
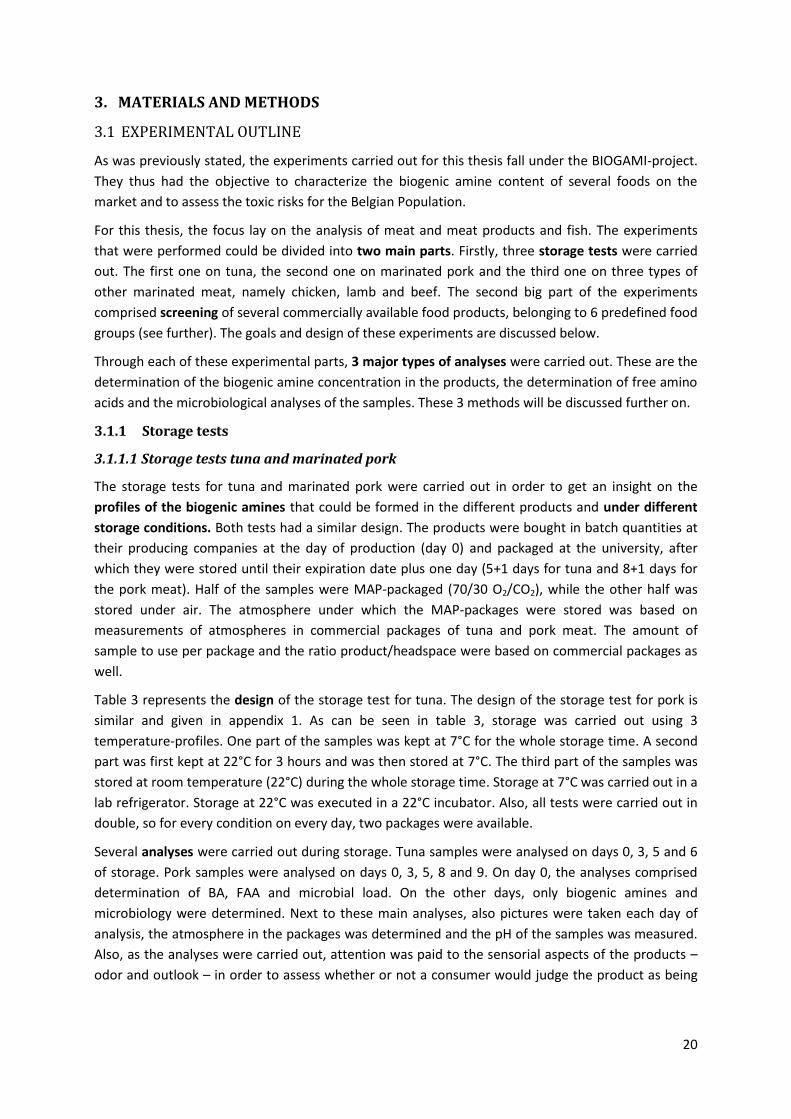
20
3. MATERIALS AND METHODS
3.1 EXPERIMENTAL OUTLINE
As was previously stated, the experiments carried out for this thesis fall under the BIOGAMI-project.
They thus had the objective to characterize the biogenic amine content of several foods on the
market and to assess the toxic risks for the Belgian Population.
For this thesis, the focus lay on the analysis of meat and meat products and fish. The experiments
that were performed could be divided into two main parts. Firstly, three storage tests were carried
out. The first one on tuna, the second one on marinated pork and the third one on three types of
other marinated meat, namely chicken, lamb and beef. The second big part of the experiments
comprised screening of several commercially available food products, belonging to 6 predefined food
groups (see further). The goals and design of these experiments are discussed below.
Through each of these experimental parts, 3 major types of analyses were carried out. These are the
determination of the biogenic amine concentration in the products, the determination of free amino
acids and the microbiological analyses of the samples. These 3 methods will be discussed further on.
3.1.1 Storage tests
3.1.1.1 Storage tests tuna and marinated pork
The storage tests for tuna and marinated pork were carried out in order to get an insight on the
profiles of the biogenic amines that could be formed in the different products and under different
storage conditions. Both tests had a similar design. The products were bought in batch quantities at
their producing companies at the day of production (day 0) and packaged at the university, after
which they were stored until their expiration date plus one day (5+1 days for tuna and 8+1 days for
the pork meat). Half of the samples were MAP-packaged (70/30 O2/CO2), while the other half was
stored under air. The atmosphere under which the MAP-packages were stored was based on
measurements of atmospheres in commercial packages of tuna and pork meat. The amount of
sample to use per package and the ratio product/headspace were based on commercial packages as
well.
Table 3 represents the design of the storage test for tuna. The design of the storage test for pork is
similar and given in appendix 1. As can be seen in table 3, storage was carried out using 3
temperature-profiles. One part of the samples was kept at 7°C for the whole storage time. A second
part was first kept at 22°C for 3 hours and was then stored at 7°C. The third part of the samples was
stored at room temperature (22°C) during the whole storage time. Storage at 7°C was carried out in a
lab refrigerator. Storage at 22°C was executed in a 22°C incubator. Also, all tests were carried out in
double, so for every condition on every day, two packages were available.
Several analyses were carried out during storage. Tuna samples were analysed on days 0, 3, 5 and 6
of storage. Pork samples were analysed on days 0, 3, 5, 8 and 9. On day 0, the analyses comprised
determination of BA, FAA and microbial load. On the other days, only biogenic amines and
microbiology were determined. Next to these main analyses, also pictures were taken each day of
analysis, the atmosphere in the packages was determined and the pH of the samples was measured.
Also, as the analyses were carried out, attention was paid to the sensorial aspects of the products –
odor and outlook – in order to assess whether or not a consumer would judge the product as being

21
spoilt or not. It was particularly expected that the marinade on the pork’s meat might be able to
camouflage spoilage to a certain extent.
Table 3: Design of the 6-day storage test for tuna.
Day 0 Day 3 Day 5 Day 6
Number of
samples Analyses
Number of
samples Analyses
Number of
samples Analyses
Number of
samples Analyses
7 °C
Pictures, atmosphere, pH, BA, FAA,
MO, Sensorial
Pictures, atmosphere, pH, BA, MO,
Sensorial
Pictures, atmosphere, pH, BA, MO,
Sensorial
Pictures, atmosphere, pH, BA, MO,
Sensorial MAP
2 2 2
AIR 2 2 2 2
22°C + 7°C Pictures,
atmosphere, pH, BA, MO,
Sensorial
Pictures,
atmosphere, pH, BA, MO,
Sensorial
Pictures,
atmosphere, pH, BA, MO,
Sensorial
MAP
2 2 2
AIR
2 2 2
22°C Pictures,
atmosphere, pH, BA, MO,
Sensorial
Pictures,
atmosphere, pH, BA, MO,
Sensorial
Pictures,
atmosphere, pH, BA, MO,
Sensorial
MAP
2 2 2
AIR
2 2 2
Total samples
2
12
12
12
3.1.1.2 Storage test marinated meats
The storage tests for the marinated chicken meat, lamb meat and beef had a different objective than
the previous ones: here, the goal was to study the differences between the different types of meat
concerning their biogenic amine profiles. The setup of the storage test (given in appendix 2) was
similar to the previous storage tests, although this time, the storage conditions were not varied.
Instead, one set of storage conditions, used in the previous storage tests, was chosen: MAP-
packaging (70/30 O2/CO2) and storage in the refrigerator at 7°C. These storage conditions were the
most representative of how it is advised to store fresh meat products. The samples were again stored
for 9 days (= TGT + 1 day) and analyses of biogenic amines and microbiology were carried out on days
0, 8 and 9. Free amino acids were only determined at day 0. Here, again, the sensorial features of the
products were assessed.
3.1.2 Screening tests
3.1.2.1 Objective
During the BIOGAMI-project, screening tests were performed in order to gain insight on the
concentration of several BA in products on the Belgian food market. These concentration data,
together with toxicological data on these BA, would then be used to assess the health risks
associated with BA for the Belgian population. The screenings started in October 2014 and ended in
April 2016. In total, a number of 476 products were screened over 6 different food groups in which
BA were expected to occur (due to microbial activity): fruit and vegetables (F&V), chocolate, beer,
meat and meat products, diary and fish and fish products. In each of these food groups certain
subgroups were defined (cfr. appendix 15).

22
3.1.2.2 Design
The design of a screening test is depicted in figure 12 and comprised 1) purchase of the products, 2)
analysis of biogenic amines, microbiology and FAA as quickly as possible, 3) storage until TGT + 1 day
or THT + 10% at 7°C in a refrigerator and 4) analysis of BA and microbiology at the end of the storage
period.
DAY 0 STORAGE (7°C) DAY X
Day of purchase or day after TGT + 1 day/ THT + 10% shelf life
FAA BA
BA MO
Figure 12: Design of a screening test, executed for the BIOGAMI-project.
The products to be analysed were purchased with the aim of comprising as much of the Belgian
market as possible, meaning that it was attempted to obtain products from all over Belgium and in
different types of shops. They were thus bought in supermarkets of all sorts as well as from small
producers and small facilities like groceries and butcheries. Each product was bought threefold, once
for day-0 analyses, one for end-of-storage analyses and one backup sample.
After purchase, the first analyses were executed as quickly as possible. At the start of the analyses,
the product was given a sample number, it was photographed and, next to the FAA and BA –
concentrations, gas concentrations of packed products were measured using a PDI-Dansensor and
pH-values were tested with Mettler Toledo pH-meter with an Inlab Solids electrode (details on these
apparatuses can be found in appendix 4).
Note also that for some products, only the analyses at day 0 were performed. This was done for
products for which no significant change in BA concentration was expected between the start and
the end of storage. As such, there were microbially stable products with a long shelf life (say: over 6
months), for instance raw dried hams, or fermented products like certain salami’s, cheeses and
sauerkraut. In these products it was expected that the major amount of biogenic amines were
already formed at purchase, by previous fermentation or ripening, and that as these products are
more or less microbially stable (meaning growth nor activity)(42), no further amine formation would
follow.
3.1.2.3 Focus of this thesis
Within the scope of this Master dissertation, several categories of meat products and preparations
were studied. According to EU-Directive 853/2004, meat products are defined as “processed
products resulting from the processing of meat or from the further processing of such processed
products, so that the cut surface shows that the product no longer has the characteristics of fresh
meat”. These products are ready-to-use products. In this category, hams and salami’s have been
analysed. On the other hand, meat preparations are defined as “meat that has foodstuffs,
seasonings or additives added to it or which has undergone a treatment that is insufficient to modify
the cellular structure of the meat and thus to cause the characteristics of the fresh meat to
disappear”, for example marinated pieces of pork and sausages. These kinds of products usually need
a cooking step at home. Moreover, the EU-definition of minced meat is “boned meat that has been
minced into fragments and contains less than 1 % salt”. Minced meat must have been prepared
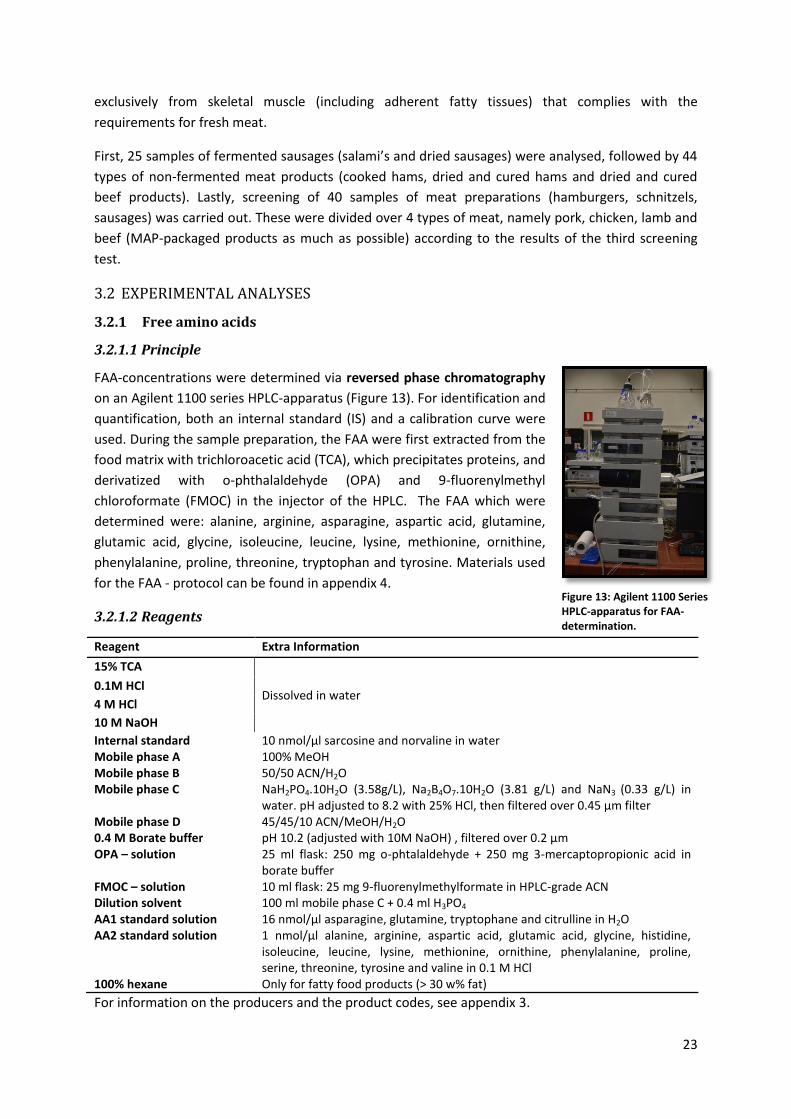
23
exclusively from skeletal muscle (including adherent fatty tissues) that complies with the
requirements for fresh meat.
First, 25 samples of fermented sausages (salami’s and dried sausages) were analysed, followed by 44
types of non-fermented meat products (cooked hams, dried and cured hams and dried and cured
beef products). Lastly, screening of 40 samples of meat preparations (hamburgers, schnitzels,
sausages) was carried out. These were divided over 4 types of meat, namely pork, chicken, lamb and
beef (MAP-packaged products as much as possible) according to the results of the third screening
test.
3.2 EXPERIMENTAL ANALYSES
3.2.1 Free amino acids
3.2.1.1 Principle
FAA-concentrations were determined via reversed phase chromatography
on an Agilent 1100 series HPLC-apparatus (Figure 13). For identification and
quantification, both an internal standard (IS) and a calibration curve were
used. During the sample preparation, the FAA were first extracted from the
food matrix with trichloroacetic acid (TCA), which precipitates proteins, and
derivatized with o-phthalaldehyde (OPA) and 9-fluorenylmethyl
chloroformate (FMOC) in the injector of the HPLC. The FAA which were
determined were: alanine, arginine, asparagine, aspartic acid, glutamine,
glutamic acid, glycine, isoleucine, leucine, lysine, methionine, ornithine,
phenylalanine, proline, threonine, tryptophan and tyrosine. Materials used
for the FAA - protocol can be found in appendix 4.
3.2.1.2 Reagents
Reagent Extra Information
15% TCA
Dissolved in water 0.1M HCl
4 M HCl
10 M NaOH
Internal standard 10 nmol/µl sarcosine and norvaline in water Mobile phase A 100% MeOH Mobile phase B 50/50 ACN/H2O Mobile phase C NaH2PO4.10H2O (3.58g/L), Na2B4O7.10H2O (3.81 g/L) and NaN3 (0.33 g/L) in
water. pH adjusted to 8.2 with 25% HCl, then filtered over 0.45 µm filter Mobile phase D 45/45/10 ACN/MeOH/H2O 0.4 M Borate buffer pH 10.2 (adjusted with 10M NaOH) , filtered over 0.2 µm OPA – solution 25 ml flask: 250 mg o-phtalaldehyde + 250 mg 3-mercaptopropionic acid in
borate buffer FMOC – solution 10 ml flask: 25 mg 9-fluorenylmethylformate in HPLC-grade ACN Dilution solvent 100 ml mobile phase C + 0.4 ml H3PO4 AA1 standard solution 16 nmol/µl asparagine, glutamine, tryptophane and citrulline in H2O AA2 standard solution 1 nmol/µl alanine, arginine, aspartic acid, glutamic acid, glycine, histidine,
isoleucine, leucine, lysine, methionine, ornithine, phenylalanine, proline, serine, threonine, tyrosine and valine in 0.1 M HCl
100% hexane Only for fatty food products (> 30 w% fat)
For information on the producers and the product codes, see appendix 3.
Figure 13: Agilent 1100 Series HPLC-apparatus for FAA-determination.

24
3.2.1.3 Protocol
The procedure for FAA-determination was as follows. First, 3.5 g (± 0.5g) of sample was added to a
50ml falcon flask. If the structure of the sample was not homogenous or easy to transfer, the whole
sample was first mixed using a commercial immersion blender. After weighing, 30 ml of 15% TCA was
added, the sample was further homogenized using an Ultra Turrax and left to extract for at least 10
minutes. Next, the pH of the sample was adjusted to 2.2 with 10M NaOH and/or 4M HCl and filtered
over a nitrogen-free paper filter into a 15 ml falcon tube. To avoid deterioration of the FAA, the
extracts were kept at 4°C in the dark as much as possible between the analysis steps.
Note: when analyzing fatty food products (>30 w% fat), like cheese, fermented sausage and cured
hams, an extra step needed to be implemented. Because the apolar fats react with the C18-column,
giving rise to erroneous chromatograms (split peaks etc.), fats were extracted by addition of 10 ml
hexane just after pH-adjustment. Vigorous shaking allowed maximal extraction and centrifugation at
8000 g for 3 minutes was used to separate the hexane and TCA-layers. The upper layer (hexane)
would then be pipetted and discarded. This procedure was repeated once again, before continuing
with the normal protocol.
After paper filtration, the samples were filtered again over an HPLC filter (0.45 µm) in order to
remove small particles which could cause clogging of the HPLC-system. After that, the pH of the
extracts was controlled using pH-strips (aim: between 2 and 4) and an HPLC-vial was prepared with
950 µl of filtrate and 50 µl of IS. Per sample, a second vial with pure HPLC-water was prepared for
rinsing. Also, 7 vials containing a standard series of AA were prepared. Finally, 5 more vials were
prepared: one containing borate buffer, one with OPA, one with FMOC, one with 100% acetonitrile
(ACN) (rinsing) and one containing a dilution liquid for injection. The vials were placed on a tray in the
HPLC-machine.
For the internal standard, a stock solution of norvaline and sarcosine in water, both at 10 nmol/µl,
was used. The standard series was prepared using a standard solution AA1, which contained the
basic amino acids at 16 nmol/µl dissolved in water, and a standard solution AA2 containing the acidic
and neutral amino acids at 1 nmol/µl in 0.1M HCl. Table 4 shows how, starting from these stock
solutions, a standard series ranging from 0 to 800 pmol/l was made.
Table 4: Overview of how to prepare the standard series.
Dilutions for calibration curve of amino acids
AA1 dilutions
Conc. (pmol/l) 800 400 200 80 40 20 0 Volume H20 (µl) 200 300 180 190 390 Volume AA1 (µl) 50 200 100 20 10 10 Total Volume (µl) 50 400 400 200 200 400
=>Take 50 µl of these solutions to make the calibration curve
Calibration curve
Conc. (pmol/l) 800 400 200 80 40 20 0 Diluted AA1 (µl) 50 50 50 50 50 50 IS (µl) 50 50 50 50 50 50 50 AA2 (µl) 800 400 200 80 40 20 0.1 M Hcl (µl) 100 500 700 820 860 880 950
Total Volume (µl) 1000 1000 1000 1000 1000 1000 1000

25
Derivatization with OPA (primary AA) and FMOC (secondary AA) was carried out automatically in the
injector of the HPLC. The FAA were separated on a Zorbax Eclipse Plus C18 column (P/N 959963-902)
from Agilent Technologies. Also, a pre-column (P/N 820950-936) was used to protect the column
against impurities. For optimal separation, a gradient program was performed, which made use of 4
mobile phases. Mobile Phase A and B were used for rinsing. Mobile phase C (polar) and mobile Phase
D (apolar) were used to create the gradient by changing their ratio (Figure 14). De derivatized FAA-
compounds were detected using a fluorescence detector. Other conditions used were a column
temperature of 40°C, a flow rate of 1.5 ml/min and a ratio of mobile phases C/D of 95/5 at the start.
Figure 14: Illustration of the gradient program for the separation of FAA. Solvent A: mobile phase A; Solvent B: Mobile Phase B; Solvent C: mobile phase C; Solvent D: mobile phase D.
3.2.1.4 Calculation of FAA-concentration
After receiving the chromatogram, the original FAA-concentrations were calculated out of the peak
areas using a standard curve. The first step in these calculations was to express the retention times
and areas of each peak in relation to those of sarcosine (for proline quantification) and norvaline (for
all other FAA). Using the relative retention times, the peaks could be identified and the
corresponding relative areas were then converted to relative concentrations by use of the slope and
intercept of the standard curve (vide supra). Lastly, the following formula was used to perform the
final step, converting the relative FAA-concentration to the original concentration in the sample
(mg/kg).
CRel = CAZ/CIS; CIS = internal standard concentration in the HPLC-vial (mg/ml); CAZ = AA-concentration in the HPLC-vial
(mg/ml); MMAZ = molar mass of the AA (g/mol); Vextract = volume of the extract (ml); msample = weighed amount of sample
(kg)
3.2.2 Biogenic amines
3.2.2.1 Principle
Determination of BA-concentrations was again performed via reversed phase chromatography, this
time using UHPLC and detection via a diode array detector (DAD). Just like the FAA, the BA were
extracted from the food product using 15% TCA. In order to compensate for losses during sample
preparation, an internal standard (1,7-diaminoheptane) was added and dansyl chloride was used as a
derivatising agent. The BA of which the concentration was determined were: cadaverine, histamine,
β-phenylethylamine, putrescine, tyramine and tryptamine.

26
3.2.2.2 Reagents
Reagent Extra information
15% TCA 100% Acetone Dichloromethane 99.9% pure Internal standard 2 mg/ml 1,7-diaminoheptane in 15% TCA Na2CO3 (saturated solution) pH adjusted to 11,2 before use Dansyl chloride solution 5 mg/ml in acetone ACN/water 65/35 (HPLC grade)
For information on the producers and the product codes, see appendix 3.
3.2.2.3 Protocol
The extraction procedure for BA is similar to that for FAA, yet still slightly different. Weighing was
carried out similarly. After weighing, 60 µl of IS was added, before adding 30ml TCA and mixing with
the Ultra Turrax. After 10 minutes of extraction, the extract was again filtered. In this procedure, it
was equally important to keep samples, extracts and filtrates in the dark and at 4°C as much as
possible.
Derivatisation was then performed in glass test tubes with screw caps. In these tubes, 1 ml of filtrate
was added, together with 0.75 ml of saturated NaCO3-solution. Next, 1 ml of dansyl chloride solution
was added, the test tubes were vortexed and immediately placed in a hot water bath of 40°C for 1.5
hours. During this time, the test tubes needed to be shaken vigorously every 10 minutes, in order for
the dansyl chloride to come into contact with the biogenic amines. The rack in which the test tubes
were placed was wrapped in aluminum foil because the derivatized compounds are sensitive to light
(42).
After derivatization, extraction of the BA followed immediately. This was performed by adding 2 ml
dichloromethane (DCM), vortexing, letting the phases set and pipetting both phases in two other test
tubes. This procedure was repeated another two times, each time working with the watery phase
from the previous step. When separation did not happen fast enough (within 10 minutes) or was
incomplete because of formation of an emulsion, an alternative approach was used, in which 3 ml
DCM was added and emulsion was centrifuged at 8000g (in plastic falcons) for 3 minutes. This was
then only performed twice. After extraction, the organic phase (DCM) was dried under N2, after
which the tubes could be stored in the freezer (-20°C).
The dried residue was subsequently dissolved by adding 1 ml 65/35 ACN/H20 to the test tubes.
Vortexing and the use of an ultrasonic water bath made sure everything was dissolved. The samples
were then filtered through 0.45 µm HPLC-filters and added to HPLC-vials. These vials were placed in
the UHPLC-apparatus (Figure15) for BA-analysis.

27
Figure 15: UHPLC-apparatus: Dionex Ultimate 3000.
The UPLC apparatus consists of several units: 1) a pump, which is able to mix up to 4 different
solutions, 2) a sampler, 3) the column unit and 4) the detector. The UHPLC – column used in this
protocol was an Acclaim RSLC 120 C18 column (particle diameter of 2.2 µm, column diameter 2.1
mm and column length 150 mm) at a temperature of 40°C. During each sample run, the gradient
pump provided for a flow of 0.5 ml/min and a gradient in ACN/H2O (Figure16). Finally, the BA-
derivatives were detected with the DAD measuring at a wavelength of 225 nm.
Figure 16: Gradient in mobile phases during UPLC-analysis.
3.2.2.4 Determination of BA-concentration
The chromatograms, resulting from the UPLC-procedure, were used to calculate the original BA-
concentrations in the food samples. First, the peaks were identified using retention times, relative to
the internal standard. Next, relative areas were calculated and used to determine the original BA-
concentrations in the food product. In this calculation, corrections for the concentration of IS (CIS),
the volume of the sample (Vsample), the amount of sample weighed (msample) were required and
executed using the following formula.

28
Rel Conc: CBA in standard/CIS in standard; a = slope of calibration curve; b = intercept of the calibration curve; Vextract =
volume of the extract (ml); msample = weighed amount of sample (kg).
Correct quantification of BA in food products also required correcting for the effect of the food
matrix. The food matrix consists out of every component of the food product that is not a BA and
may give rise to higher or lower amounts of detected BA than are actually present. This means that
the ratio of the amount of BA detected and the true amount (i.e. the recovery value), does not equal
100%. Correction was carried out by dividing the calculated BA-concentrations by these recovery
values, which were already determined before the start of this master dissertation and are presented
in appendix 5, table 42. The calibration curves (one per BA) used in these calculations were already
determined as well and are presented in appendix 5 tables 43, together with the LOD and LOQ
values, calculated out of the slope and intercept of these calibration curves.
One last note here is that when excessive BA-concentrations were present in a food product, the
corresponding peak could be much higher than the IS-peak, making correct quantification impossible.
In this case, the extract was diluted and reanalysed and the dilution was included in the calculations
by supplementary dividing the BA-concentrations by the dilution factor.
3.2.3 Microbiology
3.2.3.1 Principle
Microbial analyses were carried out in order to be able to link the presence of BA with that of MO in
a food product or in other words, to establish a view on the possible BA-forming bacteria. Therefore,
the contamination by several groups of MO (total count, LAB, Enterobacteriaceae, Enterococci,
Pseudomonas, Clostridia and Staphylococci) was determined by means of plating on their
corresponding media. After incubation, colony forming units (CFU) were counted and the original
MO-concentration of the products was calculated. Also, for food products which demonstrated high
counts of BA (> 100 mg/kg), the MO of certain plates were further characterized, but these analyses
fell out of the scope of this thesis. Materials used during the microbial analyses can be found in
appendix 6.
3.2.3.2 Plating
Table 5 shows an overview of the types of media used during microbial analysis of the samples.
However, not every bacterial group was determined for every type of sample. Clostridia, for instance,
were only determined in fish and fishery products and Staphylococci only in meat-based products.
Total bacterial count, LAB, Enterobacteriaceae and Enterococci were plated for every sample. The
VRBG-medium also measured Enterobacteriaceae, but was phased out during the course of the
screening tests, due to a limited added value of the data it yielded. Finally, Pseudomonas counts
were only determined for non-fermented products, as in fermented products, Pseudomonas was
expected to be overgrown by the fermenting flora.
Plating was carried out in a sterile environment, i.e. within a range of 15 cm from a Bunsen flame.
Firstly, from the refrigerated sample, 25.0 ± 0.5 g was weighed out in a stomacher bag. This sample
was then diluted 10 times with PPS and homogenized in the stomacher for 1 minute. Then, out of
this first dilution, a dilution series was prepared by each time transferring 1 ml of a dilution in a test
tube containing 9 ml PPS. Subsequently, several of these dilutions (3 for each sample) were plated
out. Which dilutions were plated differed between food groups and between media and was initially
determined by experience and scientific literature on how many CFU would be present on a certain

29
sample after a certain time. The goal of this method was to end up with at least one countable plate
for each sample, which means 15 – 150 CFU/plate for streak plates and 30-300 CFU/plate for pouring
plates. Streak plates were made by transferring 0.1 ml of the desired dilution onto a prepared streak
plate. For pour plates, 1 ml of a dilution was added in an empty plate, after which it was covered with
the desired medium. Some media (MRS and RE) also required a second layer of medium, in order to
create a microaerophilic environment for the MO below.
During plating, pouring media were kept at 48°C in a hot water bath. After plating the streak plates
were left to dry and the pour plates were allowed to cool down and jellify for a few minutes. Then
the plates were incubated at the appropriate temperatures for a specific amount of days. Table 5
indicates clearly which media were used, how to prepare and incubate them and how to count the
bacterial colonies after incubation.
Table 5: Media used during microbial analysis of food samples. PCA = pate count agar; MRS = de Mann Rogosa and Sharpeagar; RE = Rapid Enterobacteriaceae; MSA = Mannitol Salt Agar; SB = Slanetz and Bartley agar; KAA = Kanamycin Esculin Azide agar; PA = Pseudomonas agar; RCA = Reinforced Clostridial agar, VRBG = Violet Red Bile Glucose agar)
Medium MO Type of plate Code Incubation Colonies
PCA Total aërobic count Pour OM13 22°C, 4-5d Count everything MRS Lactic acid bacteria Pour + cover OM4 + 0,9 ml/L
12M HCl 22°C, 4-5d Count everything
RE** Enterobacteriaceae Pour + cover OM68 37°C, 18-24h
Purple –pink colonies
VRBG * Enterobacteriaceae Pour + cover 37°C, 18-24h
Purple –pink colonies
MSA***** Staphylococci Streak OM41 37°C, 24+24h
Coag +: lichtgele zone, coag-: red/purple zone
SB** Enterococci Streak / 37°C, 4h; 44°C, 44h
Pink, dark red or bordeaux with whitish edge
KAA Enterococci Streak (bev.) + sup KAA before autoclaving
37°C, 48h Black colonies, black halo
PA*** Pseudomonas Streak + 5 mL glycerol, OM52 + OS4
30°C, 48h Everything (Often blue-green or brown pigmentation)
RCA**** Clostridia Pour + cover 22°C, 4-5d, anaerobic
Count everything
*: Cook without autoclaving; day of usage
**: Cook without autoclaving
***: Add supplement after autoclaving
****: Only fish samples *****: Only meat samples
After incubation, the countable plates were counted for each sample and the original concentration
of bacteria per gram of sample was calculated using the following formula:
If growth was detected on SB plates, colonies were picked from these plates and inoculated on KAA
plates for confirmation of their nature (Enterococci should result in a black halo). Only if a colony was
positive on both the SB and the KAA-plate, their growth was registered.

30
3.3 STATISTICAL ANALYSES
3.3.1 Objectives
When the screening tests were finished, statistical analyses were performed on the collected data in
order to answer all research questions mentioned in the introduction section. The central point of
these analyses were the BA-concentrations detected in each screened food product, which were
combined with the FAA-concentrations on day 0 (A-values) and the microbial counts at the expiry
date (B-values).
The questions to be answered during the statistical analysis were:
PART 1
1) Is there a significant difference in BA-concentrations between fermented and non-
fermented foodstuffs
a. … at day 0?
b. … at the expiry date?
c. … in the evolution between day 0 and the expiry date?
2) Is there a significant difference in BA-concentrations between animal products and products
of plant origin
a. …at day 0?
b. … at the expiry date?
c. … in the evolution between day 0 and the expiry date?
3) Is there a significant difference in BA-concentrations between fermented and non-
fermented foods within animal products and products of plant origin
a. …at day 0?
b. … at the expiry date?
c. … in the evolution between day 0 and the expiry date?
PART 2
4) For each of the six BA, is there a significant difference in concentration between the
different major food groups (F&V, chocolate, beer, dairy and meat products)?
PART 3
5) Is there a correlation between the FAA-concentrations at day 0 and
a. the BA-concentrations at the expiry date?
b. the evolution in BA-concentration?
6) Is there a correlation between the microbial counts and
a. the BA-concentrations detected at the expiry date?
b. the evolution in BA-concentration?
3.3.2 Preparation of the database
In the end, screening tests resulted in a database containing all collected information on 476 food
products: their BA- and FAA-concentrations, their microbial contamination, their pH, the atmosphere
in the packages and additional information (producer, product name, etc.). In preparation of the
statistical analysis, this raw database was condensed into a single datasheet containing all
information relevant for answering the questions above. The datasheet contained for each food
product its concentration of 6 BA (cfr. 3.2.2) and 7 FAA (cfr. 3.2.1) and the microbial counts
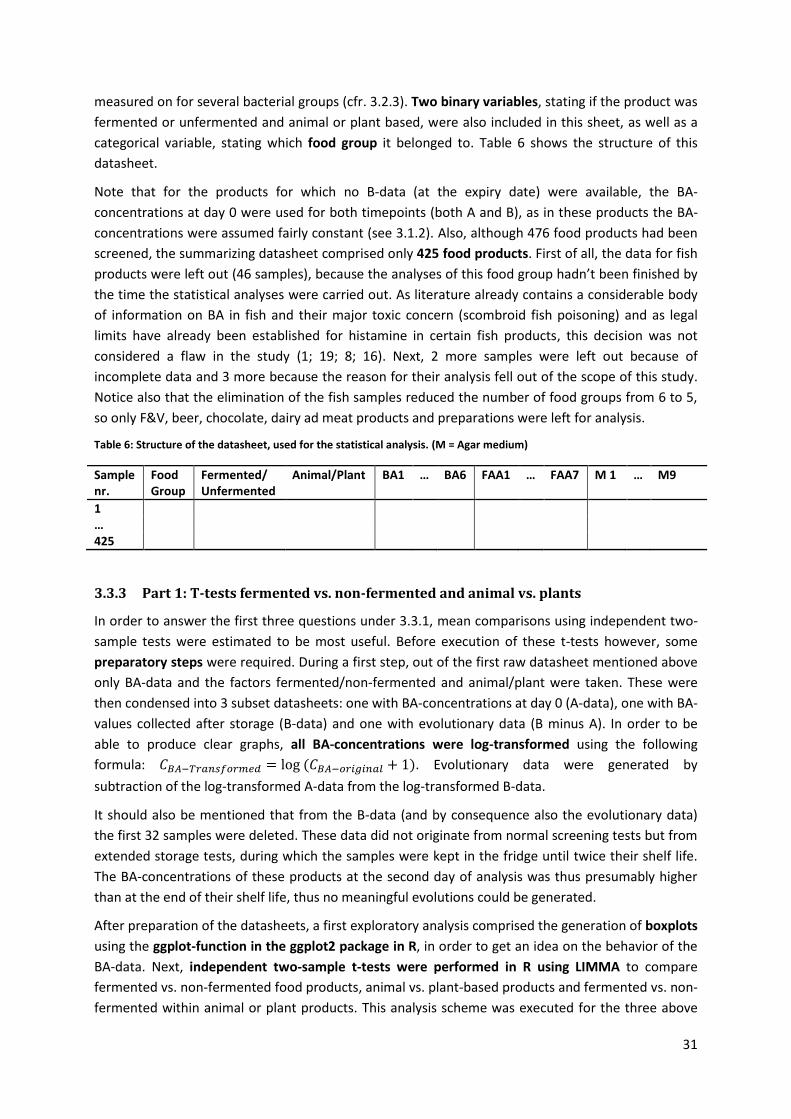
31
measured on for several bacterial groups (cfr. 3.2.3). Two binary variables, stating if the product was
fermented or unfermented and animal or plant based, were also included in this sheet, as well as a
categorical variable, stating which food group it belonged to. Table 6 shows the structure of this
datasheet.
Note that for the products for which no B-data (at the expiry date) were available, the BA-
concentrations at day 0 were used for both timepoints (both A and B), as in these products the BA-
concentrations were assumed fairly constant (see 3.1.2). Also, although 476 food products had been
screened, the summarizing datasheet comprised only 425 food products. First of all, the data for fish
products were left out (46 samples), because the analyses of this food group hadn’t been finished by
the time the statistical analyses were carried out. As literature already contains a considerable body
of information on BA in fish and their major toxic concern (scombroid fish poisoning) and as legal
limits have already been established for histamine in certain fish products, this decision was not
considered a flaw in the study (1; 19; 8; 16). Next, 2 more samples were left out because of
incomplete data and 3 more because the reason for their analysis fell out of the scope of this study.
Notice also that the elimination of the fish samples reduced the number of food groups from 6 to 5,
so only F&V, beer, chocolate, dairy ad meat products and preparations were left for analysis.
Table 6: Structure of the datasheet, used for the statistical analysis. (M = Agar medium)
Sample nr.
Food Group
Fermented/ Unfermented
Animal/Plant BA1 … BA6 FAA1 … FAA7 M 1 … M9
1 … 425
3.3.3 Part 1: T-tests fermented vs. non-fermented and animal vs. plants
In order to answer the first three questions under 3.3.1, mean comparisons using independent two-
sample tests were estimated to be most useful. Before execution of these t-tests however, some
preparatory steps were required. During a first step, out of the first raw datasheet mentioned above
only BA-data and the factors fermented/non-fermented and animal/plant were taken. These were
then condensed into 3 subset datasheets: one with BA-concentrations at day 0 (A-data), one with BA-
values collected after storage (B-data) and one with evolutionary data (B minus A). In order to be
able to produce clear graphs, all BA-concentrations were log-transformed using the following
formula: . Evolutionary data were generated by
subtraction of the log-transformed A-data from the log-transformed B-data.
It should also be mentioned that from the B-data (and by consequence also the evolutionary data)
the first 32 samples were deleted. These data did not originate from normal screening tests but from
extended storage tests, during which the samples were kept in the fridge until twice their shelf life.
The BA-concentrations of these products at the second day of analysis was thus presumably higher
than at the end of their shelf life, thus no meaningful evolutions could be generated.
After preparation of the datasheets, a first exploratory analysis comprised the generation of boxplots
using the ggplot-function in the ggplot2 package in R, in order to get an idea on the behavior of the
BA-data. Next, independent two-sample t-tests were performed in R using LIMMA to compare
fermented vs. non-fermented food products, animal vs. plant-based products and fermented vs. non-
fermented within animal or plant products. This analysis scheme was executed for the three above

32
mentioned subsets. Considering that erasing the first 32 samples from the B- and evolutionary data
meant removing all non-fermented plant-based food products, the comparison of fermented vs. non-
fermented foods within plants could not be executed for the B- and evolutionary data. As such,
instead of 12 t-tests, only 10 were performed. The influence of multiplicity on the p-values was
adjusted for using the Benjamini-Hochberg FDR procedure.
3.3.4 Part 2: ANOVA-tests for difference between food groups
For the comparison of the means of the BA-concentrations between all five food groups (question 4),
the aim was to use ANOVA-tests in SPSS, with a Bonferroni-correction for multiple comparison.
Homogeneity of variances was tested within the groups as well (using the Levene's test) and in case
of non-homogeneity, Welch F-tests and Games-Howell post hoc tests were used to replace ANOVA
and Bonferroni-tests respectively. This scheme was applied to the same three subsets mentioned in
part 1.
Next to these mean comparisons, graphs were produced in excel to function as a background during
the discussion. In these graphs, the mean BA-concentrations and the standard deviations in each
food group are presented.
3.3.5 Part 3: Correlation analysis
In order to determine the correlations mentioned in questions 6 and 7 under 3.3.1, redundancy
analysis and multiple regression were chosen as suitable techniques based on an article from
Desdevises et al (2011). Redundancy analysis is a direct gradient analysis (canonical ordination) which
allows to determine which proportion of the variance in the response variables (here the BA-
concentrations) can be explained by the variance in a set of explanatory variables (the FAA-
concentrations, the microbial data and the factors fermented/non-fermented and animal/plant). In
short it consists out of a series of multiple linear regressions carried out for the different response
variables, followed by a principle component analysis (43). The results of this type of analysis can be
presented in either a bi- or a triplot, based either on (Euclidean) distances between objects or on
correlations. In the current analyses, correlation-based triplots (displaying both response and
explanatory variables) were generated, which were then used for the qualitative description of the
correlations between BA, FAA and microbial data (44).
After the execution of the RDA, a multiple linear regression analysis (MLR) combined with an ANOVA-
test for significance provided for a more quantitative approach to the sought correlations. This
combination of analyses would select for each BA a set of explanatory variables significantly
contributing to its variance and thus correlating with it. The selection of variables was based on the
Akaike’s Information criterion (AIC).
The correlation tests were again performed in R. RDA was performed using the 'rda'-function in the
'vegan' library and MLR and ANOVA were executed using the 'lm'- function. Correlations between
BA-concentrations and FAA (question 6) were determined separately from those with microbial data
(question 7). Also, correlations were only determined for B- and evolutionary data, because the aim
was to study the development of BA during storage. As such, correlations between FAA and A-data
(BA-concentrations at day 0) would be meaningless, since they were both measured on the same
day. Likewise, determining the correlation of A-data with microbial data at the end of storage would
be meaningless, since microbial growth an BA-formation are still happening during storage. In
microbially stable products, like beer or chocolate for instance, these correlations could be

33
meaningful, as the majority of BA-formation has happened before purchase in these products, but as
stated before, no analysis after storage were performed on these products, making correlation
analysis impossible by lack of microbial data.
In preparation for the correlation analysis, again, new datasheets were prepared starting from the
raw datasheet mentioned under 3.3.2. For the correlation analyses with FAA, two sheets were
arranged: one containing (log-transformed) B-data and on containing (log-transformed) BA-
evolutions. In these sheets, all samples for which only day-0 analyses were performed were
removed, as analysis of B- or evolutionary data would not be possible. Further removal of samples
with missing FAA-concentrations lead to datasheets containing BA-data and FAA-data on 335
samples. For the microbial correlations, data-observation lead to the conclusion that 6 separate
sheets would be required, because of the use of different media for different types of products. As
such, both the sheets for the B-data and the evolutionary data were separated into a sheet for F&V,
one for dairy products and one for meat. Should the data not have been separated, then on several
media the microbial counts would have contained too many missing values, making valid and
efficient analysis impossible. After preparation of these six sheets, further cleaning comprised
removing data on media that contained too many missing values (more than 1/3 of the counts in the
particular subgroup) and subsequently removing some samples which contained missing values on
singular agar media. As such, the resulting design of these 6 datasheets is depicted in table 7.
Note also that in each of the above mentioned sheets, FAA and BA-concentrations were again log-
transformed in a similar manner as was done under 3.3.3.
Table 7: Description of the 6 datasheet (after cleaning) that were created to investigate the correlations between BA-concentrations and microbial counts. In the datasheets, log-transformed BA-concentrations were used.
Type of BA-data Subclass N (after cleaning) PCA MRS SB RE MSA PA
At expiry date (B-data) F&V 81 X X X X Dairy 81 X X X X Meat 102 X X X X Evolutionary data (B – A) F&V 81 X X X X Dairy 81 X X X X Meat 102 X X X X

34
4. RESULTS AND DISCUSSION
4.1 INTRODUCTION
During the discussion of the BA-concentrations detected in several products, some toxicological
judgments will be formulated, defining which values form a potential health risk and which do not.
As overall insufficient quantitative data is available on the toxicity of all but histamine and tyramine,
this toxicological discussion will mainly focus on these 2 BA, making use of the toxic intake values
mentioned in the literature study (table 8). Note that in the articles where these toxicological data
were found, no designation was made to the weight of the person to which these values are
applicable. As such, these values should be handled with scrutiny and only for a rough toxicological
assessment. It can be concluded that more accurate toxicological judgment of BA-concentrations in
the future will require renewed investigation of the dose-response relationships of these
compounds. For the following discussion, it was assumed that these toxicological cut-offs apply to
healthy adults (no longer growing individuals) with a healthy BMI (20-25).
Table 8: Guideline for toxicological interpretation of BA-concentrations: Toxic effect at certain intakes for Histamine and Tyramine and their corresponding concentrations in several portion sizes of food products. (Toxicological data: Histamine: Parente et al. 2001 and tyramine: EFSA 2011)
Histamine
Intake per meal (mg) Toxic effect Concentration in food product (mg/kg)
At consumption of 100g At consumption of 200g
Normal person
8 - 40 Light 80-400 40 – 200 40 - 100 Moderate 400-1000 200 - 500 >100 Severe >1000 >500
Sensitive person
NOAEL below LOD Any concentration Any concentration
Tyramine
NOAEL per meal (mg)
Concentration in food product (mg/kg)
At consumption of 50g At consumption of 100g At consumption of 200g
600 mg (healthy subject) 12000 6000 3000 50 mg (third gen. MAOI-
drugs 1000 500 250
6 mg (classical MOAI-drugs
120 60 30
In order to link the detected BA-concentrations with the intake levels in table 8, portion sizes were
required as well. Therefore, the following table shows which portions were considered during the
discussion of several types of food. These values were derived from international healthy eating
guidelines (the Belgian food pyramid) and from portion sizes mentioned on the food packaging. Note
that true portion sizes might and probably will differ from these recommended portions, leading to
different intake levels. These serving sizes were considered good guidelines nevertheless.

35
Table 9: Portion sizes for different types of food, as advised by health organizations or as designated on the packages.
Portion sizes
Fruit 1 piece (> 2 pieces a day)**** Olives 25 g **/ 30 g *** Vegetables 200 g (lunch or dinner)/ 300g a day**** Sauerkraut 200 g ** Chocolate 20-30 g ** / *** Beer 1 bottle (25 -33 cl) Meat 50-75 g */ 100g **** Salami/dried sausage 25 g ** Cooked/ dried cured ham 15 -30 g ** Fish 100 g * Yoghurt 125g */** Cheese 25-50g * *http://www.heart.org/HEARTORG/Caregiver/Replenish/WhatisaServing/What-is-a Serving_UCM_301838_Article.jsp#.VvgR_fmLSM8 **Delhaize direct: http://shop.delhaize.be/nl-be?cmpid=SEA_DD_Brand_NA_Text_Bel_Nl_NA_NA_HP_BrandPur_NA ***Collect and gohttps://www.collectandgo.be/cogostatic/static/nl/index.html ****Active food triangle: http://www.vigez.be/projecten/actieve-voedingsdriehoek
In the discussion of the results, an attempt was also made to link the microbial profile with the BA-
concentrations. Therefore, knowledge was required on which MO are associated with the formation
of which BA in each food product and if these MO were the most prominent bacteria in the product.
The following figure functioned as a guide for these discussions.
Figure 17: Overview of which microorganisms can be responsible for which BA (1; 8; 47) .
4.2 POTENTIAL FOR BA-FORMATION IN TUNA AND MARINATED PORK
Below the results of the storage tests for tuna and marinated pork will be discussed. These tests
were conducted in order to gain an overall insight on the BA-profiles in the meat versus fish and at
different storage conditions. The BA-profiles will be compared to the FAA-profiles and the
microbiological counts to see if any coherent patterns can be found.
Histamine
•GR+ and GR-
•Enterobacteriaceae (Hafnia, Morganella, klebsiella) and photobacterium (vibrionales) in fish
•LAB in fermented foods
Tyramine
•GR+
•Enterococci
•LAB
•Staphylococci
β-Phenylethylamine
•Mostly linked to tyramine-producing bacteria
•Enterococci
•LAB
•Staphylococci
Tryptamine
•Enterococci (Ansorena 2002)
•LAB (Streptococci, Lactococci, Leuconostoc)
•Staphylococci (Ansorena 2002)
Putrescine & Cadaverine
•GR- bacteria
•Enterobacteriaceae
•Pseudomonas
•Shewanella
•LAB
•Staphylococci

36
4.2.1 Storage test tuna
4.2.1.1 Biogenic amines in tuna
The results of the BA-analyses for the storage test on tuna can be found in table 10. From these
results, it’s immediately clear that tryptamine and β-phenylethylamine were not important BA in
tuna. On the contrary, the most important BA in tuna were clearly histamine and cadaverine. It is
also clear that the detected BA-levels were increasingly higher as storage was longer, no matter what
storage condition was applied. The velocity of BA-formation, however, was influenced by the storage
condition. As such, storage at 22°C was by far the most harmful condition to store tuna, giving rise to
excessive histamine concentrations at the end of storage, which were exceeding the reported
toxicological values (see table 8). Moreover, at 22°C, severely toxic levels of histamine were already
formed before the expiry date (already at day 3), making the product unfit for consumption. On the
other hand, refrigeration at 7°C proves to be an effective method to limit BA-production. These
samples only resulted in a maximum of 13 mg/kg of any BA, even at day 6. Properly refrigerated
samples can thus be considered to give rise to low risks of poisoning. Also, 3 hours of storage at 22°C
before refrigeration did not seem to have a big influence on the BA-concentration. Lastly, looking at
these data, it can be concluded that packaging under MAP-conditions does seems to diminish BA-
formation as well. This effect is the clearest for the data of the samples stored at 22°C. Both the
protective effect of MAP-packaging and refrigeration agree with previous findings described in
literature (1; 8; 27; 10).
Table 10: BA-concentrations (mg/kg) on tuna during 6-day storage test. Different storage conditions and packaging techniques were applied. For each storage condition on every day 2 samples were analysed.
Condition Tryptamine β-Phenylethylamine Putrescine Cadaverine Histamine Tyramine
DAY 0
<LOQ <LOD <LOD <LOD <LOD <LOQ
<LOD <LOD <LOD 1 <LOQ <LOQ
DAY 3
7°C – MAP <LOD <LOD <LOD <LOQ <LOD <LOQ
<LOD <LOD <LOD <LOD <LOQ <LOD
22°C – MAP <LOD <LOD <LOQ 17 445 5
<LOD <LOD 2 70 32 <LOQ
3h 22°C + 7°C - MAP <LOD <LOD <LOD <LOD <LOQ <LOD
<LOD <LOD <LOD <LOD <LOQ <LOD
7°C – Air <LOD <LOD <LOD <LOD <LOQ <LOD
<LOD <LOD <LOD <LOD <LOD <LOD
22°C – Air <LOD <LOD 10 96 899 8
<LOD <LOD 9 92 564 5
3h 22°C + 7°C - Air <LOD <LOD <LOD <LOD <LOQ <LOD
<LOD <LOD <LOD <LOD <LOD <LOD
DAY 5
7°C – MAP <LOD <LOD <LOD 2 <LOD <LOQ
<LOD <LOD <LOD 2 <LOQ 2
22°C – MAP <LOD <LOD 2 9 122 4
<LOD <LOD 2 7 170 6
3h 22°C + 7°C - MAP <LOD <LOD <LOD <LOD <LOQ <LOQ
<LOD <LOD <LOD <LOD <LOQ 3
7°C – Air <LOD <LOD <LOQ <LOD <LOQ <LOQ
<LOD <LOD <LOD 1 3 <LOQ
22°C – Air <LOD <LOQ 27 186 2233 <LOQ
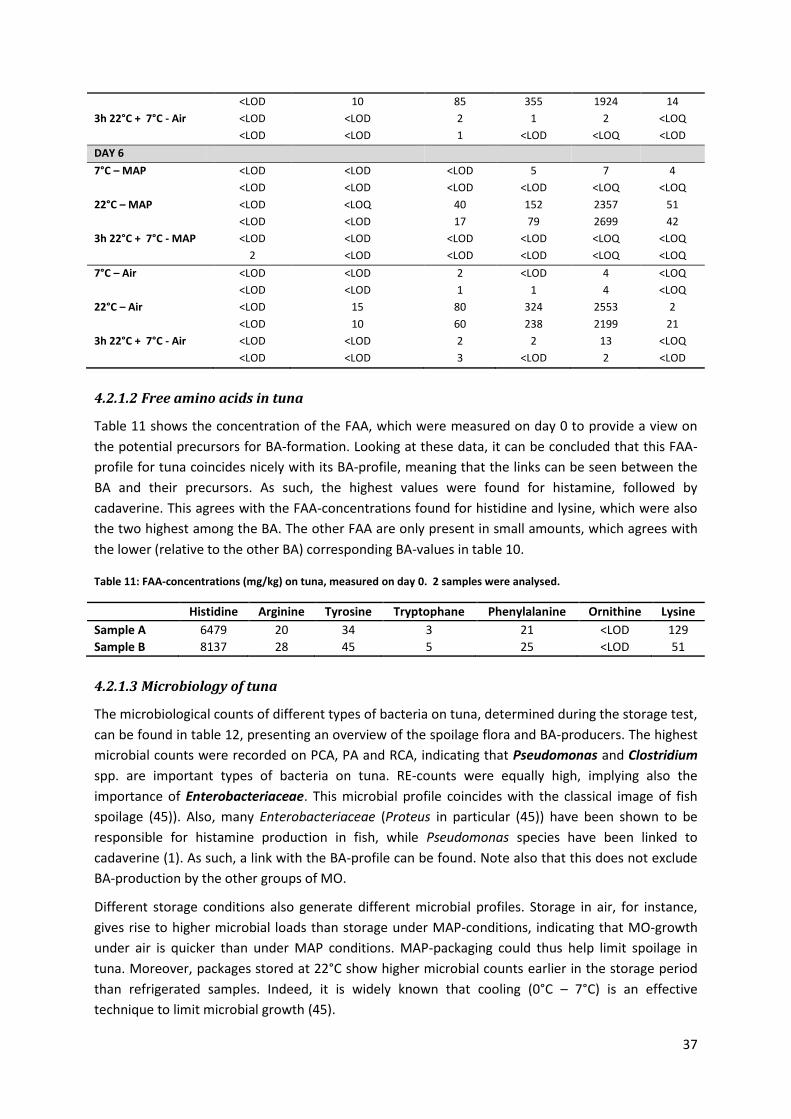
37
<LOD 10 85 355 1924 14
3h 22°C + 7°C - Air <LOD <LOD 2 1 2 <LOQ
<LOD <LOD 1 <LOD <LOQ <LOD
DAY 6
7°C – MAP <LOD <LOD <LOD 5 7 4
<LOD <LOD <LOD <LOD <LOQ <LOQ
22°C – MAP <LOD <LOQ 40 152 2357 51
<LOD <LOD 17 79 2699 42
3h 22°C + 7°C - MAP <LOD <LOD <LOD <LOD <LOQ <LOQ
2 <LOD <LOD <LOD <LOQ <LOQ
7°C – Air <LOD <LOD 2 <LOD 4 <LOQ
<LOD <LOD 1 1 4 <LOQ
22°C – Air <LOD 15 80 324 2553 2
<LOD 10 60 238 2199 21
3h 22°C + 7°C - Air <LOD <LOD 2 2 13 <LOQ
<LOD <LOD 3 <LOD 2 <LOD
4.2.1.2 Free amino acids in tuna
Table 11 shows the concentration of the FAA, which were measured on day 0 to provide a view on
the potential precursors for BA-formation. Looking at these data, it can be concluded that this FAA-
profile for tuna coincides nicely with its BA-profile, meaning that the links can be seen between the
BA and their precursors. As such, the highest values were found for histamine, followed by
cadaverine. This agrees with the FAA-concentrations found for histidine and lysine, which were also
the two highest among the BA. The other FAA are only present in small amounts, which agrees with
the lower (relative to the other BA) corresponding BA-values in table 10.
Table 11: FAA-concentrations (mg/kg) on tuna, measured on day 0. 2 samples were analysed.
Histidine Arginine Tyrosine Tryptophane Phenylalanine Ornithine Lysine
Sample A 6479 20 34 3 21 <LOD 129
Sample B 8137 28 45 5 25 <LOD 51
4.2.1.3 Microbiology of tuna
The microbiological counts of different types of bacteria on tuna, determined during the storage test,
can be found in table 12, presenting an overview of the spoilage flora and BA-producers. The highest
microbial counts were recorded on PCA, PA and RCA, indicating that Pseudomonas and Clostridium
spp. are important types of bacteria on tuna. RE-counts were equally high, implying also the
importance of Enterobacteriaceae. This microbial profile coincides with the classical image of fish
spoilage (45)). Also, many Enterobacteriaceae (Proteus in particular (45)) have been shown to be
responsible for histamine production in fish, while Pseudomonas species have been linked to
cadaverine (1). As such, a link with the BA-profile can be found. Note also that this does not exclude
BA-production by the other groups of MO.
Different storage conditions also generate different microbial profiles. Storage in air, for instance,
gives rise to higher microbial loads than storage under MAP-conditions, indicating that MO-growth
under air is quicker than under MAP conditions. MAP-packaging could thus help limit spoilage in
tuna. Moreover, packages stored at 22°C show higher microbial counts earlier in the storage period
than refrigerated samples. Indeed, it is widely known that cooling (0°C – 7°C) is an effective
technique to limit microbial growth (45).

38
Table 12: Log-values of microbiological counts (CFU/g) of different groups of bacteria during 6-day storage test for tuna. (VRBG = Violet Red Bile Glucose agar; RE = Rapid Enterobactiaceae agar).
Condition Total count
LAB Entero- Bacteriaceae
(VRBG)
Entero- Bacteriaceae
(RE)
Enterococci Pseudo-monas
Clostridium
DAY 0
4,81 1,30 3,53 3,63 <2 4,15 3,85
4,95 1,60 3,11 3,18 <2 4,94 3,65
DAY 3
7°C - MAP 3,98 1,00 1,00 <1 <2 2,00 2,87
6,15 2,11 2,26 2,68 <2 6,31 5,09
22°C - MAP 8,91 7,58 8,75 8,76 5,41 8,81 8,88
8,23 7,00 7,95 8,15 5,08 8,11 8,43
3h 22°C + 7°C - MAP 6,60 4,11 2,73 3,04 <2 6,59 6,08
4,23 2,36 1,00 1,00 <2 4,30 3,72
7°C - Air 6,86 1,60 1,70 2,08 <2 7,11 4,65
7,33 3,13 2,23 2,23 <2 3,26 5,04
22°C - Air 9,71 7,05 8,83 9,04 6,33 9,50 9,29
9,78 6,85 8,81 8,92 <4 9,47 9,19
3h 22°C + 7°C - Air 8,13 2,91 2,70 2,72 <2 8,15 6,41
7,75 3,35 1,85 2,18 <2 7,82 5,84
DAY 5
7°C - MAP 6,23 3,35 <3 <3 <2 6,64 8,76
6,46 1,85 <3 <3 <2 7,07 6,53
22°C - MAP 9,30 7,47 9,26 9,11 7,05 9,24 9,26
9,41 7,18 9,18 9,13 6,75 9,24 9,16
3h 22°C + 7°C - MAP 9,17 2,70 6,52 7,78 2,00 7,00 8,00
7,59 4,28 4,78 7,20 <2 7,91 7,85
7°C - Air 8,43 4,76 3,30 4,04 <2 8,77 7,09
8,79 <3 3,95 4,28 <2 8,88 7,18
22°C - Air 9,99 8,23 9,46 8,60 6,68 9,64 9,79
9,93 7,39 9,54 8,68 6,85 9,73 9,72
3h 22°C + 7°C - Air 9,18 4,40 7,40 7,00 9,19 8,67
9,54 2,24 6,78 4,48 2,48 9,57 8,11
DAY 6
7°C - MAP 7,85 3,95 <3 <3 <2 7,76 7,43
7,26 4,52 <3 <3 <2 6,18 6,26
22°C - MAP 9,00 7,27 9,39 8,66 5,95 9,25 9,36
9,05 7,58 8,74 9,08 5,95 8,99 9,12
3h 22°C + 7°C - MAP 8,78 7,43 6,18 7,51 <2 5,39 7,48
6,58 3,49 <3 5,78 <2 6,20 6,26
7°C - Air 9,56 6,52 4,28 4,95 3,00 9,47 7,92
8,77 5,53 3,95 3,60 <2 10,51 7,86
22°C - Air 9,89 8,72 9,75 9,94 6,71 10,00 9,09
9,79 8,18 9,53 9,60 9,53 9,78
3h 22°C + 7°C - Air 9,21 4,38 4,74 8,36 <2 9,11 8,96
9,57 6,64 7,15 7,08 2,48 4,67 8,17
4.2.1.4 Sensorial aspects of tuna
In table 13 several sensorial aspects, observed during the analysis of the tuna-samples, are described.
These were recorded in order to evaluate whether a product showing toxic values of BA also displays
sensorial changes severe enough to prevent a consumer eating it. Combining this table with the
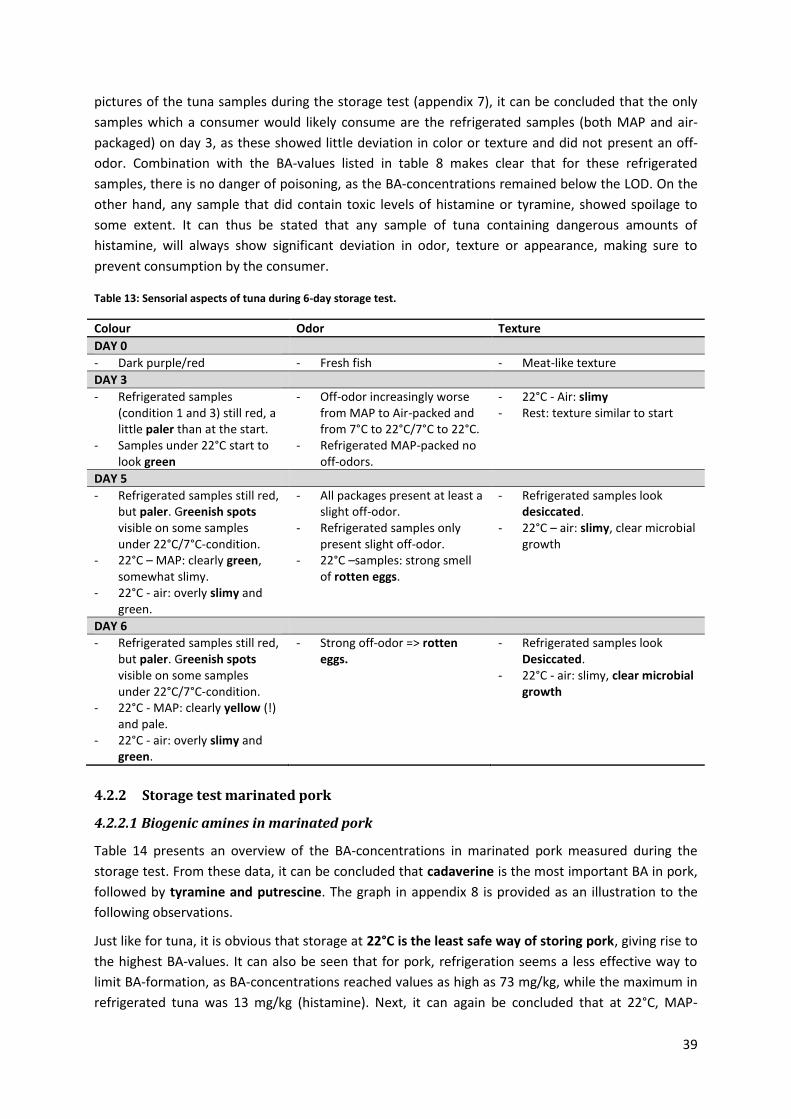
39
pictures of the tuna samples during the storage test (appendix 7), it can be concluded that the only
samples which a consumer would likely consume are the refrigerated samples (both MAP and air-
packaged) on day 3, as these showed little deviation in color or texture and did not present an off-
odor. Combination with the BA-values listed in table 8 makes clear that for these refrigerated
samples, there is no danger of poisoning, as the BA-concentrations remained below the LOD. On the
other hand, any sample that did contain toxic levels of histamine or tyramine, showed spoilage to
some extent. It can thus be stated that any sample of tuna containing dangerous amounts of
histamine, will always show significant deviation in odor, texture or appearance, making sure to
prevent consumption by the consumer.
Table 13: Sensorial aspects of tuna during 6-day storage test.
Colour Odor Texture
DAY 0
- Dark purple/red - Fresh fish - Meat-like texture
DAY 3
- Refrigerated samples (condition 1 and 3) still red, a little paler than at the start.
- Samples under 22°C start to look green
- Off-odor increasingly worse from MAP to Air-packed and from 7°C to 22°C/7°C to 22°C.
- Refrigerated MAP-packed no off-odors.
- 22°C - Air: slimy - Rest: texture similar to start
DAY 5
- Refrigerated samples still red, but paler. Greenish spots visible on some samples under 22°C/7°C-condition.
- 22°C – MAP: clearly green, somewhat slimy.
- 22°C - air: overly slimy and green.
- All packages present at least a slight off-odor.
- Refrigerated samples only present slight off-odor.
- 22°C –samples: strong smell of rotten eggs.
- Refrigerated samples look desiccated.
- 22°C – air: slimy, clear microbial growth
DAY 6
- Refrigerated samples still red, but paler. Greenish spots visible on some samples under 22°C/7°C-condition.
- 22°C - MAP: clearly yellow (!) and pale.
- 22°C - air: overly slimy and green.
- Strong off-odor => rotten eggs.
- Refrigerated samples look Desiccated.
- 22°C - air: slimy, clear microbial growth
4.2.2 Storage test marinated pork
4.2.2.1 Biogenic amines in marinated pork
Table 14 presents an overview of the BA-concentrations in marinated pork measured during the
storage test. From these data, it can be concluded that cadaverine is the most important BA in pork,
followed by tyramine and putrescine. The graph in appendix 8 is provided as an illustration to the
following observations.
Just like for tuna, it is obvious that storage at 22°C is the least safe way of storing pork, giving rise to
the highest BA-values. It can also be seen that for pork, refrigeration seems a less effective way to
limit BA-formation, as BA-concentrations reached values as high as 73 mg/kg, while the maximum in
refrigerated tuna was 13 mg/kg (histamine). Next, it can again be concluded that at 22°C, MAP-

40
packaging did seem to limit BA-production. In refrigerated (7°C) samples, however, the effect of
MAP-packaging seemed minor. Also, storing the samples at 22°C for 3 hours before refrigerating
does not seem to have major increasing effect on BA-concentrations, compared to immediate
refrigeration. Statistical analysis of this difference, however, was not possible, as there are only 2
samples per condition on each day.
For toxicological analysis, a portion size of 100g can be assumed (cfr. table 9). Considering table 8, it
can be concluded that histamine will pose no toxicological threat. For tyramine, the threshold of
6000 mg/kg for symptoms in health people was never reached. Even values of 500 mg/kg, which
would cause symptoms in people taking third generation MAOI-drugs, were not recorded. In people
taking classical MAOI-drugs, however, symptoms can occur starting from concentrations of 60
mg/kg. Such values were reached already at day 3 for samples at 22°C and between day 8 and 9 for
refrigerated samples, making these samples possible health hazards for these people. Overall,
however, no major toxicological problems are to be expected.
Table 14: BA-concentrations (mg/kg) for marinated pork meat during 9-day storage test, during which different storage conditions and packaging techniques were applied. For each storage condition on every day, 2 samples were analysed.
Condition Tryptamine β-Phenylethylamine Putrescine Cadaverine Histamine Tyramine
DAY 0
<LOD <LOD <LOD <LOD <LOD <LOD
<LOD <LOD <LOD <LOD <LOD <LOD
DAY 3
7°C - MAP 3 <LOD 6 23 1 12
2 <LOD 4 24 1 13
22°C - MAP 9 <LOD 48 93 3 68
10 1 52 99 3 73
3h 22°C + 7°C - MAP 2 <LOD 10 35 2 18
<LOQ <LOD 9 28 2 13
7°C - Air <LOQ <LOD 10 32 4 16
<LOD <LOD 10 32 5 <LOD
22°C - Air 12 1 50 103 8 70
10 2 51 112 8 74
3h 22°C + 7°C - Air <LOD <LOD 13 42 5 25
<LOQ <LOD 15 37 4 22
DAY 5
22°C - MAP 27 2 80 116 10 106
30 3 88 135 11 125
22°C - Air 32 8 117 282 20 144
42 13 125 409 24 181
DAY 8
7°C - MAP 6 <LOD 39 45 4 38
11 <LOD 47 53 6 47
3h 22°C + 7°C - MAP 10 <LOD 49 54 5 47
15 <LOQ 57 69 7 54
7°C - Air 12 <LOD 55 51 16 53
15 1 60 58 16 62
3h 22°C + 7°C - Air 15 1 59 65 21 59
12 1 50 56 21 49
DAY 9
7°C - MAP 13 <LOD 52 58 7 54
12 <LOD 48 54 6 50

41
3h 22°C + 7°C - MAP 14 1 58 68 6 60
15 <LOD 56 65 5 60
7°C - Air 17 2 60 58 17 67
15 1 57 58 16 60
3h 22°C + 7°C - Air 18 3 68 72 20 73
18 3 59 64 20 65
4.2.2.2 Free amino acids in marinated pork
Table 15 shows the FAA-concentrations detected in marinated pork on day 0 of the storage test,
providing a view on the BA-precursors. In tuna, the FAA-pattern agreed with the BA-concentrations
detected (see 4.1.1.2 ). In pork, however, such a coherence cannot be observed. The highest FAA-
concentrations were found for tryptophane and β-phenylalanine, from which would be expected that
tryptamine and β-phenylethylamine concentrations are equally the highest. Table 14 however,
shows that the contrary is true, tryptamine and β-phenylethylamine concentrations were the lowest
among the BA. On the other hand, arginine, tyrosine, ornithine and lysine are found in lower
concentrations, while their BA are found in the highest concentrations. This leads to the conclusion
that the FAA present at the beginning of storage are not a decisive factor determining the final BA-
concentrations in marinated fresh pork. BA might mostly originate from proteolysis and
decarboxylating activities during the storage, rather than before. As another explanation the
bacteria on pork might have a preference towards the production of cadaverine, tyramine and
putrescine, rather than tryptamine and β-phenylethylamine, generating a BA-profile not coherent
with the FAA-profile at the start.
Table 15: FAA-concentrations (mg/kg) in marinated pork, measured on day 0. Two samples were analysed.
Histidine Arginine Tyrosine Tryptophane Phenylalanine Ornithine Lysine
Sample A 20 <LOD 27 174 38 9 49
Sample B 21 <LOD 27 177 39 9 50
4.2.2.3 Microbiology of marinated pork
Table 16 shows the microbiological counts recorded during the storage test of marinated pork,
illustrating the spoilage flora and the possible BA-producers present. Table 16 clearly shows that the
highest counts were found for the total bacterial count, Lactic acid bacteria (LAB) and Pseudomonas.
Moreover, Enterobacteriaceae show lower counts here than in tuna. The predominant presence of
LAB and Pseudomonas agrees with the classical image of spoilage of packaged fresh meat (45). It also
agrees with the BA-profile detected, because LAB have been associated with tyramine, cadaverine
and putrescine and pseudomonas have been shown to produce cadaverine an putrescine as well.
Considering the evolution in time, just like for tuna, higher counts were detected at the end of
storage than at the start. Also just like for tuna, each storage conditions gives rise to different MO-
counts, with higher values for air-stored products versus MAP-packaged products and higher values
for samples at 22°C versus 7°C.

42
Table 16: Log-values of microbial counts (CFU/g) of different groups of bacteria during 9-day storage test of marinated pork. (VRBG = violet red bile glucose agar; Re = Rapid Enterobacteriaceae agar).
Condition Total count LAB Entero- Bacteriaceae (VRBG)
Entero- Bacteriaceae
(RE)
Enterococci Pseudomonas Staphylococci
DAY 0
4,20 3,85 <1 <1 <2 3,64 3,08 4,16 3,97 1,00 2,78 <2 3,88 2,85
DAY 3
7°C - MAP 5,96 5,75 2,15 2,26 2,00 4,41 3,34 6,05 5,62 2,11 1,90 2,00 4,42 3,59 22°C - MAP 9,13 9,12 4,76 5,19 <4 5,49 7,43 9,08 9,09 4,34 5,09 2,78 5,18 5,15 3h 22°C + 7°C - MAP
6,21 5,81 2,18 2,30 2,00 6,07 3,53
6,29 5,91 2,36 2,63 <2 5,93 3,61
7°C - Air 6,45 5,75 2,62 2,61 2,48 6,37 3,75 6,38 5,85 2,34 2,86 2,95 4,70 3,83 22°C - Air 9,62 9,26 7,02 7,35 <4 9,11 7,41 9,63 9,14 6,76 7,43 <4 9,13 7,38 3h 22°C + 7°C - Air
7,12 6,14 2,76 2,90 3,00 6,77 4,11
6,93 6,17 2,60 2,64 <3 6,43 3,92
DAY 5
22°C - MAP 9,22 9,19 3,30 4,36 <4 5,43 5,62 9,31 9,30 3,00 4,59 <4 5,35 5,68 22°C - Air 10,23 9,25 9,28 9,85 <4 9,82 8,16 10,20 9,32 9,00 9,08 8,15 9,71 9,07
DAY 8
7°C - MAP 8,62 8,76 2,20 2,59 2,00 4,23 3,04 8,68 8,76 2,60 2,87 <2 4,29 3,72 3h 22°C + 7°C - MAP
9,64 8,94 5,31 5,33 <2 9,36 5,73
8,59 8,80 2,18 2,71 <2 4,29 3,23
7°C - Air 9,41 8,95 4,52 4,60 <2 9,20 5,20 9,58 9,04 4,56 4,92 2,70 9,47 5,38 3h 22°C + 7°C - Air
9,56 8,89 5,45 5,49 <2 9,28 5,00
9,36 8,82 4,51 5,21 <2 9,29 4,60
DAY 9
7°C - MAP 8,51 8,72 2,63 2,38 <4 4,03 3,54 8,62 8,78 2,00 2,43 <4 4,07 3,08 3h 22°C + 7°C - MAP
8,59 8,72 2,18 2,63 <4 4,13 3,48
8,58 8,80 2,20 2,49 <4 4,23 3,38
7°C - Air 9,42 8,89 5,00 5,37 <4 9,27 5,53 9,36 9,02 4,56 4,75 <4 9,33 5,51 3h 22°C + 7°C - Air
9,54 9,07 5,45 5,78 <4 9,54 6,07
9,34 8,88 4,52 4,93 <4 9,31 5,54
4.2.2.4 Sensorial aspects in marinated pork
Table 17 gives a description of the color, odor and texture of the marinated meat during the storage
experiment. The evaluation of the sensorial aspects is more important here than for tuna, as the
marinade might camouflage spoilage of the product, misleading a consumer into thinking it is still
safe to eat. Although it was previously concluded that the BA-values in these products would not
pose a considerable health threat (see 4.1.2.1), this discussion might still be useful, as spoilage could
also be associated with the growth of pathogens.

43
Combining table 17 and the pictures in appendix 9, it can be concluded that toxic BA-concentrations
will mostly be visible enough to prevent a consumer from consuming the product. At day 3 for
example, the only products carrying toxic tyramine-concentrations (for people taking classical MAOI-
drugs) were the ones under 22°C. Judging from the pictures, however, it can be considered unlikely
that these products would still be consumed. At day 5, the same reasoning is applicable.
Looking at the data for day 8 and 9, however, careful consideration is obliged. The atmosphere under
which the samples were packed plays an important role here. As such, air-samples did not appear
consumable anymore, so these should not pose any toxicological problems. The MAP-packages,
however, show little observable signs of spoilage, while microbial counts and BA-values were similar
to the air-packaged products. Considering the sensorial aspects of these samples, it was concluded
that inattentive consumers or a person in a hurry could very well consume the MAP-packaged
products. When this regards a person taking classical MOAI-drugs, these samples are possibly
hazardous.
Table 17: Sensorial aspects of marinated pork during 9-day storage test.
4.3 STORAGE TEST OF DIFFERENT TYPES OF MARINATED MEAT
Here, the results of the storage tests on chicken meat, lamb meat and beef will be discussed. The BA-
profiles of the different meat-types will be compared in order to identify potential differences. Also,
the agreements between the BA-profiles and the FAA and microbiological profiles will again be
judged.
Color Odor Texture
DAY 0
- Colour of the marinade - Fresh marinated meat
DAY 3
- Samples at 22°C: marinade looks paler and has lost shine.
- Refrigerated samples: normal color.
- No off-odors - Marinade has thickened.
DAY 5 (only samples under 22°C)
- Strong off-odor on all samples: corpse smell
- Air-samples: meat and marinade stick together.
Day 8 (Only refrigerated samples)
- Samples still red (color of marinade) - Microbial growth visible only on air-samples
- No off-odors on MAP-samples
- Slight off-odor on air-samples.
- Marinade somewhat solidified
- Meat under MAP somewhat desiccated.
DAY 9 (Only refrigerated samples)
- Samples still red (color of marinade) - Microbial growth visible only on air-samples
- No off-odors on MAP-samples
- Slight off-odor on air-samples.
- Marinade somewhat solidified
- MAP-samples somewhat desiccated.

44
4.3.1.1 Biogenic amines in different types of meat
Table 18 shows the BA-concentrations measured during the storage test on marinated chicken meat,
lamb meat and beef. The BA-concentrations for marinated pork for the condition 7°C-MAP (vide
supra) were included as well, in order to be able to include pork in the following discussion. Study of
these data makes clear that the level of BA-formation depends on the type of meat and that some
meat types are more vulnerable to BA-formation than others. As such, the highest BA-concentrations
by far were found in chicken meat, followed by lamb meat, pork and beef. On the other hand, the
types of BA which were formed predominantly were quite similar in all types of meat. As such,
tyramine, cadaverine and tryptamine were the three principal BA.
Toxicologically, attention goes once again mainly to the tyramine-values, as histamine-values were
too low to cause any symptoms (see table 1). Again considering a portion of 100g of meat per meal,
it can be concluded that chicken and lamb contained concentrations that could cause toxicological
problems at the end of storage, but only in those taking MAOI-drugs. Normal people should not
experience any toxicological complaints from these products. Another remark is all BA-
concentrations seem to increase during the experiment. Unexpectedly, though, the putrescine
concentrations decrease from day 8 to day 9 in chicken meat, lamb meat and pork. No statement on
the possible breakdown of this BA can be made, however, because different samples were analysed
on each day.
Lastly, it should be noted that all meat types were marinated differently, which might have had an
effect on the development of the different BA-profiles. Differences in pH or ingredients of the
marinade, for instance, might have influenced microbial growth and activity, both proteolytic and
decarboxylating (see literature study). It is, however, impossible to state if and to which extent the
different marinades might have caused differences in BA-formation.
Table 18: BA-concentrations (mg/kg) in chicken meat, lamb meat and beef during 9-day storage test. Storage happened under MAP conditions and refrigeration (7°C).
Histamine Tyramine β-Phenylethylamine Tryptamine Putrescine Cadaverine
DAY 0
Chicken <LOD <LOD <LOD <LOQ <LOD <LOD
1 <LOD <LOD <LOQ <LOD <LOD
Lamb <LOD 6 <LOD 5 <LOD 1
<LOD 6 <LOD 6 <LOD <LOD
Beef <LOD 7 <LOD 4 <LOD 2
2 6 <LOD 2 <LOD 2
Pork <LOD <LOD <LOD <LOD <LOD <LOD
<LOD <LOD <LOD <LOD <LOD <LOD
DAY8
Chicken 3 168 <LOD 48 140 117
3 165 <LOD 44 137 105
Lamb <LOD 97 <LOD 14 33 43
<LOD 73 <LOD 12 31 36
Beef 3 24 <LOD 7 64 35
3 33 <LOD 9 76 39
Pork 6 <LOD 39 45 4 38
11 <LOD 47 53 6 47
DAY 9
Chicken 7 196 6 54 <LOD 167
6 187 5 47 <LOD 166
Lamb 1 111 <LOD 21 <LOD 68
2 105 <LOD 22 <LOD 56
Beef 6 34 1 10 <LOD 46

45
5 16 1 7 <LOD 40
Pork 13 <LOD 52 58 7 54
12 <LOD 48 54 6 50
4.3.1.2 Free amino acids in different types of meat
The concentrations of the FAA, precursing the BA, for the storage test on chicken meat, lamb meat
and beef are presented in table 19. The following observations can be mentioned: firstly, from the
predominant presence of tyramine, putrescine and cadaverine among the BA (table 18), it could be
expected that tyrosine, arginine and lysine would also show notable concentrations, which was
indeed observed. However, their importance relative to each other in the BA- or the FAA-profiles
respectively did not coincide. Also, starting from the FAA-profile, it would be expected that β-
phenylethylamine concentrations are somewhat comparable to those of tyramine (for chicken and
lamb meat) and histamine (for beef and pork). This was, however, not observed in the BA-profile.
Also, comparing the FAA-profiles between the different meat-types, it must be stated that on this
point, the BA- and the FAA-profiles do agree. In the BA-profile the values were the highest for
chicken meat and the lowest for beef, which is also the case here.
Overall it can thus be concluded that, although some agreement could be found, the FAA-patterns of
these meat types are not entirely reflected in their BA-patterns, which again leads to the conclusion
that there are oher important factors than only the FAA-concentration determining the BA-
concentrations at the end of the experiment. The same explanation as suggested for the marinated
pork counts: BA are probably more derived from AA formed by proteolysis during storage, then they
are formed out of FAA available at the beginning of storage.
Table 19: FAA-concentrations (mg/kg) in chicken meat, lamb meat and beef meat on day 0 of the storage test. For each type of meat, 2 samples were analysed. Storage happened under MAP conditions and refrigeration (7°C).
Histidine Tyrosine Phenylalanine Tryptophane Arginine Ornithine Lysine
Chicken 99 163 117 91 300 <LOD 313
103 170 122 94 304 <LOD 316
Lamb 78 102 116 <LOD 316 <LOD 224
74 98 108 <LOD 290 <LOD 121
Beef 39 25 34 <LOD 43 <LOD 18
33 7 28 <LOD 32 <LOD 21
Pork 20 <LOD 27 174 38 9 49
21 <LOD 27 177 39 9 50
4.3.1.3 Microbiology of different types of meat
In table 20, the microbiological counts for the storage test on chicken meat, lamb meat and beef can
be found, again representing the spoilage flora and possible BA-producers. The microbial data for
pork were also included in this table for comparison. First of all, comparing the different types of
meat, it can be observed that lamb meat and beef carried the highest initial microbial
contamination. Chicken meat started with lower contaminations, but by the end of the storage test
the microbial counts on chicken meat were comparable to these on lamb, suggesting rapid microbial
growth/activity. This might explain why the BA-values recorded for chicken meat were higher than
those on lamb meat, as BA-formation and microbial activity are linked (see literature study). The
microbial counts for pork were each time lower than on the other meat-types. For all meat types, the
microbial counts rose during storage.

46
Next, looking at which types of MO were the most predominant, the LAB-counts clearly stand out as
the highest microbial counts. The second highest values were observed for PA (Pseudomonas). The
same conclusion as for the storage test on pork counts: this is the classical spoiling flora of meat (45).
Now comparing this microbial profile with the BA-data, it can be concluded that these two agree
with each other. Figure 17 clearly suggests that the combined presence of LAB and Pseudomonas
gives rise to the formation of tyramine, cadaverine and putrescine. Again, it should be noted here
that the different marinades might have influenced the development of the microbial profiles.
Table 20: Log-values of microbial counts (CFU/g) of different groups of bacteria on chicken meat, lamb meat and beef during 9-day storage test. Storage happened under MAP conditions and refrigeration (7°C).
Total count LAB Staphylococci Enterobacteriaceae Enterococci Pseudomonas
DAY 0
Chicken 4,76 3,10 3,08 2,04 <2 3,90 4,80 3,13 3,34 2,20 <2 3,81 Lamb 7,17 4,84 2,78 3,77 <2 4,24 7,41 5,01 3,30 4,10 <2 4,72 Beef 7,04 7,09 3,46 3,45 <2 5,13 7,00 6,74 3,90 3,47 <2 5,35 Pork 4,20 3,85 3,08 <1 <2 3,64
4,16 3,97 2,85 2,78 <2 3,88
DAY 8
Chicken 8,77 8,81 3,00 3,90 <3 4,90 8,78 8,70 <3 3,90 <3 4,92 Lamb 9,12 9,11 <3 5,12 <3 5,72 8,89 8,91 <3 5,46 <3 5,96 Beef 8,73 8,83 3,30 3,00 <3 5,37 8,72 8,85 <3 4,00 <3 5,28 Pork 8,62 8,76 3,04 2,59 2,00 4,23
8,68 8,76 3,72 2,87 <2 4,29
DAY 9
Chicken 8,91 8,76 <3 4,53 <3 6,17 9,06 8,98 <3 4,11 <3 5,05 Lamb 9,11 8,94 <3 5,52 <3 5,99 9,07 9,12 <3 5,14 <3 5,60 Beef 8,68 8,74 <3 3,70 <3 5,28 8,58 8,71 <3 3,48 <3 5,32 Pork 8,51 8,72 3,54 2,38 <4 4,03
8,62 8,78 3,08 2,43 <4 4,07
4.3.1.4 Sensorial aspects of different types of meat
As previously discussed, only the presence of tyramine might pose any health risk in the analysed
samples of chicken meat, lamb meat and beef, and only for people taking MAOI-drugs. But although
no major toxicological problems are expected, discussion of the sensorial properties of these meats is
still considered useful, because the marinades can still camouflage spoilage.
Table 21 sets out the sensorial aspects of chicken, lamb and beef during the storage test. From this
table, it can be seen that beef seems most prone to show aberrant sensorial aspects. Combination of
the microbial data (table 20) with the microbiological criteria (46) counting for meat preparations
shows that by day 8, all meat-types were already spoiled, while only beef showed visible signs of
spoilage at that point. It took up till day 9 before actual discoloring appeared in all types of meat. This

47
leads to the conclusion that the marinades are able to camouflage spoilage and although the BA
might not form a threat, consumption of such products could still be dangerous for microbial reasons
(for instance, if vegetative pathogens were to be present).
Table 21: Sensorial aspects of marinated chicken, lamb and beef recorded during 9-day storage test.
Color Odor Texture
DAY 0
Normal Normal Normal
DAY 8
Chicken Not aberrant Not aberrant Not aberrant
Lamb Not aberrant Not aberrant Not aberrant
Beef Meat has become grey under marinade
Not aberrant Desiccated
DAY 9
Chicken Meat has become white under marinade; still pink on inside
Not aberrant No remarks
Lamb Meat has become grey under marinade; still red on inside
Not aberrant No remarks
Beef Meat has become grey under marinade
Off-odor Desiccated, baked outlook
4.4 SCREENING OF MEAT PRODUCTS AND PREPARATIONS FROM THE BELGIAN
MARKET
In this section, the results of the screening tests conducted for the group of meat products and
preparations, purchased in commercial stores, will be discussed. This will comprise discussion of the
BA-concentrations in salami’s and dried sausages, cooked hams, raw dried hams and meat
preparations, plus their toxicological importance. Also, a comparison of this BA-profile with the FAA-
concentrations and the microbial profile will be made.
4.4.1 Salami and dried sausages
4.4.1.1 Biogenic amines
In total, 17 types of dried sausages and 8 salami’s, purchased from diverse supermarkets, markets
and butchery shops in Belgium, were screened. At purchase, there was a specific search for the most
'traditional' sausages, instead of sausages from well established companies or retailers. The
distinction between salami’s and dried sausages was made on the basis of their ingredients: sausages
containing intentionally added ferments were categorized as salami, while those without were filed
as dried sausages. In these last ones, natural fermentation had occurred.
Table 22 represents the BA-concentrations detected in these products. It can be derived that
tyramine and putrescine were the most important BA in both salami and dried sausages, based on
their mean and maximal values. In dried sausages, also cadaverine reached values over 100 mg/kg,
while in salami, cadaverine was less important. Another observation is that the BA-values for
putrescine, cadaverine and tyramine varied widely between samples. In most dried sausages, for
instance, the putrescine and cadaverine concentrations were no higher than several mg/kg, but in
some sausages several hundreds of mg/kg were reached! Also, comparing dried sausages to salami
shows that dried sausages showed higher mean and maximal values on the most important BA
(putrescine, cadaverine, histamine and tyramine), an observation agreeing with previous studies (8).

48
The biggest absolute differences were found for cadaverine. Next, when comparing concentrations of
A (day 0) vs. B (expiry date), data shows that mean values were usually lower at the end of storage
than at the beginning. Looking at individual samples, however, this effect was not always consistently
displayed.
Toxicologically, considering a portion of 25g for salami/dried sausage (see table 9), it can be
concluded that histamine values in these products are of no concern. Even for tyramine, no health
hazard should occur, because at a consumption of 25 g per meal, concentrations of 24000 mg/kg
would be required to cause symptoms in healthy individuals. For people taking classical MAOI-drugs,
tyramine-values would have to exceed 240 mg/kg to cause any trouble, a value which was reached in
none of the samples. Hence, it can be concluded that neither histamine, nor tyramine will form a
health risk in salami or dried sausages.
Table 22: BA-concentrations (mg/kg) in dried sausages and salami’s collected during screening tests. For the calculation of means, standard deviations, minimal and maximal values, B-values were filled out when unavailable by copying the A-concentrations (see materials and methods)
Tryptamine B-Phenylethylamine Putrescine Cadaverine Histamine Tyramine
DRIED SAUSAGE
Min A <LOD <LOD <LOD <LOD <LOD <LOD
B <LOD <LOD <LOD <LOD <LOD <LOD
Mean A 9 4 45 21 5 79
B 7 6 30 18 5 75
Stdev A 13 6 84 41 14 77
B 11 7 49 40 14 68
P50 A 2 1 3 2 <LOD 71 B <LOD 4 9 2 <LOD 64
P90 A 32 10 145 64 11 180 B 27 13 105 50 12 171
Max A 33 24 307 158 54 226
B 33 24 156 158 54 205
SALAMI
Min A <LOD <LOD <LOD <LOD <LOD <LOD
B <LOD <LOD <LOD <LOD <LOD <LOD
Mean A 4 4 34 3 2 65
B 4 3 28 9 2 48
Stdev A 11 5 51 2 4 56
B 11 4 49 19 4 53
P50 A <LOD 1 4 2 <LOD 63
B <LOD 2 6 3 <LOD 28
P90 A <LOD 5 59 3 2 103
B <LOD 5 22 4 2 78
Max A 31 12 141 7 13 153
B 31 10 136 57 13 134
Note: for concentrations in individual samples, see appendix 10
4.4.1.2 Free amino acids
Table 23 contains the FAA-concentrations detected in salami’s and dried sausages. Comparing the
FAA-profile to the BA-profile above, it can be concluded that the two profiles do not agree: where
tyramine, putrescine and cadaverine were the principal BA, the three most important FAA at the
beginning of storage were lysine, phenylalanine and histidine (based on the mean values). This non-
coherence is more logical here than for fresh meat products, because in these fermented products,
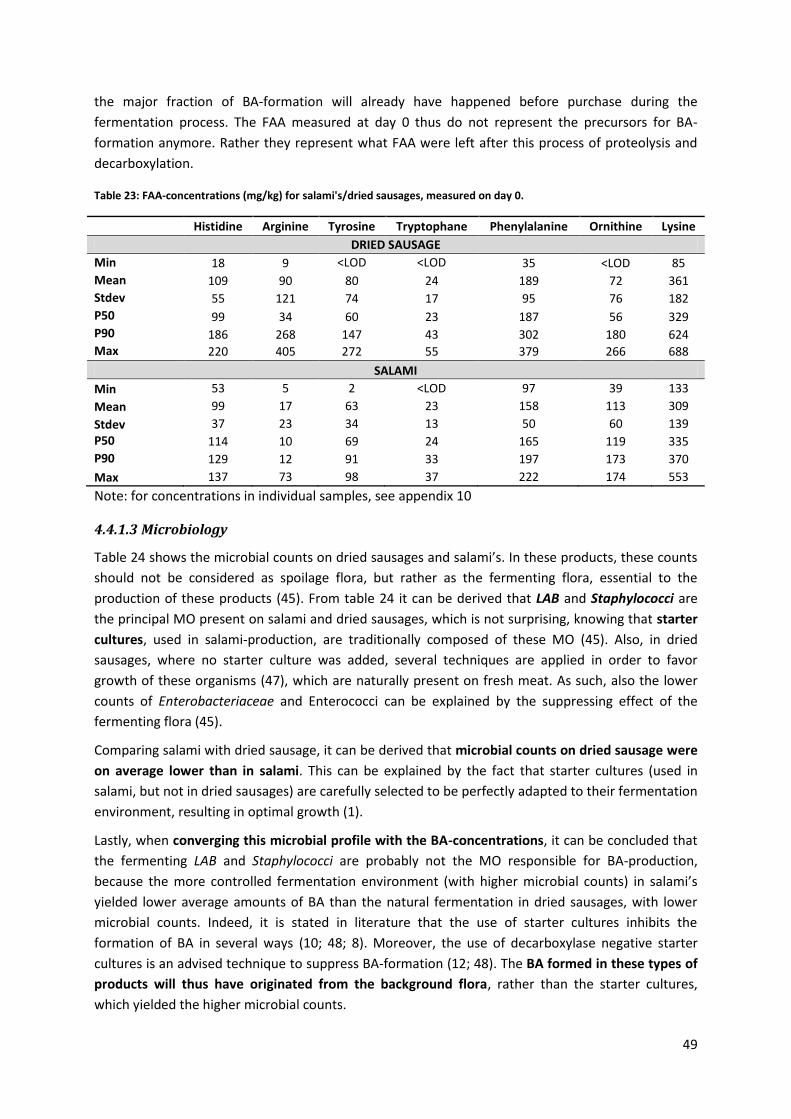
49
the major fraction of BA-formation will already have happened before purchase during the
fermentation process. The FAA measured at day 0 thus do not represent the precursors for BA-
formation anymore. Rather they represent what FAA were left after this process of proteolysis and
decarboxylation.
Table 23: FAA-concentrations (mg/kg) for salami's/dried sausages, measured on day 0.
Histidine Arginine Tyrosine Tryptophane Phenylalanine Ornithine Lysine
DRIED SAUSAGE
Min 18 9 <LOD <LOD 35 <LOD 85
Mean 109 90 80 24 189 72 361
Stdev 55 121 74 17 95 76 182
P50 99 34 60 23 187 56 329 P90 186 268 147 43 302 180 624 Max 220 405 272 55 379 266 688
SALAMI
Min 53 5 2 <LOD 97 39 133
Mean 99 17 63 23 158 113 309
Stdev 37 23 34 13 50 60 139
P50 114 10 69 24 165 119 335
P90 129 12 91 33 197 173 370
Max 137 73 98 37 222 174 553
Note: for concentrations in individual samples, see appendix 10
4.4.1.3 Microbiology
Table 24 shows the microbial counts on dried sausages and salami’s. In these products, these counts
should not be considered as spoilage flora, but rather as the fermenting flora, essential to the
production of these products (45). From table 24 it can be derived that LAB and Staphylococci are
the principal MO present on salami and dried sausages, which is not surprising, knowing that starter
cultures, used in salami-production, are traditionally composed of these MO (45). Also, in dried
sausages, where no starter culture was added, several techniques are applied in order to favor
growth of these organisms (47), which are naturally present on fresh meat. As such, also the lower
counts of Enterobacteriaceae and Enterococci can be explained by the suppressing effect of the
fermenting flora (45).
Comparing salami with dried sausage, it can be derived that microbial counts on dried sausage were
on average lower than in salami. This can be explained by the fact that starter cultures (used in
salami, but not in dried sausages) are carefully selected to be perfectly adapted to their fermentation
environment, resulting in optimal growth (1).
Lastly, when converging this microbial profile with the BA-concentrations, it can be concluded that
the fermenting LAB and Staphylococci are probably not the MO responsible for BA-production,
because the more controlled fermentation environment (with higher microbial counts) in salami’s
yielded lower average amounts of BA than the natural fermentation in dried sausages, with lower
microbial counts. Indeed, it is stated in literature that the use of starter cultures inhibits the
formation of BA in several ways (10; 48; 8). Moreover, the use of decarboxylase negative starter
cultures is an advised technique to suppress BA-formation (12; 48). The BA formed in these types of
products will thus have originated from the background flora, rather than the starter cultures,
which yielded the higher microbial counts.

50
Table 24: Log-values of microbial counts (CFU/g) of different groups of bacteria on salami/dried sausages. These values were calculated using an upper bound scenario.
Total count LAB Staphylococci Enterobacteriaceae Enterococci
DRIED SAUSAGE
Mean 7,89 7,97 6,24 0,30 3,99
Stdev 1,08 0,62 1,37 1,22 1,47
Min 4,56 6,76 3,60 <1 <3
P50 8,21 8,20 5,77 3,00 3,00 P90 8,60 8,56 7,70 3,00 5,83 Max 9,17 8,65 8,94 5,02 7,36
SALAMI
Mean 8,32 8,13 6,49 <3 3,58
Stdev 0,55 0,49 1,09 <3 1,00
Min 7,34 7,33 5,30 <3 3,00
P50 8,57 8,39 6,51 <3 3,00 P90 8,76 8,50 7,63 <3 5,02 Max 8,87 8,51 8,42 <3 5,19
Note: for concentrations in the individual samples, see appendix 10
4.4.2 Cooked hams
In this category, it was observed that the preparation method differed between different types of
cooked meat products. For instance, next to being cooked, many cooked hams were also smoked,
either by use of an additive or a smoking chamber. Additionally, some hams were also grilled. These
different preparation methods might have had different effects on the formation of BA during
storage, but the effect was not investigated here. The different preparations methods of the samples
are described in appendix 14.
4.4.2.1 Biogenic amines
Table 25 shows a summary of these BA-concentrations in cooked hams, from which the following
observations can be described. Firstly, overall, cooked hams contain only limited amounts of BA,
which can be explained by the cooking process, which serves as a pasteurization, killing most of the
present MO. It is also clear that tyramine is the most important BA, as it’s mean value is the highest
and it occurs in the largest number of samples. Other BA are insignificant in cooked hams. It can also
be noted that, except for in the first sample, the tyramine values are usually higher at the end of
storage (A-values) than at the start (B-values).
Toxicologically, it appears that these products can do no harm. Firstly, histamine-concentrations, just
like in fermented sausages, were too low to cause any trouble. Secondly, as these products are
meant to be consumed between a sandwich, the portion size of these products will usually only be a
couple of grams, which results in even higher tolerable concentrations in these products than given
in table 8. This leads to the conclusion that cooked hams will be of no significant health risk.
Table 25: BA-concentrations (mg/kg) in cooked hams. For the calculation of means, standard deviations, minimal and maximal values, B-values were filled out when unavailable by copying the A-concentrations (see materials and methods).
Tryptamine B-Phenylethylamine Putrescine Cadaverine Histamine Tyramine
Mean A 1 <LOD 3 1 <LOD 10
B 1 <LOD <LOD 5 <LOD 26
Stdev A 2 1 12 1 1 24
B 1 <LOD 1 14 1 22

51
Min A <LOD <LOD <LOD <LOD <LOD <LOD
B <LOD <LOD <LOD <LOD <LOD <LOD
P50 A <LOD <LOD <LOD <LOD <LOD <LOD B <LOD <LOD <LOD <LOD <LOD 25
P90 A 2 <LOD <LOD 2 <LOD 28
B 3 <LOD <LOD 9 2 60
Max A 6 3 47 5 2 86
B 4 <LOD 3 56 2 70
Note: for concentrations in the different samples, see appendix 11.
4.4.2.2 Free amino acids
Table26 presents the FAA-concentrations in cooked hams. Looking at the mean and max FAA-values,
lysine and arginine appeared the most prominent, which led to the expectation of putrescine and
cadaverine being the principal BA. This is not the case, however. Also, while tyramine was the most
important BA in cooked hams, tyrosine was only 4th in the ranking from high to low FAA-
concentrations. It can thus be concluded, and this agrees with all other meat products discussed
above, that the FAA-profile does not seem to correspond with the BA-profile of cooked hams. The
reason might be similar to the one stated in the discussion of the storage tests for marinated pork
and other meats.
Table 26: FAA-concentrations (mg/kg) in cooked hams.
Histidine Arginine Tyrosine Tryptophane Phenylalanine Ornithine Lysine
Mean 50 99 67 36 85 10 130 Stdev 25 48 24 16 31 27 51
Min <LOD 49 25 17 37 <LOD 60
P50 45 82 62 27 84 <LOD 148 P90 84 157 100 56 123 32 184 Max 94 230 107 57 138 91 217
Note: for concentrations in the different samples, see appendix 11.
4.4.2.3 Microbiology
In cooked hams, strictly speaking, the only bacteria that should be found are the ones that survive
the cooking process (some heat resistant LAB). However, post-contamination occurring after
pasteurization and before packaging can lead to the presence of other types of MO (45). The
following table, containing the microbiological counts in cooked hams, shows that LAB are the most
prominent in cooked hams. On the other hand, the microbial counts for staphylococci (MSA),
Enterobacteriaceae (RE) and Enterococci (SB) are very low, which indicates that in most hams post-
contamination was successfully inhibited. Also, these low counts are a probably the explanation for
the low BA-concentrations discussed above.
Table 27: Log-values of microbial counts (CFU/g) of different groups of bacteria in cooked hams.
Total count LAB Staphylococci Enterobacteriaceae Enterococci
Mean 8,07 8,14 0,63 <3 0,42
Stdev 1,03 0,92 1,85 <3 1,16
Min 5,92 6,05 <3 <3 <3
P50 8,60 8,49 3,00 <3 3,00
P90 8,89 8,81 3,15 <3 3,15
Max 9,00 9,03 6,85 <3 3,48
Note: for concentrations in the different samples, see appendix 11.
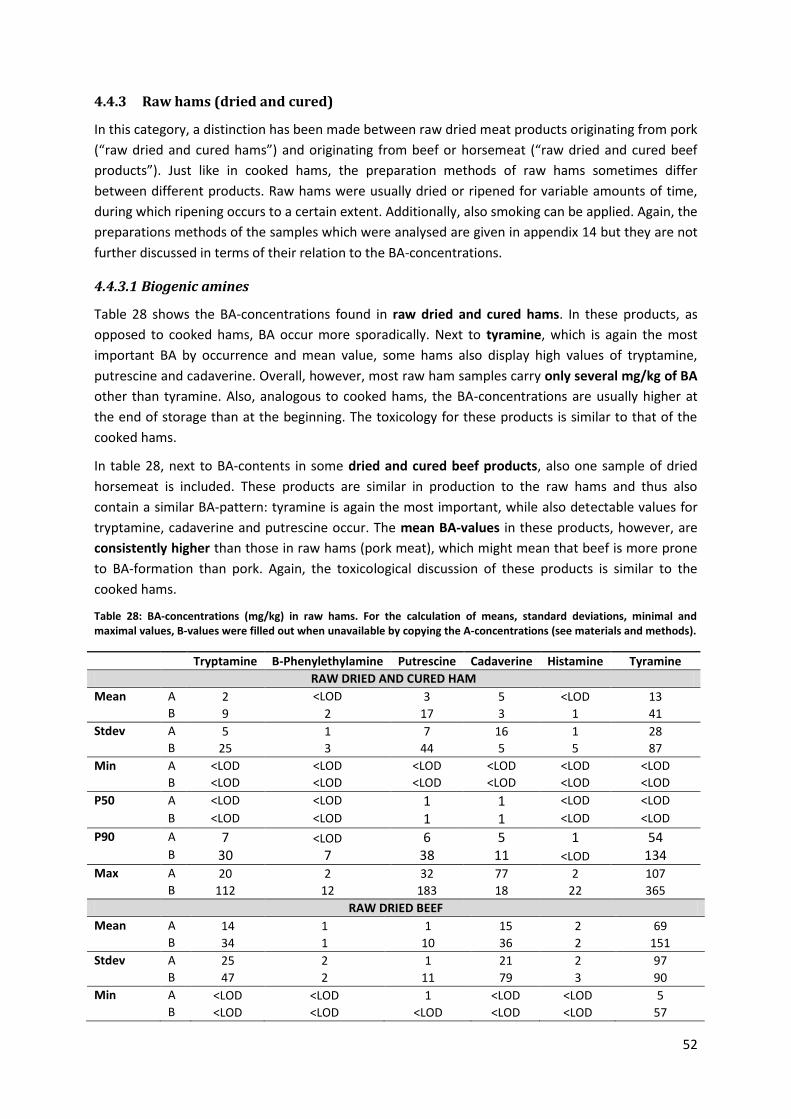
52
4.4.3 Raw hams (dried and cured)
In this category, a distinction has been made between raw dried meat products originating from pork
(“raw dried and cured hams”) and originating from beef or horsemeat (“raw dried and cured beef
products”). Just like in cooked hams, the preparation methods of raw hams sometimes differ
between different products. Raw hams were usually dried or ripened for variable amounts of time,
during which ripening occurs to a certain extent. Additionally, also smoking can be applied. Again, the
preparations methods of the samples which were analysed are given in appendix 14 but they are not
further discussed in terms of their relation to the BA-concentrations.
4.4.3.1 Biogenic amines
Table 28 shows the BA-concentrations found in raw dried and cured hams. In these products, as
opposed to cooked hams, BA occur more sporadically. Next to tyramine, which is again the most
important BA by occurrence and mean value, some hams also display high values of tryptamine,
putrescine and cadaverine. Overall, however, most raw ham samples carry only several mg/kg of BA
other than tyramine. Also, analogous to cooked hams, the BA-concentrations are usually higher at
the end of storage than at the beginning. The toxicology for these products is similar to that of the
cooked hams.
In table 28, next to BA-contents in some dried and cured beef products, also one sample of dried
horsemeat is included. These products are similar in production to the raw hams and thus also
contain a similar BA-pattern: tyramine is again the most important, while also detectable values for
tryptamine, cadaverine and putrescine occur. The mean BA-values in these products, however, are
consistently higher than those in raw hams (pork meat), which might mean that beef is more prone
to BA-formation than pork. Again, the toxicological discussion of these products is similar to the
cooked hams.
Table 28: BA-concentrations (mg/kg) in raw hams. For the calculation of means, standard deviations, minimal and maximal values, B-values were filled out when unavailable by copying the A-concentrations (see materials and methods).
Tryptamine B-Phenylethylamine Putrescine Cadaverine Histamine Tyramine
RAW DRIED AND CURED HAM
Mean A 2 <LOD 3 5 <LOD 13
B 9 2 17 3 1 41
Stdev A 5 1 7 16 1 28
B 25 3 44 5 5 87
Min A <LOD <LOD <LOD <LOD <LOD <LOD
B <LOD <LOD <LOD <LOD <LOD <LOD
P50 A <LOD <LOD 1 1 <LOD <LOD B <LOD <LOD 1 1 <LOD <LOD
P90 A 7 <LOD 6 5 1 54
B 30 7 38 11 <LOD 134
Max A 20 2 32 77 2 107
B 112 12 183 18 22 365
RAW DRIED BEEF
Mean A 14 1 1 15 2 69
B 34 1 10 36 2 151
Stdev A 25 2 1 21 2 97
B 47 2 11 79 3 90
Min A <LOD <LOD 1 <LOD <LOD 5
B <LOD <LOD <LOD <LOD <LOD 57

53
P50 A <LOD <LOD 1 <LOD 2 28
B 9 <LOD 3 <LOD 2 107
P90 A 39 3 2 39 3 168
B 86 3 22 107 5 250
Max A 59 5 3 44 4 238
B 109 4 23 177 7 265
*Horsemeat Note: for concentrations in the individual samples, see appendix 12
4.4.3.2 Free amino acids
FAA-concentrations in raw meat products are displayed in table 29. Compared to the FAA-
concentrations in cooked hams, these FAA-values were a lot higher (factor 10 or more). This might
be explained by the difference in production method, in which raw hams are not pasteurized but
undergo a stage of ripening/fermentation, undoubtedly favoring proteolysis. At the time of purchase,
the major BA-formation has thus already happened in dried hams, while this is not the case in
cooked hams.
When comparing the FAA- and the BA-profile for raw dried hams, similar observations can be made
as for the cooked hams and the overall conclusion is again that both profiles don’t agree. In raw
dried beef products, the relative importance of the different BA differs from that of raw hams, yet
still there is no agreement between the FAA- and the BA-profile of these products. Notice also that in
these dried products, as the major part of BA should already have been formed, the FAA measured at
day 0 are not the precursors for BA-formation. In that sense, these products are more similar to dried
sausages than to cooked hams, so a similarity with dried sausages would be expected. This is not the
case, however: the comparison between BA- and FAA-profile yields similar conclusions for cooked
and raw hams. This leads to the conclusion that the relationship between the BA-and FAA-profile
might be more characteristic of the type of product (raw material, production method, microbial
profile,…), rather than to depend on the timepoint in BA-production.
Table 29: FAA-concentrations (mg/kg) in raw ham (pork) and raw dried beef products.
Histidine Arginine Tyrosine Tryptophane Phenylalanine Ornithine Lysine
RAW DRIED AND CURED HAM
Mean 613 1348 763 191 988 120 2284
Stdev 450 990 509 135 677 101 1561
Min <LOD 36 23 19 98 <LOD <LOD
P50 613 1408 720 176 873 94 2391
P90 1299 2673 1405 370 1977 235 4452
Max 1533 3234 1940 516 2370 348 5167
RAW DRIED BEEF
Mean 338 351 264 96 563 158 949
Stdev 274 319 260 51 378 217 920
Min 66 114 27 36 164 <LOD 138
P50 373 127 114 87 679 72 634
P90 612 709 555 149 920 385 1967
Max 701 763 611 157 1001 527 2226
*Horsemeat Note: for concentrations in individual samples, see appendix 12
4.4.3.3 Microbiology
Looking at the microbiological counts in table 30, it can firstly be observed that the microbiological
counts for raw hams and beef products are lower than those for cooked hams. Considering the low

54
aw of these products (due to salting AND drying), this seems evident. It does contrast with the
observation, though, that the BA-concentrations in these products are higher than in cooked hams.
Apparently, the bacterial cultures on raw dried meat products are more prone to form BA than the
MO which survive on cooked hams after pasteurization. Another observation is that raw beef
products give rise to higher counts than raw hams, which indicates the influence of the type of meat
on the growth of MO. Next, it can be observed that raw hams and beef products contain only low
amounts of Enterococci (SB), Enterobacteriaceae (RE) or Pseudomonas (PA). LAB, on the other hand,
are present in significant amounts on both types of products. This is the typical microbial profile of
raw ham (45). Also, in raw dried beef products, Staphylococci also showed a notable presence, while
their counts on raw hams are several log’s lower.
Combining this microbial profile again with the BA-profile and table figure 17, it can be concluded
that the types of BA formed can be explained by the types of bacteria detected. Also, the fact that
BA-concentrations were on average higher in beef products than in dried pork, combined with the
fact that higher counts of microorganisms should give rise to higher amounts of BA, leads to the
conclusion that LAB and Staphylococci were probably the most BA-forming bacteria in these
products, because the counts of Enterobacteriaceae, Enterococci and Pseudomonas were each time
lower in beef products, while the BA-contents were higher in these products.
Table 30: Log-values of microbial counts(CFU/g) in raw hams (pork) and raw dried beef products.
Total count LAB Staphylococci Enterobacteriaceae Enterococci Pseudomonas
RAW DRIED AND CURED HAM
Mean 5,84 5,10 3,64 2,95 3,47 3,02
Stdev 2,17 2,20 1,32 0,21 1,47 0,08
Min <3 <3 <2 <3 <3 <3
P50 5,07 4,28 3,85 3,00 3,00 3,00
P90 8,45 8,31 4,57 3,00 3,80 3,00
Max 9,81 8,40 6,36 <3 9,30 3,30
RAW DRIED BEEF
Mean 7,70 6,86 4,57 2,80 3,00 3,00
Stdev 0,78 1,99 1,94 0,45 0,00 0,00
Min 6,75 3,60 3,00 <2 <3 <3
P50 8,12 8,02 3,48 3,00 3,00 3,00
P90 8,33 8,20 6,70 3,00 3,00 3,00
Max 8,34 8,24 6,78 <3 <3 <3
*Horsemeat Note: for concentrations in individual samples, see appendix 12
4.4.4 Meat preparations
As described before, meat preparations are products containing meat, to which several spices and
other ingredients can be added, but in which the structure of meat can still be recognized (EU
Regulation 853/2004). In this category, products such as sausages, burgers, schnitzels and marinated
meat were included.
4.4.4.1 Biogenic amines
The BA-concentrations displayed in table 31 show that in this type of product, tyramine is again the
most prominent BA, occurring in the highest mean values. Next to tyramine, putrescine and
cadaverine are also present. This BA-profile thus agrees with the one observed during the storage
tests (vide supra). Cadaverine also gives rise to the highest maximum value. Overall, however, meat

55
preparations seem to contain only low amounts of BA (judging from the P50). In many meat
preparations, many BA were even undetectable. Also, in most cases the BA-concentrations at the
expiry date (B-values) were higher than those on day 0 (A-values), agreeing with the idea that
spoilage occurs during storage.
The toxicological assessment here is similar to the one described for the storage test of marinated
meats. As such, histamine-concentrations were again in too low to be able to cause any health
problems (see appendix 13 for concentrations in individual samples). In terms of portion size, it
should be noted that, although portions of 100g of meat are advised (table 9), portion sizes in
commercial packages of for instance burgers, sausages, etc. are mostly larger, lying between 100 and
200 g (49; 50; 51). Combining these portion sizes with table 8 shows that, for tyramine, the same
conclusions count as for the storage tests of marinated meat, namely that only people taking classical
MAOI-drugs might encounter health problems after consumption of certain products.
Table 31: BA-concentrations (mg/kg) in several meat preparations. For the calculation of means, standard deviations, minimal and maximal values, B-values were filled out when unavailable by copying the A-concentrations (see materials and methods).
Tryptamine B-Phenylethylamine Putrescine Cadaverine Histamine Tyramine
Mean A <LOD <LOD 4 2 <LOD 6 B 6 <LOD 6 15 2 29
Stdev A <LOD 1 25 4 1 17 B 16 1 26 45 5 45
Min A <LOD <LOD <LOD <LOD <LOD <LOD B <LOD <LOD <LOD <LOD <LOD <LOD
P50 A <LOD <LOD <LOD <LOD <LOD <LOD B <LOD <LOD 1 1 <LOD 5
P90 A <LOD <LOD 2 6 1 12
B 16 2 5 47 4 96
Max A <LOD 4 157 18 3 102 B 83 3 163 269 29 195
Note: for concentrations in individual samples, see appendix 13
4.4.4.2 Free amino acids
Starting from the BA-profile it can be expected that tyrosine should give rise to the highest FAA-
values (table 32) and that lysine and arginine and/or ornithine are the second and third most
prominent. This is not the case, however. Also, the mean value for phenylalanine lies between those
of tyrosine and arginine, while β-phenylethylamine (originating from phenylalanine) was usually not
even detectable. The conclusion is again that the BA- and FAA-profiles do not coincide, for the same
reason as stated in the discussion of the storage tests for marinated meat.
Table 32: FAA-concentrations (mg/kg) in meat preparations.
Histidine Arginine Tyrosine Tryptophane Phenylalanine Ornithine Lysine
Mean 56 119 61 23 74 19 126 Stdev 38 93 49 22 52 25 102 Min 14 <LOD 17 <LOD 25 <LOD 43 P50 47 92 61 22 69 <LOD 117 P90 108 228 122 57 165 43 317 Max 168 421 214 88 195 106 423
Note: for concentrations in individual samples, see appendix 13

56
4.4.4.3 Microbiology
Looking at the microbial profile in meat preparations (table 33) a similar pattern as viewed during the
storage tests for marinated meat is observed, which means a predominance of LAB and
Pseudomonas. The microbial counts are, however, lower than for the storage test, possibly due to
less post-contamination - the marinated meats originated from a butchers chop, while the meat
preparations were mostly industrially packed - and higher contents of conserving additives.
Table 33: Log-values of the microbial counts (CFU/g) in meat preparations at the end of storage.
Total count LAB Staphylococci Enterobacteriaceae Enterococci Pseudomonas
Mean 7,06 6,84 3,53 3,69 3,23 4,96 Stdev 2,16 2,15 0,86 1,46 0,54 1,96
Min <3 <3 <3 <3 <3 <3
P50 8,06 7,92 3,60 3,00 3,00 4,49 P90 8,86 8,72 4,61 5,72 4,03 7,57 Max 9,18 8,99 5,02 7,63 5,43 8,84
Note: for concentrations in individual samples, see appendix 13
4.4.5 Concluding remarks on fresh meat, meat preparations and meat products
When comparing the above mentioned products on their BA-content, FAA-content and MO-counts,
the following summarizing remarks can be made. Firstly, tyramine is present in all types of meat
products, mostly as the principal BA. Other types of BA which can show significant presence are
cadaverine, putrescine and sometimes tryptamine, but their presence depends strongly on the type
of product. Also, within one type of meat product, the BA-contents tend to vary considerably
between different samples (f. ex between different types of salami). As such, many BA in many
samples were undetectable, but sporadically, some samples carried excessive concentrations of
tyramine, cadaverine, putrescine or tryptamine.
Next, only limited agreements could be found between the FAA- and the BA-profile detected in the
same products, meaning that predominance of certain BA not always coincides with the
predominance of the precursor-FAA. This means that for meat-based products, the FAA-content at
the moment of purchase is not a good indicator for the BA-contents that will be registered at the end
of their shelf life. Apparently, too many other factors play a role in the development of the BA-profile
during storage (proteolysis f.ex., mainly for more perishable products) or the FAA at the moment of
purchase are not precursors anymore, as they are measured after the major BA-formation (f.ex. in
fermented sausages)
Finally, the microbial profiles on meat-based products could mostly be explained using knowledge of
their production methods. In fermented sausages, for instance, the starter culture is a defining
factor. In cooked hams, the cooking process is crucial in determining the microbial load. In dried and
cured hams the microbial profile can be explained by its low water activity and the microbial profile
in meat preparations is also as can be expected. Also, in all discussed types of meat-containing
products, the microbial profile could be linked with the BA-profile. It can thus be concluded that the
microbial profile forms a better indicator for the level of BA formed.
4.5 DESCRIPTION OF BA-DATA ASSEMBLED FOR OTHER FOOD GROUPS
As an introduction to the results of the statistical tests, first, the BA-concentrations in each food
group are described below. These food groups were not all analysed in the frame of this master

57
thesis, but are the BIOGAMI project. Appendix 17 provides an overview of several characteristics of
the BA-concentrations in each food group and subgroup, as well as the number of samples in each of
these categories. After this descriptional exposition, the results of the statistical analyses, executed
using the data resulting from the screening tests, will be discussed as well.
4.5.1 Fruit and vegetables
This category comprises 3 types of products, namely fresh fruit and vegetables (F&V) (non-
fermented), olives and sauerkraut (both fermented). It was observed that the BA-profiles differed
largely between all three of these food groups. Studying the BA-concentrations in fresh fruit and
vegetable products, it was observed that histamine and putrescine are the most characteristic BA.
Histamine occurred in the highest values (max of 39 mg/kg) and putrescine in the largest number of
samples. Other BA were usually undetectable.
Next, observing the BA-concentrations in olives reveals firstly that overall, only small amount of BA
were present in olives (P90 no higher than 2 mg/kg). Tryptamine was present in the highest
concentrations (maximum value of 41 mg/kg). Tyramine and β-phenylethylamine, on the other hand,
were never detected. Other BA, like putrescine, histamine and cadaverine sporadically occurred in
values of respectively 0 – 15, 0 – 5 and 0 – 12 mg/kg. Another peculiar observation was that the
average BA-values in olives were lower at the expiry date than on day 0, which indicates that BA
might be broken down during prolonged storage. This can, however, not be concluded with full
certainty, because two separate samples were used on the two timepoints of analysis.
Finally, the BA-concentrations in Sauerkraut clearly show that in this type of product much higher
BA-values occured than in olives. Putrescine was by far the most dominant BA in sauerkraut, as it
appeared in the highest concentrations (6 – 441 mg/kg) and in all samples. All other BA occurred in
considerably lower amounts and based on the mean values, BA-values diminished from tyramine to
cadaverine, histamine, β-phenylethylamine and tryptamine. As for the difference between the
timepoints of analysis: most mean values had not changed considerably at the end of storage
compared to day 0. For β-phenylethylamine, histamine and cadaverine, slight increases were
observed, while tyramine and putrescine have shown diminished BA-concentrations.
4.5.2 Chocolate
Both white, brown and dark chocolates were analysed. Brown and dark chocolate were both
categorized as “dark chocolate”. Looking at these BA-concentrations, it is clear that only brown and
dark chocolate seems prone to BA-formation. Samples of dark chocolate contained detectable
amounts or all BA, but all concentrations remained fairly low, with tyramine reaching the highest
values (0 – 29 mg/kg). White chocolate contained almost no detectable amounts of BA whatsoever
(only one sample showed detectable amounts).
4.5.3 Beer
In this food group, the aim was to analyse beers brewed by local breweries, as it was assumed that
larger industrial breweries already implement sufficient control measures in order to limit any health
hazards in their products. An overall view on BA-values in beer led to the impression that the
presence of BA decreased in the following sequence: tyramine > putrescine > histamine > cadaverine
> β-phenylethylamine > tryptamine. In general, BA-concentrations were low in beer, with a maximal
detected amount of 67 mg/kg for tyramine. Toxicologically, beer should thus be of no concern,
unless consumed in excessive amounts.

58
Further comparison of the different subcategories in beer gives interesting results. Firstly, in all
subcategories, putrescine was present in comparable amounts. The content of other BA, however,
differed. Firstly, in amber beers, except for putrescine, all other BA were undetectable (although one
sample contained histamine and tyramine). In light beers (or lagers), putrescine was again the most
widely present. Tyramine, histamine and cadaverine were also present in some samples, usually in
much higher amounts (13-67 mg/kg) than the average putrescine concentration (5 mg/kg). In dark
beers, the main presence next to putrescine was tryptamine, a BA unique for this subcategory.
Concentrations of tryptamine were comparable to those of putrescine when present. In home-
brewed beers, putrescine was the only BA detected. And lastly, fruitbeers contained the most varied
spectrum of BA. Not only were the putrescine values slightly higher in this subcategory, but it was
also no longer the principle BA in this class. On the contrary, tyramine, cadaverine and histamine
were widely present in this group, in values of 0 – 64, 0 – 52 and 0 – 29 respectively.
4.5.4 Meat products and preparations
These BA-concentrations have already been described under 4.3 Screening of meat products.
4.5.5 Dairy
4.5.5.1 Yoghurt
As can be seen from the mean BA-values in appendix 15, yoghurt contained practically no BA. The
maximum BA-value over all yoghurts was a concentration of 6 mg/kg, reported for tyramine.
4.5.5.2 Cheese
In contrast with yoghurt, the subgroup of cheese is much harder to describe. There are fewer clear
trends visible here than in other food groups. During the screenings of soft cheeses, usually only very
low or undetectable BA-concentrations were recorded (only 9 samples showed contents higher than
50 mg/kg). On the other hand, when detectable amounts of BA occurred, their values were
sporadically very high (904 mg/kg for cadaverine!). Generally, data showed that there was not really
one or 2 characteristic BA in soft cheese. Only tryptamine and β-phenylethylamine did not really
occur often in this subgroup. On the other hand, marked amounts of different BA are usually found in
the same samples, showing that BA-formation strongly depends on the type of cheese. Another
observation is that BA-contents were always higher at the end of storage (timepoint B) than at the
start (timepoint A), indicating that fermentation goes on during storage.
The subgroup of half-hard cheeses showed a slightly different BA-pattern than the soft cheeses. For
starters, the maximal concentrations were much higher in this class, indicating a further ripening
stage at purchase. Tyramine, in particular, reached some excessive values (726 and 1029 mg/kg!)
and also a larger fraction of samples contained more elevated BA-concentrations than in the soft
cheeses. Also, putrescine was less represented in this subgroup than in soft cheeses, but β-
phenylethylamine occured more in this class. High BA-concentrations are again mainly concentrated
per product and B-values are again higher than A-values.
When comparing the hard cheeses to the half-hard and the soft cheeses, it is again clear that a
longer ripening time results in higher BA-concentrations, as mean values were higher in hard cheeses
compared to the previous classes. In this subgroup, tyramine and cadaverine seemed most important
and one excessive histamine value (1025 mg/kg) was detected, which would undoubtedly cause
health problems. Looking at the evolution in time, in this subgroup it can no longer be said that BA-

59
concentrations were clearly higher at the end of storage. Apparently, when the ripening time is
sufficiently long, most BA are already formed at the moment of sale in the supermarkets and no
significant BA-formation occurs anymore during storage (similar statements have been made for
fermented sausages and dried and cured hams: vide supra).
The BA-concentrations in blue cheese were more concentrated around one BA, being tyramine.
Some extreme values were reached for this BA (5 in 16 samples > 300 mg/kg and 2 samples above
1000 mg/kg). Other BA were less important in this subgroup. Also, looking at the evolution of BA in
individual samples, no real conclusion can be drawn for this class. For some BA, the concentrations
were lower after storage, some others were higher.
Overall conclusions for cheese are that tyramine and histamine were the most important BA in terms
of concentration level. Furthermore, also cadaverine and putrescine sometimes came forward.
Generally speaking, cheese is a food group with a wide variety of BA, and quite high values compared
to the previously mentioned groups. Looking at the toxicity, the food groups described above never
really showed a high potential for causing health problems. In cheese, however, this story changes. In
terms of tyramine, there should only be a problem for people taking classical MOAI-drugs, which is
the same as described for the other food groups. Considering a portion size of 25 to 50 g of cheese,
values of at least 12000, 6000 and 120 mg/kg should be present to cause toxic symptoms for
tyramine in respectively healthy people, people taking new MOAI-drugs and those taking classical
MAOI-drugs. For histamine, however, considering the same portion size, concentrations of 160, 800
and 2000 can cause respectively light, moderate and severe toxic symptoms. In total, 3 cheeses (out
of 86) showed values higher than 160 mg/kg (and under 800 mg/kg) and one value over 800 mg/kg
was recorded, from which it can thus be concluded that in cheese, some toxicological risks may be
present. On the other hand, considering the amount of cheeses which were analysed, 4 cheeses with
potential for intoxication does not result in a very high risk, but compared to the other food groups,
in which no such risks seemed to exist, this is a big difference.
4.6 STATISTICAL ANALYSIS
4.6.1 PART 1: T-tests fermented vs. non-fermented and animal vs. plants
In this part, the p-values resulting from the independent t-tests comparing fermented and non-
fermented food products and animal or plant-based products will be discussed in order to see if any
significant difference could be detected. Table 34 gives an overview of how the food products were
distributed in the first summarizing datasheet (cfr. 3.3.2). Note again that for the analysis of B-data or
BA-evolutions, the 32 non-fermented plant-based products were excluded, yielding slightly different
distributions than the one depicted below.
Table 34: Distribution of the food products over the factors "fermented/non-fermented" and "animal/plant" for the t-tests on BA-data on day 0. A similar table can be generated for the B-data or the BA-evolutions by eliminating the 32 non-fermented plant samples.
Animal Plant Total
Fermented 127 182 309 Non-fermented 84 32 116
Total 211 214 425
The boxplots, generated for this part of the statistical analysis can be found in appendix 16. Next,
tables 35 to 38 below show the p-values resulting from the independent t-tests. Looking at table 35,

60
it can be seen that at day 0 (timepoint A) the concentrations of 3 BA (tryptamine, putrescine and
tyramine) differed significantly between animal and plant-based products. The corresponding
boxplot shows that, at this point in time, plant-based products usually showed higher BA-
concentrations than animal products. Next, at the end of storage (timepoint B), the pattern shifts
slightly and 4 BA were significantly different. In the boxplots it can be seen that the BA-
concentrations for animal products have increased during storage, which presumably caused the
shift in significant differences. The evolutionary boxplot for animal vs. plant, showing positive
evolutions for putrescine, cadaverine and tyramine, for animal products, supports this statement.
Also, overall, the evolutions in BA were larger in absolute value in animal products than in plant-
based products, which could be explained by the fact that animal products contain higher
percentages of protein (see literature study). A more likely explanation here, however, is that for the
evolutionary analyses, all plant-based products were stable products (after exclusion of 32 non-
fermented samples) for which little BA-evolution occurred. P-values presented in table 35 show that
the differences in evolutions were significant for all BA.
Table 35: Adjusted p-values for independent two-sample t-tests comparing animal vs. plant-based products (significance level of 5% was used). Significant p-values are expressed in bold.
Biogenic amine A B EV
p-value p-value p-value
Tryptamine 0.01 0.52 <0.001
Β-phenylethylamine 0.11 0.04 0.04
Putrescine <0.001 <0.001 <0.001
Cadaverine 0.08 0.01 <0.001
Histamine 0.07 0.52 0.03
Tyramine 0.01 <0.001 <0.001
Table 36 was used to study the differences in BA-profile between fermented and non-fermented
food products. From this table, it can be concluded that already at day 0 (timepoint A), all BA-
concentrations differed significantly between these classes, with fermented products containing
significantly higher values than non-fermented products (cfr. figure 24 in appendix 16). This seems
logical, knowing that fermentation yields BA. Next, at the end of storage (timepoint B), it can be seen
that several of the significant differences (for tryptamine, cadaverine and tyramine) have
disappeared. Again, this is no surprise, considering the BA-formation happening during spoilage of
fresh products (cfr. literature study), versus the assumingly stable BA-concentrations in fermented
products once fermentation has finished (cfr. 3.1.2). The boxplot at timepoint B and the evolutionary
boxplot confirm this reasoning, clearly depicting increasing BA-concentrations in non-fermented food
(tryptamine, cadaverine, putrescine and tyramine) and also showing significantly higher increases in
non-fermented versus fermented food products.
Table 36: Adjusted p-values for independent two-sample t-tests comparing fermented vs. non-fermented products (significance level of 5% was used). Significant p-values are expressed in bold.
Biogenic amine A B EV
p-value p-value p-value Tryptamine <0.001 0.17 0.01 Β-phenylethylamine <0.001 0.02 0.42 Putrescine <0.001 <0.001 0.27 Cadaverine <0.001 0.68 0.01 Histamine <0.001 <0.001 0.04 Tyramine <0.001 0.13 0.02

61
In table 37, the differences between fermented and non-fermented plant-based products are
represented. From these p-values, a different picture than from table 36 arises. As such, it can be
seen that only for tryptamine, the difference in concentration was significant, while when animal and
plant base products were analysed together, the concentrations of all BA were significantly different.
Table 37: Adjusted p-values for independent two-sample t-tests comparing fermented vs. non-fermented products within plant-based products (significance level of 5% was used). t-tests for the end-of-storage data and the evolutionary data could not be performed (cfr. 3.3.3). Significant p-values are expressed in bold.
Biogenic amine A
p-value
Tryptamine 0.03
Β-phenylethylamine 0.17
Putrescine 0.68
Cadaverine 0.17
Histamine 0.17
Tyramine 0.78
Lastly, some remarkable conclusions can be drawn from table 38, presenting the p-values for the
differences between fermented versus non-fermented animal products. As such, it can be seen that
within animal products, BA-concentrations nor evolutions in BA-concentrations differed significantly
between fermented and non-fermented foods, which again seems contradictory to the overall
conclusions on the comparison of fermented and non-fermented products (table 36). Apparently,
fermentation is a more important process in plant-based than in animal products in terms of causing
differences in BA-concentration.
Table 38: Adjusted p-values for independent two-sample t-tests comparing fermented vs. non-fermented products within animal products (significance level of 5% was used). Significant p-values are expressed in bold.
Biogenic amine A B EV
p value p Tryptamine 0.10 0.56 0.50 Β-phenylethylamine 0.39 0.16 0.50 Putrescine 0.39 0.56 0.82 Cadaverine 0.99 0.56 0.56 Histamine 0.39 0.56 0.50 Tyramine 0.10 0.16 0.82
4.6.2 PART 2: ANOVA-tests for difference between food groups
In this part, the results of the ANOVA-test, comparing different food groups on their BA-content are
presented. First of all, preliminary testing for homogeneity of variances showed that for all BA, the
variances within each food group were not homogenous (all p-values were <0.001). Therefore,
conclusions were based on the outcomes of the Welch F-tests and the Games-Howell tests, rather
than the ANOVA- and the Bonferroni-tests.
The Welch F-test, comparing the means among the five food groups resulted in p-values indicating
significant differences in BA-concentrations between the food groups for both the analysis on A-data
and B-data (at day 0 and the expiry date respectively). The Welch test for the evolutionary data did
not run, because of zero-variances for one of the food groups (beer). Therefore, to define differences
in BA-evolutions, only the results of the pairwise comparisons (Games-Howell) were consulted (see
further).

62
Now before discussing the results of these pairwise comparisons, figures 18 and 19 show the BA-
concentrations in the different food groups on day 0 and at expiry date respectively. At first sight,
both graphs do not seem to differ much. Nevertheless, looking closer, some slight differences can be
noticed, like for instance an increase in tyramine and putrescine for meat. Note that the mean BA-
concentrations of F&V should not be compared between these two figures to conclude on
evolutions, because in figure 19, F&V contained only olives and sauerkraut (32 fresh samples were
not included (see 3.3.3)) while in figure 18, the whole F&V-group is depicted. It can also be observed
in figures 18 and 19 that the BA-profile is clearly different in the different food groups. Another
observation, judging from the length of the error bars, is that the variability in BA-concentration is
quite substantial and often larger than the mean BA-value itself. This illustrates clearly the
importance of the mean comparison tests to indicate the significance of the differences in BA-
concentrations between the different food groups.
The p-values resulting from these mean comparisons for A- and B-data are represented in tables 61
and 62 in appendix 17. Combining these tables with figures 18 and 19 led to the following
observations. Firstly, as tryptamine and β-phenylethylamine were presented in significantly higher
concentrations in chocolate than in most other food groups, these BA can be considered
characteristic for chocolate (although some significances disappeared at the end of storage).
Secondly, putrescine is clearly characteristic for F&V, as this BA was significantly more present in this
food group and retained this property compared to all food groups (except for beer) until after
storage. A third observation is that the concentrations of cadaverine and tyramine did not differ
significantly between most food groups (most p-values were non-significant). Cadaverine was also
the most predominant in F&V and dairy. Histamine is also highly represented in F&V (and also in
dairy), but notice that if fish products were included in these analyses, it's mean histamine value
might have been important as well (consider the histamine-levels detected during these storage test
for tuna (see 4.2.1)). Lastly, studying the profile of tyramine among the food groups, it should be
noted that this profile is the most dynamic among the different BA. As such, at day 0, dairy and
chocolate contained the highest mean tyramine concentrations, but after storage, a rise in tyramine
concentration in and meat changed up the pattern of p-values and meat became the most prominent
food group for tyramine.
Figure 18: Comparison of the BA-concentrations in the different food groups at day 0 (A-data).
0,00
0,50
1,00
1,50
2,00
log(
BA
-co
nce
nra
tio
n +
1)
Fruit and Vegetables
Chocolate
Beer
Dairy
Meat

63
Figure 19: Comparison of the BA-concentrations in the different food groups at expiry date (B-data). As 32 non-fermented fruit and vegetable samples were eliminated when creating this graph, F&V contain only olives and sauerkraut.
Next, figure 20 shows the evolution in BA-concentration during storage in the different food groups.
For this figure, it should be noted that beer and chocolate were not included, because these products
were only screened at day 0. Also, again the evolutions for F&V depicted in this graph should not be
linked with the two graphs discussed above, as the non-fermented F&V were removed from the B-
and evolutionary data (vide supra).
Looking at figure 20, the overall the evolutions of the BA-concentrations can be judged very small
(amounting to only several mg/kg usually). The variability in evolutions, however, is again quite
substantial, compared to the mean evolutions. Next, it is clear that the evolution in BA-values clearly
differed between different food groups: in F&V (olives and sauerkraut) 4 of the 6 BA showed
decreasing mean values, dairy-products usually showed only slight positive evolutions and in meat
products all BA increased in concentration during storage. Moreover, these increases were far more
substantial than in dairy. Considering these observations, the results of the mean comparisons (table
63 in appendix 17) looking for significantly different evolutions, were as can be expected. Significant
differences in evolutions were only found for meat products compared to all other classes. For β-
phenylethylamine and histamine, no significant differences could be found. It should also be noted
that, although decreasing evolutions are presented in figure 20for F&V, the BA-concentrations in the
excluded fresh samples did increase. And finally, it can also be stated that the sharp positive
evolution in tyramine for meat products agrees with the previous observation in figures 18 and 19.
0,00
0,50
1,00
1,50
2,00
2,50 lo
g(B
A-c
on
cen
trat
ion
+ 1
) Fruit and Vegetables
Chocolate
Beer
Dairy
Meat

64
Figure 20: Evolution of the BA-concentrations in several food groups during storage. As 32 non-fermented fruit and vegetable samples were eliminated when creating this graph, F&V contain only olives and sauerkraut.
4.6.3 PART 3: Correlation analysis
This part will comprise firstly the discussion of the correlations between BA and FAA. Secondly, the
correlations between BA and microbial data will be explained. Notice that for the meat products and
preparations, the relationships between FAA, BA and microbial data have already been debated
under subsections 4.2 and 4.3.
For all correlation analyses, correlation triplots will serve as a means to represent the results of the
RDA. In these figures the explanatory variables (FAA, microbial counts and factors fermented/non-
fermented and animal/plant) will be shown as vectors, while the response variables (BA) are
depicted by red dots. Black circles will represent the individual objects of analysis, in this case the
food products. Also, in a correlation triplot, the correlations between two variables can be judged by
the angle between the corresponding vectors since the cosine of the angle between two vectors
represents the correlation value. As such, the sharper the angle, the stronger the correlation. 90°
angles indicate a non-existent correlations and angles >90° indicate inverse correlations (44; 52; 53).
4.6.3.1 Correlations FAA and BA
In this part, the goal was to investigate whether higher amounts of FAA at day 0 result in higher BA-
concentrations at the end of storage or in greater BA-increases during storage. When studying these
relationships, it is first of all important to know what was expected. As such, in products in which BA
are formed during storage, the FAA measured at day 0 represent the BA-precursors. Hence in these
products a correlation between FAA and BA was expected. However, if no correlation between a BA
and its precursor could be found, this can be explained by a degree of proteolysis still occurring
during storage, generating new FAA not measured on day 0. On the other hand, in products which
are considered microbially stable (chocolate, salami, dried and cured ham,...), the FAA at day 0
represent what FAA are left after BA-formation during fermentation or ripening. As these values do
not represent precursors anymore, the data for food products only analysed at day 0 were
eliminated (cfr. materials and methods).
-0,8
-0,6
-0,4
-0,2
0
0,2
0,4
0,6
0,8
1
1,2
log(
BA
-co
nce
ntr
atio
n +
1)
Fruit and Vegetables
Dairy
Meat

65
The results of the RDA-analysis for this part of the statistics are displayed in figures 30 and 31 in
appendix18 showing the triplots for the B-data and the BA-evolutions respectively. Next to the
triplots, also the results of the MLR are given in table 64 in appendix 19.
When analysing these results, there was a specific search for correlations between the BA and their
precursing FAA. As such, from figure 30 it can be noticed that the strongest positive correlations
were present between histamine and histidine and β-phenylethylamine and tyrosine. For all other
BA-FAA couples, the angels between the BA-point and the FAA-vector were wider, even > 90° for
tryptophane and tryptamine. Nevertheless, the p-values in table 65 show that for each BA, the MLR
extracted their precursor as being a significant explanatory variable, which leads to the conclusion
that BA-concentrations at the end of storage are indeed linearly correlated to the FAA-
concentrations. The correlation between tryptophane and tryptamine were negative though.
Out of figure 31, resulting from the RDA for the BA-evolutions, no conclusions can be formulated
with regard to the correlations between the variables, because the BA are all centred around the
origin. This can be explained by the limited extent of variability in the BA-evolutions. Looking at the
results of the MLR instead shows that for the BA-evolutions, the correlations between BA and FAA
were practically non-existent. Only for tryptamine, the MLR designated its precursor as a significant
explanatory variable.
Finally, looking at the correlations of BA with the factors fermented/non-fermented (F/NF) and
animal/plant, it can be noted that these factors only play a significant role for a limited selection of
BA. When F/NF was designated as correlating significantly with the BA-values, this should be
interpreted as fermentation resulting in a significantly higher amount of that BA (or in a significant
positive evolution). As such, fermentation seems to have played a role for tryptamine, β-
phenylethylamine and cadaverine (both B-data and evolutionary). If F/NF was not extracted by the
MLR, it should simply be concluded that whether or not the product was fermented did not play a
significant role raising the level of that BA.
The factor animal/plant was also extracted several times by the MLR, designating correlations with
some BA. For the tyramine-concentrations at the expiry date, the correlation was positive, while all
other significantly found correlations were negative. Positive correlations meant that animal
products contained a higher level of a certain BA than plant based products, while negative
correlations meant the reverse. Non-significant correlations just meant that the origin of the product
did not seem to play a role for the concentration (or evolution) of that specific BA.
4.6.3.2 Correlations microbial counts and BA
The central question in these analyses was if a higher count of MO on a certain product correlates
with a higher concentration of certain BA, which could be expected in the knowledge that bacteria
are the BA-producers in food and that sterile products remain BA-free (cfr. literature study).
4.6.3.2.1 Fruit and vegetables
For this food group, correlations were sought for total bacterial count (PCA), LAB (MRS), Enterococci
(SB) and Enterobacteriaceae (RE) (see table 7). Pseudomonas-counts were left out because of an
excessive fraction of missing values. Figures 32 and 35 in appendix 18 and table 65 in appendix 19
represent the results of the RDA and MLR executed for the microbial correlations in F&V. First of all,
looking at figure 32, it could be concluded that some significant correlations might be found between
cadaverine and LAB, between putrescine and total bacterial count or between tryptamine and the

66
factor fermented/non-fermented. Indeed, the result of the MLR did show these relationships. On the
other hand, not many explanatory variables were appointed as being significantly related to the end-
of-storage BA-concentrations.
The correlation triplot for the BA-evolutions (figure 35) shows that cadaverine is strongly (and
positively) correlated with Enterococci counts (SB) and with total bacterial count, LAB and
Pseudomonas as well. Also, putrescine seems to have been positively correlated with Pseudomonas,
Enterococci, LAB and total count. Indeed, table 66 confirms these presumptions, although the
significance for Pseudomonas is missing. Out of these results it can now be concluded that for F&V,
the BA-concentrations (both end-of-storage and evolutions) were generally not very strongly
correlated with the microbial counts. Only for the evolution in putrescine and cadaverine
concentration, the MLR detected multiple bacterial groups as significant explanatory variables, while
for the other BA, not many correlations were found.
4.6.3.2.2 Dairy
For this food category, instead of Enterobacteriaceae, the Pseudomonomas counts were included in
the analysis (for the same reason as before), next to total bacterial count, Enterococci and LAB.
Figures 33 and 36 in appendix 18 represent the results of the RDA performed for this food group,
while table 67 in appendix 19 presents the MLR-models generated.
Having a look at the MLR-results first immediately shows that for this food class, even less microbial
factors were appointed as significantly explanatory for the BA-concentrations (or evolutions).
Enterobacteriaceae (RE) were the bacterial group extracted most often in relation to the end-of-
storage BA-contents. The corresponding correlation triplot indeed shows sharp angles between this
explanatory variable and several BA. However, it also shows a close proximity of the other bacterial
groups to the BA, yet MLR did not detect these variables as being significantly explanatory.
4.6.3.2.3 Meat
For this last food group, the microbial variables which were analysed were total bacterial count, LAB,
Enterococci, Staphylococci and Enterobacteriaceae (Pseudomonas was left out again). Again the
results of the RDA's are presented in appendix 18 (figures 34 and 37) and in appendix 19 table 67
shows the models generated by MLR.
A first thing that can be noticed is that the triplot for the B-data in this food group is very similar to
the one for the dairy group, indicating that the correlational pattern in both food groups should be
similar. Looking at table 68, however, shows that MLR mostly did not appoint the same explanatory
variables as being significant. Overall, for the meat category, more microbial variables were
designated as significant explanatory variables by MLR than in dairy or F&V, indicating that the
correlation between the BA-concentrations (both end-of-storage and evolutionary) and the presence
of bacteria is stronger.
4.6.3.2.4 Overall conclusion on microbial correlations
Overall, it can thus be stated that correlations between MO-counts BA-concentrations at the end of
storage (or BA-evolutions) were generally not that strong. Also, comparing the different food groups,
correlations were the strongest in meat-based products. And lastly, a final look at tables 65 to 67
shows that no bacterial agar medium stands out as being extracted more often by the MLR than the
others. Therefore, no type of bacteria could be appointed as showing stronger correlations to the BA
than other MO.

67
5. CONCLUSIONS
The conclusions for this master dissertation can be subdivided in three parts, discussing first the
results of the storage tests. Then the outcomes of the screening tests can be described and finally the
statistical results will be explained.
The results of the storage test on tuna showed that in these samples, histamine was detected as the
most prominent BA. In samples which were misused (non-refrigerated samples) the histamine-
concentrations reached excessive, and undoubtedly toxic concentrations. In marinated pork and
other marinated meat types, tyramine and cadaverine came forward the most dominant BA. It was
also found that from these products, regular people (not taking classical MAOI-drugs) should not
experience any harmful effects. Next, both for tuna and marinated meat, the conclusion was made
that MAP-packaging and refrigeration are effective techniques to suppress BA-formation, which
agrees with literature (1; 8; 10; 54). In tuna, refrigeration even proved to be essential to limit the
formation of toxic levels of histamine. Effects on microbial growth were similar and agreed with the
observations in the BA-profile, knowing that MO are the producers of BA.
Looking at FAA as the precursors for BA and assuming that larger amounts of FAA should result in
higher concentrations of BA, the conclusion for tuna was that the FAA- and the BA-profile matched
nicely. In marinated pork, or the other meat types for that matter, this kind of agreement was not
found. Better agreements were found for the microbial profile, as both in marinated meat and in
tuna the bacteria detected in the highest counts matched the most prominent BA.
A final conclusion drawn from the storage tests concerns the possible camouflage of toxic BA-levels
by preparation of the meat. For this matter, it should be noted that no marinated meat sample was
observed to contain BA-levels toxic to healthy individuals, so a judgement on masking of this health
hazard could not be made. Spoilage by microorganisms, however, which might also bring about some
health risks (foodborne pathogens), was considered to be camouflaged to some extent in all meat
types, certainly in MAP-packaged and refrigerated products.
The results of the screening tests of the meat products and preparations led to the following
conclusions. First of all, tyramine appears as a constant predominant BA in all types of meat-based
products. Notable appearances of other BA differed greatly between the different types of meat
products and preparations. In fermented sausages, for instance, putrescine was the second most
predominantly occurring BA, next to tyramine. In dried and cured hams and in meat preparations,
also cadaverine and tryptamine came forward. Within fermented sausages, also the difference
between salami and dried sausage, owing to the use (or abscence) of a starter culture became clear
in both the BA- and the microbial profile. Next, in agreement with the storage tests for marinated
meats, agreement between the FAA- and the BA-profile was limited for all categories. In fermented
or cured meat products, this was explained by a process of BA-formation before purchase during
fermentation or ripening, while in more perishable products this non-agreement was attributed to
proteolysis during storage. It was also evidenced, however, that the type of product might be a more
important factor in the FAA-BA relationship. Nevertheless, these indications have important
implications with respect to the development of FSMS. Finally, contrary to the FAA-profile,
agreement between the microbial counts and the BA-concentrations were more obvious and
differences in microbial profiles between the different meat-base products (and by consequence also
the BA-profile) could be explained by differences in production methods.
68
Screening tests conducted on other food groups showed that BA-profiles differed greatly between
all 5 groups and that to some food categories, characteristic BA could be assigned. β-
phenylethylamine, for instance, was the main BA in chocolate. Another important observation was
the large variance in BA-concentrations even within food groups. Toxicologically, it could be
concluded that most classes did not pose a considerable health threat according to currently
available toxicological data. Only in cheese, 4 (out of 86) samples were found to contain toxic levels
of histamine. Combining this with the results of the storage test for tuna, it can be stated that the
observations match literature stating that fish and cheese are the most important food groups
causing histamine intoxication.
Next, the results of the independent t-tests, investigating the effects of fermentation and the origin
of the food product (animal or plant-based), showed that significant differences in BA-concentration
were detected between animal and plant-based products for half of the BA. The increase in BA-
concentrations during storage was significantly higher in animal products than in their plant-based
counterparts, a feature which can mainly be explained, though, by the larger fraction of stable
products in the plant-based group. Comparison of fermented versus non-fermented food products
showed that fermentation leads to significant differences in BA-content compared to non-fermented
products at the moment of purchase, but that due to microbial growth, causing BA-production in
non-fermented products, some of these significant differences disappeared after storage. Also
remarkable was that when splitting the data in animal and plant-based products, the earlier detected
significant differences between fermented and non-fermented products did not occur anymore.
The mean comparisons of the different food groups showed (as observed before) that the BA-profile
is clearly different in different types of food, and some BA can be considered characteristic for
certain food groups, like for instance tryptamine and β-phenylethylamine in chocolate. Other BA are
less characteristic and occur in statistically equal amounts in practically all food groups analysed,
such as cadaverine and tyramine. An important note here, however, is that the extent of variability in
BA-concentrations in each food group was that large that the conclusions sketched here for the
mean BA-concentrations might not be valid for individual or smaller groups of samples.
And finally, during the correlation analysis for FAA, significant correlations were found for all BA
between the BA-concentrations detected at the expiry date and the FAA measured at day 0. Using
the evolutions in BA during storage, however, the resulting correlations were less strong. Thus it is
only with caution that the statement can be made that higher levels of BA at day 0 might result in
higher levels of BA at the end of storage. Future investigations should confirm this message. Next,
the correlation analyses for microbial data showed that only limited correlations could be found
between several groups of bacteria and BA-concentrations or -evolutions and that the correlations
appeared stronger in the group of meat-based products, than in dairy of F&V. Lastly, no bacterial
groups came forward as being more correlated with the BA than the others.

69
6. FUTURE INVESTIGATIONS
Following the completion of this master dissertation, the database gathered before and during this
thesis on the occurrence of BA in different food groups and products should be used to perform an
exposure assessment (and subsequently a risk assessment) following the steps proposed under 2.7
exposure and risk assessment. The data gathered during the Belgian food consumption survey of
2014 (55) might function as consumption data for this exposure calculation. Next, after calculation of
exposures to the detected BA, performing a risk assessment would require sufficient toxicological
data, which is where still a major gap lies. Currently available data carries insufficient information on
the toxic level (NOAEL) of the different BA, the associated toxic concentrations in several food
groups/products (in mg/kg), the potentiating effect of putrescine and cadaverine, the effect of
process and environmental parameters on BA-formation, etc. Data which do exist usually originate
from long outdated studies. As such, before any meaningful risk assessment can be made, new and
detailed research projects investigating these topics should be elaborated.
Another task yet to be performed is the characterisation of the microbial flora detected on the
screened food products. For this purpose, agar plates of MRS, SB and PA were preserved in the fridge
for samples containing sufficient amounts of BA (values >100 mg/kg1 for any BA) and they will be
sent to a specialized research unit. This will result in a more in depth view on the species present on
the screened food products, information which can then, in consultancy with literature, be linked to
their BA-content.
Also, although the BA-contents in fish are already well characterized by literature, it would be
interesting to finish the screening tests for the food group of fish and fish products as well, as they
were originally a part of the sampling plan. Those data will be more representative for the Belgian
food market and will thus yield a more representative risk assessment for the Belgian population.
Moreover, literature proves that histamine from fish forms an important health risk, frequently
causing food intoxications, which is an additional reason to characterize this risk for the Belgian food
market as precisely as possible.
Some other useful additions to the results of the storage and screening tests could also be made. For
instance, the influence of the packaging atmosphere (O2 and CO2 -concentrations) and the pH of the
samples on the BA-profile could be investigated for instance by finding correlations between the data
recorded during this project. Results of such investigations would be very useful in the optimalisation
of MAP-packaging techniques. The influence of different preparations methods within a certain type
of food product - think about the different marinades on the meat used during the second storage
test or the different production methods of cooked hams - should be investigated as well.
A final suggestion for future investigation concerns the correlation between FAA and BA. The RDA
and MLR performed during the statistical analysis appointed a possible correlation between these
two parameters, yet the correlations were only determined on a wider scale and no distinction was
made between the different food groups. Therefore, additional correlation analyses should be
executed, during which the database should be split up into different food groups. These studies
might then confirm the significant correlations found during this thesis. Or they might reject them,
which would be an equally interesting outcome.
1 The treshold of 100 mg/kg was based on the legal limit of 100 mg/kg, set by Europe for certain fish products (see literature
study). This value is evidently not ideal, because it cannot be representative for other BA than histamine or other food groups than fish, but is was used nevertheless because it was the only guideline available.
70
7. REFERENCES
1. Scientifi Opinion on risk based control of biogenic amine formation in fermented foods. (BIOHAZ),
EFSA Panel on Biological Hazards. 9 (10), 2011, EFSA Journal, Vol. 2011, p. 2393.
2. Demeulenaer, B., Devlieghere, F. and Jacxens, L. Projectvoorstel BIOGAMI. Brussel : FOD
volksgezondheid, 2013.
3. EC. General Food Law. [Online] 2015.
http://ec.europa.eu/food/safety/general_food_law/index_en.htm.
4. —. Food Law General Principles. [Online] 2015.
http://ec.europa.eu/food/safety/general_food_law/principles/index_en.htm.
5. Measuring the safety of the food chain in Belgium: Development of a barometer. Baert, Katleen, et
al. 44, 2011, Food Research International, Vol. 2011, pp. 940-960.
6. Food safety issues in fresh produce: Bacterial pathogens, viruses and pesticide residues indicated as
major concerns by stakeholders in the fresh produce chain. Van Boxstael, S., et al. 32, 2013, Food
Control, Vol. 2013, pp. 190-197.
7. A review: Current analytical methods for the determination of biogenic amines in foods. Önal,
Armagan. 103, 2006, Food Chemistry, Vol. 2007, pp. 1475-1486.
8. Biogenic amines: their importance in foods. Silla Santos, M.H. 29, 1995, International Journal of
Food Microbiology, Vol. 1996, pp. 213-231.
9. Biogenic amine en polyamine contents in meat and meat products. Hernandez-Jover, Teresa, et al.
45, 1997, Journal of Agricultural Food Chemistry, Vol. 1997, pp. 2098-2102.
10. Biogenic amines in dry fermented sausages: a review. Suzzi, Giovanni and Gardini, Fausto. 88,
2003, International Journal of Food Microbiology, Vol. 2004, pp. 41-54.
11. Biogenic Amine and Polyamine Contents in Meat and Meat Products. Hernandez-Jover, Teresa, et
al. 1997, Journal of Agricultural Food Chemistry, pp. 2098-2012.
12. Biogenic amines in meat and meat products. Ruiz-Capillas, Claudia and Jiménez-Colmenero,
Francisco. 44, 2004, Food Science and Nutrition, Vol. 2004, pp. 489-499.
13. Biogenic amines in foods: Histamine and food processing. Bodmer, S., Imark, C. and Kneubühl,
M. 48, 1999, Inflammation Research, Vol. 1999, pp. 296-300.
14. Chhabra, Namrata. biochemistryformedics. [Online] 2015. [Cited: 20 12 2015.]
http://usmle.biochemistryformedics.com/histidine-to-histamine-conversion/.
15. Tutor. Sequence determination. [Online] 2015. [Cited: 20 September 2015.]
http://www.tutorhelpdesk.com/homeworkhelp/Biochemistry-/Sequence-Determination-
Assignment-Help.html.
16. Ladero, Victor, et al. Toxicological effects of dietary biogenic amines. Villaviciosa, Asturias, Spain :
Instituto de Productos Lacteos de Asturias.

71
17. The vascular effects of trace amines and amphetamines. Broadley, Kenneth J. 125, 2010,
Pharmacology and therapeutics, Vol. 2010, pp. 363-375.
18. Histamine and histamine intolerance. Maintz, Laura and Novak, Natalija. 85, 2007, The American
Journal of Clinical Nutrition, Vol. 2007, pp. 1185-1196.
19. Biogenic amines and their production by microorganisms in food. Halasz, Anna, et al. 5, 1994,
Trends in Food Science and Technology, Vol. 1994.
20. EC, The Commision of the European Communities. Commision Regulation (EC) No 2073/2005.
2005.
21. A review of dietary polyamines: Formation, implications for growth and health and occurence in
foods. Kalac, Pavel and Krausova, Petra. 90, Food Chemistry : s.n., 2005, Food Chemistry, Vol. 2005,
pp. 219-230.
22. Biological significance of dietary polyamines. Larque, Elvira, Sabater-Molina, Maria and Zamora,
Salvador. 23, 2007, Nutrition, Vol. 2007, pp. 87-95.
23. Significance of biogenic amines to food safety and human health. Shalaby, Ali R. 29, 1996, Food
Reasearch International, Vol. 1996, pp. 675-690.
24. Muskid. Nitrosation. [Online] 2014. [Cited: 21 12 2015.]
https://en.wikipedia.org/wiki/Nitrosation#/media/File:Formation_N-Phenyl-nitrosamine.svg.
25. Influence of Processing Temperature on the Fromation of Biogenic Amines in Dry Sausages.
Majala, R. and Nurmi, E. 1995, Vol. 1994.
26. Microbial and chemical analysis of chihuahua chees and relationship to histamine and tyramine.
Diaz-Cinco, M.E., et al. 57, 1992, J. of Food Science, Vol. 1992, pp. 355-356.
27. Use of Staphylococcus Xylosis as a starter culturein dried sausages: effect on the biogenic amine
content. Gardini, Fausto, et al. 61 (3), 2002, Meat Science, Vol. 2002, pp. 275-283.
28. Degradation of histamine and Tyramine by Brevibacterium linens during Surface Ripening of
Munnster Cheese. Leuschner, Renata G.K. and Hammes, Walter P. 7, 1998, J. Food Protection, Vol.
1998, pp. 785-923.
29. Evaluation of biogenic amines and microbial counts thrghout the ripening of goat cheese from
pasteurized and raw milk. . Novella-Rodriquez, Sonia, et al. 71 (2), 2004, J. Diary Research, Vol. 2004,
pp. 245-252.
30. Influence of Hygienic quality of raw materials on biogenic amine production during ripening and
storage of dry fermented sausages. Bover-Cid, Srar, Izquieerdo-Pulido, Maria and Vidal-Carou,
Carmen M. 11, 2000, J. Food Protection, Vol. 2000, pp. 1467-1609.
31. Biogenic amine content in dry fermented sausages as influenced by a producer, spice mix, starter
culture, sausage diameter and time of ripening. Komprda, T., Sladkova, P. and Dohnal, V. 83, 2009,
Meat Science, Vol. 2009, pp. 534-542.

72
32. Lactic acid bacteria as functional starter cultures for the fermentation industry. Leroy, Frédéric
and De Vuyst, Luc. 15(2), 2004, Trends in Food Science & Technology, Vol. 2004, pp. 67-78.
33. Magan, N and Olsen, M. Mycotoxins in food: detection and control. Cambridge, England :
Woodhead Publishing, 2004.
34. Hazard identification and exposure assessment for microbial food safety risk assessment.
Lammerding, Anna and Aamir, Fazil. 58, Int.J. Food Microbiology : s.n., 2000, Int. J. Food
Microbiology, Vol. 2000, pp. 147-157.
35. Jacxsens, Liesbeth. Quality Management and Risk Analysis. Gent : Department of Food Safety and
Food Quality - Ghent University, 2015.
36. Boon, Polly, et al. Acropolise Deliverables. Acropolis - eu. [Online] July 2010. [Cited: 14 February
2016.] http://www.acropolis-eu.com/object_binary/o5158_Deliverable-
6.2TrainingMaterialsPrototypev2.pdf.
37. Aggregate exposure and cumulative risk assessment - integrating occupational and non-
occupational risk factors. Lentz, T.J., et al. 12 (sup1), 2015, Vol. 2015.
38. EPA. Framework for cumulative risk assessment. Washington DC : U.S. Environmental Protection
Agency, 2003.
39. EUROMIX. objectives. Euromix project. [Online] EU, 2015. [Cited: 14 februari 2016.]
https://www.euromixproject.eu/.
40. ACROPOLIS. Welcome to ACROPOLIS. acropolis eu. [Online] EU, 2009. [Cited: 14 februari 2016.]
http://www.acropolis-eu.com/.
41. Exposure Assessment Tools by Tiers and Types - Aggregate and Cumulative. EPA.gov. [Online] EPA
(United States Environmental Protection Agency), 11 November 2015. [Cited: 15 March 2016.]
https://www.epa.gov/expobox/exposure-assessment-tools-tiers-and-types-aggregate-and-
cumulative.
42. Dansylation of amino acids for high-performance liquid chromatography analysis. Tapuhi, Yizhak,
et al. 115, 1981, Analytical biochemistry, Vol. 1981, pp. 123-129.
43. A snapshot of the population structure of branchiostoma lanceolatum in the racou beach, france,
during its spawning season. Desdevises, Yves, et al. 4, 2011, PLOS one, Vol. 2011.
44. Legendre, P. and Legendre, L. Numercial Ecology. 2. Canada : s.n., 1998.
45. Devlieghere, Frank. Levensmiddelenmicrobiologie en -conservering. Brugge : die Keure, 2011. 978
90 4861 1911.
46. Uyttendaele, Mieke, et al. Microbiologische richtwaarden & wettelijke microbiologische criteria.
Gent : LFMFP-UGent, 2010.

73
47. Safety improvement and preservation of typical sensory qualities of traditional dry fermented
sausages using autochtonous starter cultures. . Talon, Régine, et al. 126, 2008, International Journal
of Food Microbiology, Vol. 2008, pp. 227-234.
48. Biogenic amines in finnish dry sausages. Eerola, H.S., Roig Sagues, A.X. and Hirvi, T.K. 18, 1998,
Journal of food safety, Vol. 1998, pp. 127-138.
49. Delhaize. Delhaize direct. [Online] 2016. [Cited: 20 may 2016.] http://shop.delhaize.be/nl-be/.
50. Heyn, Albert. Webshop albert heyn. [Online] 2016. [Cited: 20 May 2016.] http://www.ah.be/.
51. Carrefour. Carrefour drive. [Online] 2016. [Cited: 20 May 216.]
https://delivery.drive.be/nl/beenhouwerij-charcuterie/vlees/PID0/23313.
52. GustaMe. Gusta Me. [Online] 2016. [Cited: 21 May 2016.]
http://mb3is.megx.net/gustame/constrained-analyses/rda.
53. Multivariate analyses in microbial ecology. Ramette, Alban. 62, 2007, FEMS Microbial ecology,
Vol. 2007, pp. 142-160.
54. Control of Biogenic Amines in Food—Existing. Naila, Aisath, et al. Vol 75, nr 7, 2010, J. of food
science, Vol. 2010.
55. WIV-ISP. Nationale voedselconsumptiepeiling. [Online] 2016. [Cited: 10 mei 2016.]
https://fcs.wiv-isp.be/nl/SitePages/Introductiepagina.aspx.

74
8. APPENDICES
Appendix 1: Design of the 9-day storage test for marinated pork.
Day 0 Day 3 Day 5 Day 8 Day 9
Number of plates
Analyses Number of plates
Analyses Number of plates
Analyses Number of plates
Analyses Number of plates
Analyses
7 °C Pictures,
atmosphere, pH, BA, FAA, MO,
Sensorial
Pictures,
atmosphere, pH, BA, MO,
Sensorial
Pictures,
atmosphere, pH, BA, MO,
Sensorial
Pictures,
atmosphere, pH, BA, MO,
Sensorial
MAP / 2
2 2
AIR 2 2
2 2
22°C + 7°C Pictures,
atmosphere, pH, BA, MO,
Sensorial
Pictures,
atmosphere, pH, BA, MO,
Sensorial
Pictures,
atmosphere, pH, BA, MO,
Sensorial
MAP
2
2 2
AIR 2
2 2
22°C Pictures,
atmosphere, pH, BA, MO,
Sensorial
Pictures,
atmosphere, pH, BA, MO,
Sensorial
MAP
2 2
AIR 2 2
Total samples 2
12
4
8
8
Appendix 2: Design of the 9-day storage test for 3 types of marinated meat, stored at 7°C and MAP-packaged (70/30 O2/CO2).
Day 0 Day 3 Day 8 Day 9
Number of samples
Analyses Number of
samples Analyses
Number of samples
Analyses Number of
samples Analyses
2 chicken 2 beef 2 lamb
Pictures, atmosphere, pH, BA, FAA, MO,
sensorial
2 chicken 2 beef 2 lamb
Pictures, atmosphere, pH, BA, MO, Sensorial
2 chicken 2 beef 2 lamb
Pictures, atmosphere, pH, BA, MO, Sensorial
2 chicken 2 beef 2 lamb
Pictures, atmosphere, pH, BA, MO, Sensorial

75
Appendix 3: Reagents used during the chemical analyses.
Table 39:Reagents for the FAA-protocol
Reagent R-number Producer Code
TCA R170 Acros Organics 152130025 HCl (25%) R106 Chem-lab CL00.0368.2500 NaOH R92 Chem-lab CL00.1404.5000 H3BO3 R88 Chem-lab CL00.0216.1000 ACN (HPLC-grade) R1872 Fisher Scientific UK A/0627/17 MeOH (HPLC-grade) R1536 Sigma-Aldrich 34860-2.5L-R NaH2PO4.H2O R99 Chem-lab CL00.1465.1000 NaN3 R348 Sigma Aldrich 101338117 o-phtalaldehyde R904 Sigma P1378-5G 3-mercaptopropionic R1960 Acros-Organics 125531000 9-fluorenylmethylformate R1973 Fluka 1286226 22707178
Norvaline Fluka 74670 Sarcosine Fluka 84529 Alanine R217 Fluka 05150 Arginine HCL R216 Sigma A-5131 Asparagine H2O R214 Acros 175272500 Aspartic acid R215 Merck 126 Glutamine R337 Fluka 49419 Glutamic acid R232 Sigma G1626 Glycine R208 Sigma 50046-50G Histidine R233 Fluka 53330 Isoleucine R229 Fluka 58879 Leucine R228 Fluka 61840 Lysine HCl R231 Sigma L6001-25G Methionine R227 M9500-100G Ornithine R432 Sigma O2375-25G Phenylalanine R224 Sigma P-2126 Proline R223 Acros 157620250 Serine R221 Janssen Chimica 13.265.73 Threonine R219 Merck 8410 Tryptophane R218 Fluka 93659 Tyrosine R222 CA Biochem 6570 Valine R220 Fluka 94640
Table 40:Reagents for the BA-protocol.
Reagent R-number Producer Code
TCA R170 Acros Organics 152130025 ACN (HPLC-grade) R1872 Fisher Scientific UK A/0627/17
Dichloromethane R189 Acros Organics 326760025
1,7- diaminoheptane R2075 Sigma-Aldrich 101438602
Na2CO3 R97 Emsure (VWR) 1063921000 Dansyl chloride R1266 Sigma-Aldrich 101563354 MeOH (HPLC-grade) R1536 Sigma-Aldrich 34860-2.5L-R

76
Appendix 4: Materials and Machines used for the chemical analyses.
Material Producer Product Code / Model
Plastic falcon tubes (50 ml and 15 ml)
Test tubes with screw caps
Racks for falcon tubes and test tubes
Measuring cups
Erlenmeyers
Duran Schott-bottles Novolab lab bottles boroglas 1L+scrc.GL45 blauw PP.
Flasks + caps (2000, 1000, 500, 25 and 10ml)
Funnels
Glass pipets
Plastic pipets
Nitrile blue examination gloves VWR Cat No 112-2373
HPLC-vials 854165) SUPELCO 854165
Sterile microfilter (0.45 µm) Thermo Scientific Nalgene Rapid-Flow filters Cat.No.290-4545
Paper filters novolab A26464 130 mm
3 ml syringes Romes Holland 3 part-syringes 3SYR-3ML
Sterile needles Braun 100 Sterican 0,8 x 120 mm 21 G x4 ¾
HPLC-filters Millipore PN SLCR013NR
pH-strips EMD Millipore® 1.09531.0001 MColorpHast® pH Test Strips, 0-6 (Box of 100)
Micropipets (1000 µl + 200 µl) Sigma Aldrich BRAND® Transferpette S
Tips for micropipets Greiner Bio-one Ref 740290
Machines
Analytical balance Sartorius CP6201 + BP301S + CPA324S
Refrigerator chamber (4°C)
Refrigerator (7°C)
Mixer Braun 4165 en 4191
Ultraturrax IKA T25 digital
pH-meter Mettler Toledo SevenCompact pH/Ion s220 (liquid foods); Seveneasy pH (solid food products)
Headspace analyser PBI Dansensor CheckMate 3
HPLC–apparatus Agilent 1100 Series
UPLC-apparatus Dionex Ultimate 3000
Hot water bath (40°C) memmert WNB 29
Centrifuge Sartorius Sigma 4K15
Vortex VWR international P/N VWRI444-1372
Ultrasonic water bath Elma Ultrasonic cleaner Elmasonic SH025EL

77
Appendix 5: Tables required during the calculation of the BA-concentrations.
Table 41: Matrices assigned to each group of food product.
Matrix Food Products
Fresh white cabbage Fresh vegetables, sauerkraut and olives Mixture of coconut fat, syrup and emulsifier Chocolate Wort Beer Very young cheese Non-aqueous diary Milk Aqueous diary Minced meat Meat, meat products and fish
Table 42: Recovery percentages for each food matrix (FWC = fresh white cabbage; MFSE = Mixture of coconut fat, syrup
and emulsifier; VYC = Very young cheese; MM = Minced meat).
Product Tryptamine B-Phenylethylamine Putrescine Cadaverine Histamine Tyramine
FWC 83 +/- 2 92 +/- 7 100 +/- 6 93 +/- 4 89 +/- 6 84 +/- 8
MFSE 62 +/- 10 84 +/- 2 81 +/- 5 89 +/- 3 89 +/- 2 103 +/- 7
Wort 86 +/- 8 95 +/- 3 106 +/- 15 94 +/- 2 95 +/- 2 103 +/- 5
VYC 52 +/- 3 63 +/- 9 92 +/- 8 111 +/- 11 110 +/- 14 83 +/- 10
Milk 93 +/- 14 106 +/- 6 94 +/- 7 98 +/- 2 99 +/- 4 96 +/- 8
MM 53 +/- 5 75 +/- 5 104 +/- 6 101 +/- 2 108 +/- 6 102 +/- 4
Table 43: LOD, LOQ, slopes and intercepts calculated for the lower concentration range calibration curve.
Tryptamine B-Phenylethylamine Putrescine Cadaverine Histamine Tyramine
LOD (ppm) 1,17 1,00 0,11 0,48 3,36 1,88 LOQ (ppm) 4,26 4,31 1,91 2,16 9,94 5,90 a 5,52 8,57 5,87 5,81 7,06 4,24 b -0,06 -0,10 -0,13 -0,06 0,02 -0,02
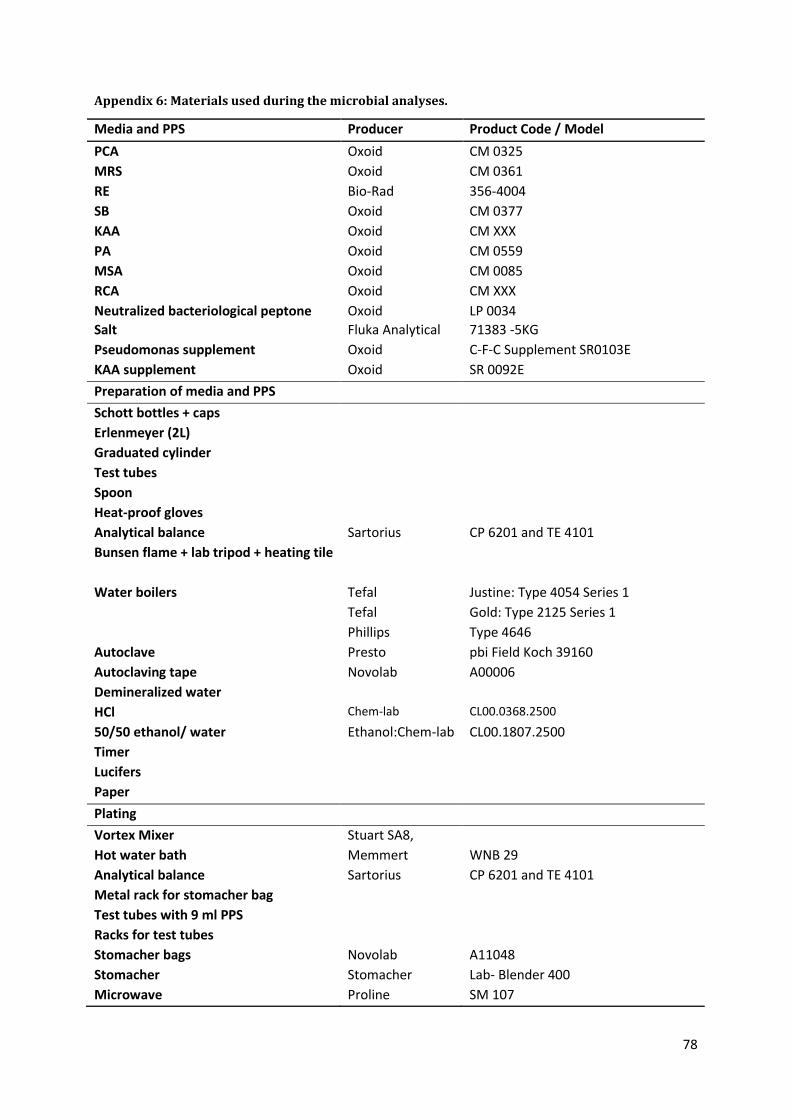
78
Appendix 6: Materials used during the microbial analyses.
Media and PPS Producer Product Code / Model
PCA Oxoid CM 0325
MRS Oxoid CM 0361
RE Bio-Rad 356-4004
SB Oxoid CM 0377
KAA Oxoid CM XXX
PA Oxoid CM 0559
MSA Oxoid CM 0085
RCA Oxoid CM XXX
Neutralized bacteriological peptone Oxoid LP 0034
Salt Fluka Analytical 71383 -5KG
Pseudomonas supplement Oxoid C-F-C Supplement SR0103E
KAA supplement Oxoid SR 0092E
Preparation of media and PPS
Schott bottles + caps
Erlenmeyer (2L)
Graduated cylinder
Test tubes
Spoon
Heat-proof gloves
Analytical balance Sartorius CP 6201 and TE 4101
Bunsen flame + lab tripod + heating tile
Water boilers Tefal Justine: Type 4054 Series 1
Tefal Gold: Type 2125 Series 1
Phillips Type 4646
Autoclave Presto pbi Field Koch 39160
Autoclaving tape Novolab A00006
Demineralized water
HCl Chem-lab CL00.0368.2500
50/50 ethanol/ water Ethanol:Chem-lab CL00.1807.2500
Timer
Lucifers
Paper
Plating
Vortex Mixer Stuart SA8,
Hot water bath Memmert WNB 29
Analytical balance Sartorius CP 6201 and TE 4101
Metal rack for stomacher bag
Test tubes with 9 ml PPS
Racks for test tubes
Stomacher bags Novolab A11048
Stomacher Stomacher Lab- Blender 400
Microwave Proline SM 107

79
Petri plates Gosselin SB93-101
Pipette (1.0, 10 and 50 ml) Novolab A13671 (1ml), A13684 (10ml)
Greiner bio one 768180 (50ml)
Micropipette Finnpipette
Fridges Liebherr profi line UKS2600/UKS1800/FKU2610
Incubators Termaks KB 8400/B8133
Cup filled with 100% ethanol
Anaerogen bags Oxoid AN0010C
Spoon
Scalpel
Pincet
Drigalski spatula’s Novolab A10538
Waste bag

80
Appendix 7: Pictures of tuna samples during 6-day storage test.
DAY 3
MAP – 7°C MAP – 22°C (3h) + 7°C MAP – 22°C
Air – 7°C Air – 22°C (3h) + 7°C Air – 22°C
DAY 5
MAP – 7°C MAP – 22°C (3h) + 7°C MAP – 22°C
Air – 7°C Air – 22°C (3h) + 7°C Air – 22°C
Day 6
MAP – 7°C MAP – 22°C (3h) + 7°C MAP – 22°C

81
Air – 7°C Air – 22°C (3h) + 7°C Air – 22°C

82
Appendix 8: BA-concentrations on the last day of analysis of the storage test for marinated pork:.
Mean values of the two samples on the last day of analysis for each condition and each BA are
plotted.
0
50
100
150
200
250
300
350
400
7°C - MAP 22°C - MAP 22°C/7°C - MAP
7°C - Air 22°C - Air 22°C/7°C - Air
BA
- c
on
cen
trat
ion
(p
pm
)
Tryptamine
B-Phenylethylamine
Putrescine
Cadaverine
Histamine
Tyramine

83
Appendix 9: Pictures of marinated pork during the 9-day storage test.
DAY 3
MAP -7°C MAP -22°C MAP – 22°C (3h) + 7°C
Air – 7°C Air – 22°C Air - 22°C (3h) + 7°C
DAY 5
MAP -7°C MAP -22°C MAP – 22°C (3h) + 7°C
Air – 7°C Air – 22°C Air - 22°C (3h) + 7°C
/
/
DAY 8
MAP -7°C MAP -22°C MAP – 22°C (3h) + 7°C
/

84
Air – 7°C Air – 22°C Air - 22°C (3h) + 7°C
/
DAY 9
MAP -7°C MAP -22°C MAP – 22°C (3h) + 7°C
/
Air – 7°C Air – 22°C Air - 22°C (3h) + 7°C
/

85
Appendix 10: Results of the screening tests on salami’s and dried sausages.
Table 44: BA-concentrations (mg/kg) in dried sausages and salami’s collected during screening tests. For the calculation of means and other characteristics, B-values were filled out when unavailable by copying the A-concentrations (see materials and methods).
Tryptamine B-Phenylethylamine Putrescine Cadaverine Histamine Tyramine
DRIED SAUSAGES
262 A 9 4 14 39 2 124
263 A <LOD 4 9 1 <LOD 18
264 A 33 12 84 65 3 205
265 A 23 6 8 2 <LOD 71
266 A <LOD 9 156 10 <LOD 134
267 A 6 <LOD <LOD 1 <LOD <LOD
268 A <LOD 1 <LOD 2 <LOD 15
268 B <LOD <LOD 12 1 <LOD 12
269 A 9 <LOD 0 0 <LOD 3
272 A 33 <LOD 307 63 3 226
272 B <LOD <LOD <LOD 3 <LOD 35
273 A <LOD <LOD <LOD <LOD <LOD 8
273 B <LOD 7 6 <LOD 5 12
277 A <LOD <LOD <LOD 13 <LOD 93
308 A <LOD <LOD <LOD <LOD <LOD <LOD
308 B <LOD <LOD 7 1 <LOD <LOD
309 A <LOD <LOD <LOD 7 <LOD 30
309 B <LOD <LOD 7 8 2 41
310 A <LOD <LOD <LOD <LOD <LOD 139
310 B <LOD 14 9 <LOD <LOD 182
311 A 2 4 3 2 <LOD <LOD
311 B 5 <LOD 9 10 <LOD 64
312 A 10 24 137 <LOD 54 163
313 A 32 8 55 158 22 115
Mean A 9 4 45 21 5 79
B 7 6 30 18 5 75
Stdev A 13 6 84 41 14 77
B 11 7 49 40 14 68
Min A <LOD <LOD <LOD <LOD <LOD <LOD
B <LOD <LOD <LOD <LOD <LOD <LOD
P50 A 2 1 3 2 <LOD 71
B <LOD 4 9 2 <LOD 64
P90 A 32 10 145 64 11 180
B 27 13 105 50 12 171
Max A 33 24 307 158 54 226
B 33 24 156 158 54 205
SALAMI’S
270 A <LOD 1 <LOD 7 <LOD 24
270 B <LOD 4 4 7 <LOD 30
271 A <LOD <LOD 57 2 2 97
271 B 2 <LOD <LOD 57 1 8
274 A <LOD 12 8 3 <LOD 53
274 B <LOD 10 4 1 <LOD 26
275 A <LOD 4 141 2 3 153
275 B <LOD 1 136 4 3 134
276 A <LOD 2 <LOD 3 <LOD 73

86
276 B <LOD 2 8 3 <LOD 64
305 A 31 10 63 2 13 121
306 A <LOD <LOD <LOD 2 <LOD <LOD
306 B <LOD <LOD <LOD 1 <LOD <LOD
307 A <LOD <LOD <LOD <LOD <LOD <LOD
307 B <LOD <LOD 8 <LOD <LOD <LOD
Mean A 4 4 34 3 2 65
B 4 3 28 9 2 48
Stdev A 11 5 51 2 4 56
B 11 4 49 19 4 53
Min A <LOD <LOD <LOD <LOD <LOD <LOD
B <LOD <LOD <LOD <LOD <LOD <LOD
P50 A <LOD 1 4 2 <LOD 63
B <LOD 2 6 3 <LOD 28
P90 A 9 11 87 4 6 130
B 11 10 85 22 6 125
Max A 31 12 141 7 13 153
B 31 10 136 57 13 134
Table 45: FAA-concentrations (mg/kg) for salami's/dried sausages, measured on day 0.
Histidine Arginine Tyrosine Tryptophane Phenylalanine Ornithine Lysine
DRIED SAUSAGE
262 64 102 60 12 82 19 163
263 92 11 <LOD 12 177 75 264
264 99 9 13 <LOD 319 111 397
265 70 54 21 <LOD 97 38 187
266 112 11 <LOD 29 187 <LOD 329
267 18 22 30 18 35 <LOD 85
268 178 32 158 34 291 266 584
269 132 346 139 49 165 <LOD 570
272 220 9 <LOD 31 379 25 688
273 115 18 137 32 198 184 363
277 169 126 71 55 232 20 683
308 93 38 130 39 242 178 323
309 84 34 57 23 105 80 305
310 104 216 54 40 255 65 386
311 65 11 86 20 108 101 282
312 44 84 139 11 246 56 405
313 198 405 272 1 85 10 125
Mean 109 90 80 24 189 72 361
Stdev 55 121 74 17 95 76 182
Min 18 9 <LOD <LOD 35 <LOD 85
P50 99 34 60 23 187 56 329
P90 186 268 147 43 302 180 624
Max 220 405 272 55 379 266 688
SALAMI
270 121 5 90 21 150 150 326
271 137 11 96 28 212 173 392
274 131 6 98 37 192 173 343
275 108 11 38 32 222 52 553
276 128 6 58 34 179 174 363

87
305 53 14 2 <LOD 97 39 211
306 55 10 79 19 109 89 151
307 57 73 44 12 104 53 133
Mean 99 17 63 23 158 113 309
Stdev 37 23 34 13 50 60 139
Min 53 5 2 <LOD 97 39 133
P50 114 10 69 24 165 119 335
P90 133 31 97 35 215 173 440
Max 137 73 98 37 222 174 553
Table 46: Log-values of microbial counts (CFU/g) of different groups of bacteria on salami/dried sausages. An upper bound scenario was used in the calculations of means and other characteristics.
Total count LAB Staphylococci Enterobactericeae Enterococci
DRIED SAUSAGE
262 8,61 7,63 7,40 <1 <3
263 7,68 7,31 <4 <1 7,36
264 8,39 8,58 3,60 <3 <3
265 8,53 8,52 8,00 <3 <3
266 4,56 8,43 <4 <3 3,95
267 8,00 8,00 7,18 <3 <3
268 8,59 8,51 6,00 <3 <3
272 7,01 6,76 5,43 <3 5,66
273 8,20 8,40 6,53 <3 <3
277 7,33 7,51 5,70 <3 <3
308 8,47 8,54 5,93 <3 5,48
309 8,18 8,16 5,85 <3 <3
310 8,22 7,09 <3 <3 6,00
311 6,92 7,22 5,37 <3 <3
312 8,35 8,25 5,25 <3 <3
313 9,17 8,65 8,94 5,02 5,43
Mean 7,89 7,97 6,24 0,30 3,99 Stdev 1,08 0,62 1,37 1,22 1,47 Min 4,56 6,76 3,60 <1 <3 P50 8,21 8,20 5,77 3,00 3,00 P90 8,60 8,56 7,70 3,00 5,83 Max 9,17 8,65 8,94 5,02 7,36
SALAMI
270 8,87 8,42 8,42 <3 4,90
271 7,76 7,33 6,51 <3 5,19
274 8,57 8,51 7,10 <3 3,00
275 8,57 8,50 5,66 <3 <3
276 8,43 8,39 6,82 <3 3,00
306 7,34 7,53 5,60 <3 <3
307 8,68 8,24 5,30 <3 <3
Mean 8,32 8,13 6,49 <3 3,58 Stdev 0,55 0,49 1,09 <3 1,00 Min 7,34 7,33 5,30 <3 3,00 P50 8,57 8,39 6,51 <3 3,00 P90 8,76 8,50 7,63 <3 5,02 Max 8,87 8,51 8,42 <3 5,19
Appendix 11: Results of the screening tests on cooked hams.
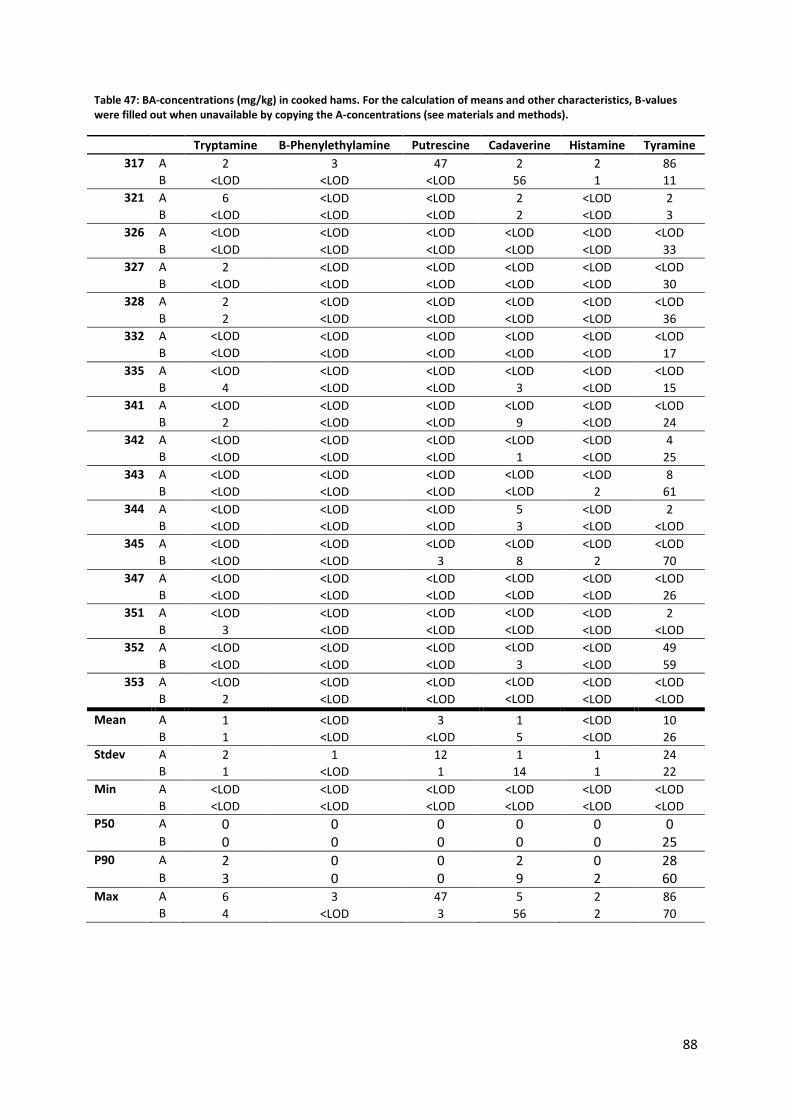
88
Table 47: BA-concentrations (mg/kg) in cooked hams. For the calculation of means and other characteristics, B-values were filled out when unavailable by copying the A-concentrations (see materials and methods).
Tryptamine B-Phenylethylamine Putrescine Cadaverine Histamine Tyramine
317 A 2 3 47 2 2 86
B <LOD <LOD <LOD 56 1 11
321 A 6 <LOD <LOD 2 <LOD 2
B <LOD <LOD <LOD 2 <LOD 3
326 A <LOD <LOD <LOD <LOD <LOD <LOD
B <LOD <LOD <LOD <LOD <LOD 33
327 A 2 <LOD <LOD <LOD <LOD <LOD
B <LOD <LOD <LOD <LOD <LOD 30
328 A 2 <LOD <LOD <LOD <LOD <LOD
B 2 <LOD <LOD <LOD <LOD 36
332 A <LOD <LOD <LOD <LOD <LOD <LOD
B <LOD <LOD <LOD <LOD <LOD 17
335 A <LOD <LOD <LOD <LOD <LOD <LOD
B 4 <LOD <LOD 3 <LOD 15
341 A <LOD <LOD <LOD <LOD <LOD <LOD
B 2 <LOD <LOD 9 <LOD 24
342 A <LOD <LOD <LOD <LOD <LOD 4
B <LOD <LOD <LOD 1 <LOD 25
343 A <LOD <LOD <LOD <LOD <LOD 8
B <LOD <LOD <LOD <LOD 2 61
344 A <LOD <LOD <LOD 5 <LOD 2
B <LOD <LOD <LOD 3 <LOD <LOD
345 A <LOD <LOD <LOD <LOD <LOD <LOD
B <LOD <LOD 3 8 2 70
347 A <LOD <LOD <LOD <LOD <LOD <LOD
B <LOD <LOD <LOD <LOD <LOD 26
351 A <LOD <LOD <LOD <LOD <LOD 2
B 3 <LOD <LOD <LOD <LOD <LOD
352 A <LOD <LOD <LOD <LOD <LOD 49
B <LOD <LOD <LOD 3 <LOD 59
353 A <LOD <LOD <LOD <LOD <LOD <LOD
B 2 <LOD <LOD <LOD <LOD <LOD
Mean A 1 <LOD 3 1 <LOD 10
B 1 <LOD <LOD 5 <LOD 26
Stdev A 2 1 12 1 1 24
B 1 <LOD 1 14 1 22
Min A <LOD <LOD <LOD <LOD <LOD <LOD
B <LOD <LOD <LOD <LOD <LOD <LOD
P50 A 0 0 0 0 0 0
B 0 0 0 0 0 25
P90 A 2 0 0 2 0 28
B 3 0 0 9 2 60
Max A 6 3 47 5 2 86
B 4 <LOD 3 56 2 70

89
Table 48: FAA-concentrations (mg/kg) in cooked hams.
Sample nr. Histidine Arginine Tyrosine Tryptophane Phenylalanine Ornithine Lysine
317 38 100 95 23 89 <LOD 160
321 <LOD 152 106 30 138 <LOD 217
326 48 230 63 17 91 <LOD 147
327 29 66 57 23 66 <LOD 71
328 36 54 36 23 37 <LOD 60
332 45 93 68 25 61 <LOD 96
335 40 77 49 22 44 <LOD 84
341 30 67 50 20 55 <LOD 62
342 31 70 50 22 58 <LOD 70
343 73 87 56 49 109 <LOD 150
344 45 78 62 48 69 <LOD 115
345 89 114 90 51 129 <LOD 175
347 94 118 85 55 117 <LOD 193
351 47 71 66 54 78 <LOD 150
352 79 49 25 56 110 91 164
353 76 163 107 57 113 65 170
Mean 50 99 67 36 85 10 130 Stdev 25 48 24 16 31 27 51
Min <LOD 49 25 17 37 <LOD 60
P50 45 82 62 27 84 0 148 P90 84 157 100 56 123 32 184 Max 94 230 107 57 138 91 217
Table 49: Log-values of microbial counts (CFU/g) of different groups of bacteria in cooked hams.
Sample nr. Total count LAB Staphylococci Enterobacteriaceae Enterococci
317 8,37 8,44 <3 <3 <3
321 7,09 6,62 <3 <3 <3
326 8,75 8,71 <3 <3 <3
327 8,68 8,81 <3 <3 <3
328 7,26 7,34 <3 <3 3,48
332 8,64 8,68 <3 <3 <3
335 5,92 <3 3,30 <3 <3
341 9,00 9,03 <3 <3 <3
342 8,87 8,54 <3 <3 <3
343 8,86 8,42 <3 <3 <3
344 8,25 8,31 <3 <3 <3
345 8,56 8,57 <3 <3 <3
347 8,90 8,81 <3 <3 3,30
351 6,10 6,05 <3 <3 <3
352 8,84 8,75 <3 <3 <3
353 7,08 7,00 6,85 <3 <3
Mean 8,07 8,14 0,63 <3 0,42
Stdev 1,03 0,92 1,85 <3 1,16
Min 5,92 6,05 <3 <3 <3
P50 8,60 8,49 3,00 <3 3,00
P90 8,89 8,81 3,15 <3 3,15
Max 9,00 9,03 6,85 <3 3,48
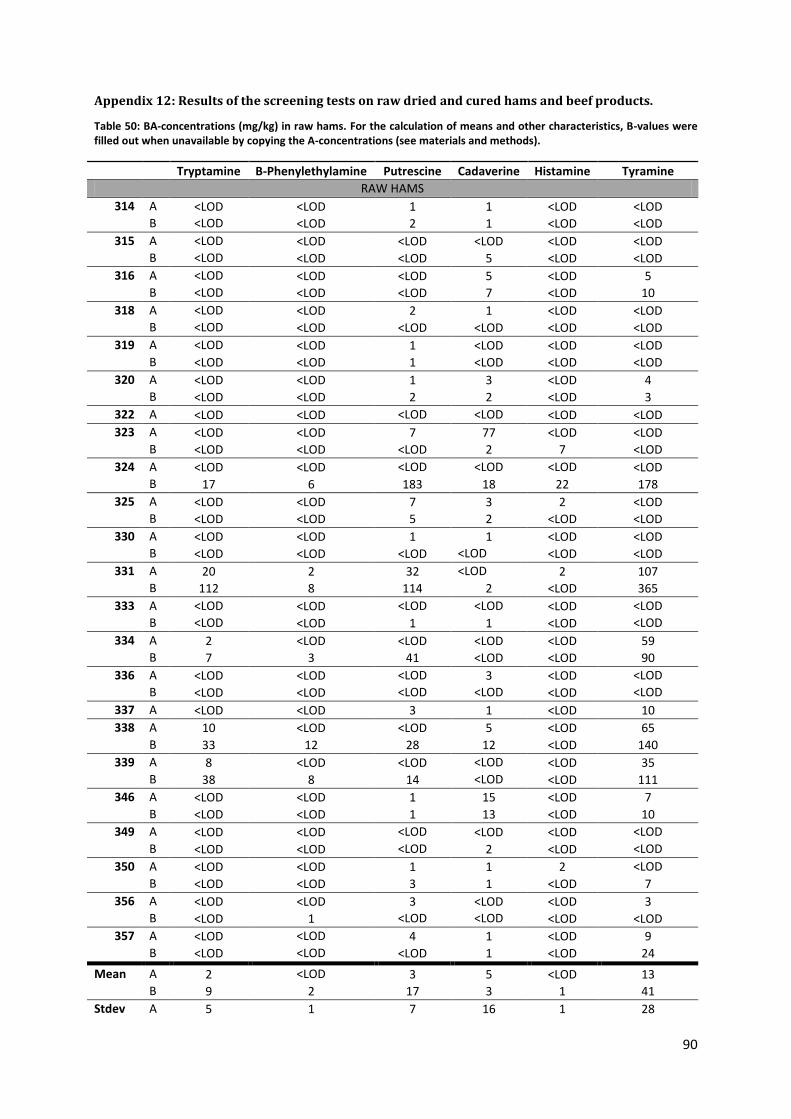
90
Appendix 12: Results of the screening tests on raw dried and cured hams and beef products.
Table 50: BA-concentrations (mg/kg) in raw hams. For the calculation of means and other characteristics, B-values were filled out when unavailable by copying the A-concentrations (see materials and methods).
Tryptamine B-Phenylethylamine Putrescine Cadaverine Histamine Tyramine
RAW HAMS
314 A <LOD <LOD 1 1 <LOD <LOD
B <LOD <LOD 2 1 <LOD <LOD
315 A <LOD <LOD <LOD <LOD <LOD <LOD
B <LOD <LOD <LOD 5 <LOD <LOD
316 A <LOD <LOD <LOD 5 <LOD 5
B <LOD <LOD <LOD 7 <LOD 10
318 A <LOD <LOD 2 1 <LOD <LOD
B <LOD <LOD <LOD <LOD <LOD <LOD
319 A <LOD <LOD 1 <LOD <LOD <LOD
B <LOD <LOD 1 <LOD <LOD <LOD
320 A <LOD <LOD 1 3 <LOD 4
B <LOD <LOD 2 2 <LOD 3
322 A <LOD <LOD <LOD <LOD <LOD <LOD
323 A <LOD <LOD 7 77 <LOD <LOD
B <LOD <LOD <LOD 2 7 <LOD
324 A <LOD <LOD <LOD <LOD <LOD <LOD
B 17 6 183 18 22 178
325 A <LOD <LOD 7 3 2 <LOD
B <LOD <LOD 5 2 <LOD <LOD
330 A <LOD <LOD 1 1 <LOD <LOD
B <LOD <LOD <LOD <LOD <LOD <LOD
331 A 20 2 32 <LOD 2 107
B 112 8 114 2 <LOD 365
333 A <LOD <LOD <LOD <LOD <LOD <LOD
B <LOD <LOD 1 1 <LOD <LOD
334 A 2 <LOD <LOD <LOD <LOD 59
B 7 3 41 <LOD <LOD 90
336 A <LOD <LOD <LOD 3 <LOD <LOD
B <LOD <LOD <LOD <LOD <LOD <LOD
337 A <LOD <LOD 3 1 <LOD 10
338 A 10 <LOD <LOD 5 <LOD 65
B 33 12 28 12 <LOD 140
339 A 8 <LOD <LOD <LOD <LOD 35
B 38 8 14 <LOD <LOD 111
346 A <LOD <LOD 1 15 <LOD 7
B <LOD <LOD 1 13 <LOD 10
349 A <LOD <LOD <LOD <LOD <LOD <LOD
B <LOD <LOD <LOD 2 <LOD <LOD
350 A <LOD <LOD 1 1 2 <LOD
B <LOD <LOD 3 1 <LOD 7
356 A <LOD <LOD 3 <LOD <LOD 3
B <LOD 1 <LOD <LOD <LOD <LOD
357 A <LOD <LOD 4 1 <LOD 9
B <LOD <LOD <LOD 1 <LOD 24
Mean A 2 <LOD 3 5 <LOD 13
B 9 2 17 3 1 41
Stdev A 5 1 7 16 1 28

91
B 25 3 44 5 5 87
Min A <LOD <LOD <LOD <LOD <LOD <LOD
B <LOD <LOD <LOD <LOD <LOD <LOD
P50 A 0 0 1 1 0 0
B 0 0 1 1 0 0
P90 A 7 0 6 5 1 54
B 30 7 38 11 0 134
Max A 20 2 32 77 2 107
B 112 12 183 18 22 365
RAW DRIED BEEF PRODUCTS
329 A <LOD <LOD 1 31 4 5
B <LOD 2 23 3 7 57
340 A <LOD <LOD 1 <LOD <LOD 10
B 9 <LOD 3 <LOD <LOD 107
348 A 59 5 1 <LOD 3 238
B 52 <LOD <LOD <LOD 3 227
354 A <LOD <LOD 1 <LOD 2 28
B 109 4 21 177 <LOD 265
355* A 10 <LOD 3 44 <LOD 62
B <LOD <LOD 1 <LOD 2 97
Mean A 14 1 1 15 2 69
B 34 1 10 36 2 151
Stdev A 25 2 1 21 2 97
B 47 2 11 79 3 90
Min A <LOD <LOD 1 <LOD <LOD 5
B <LOD <LOD <LOD <LOD <LOD 57
P50 A <LOD <LOD 1 <LOD 2 28
B 9 <LOD 3 <LOD 2 107
P90 A 39 3 2 39 3 168
B 86 3 22 107 5 250
Max A 59 5 3 44 4 238
B 109 4 23 177 7 265
*Horsemeat
Table 51: FAA-concentrations (mg/kg) in raw ham (pork) and raw dried beef products.
Histidine Arginine Tyrosine Tryptophane Phenylalanine Ornithine Lysine
RAW HAM
314 777 1647 934 200 1133 100 2750
315 488 1115 575 107 741 42 1836
316 734 1408 720 167 973 137 2612
318 613 1290 677 149 819 94 2057
319 1117 2150 1158 280 1530 236 3787
320 1388 2687 1422 381 1992 205 4488
322 1345 2615 1463 326 1914 220 4308
323 <LOD 3105 1341 445 2188 143 4829
324 56 41 89 19 111 <LOD 176
325 576 963 630 120 720 348 2008
330 665 1464 822 178 964 67 2469
331 318 192 365 104 656 232 957
333 655 1458 889 176 873 71 2391
334 54 87 23 28 98 34 141
336 960 2107 1003 284 1542 59 3437

92
337 734 1610 883 221 1166 47 2676
338 71 195 57 30 123 24 <LOD
339 67 137 77 28 130 17 253
346 892 1739 1191 263 1212 107 2937
349 248 604 371 88 416 62 918
350 1533 3234 1940 516 2370 210 5167
356 242 36 279 87 324 313 671
357 561 1122 650 186 739 <LOD 1675
Mean 613 1348 763 191 988 120 2284
Stdev 450 990 509 135 677 101 1561
Min <LOD 36 23 19 98 <LOD <LOD
P50 613 1408 720 176 873 94 2391
P90 1299 2673 1405 370 1977 235 4452
Max 1533 3234 1940 516 2370 348 5167
RAW DRIED BEEF
329 479 763 611 137 679 72 1577
340 66 121 114 36 175 20 138
348 701 114 471 157 1001 527 2226
354 69 127 96 62 164 <LOD 171
355* 373 629 27 87 797 172 634
Mean 338 351 264 96 563 158 949
Stdev 274 319 260 51 378 217 920
Min 66 114 27 36 164 <LOD 138
P50 373 127 114 87 679 72 634
P90 612 709 555 149 920 385 1967
Max 701 763 611 157 1001 527 2226
*Horsemeat
Table 52: Log-values of microbial counts(CFU/g) in raw hams (pork) and raw dried beef products.
Total count LAB Staphylococci Entero-
bacteriaceae Enterococci Pseudomonas
RAW HAM
314 9,81 <3 3,85 <3 <3
315 4,89 4,41 3,30 <3 <3 <3
316 <3 <3 <3 <3 <3
318 4,58 <3 4,28 <3 <3
319
<3 <3 <3 <3 <3
320 5,64 3,60 <4 <3 3,00 <3
322 4,08 4,48 <3 <3 <3 <3
323 5,26 5,45 4,32 <3 <3 3,30
324 8,47 8,37 <4 <3 6,48 <3
325 3,48 <3 <4 <3 <3 <3
330 3,00 <3 3,30 <3 <3
331 7,94 7,83 <4 <3 <3 <3
333 3,48 <3 3,78 <3 <4 <3
334 8,32 8,40 <3 <3 <3
336 4,46 4,08 4,59 <3 <3 <3
337 4,64 4,28 4,46 <3 <3 <3
338 8,29 7,84 <3 <3 <3
339 8,47 8,39 <3 <3 <3
346 4,76 3,30 4,38 <3 <3
349 6,64 6,74 <3
9,30 <3
350 3,48 3,48 <2 <2 <3 <3

93
356 8,23 8,10 6,20 <3 <3
357 7,53 7,50 6,36 <3 <3
Mean 5,84 5,10 3,64 2,95 3,47 3,02
Stdev 2,17 2,20 1,32 0,21 1,47 0,08
Min <3 <3 <2 <3 <3 <3
P50 5,07 4,28 3,85 3,00 3,00 3,00
P90 8,45 8,31 4,57 3,00 3,80 3,00
Max 9,81 8,40 6,36 <3 9,30 3,30
RAW DRIED BEEF
329 6,95 6,28 6,78 <2 <3 <3
340 8,31 8,13 <3 <3 <3
348 6,75 3,60 6,58 <3 <3 <3
354 8,12 8,02 3,48 <3 <3
355* 8,34 8,24 <3 <3 <3
Mean 7,70 6,86 4,57 2,80 3,00 3,00
Stdev 0,78 1,99 1,94 0,45 0,00 0,00
Min 6,75 3,60 3,00 <2 <3 <3
P50 8,12 8,02 3,48 3,00 3,00 3,00
P90 8,33 8,20 6,70 3,00 3,00 3,00
Max 8,34 8,24 6,78 <3 <3 <3
*Horsemeat
Appendix 13: Results of the screening tests on meat preparations.
Table 53: BA-concentrations (mg/kg) in several meat preparations. For the calculation of means and other characteristics, B-values were filled out when unavailable by copying the A-concentrations (see materials and methods).
Tryptamine B-Phenylethylamine Putrescine Cadaverine Histamine Tyramine
372 A <LOD <LOD <LOD <LOD <LOD <LOD
B <LOD <LOD 30 50 3 64
373 A <LOD 1 1 <LOD 2 <LOD B <LOD <LOD <LOD <LOD 1 3
374 A <LOD <LOD <LOD <LOD 2 <LOD B 13 <LOD <LOD <LOD 2 39
375 A <LOD <LOD 1 <LOD 1 10 B <LOD 1 <LOD <LOD <LOD 139
376 A <LOD <LOD 2 1 <LOD <LOD B <LOD <LOD <LOD 47 <LOD 2
377 A <LOD 4 2 9 <LOD 27 B <LOD 3 2 9 <LOD 25
378 A <LOD <LOD <LOD 2 <LOD <LOD B <LOD <LOD <LOD 2 <LOD <LOD
379 A <LOD <LOD <LOD 8 <LOD 8 B 11 1 <LOD 78 <LOD 41
380 A <LOD <LOD <LOD <LOD <LOD 2 B 40 <LOD 2 1 11 95
381 A <LOD <LOD 1 7 <LOD 8 B <LOD <LOD <LOD 15 <LOD 3
382 A <LOD <LOD 3 <LOD <LOD <LOD B <LOD <LOD 1 <LOD <LOD 9
383 A <LOD <LOD <LOD <LOD <LOD <LOD B 2 <LOD <LOD 1 <LOD 11
384 A <LOD <LOD 2 <LOD <LOD <LOD
B <LOD <LOD 3 5 <LOD <LOD
385 A <LOD <LOD <LOD <LOD <LOD <LOD
B 8 <LOD 1 1 4 <LOD
386 A <LOD <LOD <LOD 1 <LOD 3 B <LOD <LOD 1 2 <LOD 11

94
387 A <LOD <LOD <LOD <LOD <LOD <LOD
B <LOD <LOD <LOD <LOD <LOD <LOD
388 A <LOD <LOD 1 6 <LOD <LOD
B 5 <LOD 1 11 <LOD 39
389 A <LOD <LOD <LOD 2 <LOD 13 B <LOD 2 <LOD 1 <LOD 121
390 A <LOD <LOD <LOD 1 <LOD 33 B 44 3 9 2 <LOD 104
391 A <LOD <LOD <LOD <LOD <LOD <LOD
B <LOD <LOD <LOD <LOD <LOD 5
392 A <LOD <LOD 1 <LOD <LOD <LOD
B <LOD <LOD <LOD <LOD <LOD <LOD
393 A <LOD <LOD 1 1 <LOD <LOD
B <LOD <LOD 1 2 <LOD <LOD
394 A <LOD <LOD 1 <LOD <LOD <LOD
B <LOD <LOD 1 <LOD <LOD <LOD
395 A <LOD <LOD 1 <LOD <LOD 3 B 21 <LOD <LOD 73 8 63
396 A <LOD <LOD <LOD <LOD <LOD <LOD
B 83 3 163 269 29 195
462 A <LOD <LOD <LOD <LOD <LOD <LOD
B <LOD <LOD <LOD 3 <LOD 5
463 A <LOD <LOD 1 1 <LOD <LOD
B <LOD <LOD <LOD 10 <LOD <LOD
464 A <LOD <LOD <LOD 0 <LOD <LOD
B <LOD <LOD <LOD 1 <LOD 22
465 A <LOD <LOD 2 3 1 11
B <LOD <LOD 6 2 <LOD <LOD
466 A <LOD <LOD 157 18 3 102 B <LOD <LOD 4 13 <LOD 19
467 A <LOD <LOD 1 <LOD <LOD <LOD
B <LOD <LOD 1 <LOD <LOD <LOD
468 A <LOD <LOD <LOD <LOD <LOD <LOD
B <LOD <LOD <LOD <LOD <LOD <LOD
469 A <LOD <LOD <LOD 2 <LOD <LOD
B <LOD <LOD <LOD 3 <LOD <LOD
470 A <LOD <LOD <LOD <LOD <LOD <LOD
B <LOD <LOD 1 <LOD <LOD <LOD
471 A <LOD <LOD <LOD <LOD <LOD <LOD
B <LOD <LOD 1 9 3 31
472 A <LOD <LOD <LOD <LOD <LOD <LOD B <LOD <LOD <LOD <LOD <LOD 5
473 A <LOD <LOD <LOD <LOD <LOD <LOD
B <LOD <LOD <LOD <LOD <LOD <LOD
474 A <LOD <LOD 1 <LOD <LOD <LOD
B <LOD <LOD 5 8 2 52
475 A <LOD <LOD <LOD <LOD <LOD <LOD
B <LOD <LOD 1 <LOD <LOD <LOD
476 A <LOD <LOD <LOD <LOD 3 <LOD
B 15 2 1 <LOD 7 38
Mean A <LOD <LOD 4 2 <LOD 6 B 6 <LOD 6 15 2 29
Stdev A <LOD 1 25 4 1 17 B 16 1 26 45 5 45
Min A <LOD <LOD <LOD <LOD <LOD <LOD
B <LOD <LOD <LOD <LOD <LOD <LOD
P50 A <LOD <LOD <LOD <LOD <LOD <LOD
B <LOD <LOD 1 1 <LOD 5
P90 A <LOD <LOD 2 6 1 12 B 16 2 5 47 4 96

95
Max A <LOD 4 157 18 3 102 B 83 3 163 269 29 195
Table 54: FAA-concentrations (mg/kg) in meat preparations.
Sample nr. Histidine Arginine Tyrosine Tryptophane Phenylalanine Ornithine Lysine
372 160 421 214 88 178 <LOD 423 373 25 68 32 14 25 <LOD 66 374 25 68 32 14 25 <LOD 66 375 25 68 32 14 25 <LOD 66 376 25 68 32 14 25 <LOD 66 377 79 55 51 56 117 57 188 378 59 99 63 65 51 <LOD 121 379 55 15 35 <LOD 46 <LOD 76 380 67 136 90 48 101 <LOD 270 381 127 124 129 65 164 78 326 382 168 403 193 82 154 <LOD 343 383 47 86 38 <LOD 41 <LOD 79 384 51 88 64 53 65 <LOD 122 385 61 94 63 <LOD 70 <LOD 104 386 61 131 79 49 93 <LOD 124 387 76 169 121 27 90 <LOD 203 388 37 50 53 21 80 19 112 389 62 150 73 23 175 32 184 390 77 122 58 23 141 12 254 391 44 163 54 21 91 <LOD 112 392 41 90 69 27 71 <LOD 113 393 42 77 54 25 43 <LOD 106 394 67 143 112 28 85 <LOD 165 395 138 294 205 54 155 <LOD 316 396 27 42 37 <LOD 29 <LOD 57 462 16 145 25 13 39 <LOD 44 463 87 53 94 19 181 80 289 464 44 0 85 31 67 0 175 465 25 223 29 20 30 41 77 466 106 45 95 24 195 106 349 467 67 143 84 28 78 33 146 468 18 59 22 14 31 17 46 469 26 89 27 11 38 13 63 470 14 159 17 18 25 0 43 471 53 278 96 21 79 15 248 472 20 50 33 15 46 13 63 473 17 69 25 12 38 12 48 474 44 0 86 34 69 <LOD 145 475 47 139 85 27 90 18 151 476 18 98 22 13 27 24 45
Mean 56 119 61 23 74 19 126 Stdev 38 93 49 22 52 25 102 Min 14 <LOD 17 <LOD 25 <LOD 43 P50 47 92 61 22 69 <LOD 117 P90 108 228 122 57 165 43 317 Max 168 421 214 88 195 106 423

96
Table 55: Log-values of the microbial counts (CFU/g) in meat preparations at the end of storage.
Sample nr. Total count LAB Staphylococci
Entero- bacteriaceae
Enterococci Pseudomonas
372 8,60 8,40 5,02 6,86 3,85
373 8,79 8,83 4,66 4,08 <3
374 8,64 8,66 4,32 4,98 3,00
375 8,79 8,83 3,78 <3 3,00
376 8,55 8,68 3,90 <3 4,20
377 4,81 <3 <3 <3 <3
378 <3 <3 <3 <3 <3
379 7,73 7,81 <3 <3 4,00
380 7,91 8,02 3,60 <3 <3
381 <3 <3 <3 <3 <3
382 8,14 8,09 <3 <3 <3
383 8,31 8,51 <3 4,99 <3
384 8,68 7,82 4,23 6,08 <3
385 7,92 7,92 <3 <3 <3
386 7,98 8,00 3,00 <3 <3
387 6,38 6,32 4,94 <3 <3
388 8,85 8,57 4,18 <3 <3
389 8,85 8,68 3,00 <3 <3
390 8,74 8,68 3,95 <3 <3
391 8,89 8,73 3,70 <3 <3
392 4,66 4,54 <3 <3 <3
393 <3 <3 <3 <3 <3
394 4,32 5,30 3,70 <3 <3
395 9,11 8,58 3,30 7,10 4,00
396 7,87 8,21 <3 <3 <3
462 8,19 7,95 <4 7,63 <3 7,72
463 7,93 7,05 4,00 <3 <3 4,79
464 8,33 8,28 <4 4,98 5,43 5,63
465 8,76 6,63 4,85 4,68 <3 8,84
466 6,32 6,15 <4 <3 <3 7,36
467 <3 <3 <3 <3 4,08 <3
468 9,18 3,78 0,00 0,00 <3 4,49
469 <3 <3 <3 <3 <3 <3
470 <3 <3 <3 <3 <3 3,60
471 8,58 7,91 4,60 5,52
7,06
472 4,79 7,41 3,60 4,11 <3 4,18
473 6,88 6,78 <4 <3
<3
474 8,93 8,99 <3 5,68 4,08 5,27
475 5,87 5,81 <3 <3 <3 <3
476 8,16 8,72 <4 <3 <3 3,48
Mean 7,06 6,84 3,53 3,69 3,23 4,96 Stdev 2,16 2,15 0,86 1,46 0,54 1,96 Min <3 <3 <3 <3 <3 <3

97
P50 8,06 7,92 3,60 3,00 3,00 4,49 P90 8,86 8,72 4,61 5,72 4,03 7,57 Max 9,18 8,99 5,02 7,63 5,43 8,84
Appendix 14: Preparation methods of cooked and raw dried and cured ham samples as designated
on the package.
COOKED
Sample nr. Smoked Grilled Roasted
317 321 326 327 328 332 335 341 342 343 344 345 347 351 352 353 RAW
Sample nr. Dried Smoked Specification
314 12 months 315
316 318 319 320 min 24 months
322 18 months 323
324
Ferments added
325 12- 14 months 329
Beef
330 331
Beef
333 9 months 334
336 337 11 months
338 339

98
340
Beef
346 7 months
348
Beef, Ferments added
349 350 354
Beef
355
Horse
356 357

99
Appendix 15: Overview of the BA-concentrations in different food groups and their subgroups.
Table 56: Overview of BA-distribution in F&V and it's subgroups. Mean, median, P50, P90 and max are given in mg/kg. Timepoint A = day of purchace = day 0; Timepoint B = after expiry date.
Subgroup N Timepoint
Tryptamine B-Phenylethylamine Putrescine Cadaverine Histamine Tyramine
Overall 103 A mean 3 0 50 9 10 16
P50 0 0 7 0 0 0
P90 14 1 172 33 31 75
max 30 13 419 74 64 100
N <LOD 69 86 26 67 54 70
B mean 4 5 67 13 12 21
P50 0 0 6 0 0 0
P90 10 2 167 37 44 74
max 41 322 419 82 133 99
N <LOD 77 82 33 60 54 73
Fresh products 34 A mean 0 1 9 0 11 1
P50 0 0 9 0 0 0
P90 0 2 16 0 27 3
max 2 13 26 0 39 5
N <LOD 32 26 1 31 17 26
Olives 41 A mean 4 0 2 0 0 0
P50 0 0 0 0 0 0
P90 17 0 4 1 2 0
max 30 0 15 12 5 0
N <LOD 29 41 24 34 34 41
B mean 2 0 1 0 0 0
P50 0 0 0 0 0 0
P90 2 0 2 1 2 0
max 41 0 7 1 4 0
N <LOD 35 41 31 35 35 41
Sauerkraut 28 A mean 7 1 173 33 23 57
P50 4 0 145 32 19 61
P90 11 1 185 36 31 76
max 21 2 419 74 64 100
N <LOD 8 18 0 1 1 1

100
B mean 7 12 173 33 30 55
P50 4 0 152 31 21 55
P90 17 2 297 62 57 88
max 21 322 419 82 133 99
N <LOD 9 19 0 1 1 2
Table 57: Overview of BA-distribution in chocolate and it's subgroups. Mean, median, P50, P90 and max are given in mg/kg. Timepoint A = day of purchace = day 0; Timepoint B = after expiry date.
Subgroup N Timepoint
Tryptamine B-Phenylethylamine Putrescine Cadaverine Histamine Tyramine
Chocolate 43 A mean 4 2 3 3 1 8
P50 4 2 1 1 0 7
P90 8 5 7 9 4 16
max 15 8 16 17 18 29
N <LOD 15 12 13 19 29 11
Dark 33 A mean 5 3 3 4 2 10
P50 5 3 3 1 0 8
P90 9 5 9 9 4 17
max 15 8 16 17 18 29
N <LOD 5 3 4 10 20 2
White 10 A mean 0 0 1 1 0 1
P50 0 0 0 0 0 0
P90 0 0 1 1 0 1
max 0 4 7 9 2 14
N <LOD 10 9 9 9 9 9
Table 58: Overview of BA-distribution in beer and it's subgroups. Mean, median, P50, P90 and max are given in mg/kg. Timepoint A = day of purchace = day 0; Timepoint B = after expiry date.
Category N Timepoint
Tryptamine B-Phenylethylamine Putrescine Cadaverine Histamine Tyramine
Beer 70 A mean 0 0 5 4 4 10
P50 0 0 3 0 0 0
P90 0 2 8 10 16 33
max 7 6 36 52 29 67
N <LOD 65 56 0 44 51 46

101
Amber 7 A mean 0 0 4 0 3 1
P50 0 0 3 0 0 0
P90 0 0 7 0 8 4
max 0 0 11 0 20 9
N <LOD 7 7 0 7 6 6
Light/Lager 22 A mean 0 0 5 1 2 8
P50 0 0 3 0 0 0
P90 0 1 4 2 0 40
max 0 1 36 13 20 67
N <LOD 22 18 0 16 20 18
Dark 13 A mean 2 0 4 0 0 1
P50 0 0 3 0 0 0
P90 6 0 4 0 0 0
max 7 0 5 1 0 11
N <LOD 8 13 0 12 13 12
Home-brewed 7 A mean 0 0 3 0 0 0
P50 0 0 3 0 0 0
P90 0 0 4 0 0 0
max 0 0 5 0 0 0
N <LOD 7 7 0 4 7 7
Fruit beer 21 A mean 0 1 6 10 11 25
P50 0 0 5 4 11 26
P90 0 2 12 33 23 39
max 0 6 19 52 29 64
N <LOD 21 11 0 5 5 3
Table 59:Overview of BA-distribution in dairy products and it's subgroups. Mean, median, P50, P90 and max are given in mg/kg. Timepoint A = day of purchace = day 0; Timepoint B = after expiry date.
Category N Timepoint
Tryptamine B-Phenylethylamine Putrescine Cadaverine Histamine Tyramine
Dairy 104 A mean 2 4 17 30 25 86
P50 0 0 0 1 0 0
P90 0 16 48 77 56 300
max 110 73 269 406 1025 1111
N <LOD 92 75 61 39 62 53

102
B mean 3 8 17 39 30 104
P50 0 0 0 1 0 4
P90 0 18 56 100 67 390
max 110 219 255 904 1025 1306
N <LOD 92 75 53 37 64 50
Yoghurt 18 A mean 0 0 0 0 0 0
P50 0 0 0 0 0 0
P90 0 0 0 1 0 0
max 0 0 3 2 0 6
N <LOD 16 16 15 9 16 15
B mean 0 0 0 1 0 0
P50 0 0 0 0 0 0
P90 0 0 0 1 0 0
max 0 0 3 2 0 6
N <LOD 16 16 15 8 16 15
Soft cheese 26 A mean 0 3 23 40 13 21
P50 0,0 0,0 0,0 0,0 0,0 0,0
P90 0,0 12,8 61,2 112,1 48,9 41,2
max 3 20 253 399 110 245
N <LOD 25 20 14 14 17 20
B mean 1 3 26 75 18 33
P50 0,0 0,0 1,3 0,9 0,0 0,0
P90 0,0 12,5 102,5 141,0 65,2 77,0
max 15 19 252 904 176 393
N <LOD 24 19 12 11 18 18
Half Hard cheese 19 A mean 1 7 12 28 22 54
P50 0 0 0 2 0 14
P90 4 17 51 28 71 209
max 12 73 98 406 207 227
N <LOD 16 13 11 5 11 9
B mean 4 28 13 29 35 135
P50 0 0 2 3 0 17
P90 6 93 59 35 71 326
max 69 219 98 406 444 1029
N <LOD 16 12 7 5 11 6
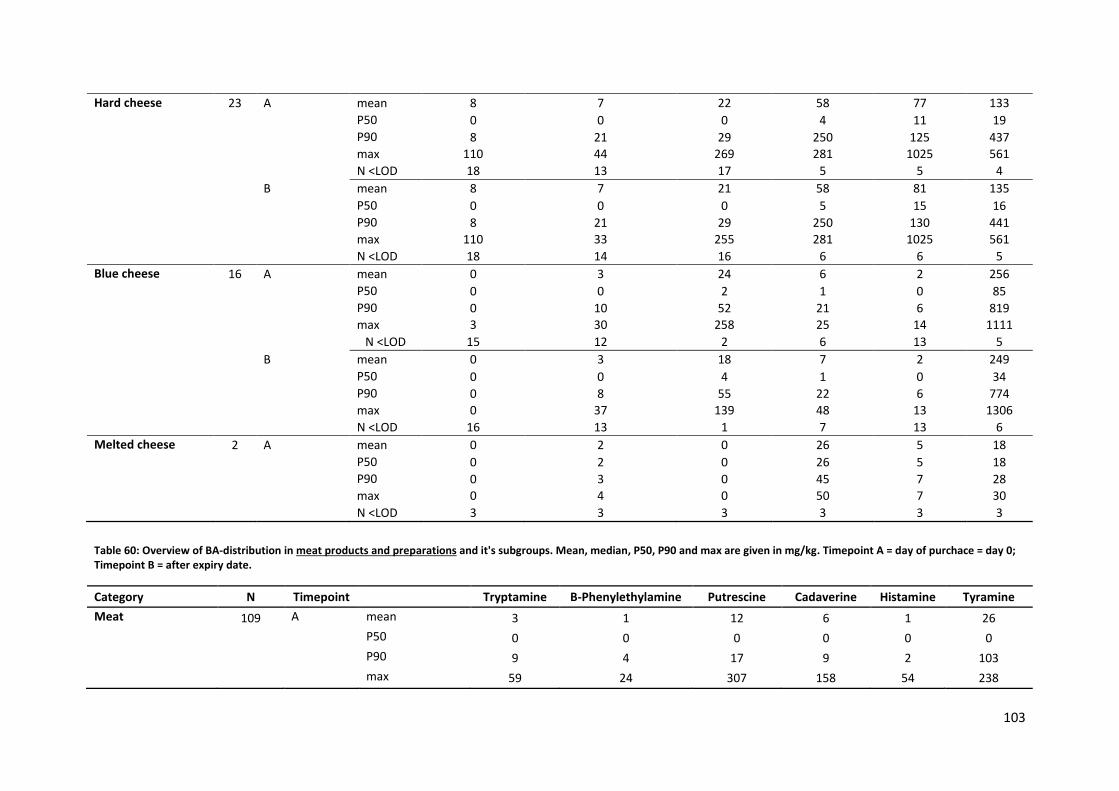
103
Hard cheese 23 A mean 8 7 22 58 77 133
P50 0 0 0 4 11 19
P90 8 21 29 250 125 437
max 110 44 269 281 1025 561
N <LOD 18 13 17 5 5 4
B mean 8 7 21 58 81 135
P50 0 0 0 5 15 16
P90 8 21 29 250 130 441
max 110 33 255 281 1025 561
N <LOD 18 14 16 6 6 5
Blue cheese 16 A mean 0 3 24 6 2 256
P50 0 0 2 1 0 85
P90 0 10 52 21 6 819
max 3 30 258 25 14 1111
N <LOD 15 12 2 6 13 5
B mean 0 3 18 7 2 249
P50 0 0 4 1 0 34
P90 0 8 55 22 6 774
max 0 37 139 48 13 1306
N <LOD 16 13 1 7 13 6
Melted cheese 2 A mean 0 2 0 26 5 18
P50 0 2 0 26 5 18
P90 0 3 0 45 7 28
max 0 4 0 50 7 30
N <LOD 3 3 3 3 3 3
Table 60: Overview of BA-distribution in meat products and preparations and it's subgroups. Mean, median, P50, P90 and max are given in mg/kg. Timepoint A = day of purchace = day 0; Timepoint B = after expiry date.
Category N Timepoint
Tryptamine B-Phenylethylamine Putrescine Cadaverine Histamine Tyramine
Meat 109 A mean 3 1 12 6 1 26
P50 0 0 0 0 0 0
P90 9 4 17 9 2 103
max 59 24 307 158 54 238

104
N <LOD 89 90 55 57 88 56
B mean 7 2 13 12 2 45
P50 0 0 1 1 0 15
P90 25 7 28 22 4 134
max 112 24 183 269 54 365
N <LOD 76 79 48 36 82 34
Salami 8 A mean 4 4 34 3 2 65
P50 0 1 4 2 0 63
P90 9 11 87 4 6 130
max 31 12 141 57 13 153
N <LOD 3 3 4 1 5 2
B mean 4 3 28 9 2 48
P50 0 2 6 3 0 28
P90 11 10 85 22 6 125
max 31 10 136 57 13 134
N <LOD 2 2 2 2 2 2
Dried sausage 17 A mean 9 4 45 21 5 79
P50 2 1 3 2 0 71
P90 32 10 145 64 11 180
max 33 24 307 158 54 226
N <LOD 8 8 7 5 12 3
B mean 7 6 30 18 5 75
P50 0 4 9 2 0 64
P90 27 13 105 50 12 171
max 33 24 156 158 54 205
N <LOD 9 7 4 4 11 2
Cooked ham 16 A mean 1 0 3 1 0 10
P50 0 0 0 0 0 0
P90 2 0 0 2 0 28

105
max 6 3 47 5 2 86
N <LOD 12 15 15 13 15 9
B mean 1 0 0 5 0 26
P50 0 0 0 0 0 25
P90 3 0 0 9 2 60
max 4 0 3 56 2 70
N <LOD 11 16 14 8 13 3
Raw ham 23 A mean 2 0 3 5 0 13
P50 0 0 1 1 0 0
P90 7 0 6 5 1 54
max 20 2 32 77 2 107
N <LOD 19 22 9 10 20 13
B mean 9 2 17 3 1 41
P50 0 0 1 1 0 0
P90 30 7 38 11 0 134
max 112 12 183 18 22 365
N <LOD 18 17 8 7 21 12
Raw dried beef 5 A mean 14 1 1 15 2 69
P50 0 0 1 0 2 28
P90 39 3 2 39 3 168
max 59 5 3 44 4 238
N <LOD 3 4 0 3 2 0
B mean 34 1 10 36 2 151
P50 9 0 3 0 2 107
P90 86 3 22 107 5 250
max 109 4 23 177 7 265
N <LOD 2 3 1 3 2 0
Meat preparations 40 A mean 0 0 4 2 0 6
P50 0 0 0 0 0 0

106
P90 0 0 2 6 1 12
max 0 4 157 18 3 102
N <LOD 40 38 20 25 34 29
B mean 6 0 6 15 2 29
P50 0 0 1 1 0 5
P90 16 2 5 47 4 96
max 83 3 163 269 29 195
N <LOD 30 33 19 13 30 15

107
Appendix 16: Box-plots of BA-concentrations belonging to Part 1 of the statistical analysis.
Figure 21: BA-concentrations at day 0 for animal versus plant-based food products.
Figure 22: BA-concentrations at the expiry date for animal versus plant-based food products.

108
Figure 23: Evolution in BA-concentrations during storage for animal versus plant-based food products.
Figure 24: BA-concentrations at day 0 for fermented versus non-fermented food products.

109
Figure 25: BA-concentrations at the expiry date for fermented versus non-fermented food products.
Figure 26: Evolution in BA-concentrations during storage for fermented versus non-fermented food products.

110
Figure 27: BA-concentrations at day 0 for fermented versus non-fermented within animal and plant-based products.
Figure 28: BA-concentrations at the expiry date for fermented versus non-fermented within animal and plant-based products. Note: non-fermented plant-based products were eliminated from the database, due to invalid B-values.

111
Figure 29: Evolution in BA-concentrations during storage for fermented versus non-fermented within animal and plant-based products. Note: non-fermented plant-based samples were eliminated from the database, due to invalid B-values.

112
Appendix 17: Tables representing the p-values resulting from the mean comparisons (ANOVA) of
the BA-concentrations in the different food groups.
Table 61: p-values for the independent one-way ANOVA tests comparing the BA-concentrations in the different food groups at day 0 (significance level of 5%). Significant p-values are presented in bold.
Tryptamine
Fruit and Vegetables Chocolate Beer Dairy Meat
Fruit and Vegetables 1 0,041 0 0,006 0,358
Chocolate
1 0 0 0
Beer
1 0,776 0,043
Dairy
1 0,485
Meat
1
β-phenylethylamine
Fruit and Vegetables Chocolate Beer Dairy Meat
Fruit and Vegetables 1 0 0,994 0,001 0,483
Chocolate
1 0 0,179 0
Beer
1 0,004 1
Dairy
1 0,068
Meat
1
Putrescine
Fruit and Vegetables Chocolate Beer Dairy Meat
Fruit and Vegetables 1 0 0,007 0 0
Chocolate
1 0,001 1 0,951
Beer
1 0,003 0
Dairy
1 0,967
Meat
1
Cadaverine
Fruit and Vegetables Chocolate Beer Dairy Meat
Fruit and Vegetables 1 0,969 0,360 0,394 0,863
Chocolate
1 0,775 0,128 0,999
Beer
1 0,004 0,829
Dairy
1 0,035
Meat
1
Histamine
Fruit and Vegetables Chocolate Beer Dairy Meat
Fruit and Vegetables 1 0 0,054 0,943 0
Chocolate
1 0,679 0,017 0,540
Beer
1 0,384 0,044
Dairy
1 0
Meat
1
Tyramine
Fruit and Vegetables Chocolate Beer Dairy Meat
Fruit and Vegetables 1 0,123 1 0,038 0,481
Chocolate
1 0,121 0,914 0,951
Beer
1 0,037 0,454
Dairy
1 0,600
Meat
1

113
Table 62: p-values for the independent one-way ANOVA tests comparing the BA-concentrations between the different food groups at the expiry date (significance level of 5%). Significant p-values are presented in bold.
Tryptamine
Fruit and Vegetables Chocolate Beer Dairy Meat
Fruit and Vegetables 1 0,166 0 0,024 1
Chocolate 1 0 0 0,198
Beer 1 0,601 0
Dairy 1 0,008
Meat 1
β-phenylethylamine
Fruit and Vegetables Chocolate Beer Dairy Meat
Fruit and Vegetables 1 0 1 0,006 0,102
Chocolate 1 0 0,489 0,001
Beer 1 0,002 0,028
Dairy 1 0,479
Meat 1
Putrescine
Fruit and Vegetables Chocolate Beer Dairy Meat
Fruit and Vegetables 1 0,003 0,310 0,016 0,013
Chocolate 1 0,001 0,960 0,960
Beer 1 0,042 0,018
Dairy 1 1
Meat 1
Cadaverine
Fruit and Vegetables Chocolate Beer Dairy Meat
Fruit and Vegetables 1 0,196 0,013 0,983 0,955
Chocolate 1 0,775 0,032 0,325
Beer 1 0,001 0,010
Dairy 1 0,626
Meat 1
Histamine
Fruit and Vegetables Chocolate Beer Dairy Meat
Fruit and Vegetables 1 0,004 0,132 0,995 0,001
Chocolate 1 0,679 0,010 0,994
Beer 1 0,271 0,366
Dairy 1 0,001
Meat 1
Tyramine
Fruit and Vegetables Chocolate Beer Dairy Meat
Fruit and Vegetables 1 0,918 0,735 0,368 0,014
Chocolate 1 0,121 0,726 0,041
Beer 1 0,013 0
Dairy 1 0,765
Meat 1

114
Table 63: p-values for the independent one-way ANOVA tests comparing the evolutions in BA-concentrations between the different food groups (significance level of 5%). Significant p-values are presented in bold.
Tryptamine
Fruit and Vegetables Chocolate Beer Dairy Meat
Fruit and Vegetables 1 0,120 0,120 0,078 0,001
Chocolate
1 0 0,879 0,011
Beer
1 0,879 0,011
Dairy
1 0,053
Meat
1
β-phenylethylamine
Fruit and Vegetables Chocolate Beer Dairy Meat
Fruit and Vegetables 1 0,965 0,965 1 0,799
Chocolate
1 1 0,866 0,064
Beer
1 1 0,064
Dairy
1 0,854
Meat
1
Putrescine
Fruit and Vegetables Chocolate Beer Dairy Meat
Fruit and Vegetables 1 0,065 0,065 0,003 0,039
Chocolate
1 1 0,087 0,363
Beer
1 0,087 0,363
Dairy
1 0,926
Meat
1
Cadaverine
Fruit and Vegetables Chocolate Beer Dairy Meat
Fruit and Vegetables 1 0,858 0,858 0,110 0,007
Chocolate
1 1 0,171 0,012
Beer
1 0,171 0,012
Dairy
1 0,314
Meat
1
Histamine
Fruit and Vegetables Chocolate Beer Dairy Meat
Fruit and Vegetables 1 0,845 0,845 0,999 0,769
Chocolate
1 1 0,646 0,244
Beer
1 0,646 0,244
Dairy
1 0,863
Meat
1
Tyramine
Fruit and Vegetables Chocolate Beer Dairy Meat
Fruit and Vegetables 1 0,698 0,698 0,599 0
Chocolate
1 1 0,827 0
Beer
1 0,827 0
Dairy
1 0,001
Meat
1

115
Appendix 18: Correlation triplots resulting from redundancy analyses (RDA) executed to analyze
the correlations between BA, FAA and microbial concentrations.
Figure 30: Triplot for the RDA with FAA and factors fermented/non-fermented and animal/plant as explanatory variables (blue arrows) and BA-concentrations at the expiry date as response variables (red dots and names). The black circles represent the individual samples.

116
Figure 31: Triplot for the RDA with FAA and factors fermented/non-fermented and animal/plant as explanatory variables (blue arrows) and BA-evolutions as response variables (red dots and names). The black circles represent the individual samples.

117
Figure 32: Triplot for the RDA with microbial data and factors fermented/non-fermented and animal/plant as explanatory variables (blue arrows) and BA-concentrations at the expiry date (F&V) as response variables (red dots and names). The black circles represent the individual samples.

118
Figure 33: Triplot for the RDA with microbial data and factors fermented/non-fermented and animal/plant as explanatory variables (blue arrows) and BA-concentrations at the expiry date (dairy products) as response variables (red dots and names). The black circles represent the individual samples.
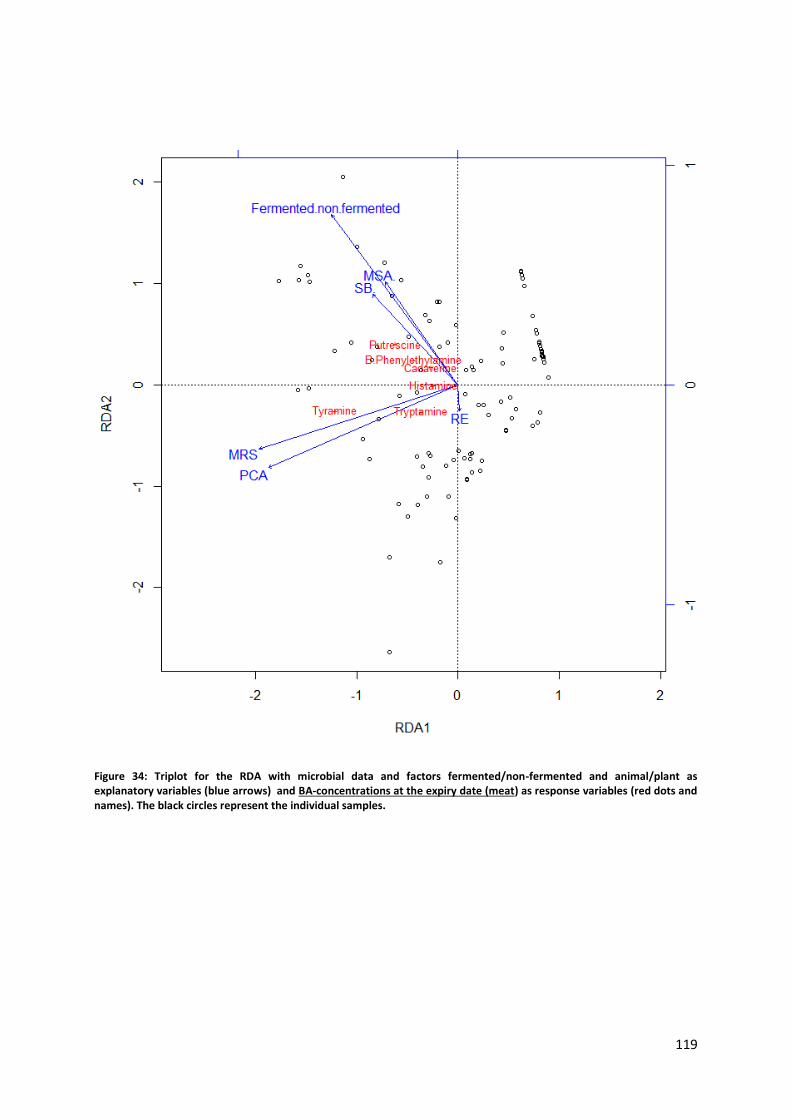
119
Figure 34: Triplot for the RDA with microbial data and factors fermented/non-fermented and animal/plant as explanatory variables (blue arrows) and BA-concentrations at the expiry date (meat) as response variables (red dots and names). The black circles represent the individual samples.

120
Figure 35: Triplot for the RDA with microbial data and factors fermented/non-fermented and animal/plant as explanatory variables (blue arrows) and BA-evolutions (F&V) as response variables (red dots and names). The black circles represent the individual samples.

121
Figure 36: Triplot for the RDA with microbial data and factors fermented/non-fermented and animal/plant as explanatory variables (blue arrows) and BA-evolutions (dairy products) as response variables (red dots and names). The black circles represent the individual samples.

122
Figure 37: Triplot for the RDA with microbial data and factors fermented/non-fermented and animal/plant as explanatory variables (blue arrows) and BA-evolutions (meat) as response variables (red dots and names). The black circles represent the individual samples.
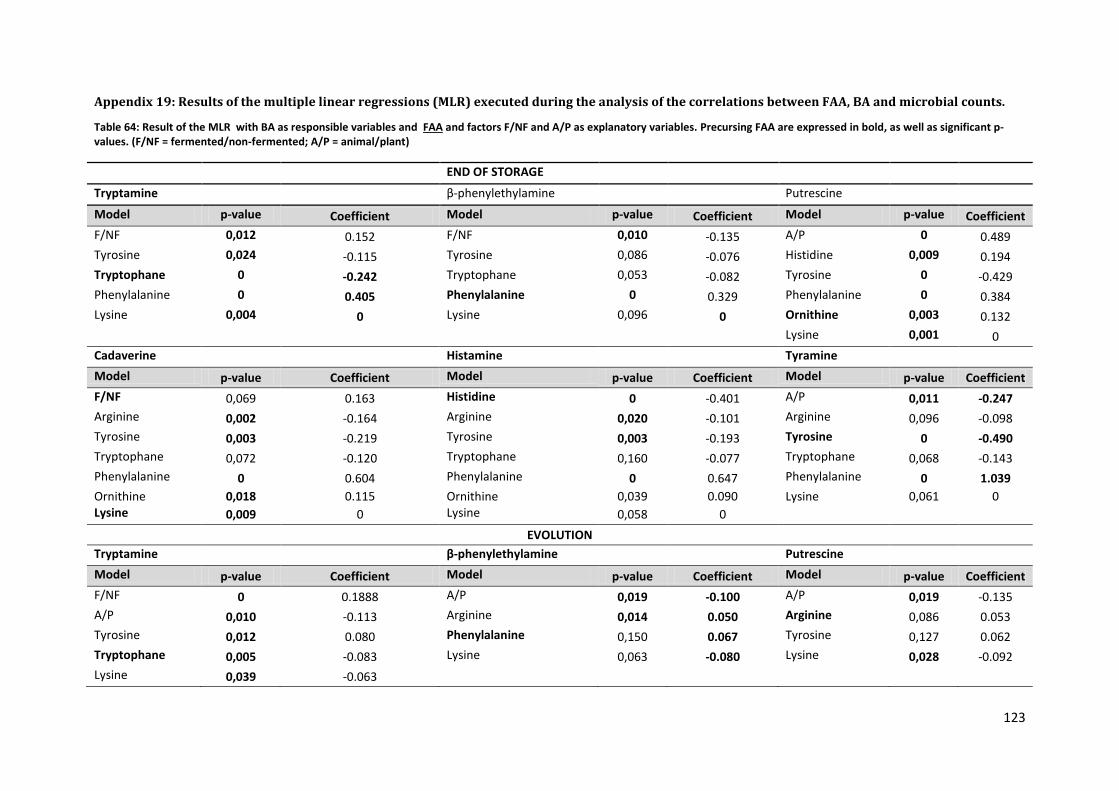
123
Appendix 19: Results of the multiple linear regressions (MLR) executed during the analysis of the correlations between FAA, BA and microbial counts.
Table 64: Result of the MLR with BA as responsible variables and FAA and factors F/NF and A/P as explanatory variables. Precursing FAA are expressed in bold, as well as significant p-values. (F/NF = fermented/non-fermented; A/P = animal/plant)
END OF STORAGE
Tryptamine β-phenylethylamine Putrescine
Model p-value Coefficient Model p-value Coefficient Model p-value Coefficient
F/NF 0,012 0.152 F/NF 0,010 -0.135 A/P 0 0.489
Tyrosine 0,024 -0.115 Tyrosine 0,086 -0.076 Histidine 0,009 0.194
Tryptophane 0 -0.242 Tryptophane 0,053 -0.082 Tyrosine 0 -0.429
Phenylalanine 0 0.405 Phenylalanine 0 0.329 Phenylalanine 0 0.384
Lysine 0,004 0 Lysine 0,096 0 Ornithine 0,003 0.132
Lysine 0,001 0
Cadaverine Histamine Tyramine
Model p-value Coefficient Model p-value Coefficient Model p-value Coefficient
F/NF 0,069 0.163 Histidine 0 -0.401 A/P 0,011 -0.247
Arginine 0,002 -0.164 Arginine 0,020 -0.101 Arginine 0,096 -0.098
Tyrosine 0,003 -0.219 Tyrosine 0,003 -0.193 Tyrosine 0 -0.490
Tryptophane 0,072 -0.120 Tryptophane 0,160 -0.077 Tryptophane 0,068 -0.143
Phenylalanine 0 0.604 Phenylalanine 0 0.647 Phenylalanine 0 1.039
Ornithine 0,018 0.115 Ornithine 0,039 0.090 Lysine 0,061 0 Lysine 0,009 0 Lysine 0,058 0
EVOLUTION
Tryptamine β-phenylethylamine Putrescine
Model p-value Coefficient Model p-value Coefficient Model p-value Coefficient
F/NF 0 0.1888 A/P 0,019 -0.100 A/P 0,019 -0.135
A/P 0,010 -0.113 Arginine 0,014 0.050 Arginine 0,086 0.053
Tyrosine 0,012 0.080 Phenylalanine 0,150 0.067 Tyrosine 0,127 0.062
Tryptophane 0,005 -0.083 Lysine 0,063 -0.080 Lysine 0,028 -0.092
Lysine 0,039 -0.063

124
Cadaverine Histamine Tyramine
Model p-value Coefficient Model p-value Coefficient Model p-value Coefficient
F/NF 0 0.206 A/P 0,042 -0.056 F/NF 0 0.330
Histidine 0,002 0.133 Phenylalanine 0,100 0.034 A/P 0,002 -0.211
Arginine 0,046 -0.064 Ornithine 0,014 -0.040 Arginine 0,127 -0.063
Ornithine 0,001 -0.091 Phenylalanine 0,131 0.083
Ornithine 0,005 -0.108
Table 65: Result of the MLR with BA as responsible variables and microbial counts (F&V) and factors F/NF and A/P as explanatory variables. Significant p-values are expressed in bold. (F/NF = fermented/non-fermented; A/P = animal/plant, PCA: total bacterial count; MRS: Lactic acid bacteria; SB: Enterococci; RE: Enterobacteriaceae)
END OF STORAGE
Tryptamine β-phenylethylamine Putrescine
Model p-value Coefficient Model p-value Coefficient Model p-value Coefficient
F/NF 0,004 -0.322 SB 0,026 0.111 F/NF 0,07 0.389
Cadaverine Histamine Tyramine
Model p-value Coefficient Model p-value Coefficient Model p-value Coefficient
F/NF 0,026 0.414 1 / / F/NF 0,013 -0.451
SB 0,002
EVOLUTION
Tryptamine β-phenylethylamine Putrescine
Model p-value Coefficient Model p-value Coefficient Model p-value Coefficient
F/NF 0,159 0.113 1 / / F/NF 0,003 0.323
PCA 0,001 -0.101
MRS 0,011 0.070
SB 0,013 0.123
Model p-value Coefficient Model p-value Coefficient Model p-value Coefficient
PCA 0,004 -0.108 1 / / MRS 0,061 0.026
MRS 0 0.129 PA 0,037 -0.017

125
SB 0 0.336
PA 0,007 0.061
Table 66: Result of the MLR with BA as responsible variables and microbial counts (dairy products) and factors F/NF and A/P as explanatory variables. Significant p-values are expressed in bold. (F/NF = fermented/non-fermented; A/P = animal/plant, PCA: total bacterial count; MRS: Lactic acid bacteria; SB: Enterococci; RE: Enterobacteriaceae)
END OF STORAGE
Tryptamine β-phenylethylamine Putrescine
Model p-value Coefficient Model p-value Coefficient Model p-value Coefficient
1 / / SB 0,001 0.115 SB 0,093 0.071
RE 0 0.209
Cadaverine Histamine Tyramine
Model p-value Coefficient Model p-value Coefficient Model p-value Coefficient
SB 0,031 0.111 MRS 0,024 0.094 MRS 0,047 0.096
RE 0,001 0.171 RE 0,152 0.076 RE 0 0.252
EVOLUTION
Tryptamine β-phenylethylamine Putrescine
Model p-value Coefficient Model p-value Coefficient Model p-value Coefficient
1 / / 1 / / 1 / /
Cadaverine Histamine Tyramine
Model p-value Coefficient Model p-value Coefficient Model p-value Coefficient
SB 0,099 0.031 MRS 0,082 0.016 1 / /
Table 67: Result of the MLR with BA as responsible variables and microbial counts (meat) and factors F/NF and A/P as explanatory variables. Significant p-values are expressed in bold. (F/NF = fermented/non-fermented; A/P = animal/plant, PCA: total bacterial count; MRS: Lactic acid bacteria; SB: Enterococci; RE: Enterobacteriaceae)
Tryptamine
β-phenylethylamine
Putrescine
Model p-value Model p-value Model p-value
PCA 0,003 0.088 F/NF 0 -0.335 F/NF 0 -0.557
MRS 0,014 0.042 MRS 0,095 0.049

126
RE 0,082 -0.062
Cadaverine Histamine Tyramine
Model p-value Model p-value Model p-value
SB 0,038 0.148 MRS 0,029 0.039 MRS 0 0.212
RE 0,102 0.100 MSA 0,123 0.039
Tryptamine β-phenylethylamine Putrescine
Model p-value Model p-value Model p-value
F/NF 0,004 0.363 F/NF 0,132 0.128 PCA 0,059 0.065
MRS 0,007 0.069 MRS 0,015 0.040
SB 0,064 0.074
RE 0,080 -0.060
Cadaverine Histamine Tyramine
Model p-value Model p-value Model p-value
PCA 0,038 0.064 MRS 0,047 0.031 F/NF 0,005 0.566
RE 0,005 0.169 MRS 0 0.168
MSA 0,023 -0.091 MSA 0,134 -0.082