Biogen Inc. - Climate Change 2020
41
Biogen Inc. - Climate Change 2020 C0. Introduction C0.1 (C0.1) Give a general description and introduction to your organization. Caring Deeply. Working Fearlessly. Changing Lives. ™ At Biogen, our mission is clear: we are pioneers in neuroscience. Since our founding in 1978 as one of the world’s first global biotechnology companies by Charles Weissmann, Heinz Schaller, Kenneth Murray and Nobel Prize winners Walter Gilbert and Phillip Sharp, Biogen has led innovative scientific research with the goal over the last decade to defeat devastating neurological diseases. Millions of people around the world are affected by multiple sclerosis, Alzheimer’s disease, Parkinson’s disease and amyotrophic lateral sclerosis (ALS). Many people also suffer from less common diseases such as spinal muscular atrophy (SMA) and progressive supranuclear palsy (PSP). We believe that no other disease area holds as much need or as much promise for medical breakthroughs as neuroscience. Biogen has some of the world’s best neurologists and neuroscientists. We engage with physicians and scientific leaders around the world with the aim to further medical research. Our focus on neuroscience, our deep scientific expertise and our courage to take risks make us leaders in the research and development of medicines to transform neuroscience to benefit society. Our technology and engineering capabilities create novel ways to seamlessly transition products from development to manufacturing with the intent of bringing our high-quality medicines to market faster. We respect the contributions of health care providers caring for people living with neurological diseases. We honor the important role of caregivers, families and friends who care about them. Biogen is committed to working with advocacy and patient organizations as they serve the communities they represent. Recognizing the challenges facing health care systems today, we collaborate with regulatory authorities and customers such as health care providers and payers, so that those in need can access our medicines. Professional, ethical, and compliant, we hold ourselves accountable to deliver value to our shareholders. Biogen contributes to the communities where we live. We are committed to our employees, diversity and inclusion, and environmental sustainability. We care deeply about making a difference. We work fearlessly. We do not give up even when challenged, pursuing innovation in all that we do. We are humbled by the opportunity to change lives. Biogen is listed on the Global Select Market of the NASDAQ Stock Market under the symbol BIIB. Our global headquarters in Cambridge, Mass., is also home to our research operations and small-scale manufacturing facility, with an international headquarters in Zug, Switzerland, and world-class manufacturing facilities in Research Triangle Park (RTP), N.C., and Solothurn, Switzerland. We offer therapies globally through direct affiliate presence in more than 34 countries and a network of distribution partners in more than 70 additional countries. C0.2 (C0.2) State the start and end date of the year for which you are reporting data. Start date End date Indicate if you are providing emissions data for past reporting years Select the number of past reporting years you will be providing emissions data for Reporting year January 1 2019 December 31 2019 No <Not Applicable> C0.3 CDP Page of 41 1
Transcript of Biogen Inc. - Climate Change 2020

Biogen Inc. - Climate Change 2020
C0. Introduction
C0.1
(C0.1) Give a general description and introduction to your organization.
Caring Deeply. Working Fearlessly. Changing Lives. ™
At Biogen, our mission is clear: we are pioneers in neuroscience. Since our founding in 1978 as one of the world’s first global biotechnology companies by CharlesWeissmann, Heinz Schaller, Kenneth Murray and Nobel Prize winners Walter Gilbert and Phillip Sharp, Biogen has led innovative scientific research with the goal over thelast decade to defeat devastating neurological diseases. Millions of people around the world are affected by multiple sclerosis, Alzheimer’s disease, Parkinson’s disease andamyotrophic lateral sclerosis (ALS). Many people also suffer from less common diseases such as spinal muscular atrophy (SMA) and progressive supranuclear palsy (PSP).We believe that no other disease area holds as much need or as much promise for medical breakthroughs as neuroscience.
Biogen has some of the world’s best neurologists and neuroscientists. We engage with physicians and scientific leaders around the world with the aim to further medicalresearch. Our focus on neuroscience, our deep scientific expertise and our courage to take risks make us leaders in the research and development of medicines to transformneuroscience to benefit society. Our technology and engineering capabilities create novel ways to seamlessly transition products from development to manufacturing with theintent of bringing our high-quality medicines to market faster.
We respect the contributions of health care providers caring for people living with neurological diseases. We honor the important role of caregivers, families and friends whocare about them.
Biogen is committed to working with advocacy and patient organizations as they serve the communities they represent. Recognizing the challenges facing health caresystems today, we collaborate with regulatory authorities and customers such as health care providers and payers, so that those in need can access our medicines.Professional, ethical, and compliant, we hold ourselves accountable to deliver value to our shareholders. Biogen contributes to the communities where we live. We arecommitted to our employees, diversity and inclusion, and environmental sustainability.
We care deeply about making a difference.
We work fearlessly. We do not give up even when challenged, pursuing innovation in all that we do.
We are humbled by the opportunity to change lives.
Biogen is listed on the Global Select Market of the NASDAQ Stock Market under the symbol BIIB. Our global headquarters in Cambridge, Mass., is also home to our researchoperations and small-scale manufacturing facility, with an international headquarters in Zug, Switzerland, and world-class manufacturing facilities in Research Triangle Park(RTP), N.C., and Solothurn, Switzerland. We offer therapies globally through direct affiliate presence in more than 34 countries and a network of distribution partners in morethan 70 additional countries.
C0.2
(C0.2) State the start and end date of the year for which you are reporting data.
Start date End date Indicate if you are providing emissions data for past reportingyears
Select the number of past reporting years you will be providing emissions datafor
Reportingyear
January 12019
December 312019
No <Not Applicable>
C0.3
CDP Page of 411

(C0.3) Select the countries/areas for which you will be supplying data.ArgentinaAustraliaAustriaBelgiumBrazilCanadaChileChinaChina, Hong Kong Special Administrative RegionColombiaCzechiaDenmarkFinlandFranceGermanyHungaryIrelandItalyJapanMexicoNetherlandsNew ZealandNorwayPolandPortugalRepublic of KoreaSingaporeSlovakiaSloveniaSpainSwedenSwitzerlandUnited Kingdom of Great Britain and Northern IrelandUnited States of AmericaUruguay
C0.4
(C0.4) Select the currency used for all financial information disclosed throughout your response.USD
C0.5
(C0.5) Select the option that describes the reporting boundary for which climate-related impacts on your business are being reported. Note that this option shouldalign with your chosen approach for consolidating your GHG inventory.Operational control
C1. Governance
C1.1
(C1.1) Is there board-level oversight of climate-related issues within your organization?Yes
C1.1a
(C1.1a) Identify the position(s) (do not include any names) of the individual(s) on the board with responsibility for climate-related issues.
Position ofindividual(s)
Please explain
Director onboard
Board-level Responsibility: The vision, commitment and oversight for our Biogen Healthy Climate Healthy Lives strategy starts at the very top of our organization. The Risk Committee of the Board ofDirectors oversees Biogen’s risk governance framework and infrastructure. In 2019, this committee discussed topics such as information technology, cybersecurity, workplace safety, climate change,and other material risks. Executive-level Responsibility: At the executive management level, our strategy is overseen by the Biogen Healthy Climate Healthy Lives working group, which is sponsoredby our executive vice president for Pharmaceutical Operations and Technology, and includes members of Biogen’s senior leadership team. The duties of this group are governed by the BiogenHealthy Climate Healthy Lives Charter, which includes, among other functions, setting strategy, driving implementation, reviewing progress and aligning resources. The working group meets fourtimes per year, reports to the executive council twice per year, and to the Board once per year.
CDP Page of 412

C1.1b
(C1.1b) Provide further details on the board’s oversight of climate-related issues.
Frequency withwhich climate-related issuesare a scheduledagenda item
Governancemechanisms intowhich climate-related issues areintegrated
Scope ofboard-leveloversight
Please explain
Scheduled –some meetings
Reviewing andguiding strategyReviewing andguiding major plans ofactionReviewing andguiding riskmanagement policiesMonitoring andoverseeing progressagainst goals andtargets for addressingclimate-related issues
<NotApplicable>
The vision, commitment and oversight for our Global Impact Strategy starts at the very top of our organization. The Risk Committee of the Board of Directorsoversees Biogen’s risk governance framework and infrastructure. In 2018, this committee met five times and discussed topics such as information technology,cybersecurity, workplace safety, climate change and other material risks. To date climate change has not had an outsized impact on the organizations and isconsidered a secondary issue by stakeholders. Extreme weather events have occurred that resulted in re-evaluation of existing risk management measuressuch as in the supply chain with Hurricane Maria.
C1.2
(C1.2) Provide the highest management-level position(s) or committee(s) with responsibility for climate-related issues.
Name of the position(s) and/orcommittee(s)
Reporting line Responsibility Coverage ofresponsibility
Frequency of reporting to the board on climate-relatedissues
Chief Operating Officer (COO) <NotApplicable>
Both assessing and managing climate-related risks andopportunities
<Not Applicable> Annually
C1.2a
(C1.2a) Describe where in the organizational structure this/these position(s) and/or committees lie, what their associated responsibilities are, and how climate-related issues are monitored (do not include the names of individuals).
At the executive management level, our strategy is overseen by the Biogen Healthy Climate Healthy Lives working group, which is sponsored by our executive vice presidentfor Pharmaceutical Operations and Technology (this role is the equivalent of a COO), and includes members of Biogen’s senior leadership team. The duties of this group aregoverned by the Biogen Healthy Climate Healthy Lives Charter, which includes, among other functions, setting strategy, driving implementation to company targets, reviewingprogress and aligning resources. The working group meets four times per year, reports to the executive council twice per year, and to the Board once per year.
In 2017, Biogen also added its first Stakeholder Advisory Council, made up of external stakeholders who help to review trends, benchmark our peers and recommendimprovements to goals and initiatives Our Environmental, Health, Safety & Sustainability and Human Performance organization manages day-to-day execution of Biogen’sGlobal Impact Strategy, although the breadth of our strategy extends beyond environmental matters to include patients, community investments and other key issues
C1.3
(C1.3) Do you provide incentives for the management of climate-related issues, including the attainment of targets?
Provide incentives for the management of climate-related issues Comment
Row 1 Yes
C1.3a
CDP Page of 413

(C1.3a) Provide further details on the incentives provided for the management of climate-related issues (do not include the names of individuals).
Entitled to incentive Type ofincentive
Activity inventivized Comment
All employees Monetaryreward
Emissions reduction projectEnergy reduction projectEfficiency project
The Biogen Innovation Fund provides funding for projects that provide innovative solutions to solve business challenges. Past awardwinners have included energy efficiency and environmental conservation projects.
All employees Monetaryreward
Emissions reduction projectEnergy reduction projectEfficiency project
BIG (Biogen Great) is Biogen’s Recognition and Rewards Program. BIG has three over-arching criteria for recognizing thecontributions of fellow employees: Living Our Values, Achieving Excellence and Teaming and Leading.
All employees Monetaryreward
Emissions reduction projectEnergy reduction projectEfficiency project
Our annual global EHS+S Awards recognize non-EHS+S employees who go beyond their regular duties to embrace and strengthenour commitment to sustainability, wellness and safety.
Environment/Sustainabilitymanager
Monetaryreward
Emissions reduction targetCompany performance against aclimate-related sustainability index
Sustainability managers are required to develop annual goals / targets related to emissions reductions and energy reductions andare measured on that performance.
Chief Operating Officer(COO)
Monetaryreward
Emissions reduction target COO has annual goals / targets related to the Biogen Healthy Climate Healthy Lives strategy.
C2. Risks and opportunities
C2.1
(C2.1) Does your organization have a process for identifying, assessing, and responding to climate-related risks and opportunities?Yes
C2.1a
(C2.1a) How does your organization define short-, medium- and long-term time horizons?
From (years) To (years) Comment
Short-term 0 2
Medium-term 2 5
Long-term 5 10
C2.1b
(C2.1b) How does your organization define substantive financial or strategic impact on your business?
A substantive financial or strategy impact on our business would entail a material impact on product development, manufacturing, or delivery. With climate-related risks,examples of a material impact would include a physical plant shutdown for any extended period of time (greater than a hour) due to weather or power outage and a delay ofover one month for supplier materials due to extreme weather or other climate-related event.
C2.2
CDP Page of 414

(C2.2) Describe your process(es) for identifying, assessing and responding to climate-related risks and opportunities.
Value chain stage(s) coveredDirect operationsUpstream
Risk management processIntegrated into multi-disciplinary company-wide risk management process
Frequency of assessmentMore than once a year
Time horizon(s) coveredShort-termMedium-termLong-term
Description of processOne component of Biogen's Enterprise Risk Management process is to proactively reach out to managers across the organization each year to flag changing and emergingrisks that should be added into the overall ERM process. In 2019, the Task Force on Climate-related Financial Disclosures recommendations was one of the topic flaggedfor inclusion into the overall ERM process. This program proactively fosters collaboration and at all levels, reducing risk before and after the fact. Biogen’s Enterprise RiskManagement Committee meets bimonthly to discuss risk management initiatives and provide governance for the organization’s Enterprise Risk Management, BusinessContinuity and Crisis Management functions. The group is representative of all major functions within the organization and its members are charged with promoting riskawareness and culture within their respective business areas. At the business level, Biogen is identifying, assessing and responding to climate-related risks on multiplefronts. Procurment identified short-term distruptions to upstream supply chain risks as a signfiicant area of concern and integrated software to rapid identify, assess andrespond to severe events with the most notable example in recent past being Hurricane Marie in Puerto Rico. The Global EHS+S department continues to provide supportthrough high level screening of our facilities towards the medium and long-term impacts of a changing climate such as water security. The opportunities related to climatechange are managed by the Biogen Healthy Climate Healthy Lives strategy, which will leverage innovation towards a low carbon economy to drive production efficiency andemployee engagement in the medium to long-term. Our pledge to transition our fleet to electric vehicles by 2025 and integate green chemistry principles across all stages ofproduct development being two examples.
C2.2a
(C2.2a) Which risk types are considered in your organization's climate-related risk assessments?
Relevance&inclusion
Please explain
Currentregulation
Relevant,alwaysincluded
Biogen has significant operations located in areas with ongoing carbon-related regulations, specifically the Switzerland carbon tax, and EU ETS. While the biopharmaceutical industry hasa low carbon intensity, changes in current regulations can present financial risks.
Emergingregulation
Relevant,alwaysincluded
Biogen has significant operations located in areas with emerging regulations, specifically Massachusetts and the United States as a whole. While the biopharmaceutical industry has a lowcarbon intensity, introduction of new regulations have the potential to present financial risks.
Technology Notrelevant,explanationprovided
Technological improvements that support a transition to a low carbon economy are viewed as potential opportunities rather than risks. However, these opportunities are not relevant toBiogen's core business strategy.
Legal Notrelevant,explanationprovided
Biogen's business strategy and sphere of operation are unrelated to climate-related legal considerations.
Market Notrelevant,explanationprovided
As a biopharmaceutical company, the cost of goods sold is a much smaller percentage of the sales price compared to most other sectors. As a result, market risks related to shifts insupply and demand of commodities, products and services are not sufficiently relevant at this time given Biogen's size.
Reputation Relevant,sometimesincluded
Climate change is a serious risk to human health and our business. The World Health Organization identifies climate change as “the greatest threat to global health in the 21st century.”The direct and indirect impacts to health are already being felt around the world due to extreme weather events, the spread of infectious diseases, and degradation of air quality. Theseimpacts often burden the most vulnerable and least served portions of our society (e.g., children, elderly, and the poor) the hardest. As a science-based company focused on improvingthe quality of life, stakeholders may set expectations related to Biogen's efforts towards climate change. For example, Biogen operates in a highly competitive industry where human andintellectual capital is essential for success. Loss of highly-qualified employees to competitors due to falling short of expectations could place Biogen’s research and development efforts atrisk.
Acutephysical
Relevant,alwaysincluded
One of the most significant risk stems from changes in precipitation and usual weather patterns. Biogen's physical locations and its supply chain are exposed to increased volatile andextreme weather events (snow storms, hurricanes, and droughts).
Chronicphysical
Relevant,sometimesincluded
Biogen's operational footprint is largely located in areas without known significant long-term climate impacts (e.g. droughts, and heat waves). As a result relevance is on a specific case-by-case basis such as new facility siting.
C2.3
(C2.3) Have you identified any inherent climate-related risks with the potential to have a substantive financial or strategic impact on your business?Yes
C2.3a
(C2.3a) Provide details of risks identified with the potential to have a substantive financial or strategic impact on your business.
CDP Page of 415

IdentifierRisk 1
Where in the value chain does the risk driver occur?Direct operations
Risk type & Primary climate-related risk driver
Emerging regulation Carbon pricing mechanisms
Primary potential financial impactIncreased indirect (operating) costs
Climate risk type mapped to traditional financial services industry risk classification<Not Applicable>
Company-specific descriptionThe most significant risk consists of the establishment of federal legislation on greenhouse gas emissions that mandates GHG reductions and/or establishes a non-revenueneutral carbon tax (beyond those regions with carbon taxes already inplace such as Denmark). To mitigate this risk, Biogen is taking proactive steps to source 100% of itselectricity consumption and thus associated GHG emissions from renewable sources as well as continuing to invest in sustainable innovation internally.
Time horizonMedium-term
LikelihoodMore likely than not
Magnitude of impactMedium-low
Are you able to provide a potential financial impact figure?Yes, a single figure estimate
Potential financial impact figure (currency)1300000
Potential financial impact figure – minimum (currency)<Not Applicable>
Potential financial impact figure – maximum (currency)<Not Applicable>
Explanation of financial impact figureThe extent of financial impact on Biogen will ultimately depend on the exact approach taken by regulators. The impact assumes a $20/MTCO2e tax on carbon and $0/MWHpremium for long-term renewable electricity supply contracts. Additionally, there may be a supplier cost pass-through resulting from regulatory actions, but not quantifiableat this time.
Cost of response to risk250000
Description of response and explanation of cost calculationTo mitigate this risk, Biogen is taking proactive steps to source 100% of its electricity consumption from renewable sources as well as continuing to invest in sustainableinnovation internally. The extent that our current renewable electricity strategy of purchasing and retiring RECs can mitigate this impact is less certain, but not quantifiable atthis time. For the future, we are evaluating alternative purchasing strategies of renewable electricity such as a PPA or direct contract to further mitigate against this risk.
Comment
IdentifierRisk 2
Where in the value chain does the risk driver occur?Upstream
Risk type & Primary climate-related risk driver
Acute physical Increased severity and frequency of extreme weather events such as cyclones and floods
Primary potential financial impactDecreased revenues due to reduced production capacity
Climate risk type mapped to traditional financial services industry risk classification<Not Applicable>
Company-specific descriptionA significant risk stems from changes in precipitation and weather patterns. Biogen's physical locations and its supply chain are exposed to increasingly volatile andextreme weather events (snow storms, hurricanes, and droughts). We have seen an increase in volatile and extreme events at two of our major locations in recent years,specifically in the form of hurricanes and snow storms. Each of these extreme events has impacted business operations and transportation of goods/services/employees.
Time horizonShort-term
LikelihoodVery unlikely
Magnitude of impactMedium
CDP Page of 416

Are you able to provide a potential financial impact figure?Yes, a single figure estimate
Potential financial impact figure (currency)1500000
Potential financial impact figure – minimum (currency)<Not Applicable>
Potential financial impact figure – maximum (currency)<Not Applicable>
Explanation of financial impact figureThe estimated financial impact assumes a 1-day unplanned shutdown of our RTP Drug Substance facility due to impacts to the facility or a key supplier. Small impactsaround $100,000 resulting from temporary office closers are a more likely occurrence.
Cost of response to risk500000
Description of response and explanation of cost calculationBiogen is actively managing this risk via implementing redundancy into our sites and investing in the Resilinc supply chain disruption monitoring software system. Thissoftware was able to mitigate supply chain impacts resulting from the Maria Hurricane that impacted many of our biopharmaceutical supply chain partners in Puerto Rico. ABusiness Continuity Plan for Drought Conditions and Emergency Response plans are in place for inclement weather and wildfires. The estimated cost of management isbased on our redundancy and software investments.
Comment
IdentifierRisk 3
Where in the value chain does the risk driver occur?Direct operations
Risk type & Primary climate-related risk driver
Chronic physical Changes in precipitation patterns and extreme variability in weather patterns
Primary potential financial impactIncreased direct costs
Climate risk type mapped to traditional financial services industry risk classification<Not Applicable>
Company-specific descriptionChanging climates could result in water scarcity issues that would limit water available for manufacturing operations in North Carolina.
Time horizonLong-term
LikelihoodVery unlikely
Magnitude of impactMedium
Are you able to provide a potential financial impact figure?Yes, an estimated range
Potential financial impact figure (currency)<Not Applicable>
Potential financial impact figure – minimum (currency)1000000
Potential financial impact figure – maximum (currency)2000000
Explanation of financial impact figureThe estimated cost of obtaining a sufficient supply of water would be between $1 and $2 million annually. The estimated cost is based on trucking in 50 percent of the waterneeded by the manufacturing operations in North Carolina. This is an annual cost.
Cost of response to risk50000
Description of response and explanation of cost calculationBiogen is managing this risk by working with stakeholders to ensure a sufficient supply of water and increasing water recycling at the RTP Drug Substance facility. On anannual basis we conduct water assessments to understand potential issues of water scarcity in the regions of operation. Additionally, a few years ago Biogen coordinatedwith the City of Cary to replace potable water use with grey water use for irrigation as a means to further reduce demand on the local water system.
Comment
C2.4
(C2.4) Have you identified any climate-related opportunities with the potential to have a substantive financial or strategic impact on your business?Yes
CDP Page of 417
C2.4a
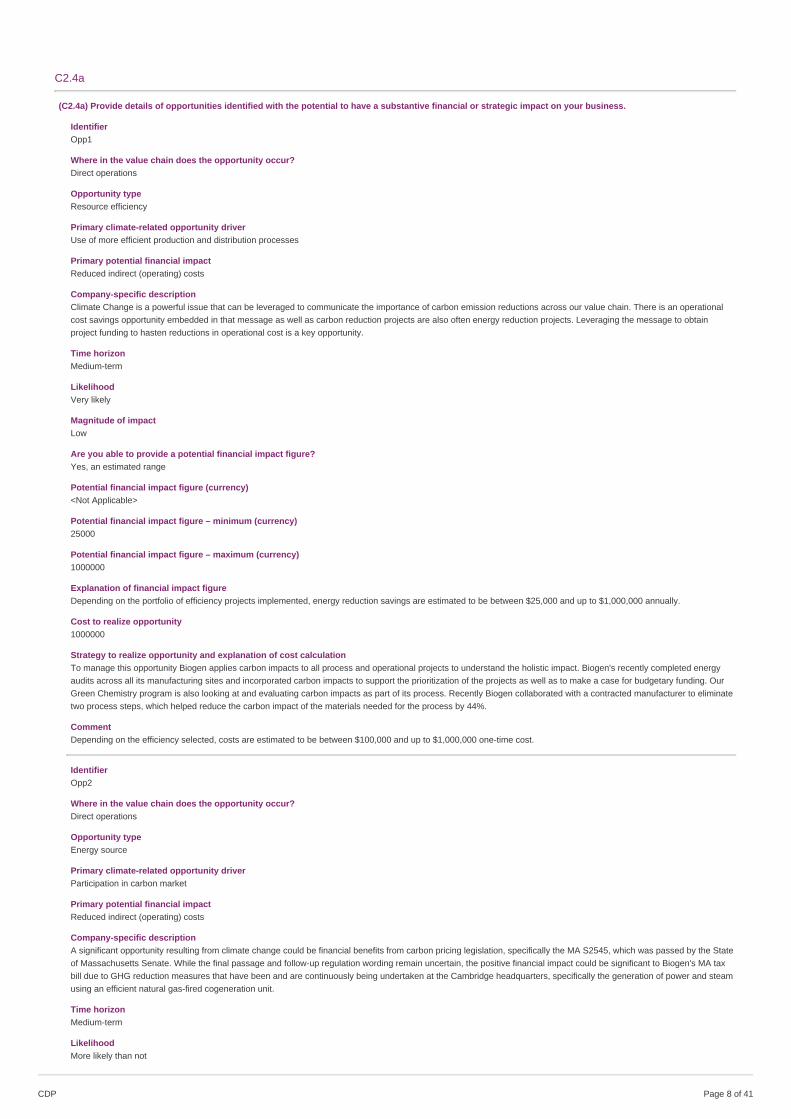
(C2.4a) Provide details of opportunities identified with the potential to have a substantive financial or strategic impact on your business.
IdentifierOpp1
Where in the value chain does the opportunity occur?Direct operations
Opportunity typeResource efficiency
Primary climate-related opportunity driverUse of more efficient production and distribution processes
Primary potential financial impactReduced indirect (operating) costs
Company-specific descriptionClimate Change is a powerful issue that can be leveraged to communicate the importance of carbon emission reductions across our value chain. There is an operationalcost savings opportunity embedded in that message as well as carbon reduction projects are also often energy reduction projects. Leveraging the message to obtainproject funding to hasten reductions in operational cost is a key opportunity.
Time horizonMedium-term
LikelihoodVery likely
Magnitude of impactLow
Are you able to provide a potential financial impact figure?Yes, an estimated range
Potential financial impact figure (currency)<Not Applicable>
Potential financial impact figure – minimum (currency)25000
Potential financial impact figure – maximum (currency)1000000
Explanation of financial impact figureDepending on the portfolio of efficiency projects implemented, energy reduction savings are estimated to be between $25,000 and up to $1,000,000 annually.
Cost to realize opportunity1000000
Strategy to realize opportunity and explanation of cost calculationTo manage this opportunity Biogen applies carbon impacts to all process and operational projects to understand the holistic impact. Biogen's recently completed energyaudits across all its manufacturing sites and incorporated carbon impacts to support the prioritization of the projects as well as to make a case for budgetary funding. OurGreen Chemistry program is also looking at and evaluating carbon impacts as part of its process. Recently Biogen collaborated with a contracted manufacturer to eliminatetwo process steps, which helped reduce the carbon impact of the materials needed for the process by 44%.
CommentDepending on the efficiency selected, costs are estimated to be between $100,000 and up to $1,000,000 one-time cost.
IdentifierOpp2
Where in the value chain does the opportunity occur?Direct operations
Opportunity typeEnergy source
Primary climate-related opportunity driverParticipation in carbon market
Primary potential financial impactReduced indirect (operating) costs
Company-specific descriptionA significant opportunity resulting from climate change could be financial benefits from carbon pricing legislation, specifically the MA S2545, which was passed by the Stateof Massachusetts Senate. While the final passage and follow-up regulation wording remain uncertain, the positive financial impact could be significant to Biogen's MA taxbill due to GHG reduction measures that have been and are continuously being undertaken at the Cambridge headquarters, specifically the generation of power and steamusing an efficient natural gas-fired cogeneration unit.
Time horizonMedium-term
LikelihoodMore likely than not
CDP Page of 418

Magnitude of impactMedium-low
Are you able to provide a potential financial impact figure?Yes, an estimated range
Potential financial impact figure (currency)<Not Applicable>
Potential financial impact figure – minimum (currency)150000
Potential financial impact figure – maximum (currency)250000
Explanation of financial impact figurePreliminary estimations indicate Biogen would receive an annual net rebate of between $150,000 and $250,000 for each $10/MTCO2e. The bill indicates a starting fee ofaround $20/MTCO2e.
Cost to realize opportunity10000
Strategy to realize opportunity and explanation of cost calculationBiogen is monitoring possible legislation, continuing to be transparent regarding its emissions, and implementing measures reducing its overall environmental footprint.Examples of management efforts to reduce the overall environmental footprint are outlined in the energy efficiency improvements in section C4.3.
Comment
IdentifierOpp3
Where in the value chain does the opportunity occur?Direct operations
Opportunity typeResource efficiency
Primary climate-related opportunity driverOther, please specify (Employee productivity)
Primary potential financial impactReduced indirect (operating) costs
Company-specific descriptionReputational opportunities to attract and retain employees. Biogen operates in a highly competitive industry where human and intellectual capital is essential for success.Loss of highly-qualified employees to competitors would place Biogen’s research and development efforts at risk.
Time horizonMedium-term
LikelihoodLikely
Magnitude of impactMedium-low
Are you able to provide a potential financial impact figure?Yes, an estimated range
Potential financial impact figure (currency)<Not Applicable>
Potential financial impact figure – minimum (currency)5000
Potential financial impact figure – maximum (currency)1000000
Explanation of financial impact figureThe impact of any one hire or keeping one individual will vary depending on their criticality to a specific department or product. The estimated financial implications rangecould range from $5,000 to $1 million.
Cost to realize opportunity220000
Strategy to realize opportunity and explanation of cost calculationBiogen communicates its citizenship and sustainability activities to its employees and potential recruits to help bolster its reputation as a responsible corporate citizen.Specific examples include via Earth Day fairs, promotion of EV charging stations and Biogen Bus program as well as our through the annual Corporate SocialResponsibility report.
CommentOur budget varies depending upon the activities we are implementing. For example, in 2017, we spent about $170,000 to offset our Scope 1 and 2 to maintain carbonneutrality and around $50,000 on the Biogen Bus and EV charging stations programs.
C3. Business Strategy
CDP Page of 419

C3.1
(C3.1) Have climate-related risks and opportunities influenced your organization’s strategy and/or financial planning?Yes, and we have developed a low-carbon transition plan
C3.1a
(C3.1a) Does your organization use climate-related scenario analysis to inform its strategy?Yes, qualitative and quantitative
C3.1b
(C3.1b) Provide details of your organization’s use of climate-related scenario analysis.
Climate-relatedscenariosandmodelsapplied
Details
2DS Our Science-based Carbon Target utilized the Science Based Target Initiative's Sectorial Decarbonization Approach (SDA). The SDA methodology is based on the 2°C scenario (2DS) developed by theInternational Energy Agency (IEA) as part of its publication, Energy Technology Perspectives (ETP) 2014 (IEA, 2014). It was developed by CDP, WRI and WWF with the technical support of Ecofys asa consultancy partner. The methodology was created with input from a group of technical advisors, two public stakeholder workshops and one online workshop, and aims to provide businesses with asector-specific and research-backed method to set their emissions goals. The accompanying SDA tool allows companies to enter their data and determine their science-based targets according to themethod and is regularly updated with recent ETP data. Our carbon target provides us with a long-term perspective (out to 2030) on how our business must transform across all aspects as related to theemission of carbon. Given this long-term perspective, assumptions regarding company growth, the transition of utility grids to renewables, global transportation efficiency improvements, and supplierefficiency improvements. On an annual basis we review this long-term scenario analysis to determine which aspects of the company are on-track and which need further development and if priorassumptions need to be amended. The results of this analysis are reported to the Biogen Healthy Climate Healthy governance team and recently have largely reaffirmed the business objective andstrategy surrounding the focus on identifying and implementing innovative improvements to the manufacturing process. Other notable findings from the analysis include additional work needs to bedone towards reducing the impact of our suppliers and company vehicles. Specifically with the company vehicle finding, a strategy is being developed to integrate electric vehicles into our fleet. Aresulting example on our innovative in manufacturing strategy is in 2017 Biogen opened a new facility in Research Triangle Park for the synthesis of antisense oligonucleotides (ASOs), which aremodified RNA molecules used in the treatment of neurological disorders. This new ASO facility and manufacturing platform will produce materials for both our clinical pipeline and commercial products.Our prior ASO purification process used flammable solvents, such as ethanol and methanol, which created hazardous waste. Utilizing green chemistry best practices, a cross-functional team developeda new, more responsible process, replacing the use of ethanol and methanol with a method using salts and water. In addition, we also simplified our filtration process and replaced lyophilization with anultrafiltration technology that enables a ready-to-fill drug substance. This improved purification process eliminates all solvents in downstream processing, removing over 1,500 liters of hazardous wasteper kilogram of product produced. In addition, cycle times are decreased by 50 percent, and the amounts of material, water and energy used – and associated GHG emissions – are also reduced.Finally, the new approach significantly improves the product’s purity levels, making it industry-leading and ensuring we are able to deliver the best quality product for patients. The first clinical batch ofASO was successfully manufactured with this new process in November 2017.
C3.1d
(C3.1d) Describe where and how climate-related risks and opportunities have influenced your strategy.
Have climate-relatedrisks and opportunitiesinfluenced yourstrategy in this area?
Description of influence
Productsandservices
Yes At Biogen, while we strive each day to produce ground-breaking treatments, we also aim to do it while improving our environmental performance. This focus on integratinggreen chemistry principles into our drug development has had a positive impact on the production of clinical assets. We aim to integrate green chemistry into all stages ofdrug development by 2030.
Supplychainand/orvaluechain
Yes We are developing a responsible supplier program to engage and inspire our supplier partners to improve their practices wherever their starting point is. Climate will be a keycomponent of this program with expectations of suppliers to set science-based targets and source renewable electricity. We believe suppliers moving towards a low carboneconomy will be able to accelerate innovation in product development and resource efficiency.
Investmentin R&D
Yes At Biogen, while we strive each day to produce ground-breaking treatments, we also aim to do it while improving our environmental performance. This focus on integratinggreen chemistry principles into our drug development has had a positive impact on the production of clinical assets. We aim to integrate green chemistry into all stages ofdrug development by 2030.
Operations Yes The Biogen Healthy Climate Healthy Lives strategy will have a significant impact on our operations. There are significant regulatory, financial and reputation risks related tothe emission of greenhouse gases and other air pollutants. Over the course of the next couple decades we have the opportunity to demonstrate leadership on the issues ofclimate and clean air by eliminating our impact entirely. With our new strategy, Biogen is the first multinational company to commit to transitioning away from the emission ofgreenhouse gases and other air pollutants across its global footprint.
C3.1e
CDP Page of 4110

(C3.1e) Describe where and how climate-related risks and opportunities have influenced your financial planning.
Financialplanningelements thathave beeninfluenced
Description of influence
Row1
CapitalexpendituresAssets
Biogen continuously explores innovative options to improve the resilience and reliability of its manufacturing facilities. Recently Biogen evaluated the capital purchase of a new cogenerationunit for one of its facilities. This capital project is considered a long-term investment - 5 to 10 years given the potential payback and life span of the unit. As part of the financial assessment,climate-related risks were incorporated into the model. In this case, regulatory risk around carbon emissions was a key consideration. The findings with climate-related risks includedconcluded that the benefits did not outweigh the now greater risks posed by the unit.
C3.1f
(C3.1f) Provide any additional information on how climate-related risks and opportunities have influenced your strategy and financial planning (optional).
C4. Targets and performance
C4.1
(C4.1) Did you have an emissions target that was active in the reporting year?Absolute target
C4.1a
(C4.1a) Provide details of your absolute emissions target(s) and progress made against those targets.
Target reference numberAbs 1
Year target was set2016
Target coverageCompany-wide
Scope(s) (or Scope 3 category)Scope 1+2 (market-based) +3 (upstream & downstream)
Base year2013
Covered emissions in base year (metric tons CO2e)379288
Covered emissions in base year as % of total base year emissions in selected Scope(s) (or Scope 3 category)100
Target year2030
Targeted reduction from base year (%)35
Covered emissions in target year (metric tons CO2e) [auto-calculated]246537.2
Covered emissions in reporting year (metric tons CO2e)491674
% of target achieved [auto-calculated]-84.6593768173149
Target status in reporting yearUnderway
Is this a science-based target?Yes, this target has been approved as science-based by the Science-Based Targets initiative
Please explain (including target coverage)For more information, see our target on sciencebasedtargets.org. Full wording of our target is as follows: “Biogen commits to a 35% reduction of absolute emissions acrossits entire value chain (scopes 1, 2 and 3) by 2030 from a 2013 base-year. Biogen adjusted its approach to engaging suppliers in 2017 to align with standard best practices.Scope 3 emissions are noticeably higher as they are no longer 100% matched with renewable energy certificates. Consequently, Biogen is evaluating its strategy towardsachieving its 35% Absolute Reduction by 2030 target.
CDP Page of 4111

C4.2
(C4.2) Did you have any other climate-related targets that were active in the reporting year?Target(s) to increase low-carbon energy consumption or productionOther climate-related target(s)
C4.2a
(C4.2a) Provide details of your target(s) to increase low-carbon energy consumption or production.
Target reference numberLow 1
Year target was set2014
Target coverageCompany-wide
Target type: absolute or intensityAbsolute
Target type: energy carrierElectricity
Target type: activityConsumption
Target type: energy sourceRenewable energy source(s) only
Metric (target numerator if reporting an intensity target)Percentage
Target denominator (intensity targets only)<Not Applicable>
Base year2013
Figure or percentage in base year1
Target year2014
Figure or percentage in target year100
Figure or percentage in reporting year100
% of target achieved [auto-calculated]100
Target status in reporting yearAchieved
Is this target part of an emissions target?Sourcing of 100% renewable electricity is a key component of our climate Science-based Target.
Is this target part of an overarching initiative?RE100
Please explain (including target coverage)RE100 member Biogen has maintained its achievement of 100% renewable electricity across 30 of the markets in which they operate. In total, this equates to 99.94% oftheir global demand, with 0.06% remaining unmet in South Korea and New Zealand, where Biogen is facing barriers to sourcing RE in accordance with the strict RE100criteria. We look forward to working with our RE100 members to improve supply in these markets.
C4.2b
CDP Page of 4112

(C4.2b) Provide details of any other climate-related targets, including methane reduction targets.
Target reference numberOth 1
Year target was set2020
Target coverageCompany-wide
Target type: absolute or intensityAbsolute
Target type: category & Metric (target numerator if reporting an intensity target)
Low-carbon vehicles Percentage of battery electric vehicles in company fleet
Target denominator (intensity targets only)<Not Applicable>
Base year2020
Figure or percentage in base year1
Target year2027
Figure or percentage in target year100
Figure or percentage in reporting year1
% of target achieved [auto-calculated]0
Target status in reporting yearNew
Is this target part of an emissions target?Yes, transitioning our fleet to electric vehicles is a key component of reducing our dependence on fossil fuels, which impacts both climate and human health.
Is this target part of an overarching initiative?EV100
Please explain (including target coverage)Biogen is headquartered in Cambridge, Massachusetts and is one of the world’s first global biotechnology companies, leading in innovative scientific research with the goalto defeat devastating neurological diseases. As a member of EV100, Biogen has committed to 100% electrification of 1,605 vehicles and deployment of charginginfrastructure for workplace charging at 30 corporate locations.
C4.3
(C4.3) Did you have emissions reduction initiatives that were active within the reporting year? Note that this can include those in the planning and/orimplementation phases.Yes
C4.3a
(C4.3a) Identify the total number of initiatives at each stage of development, and for those in the implementation stages, the estimated CO2e savings.
Number of initiatives Total estimated annual CO2e savings in metric tonnes CO2e (only for rows marked *)
Under investigation 6 1100
To be implemented* 0 0
Implementation commenced* 6 10700
Implemented* 5 1300
Not to be implemented 3 100
C4.3b
(C4.3b) Provide details on the initiatives implemented in the reporting year in the table below.
Initiative category & Initiative type
CDP Page of 4113

Energy efficiency in buildings Lighting
Estimated annual CO2e savings (metric tonnes CO2e)630
Scope(s)Scope 2 (location-based)
Voluntary/MandatoryVoluntary
Annual monetary savings (unit currency – as specified in C0.4)300000
Investment required (unit currency – as specified in C0.4)800000
Payback period1-3 years
Estimated lifetime of the initiative16-20 years
CommentIn 2019 we completed an LED lighting conversion across our Cambridge campus.
Initiative category & Initiative type
Energy efficiency in production processes Smart control system
Estimated annual CO2e savings (metric tonnes CO2e)240
Scope(s)Scope 2 (location-based)
Voluntary/MandatoryVoluntary
Annual monetary savings (unit currency – as specified in C0.4)40000
Investment required (unit currency – as specified in C0.4)15000
Payback period<1 year
Estimated lifetime of the initiative6-10 years
CommentSecondary Pump Differential Pressure Reset + Condenser Water Temp Reset - Implement secondary pump differential pressure reset on secondary pumps. Integrate withPLC automation upgrade.
Initiative category & Initiative type
Energy efficiency in production processes Machine/equipment replacement
Estimated annual CO2e savings (metric tonnes CO2e)270
Scope(s)Scope 1
Voluntary/MandatoryVoluntary
Annual monetary savings (unit currency – as specified in C0.4)24000
Investment required (unit currency – as specified in C0.4)20000
Payback period<1 year
Estimated lifetime of the initiative3-5 years
CommentIn 2019 we performed an IR/UST survey of all campus steam traps and replaced faulty traps.
Initiative category & Initiative type
CDP Page of 4114

Energy efficiency in production processes Smart control system
Estimated annual CO2e savings (metric tonnes CO2e)90
Scope(s)Scope 1Scope 2 (location-based)
Voluntary/MandatoryVoluntary
Annual monetary savings (unit currency – as specified in C0.4)15000
Investment required (unit currency – as specified in C0.4)25000
Payback period1-3 years
Estimated lifetime of the initiative3-5 years
CommentThis project allows confirmation and trending of various controllers including HHW and CWS for heating and dehumidification. There were multiple cases where it wasconfirmed controllers were operating and full open for dehumidification vs. controlling to set point. We have now gone in this year and managed set points to maintainhumidity and balancing against human comfort.
Initiative category & Initiative type
Transportation Company fleet vehicle replacement
Estimated annual CO2e savings (metric tonnes CO2e)60
Scope(s)Scope 1
Voluntary/MandatoryVoluntary
Annual monetary savings (unit currency – as specified in C0.4)0
Investment required (unit currency – as specified in C0.4)10000
Payback periodNo payback
Estimated lifetime of the initiative3-5 years
CommentTo support Biogen’s commitment to establishing a science-based greenhouse gas (GHG) reduction target, Biogen Portugal has been working to implement a sustainabletransportation strategy for our workers in the field. In 2018 Biogen Portugal had a vision of having a fleet of completely electric vehicles (EV) and in 2019 the team beganimplementation. This initiative serves as a pilot to help us understand how to expand our transition to a fossil fuel free fleet.
C4.3c
(C4.3c) What methods do you use to drive investment in emissions reduction activities?
Method Comment
Employee engagement Biogen is launching an Employee Resource Network dedicated to climate and health, which will allow employees across the globe to engage with leadership in reducingtheir department/office's dependency on fossil fuels.
Internal incentives/recognition programs Biogen offers internal incentives/recognition programs, such as The Biogen Innovation Fund, our annual global EHS+S Awards, and the BIG (Biogen Great) Recognitionand Rewards Program.
Compliance with regulatoryrequirements/standards
Biogen prioritizes projects associated with ensuring compliance with regulatory requirements/standards.
Dedicated budget for other emissionsreduction activities
Biogen has a dedicated budget for purchasing of renewable electricity as well as for activities that overseen by Biogen's new climate and health initiative.
Internal finance mechanisms When Biogen replaces equipment at its end of life, it chooses more efficient technology as replacements.
Other Biogen uses a forecasting tool to help select and prioritize projects that will help us reduce our environmental footprint.
C4.5
CDP Page of 4115

(C4.5) Do you classify any of your existing goods and/or services as low-carbon products or do they enable a third party to avoid GHG emissions?No
C5. Emissions methodology
C5.1
(C5.1) Provide your base year and base year emissions (Scopes 1 and 2).
Scope 1
Base year startJanuary 1 2013
Base year endDecember 31 2013
Base year emissions (metric tons CO2e)54081
Comment
Scope 2 (location-based)
Base year startJanuary 1 2013
Base year endDecember 31 2013
Base year emissions (metric tons CO2e)38019
Comment
Scope 2 (market-based)
Base year startJanuary 1 2013
Base year endDecember 31 2013
Base year emissions (metric tons CO2e)44177
Comment
C5.2
(C5.2) Select the name of the standard, protocol, or methodology you have used to collect activity data and calculate emissions.The Greenhouse Gas Protocol: A Corporate Accounting and Reporting Standard (Revised Edition)
C6. Emissions data
C6.1
(C6.1) What were your organization’s gross global Scope 1 emissions in metric tons CO2e?
Reporting year
Gross global Scope 1 emissions (metric tons CO2e)67031
Start date<Not Applicable>
End date<Not Applicable>
Comment
C6.2
CDP Page of 4116

(C6.2) Describe your organization’s approach to reporting Scope 2 emissions.
Row 1
Scope 2, location-based We are reporting a Scope 2, location-based figure
Scope 2, market-basedWe are reporting a Scope 2, market-based figure
Comment
C6.3
(C6.3) What were your organization’s gross global Scope 2 emissions in metric tons CO2e?
Reporting year
Scope 2, location-based36802
Scope 2, market-based (if applicable)106
Start date<Not Applicable>
End date<Not Applicable>
CommentOur Scope 2 market-based figure consists of emissions related to purchased district steam for our Cambridge, MA facility and electricity from small offices located innations where renewable energy certificate attributes are not available (e.g. South Korea, New Zealand). As an early member of RE100, a collaborative initiative ofbusinesses committed to achieving 100 percent renewable energy, Biogen’s operations around the world have been powered by renewable electricity since 2014. This pastyear, we purchased and retired renewable energy certificates equivalent to the amount of electricity consumed at each of our locations (except as noted above), including: •Green-e certified renewable energy certificates • Guarantees of Origin • International RECs for Brazil and China • Renewable energy certificates
C6.4
(C6.4) Are there any sources (e.g. facilities, specific GHGs, activities, geographies, etc.) of Scope 1 and Scope 2 emissions that are within your selected reportingboundary which are not included in your disclosure?No
C6.5
(C6.5) Account for your organization’s gross global Scope 3 emissions, disclosing and explaining any exclusions.
Purchased goods and services
Evaluation statusRelevant, calculated
Metric tonnes CO2e334954
Emissions calculation methodology1) Biogen engages with its top suppliers by carbon impact each year, suppliers engaged over the past three years represent over 41% of its purchased goods and servicesimpact. 2) Trucost's environmentally extended input-output (EEIO) model is utilized to apply emissions factors to the remaining suppliers. based on corporate-wide spenddata mapped to corresponding industry sectors. This model uses a combination of actual supplier data (where available) and industry-level data.
Percentage of emissions calculated using data obtained from suppliers or value chain partners41
Please explainPurchased goods and services are considered relevant due to the relationship and significance to Biogen's business. There are no boundary exclusions for this source; notethat Biogen does combine other sources within this category, including upstream and downstream transportation and distributions, which are a minor component of thepurchased goods and services Biogen purchases.
CDP Page of 4117

Capital goods
Evaluation statusRelevant, calculated
Metric tonnes CO2e32759
Emissions calculation methodology1) Trucost's EEIO model is utilized to apply emissions factors to all suppliers based on corporate-wide spend data mapped to corresponding industry sectors. This modeluses a combination of actual supplier data (where available) and industry-level data
Percentage of emissions calculated using data obtained from suppliers or value chain partners0
Please explainCapital goods are considered relevant due to the relationship and significance to Biogen's business. There are no boundary exclusions for this source.
Fuel-and-energy-related activities (not included in Scope 1 or 2)
Evaluation statusRelevant, calculated
Metric tonnes CO2e10515
Emissions calculation methodology1) Non-renewable electricity, purchased steam and fossil fuels well-to-tank and transmission losses were calculated using emissions factors from UK DBEIS. 2) Renewableelectricity transmission and distributions losses were calculated using grid loss factors from the World Bank. There are no additive emissions associated with this step asrenewable electricity has an emission factor of 0. 3) Upstream emissions associated with municipal water consumption is calculated using the UK DBEIS water supplyemission factor.
Percentage of emissions calculated using data obtained from suppliers or value chain partners0
Please explainThere are no boundary exclusions for this source
Upstream transportation and distribution
Evaluation statusNot relevant, explanation provided
Metric tonnes CO2e<Not Applicable>
Emissions calculation methodology<Not Applicable>
Percentage of emissions calculated using data obtained from suppliers or value chain partners<Not Applicable>
Please explainBiogen captures emissions associated with upstream transportation and distribution within its Purchased Goods and Services emission inventory. As such a separatecalculation of this category is not relevant.
Waste generated in operations
Evaluation statusRelevant, calculated
Metric tonnes CO2e645
Emissions calculation methodologyGenerated waste and wastewater discharge are multiplied by applicable waste type and disposal method UK DBEIS emission factors.
Percentage of emissions calculated using data obtained from suppliers or value chain partners0
Please explainThere are no boundary exclusions for this source.
Business travel
Evaluation statusRelevant, calculated
Metric tonnes CO2e24083
Emissions calculation methodologyBusiness travel primary data consisting of air, rail and vehicle use is provided by Biogen's travel vendors. For air travel, emission factors incorporating 9% uplift but noradiative forcing is utilized and passenger distance is measured for the reporting year based on the ticket date of the flight rather than the booking date. All rental vehiclesare assumed to utilize gasoline. The following sources are considered de minimis: taxi and other car services such as Uber, nonnational rail, and boat.
Percentage of emissions calculated using data obtained from suppliers or value chain partners100
Please explainThere are no boundary exclusions for this source.
CDP Page of 4118

Employee commuting
Evaluation statusRelevant, calculated
Metric tonnes CO2e9516
Emissions calculation methodologyIn early 2017, Biogen conducted a global employee commuting survey the results of which were used to determine average commuting distance and transportation split.These factors were multiplied by the number of employees and days of work for each Biogen location.
Percentage of emissions calculated using data obtained from suppliers or value chain partners100
Please explainThere are no boundary exclusions for this source.
Upstream leased assets
Evaluation statusRelevant, calculated
Metric tonnes CO2e0
Emissions calculation methodologyBased on floor space of each leased asset multiplied a standard intensity value for the building use type. Biogen did not have any upstream leased assets in 2018.
Percentage of emissions calculated using data obtained from suppliers or value chain partners100
Please explainThere are no boundary exclusions for this source. As Biogen has in the past utilized upstream leased assets, this category remains relevant.
Downstream transportation and distribution
Evaluation statusNot relevant, explanation provided
Metric tonnes CO2e<Not Applicable>
Emissions calculation methodology<Not Applicable>
Percentage of emissions calculated using data obtained from suppliers or value chain partners<Not Applicable>
Please explainBiogen captures emissions associated with downstream transportation and distribution within its Purchased Goods and Services emission inventory. As such a separatecalculation of this category is not relevant.
Processing of sold products
Evaluation statusNot relevant, explanation provided
Metric tonnes CO2e<Not Applicable>
Emissions calculation methodology<Not Applicable>
Percentage of emissions calculated using data obtained from suppliers or value chain partners<Not Applicable>
Please explainDetermined to not be relevant because Biogen does not sell products for further processing.
Use of sold products
Evaluation statusNot relevant, explanation provided
Metric tonnes CO2e<Not Applicable>
Emissions calculation methodology<Not Applicable>
Percentage of emissions calculated using data obtained from suppliers or value chain partners<Not Applicable>
Please explainDetermined to not be significant based on the Lawrence Berkeley National Lab report "Optimization of Product Life Cycles to Reduce Greenhouse Gas Emissions inCalifornia" (2005) publication, which reports use-phase emissions of 0 kg CO2e for over the counter drugs. Biogen's prescription drugs were assumed to have the sameemissions from use.
CDP Page of 4119

End of life treatment of sold products
Evaluation statusRelevant, calculated
Metric tonnes CO2e12065
Emissions calculation methodologyTrucost's EEIO model is utilized along with average waste disposal routes for United States and rest of world.
Percentage of emissions calculated using data obtained from suppliers or value chain partners0
Please explainThere are no boundary exclusions for this source.
Downstream leased assets
Evaluation statusNot relevant, explanation provided
Metric tonnes CO2e<Not Applicable>
Emissions calculation methodology<Not Applicable>
Percentage of emissions calculated using data obtained from suppliers or value chain partners<Not Applicable>
Please explainDetermined to be not relevant because Biogen does not act as a lessor of owned properties to other parties.
Franchises
Evaluation statusNot relevant, explanation provided
Metric tonnes CO2e<Not Applicable>
Emissions calculation methodology<Not Applicable>
Percentage of emissions calculated using data obtained from suppliers or value chain partners<Not Applicable>
Please explainDetermined to be not relevant because Biogen does not have any franchises.
Investments
Evaluation statusNot relevant, explanation provided
Metric tonnes CO2e<Not Applicable>
Emissions calculation methodology<Not Applicable>
Percentage of emissions calculated using data obtained from suppliers or value chain partners<Not Applicable>
Please explainDetermined to be not relevant because Biogen does not make the types of financial investments outlined in the Scope 3 guidance document for this category.
Other (upstream)
Evaluation statusNot relevant, explanation provided
Metric tonnes CO2e<Not Applicable>
Emissions calculation methodology<Not Applicable>
Percentage of emissions calculated using data obtained from suppliers or value chain partners<Not Applicable>
Please explainAll upstream categories covered above.
CDP Page of 4120

Other (downstream)
Evaluation statusNot relevant, explanation provided
Metric tonnes CO2e<Not Applicable>
Emissions calculation methodology<Not Applicable>
Percentage of emissions calculated using data obtained from suppliers or value chain partners<Not Applicable>
Please explainAll downstream categories covered above.
C6.7
(C6.7) Are carbon dioxide emissions from biogenic carbon relevant to your organization?No
C6.10
(C6.10) Describe your gross global combined Scope 1 and 2 emissions for the reporting year in metric tons CO2e per unit currency total revenue and provide anyadditional intensity metrics that are appropriate to your business operations.
Intensity figure0.000005
Metric numerator (Gross global combined Scope 1 and 2 emissions, metric tons CO2e)67137
Metric denominatorunit total revenue
Metric denominator: Unit total14378000000
Scope 2 figure usedMarket-based
% change from previous year8
Direction of changeDecreased
Reason for changeThe considerable reduction in emission per unit of revenue in 2019 was largely related to improvements made to Biogen's next-generation manufacturing processesallowing for greater production with less equipment.
C7. Emissions breakdowns
C7.1
(C7.1) Does your organization break down its Scope 1 emissions by greenhouse gas type?Yes
C7.1a
CDP Page of 4121

(C7.1a) Break down your total gross global Scope 1 emissions by greenhouse gas type and provide the source of each used greenhouse warming potential(GWP).
Greenhouse gas Scope 1 emissions (metric tons of CO2e) GWP Reference
CO2 66253 IPCC Fifth Assessment Report (AR5 – 100 year)
CH4 45 IPCC Fifth Assessment Report (AR5 – 100 year)
N2O 105 IPCC Fifth Assessment Report (AR5 – 100 year)
PFCs 0 IPCC Fifth Assessment Report (AR5 – 100 year)
HFCs 468 IPCC Fifth Assessment Report (AR5 – 100 year)
Other, please specify (HFCFs) 110 IPCC Fifth Assessment Report (AR5 – 100 year)
Other, please specify (CFCs) 50 IPCC Fifth Assessment Report (AR5 – 100 year)
SF6 0 IPCC Fourth Assessment Report (AR4 - 100 year)
NF3 0 IPCC Fifth Assessment Report (AR5 – 100 year)
C7.2
(C7.2) Break down your total gross global Scope 1 emissions by country/region.
Country/Region Scope 1 emissions (metric tons CO2e)
Argentina 19
Australia 16.8
Austria 68.7
Belgium 97.1
Canada 430.1
Chile 0.4
Colombia 5.2
Czechia 101
Denmark 2971.9
Finland 28.3
France 616.3
Germany 1923.4
Hungary 64.6
Ireland 2.4
Italy 652
Japan 258.9
Netherlands 52.2
Norway 12
Mexico 0.6
Poland 200.8
Portugal 45.1
Slovakia 142.7
Slovenia 9.5
Spain 291.4
Sweden 94.4
Switzerland 6859
United Kingdom of Great Britain and Northern Ireland 381.4
Brazil 17.2
United States of America 51627.4
Republic of Korea 37
New Zealand 0.7
China 3.1
C7.3
(C7.3) Indicate which gross global Scope 1 emissions breakdowns you are able to provide.By facilityBy activity
C7.3b
CDP Page of 4122

(C7.3b) Break down your total gross global Scope 1 emissions by business facility.
Facility Scope 1 emissions (metric tons CO2e) Latitude Longitude
Research Triangle Park, North Carolina - Drug Product 6693.4 35.898 -78.861
Research Triangle Park, North Carolina - Drug Substance 10842.1 35.898 -78.861
Cambridge, Massachusetts 28886.3 42.366 -71.087
Hillerød, Denmark 2914.5 55.922 12.276
Affiliate Offices (Various locations around the world) 5882.3 42.366 -71.087
US Commercial Fleet (Various locations) 5129.8 42.366 -71.087
Solothurn, Switzerland 6682.6 47.222448 7.57963
C7.3c
(C7.3c) Break down your total gross global Scope 1 emissions by business activity.
Activity Scope 1 emissions (metric tons CO2e)
Stationary Fuel Combustion 56507.7
Mobile Fuel Combustion 9895
Fugitive Refrigerant Emissions 628.3
C7.5
(C7.5) Break down your total gross global Scope 2 emissions by country/region.
Country/Region Scope 2, location-based(metric tons CO2e)
Scope 2, market-based(metric tons CO2e)
Purchased and consumed electricity,heat, steam or cooling (MWh)
Purchased and consumed low-carbon electricity, heat, steam or coolingaccounted for in Scope 2 market-based approach (MWh)
United States of America 32537.5 76.2 102154.5 101838.8
Denmark 2257.5 0 14911.1 14911.1
Argentina 33.6 0 95.4 95.4
Australia 128.7 0 172.5 172.5
Austria 16.5 0 102.1 102.1
Belgium 17 0 98.7 98.7
Brazil 12.7 0 108.6 108.6
Canada 20.8 0 145.6 145.6
Chile 1.2 0 2.8 2.8
Colombia 4.3 0 32.2 32.2
Czechia 30.1 0 60 60
Finland 6.1 0 57.2 57.2
France 31.1 0 448.2 448.2
Germany 149.5 0 356.9 356.9
Hungary 6 0 22.5 22.5
Ireland 3.3 0 8.7 8.7
Italy 182.9 0 559.2 559.2
Japan 58.7 0 112 112
Mexico 2 0 4.1 4.1
Netherlands 37.9 0 86.4 86.4
New Zealand 0.4 0.4 3.7 0
Norway 3.3 0 396.5 396.5
Poland 130.8 0 183.4 183.4
Portugal 53.8 0 149.1 149.1
Slovakia 14.7 0 91.9 91.9
Slovenia 17.6 0 67 67
Republic of Korea 29.2 29.2 81 0
Spain 84 0 289.9 289.9
Switzerland 679.2 0 23501.6 23501.6
United Kingdom of GreatBritain and Northern Ireland
213.6 0 864.9 864.9
Sweden 1.7 0 136 136
China 21.4 0 34.2 34.2
C7.6
(C7.6) Indicate which gross global Scope 2 emissions breakdowns you are able to provide.By facilityBy activity
CDP Page of 4123

C7.6b
(C7.6b) Break down your total gross global Scope 2 emissions by business facility.
Facility Scope 2, location-based (metric tons CO2e) Scope 2, market-based (metric tons CO2e)
Research Triangle Park, North Carolina - Drug Product 8450 0
Research Triangle Park, North Carolina - Drug Substance 21674.2 0
Cambridge, Massachusetts 2376.6 76.2
Hillerød, Denmark 2243 0
Affiliate Offices (Various locations around the world) 1409.8 29.6
Solothurn, Switzerland 648.4 0
C7.6c
(C7.6c) Break down your total gross global Scope 2 emissions by business activity.
Activity Scope 2, location-based (metric tons CO2e) Scope 2, market-based (metric tons CO2e)
Electricity 36726 30
Steam 76 76
C7.9
(C7.9) How do your gross global emissions (Scope 1 and 2 combined) for the reporting year compare to those of the previous reporting year?Decreased
C7.9a
(C7.9a) Identify the reasons for any change in your gross global emissions (Scope 1 and 2 combined), and for each of them specify how your emissions compareto the previous year.
Change inemissions(metrictonsCO2e)
Directionof change
Emissionsvalue(percentage)
Please explain calculation
Change inrenewableenergyconsumption
26 Increased 0 RE100 member Biogen has maintained its achievement of 100% renewable electricity across 30 of the markets in which they operate. In total, this equates to99.94% of our global demand, with 0.06% remaining unmet in South Korea and New Zealand, where Biogen is facing barriers to sourcing RE in accordancewith the strict RE100 criteria. We look forward to working with our RE100 members to improve supply in these markets.). Expansion of our office space in SouthKorea resulted in an increase of 26 MTCO2e from purchased electricity compared to the previous year. [26/68,509 = <0.1%]
Otheremissionsreductionactivities
330 Decreased 0.5 Biogen conducts emission reduction activities related each year to lower resource uses by its facilities and production processes. Due to its 100% renewableelectricity usage, the value presented here only considers changes in direct combustion of fossil fuels at the sites and fleet. These projects includes HVAC andsteam production improvements and with an aggregated estimated 330 MTCO2e reduction [-330 / 68,509 = -0.5%].
Divestment 2200 Decreased 3 Biogen sold its Hillerod manufacturing facility to Fujifilm on July 31 2019. The estimated emissions the facility would have generated over the August-Decembertime period is 2,200 MTCO2e [-2,200 / 68,509 = -3.0%
Acquisitions 0 No change 0 No significant acquisitions impacting emissions were made in 2019.
Mergers 0 No change 0 No mergers occurred in 2019.
Change inoutput
702 Increased 1 Production of our treatment for spinal muscular atrophy (SMA), Spinraza , increased significantly in 2019. Emissions associated with Spinraza and as well as aramp up of our biosimilars portfolio is estimated at 702 MTCO2e. [702 / 68,509 = 1.0%]
Change inmethodology
0 No change 0 No methodology changes occurred in 2019.
Change inboundary
0 No change 0 No boundary changes occurred in 2019.
Change inphysicaloperatingconditions
0 No change 0 Weather variability has minor impacts to energy usage each year associated with building heating and cooling, but cannot be quantified apart from the moresignificant trends in production output.
Unidentified 0 No change 0 None
Other 430 Increased 0.6 Biogen's new biologics manufacturing facility in Solothurn expanded its operational testing in 2019. Emissions related to the facility were 430 MTCO2e. [430 /68,509 = 0.6%]
C7.9b
CDP Page of 4124

(C7.9b) Are your emissions performance calculations in C7.9 and C7.9a based on a location-based Scope 2 emissions figure or a market-based Scope 2emissions figure?Market-based
C8. Energy
C8.1
(C8.1) What percentage of your total operational spend in the reporting year was on energy?More than 0% but less than or equal to 5%
C8.2
(C8.2) Select which energy-related activities your organization has undertaken.
Indicate whether your organization undertook this energy-related activity in the reporting year
Consumption of fuel (excluding feedstocks) Yes
Consumption of purchased or acquired electricity Yes
Consumption of purchased or acquired heat No
Consumption of purchased or acquired steam Yes
Consumption of purchased or acquired cooling No
Generation of electricity, heat, steam, or cooling No
C8.2a
(C8.2a) Report your organization’s energy consumption totals (excluding feedstocks) in MWh.
Heating value MWh from renewable sources MWh from non-renewable sources Total (renewable and non-renewable) MWh
Consumption of fuel (excluding feedstock) HHV (higher heating value) 0 352158 352158
Consumption of purchased or acquired electricity <Not Applicable> 144937 85 145022
Consumption of purchased or acquired heat <Not Applicable> <Not Applicable> <Not Applicable> <Not Applicable>
Consumption of purchased or acquired steam <Not Applicable> 0 316 316
Consumption of purchased or acquired cooling <Not Applicable> <Not Applicable> <Not Applicable> <Not Applicable>
Consumption of self-generated non-fuel renewable energy <Not Applicable> <Not Applicable> <Not Applicable> <Not Applicable>
Total energy consumption <Not Applicable> 144937 352559 497496
C8.2b
(C8.2b) Select the applications of your organization’s consumption of fuel.
Indicate whether your organization undertakes this fuel application
Consumption of fuel for the generation of electricity No
Consumption of fuel for the generation of heat Yes
Consumption of fuel for the generation of steam Yes
Consumption of fuel for the generation of cooling No
Consumption of fuel for co-generation or tri-generation Yes
C8.2c
(C8.2c) State how much fuel in MWh your organization has consumed (excluding feedstocks) by fuel type.
Fuels (excluding feedstocks)Natural Gas
Heating valueHHV (higher heating value)
Total fuel MWh consumed by the organization306493
MWh fuel consumed for self-generation of electricity<Not Applicable>
CDP Page of 4125

MWh fuel consumed for self-generation of heat35000
MWh fuel consumed for self-generation of steam121647
MWh fuel consumed for self-generation of cooling<Not Applicable>
MWh fuel consumed for self-cogeneration or self-trigeneration149846
Emission factor53.1148
Unitkg CO2e per million Btu
Emissions factor source2018 Update https://www.epa.gov/climateleadership/center-corporate-climate-leadership-ghg-emission-factors-hub
CommentCambridge facility contains a cogeneration plant to generate facility's steam needs as well as partial electricity need.
Fuels (excluding feedstocks)Diesel
Heating valueHHV (higher heating value)
Total fuel MWh consumed by the organization17063
MWh fuel consumed for self-generation of electricity<Not Applicable>
MWh fuel consumed for self-generation of heat0
MWh fuel consumed for self-generation of steam0
MWh fuel consumed for self-generation of cooling<Not Applicable>
MWh fuel consumed for self-cogeneration or self-trigeneration0
Emission factor2.59411
Unitkg CO2e per liter
Emissions factor sourceUK Department for Environment, Food & Rural Affairs (Defra) - 2019 | https://www.gov.uk/government/publications/greenhouse-gas-reporting-conversion-factors-2019 -Stationary Fuel - Diesel (Biofuel Blend) (Volume) (Direct)
CommentUsed in commercial fleet vehicles
Fuels (excluding feedstocks)Motor Gasoline
Heating valueHHV (higher heating value)
Total fuel MWh consumed by the organization24851
MWh fuel consumed for self-generation of electricity<Not Applicable>
MWh fuel consumed for self-generation of heat0
MWh fuel consumed for self-generation of steam0
MWh fuel consumed for self-generation of cooling<Not Applicable>
MWh fuel consumed for self-cogeneration or self-trigeneration0
Emission factor2.20904
Unitkg CO2e per liter
CDP Page of 4126

Emissions factor sourceUK Department for Environment, Food & Rural Affairs (Defra) - 2019 | https://www.gov.uk/government/publications/greenhouse-gas-reporting-conversion-factors-2019 -Stationary Fuel - Gasoline / Petrol (Biofuel Blend) (Volume) (Direct)
CommentUsed in commercial fleet vehicles
Fuels (excluding feedstocks)Fuel Oil Number 2
Heating valueHHV (higher heating value)
Total fuel MWh consumed by the organization3751
MWh fuel consumed for self-generation of electricity<Not Applicable>
MWh fuel consumed for self-generation of heat0
MWh fuel consumed for self-generation of steam0
MWh fuel consumed for self-generation of cooling<Not Applicable>
MWh fuel consumed for self-cogeneration or self-trigeneration0
Emission factor10.24409
Unitkg CO2e per gallon
Emissions factor sourceUK Department for Environment, Food & Rural Affairs (Defra) - 2019 | https://www.gov.uk/government/publications/greenhouse-gas-reporting-conversion-factors-2019 -Stationary Fuel - Fuel Oil (Distillate - No.2) (Volume) (Direct)
CommentBackup generators
C8.2e
(C8.2e) Provide details on the electricity, heat, steam, and/or cooling amounts that were accounted for at a zero emission factor in the market-based Scope 2figure reported in C6.3.
Sourcing methodGreen electricity products (e.g. green tariffs) from an energy supplier, supported by energy attribute certificates
Low-carbon technology typeWind
Country/region of consumption of low-carbon electricity, heat, steam or coolingNorth America
MWh consumed accounted for at a zero emission factor3269
CommentBiogen signed a supplier contract with Calpine Energy Solutions for 100% renewable power for our Weston, Massachusetts office facility.
Sourcing methodUnbundled energy attribute certificates, Renewable Energy Certificates (RECs)
Low-carbon technology typeBiomass
Country/region of consumption of low-carbon electricity, heat, steam or coolingNorth America
MWh consumed accounted for at a zero emission factor98716
CommentIn the United States and Canada, our operations are matched with 100% renewable electricity through the purchase and retirement of Green-e certified RECs.
Sourcing methodUnbundled energy attribute certificates, Guarantees of Origin
Low-carbon technology typeBiomass
CDP Page of 4127

Country/region of consumption of low-carbon electricity, heat, steam or coolingEurope
MWh consumed accounted for at a zero emission factor42392
CommentIn the EU, our operations are matched with 100% renewable electricity through the purchase and retirement of EECS Guarantees of Origin.
Sourcing methodUnbundled energy attribute certificates, International REC Standard (I-RECs)
Low-carbon technology typeWind
Country/region of consumption of low-carbon electricity, heat, steam or coolingSouth America
MWh consumed accounted for at a zero emission factor240
CommentIn South America, our operations are matched with 100% renewable electricity through the purchase and retirement of I-RECs from wind farms in Brazil.
Sourcing methodUnbundled energy attribute certificates, other - please specify (Japan Green Power Certificates)
Low-carbon technology typeBiomass
Country/region of consumption of low-carbon electricity, heat, steam or coolingJapan
MWh consumed accounted for at a zero emission factor112
CommentIn Japan, our operations are matched with 100% renewable electricity through the purchase and retirement of Green Power Certificates from a biomass facility.
Sourcing methodUnbundled energy attribute certificates, other - please specify (Australian RECs)
Low-carbon technology typeWind
Country/region of consumption of low-carbon electricity, heat, steam or coolingAustralia
MWh consumed accounted for at a zero emission factor173
CommentIn Australia, our operations are matched with 100% renewable electricity through the purchase and retirement of Australian RECs (large generation certificates) from a windfarm in Australia.
Sourcing methodUnbundled energy attribute certificates, International REC Standard (I-RECs)
Low-carbon technology typeSolar
Country/region of consumption of low-carbon electricity, heat, steam or coolingMexico
MWh consumed accounted for at a zero emission factor5
CommentIn Mexico, our operations are matched with 100% renewable electricity through the purchase and retirement of I-RECs from the Aura Solar I project.
Sourcing methodUnbundled energy attribute certificates, International REC Standard (I-RECs)
Low-carbon technology typeWind
Country/region of consumption of low-carbon electricity, heat, steam or coolingChina
MWh consumed accounted for at a zero emission factor35
CommentIn China, our operations are matched with 100% renewable electricity through the purchase and retirement of I-RECs from the Datang New Energy Phase I to V Wind PPTongxin facility.
CDP Page of 4128

C9. Additional metrics
C9.1
(C9.1) Provide any additional climate-related metrics relevant to your business.
C10. Verification
C10.1
(C10.1) Indicate the verification/assurance status that applies to your reported emissions.
Verification/assurance status
Scope 1 Third-party verification or assurance process in place
Scope 2 (location-based or market-based) Third-party verification or assurance process in place
Scope 3 Third-party verification or assurance process in place
C10.1a
(C10.1a) Provide further details of the verification/assurance undertaken for your Scope 1 emissions, and attach the relevant statements.
Verification or assurance cycle in placeAnnual process
Status in the current reporting yearComplete
Type of verification or assuranceLimited assurance
Attach the statementFINAL ERM CVS 2019 Assurance Statement Biogen_21Apr.pdf
Page/ section referenceThe ERM CVS assurance statement is publicly available here:https://www.biogen.com/content/dam/corporate/en_us/yir/PDFs/ERM_CVS_2019_Assurance_Statement_Biogen.pdf. The referenced data table outlining assured datavalues, including all emission, energy, water and waste data, can be found here: https://biogen.com/en_us/yearinreview /datatable.html.
Relevant standardERM GHG Performance Data Assurance Methodology
Proportion of reported emissions verified (%)100
C10.1b
CDP Page of 4129

(C10.1b) Provide further details of the verification/assurance undertaken for your Scope 2 emissions and attach the relevant statements.
Scope 2 approachScope 2 market-based
Verification or assurance cycle in placeAnnual process
Status in the current reporting yearComplete
Type of verification or assuranceLimited assurance
Attach the statementFINAL ERM CVS 2019 Assurance Statement Biogen_21Apr.pdf
Page/ section referenceThe ERM CVS assurance statement is publicly available here:https://www.biogen.com/content/dam/corporate/en_us/yir/PDFs/ERM_CVS_2019_Assurance_Statement_Biogen.pdf. The referenced data table outlining assured datavalues, including all emission, energy, water and waste data, can be found here: https://biogen.com/en_us/yearinreview /datatable.html.
Relevant standardERM GHG Performance Data Assurance Methodology
Proportion of reported emissions verified (%)100
Scope 2 approachScope 2 location-based
Verification or assurance cycle in placeAnnual process
Status in the current reporting yearComplete
Type of verification or assuranceLimited assurance
Attach the statementFINAL ERM CVS 2019 Assurance Statement Biogen_21Apr.pdf
Page/ section referenceThe ERM CVS assurance statement is publicly available here:https://www.biogen.com/content/dam/corporate/en_us/yir/PDFs/ERM_CVS_2019_Assurance_Statement_Biogen.pdf. The referenced data table outlining assured datavalues, including all emission, energy, water and waste data, can be found here: https://biogen.com/en_us/yearinreview /datatable.html.
Relevant standardERM GHG Performance Data Assurance Methodology
Proportion of reported emissions verified (%)100
C10.1c
(C10.1c) Provide further details of the verification/assurance undertaken for your Scope 3 emissions and attach the relevant statements.
Scope 3 categoryScope 3: Purchased goods and services
Verification or assurance cycle in placeAnnual process
Status in the current reporting yearComplete
Type of verification or assuranceLimited assurance
Attach the statementFINAL ERM CVS 2019 Assurance Statement Biogen_21Apr.pdf
Page/section referenceAssurance covers all 15 Scope 3 categories. The ERM CVS assurance statement is publicly available here:https://www.biogen.com/content/dam/corporate/en_us/yir/PDFs/ERM_CVS_2019_Assurance_Statement_Biogen.pdf. The referenced data table outlining assured datavalues, including all emission, energy, water and waste data, can be found here: https://biogen.com/en_us/yearinreview /datatable.html.
Relevant standardERM GHG Performance Data Assurance Methodology
Proportion of reported emissions verified (%)100
CDP Page of 4130

C10.2
(C10.2) Do you verify any climate-related information reported in your CDP disclosure other than the emissions figures reported in C6.1, C6.3, and C6.5?Yes
C10.2a
(C10.2a) Which data points within your CDP disclosure have been verified, and which verification standards were used?
Disclosure module verification relates to Dataverified
Verification standard Please explain
C8. Energy Energyconsumption
ERM CVS’ assurance methodology, based on the International Standard on AssuranceEngagements ISAE 3000 (Revised) and ISAE 3410 for GHG emissions
All related energy, water and waste data that rolls up toour climate data is third party assured.
FINAL ERM CVS 2019 AssuranceStatement Biogen_21Apr.pdf
C11. Carbon pricing
C11.1
(C11.1) Are any of your operations or activities regulated by a carbon pricing system (i.e. ETS, Cap & Trade or Carbon Tax)?Yes
C11.1a
(C11.1a) Select the carbon pricing regulation(s) which impacts your operations.EU ETS
C11.1b
(C11.1b) Complete the following table for each of the emissions trading schemes you are regulated by.
EU ETS
% of Scope 1 emissions covered by the ETS4
% of Scope 2 emissions covered by the ETS0
Period start dateJanuary 1 2019
Period end dateJuly 31 2019
Allowances allocated0
Allowances purchased3200
Verified Scope 1 emissions in metric tons CO2e3200
Verified Scope 2 emissions in metric tons CO2e0
Details of ownershipFacilities we own and operate
CommentBiogen sold its biologics manufacturing operations in Hillerød, Denmark to Fujifilm on July 31.
C11.1d
CDP Page of 4131

(C11.1d) What is your strategy for complying with the systems you are regulated by or anticipate being regulated by?
The EU ETS applies to our Hillerød manufacturing facility. Our strategy for complying with the requirements of the ETS are to 1) purchase allowances to cover the calculatedverified emissions associated with the facility and 2) continue our innovation and energy efficiency work to reduce our obligations under the ETS. One example is Hillerødobtaining ISO50001 certification in 2016.
C11.2
(C11.2) Has your organization originated or purchased any project-based carbon credits within the reporting period?No
C11.3
(C11.3) Does your organization use an internal price on carbon?Yes
C11.3a
(C11.3a) Provide details of how your organization uses an internal price on carbon.
Objective for implementing an internal carbon priceChange internal behaviorDrive energy efficiencyStress test investments
GHG ScopeScope 1Scope 2
ApplicationAs part of Biogen’s carbon neutrality strategy, we purchase and retire carbon offsets. The average price per offset serves as a real price on carbon to the business. Oneapplication of this internal price on carbon was against energy efficiency projects identified at all of our major facilities in 2016 to determine their full financial impact. Wehave also piloted the use of higher shadow prices to stress test long-term energy impacting projects.
Actual price(s) used (Currency /metric ton)1.3
Variance of price(s) usedShadowing pricing used for stress testing investments has ranged from USD10 to USD50 based on the range of pricing included in previously bills circulated within theUnited States congress.
Type of internal carbon priceShadow priceOffsets
Impact & implicationThe impact of shadow pricing and offsets can be significant. As one example, in 2015 we assessed the finances of a cogeneration plant at one of our sites with the inclusionof a variety of shadow prices. The price on carbon ultimately has a meaningful impact on the long-term financial viability of the project.
C12. Engagement
C12.1
(C12.1) Do you engage with your value chain on climate-related issues?Yes, our suppliersYes, other partners in the value chain
C12.1a
CDP Page of 4132

(C12.1a) Provide details of your climate-related supplier engagement strategy.
Type of engagementEngagement & incentivization (changing supplier behavior)
Details of engagementRun an engagement campaign to educate suppliers about climate change
% of suppliers by number0.01
% total procurement spend (direct and indirect)25
% of supplier-related Scope 3 emissions as reported in C6.530
Rationale for the coverage of your engagementThe intent of Biogen's multi-year supplier engagement program is to further understand the true impact of its largest suppliers from a climate impact perspective. Preliminarycarbon emissions are calculated for all suppliers using Trucost's environmentally extended input-output (EEIO) model. The top non-capital goods suppliers are selectedfrom the list for the engagement process. The engagement consists of requesting primary energy data from suppliers as well as more detailed life cycle analysis/footprintingdata associated with the specific goods and services purchased by Biogen.
Impact of engagement, including measures of successBy engaging with 10 of our top impacting suppliers each year, Biogen is able to initiate discussions with suppliers about the importance of manufacturing in a sustainablemanner and also better understand how suppliers are managing risks. The quantitative impact of this engagement is around an aggregate emissions reduction of 5 percentthrough the use of actual carbon emission data from vendors as compared to estimates made by the EEIO model. Success is largely measured by securing positiveengagement with the supplier through an open communication channel and receipt of company-level emission data at a minimum. Biogen typically achieves a 50% successrate for its supplier engagement typical of past engagement. Biogen procures goods and services from a variety of suppliers, both small and large. While many haveestablished environmental performance programs, some do not. As a result, the supplier engagement program also provides incentivization for companies to furtherdevelop its environmental collection and reporting capabilities.
Comment
C12.1d
(C12.1d) Give details of your climate-related engagement strategy with other partners in the value chain.
Approximately 70 percent of our carbon impacts are driven by goods and services provided by our supply chain partners. In order to meet our full value-chain emissionsreduction goal, we have developed a strategy consisting of working closely with our high impact suppliers to better understand their contributions to our carbon footprint andtheir climate strategies. Since 2015, we have engagement with suppliers that collectively are responsible for around half our purchased goods and services emissions (Scope3 - Category 1).
This initiative, which consists of sharing data to better understand the carbon impact of the goods and services we purchase, has resulted in more accurate accounting of ourfootprint and often a decrease in our overall carbon footprint. Examples of this engagement include Thermo Fisher Scientific and General Electric (GE), which providematerials for the production of our therapies. For this example, we learnt that the resins we purchase are more carbon intensive than the industry average, while mediaprovided by GE has nearly half the carbon footprint of basic organic chemicals. We will continue to expand this work with suppliers, supporting their emissions reductionsthrough the sharing of best practices and identifying opportunities for improvement.
C12.3
(C12.3) Do you engage in activities that could either directly or indirectly influence public policy on climate-related issues through any of the following?Direct engagement with policy makers
C12.3a
(C12.3a) On what issues have you been engaging directly with policy makers?
Focus oflegislation
Corporateposition
Details of engagement Proposed legislative solution
Cleanenergygeneration
Supportwith minorexceptions
At a local level, Biogen engages with policy makers on key issues as needed. In Cambridge, Biogen is a member of the Kendall Square EcoDistrict,which is working to drive sustainability actions within the square and larger Cambridge community such as through district-scale energy projects andbike infrastructure improvements. Biogen’s Hillerød facility is collaborating through its Symbiosis network, where it has been working to address foodwaste, wastewater, safety and employee wellness efforts. We believe that leadership on climate change also means engaging stakeholders and beingadvocates for sustainable climate policies. To foster this, we are participating in advocacy initiatives with other likeminded businesses around the worldto increase awareness that climate change is a business issue to be addressed. In recent years, we showed our support to a number of climateadvocacy initiatives: RE100, the White House American Business Act on Climate Pledge, We Mean Business coalition, and the EPA Green PowerPartnership.
Biogen seeks access to diverseenergy sources, including thedevelopment of cost-effectiverenewable energy sources, tofurther diversify our portfolio,ensure reliability, eliminate ourclimate change impact, andstrengthen our carbon neutralitystrategy.
C12.3f
CDP Page of 4133

(C12.3f) What processes do you have in place to ensure that all of your direct and indirect activities that influence policy are consistent with your overall climatechange strategy?
All of our activities that influence climate change policy are managed by the global EHS+S and Government Affairs groups with oversight from the Biogen Healthy ClimateHealthy Lives working group, which is sponsored by our executive vice president for Pharmaceutical Operations and Technology, and includes members of Biogen’s seniorleadership team. Biogen’s Climate Change Position Statement recognizes that climate change is a serious risk to human health and our business, and that internationalbodies and national governments have an important role to play in providing a framework for a transition to a low-carbon economy and fulfilling our collective obligationsunder the Paris Agreement. We use the Climate Change Position Statement to guide our engagement with stakeholders and to ensure that all of our direct and indirectactivities are consistent with our overall climate change strategy.
C12.4
(C12.4) Have you published information about your organization’s response to climate change and GHG emissions performance for this reporting year in placesother than in your CDP response? If so, please attach the publication(s).
PublicationIn voluntary sustainability report
StatusComplete
Attach the documentBiogen 2019 Year in Review Report (index only).pdf
Page/Section referenceThe attached document is Index for our Year in Review report, which can be found online at https://www.biogen.com/en_us/yearinreview. Emission data can be found athttps://www.biogen.com/en_us/yearinreview/datatable.html while discussion on our climate strategy and targets can be found athttps://www.biogen.com/en_us/yearinreview/sustainablescience.html
Content elementsGovernanceStrategyEmissions figuresEmission targetsOther metrics
Comment
PublicationIn mainstream reports
StatusComplete
Attach the documentBiogen 2019 Annual Report.PDF
Page/Section referencePage 6 discusses our commitment to environmental sustainability
Content elementsStrategyEmission targets
CommentItems discussed include our approach to reducing emissions and our 100% renewable electricity commitment.
C15. Signoff
C-FI
(C-FI) Use this field to provide any additional information or context that you feel is relevant to your organization's response. Please note that this field is optionaland is not scored.
Attached to this submission is our RE100 annual progress report.Biogen_RE100 Reporting Spreadsheet 2020.xlsx
C15.1
(C15.1) Provide details for the person that has signed off (approved) your CDP climate change response.
Job title Corresponding job category
Row 1 Executive Vice President, Pharmaceutical Operations and Technology Chief Operating Officer (COO)
CDP Page of 4134

SC. Supply chain module
SC0.0
(SC0.0) If you would like to do so, please provide a separate introduction to this module.
Biogen uses a three-pronged approach to maintaining carbon neutrality: measuring and continually improving the accuracy of emissions data, driving reductions internally andworking with our suppliers, and investing in reputable renewable electricity instruments and carbon offsets. Biogen become one of the first companies to achieve sourcing100% renewable electricity in 2014 and maintained that status in the last reporting year with a commitment to continue doing so moving forward. This is the result of amultiyear initiative that emphasizes measuring our emissions and improving data quality, reducing our operational carbon footprint, and working with suppliers to do the same.
Starting in 2015 we began working closely with our suppliers to better understand their contribution to our carbon footprint and demonstrate our interest in their climatestrategy. In 2018 we engaged with 10 suppliers, which collectively represented 31 percent of our supply chain carbon emissions. This initiative has resulted in more accurateaccounting of our footprint. In the future, we plan to expand our work with suppliers to focus on supporting their carbon footprint reductions through best practices sharing andidentifying opportunities for improvement. For those vendors that supply products and services that relate directly to the safety and integrity of our products and the continuityof our manufacturing process, we have intensified our focus on implementing a proactive supply-chain assessment process. In 2018, we assessed over 900 supplier sites.This annual process evaluates the risks associated with our critical supplier base from an environmental, social and governance perspective across multiple factors, includingwater risks. Through this rigorous process we have not identified any at-risk suppliers, but we will continue to monitor these risks annually. We are also an active participantin the Pharmaceutical Supply Chain Initiative, which supports better social, economic and environmental outcomes for all those who make up the pharmaceutical supplychain.
SC0.1
(SC0.1) What is your company’s annual revenue for the stated reporting period?
Annual Revenue
Row 1 14378000000
SC0.2
(SC0.2) Do you have an ISIN for your company that you would be willing to share with CDP?Yes
SC0.2a
(SC0.2a) Please use the table below to share your ISIN.
ISIN country code (2 letters) ISIN numeric identifier and single check digit (10 numbers overall)
Row 1 US 09062X1037
SC1.1
(SC1.1) Allocate your emissions to your customers listed below according to the goods or services you have sold them in this reporting period.
Requesting memberCVS Health
Scope of emissionsScope 1
Allocation levelCompany wide
Allocation level detail<Not Applicable>
Emissions in metric tonnes of CO2e944
Uncertainty (±%)10
Major sources of emissions
CDP Page of 4135

Combustion of natural gas for steam and space heating; Gasoline and diesel associated with fleet vehicle use
VerifiedNo
Allocation methodAllocation based on the market value of products purchased
Please explain how you have identified the GHG source, including major limitations to this process and assumptions madeGHG sources are tracked via invoices (electricity, natural gas) or in some cases estimated (fleet vehicle fuel use) and have been verified by CVS ERM. The allocationcalculation assumes emissions per dollar of product value is roughly equivalent and that office-related activities in non-product facilities support each product in a roughlyequivalent manner. Note: As part of Biogen's carbon neutrality commitment, Biogen purchases carbon offsets to neutralize 100% of its direct emissions. Thus, whenincluding offsets, allocation to CVS Health would be 0 MTCO2e.
Requesting memberCVS Health
Scope of emissionsScope 2
Allocation levelCompany wide
Allocation level detail<Not Applicable>
Emissions in metric tonnes of CO2e1
Uncertainty (±%)10
Major sources of emissionsPurchased Steam
VerifiedNo
Allocation methodAllocation based on the market value of products purchased
Please explain how you have identified the GHG source, including major limitations to this process and assumptions madeElectricity and purchased steam use is tracked from utility invoices and has been verified by ERM CVS. The same allocation method and assumptions are used for Scope 2as Scope 1. There are no emissions associated with electricity consumption as 100 percent of the electricity consumed by the applicable Biogen facilities is from renewablesources and has been since 2014. This commitment to renewable electricity reduced the allocation of emissions to CVS Health by 517 MTCO2e. Additionally, Biogenpurchases and retires carbon offsets for emissions associated with purchased steam, reducing CVS Health's allocation to 0 MTCO2e.
Requesting memberCVS Health
Scope of emissionsScope 3
Allocation levelCompany wide
Allocation level detail<Not Applicable>
Emissions in metric tonnes of CO2e5980
Uncertainty (±%)25
Major sources of emissionsCategory 1 Purchased Goods and Services - 4718 MTCO2e; Category 2 Capital Goods - 461 MTCO2e; Category 3 Upstream/Downstream Energy and Water - 148MTCO2e; Category 5 Waste - 9 MTCO2e; Category 6 Business Travel - 339 MTCO2e; Category 7 Employee Commuting - 134 MTCO2e; Category 12 Product End of Life- 170 MTCO2e; Categories 4, 8, 9, 10, 11, 13, 14, and 15 are either included within another category, de minimis, or not relevant.
VerifiedNo
Allocation methodAllocation based on the market value of products purchased
Please explain how you have identified the GHG source, including major limitations to this process and assumptions madeEmissions are calculated from a variety of methodologies: Categories 1, 2 and 12 are based on Trucost's EEIO model based on Biogen's spend. Categories 3, 5 and 6 useUK BEIS emissions factors against tracked electricity, natural gas, water, waste, and air travel values. Category 7 uses employee commuting surveys and UK BEISemission factors. Similar to Scope 1 and 2, the allocation calculation assumes emissions per dollar of product value is roughly equivalent and that office-related activities innonproduct facilities support each product in a roughly equivalent manner. Uncertainty is higher as this assumption becomes more challenging when related to upstreamand downstream emissions.
Requesting memberJohnson & Johnson
Scope of emissionsScope 1
CDP Page of 4136

Allocation levelFacility
Allocation level detailAllocation is determined by identifying the number of Biogen employees at the RTP Drug Product and Hillerød facilities focused on the Johnson and Johnson products,which is calculated based on the breakdown of batch production by volume. The total percentage of Biogen employees focused on Johnson and Johnson products is thenmultiplied by the company-level emissions.
Emissions in metric tonnes of CO2e3697
Uncertainty (±%)5
Major sources of emissionsCombustion of natural gas for steam and space heating.
VerifiedNo
Allocation methodAllocation based on the volume of products purchased
Please explain how you have identified the GHG source, including major limitations to this process and assumptions madeThis calculation assumes each facility’s emissions are equally distributed per unit volume of batch production and that office-related activities are other Biogen locations areinsignificant. Note: As part of Biogen's carbon neutrality commitment, Biogen purchases carbon offsets to neutralize 100% of its direct emissions. Thus, when includingoffsets, allocation to Johnson and Johnson would be 0 MTCO2e.
Requesting memberJohnson & Johnson
Scope of emissionsScope 2
Allocation levelFacility
Allocation level detailAllocation is determined by identifying the number of Biogen employees at the RTP Drug Product and Hillerød facilities focused on the Johnson and Johnson products,which is calculated based on the breakdown of batch production by volume. The total percentage of Biogen employees focused on Johnson and Johnson products is thenmultiplied by the company-level emissions.
Emissions in metric tonnes of CO2e0
Uncertainty (±%)0
Major sources of emissionsNone
VerifiedNo
Allocation methodAllocation based on the volume of products purchased
Please explain how you have identified the GHG source, including major limitations to this process and assumptions madeThe same allocation method and assumptions are used for Scope 2 as Scope 1. There are no emissions associated with Scope 2 as 100 percent of the electricityconsumed by the applicable Biogen facilities is from renewable sources and has been since 2014. This commitment to renewable electricity reduced the allocation ofemissions to Johnson and Johnson from this source by 7253 MTCO2e.
Requesting memberJohnson & Johnson
Scope of emissionsScope 3
Allocation levelCompany wide
Allocation level detail<Not Applicable>
Emissions in metric tonnes of CO2e25304
Uncertainty (±%)50
Major sources of emissionsPurchased goods and services and Capital Goods (Categories 1 and 2). Biogen includes upstream and downstream transportation and distribution (Categories 4 and 9)emissions within purchased goods and services for reference.
VerifiedNo
Allocation methodAllocation based on the volume of products purchased
CDP Page of 4137

Please explain how you have identified the GHG source, including major limitations to this process and assumptions madeThis methodology is limited in its accuracy as spend on purchased goods and services / capital goods specific to production at the two facilities of interest is unknown.
Requesting memberJohnson & Johnson
Scope of emissionsScope 3
Allocation levelFacility
Allocation level detailProduction specific to Johnson and Johnson is conducted at Biogen’s RTP Drug Substance and Hillerød manufacturing facilities. Allocation of greenhouse gases is basedon the percentage of batch production by volume associated with Johnson and Johnson compared to the total for each facility during the calendar year. Each facility’semissions are multiplied by this percentage to come up with the total allocation.
Emissions in metric tonnes of CO2e580
Uncertainty (±%)5
Major sources of emissionsUpstream and downstream waste, water, fuel and energy-related activities (Categories 3 and 5).
VerifiedNo
Allocation methodAllocation based on the volume of products purchased
Please explain how you have identified the GHG source, including major limitations to this process and assumptions madeThe same assumptions are used for this GHG source as Scopes 1 and 2. Biogen’s purchasing of 100 renewably sourced electricity reduced the allocation of emissions toJohnson and Johnson from this source.
Requesting memberJohnson & Johnson
Scope of emissionsScope 3
Allocation levelCompany wide
Allocation level detail<Not Applicable>
Emissions in metric tonnes of CO2e1657
Uncertainty (±%)50
Major sources of emissionsBusiness Travel (Category 6)
VerifiedNo
Allocation methodAllocation based on the volume of products purchased
Please explain how you have identified the GHG source, including major limitations to this process and assumptions madeThe accuracy of this method is limited as the specific number of employees working on the Johnson and Johnson account is unknown
Requesting memberJohnson & Johnson
Scope of emissionsScope 3
Allocation levelFacility
Allocation level detailProduction specific to Johnson and Johnson is conducted at Biogen’s RTP Drug Substance and Hillerød manufacturing facilities. Allocation of greenhouse gases is basedon the percentage of batch production by volume associated with Johnson and Johnson compared to the total for each facility during the calendar year. Each facility’semissions are multiplied by this percentage to come up with the total allocation.
Emissions in metric tonnes of CO2e800
Uncertainty (±%)15
Major sources of emissionsEmployee Commuting (Category 7)
CDP Page of 4138

VerifiedNo
Allocation methodAllocation based on the volume of products purchased
Please explain how you have identified the GHG source, including major limitations to this process and assumptions madeThe accuracy of this method is limited as the specific number of employees working on the Johnson and Johnson account is unknown.
Requesting memberJohnson & Johnson
Scope of emissionsScope 3
Allocation levelCompany wide
Allocation level detail<Not Applicable>
Emissions in metric tonnes of CO2e0
Uncertainty (±%)0
Major sources of emissionsAll other Scope 3 Categories (8, 10, 11, 12, 13, 14 and 15)
VerifiedNo
Allocation methodAllocation based on the volume of products purchased
Please explain how you have identified the GHG source, including major limitations to this process and assumptions madeThere is no allocation of emission from these sources as they are either not relevant to Biogen, have 0 emissions (upstream leased assets), or are not relevant to Johnsonand Johnson (product end-of-life).
Requesting memberNHS England
Scope of emissionsScope 1
Allocation levelCompany wide
Allocation level detail<Not Applicable>
Emissions in metric tonnes of CO2e2388
Uncertainty (±%)10
Major sources of emissionsCombustion of natural gas for steam and space heating; Gasoline and diesel associated with fleet vehicle use.
VerifiedNo
Allocation methodAllocation based on the market value of products purchased
Please explain how you have identified the GHG source, including major limitations to this process and assumptions madeGHG sources are tracked via invoices (electricity, natural gas) or in some cases estimated (fleet vehicle fuel use) and have been verified by CVS ERM. The allocationcalculation assumes emissions per dollar of product value is roughly equivalent and that office-related activities in non-product facilities support each product in a roughlyequivalent manner. Note: As part of Biogen's carbon neutrality commitment, Biogen purchases carbon offsets to neutralize 100% of its direct emissions. Thus, whenincluding offsets, allocation to CVS Health would be 0 MTCO2e.
Requesting memberNHS England
Scope of emissionsScope 2
Allocation levelCompany wide
Allocation level detail<Not Applicable>
Emissions in metric tonnes of CO2e4
Uncertainty (±%)
CDP Page of 4139

10
Major sources of emissionsPurchased steam
VerifiedNo
Allocation methodAllocation based on the market value of products purchased
Please explain how you have identified the GHG source, including major limitations to this process and assumptions madeElectricity and purchased steam use is tracked from utility invoices and has been verified by ERM CVS. The same allocation method and assumptions are used for Scope 2as Scope 1. There are no emissions associated with electricity consumption as 100 percent of the electricity consumed by the applicable Biogen facilities is from renewablesources and has been since 2014. This commitment to renewable electricity reduced the allocation of emissions to CVS Health by 1307 MTCO2e. Additionally, Biogenpurchases and retires carbon offsets for emissions associated with purchased steam, reducing CVS Health's allocation to 0 MTCO2e.
Requesting memberNHS England
Scope of emissionsScope 3
Allocation levelCompany wide
Allocation level detail<Not Applicable>
Emissions in metric tonnes of CO2e15126
Uncertainty (±%)25
Major sources of emissionsCategory 1 Purchased Goods and Services - 11934 MTCO2e; Category 2 Capital Goods - 1167 MTCO2e; Category 3 Upstream/Downstream Energy and Water - 375MTCO2e; Category 5 Waste - 23 MTCO2e; Category 6 Business Travel - 858 MTCO2e; Category 7 Employee Commuting - 339 MTCO2e; Category 12 Product End ofLife - 430 MTCO2e; Categories 4, 8, 9, 10, 11, 13, 14, and 15 are either included within another category, de minimis, or not relevant.
VerifiedNo
Allocation methodAllocation based on the market value of products purchased
Please explain how you have identified the GHG source, including major limitations to this process and assumptions madeEmissions are calculated from a variety of methodologies: Categories 1, 2 and 12 are based on Trucost's EEIO model based on Biogen's spend. Categories 3, 5 and 6 useUK BEIS emissions factors against tracked electricity, natural gas, water, waste, and air travel values. Category 7 uses employee commuting surveys and UK BEISemission factors. Similar to Scope 1 and 2, the allocation calculation assumes emissions per dollar of product value is roughly equivalent and that office-related activities innonproduct facilities support each product in a roughly equivalent manner. Uncertainty is higher as this assumption becomes more challenging when related to upstreamand downstream emissions.
SC1.2
(SC1.2) Where published information has been used in completing SC1.1, please provide a reference(s).
Biogen's 2019 data can be found publicly in its 2020 CDP Climate Change disclosure as well as in its 2019 Year in Review, available online at https://www.biogen.com/en_us/yearinreview.html. All Biogen greenhouse gas values were assured by an independent third-party using the ERM CVS’ assurancemethodology, based on the International Standard on Assurance Engagements ISAE 3000 (Revised) and ISAE 3410 for GHG emissions.
SC1.3
(SC1.3) What are the challenges in allocating emissions to different customers, and what would help you to overcome these challenges?
Allocationchallenges
Please explain what would help you overcome these challenges
Other, please specify(Breakdown of Scope3 emissions)
While Scope 1 allocation could be improved further through the use of life cycle analysis techniques to identify the specific impact of each production process, Scope 3 provides the largestchallenge. Purchased goods and services is by far Biogen's largest area of impact and presents a significant challenge in attempting to allocate spend to individual production processes.We have not evaluated ways to overcome this challenge at the present time.
SC1.4
(SC1.4) Do you plan to develop your capabilities to allocate emissions to your customers in the future?Yes
CDP Page of 4140

SC1.4a
(SC1.4a) Describe how you plan to develop your capabilities.
Biogen plans to strategically conduct additional submetering as well as life cycle assessments for certain production processes to better understand their impacts. This mayallow Biogen to shift from towards product and production specific allocations.
SC2.1
(SC2.1) Please propose any mutually beneficial climate-related projects you could collaborate on with specific CDP Supply Chain members.
SC2.2
(SC2.2) Have requests or initiatives by CDP Supply Chain members prompted your organization to take organizational-level emissions reduction initiatives?No
SC3.1
(SC3.1) Do you want to enroll in the 2020-2021 CDP Action Exchange initiative?No
SC3.2
(SC3.2) Is your company a participating supplier in CDP’s 2019-2020 Action Exchange initiative?No
SC4.1
(SC4.1) Are you providing product level data for your organization’s goods or services?No, I am not providing data
Submit your response
In which language are you submitting your response?English
Please confirm how your response should be handled by CDP
I am submitting to Public or Non-Public Submission Are you ready to submit the additional Supply Chain Questions?
I am submitting my response InvestorsCustomers
Public Yes, submit Supply Chain Questions now
Please confirm belowI have read and accept the applicable Terms
CDP Page of 4141