Biogen Business Overview
15
1 Biogen Business Overview 2018 Annual Meeting of Stockholders Michel Vounatsos, CEO June 12, 2018
Transcript of Biogen Business Overview
1
Biogen Business Overview2018 Annual Meeting of Stockholders
Michel Vounatsos, CEO
June 12, 2018
2
This presentation contains forward-looking statements, including statements relating to: our strategy and plans; potential of our commercial business and pipeline programs;
capital allocation and investment strategy; clinical trials and data readouts and presentations; regulatory filings and the timing thereof; financial matters; and anticipated benefits
and potential of investments, collaborations and business development activities. These forward-looking statements may be accompanied by such words as “aim,” “anticipate,”
“believe,” “could,” “estimate,” “expect,” “forecast,” “intend,” “may,” “plan,” “potential,” “possible,” “will” and other words and terms of similar meaning. Drug development and
commercialization involve a high degree of risk, and only a small number of research and development programs result in commercialization of a product. Results in early stage
clinical trials may not be indicative of full results or results from later stage or larger scale clinical trials and do not ensure regulatory approval. You should not place undue
reliance on these statements or the scientific data presented.
These statements involve risks and uncertainties that could cause actual results to differ materially from those reflected in such statements, including: our dependence on sales
from our principal products; failure to compete effectively due to significant product competition in the markets for our products; difficulties in obtaining and maintaining adequate
coverage, pricing and reimbursement for our products; the occurrence of adverse safety events, restrictions on use with our products or product liability claims; failure to protect
and enforce our data, intellectual property and other proprietary rights and the risks and uncertainties relating to intellectual property claims and challenges; uncertainty of long-
term success in developing, licensing, or acquiring other product candidates or additional indications for existing products; the risk that positive results in a clinical trial may not be
replicated in subsequent or confirmatory trials or success in early stage clinical trials may not be predictive of results in later stage or large scale clinical trials or trials in other
potential indications; risks associated with clinical trials, including our ability to adequately manage clinical activities, unexpected concerns that may arise from additional data or
analysis obtained during clinical trials, regulatory authorities may require additional information or further studies, or may fail to approve or may delay approval of our drug
candidates; risks associated with current and potential future healthcare reforms; problems with our manufacturing processes; risks relating to technology failures or breaches;
our dependence on collaborators and other third parties for the development, regulatory approval, and commercialization of products and other aspects of our business, which
are outside of our control; failure to successfully execute on our growth initiatives; risks relating to management and key personnel changes, including attracting and retaining key
personnel; risks relating to investment in and expansion of manufacturing capacity for future clinical and commercial requirements; failure to comply with legal and regulatory
requirements; fluctuations in our effective tax rate; the risks of doing business internationally, including currency exchange rate fluctuations; risks related to commercialization of
biosimilars; risks related to investment in properties; the market, interest and credit risks associated with our portfolio of marketable securities; risks relating to stock repurchase
programs; risks relating to access to capital and credit markets; risks related to indebtedness; environmental risks; risks relating to the sale and distribution by third parties of
counterfeit versions of our products; risks relating to the use of social media for our business; change in control provisions in certain of our collaboration agreements; risks relating
to the spin-off of our hemophilia business, including risks of operational difficulties and exposure to claims and liabilities; and the other risks and uncertainties that are described in
the Risk Factors section of our most recent annual or quarterly report and in other reports we have filed with the Securities and Exchange Commission.
These statements are based on our current beliefs and expectations and speak only as of the date of this presentation. We do not undertake any obligation to publicly update any
forward-looking statements.
Note regarding trademarks: AVONEX®, PLEGRIDY®, SPINRAZA®, TECFIDERA®, TYSABRI® and ZINBRYTA® are registered trademarks of Biogen. BENEPALITM, FLIXABITM and
IMRALDITM are trademarks of Biogen. Other trademarks referenced in this presentation are the property of their respective owners.
Forward-Looking Statements

3
Strong Track Record
6.9
9.710.8
11.412.3
2013 2014 2015 2016 2017
Revenues ($B)
+14% CAGR
Non-GAAP Diluted EPS is a Non-GAAP financial measure. A reconciliation of our GAAP to Non-GAAP financial results is at the end of this presentation.
8.96
13.83
17.01
20.2221.81
2013 2014 2015 2016 2017
Non-GAAP Diluted EPS($)
7.81
12.37
15.3416.93
11.92
2013 2014 2015 2016 2017
GAAP Diluted EPS($)
+11% CAGR +25% CAGR
* 2017 GAAP Diluted EPS was negatively impacted by $5.51 related to the transition toll tax and re-measurement of net deferred tax assets related to the Tax Cuts and Jobs Act of 2017.
*
^
4
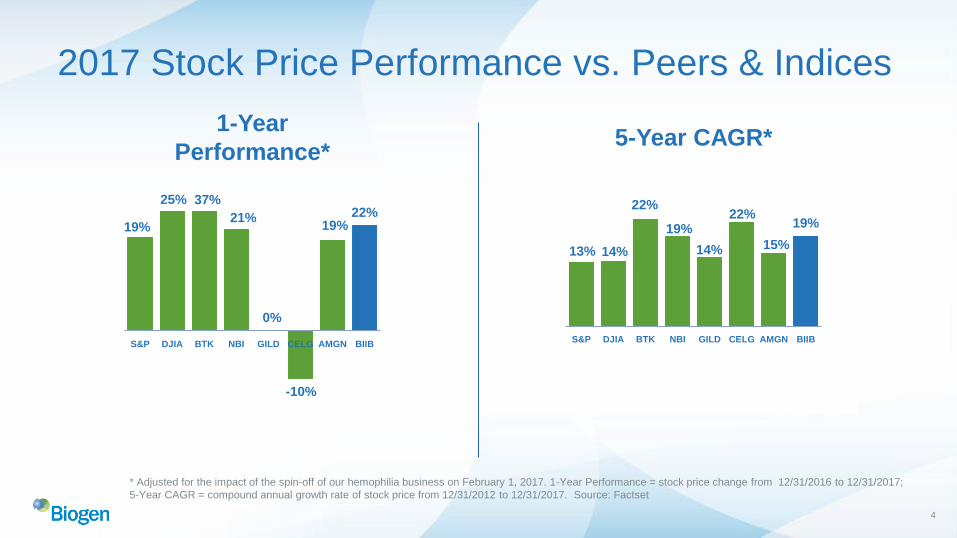
2017 Stock Price Performance vs. Peers & Indices
19%
25% 37%
21%
0%
-10%
19%22%
S&P DJIA BTK NBI GILD CELG AMGN BIIB
1-Year
Performance*5-Year CAGR*
* Adjusted for the impact of the spin-off of our hemophilia business on February 1, 2017. 1-Year Performance = stock price change from 12/31/2016 to 12/31/2017;
5-Year CAGR = compound annual growth rate of stock price from 12/31/2012 to 12/31/2017. Source: Factset
13% 14%
22%
19%
14%
22%
15%
19%
S&P DJIA BTK NBI GILD CELG AMGN BIIB
5
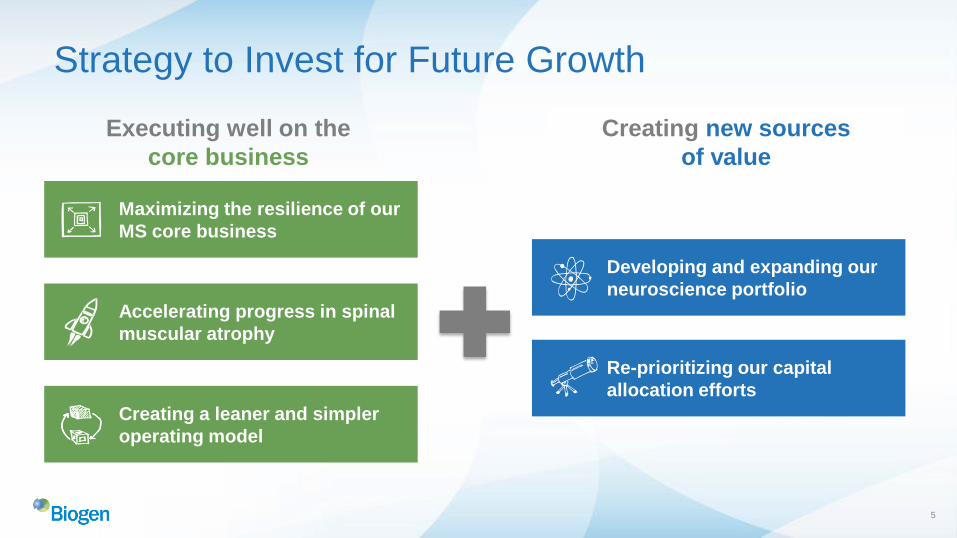
Strategy to Invest for Future Growth
Maximizing the resilience of our
MS core business
Accelerating progress in spinal
muscular atrophy
Creating a leaner and simpler
operating model
Developing and expanding our
neuroscience portfolio
Re-prioritizing our capital
allocation efforts
Executing well on the
core business
Creating new sources
of value

6
It is our belief that no other area of medicine holds as much
promise with as much need as neuroscience.
Building An Industry Leading Neuroscience Company
Significant Opportunities in Neuroscience
Core Growth Areas Emerging Growth Areas
Acute
Neurology
Neuro-
psychiatry
Ophthal-
mologyPain
Neuro-
muscular
Disorders
Movement
Disorders
Alzheimer’s
Disease/
Dementia
MS and Neuro-
immunology
7
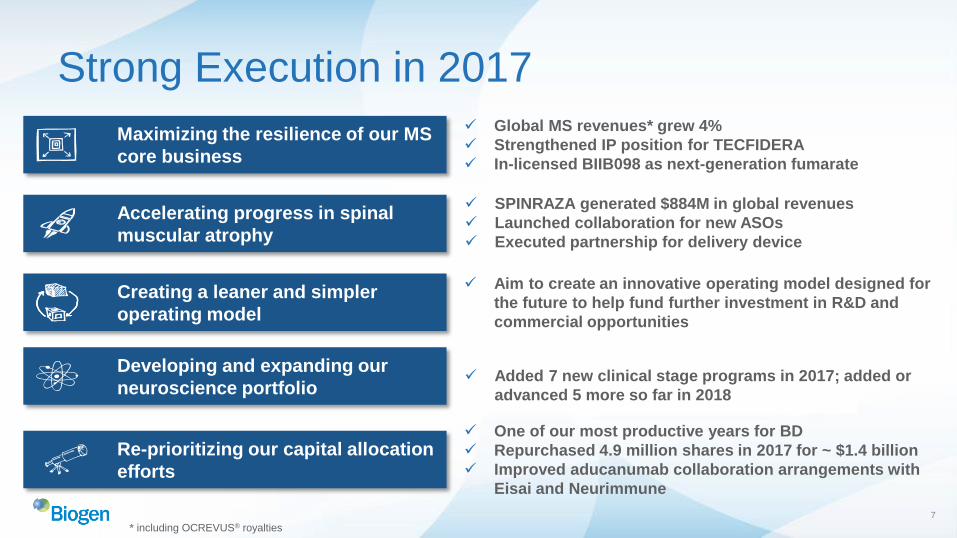
Strong Execution in 2017
Maximizing the resilience of our MS
core business
Global MS revenues* grew 4%
Strengthened IP position for TECFIDERA
In-licensed BIIB098 as next-generation fumarate
Accelerating progress in spinal
muscular atrophy
SPINRAZA generated $884M in global revenues
Launched collaboration for new ASOs
Executed partnership for delivery device
Developing and expanding our
neuroscience portfolio Added 7 new clinical stage programs in 2017; added or
advanced 5 more so far in 2018
Re-prioritizing our capital allocation
efforts
One of our most productive years for BD
Repurchased 4.9 million shares in 2017 for ~ $1.4 billion
Improved aducanumab collaboration arrangements with
Eisai and Neurimmune
Creating a leaner and simpler
operating model
Aim to create an innovative operating model designed for
the future to help fund further investment in R&D and
commercial opportunities
* including OCREVUS® royalties

8
Demonstrated Resilience in our $9 Billion MS Franchise
256k
306k331k 343k 350k
2013 2014 2015 2016 2017
AVONEX PLEGRIDY TYSABRI TECFIDERA ZINBRYTA
Biogen MS PatientsThousands
► ~$20B market with ~950k treated MS
patients worldwide1
► As of March 31, 2018, Biogen products
treated ~36% of all treated MS patients
globally1
► Bolstered MS pipeline with in-licensing of
BIIB098 (MMF prodrug)
► Pursuing extended interval dosing for
TYSABRI
► Developing intramuscular formulation of
PLEGRIDY
► Advancing opicinumab in Phase 2b for
remyelination in MSNote: Patient numbers represent estimated ending patient count as of December 31st of each year.1. Biogen data on file.
+8%
CAGR
HIGHLIGHTS
9
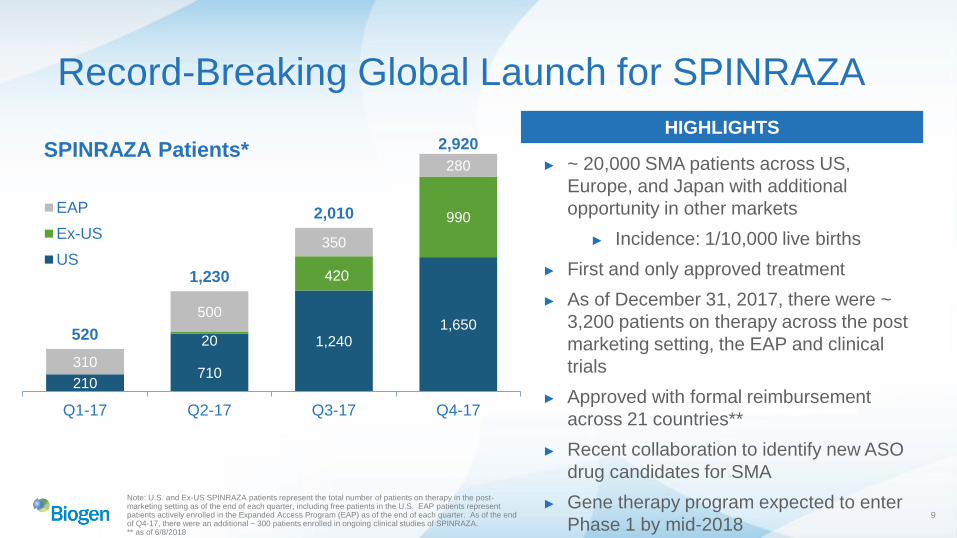
Record-Breaking Global Launch for SPINRAZA
► ~ 20,000 SMA patients across US,
Europe, and Japan with additional
opportunity in other markets
► Incidence: 1/10,000 live births
► First and only approved treatment
► As of December 31, 2017, there were ~
3,200 patients on therapy across the post
marketing setting, the EAP and clinical
trials
► Approved with formal reimbursement
across 21 countries**
► Recent collaboration to identify new ASO
drug candidates for SMA
► Gene therapy program expected to enter
Phase 1 by mid-2018
HIGHLIGHTS
Note: U.S. and Ex-US SPINRAZA patients represent the total number of patients on therapy in the post-marketing setting as of the end of each quarter, including free patients in the U.S. EAP patients represent patients actively enrolled in the Expanded Access Program (EAP) as of the end of each quarter. As of the end of Q4-17, there were an additional ~ 300 patients enrolled in ongoing clinical studies of SPINRAZA.** as of 6/8/2018
210710
1,2401,650
20
420
990
310
500
350
280
520
1,230
2,010
2,920
Q1-17 Q2-17 Q3-17 Q4-17
EAP
Ex-US
US
SPINRAZA Patients*
10
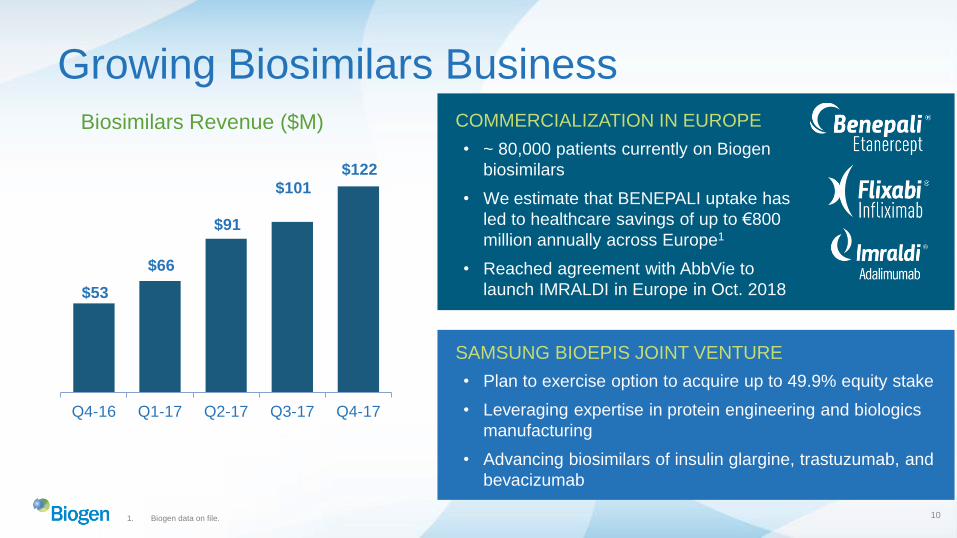
Biosimilars Revenue ($M)
Growing Biosimilars Business
$53
$66
$91
$101$122
Q4-16 Q1-17 Q2-17 Q3-17 Q4-17
SAMSUNG BIOEPIS JOINT VENTURE
• Plan to exercise option to acquire up to 49.9% equity stake
• Leveraging expertise in protein engineering and biologics
manufacturing
• Advancing biosimilars of insulin glargine, trastuzumab, and
bevacizumab
COMMERCIALIZATION IN EUROPE
• ~ 80,000 patients currently on Biogen
biosimilars
• We estimate that BENEPALI uptake has
led to healthcare savings of up to €800
million annually across Europe1
• Reached agreement with AbbVie to
launch IMRALDI in Europe in Oct. 2018
1. Biogen data on file.
11
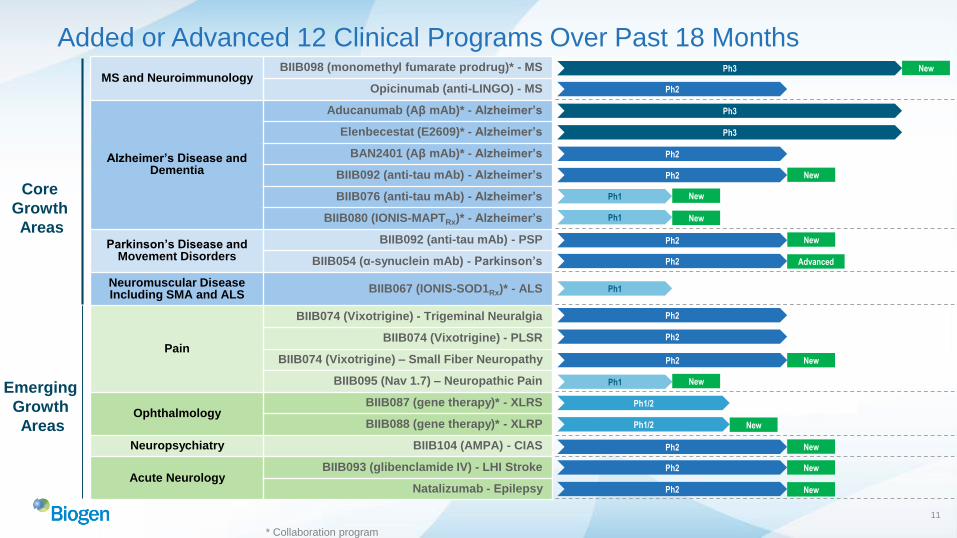
Added or Advanced 12 Clinical Programs Over Past 18 Months
Core
Growth
Areas
Emerging
Growth
Areas
Ph1/2
Ph2
Ph3
Ph2
Ph2
Ph2
Ph2
Ph3
Ph2
Ph1
Ph2
Ph1
MS and NeuroimmunologyBIIB098 (monomethyl fumarate prodrug)* - MS
Opicinumab (anti-LINGO) - MS
Alzheimer’s Disease and Dementia
Aducanumab (Aβ mAb)* - Alzheimer’s
Elenbecestat (E2609)* - Alzheimer’s
BAN2401 (Aβ mAb)* - Alzheimer’s
BIIB092 (anti-tau mAb) - Alzheimer’s
BIIB076 (anti-tau mAb) - Alzheimer’s
BIIB080 (IONIS-MAPTRx)* - Alzheimer’s
Parkinson’s Disease and Movement Disorders
BIIB092 (anti-tau mAb) - PSP
BIIB054 (α-synuclein mAb) - Parkinson’s
Neuromuscular Disease Including SMA and ALS
BIIB067 (IONIS-SOD1Rx)* - ALS
Pain
BIIB074 (Vixotrigine) - Trigeminal Neuralgia
BIIB074 (Vixotrigine) - PLSR
BIIB074 (Vixotrigine) – Small Fiber Neuropathy
BIIB095 (Nav 1.7) – Neuropathic Pain
OphthalmologyBIIB087 (gene therapy)* - XLRS
BIIB088 (gene therapy)* - XLRP
Neuropsychiatry BIIB104 (AMPA) - CIAS
Acute NeurologyBIIB093 (glibenclamide IV) - LHI Stroke
Natalizumab - Epilepsy
Ph1
Ph2
Ph3
Ph2
New
Ph1 New
Ph2 New
Ph1/2 New
Ph2 New
New
New
New
Advanced
New
New
New
* Collaboration program
12
Biogen 2017 and Beyond
Continued Growth in 2017
Updated Strategy to Invest in Future Growth
Strong Execution in 2017
Advancing and Expanding Pipeline
as we aim to be the Leader in Neuroscience
13
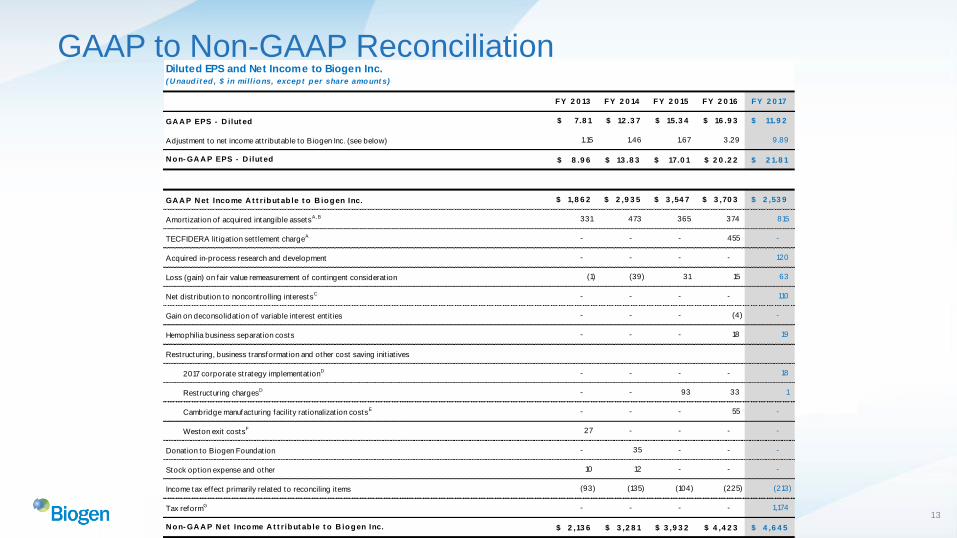
GAAP to Non-GAAP ReconciliationDiluted EPS and Net Income to Biogen Inc.( U naud it ed , $ in mill ions, excep t per share amount s)
FY 2 0 13 FY 2 0 14 FY 2 0 15 FY 2 0 16 FY 2 0 17
GA A P EPS - D ilut ed 7.8 1$ 12 .3 7$ 15.3 4$ 16 .9 3$ 11.9 2$
Adjustment to net income attributable to Biogen Inc. (see below) 1.15 1.46 1.67 3.29 9.89
N on- GA A P EPS - D ilut ed 8 .9 6$ 13 .8 3$ 17.0 1$ 2 0 .2 2$ 2 1.8 1$
GA A P N et Income A t t r ibut ab le t o B iogen Inc. 1,8 6 2$ 2 ,9 3 5$ 3 ,54 7$ 3 ,70 3$ 2 ,53 9$
Amort izat ion of acquired intangible assetsA,B 331 473 365 374 815
TECFIDERA lit igat ion sett lement chargeA - - - 455 -
Acquired in-process research and development - - - - 120
Loss (gain) on fair value remeasurement of cont ingent considerat ion (1) (39) 31 15 63
Net distribut ion to noncontrolling interestsC - - - - 110
Gain on deconsolidat ion of variable interest ent it ies - - - (4) -
Hemophilia business separat ion costs - - - 18 19
Restructuring, business transformation and other cost saving init iat ives
2017 corporate strategy implementat ionD - - - - 18
Restructuring chargesD - - 93 33 1
Cambridge manufacturing facility rat ionalizat ion costsE - - - 55 -
Weston exit costsF 27 - - - -
Donat ion to Biogen Foundat ion - 35 - - -
Stock opt ion expense and other 10 12 - - -
Income tax effect primarily related to reconciling items (93) (135) (104) (225) (213)
Tax reformG - - - - 1,174
N on- GA A P N et Income A t t r ibut ab le t o B iogen Inc. 2 ,13 6$ 3 ,2 8 1$ 3 ,9 3 2$ 4 ,4 2 3$ 4 ,6 4 5$
14
GAAP to Non-GAAP ReconciliationUse of Non-GAAP Financial Measures
We supplement our consolidated financial statements presented on a GAAP basis by providing
additional measures which may be considered “Non-GAAP” financial measures under applicable
SEC rules. We believe that the disclosure of these Non-GAAP financial measures provides
additional insight into the ongoing economics of our business and reflects how we manage our
business internally, set operational goals and forms the basis of our management incentive
programs. These Non-GAAP financial measures are not in accordance with generally accepted
accounting principles in the United States and should not be viewed in isolation or as a substitute
for reported, or GAAP, net income attributable to Biogen Inc. and diluted earnings per share.
Our “Non-GAAP net income attributable to Biogen Inc.” and “Non-GAAP earnings per share -
Diluted” financial measures exclude the following items from "GAAP net income attributable to
Biogen Inc." and "GAAP earnings per share - Diluted":
1. Purchase accounting and merger-related adjustments
We exclude certain purchase accounting related items associated with the acquisition of
businesses, assets and amounts in relation to the consolidation or deconsolidation of variable
interest entities for which we are the primary beneficiary. These adjustments include, but are not
limited to, charges for in-process research and development, the amortization of certain acquired
intangible assets, and charges or credits from the fair value remeasurement of our contingent
consideration obligations.
2. Hemophilia business separation costs
We have excluded costs that are directly associated with the set up and spin-off of our hemophilia
business into an independent, publicly-traded company on February 1, 2017. These costs
represent incremental third party costs attributable solely to hemophilia separation and set up
activities.
3. Restructuring, business transformation and other cost saving initiatives
We exclude costs associated with the company’s execution of certain strategies and initiatives to
streamline operations, achieve targeted cost reductions, rationalize manufacturing facilities or
refocus R&D activities. These costs may include employee separation costs, retention bonuses,
facility closing and exit costs, asset impairment charges or additional depreciation when the
expected useful life of certain assets have been shortened due to changes in anticipated usage,
and other costs or credits that management believes do not have a direct correlation to our on-
going or future business operations.
4. Other items
We evaluate other items of income and expense on an individual basis, and consider both the
quantitative and qualitative aspects of the item, including (i) its size and nature, (ii) whether or not it
relates to our ongoing business operations, and (iii) whether or not we expect it to occur as part of
our normal business on a regular basis. We also include an adjustment to reflect the related tax
effect of all reconciling items within our reconciliation of our GAAP to Non-GAAP net income
attributable to Biogen Inc. and diluted earnings per share.
Numbers may not foot due to rounding.
A Amortization of acquired intangible assets for 2017 includes $444 million of impairment and amortization charges related to the intangible
assets associated with our U.S. and rest of world licenses to Forward Pharma A/S’ (Forward Pharma) intellectual property, inc luding Forward
Pharma's intellectual property related to TECFIDERA. In exchange for these licenses, we paid Forward Pharma $1.25 billion in cash. During the
fourth quarter of 2016 we recognized a pre-tax charge of $455 million and in the first quarter of 2017 we recognized intangible assets of $795
million related to this agreement.
We have two intellectual property disputes with Forward Pharma, one in the U.S. and one in the European Union, concerning intellectual
property related to TECFIDERA. In March 2017 the U.S. intellectual property dispute was decided in our favor. We evaluated the recoverability
of the U.S. asset acquired from Forward Pharma and recorded an impairment charge in the first quarter of 2017 to adjust the carrying value of
the acquired U.S. asset to fair value reflecting the impact of the developments in the U.S. legal dispute. In March 2018 the European Patent
Office issued its decision revoking Forward Pharma’s European Patent No. 2 801 355. Based upon our assessment of these rulings, we
continue to amortize the remaining net book value of the U.S. and rest of world intangible assets in our consolidated statements of income
utilizing an economic consumption model.
The TECFIDERA litigation settlement charge for 2016 represents the portion of the $1.25 billion cash payment made in the first quarter of 2017
attributable to our sales of TECFIDERA during the period April 2014 through December 31, 2016.
B Amortization of acquired intangible assets for 2017 includes a $31 million pre-tax impairment charge related to our acquired and in-licensed
rights and patents intangible asset due to the European Medicines Agency’s review (referred to as an Article 20 Procedure) of ZINBRYTA.
C Net distribution to noncontrolling interests for 2017 reflects the after-tax $150 million upfront payment made to Neurimmume SubOne AG
(Neurimmune) in exchange for a 15% reduction in royalty rates payable on potential commercial sales of aducanumab, our anti -amyloid beta
antibody candidate for Alzheimer’s disease. This upfront payment is in relation to the amendment of terms of our collaboration agreement with
Neurimmune.
D 2017 corporate strategy and restructuring charges for 2017 are related to our efforts to create a leaner and simpler operating model.
Restructuring charges for 2016 include charges of $18 million incurred in connection with our 2016 restructuring resulting from our decision to
spin-off our hemophilia business. Restructuring charges for 2016 also include severance charges of $7 million related to employee separation
costs as a result of our decision to vacate and cease manufacturing in Cambridge, MA and vacate our warehouse in Somerville, MA.
Restructuring charges for 2016 further include $8 million of costs incurred in connection with our 2015 corporate restructuring.
Restructuring charges for 2015 reflect $93 million of charges incurred in connection with our 2015 corporate restructuring.
E Cambridge manufacturing facility rationalization costs for 2016 reflects $46 million of additional depreciation expense included in cost of
sales, excluding amortization of acquired intangible assets in our consolidated statements of income. Cambridge manufacturing facility
rationalization costs for 2016 also includes charges of $7 million for the write-down of excess inventory.
F This charge represents the remaining lease obligation for the vacated portion or our Weston, MA facility, net of sublease income upon
relocation of our headquarters to Cambridge, MA.
G On December 22, 2017, the Tax Cuts and Jobs Act of 2017 (the 2017 Tax Act) was signed into law and has resulted in significant changes to
the U.S. corporate income tax system. The 2017 Tax Act includes a federal corporate rate reduction from 35% to 21%, the elimination or
reduction of certain domestic deductions and credits, the transition of U.S. international taxation from a worldwide tax system towards a
territorial tax system, limitations on the deductibility of interest expense and executive compensation and base-erosion prevention measures on
future non-U.S. earnings of U.S. entities, which has the effect of subjecting certain of our earnings of foreign subsidiaries to U.S. taxation. These
changes became effective beginning in 2018.
The 2017 Tax Act also includes a one-time mandatory deemed repatriation tax on accumulated foreign subsidiaries' previously untaxed foreign
earnings (the Transition Toll Tax).
Changes in tax rates and tax laws are accounted for in the period of enactment. Therefore, during 2017 we recorded a charge totaling $1,174
million related to our current estimate of the provisions of the 2017 Tax Act, including a $990 million expense under the Transition Toll Tax. The
Transition Toll Tax must be paid over an eight-year period, starting in 2018, and will not accrue interest.
15
Questions & Answers