BioFuels Impacts Today/Tomorrow Land, Rents, Farm Management Midwest, Great Plains and Western...
36
BioFuels Impacts Today/Tomorrow Land, Rents, Farm Management Midwest, Great Plains and Western Outlook Conference Indianapolis, IN Mike Duffy August 15, 2007
-
Upload
daniela-blankenship -
Category
Documents
-
view
217 -
download
1
Transcript of BioFuels Impacts Today/Tomorrow Land, Rents, Farm Management Midwest, Great Plains and Western...

BioFuels Impacts Today/TomorrowLand, Rents, Farm Management
Midwest, Great Plains and Western Outlook Conference
Indianapolis, INMike Duffy
August 15, 2007

Outline
• Land values and rents• Current situation• Observation• Outlook• Discussion

Land Values

U.S. Average Land Values
$0
$500
$1,000
$1,500
$2,000
$2,500
1950 1954 1958 1962 1966 1970 1974 1978 1982 1986 1990 1994 1998 2002 2006

Average Farmland Value by Region
$0
$1,000
$2,000
$3,000
$4,000
$5,000
$6,000
1995 1996 1997 1998 1999 2000 2001 2002 2003 2004 2005 2006 2007
NE Corn belt SE Plains MT Pacific US

Percent Change in Land Values by Region, 2006-2007
0%
2%
4%
6%
8%
10%
12%
14%
16%
18%
20%
North
east:
Lake
Sta
tes:
Corn
Belt:
North
ern
Plains
:
Appal
achia
n:
South
east
:
Delta
Sta
tes:
South
ern
Plains
:
Mou
ntai
n:
Pacific
:
48 S
tate
s

Percent Change in Land Values by Region, 2002 to 2007
0%
20%
40%
60%
80%
100%
120%
140%
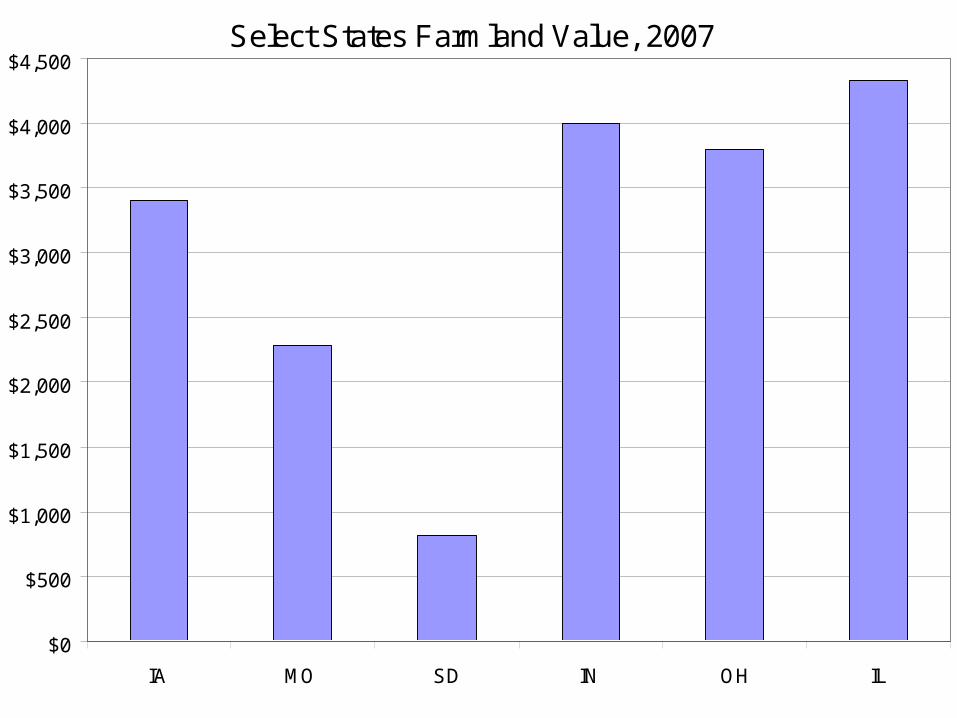
Select States Farmland Value, 2007
$0
$500
$1,000
$1,500
$2,000
$2,500
$3,000
$3,500
$4,000
$4,500
IA MO SD IN OH IL

Selected States Farmland Value, 2007
$0
$500
$1,000
$1,500
$2,000
$2,500
$3,000
$3,500
$4,000
KS ND KY MI CO OK
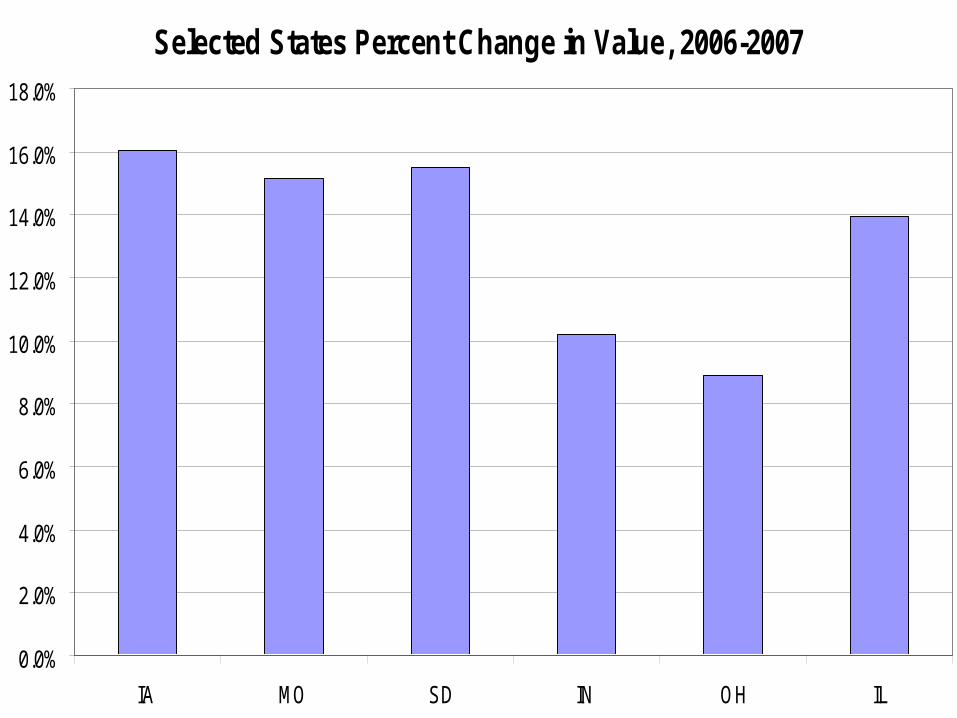
Selected States Percent Change in Value, 2006-2007
0.0%
2.0%
4.0%
6.0%
8.0%
10.0%
12.0%
14.0%
16.0%
18.0%
IA MO SD IN OH IL

Selected States Percentage Change in Value, 2006-2007
0.0%
2.0%
4.0%
6.0%
8.0%
10.0%
12.0%
14.0%
16.0%
18.0%
KS ND KY MI CO OK

Current Percentage Changes in Land Values, 7th Federal Reserve District
0%
2%
4%
6%
8%
10%
12%
14%
16%
18%
IL IN IA WI 7th District
1st Quarter '07 April to April '07

Average Cash Rent by Region and Year
$0
$25
$50
$75
$100
$125
$150
$175
$200
$225
1999 2000 2001 2002 2003 2004 2005 2006 2007
Northeast: Lake States: Corn Belt: Northern Plains:
Appalachian: Southeast: Delta States: Southern Plains:
Mountain: Pacific: 48 States

Percent Change in Cash Rent by Region, 2006-2007
0%
2%
4%
6%
8%
10%
12%
14%
16%
18%
20%
North
east:
Lake
Sta
tes:
Corn B
elt:
North
ern P
lains:
Appala
chian
:
South
east:
Delta
State
s:
South
ern
Plains
:
Moun
tain
:
Pacific
:
48 S
tate
s

Percent Change in Cash Rent by Region from 1999 to 2007
0%
5%
10%
15%
20%
25%
30%
35%

Selected States Cash Rent Value, 2007
$0.00
$20.00
$40.00
$60.00
$80.00
$100.00
$120.00
$140.00
$160.00
IA MO SD IN OH IL
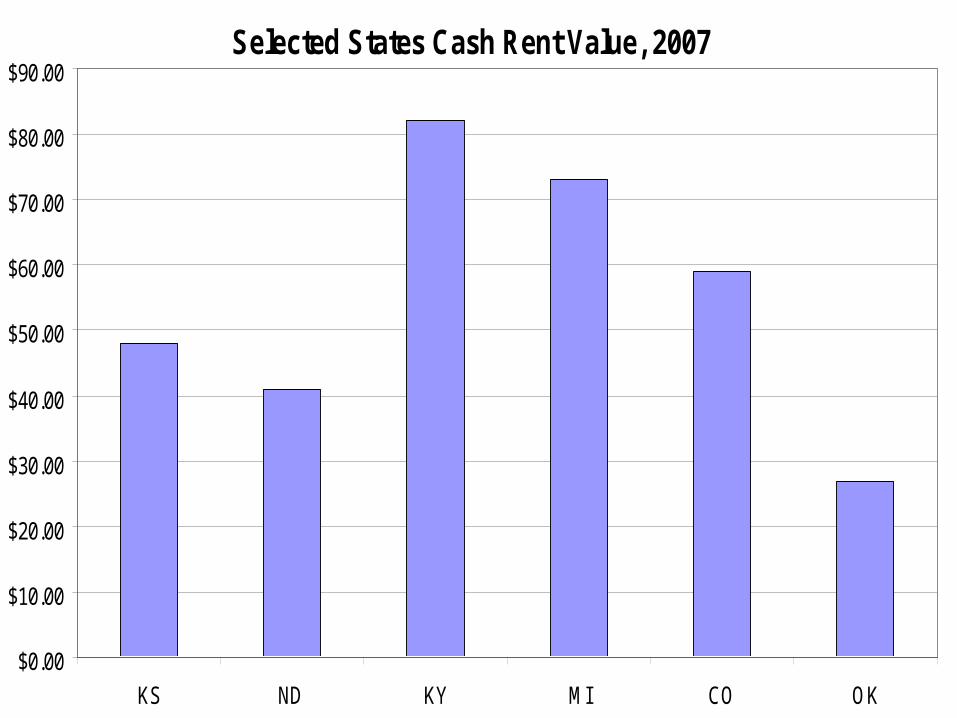
Selected States Cash Rent Value, 2007
$0.00
$10.00
$20.00
$30.00
$40.00
$50.00
$60.00
$70.00
$80.00
$90.00
KS ND KY MI CO OK
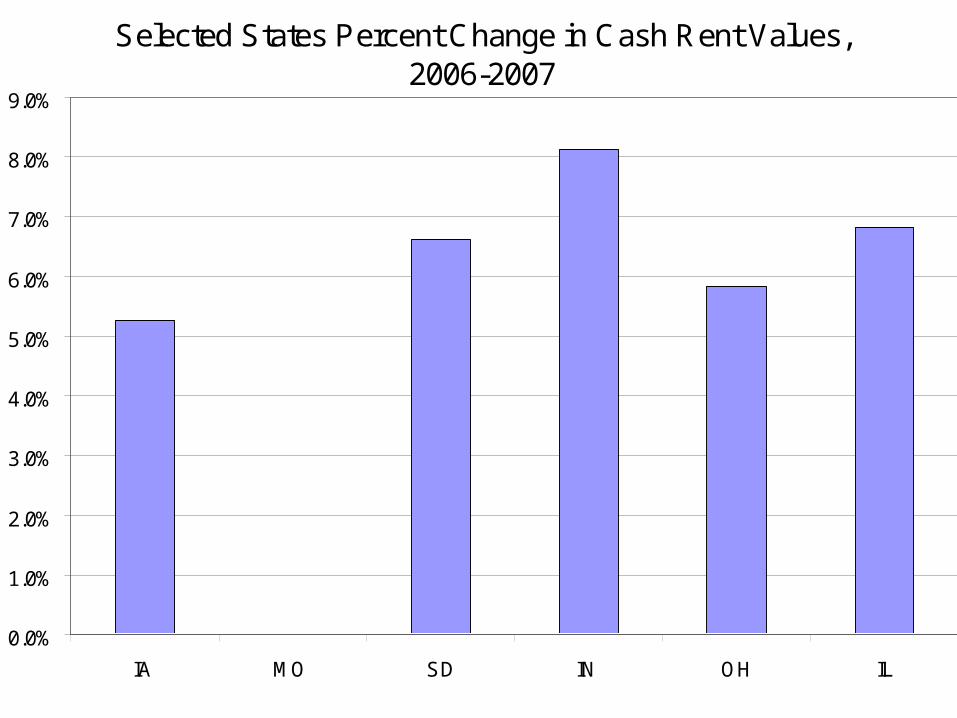
Selected States Percent Change in Cash Rent Values, 2006-2007
0.0%
1.0%
2.0%
3.0%
4.0%
5.0%
6.0%
7.0%
8.0%
9.0%
IA MO SD IN OH IL

Selected States Percent Change in Cash Rent Values, 2006-2007
-6.0%
-4.0%
-2.0%
0.0%
2.0%
4.0%
6.0%
8.0%
10.0%
12.0%
14.0%
KS ND KY MI CO OK

Rent to Value for Cropland by Region, 2007
0.0%
1.0%
2.0%
3.0%
4.0%
5.0%
6.0%
Northeast: Corn Belt: NorthernPlains:
Southeast: Mountain: Pacific: 48 States

Current Situation

• Sub prime mortgage situation and responses
• Increased production costs, especially seed and fertilizer
• Increased fertilizer use with more corn
• Considerable interest in 2008 rents in Iowa
• Two camps; 10% or 25% increase• Changing rent structure and owner
demographics

Distribution of Iowa Farmland by Age of Owner
0%
5%
10%
15%
20%
25%
< 25 25 - 34 35 - 44 45 - 54 55 - 64 65 - 74 > 75
1982 1992 2002
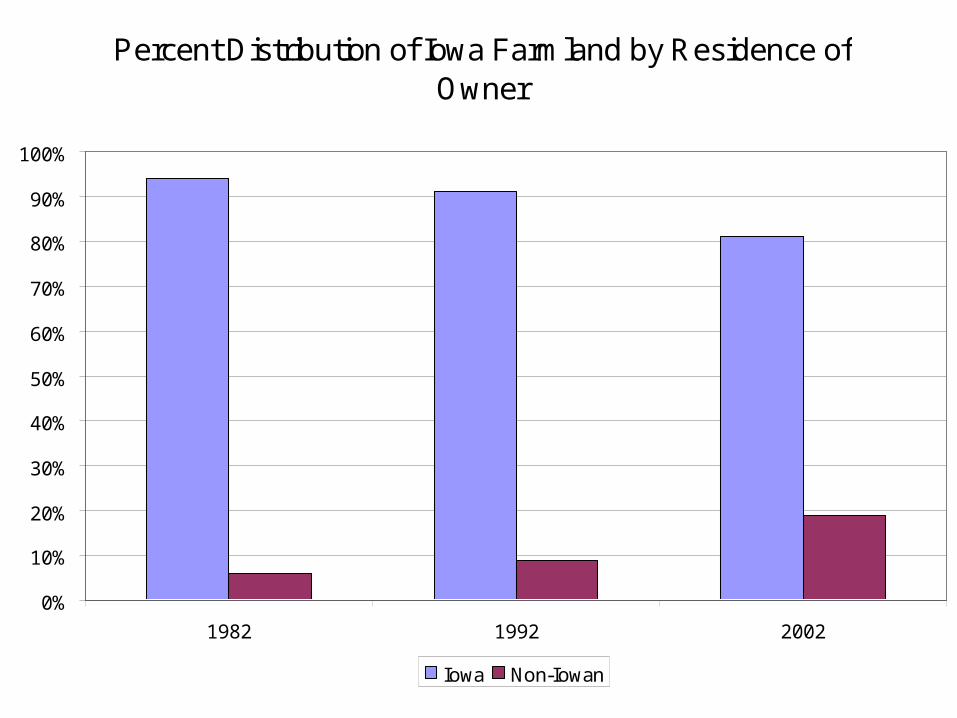
Percent Distribution of Iowa Farmland by Residence of Owner
0%
10%
20%
30%
40%
50%
60%
70%
80%
90%
100%
1982 1992 2002
Iowa Non-Iowan

Distribution of Rented Land in Iowa by Type of Lease and Year
0%
10%
20%
30%
40%
50%
60%
70%
1982 1992 2002
Cash Crop Share Other

Observation

Another Golden Era?• “There never has been a more
glorious opportunity in the history of the world for the Corn Belt farmer than there is today…”
• “It (Tama County land) will never be worth any less and the tendency will be for higher prices from now on,..”
• 1919 Tama County survey

Another Golden Era?• “The 1970’s have sometimes been
called the second golden age of American agriculture, comparable in many ways to the period from 1905 to 1915,…” the first golden age.
• “..many agricultural economists, and others urged farmers to expand their operations so the United States would be able to meet the demands for its farm products.”


Another Golden Era?• Is the bioeconomy the final push to
move agriculture beyond “the curse of agricultural abundance”?
• Some factors are different but some factors remain the same
• Farmers always have a tendency to bid profits into land values; other costs of production, especially energy based costs are increasing

Outlook

Factors to Watch• The bioeconomy, especially corn
based ethanol• The government programs;
outcome for level and type of programs is unknown; more of the same but less of it; major cuts? Regional differences could be a major factor; Public sentiment

Factors to Watch
• Overall performance of the economy, especially interest rates
• Recreational demand• Performance of the housing market• Aging farmland owners and what
the second generation will do with the land

Factors to Watch
• We are entering into a period of major uncertainty. How the ethanol situation will play out no one knows for sure.
• Land values will move with higher income and anticipation; tempered by overall economy
• How long will this ‘golden era’ last and what will be the aftermath?

Discussion