European Union and No. IDBTN191 United States Biofuel Mandates

Biofuel Biofuel OutlookOutlook
Terrence Higgins
EIA: August 1, 2012
I: Global Overview
II: Focus on Americas
A. Brazilian Ethanol Supply
Outline
All rights reserved (2012)
B. U.S. Biofuel
1. RFS Requirements
2. Ethanol Limitations
3. Advanced Biofuel

Global Outlook

Africa:
Countries beginning
to set mandatesAsia Pacific:
High variance
in blend levels
Europe:
RED implementation, sustainability
and GHG savings
North America:
RFS2, LCFS, intermediate blends
Biofuel Mandates in 2012
Source: Hart Energy’s Global Biofuels Center, June 2012
Latin America: More
countries push for
mid- and higher
level ethanol blends Ethanol
Biodiesel
Ethanol & Biodiesel
Partial or No known biofuels program
Middle East:
Ethanol &
jatropha
R&D projects;
algae

Current Mandates in Asia
NORTHKOREA
JAPANSOUTHKOREA
CHINA
MONGOLIA
PAKISTAN
BHUTAN
BANGLADESHINDIA
Hong KongMacau
TaiwanNEPAL
E5 Nationwide
except selected
states
B2
B2
E10 in 10
provinces
E10, B2
Source: Hart Energy’s Global Biofuels Center, July 2012
SRILANKA
MALAYSIA
BRUNEI
CAMBODIA
THAILAND
VIETNAMLAOS
BURMA
PHILIPPINES
SINGAPORE
INDONESIA
Nationwide mandate
Partial mandate
E10 (or E5) available on market
ETBE - blended gasoline
Key:B5
E3, B2.5
B5
20
30
40
50
60
70
Billion Liters
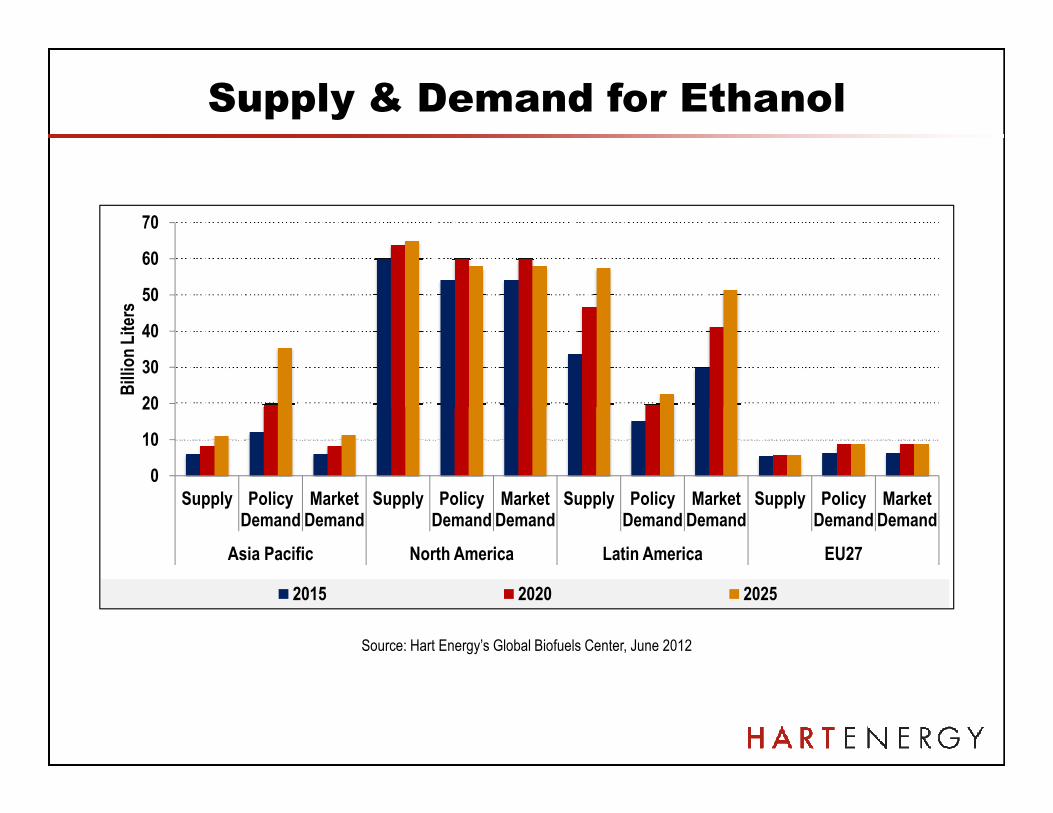
Supply & Demand for Ethanol
0
10
20
Supply Policy Demand
Market Demand
Supply Policy Demand
Market Demand
Supply Policy Demand
Market Demand
Supply Policy Demand
Market Demand
Asia Pacific North America Latin America EU27
2015 2020 2025
Source: Hart Energy’s Global Biofuels Center, June 2012

10
15
20
25
30
Billion Liters
Supply & Demand for Biodiesel
0
5
Supply Policy Demand
Market Demand
Supply Policy Demand
Market Demand
Supply Policy Demand
Market Demand
Supply Policy Demand
Market Demand
Asia Pacific North America Latin America EU27
2015 2020 2025
Source: Hart Energy’s Global Biofuels Center, June 2012
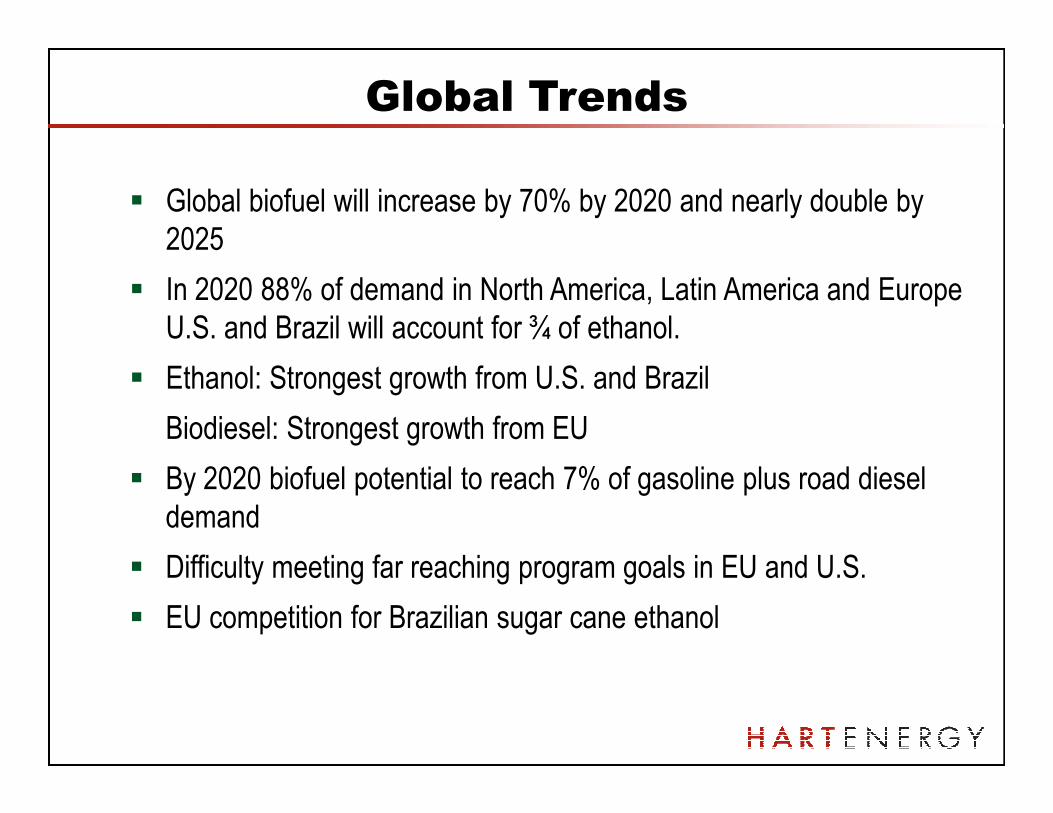
� Global biofuel will increase by 70% by 2020 and nearly double by
2025
� In 2020 88% of demand in North America, Latin America and Europe
U.S. and Brazil will account for ¾ of ethanol.
� Ethanol: Strongest growth from U.S. and Brazil
Global Trends
Biodiesel: Strongest growth from EU
� By 2020 biofuel potential to reach 7% of gasoline plus road diesel
demand
� Difficulty meeting far reaching program goals in EU and U.S.
� EU competition for Brazilian sugar cane ethanol

Focus on the Americas
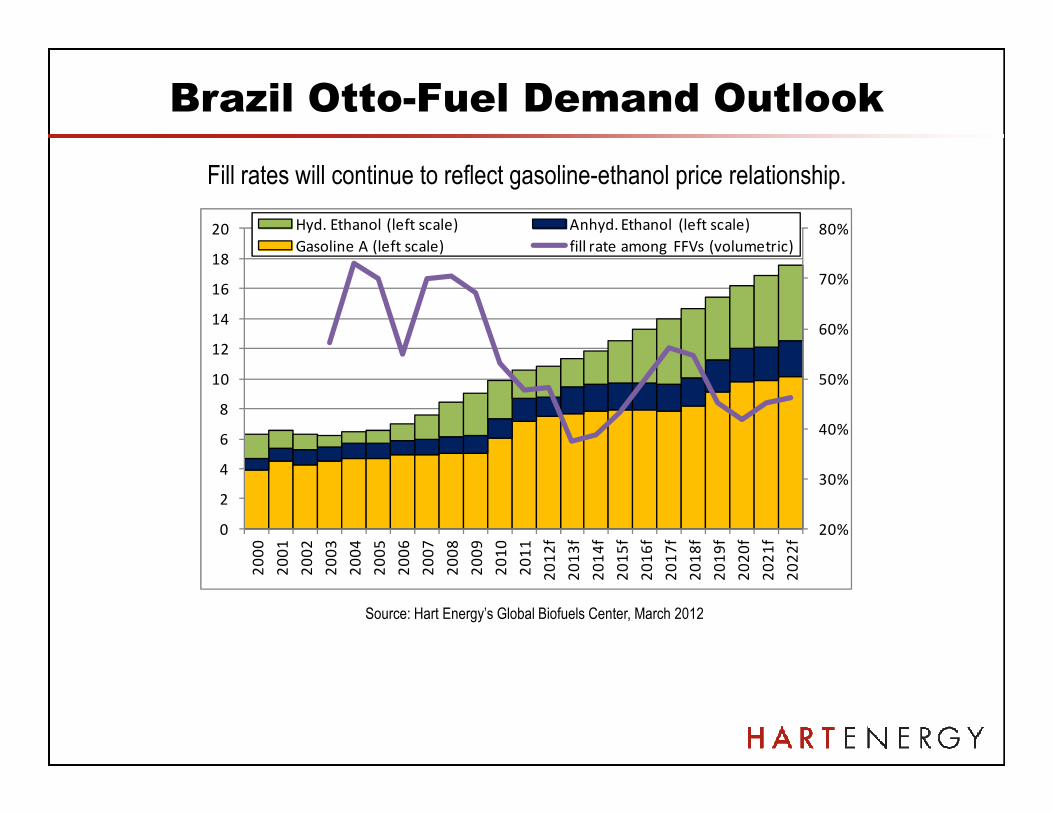
Brazil Otto-Fuel Demand Outlook
Fill rates will continue to reflect gasoline-ethanol price relationship.
50%
60%
70%
80%
8
10
12
14
16
18
20 Hyd. Ethanol (left scale) Anhyd. Ethanol (left scale)
Gasoline A (left scale) fill rate among FFVs (volumetric)
20%
30%
40%
0
2
4
6
8
20
00
20
01
20
02
20
03
20
04
20
05
20
06
20
07
20
08
20
09
20
10
20
11
20
12
f
20
13
f
20
14
f
20
15
f
20
16
f
20
17
f
20
18
f
20
19
f
20
20
f
20
21
f
20
22
f
Source: Hart Energy’s Global Biofuels Center, March 2012
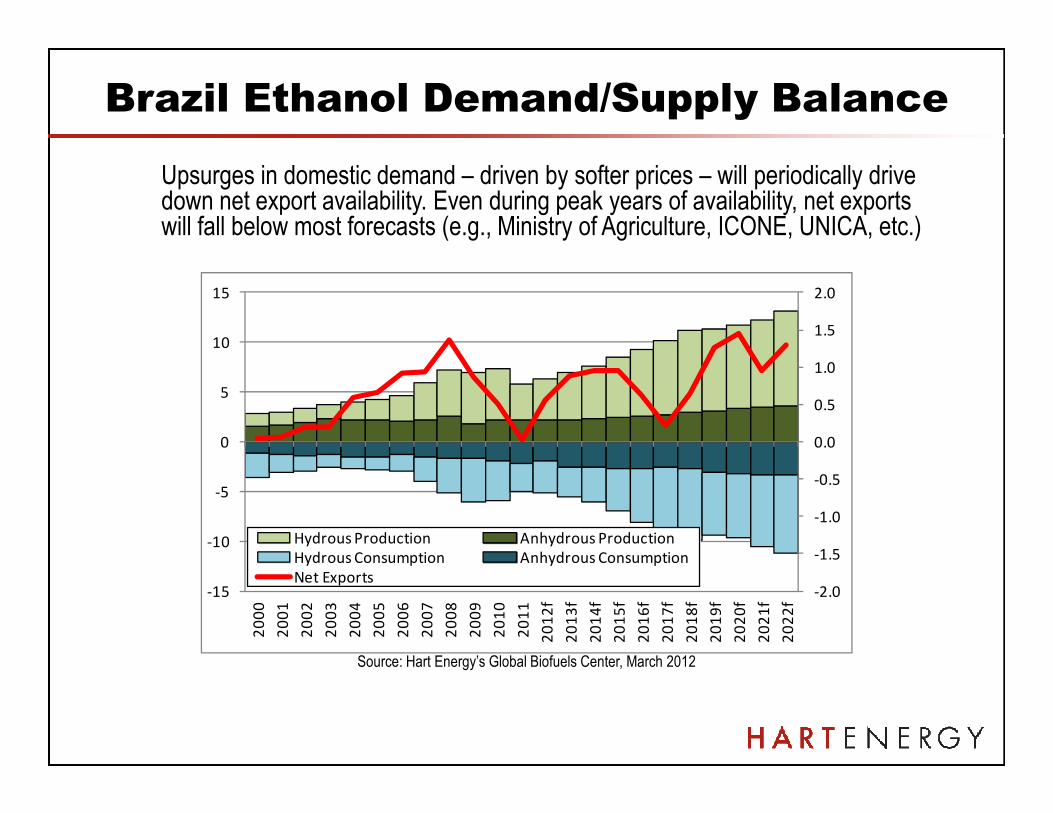
Brazil Ethanol Demand/Supply Balance
Upsurges in domestic demand – driven by softer prices – will periodically drive down net export availability. Even during peak years of availability, net exports will fall below most forecasts (e.g., Ministry of Agriculture, ICONE, UNICA, etc.)
0.5
1.0
1.5
2.0
5
10
15
-2.0
-1.5
-1.0
-0.5
0.0
0.5
-15
-10
-5
0
20
00
20
01
20
02
20
03
20
04
20
05
20
06
20
07
20
08
20
09
20
10
20
11
20
12
f
20
13
f
20
14
f
20
15
f
20
16
f
20
17
f
20
18
f
20
19
f
20
20
f
20
21
f
20
22
f
Hydrous Production Anhydrous Production
Hydrous Consumption Anhydrous Consumption
Net Exports
Source: Hart Energy’s Global Biofuels Center, March 2012

“RFS2” Program Requirements
15.0
20.0
25.0
30.0
35.0
40.0
Billions of Gallons
EPACT 2007
2006 2007 2008 2009 2010 2011 2012 2013 2014 2015 2016 2017 2018 2019 2020 2021 2022
Biomass-Based Diesel 0.5 0.7 0.8 1.0 1.0 1.0 1.0 1.0 1.0 1.0 1.0 1.0 1.0 1.0
Advanced Biofuels (Sugar) 0.1 0.2 0.3 0.5 0.8 1.0 1.5 2.0 2.5 3.0 3.5 3.5 3.5 4.0
Cellulosic Biofuels 0.1 0.25 0.5 1.0 1.8 3.0 4.25 5.5 7.0 8.5 10.5 13.5 16.0
Renewable Fuel (Corn Ethanol) 4.0 4.7 9.0 10.5 12.0 12.6 13.2 13.8 14.4 15.0 15.0 15.0 15.0 15.0 15.0 15.0 15.0
RFS1 Requirements 4.0 4.7 5.4 6.1 6.8 7.4 7.5 7.6 7.7 7.8 7.9 7.9 8.1 8.3 8.4 8.5 8.6
Total New RFS Requirement 4.0 4.7 9.0 11.1 13.0 14.0 15.2 16.6 18.2 20.5 22.3 24.0 26.0 28.0 30.0 33.0 36.0
0.0
5.0
10.0
Billions of Gallons

US Ethanol Blend Wall Scenario
E10
E15 (winter only)
2011 2012 2013 2014 2015 2022
* E15 used in Model Year 2001+
E15 (summer only)
2016 2017 2018 2019 2020 2021
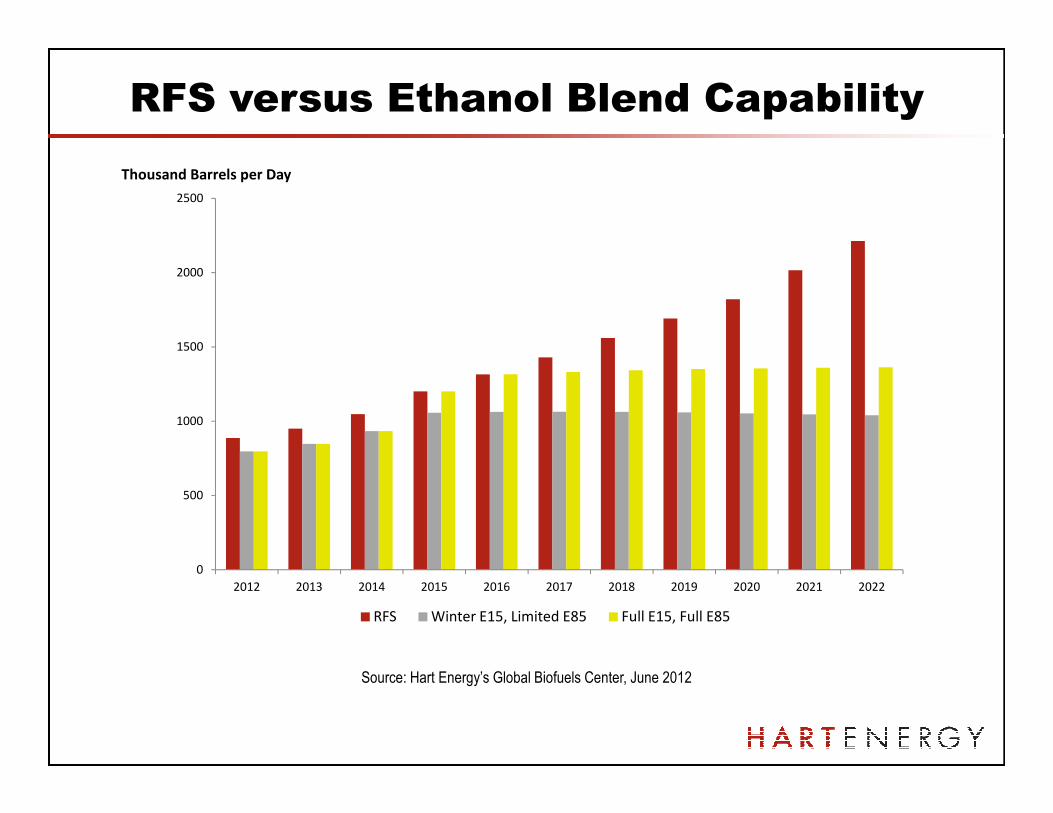
RFS versus Ethanol Blend Capability
1500
2000
2500
Thousand Barrels per Day
Source: Hart Energy’s Global Biofuels Center, June 2012
0
500
1000
2012 2013 2014 2015 2016 2017 2018 2019 2020 2021 2022
RFS Winter E15, Limited E85 Full E15, Full E85
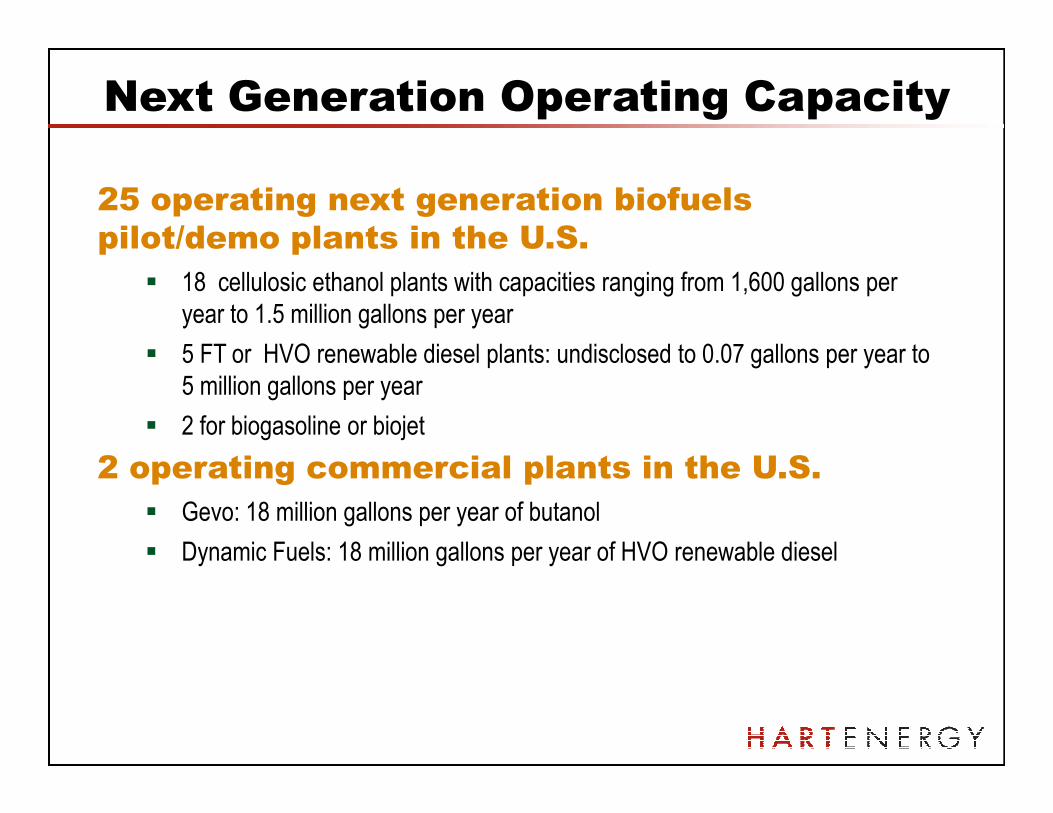
25 operating next generation biofuels
pilot/demo plants in the U.S.
� 18 cellulosic ethanol plants with capacities ranging from 1,600 gallons per
year to 1.5 million gallons per year
� 5 FT or HVO renewable diesel plants: undisclosed to 0.07 gallons per year to
5 million gallons per year
Next Generation Operating Capacity
� 2 for biogasoline or biojet
2 operating commercial plants in the U.S.
� Gevo: 18 million gallons per year of butanol
� Dynamic Fuels: 18 million gallons per year of HVO renewable diesel

Projects with Cellulosic Feedstock
100
150
200
250
300
350
Million Gallons Per Year
Capacities of Operating and Proposed Projects with Cellulosic Feedstock
0
50
100
Operating 2012 Including Proposed
Million Gallons Per Year
Source: U.S. & Brazil Ethanol Outlook to 2022, April 2012
Biobutanol Cellulosic Ethanol
FT Liquids / Hydrocarbons, Jet fuel Hydrogenated vegetable oil / animal fat
Synthetic gasoline

� Continued growth from Brazil, but exports will fall below
expectations
� E10 blend wall concerns, E15 only limited solution
� E15 and higher blending constraints and limited E85 use will keep
ethanol below RFS requirements
� RFS faces fundamental challenges
Americas Biofuel Trends
� RFS faces fundamental challenges
� Blend wall
� Shortage of cellulosic biofuel
� Slow commercialization of advanced biofuel technologies
� Near term limits on sugarcane ethanol imports
� Changes to RFS2 likely
� Advanced biofuels costly and limited, but offer improved
opportunity for incremental biofuel introduction
� Drop in fuel advantages over ethanol
Outlook and Conclusions
� Drop in fuel advantages over ethanol

Thank You! / Questions?Terry Higgins, +1 703 .891.4815, [email protected]