Biofortification of cereals with iron by manipulating soil pH in...
151
I Biofortification of cereals with iron by manipulating soil pH in calcareous soil By Pia Muhammad Adnan Ramzani 2010-ag-1039 M.Sc. (Hons.) Agriculture (Soil Science) A THESIS SUBMITTED IN PARTIAL FULFILLMENT OF REQUIREMENTS FOR THE DEGREE OF DOCTOR OF PHILOSOPHY IN SOIL SCIENCE INSTITUTE OF SOIL & ENVIRONMENTAL SCIENCES Faculty of Agriculture, University of Agriculture, Faisalabad, Pakistan 2016
Transcript of Biofortification of cereals with iron by manipulating soil pH in...

I
Biofortification of cereals with iron by manipulating soil pH in
calcareous soil
By
Pia Muhammad Adnan Ramzani
2010-ag-1039
M.Sc. (Hons.) Agriculture
(Soil Science)
A THESIS SUBMITTED IN PARTIAL FULFILLMENT OF REQUIREMENTS FOR THE
DEGREE OF
DOCTOR OF PHILOSOPHY
IN
SOIL SCIENCE
I N S T I T U T E O F S O I L & E N V I R O N M E N T A L S C I E N C E S
F a c u l t y o f A g r i c u l t u r e ,
U n i v e r s i t y o f A g r i c u l t u r e , F a i s a l a b a d , P a k i s t a n
2 0 1 6

II
To,
THE CONTROLLER OF EXAMINATIONS
UNIVERSITY OF AGRICULTURE,
FAISALABAD.
We, the supervisory committee, certify that contents and form of
thesis submitted by Pia Muhammad Adnan Ramzani (Regd. No. 2010-ag-
1039) have been found satisfactory and recommend that it be processed for
evaluation by the External Examiner(s) for the award of degree.
Supervisory Committee
Chairman: ------------------------------------
(Prof. Dr. Muhammad Khalid)
Co-supervisor: ------------------------------------
(Dr. Muhammad Shahid)
Member: -----------------------------------
(Dr. Muhammad Naveed)
Member: -----------------------------------
(Prof. Dr. Rashid Ahmad)

III
Declaration
I hereby declare that the contents of the thesis “Biofortification of cereals with
iron by manipulating soil pH in calcareous soil” are product of my own
research and no part has been copied from any published source (except the references,
some standard mathematical or generic models/equations/protocols etc.). I further
declare that this work has not been submitted or published for award of any other
diploma/degree. The university may take action if the above statement is found
inaccurate at any stage.
-------------------------------------
Pia Muhammad Adnan Ramzani

IV
*DEDICATED TO MY DEAR PARENTS*
THEIR EAGERNESS FOR MY HIGHER EDUCATION
HAS TRULY BRIGHTENED MY LIFE
V
ACKNOWLEDGEMENTS
In the name of Almighty ALLAH, the most Gracious and Merciful. To Almighty Allah we
pray that He may guide us the right path, crown our endeavors with success, and bless our lives with
abundant prosperity. Countless Darood-o-Salam upon the Lovingly Holy Prophet MUHAMMAD
(Peace Be Upon Him), the fountains of knowledge, who has guided his “Ummah” to seek knowledge
from cradle to grave.
The work presented in this manuscript is accomplished under the sympathetic
attitude, animate directions, observant pursuit, cheering perspective and enlightened
supervision of Prof. Dr. Muhammad Khalid, Institute of Soil and Environmental Sciences,
University of Agriculture, Faisalabad. I am grateful to his ever inspiring guidance, keen
interest, scholarly comments and constructive suggestions on my work.
I feel highly privileged to express my heartfelt gratitude to my committee member Dr.
Muhammad Naveed, Assistant Professor of Soil Science, for his guidance and helpful suggestions
during the research work and for critically reviewing the manuscript. His kind and generous response
to my difficulties during the whole course of the degree will never be forgotten
I offer my sincere thanks to my Co-supervisor Dr. Muhammad Shahid, Associate
Professor from Biochemistry Department and Prof. Dr. Rashid Ahmad, Department of
Crop Physiology. Their valuable feedback helped me to improve the dissertation in many
ways.
I am indebted to my thanks to other lab. fellows, friends and Miss Ayesha Irum and
thanks to Dr. Waqas-ud-Din khan for their kind help to complete my research. At the end, I regret if
I have forgotten any name.
No acknowledgment could ever adequately express my obligations to my affections
and adoring parents and affectionate sister especially Hafiza Salma Kausar and brothers,
Dr. Piyya Muhammad Musammat Rafi and Dr. Piyya Muhammad Rufi-ul-Shan whose
hands have always been raised in prayers for me. Without their moral and financial support,
the present distinction would have been merely a dream. They always acted as torch bearer
for me in the dark valleys of mortal life.
May ALLAH bless all these people with long, happy and peaceful lives (Ameen)
Pia Muhammad Adnan Ramzani

VI
CONTENTS
Acknowledgements v
List of Tables xi
List of figure xiii
Abstract xv
Chapter 1 Introduction 1
Chapter 2 Review of literature 5
2.1 Status and forms of Fe in soil: An overview 5
2.2 Iron deficiency in calcareous soil 6
2.3 Strategies to overcome Fe deficiency in soil 7
2.3.1 Sulfur effect on lowering soil pH and Fe solublization 7
2.3.2 Water soluble, exchangeable, and DTPA extractable Fe 8
2.3.3 Use of synthetic chelators 8
2.3.4 Vivianite 8
2.4 Significance of Fe for plants 9
2.5 Severity of Fe deficiency in crops 9
2.6 Strategies to overcome Fe deficiency in plants 10
2.6.1 Soil pH manipulation and Fe bioavailability 10
2.6.2 Injection of Fe salts 11
2.6.3 Blood meal 11
2.6.4 Foliar application of Fe 11
2.7 Organic amendments and Fe availability 11
2.7.1 Animal manure 12
2.7.2 Compost 12
2.7.3 Biochar 13
2.8 Iron for human health 13
2.9 Strategies to combat Fe deficiency in humans 13
2.9.1 Food diversification 14
2.9.2 Supplementation 14
2.9.3 Fortification 15
2.9.4 Biofortification 15

VII
2.10 Approaches used for Fe biofortification 15
2.10.1 Breeding and genetics approaches 16
2.10.2 Transgenic approaches 16
2.10.3 Soil and crop management 17
2.11 Nutritional factors affecting Fe bioavailability in humans 18
2.11.1 Phytic acid (phytate) 18
2.11.2 Polyphenol 18
2.11.3 Ferritin 19
2.12 Models used for determination of Fe bioavailability 19
Chapter 3 Iron biofortification of wheat grain through integrated
use of organic and chemical fertilizers in pH
manipulated calcareous soil
21
Abstract 21
3.1 Introduction 22
3.2 Materials and methods 23
3.2.1 Experimental soil 23
3.2.2 Incubation study 1 24
3.2.2.1 Manipulation of soil pH 24
3.2.3 Incubation study 2 25
3.2.3.1 Calculation and selection of Fe rates 25
3.2.4 Plant experiment 25
3.2.4.1 Experimental plants growth and conditions 25
3.2.4.2 Grain analysis 26
3.2.5 Statistical analysis 28
3.3 Results 28
3.3.1 Time course of pH in non-planted soil 28
3.3.2 Integrated effect of chemical and organic amendments on
DTPA-extractable Fe in pH manipulated calcareous soil
31
3.3.3 Pot experiment 33
3.3.3.1 Growth and physiological parameters 33
3.3.3.2 Iron and Zn concentration 34

VIII
3.3.3.3 [Phytate]:[Fe] and [Phytate]:[Zn] ratio 35
3.3.3.4 Physico-chemical analysis (Ash, Fat, Fiber) 36
3.3.3.5 Phytate and polyphenol concentration 36
3.3.3.6 Protein and ferritin concentration 37
3.4 Discussion 39
3.5 Conclusions 42
Chapter 4 Exploiting iron bioavailability and nutritional value of
maize grain through combined use of ferrous sulphate
with biochar and poultry manure in sulfur treated low
pH calcareous soil
43
Abstract 43
4.1 Introduction 44
4.2 Materials and Methods 45
4.2.1 Soil acidification 45
4.2.2 Pot Experiment 45
4.2.3 Grain analysis 47
4.2.4 Statistical analysis 48
4.3 Results 48
4.3.1 Soil acidification 48
4.3.2 Root-shoot dry mass and grain weight 48
4.3.3 Gaseous exchange measurements 49
4.3.4 Mineral concentration of grains 52
4.3.5 Biochemical contents (starch, fat and protein) in grains 52
4.3.6 Polyphenol, phytate, [Phytate[:[Fe] and [Phytate]:[Zn]
ratio
54
4.3.7 Ferritin in grain 54
4.4 Discussion 56
4.5 Conclusion 59
Chapter 5 Evaluating growth, yield and iron bioavailability of rice
in acidified calcareous soil
60
Abstract 60

IX
5.1 Introduction 61
5.2 Materials and methods 62
5.2.1 Plot preparation and soil properties 62
5.2.2 Soil acidification 63
5.2.3 Crop experiment 63
5.2.4 Grain analysis 64
5.2.5 Statistical analysis 67
5.3 Results 67
5.3.1 Plant growth and yield 67
5.3.2 Photosynthetic measurements 67
5.3.3 Grain Zn and Fe concentration 67
5.3.4 Grain quality parameters (Ash, Fat, Fiber and Starch) 68
5.3.5 Phytate, Phytate:Fe and Phytate:Zn molar ratio, Polyphenol 70
5.3.6 Ferritin and protein contents 71
5.4 Discussion 74
5.5 Conclusion 77
Chapter 6 Iron bioavailability from rice: Rat study for
determination of iron absorption
78
Abstract 78
6.1 Introduction 79
6.2 Methodology 81
6.2.1 Iron biofortified grain production 81
6.2.2 Animal 81
6.2.3 Anemia development 82
6.2.4 Experiment setup 82
6.2.5 Hematological test 83
6.2.6 Serum analysis 83
6.2.7 Determination of Fe in rat organs and serum 83
6.2.8 Ferritin quantification 83
6.2.9 Statistical analysis 84
6.3 Results 84

X
6.3.1 Rat organ weight 84
6.3.2 Hematology of rat blood 85
6.3.3 Iron concentration in rat orgasn (liver, kidney, heart, and
spleen) and serum
86
6.3.4 Ferritin contents in serum and liver 88
6.3.5 Serum biochemical analysis 91
6.4 Discussion 93
6.5 Conclusion 97
Chapter 7 Summary 98
References 102

XI
LIST OF TABLES
Table Title Page No.
3.1 Physico-chemical properties of soil and organic
amendments used in the experiment
24
3.2 Treatments in the pot experiment, BC: Biochar (1% w/w),
PM: Poultry Manure (1% w/w), Fe: Iron (0.0075 g kg-1)
27
3.3 Effect of Fe application along with BC and PM on growth
and physiological parameters of wheat in unamended and
S-treated low pH soil
34
3.4 Effect of Fe application along with BC and PM on
minerals present in wheat grains in unamended and S-
treated low pH soil
35
4.1 Effect of sulfur applied with iron, biochar, and poultry
manure on soil pH
50
4.2 Growth and physiological attributes as affected by
different organic and inorganic amendments
51
4.3 Grain minerals and biological attributes as affected by
different organic and inorganic amendments
53
5.1 Sulfur effect on soil pH amended with iron (0.0075 g kg-
1), biochar (1% w/w), and poultry manure (1% w/w)
65
5.2 Growth, yield, and photosynthetic measurements of rice 69
5.3 Grain minerals and biological attributes as affected by
different organic and inorganic amendments
70
6.1 Organ weight with respect to percent body weight. Group
of animals: feed with diet containing: 26 mg Fe (control),
85

XII
40 mg Fe (G1), 60 mg Fe (G2), 85 mg Fe (G3) and 100
mg (G4).
6.2 Haematological parameter of rats in different groups.
RBC - red blood cell, HCT - hematocrit, MCV - mean
corpuscular volume, MCH - mean corpuscular
hemoglobin, MCHC - mean corpuscular hemoglobin
concentration. Group of animals: feed with diet
containing: 26 mg Fe (control), 40 mg Fe (G1), 60 mg Fe
(G2), 85 mg Fe (G3), and 100 mg (G4).
87
6.3 Iron reserves in rats organs and serum. Group of animals:
feed with diet containing: 26 mg Fe (control), 40 mg Fe
(G1), 60 mg Fe (G2), 85 mg Fe (G3), and 100 mg (G4)
89
6.4 Rats serum biochemical analysis. Group of animals: feed
with diet containing: 26 mg Fe (control), 40 mg Fe (G1),
60 mg Fe (G2), 85 mg Fe (G3), and 100 mg (G4).
92

XIII
LIST OF FIGURES
Figures Title Page No.
3.1 Figure a-e: Graph of soil pH manipulation with elemental
sulfur and different organic amendments
29-30
3.2 Figure a-c of DTPA-extractable iron showing the
relationship of DTPA-extractable iron with: treatment vs
pH (a), pH vs days (b), days vs treatments (c).
31-32
3.3 Figure a, b: Phytate and polyphenol concentration in
wheat grain measured in various Fe treatments under
unamended and pH manipulated calcareous soil.
37
3.4 Figure a, b: Protein and ferritin concentration in wheat
grain measured in various Fe treatments under unamended
and pH manipulated calcareous soil.
38
4.1 Figure a, b, c, d. Phytate, Grain [Phytate]:[Fe] and
[Phytate]:[Zn] ratio and polyphenol concentration in
maize grain measured in various Fe treatments under
unamended and pH manipulated calcareous soil.
55
4.2 Ferritin concentration in maize grain measured in various
Fe treatments under unamended and pH manipulated
calcareous soil.
56
5.1 Figure a, b, c, d. Phytate, polyphenol conc. (mg/g seed),
[Phytate]:[Fe] ratio and [Phytate]:[Zn] ratio as determined
in rice grain with various iron (Fe), Biochar (BC), poultry
manure (PM) and sulfur (S) treatments in alkaline
calcareous soil.
72
5.2 Protein (%) and ferritin (µg/g) contents as determined in 73
XIV
rice grain with various iron (Fe), Biochar (BC), poultry
manure (PM) and sulfur (S) treatments in alkaline
calcareous soil.
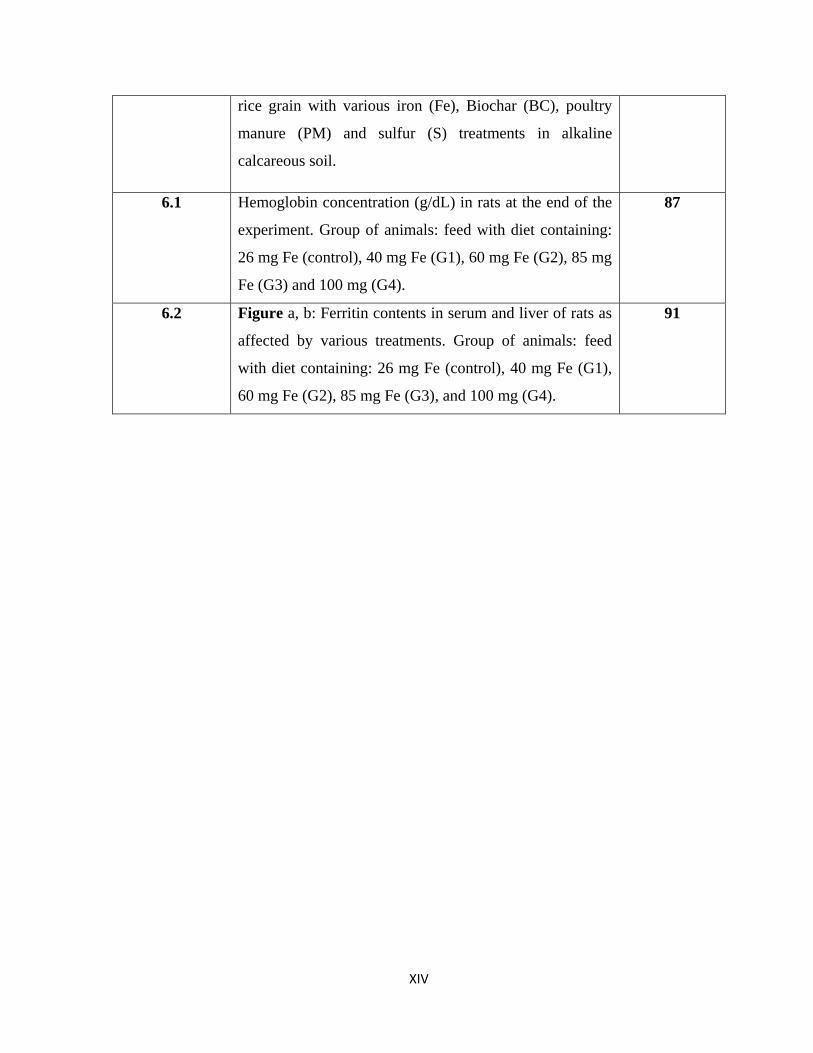
6.1 Hemoglobin concentration (g/dL) in rats at the end of the
experiment. Group of animals: feed with diet containing:
26 mg Fe (control), 40 mg Fe (G1), 60 mg Fe (G2), 85 mg
Fe (G3) and 100 mg (G4).
87
6.2 Figure a, b: Ferritin contents in serum and liver of rats as
affected by various treatments. Group of animals: feed
with diet containing: 26 mg Fe (control), 40 mg Fe (G1),
60 mg Fe (G2), 85 mg Fe (G3), and 100 mg (G4).
91

XV
Abstract
Iron (Fe) deficiency is a prevalent nutritional deficiency throughout the world, affecting an
estimated 3.7 billion people. Increasing Fe concentration in food crops is an important global
challenge due to the high incidence of Fe deficiency in human populations. Cereals grown on
calcareous soil are low in Fe. High pH, high temperature, low organic matter, and poorly
managed soil with respect to fertility are factors that cause low Fe availability to cereal crops
in calcareous soil. Iron fertilization in calcareous soil is not effective due to its rapid
conversion into unavailable forms and the poor mobility of Fe in phloem. Iron-organic
compounds in manure are effective in maintaining Fe availability to plants. Hence, there is a
need for effective strategies to overcome Fe deficiency in cereals and to increase Fe
bioavailabilty in cereal grain. Biofortification of food crops with Fe to combat iron
deficiency problems in humans, is a cost-effective and sustainable agricultural strategy to
alleviate malnutrition. We hypothesized that Fe nutrition management in calcareous soil can
increase growth, yield, and Fe bioavailability from cereals. To explore the role of Fe in
alleviating Fe deficiency in cereals and to eliminate anemia in humans a project was
proposed with six studies. Two lab studies were conducted to lower soil pH and to determine
the soil acidification effect on Fe bioavailability from Fe fertilizer and from organic
amendments. Greenhouse and field studies were conducted on the basis of the lab studies for
Fe biofortification in cereals and to enhance iron bioavailability from cereal grain. Iron
application with organic amendments significantly improved growth, yield, photosynthetic
parameters, and nutritional value of cereal grain in sulfur treated low pH calcareous soil. Iron
biofortified rice grain increased haemoglobin concentration, mean corpuscular volume, mean
corpuscular haemoglobin, and mean corpuscular haemoglobin concentration in anemic and
non-anemic rats. Moreover, high Fe bioavailability (ferritin) in grain had a beneficial
influence on the re-creation of ferritin reserves in liver and blood serum, and also did not
induce negative alterations in general growth parameters of animals. As a whole, the project
showed that Fe biofortification in cereals in pH manipulated calcareous soil significantly
improved Fe bioavailability from cereal grains.

1
Chapter 1
Introduction
The world’s population continues to increase with time. Thus, food demand is also
increasing. However, natural resources are limited (United Nations, 2012). In addition,
malnutrition is becoming a serious threat to the people of poor communities, especially in
developing countries (Sperotto et al., 2012a). In developing countries, a total of 805 million
people are not leading a healthy life and suffer from hunger. State of Food Insecurity in the
World (FAO, 2014) states that about 13.5 % of the total population lacks enough food for
their daily intake of calories. According to one estimate, every 3rd person in the world suffers
from hidden hunger due to essential nutrients and vitamin deficiency resulting in poor health
conditions (Kennedy et al., 2003).
Iron (Fe) deficiency causes 0.8 million deaths annually and is ranked third among the risk
factors of micronutrient deficiency (WHO, 2007). Iron malnutrition leads to anemia in
humans, especially pregnant women and preschool children (WHO, 2010). Iron deficiency
anemia is the most severe type of iron deficiency (Lozoff and Georgieff, 2006). It can result
in a low resistance to infection, impaired psychomotor development, impaired cognitive
function in children, poor academic performance, fatigue, fetal resorption, low productivity,
and increased risk of maternal mortality (Bothwell and MacPhail, 2004; Murray-Kolb and
Beard, 2009).
The main cause of micronutrient malnutrition is consumption of monotonous food that is
poor in microelements (Bouis et al., 2011). In developing countries the majority of the
population depends on cereal-based foods that are low in bioavailable Fe (Gibson et al.,
2010). Thus, low Fe contents from staple foods result in Fe deficiency in humans, especially
in developing countries (Sperotto et al., 2012a).
Fe is a micronutrient required by all organisms, and in plants it plays an important role in
metabolic pathways including photosynthesis, respiration, chlorophyll formation, and several
redox reactions (Briat et al., 1995; Briat and Lobréaux, 1997). Iron deficient crops show
interveinal chlorosis, stunted growth, and reduced yield (Kabir et al., 2013). Iron plays an
2
important role in functioning of cell’s power house, which is impaired under Fe deficiency
resultanting poor plant health (Bashir et al., 2013a).
Iron deficiency is a common problem for crops growing in calcareous soil (Laird et al.,
2010). High pH and high HCO3 contents are two most important factors that limit Fe
availability in calcareous soil (Bloom and Inskeep, 1988; Alcantara et al., 2002). Soil pH,
complexing ligands, and redox potential affect the availability of Fe for crops (Beckwith et
al., 1975). Iron exists mainly as oxidized Fe+3 in mineral soil under aerobic environments and
is slightly soluble if soil pH is more than 7 (Marschner, 1995). Soils with pH above 5.5-6.5
cannot maintain inorganic Fe+3 oxides to the level of soluble Fe. Due to high pH and
calcareousness, Pakistani soils promote the precipitation of Fe+3 oxides, which are insoluble
and not available to plants.
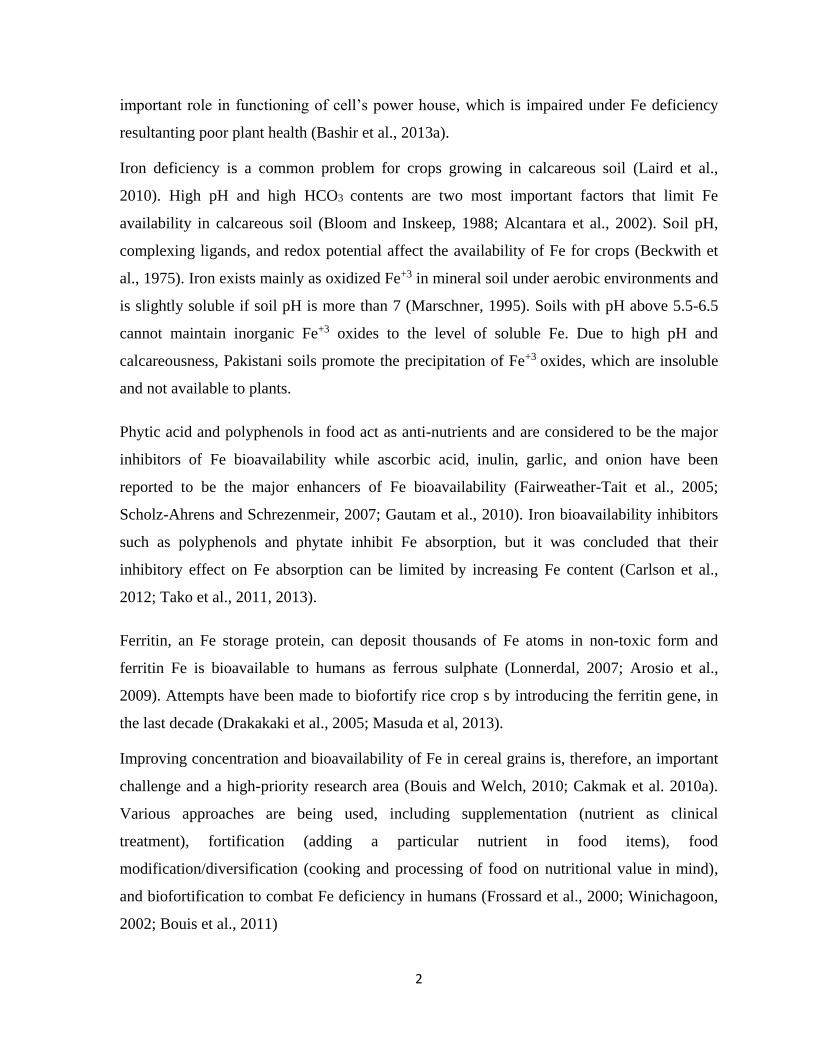
Phytic acid and polyphenols in food act as anti-nutrients and are considered to be the major
inhibitors of Fe bioavailability while ascorbic acid, inulin, garlic, and onion have been
reported to be the major enhancers of Fe bioavailability (Fairweather-Tait et al., 2005;
Scholz-Ahrens and Schrezenmeir, 2007; Gautam et al., 2010). Iron bioavailability inhibitors
such as polyphenols and phytate inhibit Fe absorption, but it was concluded that their
inhibitory effect on Fe absorption can be limited by increasing Fe content (Carlson et al.,
2012; Tako et al., 2011, 2013).
Ferritin, an Fe storage protein, can deposit thousands of Fe atoms in non-toxic form and
ferritin Fe is bioavailable to humans as ferrous sulphate (Lonnerdal, 2007; Arosio et al.,
2009). Attempts have been made to biofortify rice crop s by introducing the ferritin gene, in
the last decade (Drakakaki et al., 2005; Masuda et al, 2013).
Improving concentration and bioavailability of Fe in cereal grains is, therefore, an important
challenge and a high-priority research area (Bouis and Welch, 2010; Cakmak et al. 2010a).
Various approaches are being used, including supplementation (nutrient as clinical
treatment), fortification (adding a particular nutrient in food items), food
modification/diversification (cooking and processing of food on nutritional value in mind),
and biofortification to combat Fe deficiency in humans (Frossard et al., 2000; Winichagoon,
2002; Bouis et al., 2011)

3
Many problems have been reported with supplementation as Fe tablets due to adverse side
effects in humans (Winichagoon, 2002; Mimura et al., 2008). Fortification of common foods
with Fe, is also not effective because of poor Fe bioavailability from the Fe-fortified foods,
and also changes in product taste, which may cause resistance by consumers to the fortified
products (Frossard et al., 2000; Powell et al. 2013). Iron deficiency could also be mitigated
by enhancing grain Fe concentration and bioavailability of Fe in grains such as wheat and
rice (Bouis and Welch, 2010). In this regard, biofortification, which is a process of enhancing
the bioavailable nutrient in the edible portion of crops, is considered the most suitable
approach (Mayer et al., 2008; Bouis et al., 2011).
Approaches for Fe biofortification of crops such as genetic engineering, agronomic,
transgenic and plant breeding have been developed (Cakmak et al., 2010a; Wei et al., 2012).
It is reported by Bashir et al. (2013) that plant breeding has failed so far in developing Fe
biofortified polished rice. On the other hand, transgenic varieties sometimes may provide
more nutrients than genotype selection, but many countries have strict regulations in
commercialization of these transgenic varieties (Saltzman et al., 2013). Biofortification of
food crops with Fe through agronomic approaches is a widely applied strategy (Cakmak et
al., 2010a). Agronomic biofortification of food crops is considered the most sustainable
approach.
In high pH, calcareous soil, agronomic biofortification will be ineffective unless one lowers
the soil pH. The major issue in calcareous soil is quick transformation of soluble Fe
compounds to less soluble oxides and hydroxides. Hence, to reduce Fe’s rapid transformation
and to increase its availability, soil pH manipulation using acidifying materiasl could be a
useful approach (Malakouti and Gheibi, 1988). Different studies have reported that microbial
oxidation of elemental sulfur decreases soil pH and leads to mineral solubilization that
increases mineral availability to crops (Kaplan et al., 1998; Iqbal et al., 2012).
Organic matter is an important source of mineral nutrients. But Pakistani soils are deficient in
organic matter and essential micronutrients (Niazmi and Khan, 1989). Due to harsh climatic
conditions, organic matter mineralizes soon after its application. Application of
micronutrients mixed with organic matter can enhance its effectiveness. Thus, we need
more recalcitrant sources of organic matter that persist.

4
Soil physical properties, i.e. soil aggregation, are representative of soil quality (Vrdoljak and
Sposito, 2002) that can be corrected by application of manure, biosolids, and other kinds of
organic matter. Application of manure to soil (mainly poultry manure) not only provides a
solution to waste disposal, but also improves soil physical properties with time when applied
in combination with fertilizers (Hati et al., 2006; Bandyopadhyay et al., 2010). Mixing
inorganic salts of micronutrients with different organic materials can enhance the efficacy of
micronutrients. Thus, biochar is among the most sustainable sources of organic carbon.
Biochar plays an important role in nutrient dynamics and improves soil fertility and crop
productivity (Liu et al., 2013). Biochar affects mineral forms of Fe by acting as an electron
shuttle in redox-mediated reactions (Kappler et al., 2014). Graber et al. (2014) reported that
redox catalytic activity associated to biochar solubilized Fe by decreasing soil pH. Most
recently, carboneous product has been used for Zn biofortification of crops (Gartler et al.,
2013).
Little or no work about soil pH manipulation with elemental sulphur in calcareous soil (as in
Pakistan) for Fe biofortification in cereals has been reported in the primary literature.
Research, therefore, is needed to better understand how soil acidification will act in
calcareous soil as well as influence crop growth, yield, and Fe bioavailability.
In Pakistan, Fe biofortification with integrated use of Fe fertilizer and organic amendments in
pH-manipulated calcareous soil is new and has not been evaluated in the context of Pakistani
agriculture. Therefore, the main objectives of this integrated research project were to:
Define the rate of elemental sulfur for lowering soil pH
Determine soil acidification effects on Fe bioavailability in unamended and organic
amended calcareous soil
Estimate Fe bioavailability in cereals as affected by Fe fertilizer and organic
amendments in unamended and pH manipulated calcareous soil
Investigate the effect of Fe biofortified rice grain with regard to Fe deficiency
anemia elimination by a using normal and iron deficient rat study

5
Chapter 2
Review of Literature
There is a dire need to form new agriculture practices policies that not only meet the food
requirements of the growing world but also fulfill nutritional requirements (Welch and
Graham, 2004). Cereals grown in calcareous soil are poor in essential mineral contents i.e. Fe
and Zn causing severe threat to population that depends on such mineral deficient food. In
this chapter I discuss the status of soil Fe, its significance in plants and humans, and
strategies to combat Fe deficiency in soil, plants, and ultimately in humans.
2.1 Status and forms of Fe in soil: an overview
The predominant forms of Fe in soil are hematite, goethite, leidocrocite, ageetite, maghemite,
and ferrihydrite (Schwertmann and Taylor, 1989). Each of these oxides contains the Fe+3
form of Fe except magnetite, which contains Fe (II) as well as Fe (III). These forms exist
predominately in the clay-size fraction of soil, but magnetite can exist in the silt and sand
size fraction of soil. In arid and semi-arid regions goethite and hematite are the dominant
minerals; in slightly weathered or reduce soil magnetite is the dominant form of Fe. In soils
with changing redox condition, ferrihydrite is likely to exist in most of the soils as a small
fraction but as a major component. All these mineral oxides are found in well crystalline
structure, but ferrihydrite shows a small size of crystal structure with particle size of ≤ 10 nm.
Particle size and surface reactivity of mineral oxides are the major factors that influence their
solubility and availability. Schwertmann, (1991) gave the stability order of different mineral
oxides as follows: hematite = goethite > lepiddocrocite = magnetite > ferrihydrite.
Iron is an important component of layer silicates in soil (20-50 g kg-1) but is not available for
plant growth. In acid soil (pH <4.5) some fraction of Fe is present as exchangeable ions. As
primary or secondary minerals Fe exists as pyrite, amphibolite, pyroxenes, and siderite.
These are mostly present in reduced or relatively less weathered soils.
Yields of Fe deficient crops can, in principle, be increased through application of Fe to soils.
However, as the uptake of Fe from soils is highly complex, improving crop yields through
fertilization with Fe has been shown to be difficult (Schulte and Kelling, 2004). For example,

6
application of iron to soils in the form of ferrous sulfate (FeSO4) has generally resulted in, at
most, limited effects on crop yields (Frossard et al., 2000). Other forms in which Fe might be
added to soils (e.g. as chelates) are possibly more effective, but also expensive, and generally
too costly for use on low value staple crops (Akinrinde, 2006).
2.2 Iron deficiency in calcareous soil
Soil pH is most important factor that determines nutrient availability. The most suitable pH
for crops is around 6.0 to 6.5. Only a few crops can tolerate high pH. Most of the nutrients
are available at 6.5 to 7.5 pH. High pH soil makes most micronutrients unavailable, thus
micronutrient deficiency is widespread in high pH calcareous soils. In calcareous soil HCO3
and CO3 make various complexes with Fe, P, and Zn, thus reducing availability of mineral
nutrients. Calcium carbonate provides a reactive surface that acts as a sink for protons during
acid/base reactions involving dissolved Fe species in the soil solution (Loeppert, 1988; and
Abd El-Haleem, 1996). Singh and Dahiya (1975) found that chemically available Fe
decreased with increasing CaCO3 and time of incubation. They also reported that increasing
levels of CaCO3 in soil resulted in a decrease in some forms of exchangeable and Available
Fe. The decrease in exchangeable Fe was probably from the release of Ca2+ from hydrolysis
of CaCO3. The decrease in the other forms of Fe might be due to oxidation of soluble-native
and added Fe through direct reaction with CaCO3. Singh and Dahiya (1976) found that
excessive amounts of CaCO3 decreased the availability of Fe to plants and it is often
necessary to supply additional Fe to the soil to complete life cycle of plant. Soil deficiency of
nutrient leads to nutrient deficient plants (Cifuentes et al., 1993). Iron is 4th most abundant
element present in the Earth’s crust. But its availability is limited in most soils. Iron changes
its oxidation state very quickly. Celik and Katkat (2007) reported that at high pH, Fe(II) ion
converts into insoluble Fe (III) ion. High lime contents in calcareous soil also decrease Fe
uptake. Redox conditions are also detrimental to Fe availability.
Mengel and Kirkby, (1987) reported that Fe solubility and availability is pH dependent. It is
also reported that Fe (III) solubility and activity decease 1000 time with every one unit
increase in pH (Latimer 1952).
Iron makes complexes with organic matter (i.e. humic substances) that are influenced by
redox condition and pH. At low pH, Fe (III) complexes with organic matter are present

7
(Goodman, 1987) but at high pH values greater than 6, humic substances are less significant
because of hydrolysis of Fe and precipitation of Fe oxides. In calcareous soil where pH is
high, Fe+3 is not retained by soil humates against hydrolysis. In a pH range of 7.5-8.5 the
solution Fe+3 concentrations remaining are minimal (Lindsay, 1979). In calcareous aerated
soil as values of redox potential and soil pH are more except under condition of flooding or
saturation of soil pores for longer period of time, therefore, total Fe concentration is
insufficient to meet the requirement of plants.
2.3 Strategies to overcome Fe deficiency in soil
In cultivated calcareous soil, the potential value of applied Fe depends on the solubility of the
applied compound and the capacity of plant roots to assimilate Fe from these compounds
(Garacia-Mina et al., 2003). Therefore, different strategies are adopted to maintain the
available Fe status of soil.
2.3.1 Sulfur effect in lowering of soil pH and Fe solubilization
Decreasing soil pH is an effective way to deal with the stabilization of nutrients in calcareous
and alkaline soil. Phosphorus, Fe and Zn become unavailable in calcareous and alkaline soil
due to high pH and high concentration of calcium ions (Deluca et al., 1989; Tisdale et al.,
1993; Kaplan and Orman, 1998).Common methods for dealing with these deficiencies, are
the use of chemical fertilizers that, in addition to the high cost and low efficiency, also have
the risk of environmental pollution (Malakouti et al., 1991).
Different chemical fertilizers have been used to lower the soil pH. Any fertilizer that contains
ammonium or produces ammonium can reduce the pH (i.e. ammonium sulfate, ammonium
phosphate) (Extension Education Center 423 Griffing Avenue, Suite 100 Riverhead, New
York 11901-307). Along with these fertilizers elemental S is considered a cost effective
approach to lowering of soil pH. Because these chemical fertilizers have some constraints,
(e.g ammonium sulfate is more expensive, also the amount of ammonium sulfate needed to
achieve the same decrease in pH is six times the amount of elemental S required; and
ammonium sulfate is toxic to crops like blueberries Potasium sulfate can also be used to
lower pH but it is documented that sulfate – S containing fertilizers are not very effective in
decreasing soil pH. Ferrous sulfate can also be used but it is not cost effective and the total
amount of ferrous sulfate is eight times more than the amount of elemental S needed. Thus,

8
elemental S is the most common and cost effective acidify matter (Tisdale, 1993). After
oxidation each mole produces two moles of hydrogen ions (H+) in the soil and reducing soil
pH leads to dissolution of nutrients in the root (Modaihsh et al., 1989; Kaplan and Orman,
1998; Besharati and Salehrastin, 1999). The oxidation of elemental S has a significant
positive correlation with soil pH as with the oxidation of S soil pH decreases (Lawrence and
Germida, 1988; Kaplan and Omran, 1998).
2.3.2 Water soluble, exchangeable and DTPA extractable Fe
Extraction of soil with neutral (i.e. CaCl2, MgCl2, or KCl) or buffered (e.g. NH4C2H3O2) salt
solution will displace solution and exchangeable Fe. Acid buffered extraction may not be
suitable for calcareous soil as it may result in considerable release of carbonates and oxides
along with release of Fe from mineral structure. The extractability of Fe can be increased by
using reducing agents (reductive dissolution). However, these extractants are not that much
used in practice.
2.3.3 Use of synthetic Fe chelates
Use of synthetic chelates may help in combating Fe deficiency in plants (Pestana et al.,
2003). Iron chelators increase Fe availability in soil by increasing Fe’s concentration in soil
solution thus increasing its diffusion and rapid replenishment of depleted zones and by
providing ease to uptake by roots (Lindsay, 1995). Chelates are very effective in improving
Fe status of alkaline and calcareous soil, but due to high stability constants root may impair
high energy to take up available Fe (Rodrıguez-Lucena et al., 2010). Another constraint in
applying chelates to soil is that applied chelates may leach when frequent irrigation is
applied. The most frequently used iron chelates are ethylenediaminetetraacetic acid (ETDA),
and diethylinetriaminepentaacetic acid (DTPA) and are characterized by low stability in soil
while ethylenediamine-di(o-hydroxy-p-sulphoxyphenylacetic) acid (EDDSHA),
ethylenediamine-di(o-hydroxy-p-methylphenylacetic) acid (EDDHMA), ethylenediamine-
di(o-hydroxy-phenylacetic) acid (EDDHA) can be used in soil applications as these have
high stability constant. But Fe chelates are expensive and out of reach for most of the farmers
in developing countries (Akinrinde, 2006).
2.3.4 Vivianite

9
Soil application of synthetic Fe-phosphate Fe3 (PO4)2·8H2O has shown significant results in
supplying of Fe with time. Iron (II)-phosphate is analogous to the mineral vivianite. Vivianite
is a compound that can be easily made by mixing ferrous sulphate and di-ammonium
phosphate or mono-ammonium phosphate and vigorous shaking. Del Campillo et al. (1998)
and Rosado et al. (2000) found vivianite to be an effective compound to combat Fe
deficiency in plants that were grown in calcareous soil. Farmer hasitate to use this due to the
lack of its commercial production and high cost.
2.4 Significance of Fe for plants
Iron plays a vital role in various physiological and metabolic functions not only in plants but
also in the human body. Iron is a transitional metal and changes its oxidation state very
rapidly, thus it can be used as a cofactor for many important processes like oxidative
phosphorylation, electron transfer, and DNA synthesis (Hass et al., 2005). Iron acts as a
catalyst of chlorophyll formation, an important component of cytochromes, is involved in
nitrogen fixation, and a component of ferridoxin. Ferridoxin (iron-sulfur protein) acts as an
electron transmitter in many basic metabolic processes (Marschner, 1995). Iron also plays its
role in some degradation processes (i.e. reactions of peroxides). Being a part of the heme
protein, Fe plays the key role in hemoglobin formation and oxygen transport via hemoglobin.
Iron is also important for binding of oxygen to red blood cells (RBC), formulation of
cytochrome and myoglobin, brain development and function, and contraction and relaxation
of muscles (Başar, 2005).
2.5 Severity of Fe deficiency in crops
Iron is a key component of the chlorophyll ring structure. Any change in Fe availability leads
to major alteration in overall plant metabolism. Iron deficiency causes yellowing of young
leaves. The most common visible Fe deficiency symptom is leaf chlorosis and soil
calcareousness favors this (Tagliavini and Rambola, 2001). Plant Fe deficiency is common in
many regions (Wiersma, 2005). In severe conditions interveinal chlorosis causes serious
damage to crops. Leaf yellowing results in poor photosynthetic activity. In Fe limitation, crop
growth will be reduced. The plant life cycle slows, leading to reduced yield. Susceptibility to
disease also increases in Fe limiting conditions (Rashid and Ryan, 2004; Chatterjee et al.,
2006).

10
Severe yield losses also occur in Fe deficient conditions. It is estimated that soybean yield
loss in the USA is about 300,.000 tons a year (Hansen et al., 2004). Peach production was
reduced up to 20-30% due to interveinal chlorosis (Başar, 2003a). Thirty percent Pakistani
soils are Fe deficient (Jaskani, 2012).
2.6 Strategies to overcome Fe deficiency in plants
2.6.1 Soil pH manipulation and Fe bioavailability
Nutrients like Fe, Zn, and P become deficient at high pH soil. Soil acidity favors the
solubilization of mineral cations in soil with high calcium carbonate contents. Malakouti and
and Gheibi (1988) reported that consumption of S in calcareous soil and with neutralizing
lime increased solubility and availability of iron.
Wu et al. (2014) conducted an experiment to determine if S influenced Fe accumulation
using different levels of S. Concentration of Fe increased in rice and then decreased with
increasing S concentration. This study suggested that S application may improve Fe contents
in rice when cultivated in low S content soils, while Fe content may decrease in rice with S
inputs (fertilizers, atmospheric deposition) in high-sulfur soils. Similar studies were
conducted by Heydarnezhad et al. (2012) and Kavamura et al. (2013) to investigate nutrient
(i.e. Fe, Zn and P) concentration in calcareous soils. Sulfur application increased the
concentration of Fe, Zn and P in soil. This study suggested that S application not only
increased enhance solubility of Fe and Zn but also increased bioavailability of Fe and Zn in
calcareous soil. The acidity produced during S oxidation increases the availability of
nutrients such as P, Fe, Mg, Mn, Ca, and SO4 in soils (Lindemann et al., 1991).
Experiments have demonstrated that S in soil affects Fe uptake in rice because S can regulate
the formation of Fe plaque on the root surface of rice (Hu et al., 2007; Gao et al., 2010; Fan
et al., 2010), influence Fe uptake by rice (Liu and Zhu, 2005), and influence the formation of
phytosiderophore, which is closely linked with Fe uptake by plants (Cao et al., 2002; Jin et
al., 2005). Sulfur can increase the Fe transport in plants xylems (Hu and Xu, 2002; Na and
Salt, 2011) and phloem, as well as accelerate the activation of deposited Fe in the apoplast by
acidifying apoplast pH (Holden et al., 1991; Toulon et al., 1992). Previous studies showed
that S supply can increase the accumulation of Fe in rice seedlings (Min et al., 2007). Hassan

11
and Olsen (1966) suggested that applied S directly increased the amount of Fe and Mn
removed from the neutral and calcareous soils by production and consumption of sulfides
(e.g. FeS and MnS formation).
2.6.2 Injection of ion salts
Iron salts in liquid form (FeSO4 and ammonium citrate) have been injected into plant xylem
vessels and has significant results in reducing Fe induced chlorosis in fruits like pear,
kiwifruit, peach, olives, and apple (Wallace and Wallace, 1986; Wallace, 1991). Application
of Fe as bullets into trunks by making holes is also an effective and long lasting (2-3 years)
cure for Fe chlorosis (Wallace, 1991). However, it may cause phytotoxicity when iron
concentration injection time and plant growng times are wrongly chosen. Because of quick
transformation of Fe from available (Fe+2) to unavailable form (Fe+3).
2.6.3 Blood meal
Use of blood meal is considered an effective approach to combat Fe chlorosis in trees
(Taglivaini et al., 2000). Blood meal is a byproduct of the slaughter house and an excellent
source of Fe for plants (Kalbasi and Sharimatmadari, 1993). Blood meal can contain Fe
ranging from 20-30 g kg-1. In blood meal, Fe is found as ferrous sulphate and in complex
with the heme group of hemoglobin.
2.6.4 Foliar application of Fe
Under field conditions acidic solution sprays (e.g. citric, ascorbic, and H2SO4) have proved
effective at re-greening Fe chlorotic leaves without applying exogenous iron (Aly and
Soliman, 1998; Tagliavini et al., 1995). There was a decrease in apoplastic pH and re-
greening of Fe chlorotic leaves by applying citric and sulfuric acid (Kosegarten et al., 2004).
But there are some constrains in adopting this techniques as studied by Tagliavini et al.
(2000). More than one sprays are needed to correct Fe deficiency and much care is needed
decause high doses of spray solution causes leaf burn.
2.7 Organic amendments and nutrient availability
Organic matter supplies organic chemicals to the soil solution that can serve as chelates and
increase metal availability to plants, providing metal chelates, and increasing the solubility of
nutrients in soil solution (Du Laing et al., 2009; McCauley et al., 2009).
12
2.7.1 Animal manure
Animal manure has been used for many years alone and in combination with chemical
fertilizers. Its effectiveness is enhanced when applied with mineral fertilizers. Animal
manure has the ability to dissolve soil insoluble organic compounds. Incubation of Fe salts
with organic manure can improve efficiency of Fe sources before application (Tagliavini et
al., 2000).
The chemical composition of poultry manure reveals that it has a high concentration of
nitrogen compared to various other organic amendments (Bujoczek et al., 2000) and high
nitrogen contents change the dynamics of Fe contents in wheat as the activity of YS1 protein
needed for Fe transport is promoted in the root cell membrane (Murata et al., 2008; Curie et
al., 2009).
With increasing trend of people towards poultry industry disposal of poultry waste is
becoming an issue of great concern due to its high nutritional value for soil and plant. Poultry
manure is used as a source of organic fertilizer as it contains many nutrients (Moore et al.,
1995). It also contains many secondary elements, micronutrients, and some heavy metals
(Gupta and Gardner, 2005). The fraction of plant available nutrients can be changed by
applying manure because manure can change the soil biota and physical properties of the soil
(Demir et al., 2010).
2.7.2 Compost
A sustainable approach to manage municipal waste is the use of compost made from
municipal solid waste (Aggelides and Londra, 2000; Soumare et al., 2003a).
Physicochemical properties of soil and plant nutrient status can be improved by use of
compost because mature compost contains plant nutrients. Application of compost improved
readily available Fe, Zn, and Cu contents soil (Soumare et al., 2007). Application of compost
influences the nutrient dynamicsdue to changes in physicochemical conditions of soil
nutrient mobility and bioavailability; availability of a few nutrients can increase or vice versa
(Gardiner et al., 1995). Upon decomposition, release of mineral elements (Fe, Zn) from
organic complexes also increases availability of mineral nutrients such as Fe and Zn (Dudley
et al., 1986; Nyamangara, 1998). However, complete knowledge of minerals (Fe, Zn)
13
behavior should be understood before application of compost to maintain a sustainable and
reliable agro-ecosystem.
2.7.3 Biochar
Biochar affects mineral forms of Fe by acting as an electron shuttle in redox-mediated
reactions (Kappler et al., 2014). Recently, Graber et al. (2014) noted how the redox catalytic
activity associated with biochar solubilized Fe from a sandy soil, increasing the metal release
with decreasing pH. One of the main mechanisms proposed to justify the benefits of biochar
is its positive impact on the availability of soil nutrients (Xu et al., 2013). Direct effects of
biochar on soil fertility have been mainly related to the presence of nutrients in mineral form
on the biochar surface (Kimetu et al., 2008). However, indirect effects of biochar on soil
fertility are to change soil physico-chemical and biological properties (such as pH, redox
conditions, porosity, water retention capacity, and biotic interactions at the rhizosphere),
leading to nutrient mobilization (Lorenz and Lal, 2014; Ngo et al., 2014; Jeffery et al., 2015).
2.8 Iron for human health
It is recognized that micronutrient deficiency causes harmful impacts to public health (Black,
et al., 2008; Stein, 2010). Iron scarcity causes fatigue, poor work performance, reduced
immunity, deficient oxygen supply to RBCs, and death. In most part of the world, Fe
deficiency particularly affects preschool children and women (Benoist et al., 2008). Mortality
rate and overall burden of disease has increased due to micronutrient deficiency. Common
periods of high Fe demand include pregnancy, periods of blood loss during surgery, or Fe
demand due to insufficient Fe absorption (Trost et al., 2006).
Rice is usually very low in Fe contents compared to recommended dietary allowances. The
daily dietary dose is about 0.06 g day-1 for adult women with a low bioavailability of Fe (5%)
and 0.02 g day-1 with high bioavailable Fe, in developing countries (WHO, 2004). According
to UNSSCN (2010) about 88% of all pregnant women of 16 years and 63% of - and 14-year-
old children are considered to be anemic in South Asia.
2.9 Strategies to combat iron deficiency in humans
To improve Fe supply, three strategies namely food diversification, supplementation, and
food fortification have been practiced. These three aim to improve Fe supply and
14
bioavailability in food (Bothwell, et al., 2004; McDonagh et al., 2015). Diversification of
food increases intake and provision of an Fe-rich diet that is bioavailable to humans. On the
other hand, supply of Fe in the form of medicine and pills is supplementation. While either
addition of bioavailable Fe or reduction of the inhibitory effect of different compounds to the
most frequently consumed dietary products are categorized as food fortification. In the long
run, biofortification of plant based food is the most recent strategy to improve bioavailable
Fe contents. All these approaches need certain conditions to be fulfilled.
2.9.1 Food diversification
Food diversification aims to increase Fe contents of frequently consumed daily diet.
Diversification can improve Fe bioavailability in the variety of foods i.e. fruits, vegetables
and meat. But this has some limitations too: meat and fish that are rich in haem iron are quite
expensive, while fruits and vegetables rich in vitamin C are seasonal and available for short
periods of time only. Thus, making it difficult to enhance their intake.
2.9.2 Supplementation
A therapeutic approach that is utilized either to treat or to prevent severe micro nutrient
deficiency is supplementation (Imdad and Bhutta, 2012). In certain countries significant
results have been shown by supplementation programs organized by the health department.
Vitamin A supplementation for the cure of night blindness and newborn mortality has shown
remarkable success. Fe-foliate supplementation to pregnant women is also a feasible
approach and has been shown to have a positive impact on anemia. But in developing
countries the target of daily compliance is hard to achieve, also, lack of proper infrastructure,
disruption of stocks, lack of proper contact with the target population and official health care
department make it difficult to provide a timely supply of micronutrients such as Fe and Zn
(Bothwell et al., 2004).
Another limitation to the supplementation approach is not addressing the root cause of
malnutrition. It is a short term solution to malnutrition and nutrient deficiencies.
Supplemented food shows a variety of physiological and absorption responses of nutrients
compared to nutrients found in food (i.e. zinc, Fe and folic acid) (Bailey et al., 2015). Iron
supplemented food may not be the solution for Fe malnutrition. Different trials on
supplementation and screening for Fe-deficiency anemia (IDA) in young children reported

15
that no clear benefits of supplementation were observed (McDonagh et al., 2015). It is also
reported that supplemental Fe in the human diet with higher doses may cause serious health
hazards (i.e. gastric problems, gastric upset, vomiting and nausea, faintness, abdominal pain
or constipation) (Murray-Kolbe and Beard, 2009; Aggett et al., 2012). Oxidative stress that
leads to damage of cellular components due to lack of supply of some antioxidants also
results due to Fe introduction to the diet (Ibrahim et al., 1997).
2.9.3 Fortification
A more long term strategy to overcome Fe malnutrition is fortification of food items.
Fortification is meant for large numbers of population while supplementation exposes a
certain group of individuals. Fortification is more beneficial where micro nutrient deficiency
is widespread. However, it needs more time for implementation than supplementation.
Fortification programs needs some industrial engagement and policy decisions. The food
vehicle and amount of fortificant added is equally critical. Many food products are sensitive
to color or flavor changes and oxidative damage of some nutrients (Hurrel, 2002). Recently
published data from Powell et al. (2013) has reported that dietary fortified iron intake is
negatively associated with quality of life in patients, probably as a result of low
bioavailability as well as an antagonistic mechanism with other metals. The toxic effect of
high doses of Fe is also known (Golub et al., 2009).
2.9.4 Biofortification
Biofortification with Fe in staples provides an economical tool to reduce Fe malnutrition
(Jeong and Guerinot, 2008; Nagesh et al., 2012). Enrichment of crops with micronutrients
before harvest is known as biofortification. Biofortification enhance micronutrients, thus it is
an important tool to overcome micronutrient malnutrition (Brinch-Pedersen et al., 2007).
Biofortification is considered a long term solution to combat Fe malnutrition (Zimmermann
and Hurrell, 2002). Biofortification is only a one time investment of money for fertilizers.
For a healthy body, a dose of 2-6 ppm is enough to improve Fe level (Haas et al., 2005).
Successful biofortification needs the acceptance from consumers, adaptation by farmers, and
cost effectiveness.
2.10 Approaches for iron biofortification

16
Biofortified staple foods may not deliver equally high levels of minerals and vitamins per
day, but they can increase micronutrient intake for the resource-poor people who consume
them daily, and therefore complement existing approaches (Bouis et al., 2011). Cereals are
rich in anti-nutrients, the plant genome along with their growth conditions determine the
level of these inhibitors (Hunt, 2003). For Fe biofortification of crops, genetic engineering,
agronomic, transgenic, and plant breeding approaches have been developed (Bouis et al.,
2011; Sperotto et al., 2012a)
2.10.1 Breeding and genetic approaches
Breeding and genetic approaches have been used for many years to obtain genotypes that are
rich in micronutrients. Aung et al. (2013) and Masuda et al. (2012, 2013) studied three
combined approaches to biofortify rice grain. A combination of genes is involved in Fe
homeostasis that can be used to enrich rice grain with Fe. A successful Fe biofortified and
vitamin A-fortified rice named “Golden Rice” was introduced by Goto et al. (1999) and Ye et
al. (2000). Conventional and modern plant breeding and biotechnological approaches
suggested that Fe contents in rice are a genotypic character that is significantly different for
different genotypes hence, new Fe-enriched varieties can be screened or bred (White and
Broadley, 2005; Wen et al., 2005).
These approaches are not always very successful either because of environmental and
genotypic interactions or there may be a lack of a target genome (Palmgren et al., 2008;
Zhao, 2010). Source and sink strategy were prioritized to biofortify rice grain with Fe and Zn
(Wirth et al., 2009; Masuda et al., 2013).Traditional breeding efforts to biofortify polished
rice have not proven very effective as there are limited variations in Fe contents. Over 20,000
rice accessions from Latin America, Asia, and the Caribbean were evaluated for Fe and Zn
contents. It revealed that maximum concentration was only 8 mg kg-1 in polished grains
(Graham, 2003; Martínez et al., 2010). It is reported by Bashir et al. (2013a) that plant
breeding has failed so far in developing Fe biofortified polished rice.
2.10.2 Transgenic approaches
Goto et al. (1999) was the first to explore transgenic approaches to enrich Fe in endosperm
over a decade ago. Since then, countless efforts have been made to improve grain Fe
contents by Fe homeostasis gene expression that either increase the Fe uptake from soil,

17
ultimately accelerating Fe translocation from roots and shoots to grains, or by improving
efficacy of Fe storage protein (Kobayashi and Nishizawa, 2012; Lee et al., 2012). Studies
also suggested that stability of selected trait over number of plant generations is nevertheless
still a challenging task. Oliva et al. (2014) introduced an indica variety with phytoferritin
over expresser events without selectable marker genes; however, the level of Fe was not
sufficient to reach the target. Transgenic varieties may sometimes provide more nutrients
than genotype selection but many countries don’t allow commercialization of these
transgenic varieties (Saltzman et al., 2013).
2.10.3 Soil and crop management
Rice grain Fe contents are regulated by soil and other environmental factors (Barikmoa et al.,
2007; Zuo and Zhang, 2011). Several sources of micronutrients can be used such as inorganic
salts, natural organic polymers, and synthetic chelaters. Foliar application of micronutrients
is considered very effective as it requires fewer amounts of fertilizers and a quick response
crop response compared to soil application (Mortvedt, 2000).
Synthetic Fe chelates are also considered an effective approach to biofortify crops with Fe
and are used both in soil and foliar application. Their initial cost may be prohibitive, but
these have proved cost effective for high value crops (Fageria et al., 2002). Studies suggested
that foliar application of Fe was effective in increasing Fe contents of wheat in arid climates
(Habib, 2009; Pahlavan-Rad et al., 2009), but foliar application remained ineffective in
humid areas. Pahlavan-Rad (2009) and Habib (2009) evaluated the effectiveness of complex
micronutrient application as foliar sprays and suggested that complex micronutrient foliar
application is superior to single application as wheat grain concentration of Fe and Zn were
improved by complex micronutrient foliar application.
Application of organic amendments, such as farmyard manure, increases nutrients
concentration, improves nutritional quality, and enhances nutrient balance of crops (Graham
et al., 2001). On decomposition of organic matter, different organic acids (i.e. oxalic,
phenolic, citric, and malic) are released. These organic acids form complexes with Fe, hence
enhance its mobility and bioavailability (Lindsay, 1995). The most recent approach is to
enhance bioavailable Fe contents while reducing phytate contents and to increase total Fe
content, but these are not very practical at this time (Raboy et al., 2000; Hurrell et al., 2003).

18
Most Fe biofortification studies are conducted under favorable glasshouse conditions, with
only limited studies performed under field conditions (Masuda et al., 2008, 2012).
2.11 Nutritional factors affecting Fe bioavailability
Apart from high pH and elevated lime contents there are some other factors that affect Fe
bioavailability. Among these factors, phytic acid and poly-phenolics are most important.
2.11.1 Phytic acid (Phytate)
Phytate is a stored form of seed phosphorus deposited during seed development (Doria et al.,
2009). Phytic acid acts as a binding agent in the intestinal tract of human as it makes strong
bonding with Ca, Zn, Fe, and other essential mineral elements during digestion (Garcia et al.,
1999). As an anti-nutrient, phyate reduces bioavailability of important nutrients and causes
micronutrient malnutrition (Welch, 2002). The main challenge is to reduce phyate contents to
assure maximum ferritin concentration. It is the only way we can enrich crops with
micronutrients like Fe. Total Fe contents are of no meaning unless we decrease phytic acid
concentration that limits its bioavailability.
2.11.2 Polyphenol
Like phytate, polyphenol is also considered an antinutrient that interacts with essential
mineral contents of food and makes them unavailable for absorption (Idris et al., 2006; Abd
El Rahaman et al., 2007). Sharma and Kapoor (1997) showed that nutrient absorption by
human body was significantly influenced by polyphenols and phytate present in pearl millet.
Studies also suggested that polyphenols act as chelating agents that affect Fe bioavailability
by forming insoluble complexes (Hurrell and Egli, 2010).
Many cereals contain high contents of polyphenols i.e. maize. Liyana-Pathirana and Shahidi
(2005) reported that food digestion enhances the antioxidant capacity of cereals and cereal
based food. The solubility and functionality of polyphenols present in cereals increases in
stomach and duodenum.In vitro digestion studies showed that the amount of antioxidants
released by the array of cereals in the human gut may be higher than expected (Perez-
Jimenez and Saura-Calixto, 2005). In the plant cell wall, lignin is present that is known to
have polyphenolic properties. About 30% of plant biomass and 3-7% of bran is made up of

19
lignin. Lignin compounds are considered to be inert during digestion but their polyphenolic
structure gives them antioxidant properties (Fardet et al., 2008)
Del Pozo-Insfran et al. (2006) evaluated varietal difference in antioxidant fraction. He
demonstrated that Mexican purple maize showed a significantly higher antioxidant capacity
than American purple and white varieties. However, these were attributed to the specific
anthocyanins and/or the composition of polyphenols in the plants.
Tough, fermentation, malting, sprouting, soaking, and cooking have long been documented
by many researchers to lower down anti-nutrient concentration (Lewu et al., 2010; Osman,
2011) such information still needs more investigation.
2.11.3 Ferritin
Ferritin is a stable Fe storage protein consisting of a 24-subunit shell around a 4500-atom
iron core (Theil et al., 2004). It is reported that Ferritin doesn’t form complexes with other
cations, thus increasing Fe availability to humans. Ferritin is a stable protein and doesn’t
denature in the human elementary tract (Theil et al., 2001; Murray- Kolb et al., 2003).
In most seeds ferritin content ranges from 8-80 μg/g of seed. Several studies suggested that
rice, wheat, and corn have low bioavailable Fe contents (May et al., 1980) while nodule
forming crops are rich in ferritin (Ambe et al., 1987). Ferritin-Fe contents are bioavailable to
humans and a source of Fe for completion of the human life cycle (Lonnerdal et al., 2007).
Iron stored in ferritin is completely bioavailable (Goto and Yoshihara, 2001).
Ferritin is present in all crops, but differing in concentration. Biofortification also aims to
enhance ferritin concentration of crops. Ferritin binds to free radicals that are damaging to
cells. Ferritin also acts as a temporary storage form of Fe that is available in Fe limiting
conditions (Briat et al., 2010a). It is reported that ferritin is the key component in alleviating
oxidative stress (Mata et al., 2001). The main function of ferritin in seeds is protection
against free Fe damage through Fenton oxidation (Briat et al., 2010b).
2.12 Models used to determine Fe bioavailability
The bioavailability and Fe absorption from the daily diet are influenced by the type and
quantity of Fe present in food and by the presence of inhibitors and promoters of Fe

20
absorption in the diet and the individual’s Fe status (Duque et al., 2014). The urgency of
addressing Fe deficiency stems from its implication in a number of health conditions, some
serious or even fatal. Rat models are most frequently used for testing the effects of agents
that are toxic or potentially hazardous to humans. This also refers to the toxicity of metals
and a possible preventive and therapeutic effect (Brzóska et al., 2012; Al-Rejaie et al., 2013).
It was observed by Zielińska-Dawidziak et al. (2012) that in Fe deficient rats, decreased level
of hemoglobin (Hb), hematocrit (HCT), mean corpuscular volume (MCV), mean corpuscular
hemoglobin (MCH), mean corpuscular hemoglobin concentration (MCHC), serum and liver
ferritin were increased to normal values or better after feeding ferritin isolate. Expression of
soybean ferritin in rice resulted in Fe bioavailability similar to that of ferrous sulfate fortified
rice when evaluated in a rat hemoglobin repletion model (Kolb et al., 2002) and human
lactoferrin produced in rice had bioavailability similar to that of ferrous sulfate in young
women (Lonnerdal et al., 2006). In mice, Fe biofortified rice feeding test and Caco-2 cell
models confirmed that metal bioavailability in rats and humans increases with the increased
level of metals in rice grains (Zheng et al., 2010; Lee et al., 2012b). Recently it was shown
that biofortification of rice with Zn significantly increases Zn uptake in Caco-2 cell models
as well as in rat pups, and is suggested to have a similar effect in human populations (Jou et
al., 2012).

21
Chapter 3
Iron biofortification of wheat grain through integrated use of organic and
chemical fertilizers in pH manipulated calcareous soil
Abstract
High incidence of iron (Fe) deficiency in human populations is an emerging global challenge
for researchers attempting to alleviate Fe deficiency by increasing Fe concentration in food
crops. With the aim to increase Fe bioavailability in wheat, this study was conducted to
evaluate the potential of iron sulphate combined with biochar and poultry manure for Fe
biofortification of wheat grain in a pH manipulated calcareous soil. In two incubation studies
the rates of sulfur (S) and Fe combined with various organic amendments for lowering pH
and Fe availability in calcareous soil were optimized. In a pot experiment, optimized rate of
Fe along with biochar (BC) and poultry manure (PM) was evaluated for Fe biofortification of
wheat in normal and S treated low pH calcareous soil. Iron applied with BC in S applied low
pH soil (Fe + BC + S), provided the maximum increase in root-shoot biomass and
photosynthesis up to 79, 53 and 67%, respectively, as compared to control. Grain Fe and
ferritin concentration increased up to 140% and 120%, respectively while phytate and
polyphenol decreased 35 and 44%, respectively in treatment when Fe was applied with BC
and S compared to the control. Combined use of Fe and BC could be an effective approach
for enhancing growth and Fe biofortification of wheat in pH manipulated calcareous soil.
Keywords: biochar, sulfur, ferritin, phytate, polyphenol

22
3.1 Introduction
Dietary deficiency of essential micronutrients such as iron (Fe) affect more than two billion
people worldwide (White and Broadley, 2009; WHO, 2011). Countries where people depend
on cereal based food have high incidence of micronutrient deficiencies (Cakmak et al.,
2010a; Bouis et al., 2011). The World Health Organization estimates that approximately 25%
of the world’s population suffers from anemia (WHO, 2010) and that Fe-deficiency anemia
led to the loss of over 46,000 disability adjusted life years in 2010 alone (Murray and Lopez,
2013). Many possible strategies like dietary diversification, mineral supplementation, and
post-harvest food fortification are used to improve micronutrient intake in the human diet.
Biofortification circumvents these problems by increasing the micronutrient contents in
edible part of crops and enhancing their bioavailability and absorption in human body during
digestion (Bouis et al., 2011).
Low chemical solubility and low bioavailability of Fe in calcareous soil is a serious problem
for crops (Laird et al., 2010; Seher et al., 2011). Iron is not deficient in mineral soil but high
pH (Alcantara et al., 2002) and high HCO3 contents in calcareous soil (Bloom and Inskeep,
1988) are two important factors that limit Fe availability. Iron fertilization in calcareous soil
is not effective due to Fe’s rapid conversion into unavailable forms and poor mobility of Fe
in phloem (Rengel et al., 1999; Cakmak et al., 2010a). Phytic acid and polyphenols are
important anti-nutrients, which inhibit Fe bioavailability (Gautam et al., 2010). It was
reported that acidifying calcareous soil with sulfur (S) and neutralizing lime increased
phytoavailability of Fe (Lippman, 1916; Malakouti et al., 1988). Elemental S decreases the
soil pH (Iqbal et al., 2012) and affects the Fe availability because Fe in soil reacts with S to
form iron sulfide (Dent, 1986), sulfide can reduce ferric to ferrous (Murase and Kimura,
1997). Sulfur influences the formation of phytosiderophores, which are closely linked with
Fe uptake by plants (Cao et al., 2002; Jin et al., 2005). Sulfur can increase the Fe transport in
plants xylem (Hu and Xu, 2002; Na and Salt, 2011) and phloem, as well as accelerate the
activation of deposited Fe in the apoplast (Holden et al., 1991; Toulon et al., 1992) and
increase the accumulation of Fe in plants (Li et al., 2007).

23
Organic matter releases organic chemicals that serve as chelators and increase metal (Fe in
this case) availability to plants by solubilizing the nutrients in soil solution (Du Laing et al.,
2009; McCauley et al., 2009). Poultry manure has high nutrient composition and nitrogen (N)
contents; high N improve Fe concentration in wheat by increasing Fe activity and abundance
of Fe transporter proteins such as yellow stripe 1 (YS1) in the root cell membrane (Bujoczek
et al., 2000; Curie et al., 2009). Biochar (BC) affects soil fertility by changing soil physico-
chemical and biological properties leading to nutrient mobilization (Xu et al., 2013; Jeffery et
al., 2015). In redox mediated reaction BC affects mineral forms of Fe by acting as an electron
shuttle (Kappler et al., 2014). Biochar solubilizes Fe by decreasing soil pH due to its redox
catalytic activity (Graber et al., 2014). In addition, soil properties changed by BC application
may increase nutrient mobilization and uptake in the rhizosphere via increasing the
exploratory capacity of the root density and modifying nutrient solubility (Lehmann et al.,
2011).
Chemical fertilizers (soil and foliar applied) and organic amendments are used to increase
plant growth and Fe biofortify cereals (White and Broadley, 2009; Cakmak et al., 2010a;
Alburquerque et al., 2015). However, little is known about the combined use of iron sulphate
with BC and poultry manure for Fe biofortification of wheat in pH altered calcareous soil.
The objectives of this study were: 1) to define the time and rate of elemental S for lowering
soil pH; 2) to find out optimum level of S and Fe for calcareous soil acidification and Fe
biofortification; 3) to investigate if Fe fertilizer, BC, and PM alone as much affective as
affective in pH altered calcareous soil.
3.2 Materials and Methods
3.2.1 Experimental soil
Soil was collected from a field area of Institute of Soil and Environmental Sciences,
University of Agriculture Faisalabad, Pakistan. Soil was collected from 0-15 cm depth and
uniformaly mixed. Soil was air dried, passed through a 2-mm sieve to remove pieces of
stones and homogenized. A sunsumple was collected for various physic-chemical properties
of soil. Properties of experimental soil and organic amendments are shown in Table 3.1. The

24
soil was alkaline calcareous in nature and deficient in plant available Fe and Zn and also had
a low proportion of organic matter.
Table 3.1 Physico-chemical properties of soil and organic amendments used in the
experiment
Parameter Units Values Physic-chemical properties for wheat
Sand % 39
Silt % 29
Clay % 32
pH − 7.9 5.5-6.5
Organic matter % 0.7 ≥1%
CaCO3 g kg-1 21.9 ≤1%
HCO3 mmolc L-1 2.6
DTPA-Fe ppm 4.21 4.5-5.5 ppm
DTPA-Zn ppm 0.59 1 ppm
N mg kg-1 120 150 mg kg-1
P mg kg-1 7.9 9.5 mg kg-1
K mg kg-1 108 125 mg kg-1
Characteristic of organic amendments
Parameter Farm yard
manure
Biochar Compost Poultry
manure
pH 7.71 7.64 7.75 7.31
EC dS m-1 4.9 1.96 4.17 5.1
Organic
matter
% 51.05 59.1 55.2 53.3
C/N ratio 27 51 19 32
Fe mg kg-1 312.3 308.9 292.8 381.9
Zn mg kg-1 351.9 281.8 155.5 501.3
Mn mg kg-1 316.7 161.4 187.6 324.8
Cu mg kg-1 266.6 177.7 269.2 274.6
3.2.2 Incubation study 1
3.2.2.1 Manipulation of soil pH
A preliminary incubation experiment was conducted to lower the soil pH. For slow and
steady soil acidification, elemental S was used. Sulfur was manually crushed with a plastic
spatula to obtain a homogeneous powder, sieved (<200 μm) and weighed. Different rates of S
(1.5, 2, 2.5, 3 g kg-1 soil) were used for calculation of S needed. Sulfur was used as a single

25
treatment and with combination of four different organic amendments (poultry manure,
farmyard manure, compost, and biochar). All are used at the rate of 1% (w/w). Properties of
organic amendments are given in Table 3.1. Acidity is produced in aerobic conditions by
microbial oxidation of S to sulfuric acid.
S0 + 1.5O2 + H2O H2SO4
Soil (300 g) with 60% moisture content was mixed with four rates of S and was incubated in
a completely randomized design at 25°C for 18 weeks. Soil pH was measured by taking 2 g
soil from each pot and with soil:solution ratio of 1:2.5. Data was calculated on a weekly basis
by pH meter (JENCO pH meter, 671 P model). This data was used to calculate the amount of
S to achieve a pH value of 6.5 in each soil.
3.2.3 Incubation study 2
3.2.3.1 Calculation and selection of Fe rates
A second incubation study was conducted in a completely randomize design to select the rate
of FeSO4·7H2O for Fe biofortification of wheat. Hydrated ferrous sulphate (FeSO4·7H2O)
was used as Fe source. Different rates of Fe i.e. 0.0075, 0.0125, 0.175 g kg-1 were used as a
single treatment and in combination with two organic amendments (biochar and poultry
manure, 1% w/w) selected from the 1st incubation study. These treatments were applied
under control and pH manipulated soil. Sulfur rate (2.5 g S kg-1 soil) as selected from study 1
was applied for manipulation of soil pH. Iron rate was selected on the basis of DTPA
extractable Fe. Soil (500 g) with 60% moisture content was used in this experiment and was
incubated at 25°C for 130 days. Data was calculated after each 10 days interval. This data
was used to calculate the amount of Fe needed to obtain a DTPA extractable Fe value up to 9
ppm in each soil as and 5 g soil extracted by 0.005 MDTPA (Lindsay and Norvell 1978) and
measured by atomic absorption spectrophotometer (Perkin Elmer, AAnalyst 100, Waltham,
USA).
3.2.4 Plant experiment
3.2.4.1 Experimental plants growth and conditions

26
A pot experiment was conducted in the wire house of Institute of Soil and Environmental
Sciences, University of Agriculture Faisalabad, Pakistan to evaluate the potential of
Fe2SO4.7H2O combined with organic amendments for Fe biofortification of wheat in pH
manipulated calcareous soil. Pots were filled with 8 kg sieved soil and two organic
amendments (biochar and poultry manure @ 1% w/w) in each pot according the treatment
plan (see Table 3.2). Prior to seed sowing into the pots, soil pH was lowered by S (rate of S
as selected in study 1), and S added 4 weeks behor sowing wheat seed. Poultry manure was
collected from the poultry farm of University of Agriculture Faisalabad. Biochar was made
from Eucalyptus feedstock at 400°C temperature. After making biochar from feedstock, it
was ground and thoroughly mixed into pots. Iron was applied as determined in the 2nd
incubation study (0.0075 g kg-1) at the sowing time of wheat. Recommended doses of N
(urea), phosphorus (P) (single super phosphate) and potassium (K) (sulphate of potash) i.e.
0.06, 0.05, 0.03 g kg-1 equivalent, respectively were applied. Full doses of P and K were
applied at the time of sowing while N dose was applied in two splits. The first sub-dose was
applied at sowing and the remaining applied 30 days after sowing.
Six seeds of wheat variety (Glaxy-2013) were sown in each pot at a depth of 2 cm and 3
seedlings per pot were maintained after emergence. Throughout the experimental period, de-
ionized water was used to maintain soil moisture as needed. Fifty days after sowing, plant
physiological parameters such as photosynthetic rate (A), transpiration (E) rate, stomatal
conductance (gs), and substomatal conducts (Ci) were measured by using a CIRAS-3 (PP
System, Amesbury, MN, USA). Plant were harvested at maturity and manually threshed to
separate the grain. After shade drying, samples were kept in a forced-air-driven oven at 60°C
until constant weight. Dry weight of root, shoot and grains yield were recorded after oven
drying.
3.2.4.2 Grain analysis
Whole grain samples were ground in a mill (IKA Werke, MF 10 Basic, Staufen, Germany) to
a mesh size of 0.5-mm. Sample was placed in muffle furnace at 550oC for complete
oxidation of organic matter until the appearances of gray white ash (AOAC, 2003). Ground
subsamples of known weight were digested in a di-acid mixture (HNO3:HClO4 ratio of 2:1)

27
(Jones and Case, 1990). Zinc and Fe concentrations in the digest were measured by atomic
absorption spectrophotometer (PerkinElmer, AAnalyst 100, Waltham, USA).
Table 3.2 Treatment realized in the pot experiment, BC: Biochar (1% w/w), PM:
Poultry Manure (1% w/w), Fe: Iron (0.0075 g kg-1 soil), replication: 3
Treatments Abbreviations Iron solubilizing agent (Elemental Sulfur)
Sulfur g kg-1 soil Corresponding H+ ion
(mmol kg-1 soil)
Control C
Biochar BC
Poultry Manure PM
Iron Fe
Iron + Biochar Fe + BC
Iron + Poultry Manure Fe + PM
Sulfur S 2.5 g kg-1 soil 156.25
Sulfur + Biochar S + BC 2.5 g kg-1 soil 156.25
Sulfur + Poultry
Manure
S + PM 2.5 g kg-1 soil 156.25
Sulfur + Iron S + Fe 2.5 g kg-1 soil 156.25
Sulfur + Iron +
Biochar
S + Fe + BC 2.5 g kg-1 soil 156.25
Sulfur + Iron +
Poultry Manure
S + Fe + PM 2.5 g kg-1 soil 156.25
Total protein concentration in grain was determined with the Bradford colorimetric method
(Bradford, 1976). Fat was determined by ether extract method while using Soxhlet apparatus
(AOAC, 2003). Crude fiber was determined according to the procedure described in AOAC
(2003). A moisture free and ether extracted sample, made of cellulose was first digested with
dilute H2SO4 and then with dilute KOH solution. The undigested residue collected after
digestion was ignited and loss in weight after ignition was registered as crude fiber. Phytate
was determined by an indirect method as described by Haug and Lantzsch (1983). A 60 mg
whole grain ground sample was extracted with 10 mL of 0.2 N HCl at room temperature for
2 h and final reading was taken on a spectrophotometer (Shimadzu, UV-1201, Kyoto, Japan).
From prepared grain sample, polyphenol was measured by using the Folin–Ciocalteau
method (Aguilar-Garcia et al., 2007). Absorbance was taken by spectrophotometer at 760 nm
28
wavelength via the calibration curve of gallic acid and expressed as gallic acid equivalent.
For ferritin quantification, a 5 g grain sample was prepared as seed method described by
Lukac et al. (2009) with slight modifications. Ferritin concentration was measured by direct
ELISA (enzyme linked immunosorbent assay) using anti-body (Rabbit anti-ferritin) coated
microtiter wells and mouse monoclonal anti-ferritin antibody as antibody enzyme
(Horseradish peroxidase) conjugate solution and absorbance was taken at 450 nm wavelength
(Catalog Number: BC-1025). All devices used for chemical and biochemical analysis were
soaked in diluted HNO3 (pro analysis quality, Merck) and washed with deionized water.
3.2.5 Statistical analysis
The data of incubation studies were analyzed using MS Excel 2010. The data of pot
experiments was subjected to one-way analysis of variance (ANOVA) using Statistix 8.1
software (Analytical Software, USA, 2005). Significant difference of treatment means were
separated by post hoc Tukey’s test at P < 0.05.
3.3 Results
3.3.1 Time course of pH manipulation in non-planted soil
Soil pH value decreased gradually in the pots receiving different doses of elemental S and
was stable after 4 weeks of incubation. Among the four organic amendments, application of
S in soil with BC and PM [Fig. 3.1 (b, c)] lowered soil pH constantly compared to soil with
compost (CO) and farmyard manure (FYM) [Fig. 3.1 (d, e)]. Addition of S decreased soil pH
by about 1-1.9 units in BC and PM amended soil compared to the control. This effect was
more pronounced in the 18th week in the pots amended with BC and PM because of their
lower initial pH. Elemental S applied with out any organic amendments show similar trend as
with biochar and poultry manure. Without S, a slight increase in soil pH was observed by the
application of CO and FYM, compared to the control (Fig. 3.1). This increase in soil pH was
due to their slightly alkaline nature.

29
5.5
6.0
6.5
7.0
7.5
8.0
8.5
0 1 2 3 4 5 6 7 8 9 1 0 1 1 1 2 1 3 1 4 1 5 1 6 1 7 1 8
Soil
pH
Time (Weeks)
SulfurControl S a S b S c S d
a
5.5
6.0
6.5
7.0
7.5
8.0
8.5
0 1 2 3 4 5 6 7 8 9 1 0 1 1 1 2 1 3 1 4 1 5 1 6 1 7 1 8
Soil
pH
Time (weaks)
BiocharControl BC BC+S a BC+S b BC+S c BC+S d
b
5.5
6.0
6.5
7.0
7.5
8.0
8.5
0 1 2 3 4 5 6 7 8 9 1 0 1 1 1 2 1 3 1 4 1 5 1 6 1 7 1 8
So
ilp
H
Time (Weeks)
CompostControl CO CO+S a CO+S b CO+S c CO+S d
c

30
Fig 3.1 a-e: Soil pH manipulation with elemental S and different organic amendments. Error
bars represent standard errors of the mean (n=3)
S: sulfur, S a= 1.5 g elemental sulfur kg-1 soil, S b= 2 g elemental sulfur kg-1 soil, S c= 2.5 g
elemental sulfur kg-1 soil, S d=3 g elemental S kg-1 soil BC: 1% biochar, PM: 1% poultry
manure, CO: 1% (w/w) compost, FYM: 1% (w/w) farm yard manure
5.5
6.0
6.5
7.0
7.5
8.0
8.5
0 1 2 3 4 5 6 7 8 9 1 0 1 1 1 2 1 3 1 4 1 5 1 6 1 7 1 8
Soil
pH
Time (weeks)
Poultry ManureControl PM PM+S a PM+S b PM+S c PM+S d
d
5.5
6.0
6.5
7.0
7.5
8.0
8.5
0 1 2 3 4 5 6 7 8 9 1 0 1 1 1 2 1 3 1 4 1 5 1 6 1 7 1 8
Soil
pH
Time (Weeks)
Farm Yard ManureControl FYM FYM+S a FYM+S b FYM+S c FYM+S d
e

31
3.3.2 Integrated effect of chemical and organic amendments on DTPA-extractable Fe in
pH manipulated calcareous soil
Data in Fig. 3.2a (treatment vs soil pH) revealed that DTPA-extractable Fe concentration
increased in BC and PM amended soil along with different rates of Fe fertilizer in low pH
soil compared to the control. The S addition at 2.5 g kg-1 soil along with 0.0175 g Fe kg ha-1
gave the highest increase in DTPA-extractable Fe concentration ( i.e. 12.1 and 12.5 ppm by
PM and BC.
0
2
4
6
8
10
12
14
16
DT
PA
-Fe
(pp
m)
Treatments
Treatments*pH Soil pH 7.94 Soil pH 6.51
a
0
2
4
6
8
10
12
0 10 20 30 40 50 60 70 80 90 100 110 120 130
DT
PA
-Fe
(pp
m)
Time (Days)
pH*DaysSoil pH 9.94 Soil pH 6.51b
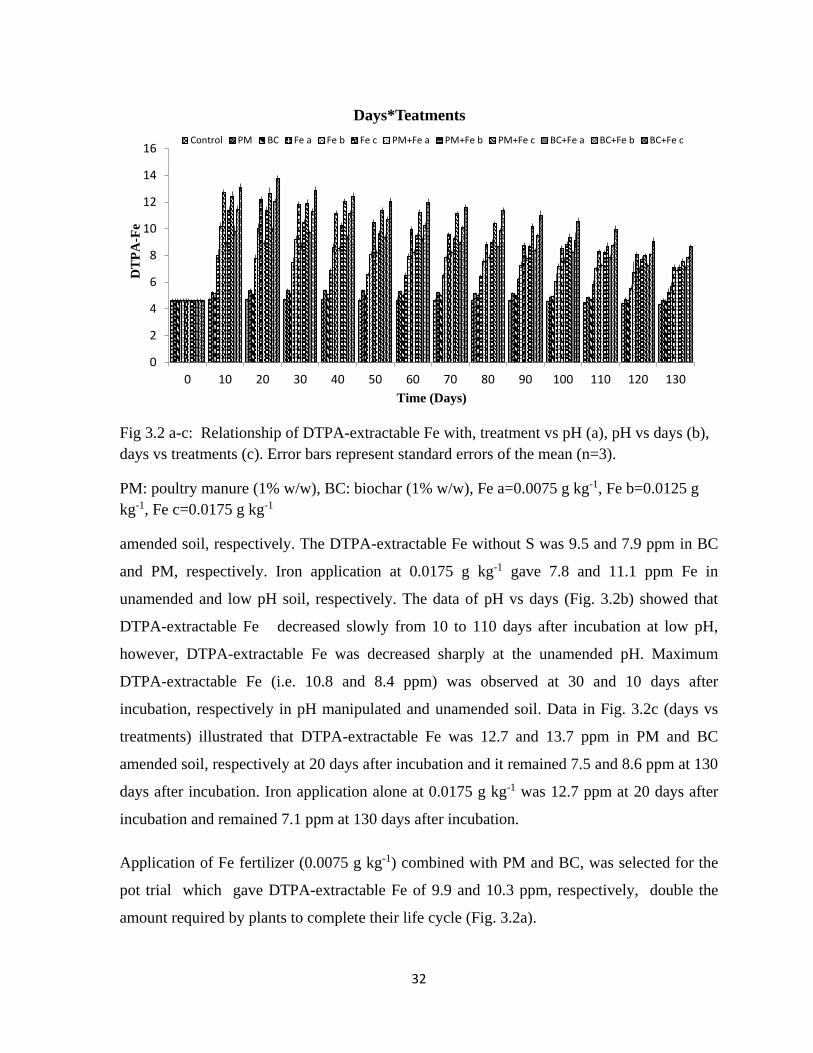
32
Fig 3.2 a-c: Relationship of DTPA-extractable Fe with, treatment vs pH (a), pH vs days (b),
days vs treatments (c). Error bars represent standard errors of the mean (n=3).
PM: poultry manure (1% w/w), BC: biochar (1% w/w), Fe a=0.0075 g kg-1, Fe b=0.0125 g
kg-1, Fe c=0.0175 g kg-1
amended soil, respectively. The DTPA-extractable Fe without S was 9.5 and 7.9 ppm in BC
and PM, respectively. Iron application at 0.0175 g kg-1 gave 7.8 and 11.1 ppm Fe in
unamended and low pH soil, respectively. The data of pH vs days (Fig. 3.2b) showed that
DTPA-extractable Fe decreased slowly from 10 to 110 days after incubation at low pH,
however, DTPA-extractable Fe was decreased sharply at the unamended pH. Maximum
DTPA-extractable Fe (i.e. 10.8 and 8.4 ppm) was observed at 30 and 10 days after
incubation, respectively in pH manipulated and unamended soil. Data in Fig. 3.2c (days vs
treatments) illustrated that DTPA-extractable Fe was 12.7 and 13.7 ppm in PM and BC
amended soil, respectively at 20 days after incubation and it remained 7.5 and 8.6 ppm at 130
days after incubation. Iron application alone at 0.0175 g kg-1 was 12.7 ppm at 20 days after
incubation and remained 7.1 ppm at 130 days after incubation.
Application of Fe fertilizer (0.0075 g kg-1) combined with PM and BC, was selected for the
pot trial which gave DTPA-extractable Fe of 9.9 and 10.3 ppm, respectively, double the
amount required by plants to complete their life cycle (Fig. 3.2a).
0
2
4
6
8
10
12
14
16
0 10 20 30 40 50 60 70 80 90 100 110 120 130
DT
PA
-Fe
Time (Days)
Days*Teatments
Control PM BC Fe a Fe b Fe c PM+Fe a PM+Fe b PM+Fe c BC+Fe a BC+Fe b BC+Fe c

33
3.3.3 Pot experiment
3.3.3.1 Growth and physiological parameters
Separate application of organic amendments (BC and PM) and Fe without S increased
growth and physiological parameters non-significantly compared to the control. However,
with the addition of S, significant increase in growth and physiology were observed
compared to the control (Table 3.3). Maximum increase in shoot dry weight 53% was
observed by combined application of BC and Fe followed by combined application of PM
and Fe (47%) in S treated low pH soil over the control. Similarly, combined application of Fe
with BC and PM significantly increased grain yield 27 and 23%, respectively compared to
the control in S amended soil (Table 3.3). A significant increase of 58 and 79% in root dry
weight of wheat was recorded by combined application of Fe with PM and BC in S treated
low pH soil compared to the control. Photosynthetic rate in all treatments increased
significantly where Fe was applied with BC and PM with or without S application, compared
to the control (Table 3.3). Maximum increase in photosynthetic rate of 67% was observed by
application of Fe + BC followed by 54% with Fe + PM in S-treated low pH soil with respect
to the control. Significant increase in transpiration rate was observed where Fe was applied
with BC and PM in unamended and S amended soil with respect to the control (Table 3.3).
Maximum increase of 93 and 79% in transpiration rate was observed by Fe application with
BC and PM in S treated soil, respectively compared to the control. There was a significant
increase in stomatal conductance in all treatments where Fe was applied with organic
amendments. The highest increase, 46 and 44% in stomatal conductance, was observed in Fe
application with BC and PM in S amended soil with respect to the control. Likewise, sub-
stomatal conductance of wheat decreased in all treatments where Fe was applied with organic
amendments, but the maximum decrease of 17% in sub-stomatal conductance was recorded
when Fe was applied with BC compared to the control.
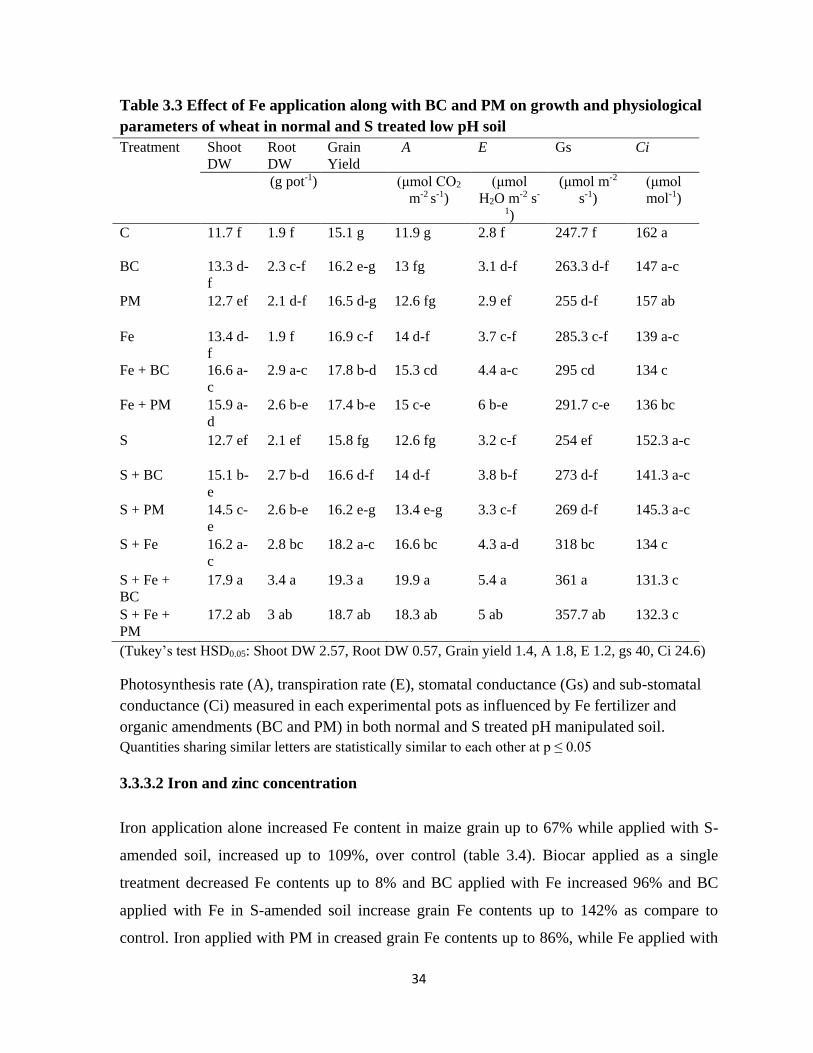
34
Table 3.3 Effect of Fe application along with BC and PM on growth and physiological
parameters of wheat in normal and S treated low pH soil
Treatment Shoot
DW
Root
DW
Grain
Yield
A E
Gs
Ci
(g pot-1) (μmol CO2
m-2 s-1)
(μmol
H2O m-2 s-
1)
(μmol m-2
s-1)
(μmol
mol-1)
C 11.7 f 1.9 f 15.1 g 11.9 g 2.8 f 247.7 f 162 a
BC 13.3 d-
f
2.3 c-f 16.2 e-g 13 fg 3.1 d-f 263.3 d-f 147 a-c
PM 12.7 ef 2.1 d-f 16.5 d-g 12.6 fg 2.9 ef 255 d-f 157 ab
Fe 13.4 d-
f
1.9 f 16.9 c-f 14 d-f 3.7 c-f 285.3 c-f 139 a-c
Fe + BC 16.6 a-
c
2.9 a-c 17.8 b-d 15.3 cd 4.4 a-c 295 cd 134 c
Fe + PM 15.9 a-
d
2.6 b-e 17.4 b-e 15 c-e 6 b-e 291.7 c-e 136 bc
S 12.7 ef 2.1 ef 15.8 fg 12.6 fg 3.2 c-f 254 ef 152.3 a-c
S + BC 15.1 b-
e
2.7 b-d 16.6 d-f 14 d-f 3.8 b-f 273 d-f 141.3 a-c
S + PM 14.5 c-
e
2.6 b-e 16.2 e-g 13.4 e-g 3.3 c-f 269 d-f 145.3 a-c
S + Fe 16.2 a-
c
2.8 bc 18.2 a-c 16.6 bc 4.3 a-d 318 bc 134 c
S + Fe +
BC
17.9 a 3.4 a 19.3 a 19.9 a 5.4 a 361 a 131.3 c
S + Fe +
PM
17.2 ab 3 ab 18.7 ab 18.3 ab 5 ab 357.7 ab 132.3 c
(Tukey’s test HSD0.05: Shoot DW 2.57, Root DW 0.57, Grain yield 1.4, A 1.8, E 1.2, gs 40, Ci 24.6)
Photosynthesis rate (A), transpiration rate (E), stomatal conductance (Gs) and sub-stomatal
conductance (Ci) measured in each experimental pots as influenced by Fe fertilizer and
organic amendments (BC and PM) in both normal and S treated pH manipulated soil.
Quantities sharing similar letters are statistically similar to each other at p ≤ 0.05
3.3.3.2 Iron and zinc concentration
Iron application alone increased Fe content in maize grain up to 67% while applied with S-
amended soil, increased up to 109%, over control (table 3.4). Biocar applied as a single
treatment decreased Fe contents up to 8% and BC applied with Fe increased 96% and BC
applied with Fe in S-amended soil increase grain Fe contents up to 142% as compare to
control. Iron applied with PM in creased grain Fe contents up to 86%, while Fe applied with
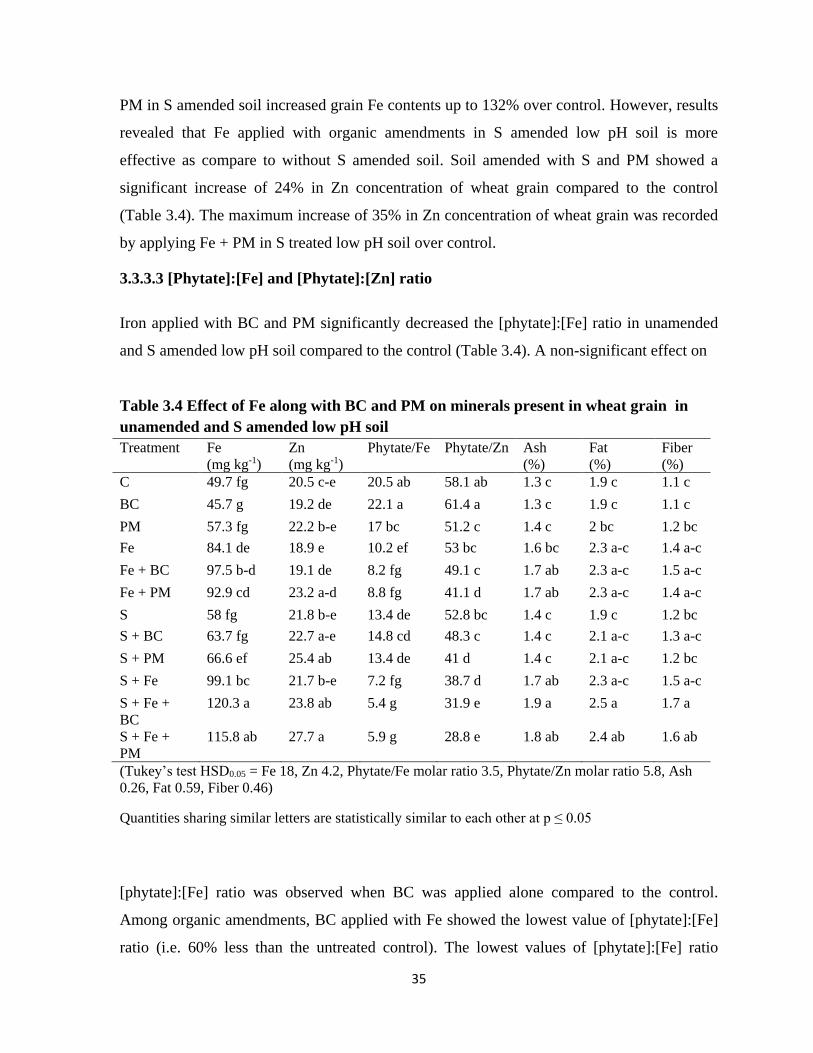
35
PM in S amended soil increased grain Fe contents up to 132% over control. However, results
revealed that Fe applied with organic amendments in S amended low pH soil is more
effective as compare to without S amended soil. Soil amended with S and PM showed a
significant increase of 24% in Zn concentration of wheat grain compared to the control
(Table 3.4). The maximum increase of 35% in Zn concentration of wheat grain was recorded
by applying Fe + PM in S treated low pH soil over control.
3.3.3.3 [Phytate]:[Fe] and [Phytate]:[Zn] ratio
Iron applied with BC and PM significantly decreased the [phytate]:[Fe] ratio in unamended
and S amended low pH soil compared to the control (Table 3.4). A non-significant effect on
Table 3.4 Effect of Fe along with BC and PM on minerals present in wheat grain in
unamended and S amended low pH soil
Treatment Fe
(mg kg-1)
Zn
(mg kg-1)
Phytate/Fe Phytate/Zn Ash
(%)
Fat
(%)
Fiber
(%)
C 49.7 fg 20.5 c-e 20.5 ab 58.1 ab 1.3 c 1.9 c 1.1 c
BC 45.7 g 19.2 de 22.1 a 61.4 a 1.3 c 1.9 c 1.1 c
PM 57.3 fg 22.2 b-e 17 bc 51.2 c 1.4 c 2 bc 1.2 bc
Fe 84.1 de 18.9 e 10.2 ef 53 bc 1.6 bc 2.3 a-c 1.4 a-c
Fe + BC 97.5 b-d 19.1 de 8.2 fg 49.1 c 1.7 ab 2.3 a-c 1.5 a-c
Fe + PM 92.9 cd 23.2 a-d 8.8 fg 41.1 d 1.7 ab 2.3 a-c 1.4 a-c
S 58 fg 21.8 b-e 13.4 de 52.8 bc 1.4 c 1.9 c 1.2 bc
S + BC 63.7 fg 22.7 a-e 14.8 cd 48.3 c 1.4 c 2.1 a-c 1.3 a-c
S + PM 66.6 ef 25.4 ab 13.4 de 41 d 1.4 c 2.1 a-c 1.2 bc
S + Fe 99.1 bc 21.7 b-e 7.2 fg 38.7 d 1.7 ab 2.3 a-c 1.5 a-c
S + Fe +
BC
120.3 a 23.8 ab 5.4 g 31.9 e 1.9 a 2.5 a 1.7 a
S + Fe +
PM
115.8 ab 27.7 a 5.9 g 28.8 e 1.8 ab 2.4 ab 1.6 ab
(Tukey’s test HSD0.05 = Fe 18, Zn 4.2, Phytate/Fe molar ratio 3.5, Phytate/Zn molar ratio 5.8, Ash
0.26, Fat 0.59, Fiber 0.46)
Quantities sharing similar letters are statistically similar to each other at p ≤ 0.05
[phytate]:[Fe] ratio was observed when BC was applied alone compared to the control.
Among organic amendments, BC applied with Fe showed the lowest value of [phytate]:[Fe]
ratio (i.e. 60% less than the untreated control). The lowest values of [phytate]:[Fe] ratio

36
occurred in Fe + BC and Fe + PM in S treated low pH soil and were a 74 and 71% decrease,
respectively, compared to the control. A decrease in [phytate]:[Zn] ratio of 29% occured
when Fe was applied with PM compared to the control. Similarly, a significant decrease in
[phytate]:[Zn] molar ratio was observed when Fe and organic amendments were used along
with S compared to the control. The maximum decrease in [phytate]:[Zn] ratio occurred in
Fe + BC + S and Fe + PM + S treatments and were 33 and 45% less, respectively,
compared to the control.
3.3.3.4 Physico-chemical analysis (Ash, Fat, Fiber)
Ash contents in wheat grain increased significantly with Fe application separately and with
BC and PM compared to the control in unamended and S amended low pH soil (Table 3.4).
Iron application as a single treatment and Fe + S increased ash content up to 23 and 31%,
respectively compared to the control. The maximum increase in ash contents (46 and 39%)
was observed where combined application of Fe with BC and PM was used, respectively in S
treated low pH soil compared to the control. A significant increase in fat content of wheat
grain was observed by application of Fe + BC + S and Fe + PM + S compared to the control
(Table 3.4). The fat contents increased up to 32 and 26% where Fe was applied with BC and
PM in S treated soil, respectively compared to the control. Iron, BC, and PM applied
separately and in combination showed non-significant effect on fiber contents in wheat grain
compared to the control. Iron applied with BC and PM increased fiber content up to 55% and
46%, respectively in pH manipulated soil compared to the control.
3.3.3.5 Phytate and polyphenol concentration
There was a significant decrease in phytate and polyphenol concentrations in wheat grain
when Fe was applied with organic amendments compared to the control [Figs. 3.3 (a, b)].
The decrease in phytate and polyphenol concentrations (i.e. 20 and 19%, respectively) were
observed when Fe was added with BC compared to the control. Similarly, phytate and
polyphenol concentration decreased significantly when Fe was added with BC and PM in S
treated low pH soil [Figs. 3.3 (a, b)]. Minimum concentrations (7.7 and 3.9 mg g-1 of phytate
and polyphenol, respectively) were measured when Fe + BC + S treatment was used
compared to the control. There was a decrease of 35 and 34% in phytate and 44 and 41%

37
polyphenol concentration s, respectively, in treatments where Fe + BC and Fe + PM were
added in S treated low pH soil compared to the control.
HSD value= Phytate 1.4, Grain polyphenol 1.4
Fig 3.3 a, b: Phytate and polyphenol concentration in wheat grain measured in various Fe
treatments under unamended and pH manipulated calcareous soil. Values are the means and
letters are significantly different from each other at p<0.05 (n=3).
3.3.3.6 Protein and ferritin concentration
a aa
b-dcd cd
aab
a-c
dd d
0
1
2
3
4
5
6
7
8
Po
lyp
he
no
l Co
nc.
mg
g-1
Treatments
(b)
a aab
c-ede de
aba-c
b-d
ef
f f
0
2
4
6
8
10
12
14
Gra
in p
hy
tate
Co
nc.
(m
g g
-1)
(a)

38
Protein concentration in wheat grain significantly increased with Fe application alone, and Fe
+ BC and Fe + PM along with S compared to the control [Fig. 3.4 (a)]. Iron applied with PM
and S increased protein concentration up to 22 and 24%, respectively compared to the
control. The highest increase in protein concentration 29 and 27% was observed by combined
HSD value= Grain ferritin 0.33, Grain protein 2.1
Fig. 3.4 a, b: Protein and ferritin concentration in wheat grain measured in various Fe
treatments under unamended and pH manipulated calcareous soil. Values are the means and
letters are significantly different from each other at p<0.05 (n=3).
d cd b-da-d a-d a-c
cda-d a-d
ab a ab
0
2
4
6
8
10
12
14
16
Grain
pro
tein
Con
c. (
%)
(a)
f ff
c-e b-d c-e
fd-f ef
bca ab
0
0.2
0.4
0.6
0.8
1
1.2
1.4
1.6
Gra
in f
erri
tin
Co
nc.
(µ
g g
-1)
Treatments
(b)
39
application of Fe + BC + S and Fe + PM + S, respectively, compared to the control. Iron
applied alone and combined with BC and PM in both unamended and S treated soil,
significantly increased grain ferritin concentration compared to the control [Fig. 3.4 (b)].
Combined application of Fe with BC and PM increased ferritin concentration in grain up to
66 and 60%, respectively compared to the control. Similarly, significant increase in ferritin
concentration was determined when Fe, BC and PM were applied with S compared to the
control. The maximum value of ferritin concentration of wheat grain (1.49 and 1.46 µg g-1 )
occurred in the combined application of Fe + BC + S and Fe + PM + S, respectively and
was 1.2- and 1.1- fold higher compared to the control.
3.4 Discussion
Lowering soil pH with elemental S has been tested successfully by many researchers (Erika
et al., 2012; Iqbal et al., 2012). Oxidation of elemental S produces sulfate and sulfate
complexes of Fe, enhancing Fe solubility and its bioavailability. Iron solubility in S amended
(low pH) soil along with organic amendments increases the processes in addition to the
action of protons [Fig. 3.2 (a)]. Organic amendments such as BC and poultry manure have
potential to improve soil physico-chemical and biological properties leading to increase Fe
mobilization and enhance its bioavailability (Du Laing et al., 2009; Xu et al., 2013). Iron is
not absent in mineral soil but due to high pH (Sabbagh et al., 2012) and calcareousness, its
availability decreases to plants (del Campillo and Torrent, 1992).
Quick transformation of Fe from soluble to relatively insoluble oxides and hydroxides in
calcareous soil, some adsorbing material was used followed by mineralization of these
adsorbed Fe compounds using pH manipulating agent like elemental S. Photosynthesis and
respiration greatly depend on availability of Fe; it is the key component of chlorophyll and
respiratory enzymes. Iron deficiency causes physiological alterations of leaf morphology,
xylem vessel morphology, stomatal conductance, leaf hydraulic conductance, and leaf water
potential in chlorotic leaves (Eichert et al., 2010). In the current study, it was observed that
Fe application along with BC in pH manipulated soil improved physiological parameters like
photosynthetic rate, transpiration rate and stomatal conductance. The mechanism behind this
might be solubilization of Fe by using S that reduced soil pH and increases nutrient

40
availability as reported by Wang et al. (2006a). Furthermore, it is a well-established fact that
biochar has high cation exchange capacity that provides essential nutrients to plants via
exchange processes (Graber et al. 2014; Kappler et al., 2014)
In the current study, plant growth was significantly improved by using Fe with BC in
unamended and acidified soil (Table 3.3). Several mechanisms might be operating behind the
growth improvement of wheat. Rhizospheric pH manipulation by H+ released in soil desorbs
Fe from the BC surface and increases its mobility to plants. Along with Fe, several other
essential nutrients also release from soil and biochar surfaces (Kimetu et al., 2008) that are
important in plant growth. Agronomic parameters like shoot and root dry weight and grain
yield were significantly improved in treatments where Fe along with BC were applied. My
results are in line with Alburquerque et al. (2015) who reported that BC application along
with fertilizer enhanced plant growth and yield more as compare to alone biochar. Biochar
has additional indirect mechanisms that are also important from the plant growth point of
view, i.e. nutrient supply by reduced leaching, changes in redox condition of soil, high water
holding capacity, and microbial interaction thus increasing microbial biomass (Lehmann et
al., 2011). Yang et al. (2003) found that use of organic amendments improved micronutrient
accumulation in plants, which also corresponds to my results.
The microelement (i.e. Fe and Zn) concentration of wheat grain was significantly improved
using Fe and BC in acidified soil. The driving force behind this might be lower soil pH as is
evident from my incubation study (see Fig. 3.2). Mühlbachová et al. (2005) and Zhao et al.
(2010) showed that soil pH played the most important role in determining nutrient speciation,
solubility from mineral surfaces, movement, and eventually bioavailability of the essential
micronutrients. My findings are in line with Iqbal et al. (2012) in which elemental S draws
nutrients from natural and anthropogenic pools by solubilizing and their uptake by plants is
increased. Kingery et al. (1993) found elevated level of Zn in soils heavily fertilized with
poultry manure. According to Uprety et al. (2009) application of poultry manure (and other
manures) can considerably increase the micronutrient content in soil because these nutrients
are given as supplements in poultry feeds, and are present in the manure. Demir et al. (2010)
in this instance is inconsistent with my results, because he found that poultry manure could

41
be a good medium of growth as it increased leaf and fruit Zn level but concentration of Fe
remained unaffected.
Apart from soil factors, many nutritional factors are important in reducing Fe bioavailability
in cereal grains. Among these factors, phytic acid is most important. Phytic acid is the
primary storage form of phosphorus and forms complexes with important minerals like Fe
and Zn, thus inhibiting their absorption (Jin et al., 2009). Reddy et al. (2000) found that grain
phytic acid correlated negatively with Fe absorption, and in my study, phytate concentration
decreased in wheat grain when soil pH was decreased with S. I found that as bioavailable Fe
concentration increased, phenolic compounds decreased significantly by using Fe with BC in
acidified soil. Tako and Glahn (2010) showed that increased Fe concentration can limit the
polyphenolic inhibitory effect on Fe absorption provided that polyphenolic content remains
constant as mineral (Fe, Zn) contents are not deficient.
Modern agriculture emphasizes not only the quantity of produce but the quality as among its
top priorities. Neutral soil pH promotes the precipitation of poorly ordered Fe minerals
(ferrihydrite), whereas acid and submerged conditions enhance the mobilization of Fe
minerals (Claudio et al., 2014). Along with H+ released from acidity that is produced by S,
roots excrete organic acids in the rhizosphere that further improve Fe availability. Organic
acids stimulate long-distance transport of the metal in Fe deficient plants (López-Millán et
al., 2001).
Previously, carbonaceous products have been used for Zn biofortification of crops (Gartler et
al., 2013). To the best of my knowledge, BC is being reported for the first time for Fe
biofortification of wheat in acidified calcareous soil. Regarding other quality parameters, I
observed that wheat fiber and ash contents were significantly improved by using BC along
with Fe in acidified soil (Table 3.4).
To increase fiber contents of food some supplementation practices have been used.
Traditionally, fiber supplementation has been focused on the use of milling by-products of
wheat and corn (Matz, 1991). Although food supplementations and fortification efforts are
successful in developed countries in developing countries their success remains limited
(Bouis et al., 2011). The protein content of wheat grain may vary between 10-18% of the
42
total dry matter (Zuzana et al., 2009). In the present study, protein contents of wheat grain
increased by using Fe along with BC + S Ferritin, an iron storage protein, binds Fe as a non-
toxic form and ferritin iron is bioavailable to humans as ferrous sulphate (Arosio et al.,
2009). In the last decade, attempts have been made for biofortification of staple food crops
by introducing the ferritin gene (Drakakaki, 2005; Masuda et al., 2013). Ferritin content
increased in wheat grain proving that agronomic biofortification of wheat with Fe by
reducing anti-nutrition factors can be an effective strategy to combat Fe deficiency in
humans. Ferritin is not only a bioavailable Fe source for humans but it also provides Fe when
its supply is scarce and protects plants from oxidative stress (Briat et al., 2010a, b).
3.5 Conclusions
In conclusion, soil acidification with S improved Fe solubilization and its bioavailability.
Iron application along with organic amendments (BC and PM) was an effective strategy to
enhance Fe biofortification of wheat in acidified soil. Ferritin concentration in wheat grain
grown in calcareous soil could be enhanced by optimizing Fe bioavailability through
acidification and its translocation in plant body could serve as a valuable approach to fight
the malnutrition problem in the world. Among the organic amendments (BC and PM), BC
applied with Fe in acidified calcareous soil remain a best treatment with regards to Fe
bioavailability.

43
Chapter 4
Exploiting iron bioavailability and nutritional value of maize grain through
combined use of ferrous sulphate with biochar and poultry manure in
sulfur treated low pH calcareous soil
Abstract
Iron (Fe) deficiency hasaffects half of the world population and is considered one of the most
widespread nutritional problems. Factors such as pH, calcium carbonate, and bicarbonate in
calcareous soil reduces iron availability to crops and limit its concentration in grain. In the
present study, we evaluated the potential of Fe fertilizer combined with organic amendments
like biochar (BC) and poultry manure (PM) for Fe biofortification of maize grain in sulfur
(S) treated low pH calcareous soil. Elemental sulfur (S) was used to lower soil pH and
solubilize Fe. Application of Fe combined with amendment (BC) and S significantly
increased root (69%) and shoot (86%) dry weight, grain weight (28%), photosynthetic rate
(74%), transpiration rate (57%), and stomatal conductance (33%), respectively compared to
the control. Similarly, combined application of Fe + BC + S increased starch (34%), protein
(64%) and fat (100%) while the anti-nutrient phytate and polyphenol contents decreased up
to 29 and 40%, respectively over the control. Application of Fe with BC + S gave maximum
increase of Fe and ferritin (120 and 170%, respectively), while S + PM increased Zn and Mn
up to 40 and 60%, respectively over the control This study indicated that applying Fe with
BC + S is beneficial for crop growth, enhances the nutrient status of grains and reduces the
phytate and polyphenol contents in maize grain.
Key words: bioforticication, zinc, manganese, ferritin, protein, phytate

44
4.1 Introduction
Iron deficiency is a serious problem for crops grown on calcareous soils (Laird et al., 2010).
High pH and high carbonates in calcareous soil limit Fe availability (Bloom and Inskeep,
1988; Fanrong et al., 2011). Iron fertilization in calcareous soil is not effective because Fe+2
rapidly converts into unavailable Fe+3 forms, which causes poor mobility of Fe in soil
(Rengel et al., 1999; Cakmak et al., 2010a).
Among the cereals crops maize (Zea mays L.) is the third most important cereal crop (Sleper
and Poehlman, 2006). Maize-based diets are deficient of necessary micronutrients such as Fe,
Zn, provitamin A, and the people who depend on such diets have stunted growth, high
incidence of anemia, less physical activity, and infant morbidity (Saltzman et al., 2013). In
the developing world the majority of the population depends on cereal-based foods
containing low concentrations of bioavailable Fe (Cakmak et al. 2010a; Bouis et al. 2011). In
maize, phytic acid and polyphenols are considered to be the major inhibitors of iron
bioavailability because they interact with food constituents such as Fe and make them
unavailable, but the inhibitory effect on Fe absorption can be limited by increasing Fe
bioavailability (Tako et al., 2013).
Iron biofortification is a sustainable and cost-effective agricultural strategy to alleviate
malnutrition, particularly of rural families that do not have enough money and lack
healthcare facilities (White and Broadley, 2009; Bouis and Welch, 2010). With Fe
biofortification, the main target is to increase the bioavailable of Fe in cereals especially
maize. Ferritin is a non-heme protein that binds Fe in a non-toxic form and ferritin Fe is
bioavailable in humans as ferrous sulphate (Lonnerdal, 2007). Ferritin in seeds thus appears
not only to be an Fe storage mechanism, but also protects plants from oxidation (Briat et al.,
2010b). Numerous attempts have been made to biofotify staple food crops by introducing
ferritin gene in the last decade (Masuda et al., 2013).
Different approaches have been used to enhance Fe bioavailability in maize by
manipulating soil factors that reduce Fe bioavailability. Elemental S decreases the soil pH
(Iqbal et al., 2012) and enhances the phytosiderophore formation process, which is closely
45
linked with Fe uptake by plants (Cao et al., 2002; Jin et al., 2005). Interestingly, S is also
involved in Fe transport in xylem and increased accumulation of Fe in plants (Na and Salt,
2011).
Similarly, organic chemicals released from organic matter serve as chelaters and enhance
solubility of nutrients and increase metal availability to plants (McCauley et al., 2009).
Among the different forms of organic amendments, biochar (BC) and poultry manure (PM)
are considered the best because of their long lasting effect on soil health and nutrient
availability (de Cesare Barbosa et al., 2015). High nitrogen content in PM enhances Fe
concentration in plants by increasing the efficiency of Fe transporter proteins such as yellow
stripe 1 (YS1) in the root cell membrane (Bujoczek et al., 2000; Curie et al., 2009). Biochar
acts as an electron shuttle in redox mediated reactions and affects mineral forms of Fe
(Kappler et al., 2014). Redox catalytic activity is associated with biochar solubilized Fe with
decreasing soil pH (Graber et al., 2014). Biochar affects soil fertility by changing soil
physico-chemical and biological properties leading to nutrient mobilization (Jeffery et al.,
2015).
Studies have been conducted on Fe biofortification with organic amendments in unaltered
and problem soils but to the best of my knowledge, no such study was yet reported on Fe
biofortification in maize with different organic amendments in pH manipulated (i.e.
acidified) calcareous soil. The main objective of this study was to: 1) lower soil pH in
calcareous soil with elemental S; and 2) determine how Fe fertilizers and organic
amendments in unmended and low pH soil affect plant growth and Fe bioavailability.
4.2 Materials and Methods
4.2.1 Soil acidification
Experimental soil was acidified using elemental sulfur (S) as previously described in chapter
3.
4.2.2 Pot experiment

46
Soil used in experiment was obtained from a field area of Institute of Soil and Environmental
Sciences, University of Agriculture Faisalabad, Pakistan. Before conducting the experiment,
all pieces of stone and straw were removed by passage through a 2-mm sieve and analyzed
for physico-chemical properties. Soil texture was clay loam (sand 39%, silt 29%, clay 32%)
as determined by hydrometer method (Gee and Bauder, 1986). Saturated soil paste had a pH
value 7.81. Organic matter, 0.68%, was determined by Walkley-Black method (Jackson,
1962). Calcium carbonate (CaCO3) was 23.9 g kg-1 soil as determined by acid dissolution
(Allison and Moodie, 1965). Plant available Fe and Zn was 4.1 and 0.6 ppm, respectively, as
extracted by 0.005 M DTPA (Lindsay and Norvell, 1978). Phosphorus extracted by Olsen
method (Watanabe and Olsen, 1965) was 7.7 mg kg-1, nitrogen 115 mg kg-1 (Bremner and
Mulvaney, 1982) and extractable potassium 102 mg kg-1 (Richards, 1954).
Each experimental pot was filled with 12 kg sieved soil. Two organic amendments biochar
(BC) and poultry manure (PM) were applied at rates of 1% w/w. Biochar was made by
using Eucalyptus as a feed stock at 400°C temperature. Biochar used in this experiment had
the following properties: pH 7.64, EC 1.96, organic matter 59.1%, Fe 308 mg kg-1, Zn 282
mg kg-1. Poultry manure was collected from a poultry farm at the University of Agriculture
Faisalabad with following properties: pH 7.31, EC 5.1, organic matter 53.3%, Fe 382 mg kg-
1, Zn 501 mg kg-1.
Prior to seed germination in the pots, soil pH was lowered by elemental S (the rate of S was
selected from the incubation study). Iron was applied at a rate of 0.0075 g kg-1 by using
FeSO4·7H2O source at the time of sowing the maize crop. Recommended doses of nitrogen
(N), phosphorus (P), and potassium (K) were applied at rates of 0.11, 0.08, and 0.06 g kg-1,
respectively as urea, single super phosphate, and sulfate of potash. Full doses of P and K
were applied at the time of sowing while N was applied in 2 split doses. Half the dose of N
was applied at sowing and the remaining half was applied 30 days later. Four seeds of
maize cultivar “DK 6714” were sown in each pot at a depth of 2 cm and one seedling per pot
was maintained after emergence. Deionized water was used to irrigate the pots when required
throughout the crop season. Treatments comprised in this experiment are detailed in Table
4.1.

47
Forty-five days after sowing gaseous exchange parameters such as photosynthetic rate (A),
transpiration rate (E), stomatal conductance (gs) and sub-stomatal conductance (Ci) were
measured by using CIRAS-3 (PP System Amesbury, MN, USA). At maturity plants were
harvested and grain was separated by manual threshing. After washing with deionized water
and shade drying, samples were kept in a forced-air-driven oven (Tokyo Rikakikai, Eyela
WFO-600 ND, Tokyo, Japan) at 60°C until constant weight was obtained, then thedry weight
of root, shoot, and grain was recorded.
4.2.3 Grain analysis
For chemical and biochemical analysis, whole grain samples were ground in a mill (IKA
Werke, MF 10 Basic, Staufen, Germany) and passed through a 0.5-mm sieve. For metal (Fe,
Zn, Mn) determination, known weight of ground subsamples of whole grain were digested in
a di-acid mixture (HNO3:HClO4 ratio of 2:1) (Jones and Case, 1990). In the digested
samples, concentration of Fe, Zn, and Mn were measured by atomic absorption
spectrophotometer (PerkinElmer, AAnalyst 100, Waltham, USA).
Protein concentration in whole grain sample was determined using the Bradford colorimetric
method (Bradford, 1976). Fat was determined by dry extraction method using a Soxhlet
apparatus (AOAC, 2003). For starch estimation in grain the iodine test was performed by
using glucose as standard in the procedure described by Sullivan (1935). The concentration
was measured at 660 nm on a spectrophotometer. Phytate was determined by the method
described by Haug and Lantzsch (1983). After grinding of whole grain sample, 60 mg of
each sample was extracted with 10 mL of 0.2 N HCl at room temperature for 2 h and the
concentration was measured on a spectrophotometer (Shimadzu, UV-1201, Kyoto, Japan).
Whole grain sample for total polyphenol determination was prepared following the method
described by Gómez-Alonso et al. (2007). Polyphenol from prepared grain sample was
measured by using the Folin–Ciocalteau method (Aguilar-Garcia et al., 2007). Absorbance
was measured by spectrophotometer at 760 nm via the calibration curve of gallic acid and
expressed as gallic acid equivalent. For ferritin quantification, 5 g grain sample was prepared
as seed in the method described by Lukac et al. (2009) with some modifications. Ferritin
concentration was measured by direct ELISA (enzyme linked immunosorbent assay) using

48
antibody (Rabbit anti-ferritin) coated microtiter wells and mouse monoclonal anti-ferritin
antibody as antibody enzyme (Horseradish peroxidase) conjugate solution and absorbance
was measued at 450 nm (Catalog Number: BC-1025). All devices used for chemical and
biochemical analysis were soaked in diluted HNO3 (pro analysis quality, Merck) and were
washed with deionized water.
4.2.4 Statistical analysis
A completely randomized design was used to conduct pot experiment. The data obtained for
plant growth, physiological, chemical, and biochemical parameters were subjected to one-
way analysis of variance (ANOVA) using Statistix 8.1 software. Significance difference of
treatment means were separated by post hoc Tukey’s test (P < 0.05).
4.3 Results
4.3.1 Soil acidification
Four different rates (1.5, 2, 2.5, 3 g kg-1 soil) of S were applied to soil and incubated in
laboratory conditions. Soil pH decreased gradually in the pots receiving 2.5 g S kg-1 soil and
remained stable after 4 weeks of soil incubation in normal and organic amended soil.
Application of S in soil with BC and PM lowered soil pH consistently as shown in Table 4.1.
Addition of S decreased soil pH about 1.3-1.5 units in biochar and poultry manure amended
soil with 2.5 g S kg-1 soil, but without organic amendments (BC and PM 1% w/w) S lowered
soil pH up to 1.3-1.5 units in non-planted pots. Data of soil pH and treatments under
experiment are presented in Table 4.1.
4.3.2 Root-shoot dry mass and grain weight
Root and shoot dry mass was significantly increased by combined application of Fe and BC
in S-treated low pH soil by up to 69 and 86%, respectively compared to the control (Table
4.2). Iron applied with S and with PM + S increased root dry weight up to 43 and 60%,
respectively and shoot dry weight 60 and 73%, respectively compared to the control. The
minimum 17% increase in shoot dry weight and 9% increase in root dry weight were

49
observed when only S was applied. Iron applied with BC and PM significantly increased
grain yield in both unamended and S treated soil compared to the control, as depicted in
Table 4.2. Among these treatments, Fe + BC combined with S remained best compared to
other treatments, which increased grain weight 28% compared to the control.
4.2.3 Gaseous exchange measurements
Gaseous exchange measurements of maize plants showed substantial increase with soil
applied Fe and organic amendments (BC and PM) with and without S (Table 4.2). Significant
increase in the photosynthetic rate (A) of maize was observed by using Fe with BC in S
treated low pH soil, which was 74% higher than the control. Separate application of Fe and
Fe + PM increased by 49 and 64% the photosynthetic rate, respectively compared to the
control in S treated low pH soil. Iron applied with PM in S treated low pH soil increased
transpiration rate up to 49% compared to the control. Among all treatments Fe + BC in S
treated low pH soil increased maximum transpiration rate 57% over the control. Iron applied
as a single treatment and applied with BC increased stomatal conductance up to 18 and 26%,
respectively in unamended soil. However, in S treated low pH soil the same treatments
showed 27 and 33% increase, respectively, compared to the control. Fe applied with PM in S
treated low pH soil increased by 31% the stomatal conductance compared to the control.
Data in Table 4.2 showed that Fe applied as a single treatment, and with S, decreased sub-
stomatal conductance up to 14 and 23%, respectively compared to the control. The highest
decrease of 35% relative to the control for sub-stomatal conductance was observed in the
treatment where Fe was applied with BC in S treated low pH soil.

50
Table 4.1 Effect of sulfur applied with iron, biochar and poultry manure on soil pH
Treatments Abbreviation Iron solubilizing agent (Elemental S) Soil pH before crop
sowing Sulfur Corresponding H+ ions
(g kg-1 soil) (mmol kg-1 soil)
Control C 7.8±0.01
Biochar BC 7.5±0.03
Poultry Manure PM 7.6±0.02
Iron Fe 7.7±0.01
Iron + Biochar Fe + BC 7.5±0.02
Iron + Poultry Manure Fe + PM 7.6±0.02
Sulfur S 2.5 156.25 6.6±0.01
Sulfur + Biochar S + BC 2.5 156.25 6.5±0.02
Sulfur + Poultry Manure S + PM 2.5 156.25 6.5±0.03
Sulfur + Iron S + Fe 2.5 156.25 6.5±0.02
Sulfur + Iron + Biochar S + Fe + BC 2.5 156.25 6.4±0.01
Sulfur + Iron + Poultry
Manure
S + Fe + PM 2.5 156.25 6.4±0.02
Sulfur applied with treatments in each pot having 12 kg soil and its effect on soil pH after 4 week of sulfur oxidation as observed in each pot
before sowing crop.
BC: biochar (1% w/w), PM: poultry manure (1% w/w), Fe: iron (15 kg ha-1)

51
Table 4.2 Growth and physiological attributes of maize as affected by different organic and inorganic amendments
Treatments
Shoot DW
Root DW
Grain
Weight
A
(μmol CO2 m-2s-1)
E
gs
Ci
(g) (μmol H2O m-
2s-1)
(μmol m-2s-1) (μmol mol-1)
C 9.5 f 3.5 d 100.3 e 14.8 g 7.9 e 216.7 e 165 a
BC 11.7 d-f 4 cd 105.8 de 16.2 e-g 8.9 c-e 231 de 153 ab
PM 11.3 ef 3.9 cd 105 de 15.6 fg 8.8 de 225.3 de 155.7 ab
Fe 13.2 b-e 4.3 b-d 112.6 c-e 17.8 d-g 9.9 b-e 255.3 b-d 142 b-e
Fe + BC 14.4 a-d 4.9 a-c 119.1 a-c 20.8 b-d 10.5 a-d 273 ab 133 c-e
Fe + PM 13.6 b-e 4.6 b-d 116.3 b-d 19.4 c-f 10 b-e 267.3 a-c 137.3 b-e
S 11.1 ef 3.8 cd 106.3 de 17.5 d-g 8.9 c-e 223 e 158 ab
S + BC 12.5 c-e 4.4 b-d 111.6 c-e 19.9 c-e 9.6 b-e 237 c-e 143.3 a-d
S + PM 12.0 d-f 4.2 cd 110.3 c-e 18.7 c-f 9.3 c-e 231.3 de 147 a-d
S + Fe 15.2 a-c 5 a-c 121.8 a-c 22.1 a-c 11.1 a-c 275.3 ab 127 d-f
S + Fe + BC 16.3 a 5.9 a 128.8 a 25.8 a 12.4 a 288.67 a 107.7 f
S + Fe + PM 15.7 ab 5.6 ab 125.6 ab 24.3 ab 11.8 ab 285 ab 119.7 ef
HSD0.05 2.8 1.4 12.4 4.1 2.2 32 22.5
Quantities sharing similar letters are statistically similar to each other at p ≤ 0.05
BC: biochar (1%), PM: poultry manure (1%), Fe: iron (15 kg ha-1), S: sulfur (2.5 g kg-1 soil).

52
4.2.4 Mineral concentration of grains
Iron, Zn, and Mn contents in maize grains were significantly improved by using soil applied
Fe and organic amendments (BC and PM) with and without S compared to the control (Table
4.3). Iron applied as a single treatments increased Fe conents in maize grain up to 47% but Fe
applied in S amended soil, grain Fe contents increased up to 86%, over control. Biochar and
PM applied with Fe, increased grain Fe contents up to 59 and 66%, respectively, while BC
and PM applied with Fe in S amended soil increase grain Fe contents up to 116% and 102%,
respectively, over control. Among all treatments, Fe + BC combined with S remained the
best for total Fe in grain, compared to other treatments, compared to the control.
Sulfur applied in soil as a single treatment and with BC or PM increased Zn concentration
21, 14, and 40%, respectively compared to the control. Grain Zn concentration was increased
up to 8, 14, and 19%, when Fe was applied alone, with BC, or with PM in S treated low pH
soil, respectively compared to the control. Iron applied with BC and PM in S treated low pH
soil increased Mn concentration up to 40 and 46%, respectively compared to the control. The
highest increase in Mn concentration was observed in treatment where organic amendments
(BC and PM) were applied in S treated low pH soil, which was 49 and 60% higher, than the
control.
4.3.5 Biochemical contents (starch, fat, and protein) in grain
Application of Fe with organic amendments (BC and PM) in the presence and absence of S
significantly improved starch, fat, protein, and ferritin contents in grain compared to the
control (Figure 4.2). Among all treatments, combined allocation of Fe + BC with S remained
best compared to other treatments, and increased starch 34%, protein 64% and fat 110% in
grain compared to the control. Iron and Fe + PM added in S treated low pH soil increased
starch 21 and 27%, fat 69 and 90%, and protein 42 and 55%, respectively relative to the
control.

53
Table 4.3 Grain minerals and biological attributes as affected by different organic and
inorganic amendments
Treatments Fe
Zn
(mg kg-1 DW)
Mn
Starch
Protein
(%)
Fat
C 41.3 g 28.2 c-e 14.9 ef 41.9 e 5.3 e 2.16 e
BC 40.9 g 30.3 b-d 16.7 d-f 42.3 de 5.9 de 2.53 c-e
PM 48.1 fg 33.3 a-c 19.4 b-d 43.6 c-e 6.1 c-e 2.63 c-e
Fe 60.9 de 25.1 de 15.1 ef 45.6 b-e 6.5 c-e 2.93 cd
Fe + BC 65.7 d 22.8 e 14.1 f 48.9 a-d 6.9 b-d 3.43 b-d
Fe + PM 68.7 cd 24.5 de 14.9 f 49.7 a-d 7.1 b-d 2.43 c-e
S 48.1 fg 34.2 a-c 18.8 b-e 42.2 de 5.7 de 2.96 cd
S + BC 54.6 ef 32.1 bc 22.2 ab 44.8 c-e 6.5 c-e 2.8 cd
S + PM 51.4 ef 39.7 a 23.9 a 45.4 c-e 6.4 c-e 2.66 bc
S + Fe 77.2 bc 30.4 b-d 17.9 c-f 50.7 a-c 7.5 a-c 3.66 bc
S + Fe +
BC
89.3 a 32.5 bc 20.8 a-c 56.2 a 8.7 a 4.36 a
S+ Fe + PM 83.7 ab 33.5 a-c 21.8 a-c 53.1 ab 8.2 ab 4.1ab
HSD0.05 9.9 6.9 3.8 7.7 1.5 1.4
Quantities sharing similar letters are statistically similar to each other at p ≤ 0.05
BC: biochar (1% w/w), PM: poultry manure (1% w/w), Fe: iron (15 kg ha-1), S: sulfur (2.5 g
kg-1 soil)

54
4.3.6 Polyphenol, phytate, [phytate[:[Fe], and [phytate]:[Zn] ratio
A significant decrease of polyphenol contents in maize grain was observed when Fe and
organic amendments with S were applied [Fig. 4.1 (d)]. Treatments where Fe and Fe + BC
and Fe + PM were applied in S treated low pH soil decreased polyphenol contents up to 30,
40, and 36%, respectively compared to the control. Iron applied alone and with S decreased
phytate content up to 12 and 23%, respectively. The maximum decrease in phytate content of
25 and 29%, respectively relative to the control occured in treatments where Fe was applied
with BC and with PM in S treated low pH soil. In all treatments where Fe was applied with
organic and inorganic amendments (BC, PM, and S) [phytate]:[Fe] ratio significantly
decreased [Fig. 4.1 (b)]. Iron applied as a single treatment and with S decreased
[phytate]:[Fe] ratio 40 and 58%, respectively compared to the control. Maximum decrease
of 67% in [phytate]:[Fe] ratio was observed in the treatment where Fe was applied with BC
followed by treatment where Fe was applied with PM (63%) in low pH soil compared to the
control. In S treated low pH soil, [phytate]:[Zn] ratio decreased significantly in treatments
where organic amendments were applied alone or with Fe [Fig. 4.1 (c)]. Maximum decrease
in [phytate]:[Zn] ratio of 37% was observed when Fe + BC was applied followed by
treatments where Fe was applied with PM in S treated low pH soil compared to the control (a
37% decrease).
4.3.7 Ferritin in grain
Soil applied Fe and organic amendments (BC and PM) with and without S significantly
improved ferritin contents in maize grain (Fig. 4.2). Fe applied as a single treatment and
combined with S increased ferritin contents 105 and 131%, respectively compared to the
control. Fe application along with BC and PM in S amended low pH soil significantly
increased ferritin contents up to 170 and 160 %, respectively more than the control.

55
(HSD value: phytate 1.9, polyphenol 1.7, [phytae]:[Fe] ratio 7.3, [phytae]:[Zn] ratio 9.7)
Fig. 4.1 a- d. Phytate, Grain [phytate]:[Fe] and [phytate]:[Zn] ratio, and polyphenol
concentration in maize grain measured in various Fe treatments under unamended and pH
manipulated calcareous soil. Values are the means and different letters indicate significant
differences at p<0.05 (n=3).
a a abbc cd cd
abbc a-c
dee e
0
5
10
15
20
25
Ph
ytat
e m
g g-1
see
d a
a ab
cdde de
b
b-dbc
eff ef
0
10
20
30
40
50
[ph
ytae
]:[F
e]
rati
o b
aab
bc
a aa
cd
cd cdd d
0
20
40
60
80
100
[ph
ytae
]:[Z
n]
rati
o
c
a ab aba-d a-e b-e
aba-c a-d
c-ee de
0
2
4
6
8
10
Po
lyp
he
no
l mg
g-1 s
ee
d
Treatments
d

56
(HSD value: Grain ferritin concentration 0.1)
Figure 4.2 Ferritin concentration in maize grain measured in various Fe treatments in
unamended and acidified calcareous soil. Values are the means and different letters indicate
significant treatment differences at p<0.05 (n=3).
4.4 Discussion
Today, different approaches are used to increase Fe content and bioavailability in cereals and
other crops. On a long term basis, Fe content can be improved by increasing Fe solubilization
in soil for plant uptake and storage in edible parts of plants (Grusak and Della Penna, 1999).
Increased levels of reducing agents, chelating agents, siderophoress and enzymes in the
rhizosphere and transporter proteins in roots could increase Fe uptake from soil to plant
body. Nutrient interaction can change their absorption rate and compete during translocation
into the plant body. Thus, attempts have been directed to enhance absorption of essential
mineral elements (Fe, Zn, Cu, Mn) in maize and reduce the concentration of anti-nutrients
that interfere with mineral nutrient absorption (White and Broadley, 2009).
d dd
cbc
c
dd d
b
a ab
0
0.1
0.2
0.3
0.4
0.5
0.6
Ferr
itin
µgg
-1se
ed
Treatments

57
In under developed countries increasing food insecurity is a common problem causing
malnutrition so, a more productive, more nutritional and sustainable agriculture system is an
urgent need.
In the current study, the potential of inorganic and organic amendments was evaluated for
improving growth and Fe biofortification of maize in S treated low pH soil. Organic
amendments significantly enhanced plant growth and development by increasing soil organic
matter, availability of plant nutrients, and improved soil physical properties such as structure,
porocity and water holding capacity (Azeez et al., 2010; Demir et al., 2010). Biochar
application positively affected growth and yield of maize (Uzoma et al., 2011) and rice (Asai
et al., 2009). Roots are known to excrete hydroxyl ions and protons in response to excess
uptake of anion and cations, respectively, and to solubilize mineral nutrient ions in response
to mineral nutrient deficiency (Hinsinger et al., 2009).
Novak et al. (2009) stated that soil amended with biochar increased bioavailability of Zn, K
and Mn. The increased concentrations of Fe, Zn and Mn in the present study were
presumably caused by nutrient solubilization and enhanced plant growth with PM and BC.
Laird et al. (2010) reported that physical and chemical properties of BC, such as high surface
area, high internal porosity, and presence of polar and non-polar surface sites and high cation
exchange capacity can lead to nutrient absorption and availability. In my study Fe added with
organic amendments (BC and PM) in acidified calcareous soil significantly increased
photosynthetic parameters except sub-stomatal conductance and the results are more
prominent with BC compared to PM. Increased photosynthetic parameters by Fe + BC + S
treatment might be due to increased growth and elevated level of nutrients in plants. Park et
al. (2011) reported improved plant growth and nutrient uptake in mustard by using chicken
manure derived biochar in problem soil.
In various parts of the world, human bioavailable micronutrient deficiency is a common
problem due to low micronutrient levels in soils, interaction of macro- and micronutrients,
use of high analysis fertilizers with low amounts of micronutrients, use of high yielding
cultivars and less attention to organic amendments (Fageria et al., 2002; Fageria et al., 2008).
To improve micronutrient uptake and to enhance their bioavailability in cereal grains,
strategies can be divided into two different groups. In the first group, micronutrient

58
bioavailability can be improved by practices such as minimizing climatic factors that affect
mineral availability and managing fertilizer application practices optimized based on soil
properties (pH, EC etc.) (Fageria et al., 2002). In the present study, added micronutrient
fertilizers were efficiently utilized and recovered (in grains) with integrated use of organic
amendments (BC and PM) and S in calcareous soil. In the second group, crop genotypes
within species can be used that work efficiently in micronutrient uptake and translocation of
largely into grain (Fageria et al., 2008).
In the present study, ferritin concentration increased up to 170% as Fe concentration
increased in grain. Ferritin-Fe is bioavailable to humans as FeSO4 and does not denature in
the human elementary tract (Theil et al., 2004). The main function of ferritin in seeds is
protection against free Fe damage through Fenton oxidation (Briat et al., 2010b). Thus, it can
be seen that a number of different barriers affect Fe translocation and accumulation into
grain. Iron accumulation in the grain was not only dependent on Fe uptake from soil but also
depended on its translocation from xylem to phloem. Sulfur enhances transportation of Fe in
the xylem of plants because it decreases pH in the apoplast and because of its effect on
nicotinamide formation which enhance Fe transport in phloem (Hu and Xu, 2002; Na and
Salt, 2011). Sulfur affects the regulation of apoplast pH and Eh and is reported to increase
the transport of Fe in phloem of plants, as well as enhance the deposited form of Fe in the
apoplast (Toulon et al., 1992). Research suggests that while maize tends to maintain nutrient
concentration in the grain within predetermined limits, application of fertilizers could alter
the balance (Rengel et al., 1999), so understanding the factors that influence the balance
might be important when selecting for accumulation of a specific nutrient, especially for Fe
or Zn. However, in the present study, we observed significantly higher Fe and Zn
bioavailability with integrated use of chemical fertilizer and organic amendments in S treated
low pH calcareous soil. As seed developed in the parent plant, concentration of nutrients
depended on soil type, nutrient availability, crop species and to the lesser extent, season and
cultivar (Ascher et al., 1994). Contrary to our results, Gregorio et al. (2000) illustrated that
nutrient concentration in grains is highly dependent on crop cultivars/genotypes rather than
nutrient fertilizer management.

59
Mineral bioavailability from grains is quite complex but [phytate]:[Fe] and [phytate]:[Zn]
ratio can be used to access bioavailability of Fe or Zn in food (Hallberg et al., 1989; Hussain
et al., 2012a). In the current study, as the Fe and Zn concentration increased in the grain of
maize, that ultimately reduced the phytate, [phytate]:[Fe] and [phytate]:[Zn] ratio. This might
be due to the higher uptake of these nutrients in maize. Polyphenols and phytate in the plant
body act as strong chelators and bind positively charged minerals (Zn2+, Mn2+ , Fe2+),
proteins and amino acids in insoluble form by forming insoluble complexes in the plant body
as well as in vitro digestion (Cheryan, 1980). In the present study, phytate and polyphenol
decreased while protein, fat, and starch increased significantly with Fe application with BC
in acidified calcareous soil. Our results are supported by the findings of Fang et al. (2008)
and Yadav et al. (2013) where all quality parameter were significantly improved by the
supply of micronutrients and organic amendments but ferritin enrichment in grains is novelty
of present experiment.
4.5 Conclusions
Combined application of Fe with organic amendments (BC and PM) has high potential to
confer beneficial effects on maize growth and it can be assumed that plant growth promotion
and Fe bioavailability are due to mineral solubilization and uptake in S amended low pH soil.
Among the organic amendments, BC remains as best for plant growth and yield. The Fe
biofortified maize grains by using Fe with BC in acidified calcareous soil could serve as a
valuable strategy to fight malnutrition problem in the world. However, multi-sites field trials
with this approach need to be performed to warrant successful performance in the field.

60
Chapter 5
Evaluating growth, yield, and iron bioavailability of rice in acidified
calcareous soil
Abstract
Iron (Fe) bioavailability is a major issue of high pH calcareous soils. Iron fertilization in
calcareous soils is ineffective due to its rapid conversion into unavailable form. This study
evaluated the effect of Fe fertilizer with organic amendments by manipulating calcareous soil
pH. Before transplanting rice seedlings, soil pH was lowered 0.5-0.6 units by using 0.25%
elemental sulfur (S). For biofortification, Fe fertilizer (FeSO4·7H2O) 0.0075 g kg-1 was
applied with biochar (BC) and poultry manure (PM) as treatment plan. The combined
application of Fe along with BC and PM enhanced plant growth, physiology, and yield as
well as improved nutritional value of grain in acidified calcareous soil. Data also suggested
that in S treated low pH soil treatments increased Fe mobilization and translocation from root
to grain. Grain Fe concentration raised up to 200% and 180% in acidified soils where Fe was
applied with BC and with PM. Ferritin concentration significantly increased 300% and 273%
by using Fe with BC with PM, respectively in acidified soil. Iron applied with BC decreased
phytate and polyphenol up to 18% and 47%, respectively in S treated low pH soil. As
reported earlier, a small fraction (2-15%) of the Fe from plant sources is bioavailable to
humans. It can be concluded that increasing levels of ferritin in rice will be helpful at
eliminating Fe deficiency in humans.
Keyword: biofortification, Zn, phytate, polyphenol, protein, ferritin

61
5.1 Introduction
Food is a basic necessity of life. Most recent statistics from the FAO indicate that 1/9th of the
developing world is food insecure (FAO, 2014). This leads to micronutrient malnutrition and
causes hidden hunger. The main cause of this micronutrient malnutrition is consumption of
monotonous food that is poor in microelements (Bouis et al., 2011). Human population use
various foods to fulfill their daily requirement of calories. A major part of daily dietary intake
is provided by cereals. Among cereals, rice is the second most consumed cereal worldwide
after wheat. According to the latest figures of the FAO, rice consumption is about 509.7
million tons worldwide (FAO, 2015). But, rice is low in important micronutrients like Fe and
Zn (Welch and Graham, 2004).
Iron acts as a cofactor for several enzymes that take part in various metabolic processes.
Susceptibility to disease also increases in Fe-limiting conditions (Chatterjee et al., 2006).
Iron deficiency leads to loss of immunity, impaired circulatory systems resulting in anemia,
and poor work performance. In short, Fe malnutrition leads to devastating impacts on human
health (Stein, 2010).
High pH and calcareousness are two major soil factors that limit Fe availability to crops
(Cifuentes et al., 1993). Iron changes its oxidation state very quickly from soluble Fe+2 to
relatively insoluble Fe+3 oxides and hydroxides, thus cause Fe deficiency in soil (Celik and
Katkat, 2007). Along with soil factors, some nutritional factors are also potential inhibitors of
Fe absorption such as phytate and polyphenolic compounds (Welch, 2002). Phytate makes
complexes with nutrient elements like Ca, Fe, Zn and Mg during digestion of food and
reduces their bioavailability, thus playing a role in malnutrition (Jin et al., 2009). On the
other hand ferritin is a bioavailable form of Fe as FeSO4 in humans (Briat et al., 2010b).
Transgenic and genetic approaches have been used to increase ferritin concentration in many
crops including rice and soyabean (Vasconcelos et al., 2003). Among potential approaches
maximizing ferritin concentration in wheat, cassava, rice, or beans is decreasing phytate,
which is also a possible solution of Fe malnutrition, but not very practical due to less farmer
intrust for growing such varities (Cakmak et al., 2010a).

62
Food fortification, diversification, and supplementation programs require continual funding
and mainly target urban populations, which excludes poor populations (Saltzman et al.,
2013). Biofortification is a cost effective approach that promises to provide sufficient mineral
contents to a target population (Bouis et al., 2011; Saltzman et al., 2013).
Agronomic biofortification of food crops is considered the most sustainable approach. In
high pH calcareous soil agronomic biofortification will be ineffective unless one can reduce
soil pH. The major issue in calcareous soil is quick transformation of soluble Fe compounds
to less soluble oxides and hydroxides (Celik and Katkat, 2007). Rapid transformation of Fe
and increasing its availability by soil pH manipulation using acidifying material could be a
useful approach. Different studies reported that microbial oxidation of elemental sulfur leads
to mineral solubilization that increases nutrient availability (Iqbal et al., 2012; Wu et al.,
2014).
Organic matter is an important source of mineral nutrients but due to harsh climatic
conditions of Pakistan it mineralizes soon after its application (Azam et al., 2001). Among
the different forms of organic amendments, biochar and poultry manure are considered best
because of their long lasting effect on soil health and nutrient availability (Lorenz and Lal,
2014; de Cesare Barbosa et al., 2015). Biochar is considered the most sustainable approach to
enhancing soil fertility and crop productivity (Liu et al., 2013). Positive effects of biochar,
having acidic nature, on Fe solubilization by decreasing soil pH have also been reported
(Graber et al., 2014). Most recently, carbonaceous products have been used for Zn
biofortification of crops (Gartler et al., 2013). To be the best of our knowledge no study has
been conducted for Fe biofortification in rice in acidified soil. The airm of the present study
was to evaluate the effect of Fe fertilizer in organic amended (BC and PM) in unamended
and S amended calcareous soil to enhance Fe bioavailability.
5.2 Materials and Methods
5.2.1 Plot preparation and soil properties
Plots of 4*4 m2 sizes were prepared for the rice experiment in a field area of the Institute of
Soil and Environmental Sciences University of Agriculture Faisalabad, Pakistan. Prior to

63
using the soil for acidification and transplanting of rice seedlings, it was homogenized to
remove stones and extra particles of crop residue. For soil characterization randomized soil
samples (0–15 cm depth) were collected from each plot, air-dried, passed through a 2 mm
sieve, and mixed thoroughly for measurement of various physicochemical properties. Soil
texture was clay loam (sand 40%, silt 27%, clay 33%) as determined by hydrometer method
(Gee and Bauder, 1986). Saturated soil paste had pH value 7.71. Organic matter was 0.62%
as determined by Walkley-Black method (Jackson, 1962). Calcium carbonate (CaCO3) as
estimated by acid dissolution (Allison and Moodie, 1965) was 5.9%. Plant available Fe and
Zn as extracted by 0.005 M DTPA (Lindsay and Norvell, 1978) was 4.1 and 0.52 ppm,
respectively as measured on an atomic absorption spectrophotometer (PerkinElmer,
AAnalyst 100, Waltham, USA). Phosphorus extracted by the Olsen method (Watanabe and
Olsen, 1965) was 7.6 mg kg-1, nitrogen 113 mg kg-1 (Bremner and Mulvaney, 1982), and
extractable potassium 101 mg kg-1 soil (Richards, 1954).
5.2.2 Soil acidification
Experimental plot was acidified with elemental sulfur (S) as previously described in chapter
3.
5.2.3 Crop experiment
Rice seed (super basmati kernel) were obtained from Ayub Agriculture Research Institute
(AARI), Faisalabad, Pakistan. Healthy, uniform, clean seeds were transferred into cloth bags
and soaked in water for 24 hours. After soaking, all seeds were placed under shade and
covered for 48 hours, sprouted seeds were grown in small plots. The experiment area was
divided into three blocks with a total of 36 plots and 25-days old uniform seedlings were
transplanted into each plot maintaining row-to-row and plant-to-plant distance of 22.5 cm.
0.0075 g kg-1 Fe was applied by using FeSO4·7H2O . Two organic amendments (i.e. BC and
PM) were applied at a 1% (w/w) rate. Biochar was made by using Eucalyptus as a feed stock
at 400 C temperature. Biochar used in the experiment had the following properties: pH 6.84,
EC 1.96, organic matter 59.1%, Fe 308 mg kg-1, Zn 281.8 mg kg-1.

64
Poultry manure was collected from the poultry farm of the University of Agriculture
Faisalabad. Poultry manure properties were: pH 6.91, EC 5.1, organic matter 53.3 %, Fe
291.9 mg kg-1, Zn 501.3 mg kg-1. Recommended doses of nitrogen (urea), phosphorus (single
super phosphate), and potassium (sulfate of potash) (i.e, 0.06, 0.045, 0.03 g kg-1) respectively
were applied. Full doses of phosphorus and potassium were applied at the time of sowing but
nitrogen was applied in three different doses. At booting stage, photosynthetic parameters
such as photosynthesis (A), stomata conductance (gs), sub-stomatal conduction (Ci), and
transpiration (E) rate were measured by a CIRAS-3 (PP System. Amesbury, MN, USA).
When 90% grain became golden yellow the rice crop was harvested. After shade drying and
washing with distilled water samples were placed in a forced-air-driven oven (Tokyo
Rikakikai, Eyela WFO-600 ND, Tokyo, Japan) at 60°C until constant weight was obtained,
then dry weight of shoot and grain were recorded.
5.2.4 Grain analysis
Whole grain samples were ground in a mill (IKA Werke, MF 10 Basic, Staufen, Germany) to
pass through a 0.5-mm sieve. Known sample was placed in muffle furnace at 550 Cº for
complete oxidation of organic matter until the appearances of gray white ash (AOAC, 2003).
Ground subsamples of known weights were digested in a di-acid mixture (HNO3:HClO4 ratio
of 2:1) for metal analysis (Jones and Case, 1990). Iron, Zn, and Mn concentrations in the
digest were measured by an atomic absorption spectrophotometer (PerkinElmer, AAnalyst
100, Waltham, USA). Total protein concentration in grains was determined with the
Bradford colorimetric method (Bradford, 1976). For fiber determination a moisture free and
ether extracted sample of fiber made of cellulose was first digested with dilute H2SO4 and
then with dilute KOH solution. Fat was determined by dry extraction method using a Soxhlet
apparatus (AOAC, 2003).

65
Table 5.1 Sulfur effect on soil pH amended with Fe (0.0075 g kg-1), biochar (1% w/w), and poultry manure (1% w/w).
Treatments Abbreviation Iron solubilizing agent (Elemental Sulfur) Soil pH before
crop sowing Sulfur Corresponding H+ ions
(% w/w) (mmol kg-1 soil)
Control C 7.7±0.02
Biochar BC 7.5±0.03
Poultry Manure PM 7.6±0.02
Iron Fe 7.7±0.02
Iron + Biochar Fe + BC 7.5±0.03
Iron + Poultry Manure Fe + PM 7.6±0.02
Sulfur S 0.25 156.25 7.2±0.02
Sulfur+Biochar S + BC 0.25 156.25 7.2±0.01
Sulfur + Poultry Manure S + PM 0.25 156.25 7.2±0.02
Sulfur + Iron S + Fe 0.25 156.25 7.2±0.01
Sulfure + Iron + Biochar S + Fe + BC 0.25 156.25 7.1±0.02
Sulfure + Iron + Poultry
Manure
S + Fe + PM 0.25 156.25 7.1±0.03
Sulfur applied with treatments in each plot having a 4*4 m2 area and its effect on soil pH after 4-5 weeks of sulfur oxidation as
observed in each sub-plots.

66
The undigested residue collected after digestion was ignited and loss in weight after ignition
was registered as crude fiber (AOAC, 2003). For starch estimation in whole grain the iodine
test was used using glucose as a standard (Sullivan, 1935). The starch concentration was
measured at 660 nm on a spectrophotometer. For phytate determination, each 60 mg sample
of finely ground grain was extracted with 10 mL of 0.2 N HCl at room temperature for 2 h
with continuous shaking. Phytate in the extract was determined by an indirect method (Haug
and Lantzsch, 1983) and the final concentration was measured on a spectrophotometer
(Shimadzu, UV-1201, Kyoto, Japan). Total polyphenol determination in rice grain sample
was prepared as described by Gómez-Alonso et al. (2007). From the prepared grain sample
polyphenol was measured by using the Folin–Ciocalteau method (Aguilar-Garcia et al.,
2007). Absorbance was measured by spectrophotometer at 760 nm via a calibration curve of
gallic acid and expressed as gallic acid equivalent. For ferritin quantification 5 g whole grain
sample was prepared as seed method as described by Lukac et al. (2009) with slight
modification. Ferritin concentration was measured by developing direct ELISA (enzyme
linked immunosorbent assay) using anti-body (rabbit anti-ferritin) coated microtiter wells and
mouse monoclonal anti-ferritin antibody as antibody enzyme (horseradish peroxidase)
conjugate solution and absorbance was measured at 450 nm (Catalog Number: BC-1025,
California). All devices used for chemical and biochemical analysis were soaked in diluted
HNO3 (pro analysis quality, Merck, Germany) and washed with deionized water.
5.2.5 Statistical analysis
The field experiment was conducted in a completely randomized block design. The data
obtained with respect to growth, physiological, chemical, and biochemical parameters were
subjective to one-way analysis of variance (ANOVA) using statistix 8.1® software.
Significant differences of treatment means were separated by post hoc Tukey’s test (P <
0.05).
5.3 Results
5.3.1 Plant growth and yield

67
Application of Fe fertilizer with organic amendments (PM and BC) significantly improved
plant growth and yield attributes. In nonacidified soil, separate application of Fe, BC, and
PM increased 1000 grain weight by 13.5, 11 and 7%, respectively compared to the control.
Meanwhile in S treated low pH soil, compared to the control, using Fe in combination with
BC and PM improved 1000 grain weight by 34 and 30%, respectively (Table 5.2). Using Fe
with BC increased straw yield 47% in unacidified soil (Table 5.2) compared to the control.
On the other hand in S amended acidified soil, an 80% improvement in straw yield was
obtained by using Fe with BC compared to its respective control. Compared to the control,
Fe application combined with BC increased paddy yield 34% in unamended soil. Maximum
increase in paddy yield was observed by using Fe fertilization with BC (56%) in S amended
acidified soil compared to the control.
5.3.2 Photosynthetic measurements
Lowering of soil pH together with provision of Fe tended to improve all photosynthetic
parameters (Table 5.2). Application of Fe with BC improved photosynthetic rate by 93% in S
amended soil compared to the control. The use of poultry manure along with Fe accelerated
the light reaction of rice by 81% in S treated acidified soil compared to the control.Compared
to the control, application of Fe alone gave only a 18% increase in transpiration rate in
unacidified soil. Likewise, compared to the control, application of Fe with BC and PM
increased transpiration rate by 39 and 34 %, respectively in acidified soil.In unacidified soil,
application of Fe with PM significantly improved stomatal conductance by 45% while the
same treatment showed a 59% increase in stomatal conductance in acidified soil compared to
the control. In unacidified soil reduction in sub-stomatal conductance was 19.2%, 23.3%, and
20.4% by using Fe alone, Fe and BC, and Fe and PM, respectively compared to the control
in S-acidified soil. Compared to the control, the greatest decrease in sub-stomatal
conductance (31.1%) was recorded in treatments where Fe was applied with BC in S-
acidified soil.

68
5.3.3 Grain Zn and Fe concentration
Mineral concentration (Zn, Fe) of rice was significantly improved by using Fe along with
organic amendments (BC and PM) in S–acidified soil (Table 5.3). Iron fertilization alone was
inefficient in unacidified soil as there was not a marked change in grain Fe (i.e. 60%).
Results depicted in Table 3 show that in unacidified soil, treatment receiving PM alone
increase grain Fe concentration by 13% over the control. The effect of PM was improved in
S-acidified soil. Compared to the control, grain Fe increased up to 180% when Fe was
applied with PM in S-acidified soil. On the other hand, the highest increase in grain Fe
concentration was observed by combined use of Fe and BC in S-acidified soil and that was
200% significantly high over control. Separate application of BC and Fe reduced grain Zn
concentration 3 and 4%, respectively in unamended soil compared to the control. Among the
organic amendments, PM had a positive effect on grain Zn contents (i.e.11% greater
compared to the control). Maximum increase in grain Zn (i.e. 32% greater concentration) was
obtained by using Fe with PM in acidified soil as compared to the control.
5.3.4 Grain quality parameters (Ash, Fat, Fiber and Starch)
Quality of rice grain was markedly influenced by application of Fe, BC, and PM in S-
acidified soil (table 5.3). Ash contents of rice grain were improved when Fe was used with
(60%) and without (30%) PM in unacidified soil compared to the control. The greatest
increase in ash contents (i.e.102%) was observed when Fe was applied with BC in S –
acidified soil over its respective control. In unacidified soil, use of Fe with BC and PM
increased fiber contents by 47.1 and 44.1%, respectively compared to the control. In S
acidified soil, fiber contents were improved 70.8 and 82.4%, respectively by using Fe with
PM and with BC compared to the control. In the case of starch contents, in unacidified soil
starch contents were 9, 10, and 14% greater by separate application of BC, PM, and Fe
fertilization, respectively compared to the control. Maximum increase in starch contents (i.e.
41%) was observed in treatment where Fe was applied with BC in S-acidified soil compared
to the control.

69
Table 5.2 Growth, yield and photosynthetic measurements of rice.
Treatment 1000 GW Straw Grain
Yield Yield
(g) (ton ha-1)
A
(μmol CO2 m-2 s-
1)
E
(μmol H2O m-
2s-1)
Gs
(mmol H2O m-2
s-1)
Ci
(μmol mol-1)
C 20 e 8.4 f 4.1 e 12.1 h 3.8 f 315 e 245 a
BC 22.2 c-e 9.9 ef 4.6 c-e 14.7 e-h 4.1 d-f 351 e 231.7 a-c
PM 21.4 de 9.6 ef 4.5 de 14.1 f-h 3.9 ef 333.7 e 236 ab
Fe
Fe + BC
22.7 c-e
24.7 a-c
10.7 de
12.4 b-d
4.8 c-e
5.5 bc
17.3 c-e
19.1 b-d
4.5 cd 410.7 cd 198 b-e
4.6 bc 453 bc 188 de
Fe + PM 24.3 a-d 12.3 b-d 5.2 b-d 17.2 c-f 4.5 c 459.3 bc 195 c-e
S 21.6 de 10.3 d-f 4.5 de 13.9 gh 3.9 f 322.7 e 224.7 a-d
S + BC 23.9 b-d 11.6 c-e 4.8 c-e 16.1 d-g 4.3 c-e 369.3 de 214 a-e
S + PM 22.8 c-e 10.8 de 4.7 c-e 15.4 e-g 4 ef 353.7 e 212.7 a-e
S + Fe
S + Fe + BC
24.9 a-c
26.9 a
13.4 a-c
15.2 a
5.9 ab
6.4 a
20.2 a-c
23.4 a
5 ab 493.7 ab 180.3 de
5.3 a 518.3 a 186.7 e
S + Fe + PM 26.1 ab 14.3 ab 6 ab 21.9 ab 5.1 a 501.3 ab 186.3 de
HSD0.05 ` 2.9 2.2 0.9 3.2 0.4 55.2 39.4
Quantities sharing similar letters are statistically similar to each other at p ≤ 0.05
1000 grain weight (G W), Straw yield (S Y), paddy yield (P Y), photosynthesis rate (A), transpiration rate (E), stomatal
conductance (gs) and sub-stomatal conductance (Ci) measured in each experiment plots (4*4 m2) as influenced by Fe fertilizer
and organic amendments (BC and PM) in unamended and acidified soil.

70
Table 5.3 Grain minerals and biological attributes as affected by different organic and
inorganic amendments
Treatment Fe Zn
Ash
Fat
Fiber
Starch
(mg kg-1 DW) (%)
C 33 gh 19.3 de 0.43 h 0.76 f 0.34 f 48.5 e
BC 30.9 h 18.7 e 0.52 gh 0.87 d-f 0.39 d-f 52.9 de
PM 37.5 f-g 21.6 b-e 0.56 hg 0.9 c-f 0.42 d-f 53.6 de
Fe 53 d 18.5 e 0.66 c-f 0.96 b-e 0.47 c-e 55.6 c-e
Fe + BC 69.1 c 19.6 c-e 0.71 b-d 1 a-d 0.5 a-d 63.7 a-c
Fe + PM 64 c 22.9 a-c 0.69 c-e 1.1 ab 0.49 b-e 64.8 ab
S 41.6 e-g 20.7 b-e 0.48 gh 0.81 ef 0.37 ef 51.3 de
S + BC 45.6 d-f 19.3 de 0.6 d-g 0.94 b-e 0.44 d-f 53.1 de
S + PM 51.5 de 23.4 ab 0.58 e-g 0.91 c-f 0.43 d-f 54.9 c-e
S + Fe 86.8 b 20.9 b-e o.73 bc 1.08 a-c 0.58 a-c 59 b-c
S + Fe + BC 99.6 a 22.6 a-d 0.87 a 1.2 a 0.62 a 68.4 a
S + Fe + PM 92.8 ab 25.6 a 0.83 ab 1.1 ab 0.6 ab 66.5 ab
HSD0.05 10.6 3.4 0.13 0.17 0.13 9.1
Quantities sharing similar letters are statistically similar to each other at p ≤ 0.05
Iron applied with BC and with poultry manure increased fat content up to 31.6 and 44.7%,
respectively compare to the control. Maximum fat contents were obtained when Fe was used
with biochar (i.e. 57.9% greater than the control).
5.3.5 Phytate, Phytate/Fe and Phytate/Zn molar ratio, Polyphenol

71
Application of Fe with organic amendments (BC and PM) in S-acidified soil significantly
influenced anti-nutrient and bioavailable contents of Fe in rice grain [Figure 5.1, 5.2]. In
unacidified soil application of Fe without any organic amendment reduced phytate contents
by 9% compared to the control [Fig. 5.1 (a)]. Iron added as a single treatment increased
phytate content in rice grain grown under S-amended soil by 13.9%. On lowering of soil pH
with S, application of Fe with BC and with PM reduced phytate contents by 18 and 16%,
respectively compared to the control in S-acidified soil.
Likewise, the phytate:Fe ratio was significantly influenced by application of Fe with PM and
BC in S-acidified soil [Fig. 5.1 (b)]. In unacidified soil, when Fe was used with BC and PM,
reduction in the phytate:Fe ratio was 58 and 54%, respectively compared to the control. But
in acidified soil this reduction reached up to 73 and 70%, respectively compared to the
control. As far as the phytate:Zn ratio was concerned, it was significantly reduced by
application of Fe with organic amendments (BC and PM) in S-acidified soil [Figure 5.1 (c)].
In unacidified soil, combined application of Fe with BC and with PM reduced the phytate: Zn
ratio by 13.9 and 25%, respectively compared to the control. Compared to the control,
combined used of Fe with BC and PM reduced the phytate:Zn ratio by 30.8 and 37.1%,
respectively in S-acidified soil. Concentrations of total polyphenol in rice grain were also
influenced by soil pH, BC and PM [Figure 5.1 (d)]. Data suggested that, compared to the
control, application of Fe with PM significantly reduced polyphenol of rice grain by 29% in
unacidified soil. Lowering soil pH with S remarkably reduced polyphenol by 47.1 and 41.2%
when Fe was applied with BC and with PM, respectively, compared to the control.
5.3.6 Ferritin and protein contents
Protein contents of rice grain were significantly influenced by application of Fe with BC and
PM in unacidified and S- acidified soil as depicted in [Figure 5.2 (a)]. Lowering of soil pH
with S improved protein contents in all treatments as compared to control. Maximum
increased in protein contents were obtained in treatment where we Fe were used with BC i.e.
58% and with PM 56 % over control in S treated low pH soil. Results indicated that in
unacidified soil, as compared to control application of Fe with BC increased ferritin contents
by 135% over control [Figure 5.2 (b)].

72
[HSD0.05= phytate (a) 1.5, Grain [phytate]:[Fe] ratio (b) 6.7, Grain [phytate]:[Zn] ratio (c) 11.4,
polyphenol (c) 0.35
Figure 5.1 Phytate, polyphenol conc. (mg g-1 seed), phyate:Fe ratio, and phytate:Zn ratio as
determined in rice grain with various iron (Fe), Biochar (BC), poultry manure (PM), and
sulfur (S) treatments in alkaline calcareous soil. Sulfur was applied 4 weeks, before
transplanting of seedlings for complete oxidation of elemental sulfur.
ab a a-cb-f d-f c-f a-d a-e a-e d-f f ef
0
5
10
15
20
Ph
ytat
e m
g g-1
a
aba
bc
eff-h fg
cdde
d-f
gh h gh
0
10
20
30
40
50
Gra
in [
Ph
ytat
e]:
[Fe
] ra
tio
b
ab a
b-dab
b-dd-f
b-d a-c
d-f c-eef
f
0
20
40
60
80
100
Gra
i [P
hyt
ate
]:[Z
n]
rati
o
c
aa-c a-c
b-ed-f c-f
aba-d a-d
d-ff ef
0
0.5
1
1.5
2
Po
lyp
he
no
l mg
g-1
d

73
The highest increase in ferritin content was observed when Fe was applied with BC in S-
acidified soil and that was 300% more than the control.
(HSD0.05 Protein (a) 0.75, Ferritin (b) 0.025
Figure 5.2 a, b. Protein (%) and ferritin (µg/g) contents determined in rice grain with various
iron (Fe), Biochar (BC), poultry manure (PM), and sulfur (S) treatments in alkaline
calcareous soil. Sulfur was applied 4 weeks, before transplanting of seedlings for complete
oxidation of elemental sulfur.
gfg f
c-ec cd
fgd-f ef
bc
a ab
0
1
2
3
4
5
6
7
8
9
Pro
tein
(%
)
a
ee
de
cd
c c
ede de
b
aab
0
0.02
0.04
0.06
0.08
0.1
0.12
0.14
0.16
Ferr
itin
(µ
g g-1
)
b

74
5.4 Discussion
The most recent challenge that we are facing is “hidden hunger” and it needs special
attention. The root cause of hidden hunger is provision of food that is lacking in essential
microelements (i.e. Fe, Zn). Rice biofortification is needed because it is the principal source
of food for more than 75% of the world population (Anjum et al., 2007). Biofortified foods
may cut the need for supplements; as Shekhar (2013) said “Biofortification is a win-win
scenario”.
The major issue regarding Fe is not its deficiency but its availability. Fe is not deficient in
mineral soil but high pH (Tazeh et al., 2012) and high carbonate (del Campillo and Torrent,
1992) limit its availability. In addition to these soil factors, some nutritional factors (i.e.
phytic acid and phenolic compounds) also reduce Fe bioavailability in the human digestive
tract (Welch, 2002) and cause Fe malnutrition. Thus, a sustainable approach is needed to
increase Fe availability in soil for plant uptake and resultantly improve Fe nutrition in the
human body (Chojnacka et al., 2011).
The current study was planned to investigate the effect of organic amendments (PM, BC) and
Fe fertilizer on Fe biofortification of rice in unacidified and acidified calcareous soil.
At high pH Fe+2 ions (the plant available form) converts into less soluble Fe+3 oxides and
hydroxides and disappears from the soil solution (Cakmak et al., 2010a). To reduce this
process soil pH manipulation might be a good approach, which was my proposed hypothesis.
For slow and steadiy soil acidification and nutrient availability, elemental S is considered
best (Iqbal et al., 2012). The application of elemental S reduced soil pH to approximately a
neutral level (pH 7) after 4 weeks. Microbial oxidation of elemental S presumably produces
enough sulfuric acid to lower the soil pH.
The effect of Fe fertilization along with BC and PM, in acidified soil was observed for Fe
biofortification in rice. All physiological parameters like photosynthetic, transpiration rate,
stomtal and sub-stomatal conductance were significantly (p≤0.05) influenced by Fe applied
with BC and PM in S-acidified soil. Photosynthetic rate was markedly influenced by BC and
PM in acidified soil. By lowering of soil pH, H+ are produce that displace metal cations

75
adsorbed on the BC surface. Iron is a key component of prophyrin ring of chlorophyll. As
soon as Fe solubilization increases the amount of available Fe for plant uptake, it also
increases the photosynthetic activity of the plant. It is a well-known fact that biochar supports
the microbial community by providing nutrients, carbon source and shelter (Wardle et al.,
2008). Thiobacillus produces sulfuric acid that lowers the soil pH (Ullah et al., 2013).
Poultry manure has plant nutrients that can play an important role in crop productivity
(Slaton et al., 2013). Watts et al. (2010) showed that poultry manure can be considered a soil
conditioner that improves organic matter contents. Thus, release of nutrients from
mineralization of PM suplies Fe for plant uptake that improves the physiology of the rice
plant but more positive results were obtaind when Fe was applied in PM amended soil. In the
same way, transpiration rate and stomatal conductance of rice was significantly improved by
lowering soil pH and application of Fe fertilizer with BC and PM.
Application of Fe with BC and PM significantly improved plant growth and yield. It is
suggested that application of biochar may improve fertilizer use efficiency (van Zwieten et
al., 2010). On lowering of soil pH, indirect release of all essential nutrients that are needed
for plant growth from BC surface along with Fe could have improved plant growth. Biohar is
known to improve soil physical properties that ultimately improve plant health and yield. My
results are in line with Rajkovich et al. (2012), Zhang et al. (2012), and Akhtar et al. (2015)
in which application of bichar increased yield of maize and wheat. Improvement in straw
yield and grain weight might also have the same mechanisms. Application of PM also
significantly improved plant growth and yield as PM is considered a source of nutrients
(Kaiser et al., 2010). Many essential nutrients like N, P are provided by PM that could
increase plant growth and yield. Also PM could help to improve water content needed for
plants (Watts et al., 2010). Our results are in accordance to the reporting of Woli et al. (2015)
and Ruiz Diaz et al. (2011) where grain yield was improved by the application of PM.
Metal analysis for the effects of BC on agronomic crops (i.e. wheat, rice, maize etc.) has
been done and positive impacts have been observed (Hammond et al., 2013; Graber et al.,
2014). In the current study we used BC and Fe alone and in combination to investigate the
grain mineral (Fe, Zn) contents of rice. Grain Fe contents were significantly improved in
treatments having both BC and Fe in acidified soil. The effectiveness of inorganic fertilizer

76
may have been improved when used with BC (Schulz and Glaser, 2012; Alburquerque et al.,
2013). This could have been increased the mineral content of grain in our study. This
confirmed the investigation of Hoefer et al. (2015) in which nutrient solubilization increased
by the application of S.
Application of Fe fertilizer along with BC reduced the Zn contents of rice grain. Biochar
might increase the mineral contents of the rhizosphere that in turn enhance the phyto-
availability of Fe and Zn. But due to the competition of similar ions for plant such as Zn
contents may be less than Fe, but greater than the control. Similar results were reported by
Beesley and Marmiroli (2011) in which application of BC reduced the Zn contents due to its
high sorption capacity and low Zn content in soil. Application of Fe with PM increased the
Fe contents of rice grain. Our results are inconsistent with previous reports of Demir et al.
(2010) in which fruit Zn contents were significantly improved by the application of PM.
The ultimate objective of Fe biofortification is either to increase the bioavailable portion of
Fe or decrease anti-nutrients (i.e. phytate or polyphenolics). In the current study I used BC
and PM to enrich rice grain with Fe in acidified soil. Biochar provides microhabitats to
microbes that produce Fe chelating compounds that further regulate Fe mobility to grain.
Thus, the total available portion of Fe increased and phytate contents decreased. Some
genotypic characteristics (YSI, YS2) may be involved or soil native conditions (i.e. organic
matter contents may increase Fe translocation into seed) (Chandel et al., 2010). Findings of
Reddy et al. (2000) support our results in which phytate contents decreased as ferritin
concentration increased in grain.
Previously, biochar has been used for Zn biofortification of crops by Gartler et al. (2013).
After phytate, polyphenolic compounds are also potential inhibitors of Fe absorption in the
human body (Scholz-Ahrens and Schrezenmeir, 2007; Gautam et al., 2010). In the present
study we found that as bioavailable Fe content increased, polyphenol concentration decreased
significantly by using Fe with BC in acidified soil. Studies also support our findings as
investigated by Tako and Glahn (2010), in which white bean had more bioavailable Fe
compared to red been because of low polyphenol content in white bean. Increased Fe
concentration can limit the polyphenol inhibitory effect on Fe absorption provided that
polyphenol concentration remains constant as Fe content increases.

77
The Phytate:Zn ratio may decline as one increases the Fe supply. A phytate:Zn ratio <20 is
generally desirable for improving human nutrition (Turnlund et al., 1984; Weaver and
Kannan, 2002). Our results are similar to the results of Hussain et al. (2012a) in which Zn
supply reduced the Phytate:Zn ratio significantly.
Modern agriculture emphasizes not only the quantity of produce but the quality of produce..
Protein and ash contents are usually examined to evaluate the nutritional value of cereal food,
such as wheat, rice, and legumes (Graham, 1999) Rice is poor in protein( i.e. 8% in brown
and 7% in milled rice) compared to other cereals like wheat, corn, etc. (Anjum, 2007). Our
results are supported by the findings of Fang et al. (2008) and Yadav et al. (2013) who found
that the optimum quantity of Fe improved nutritional quality of grains but reduction of
phytate in grain and ferritin enrichment is a noval approach in our study.
5.5 Conclusions
The research finding suggests that Fe bioavailability and nutritional quality of rice can be
enhanced by combined use of Fe with organic amendments in acidified calcareous soil.
Among the organic amendments (BC and PM), Fe applied with BC (1% w/w) show more
pronounced effect on plant growth and yield in S-amensed calcareous soil. Iron applied in
unamended soil is not much effective as affective in S-amended calcareous soil. However,
for Fe biofortification, application of Fe is more effective when applied with BC in acidified
soil compared to PM or where Fe was applied alone.
78
Chapter 6
Iron bioavailability from rice: Rat study for determination of iron
absorption
Abstract
The main purpose of this paper was to investigate the fate of iron (Fe) biofortified grain in
alleviating Fe deficiency anemia (IDA). For this purpose, an experiment was conducted in
which Fe biofortified rice grain containing different concentration of Fe (40, 60, 85, 100 mg
kg-1 DW) were used as a feed source. As part of this experiment, two rat studies were
selected. Further, each study was comprised of five rat groups as anemic and non-anemic.
Rice grain purchased from the open market and containing 26 mg Fe kg-1 DW was used as a
control. Rats were slaughtered after eight weeks of feeding to examine organ weight, iron
content in organs, hematological parameters, serum chemistry, and ferritin in liver and
serum. The experiment showed that 60, 85 and 100 mg Fe kg-1 produced effective restorative
action returning the hemoglobin (Hb), mean corpuscular volume (MCV), red blood cells
(RBC), hematocrit (HCT), mean corpuscular hemoglobin (MCH), mean corpuscular
hemoglobin concentration (MCHC), serum and liver ferritin in anemic rats to normal values
or in some cases better than normal value. Iron biofortified rice grain had a significant
positive effective on Fe concentration in organs and serum biochemical parameters compared
to the controls. It was concluded that the Fe biofortified rice grain containing a high
concentration of Fe had significantly alleviated iron deficiency anemia. The results of this
research demonstrate that Fe biofortied rice grain should be further exploited as a safe,
efficient, and a new means to eradicate Fe deficiency anemia in human.
Key Words: biofortification, anemia, hematology, serum biochemistry, ferritin
79
6.1 Introduction
Worldwide, rice is the most widely used staple food as it comprises 50% of the world’s
consumption of staple food (Fitzgerald et al., 2009). In 2014, the Food and Agriculture
Organization of the United Nations reported worldwide rice consumption of about 509.7
million tons (FAO, 2014). However, rice based food lacks richness of essential
micronutrients, such as Fe (Bouis at al., 2011). Consequently, this leads to a common
hematological disorder and it has been estimated that 46% of children between the age of 5 to
14 and 56% of pregnant women suffer from anemia (Low et al., 2013). Compared to
developed nations, most of the population in developing countries does not have adequate
access to the recommended intake of Fe, resulting in Fe malnutrition and this has impacted
two billion people (54%) of the planet (WHO, 2011; Sperotto et al., 2012).
Gârban et al. (2013) reported that Fe is a vital trace element in living matter, which plays an
important role in the biosynthesis of hemoglobin and myoglobin. They further mentioned
that Fe acts as a cofactor for several enzymes that takes part in variety of metabolic
processes. Some fatal consequences of Fe deficiency reported in the literature are; loss of
immunity, damages to the human immune system, impaired circulatory systems, problems
with pregnancy, and decelerated intellectual development of babies, anemia, and poor work
performance (Black et al., 2008; Stein, 2010). The previous research also supported the
evidence that low hemoglobin can lead to symptoms such as low energy, faintness/dizziness,
painful perineal sutures, and tingling of fingers (Albacar et al., 2001; Etebary et al., 2010).
Iron deficiency could be due to two reasons: first, inadequate iron intake; second, its
insufficient absorption by the body (Naigamwalla et al., 2012). They further reported that
either of these will result in Fe deficiency anemia. On the other hand, Duque et al. (2014)
described various factors that influence the bioavailability and Fe absorption from the daily
diet. For example, the quantity and type of Fe in food, presence of inhibitors, and promoters
of Fe absorption affect an individual’s Fe status. Similarly, Wo´jciak et al. (2012) referred to
previous research on this topic and reported that due to low Fe intake, low tissue Fe was also
observed.
80
Rice contains strong anti-nutrients such as phytic acid that lead to anemia in developed and
developing countries (Mayer et al., 2008). Therefore, Gautam et al. (2010) reported that
phytate is the major inhibitor of Fe bio-availability. On the other hand, phytoferritin, an Fe
storage protein, which can preserve thousands of Fe atoms in non-toxic form, and ferritin Fe
are bio-available to humans as ferrous sulphate (Arosio et al., 2009).
A large stream of researchers (e.g., Bhutta and Haider, 2009; Hess and King, 2009) have
argued that Fe supplements have always been available in the world. However, various
efforts for supplementation programs, food fortification, and diversification require
substantial funding and resources (Saltzman et al., 2013). Therefore, very often such
programs end serving urban population whereas rural or poor population are left unserved
deprived. One solution to this is the use of ferrous sulfate (FeSO4) teblet, because it is of low
cost and, therefore, the most commonly used iron supplement. However, the use of ferrous
sulfate can cause various gastrointestinal side effects such as, nausea, abdominal pain and
diarrhea (Mimura et al., 2008).
The research community also argues that Fe deficiency cannot always be fulfilled by
supplements. Because it can develop undesirable consequences, for example, high doses of
Fe can have toxic effects on the human body (Bread et al., 2005; Golub et al., 2009).
Similarly, Powell et al. (2013) reported the negative impact of dietary fortified Fe intake on
patients’ lives and its low bioavailability and an antagonistic mechanism with other metals,
making it undesirable as a supplement.
Pro-oxidative properties of Fe are developed by catalyzing the conversion of hydrogen
peroxide and superoxide into hydroxyl radicals in the Fenton reaction (Jomova and Valko,
2011). However, King et al. (2008) cautioned that high doses of Fe can cause lipid
peroxidation and oxidative damage of body cells, particularly liver cells due to accumulation
of this element. The previous argument is further reinforced by Hori et al. (2010) who also
warned that this element can lead to protein and DNA damage.
Among different strategies to combat Fe deficiency in humans, Saltzman et al. (2013) argued
that biofortification is a cost effective approach that enables the provision of sufficient
amounts of mineral contents to the target population with a one time investment. Similarly,

81
Bouis et al. (2011) noted that biofortified staple foods might not deliver sufficient amounts of
minerals and vitamins per day, however, they can enhance micronutrient intake for resource
deprived people who consume them on a daily basis and, therefore, complement existing
approaches.
Rats are widely used as proxies for testing purposes particularly for agents that have high
toxic effect on human body. For example, the toxicity of metals and most likely preventive
and therapeutic effects (Brzóska et al., 2012; Al-Rejaie et al., 2013).
To the best of our knowledge, no comprehensive study has investigated whether different
concentrations of Fe biofortified grains can eradicate anemia and what concentration of Fe is
best for such purpose. Thus, the aim of this research was to investigate the potential effects of
Fe biofortified rice grain on anemic and non-anemic rats to with respect to iron deficiency
anemia elimination, hematological Fe status, biochemical parameters, and variation in body
organ mass . Furthermore, ferritin deposits in liver and serum of rat were also mapped.
6.2 Methodology
6.2.1 Iron biofortified grain production
Iron biofortified rice grain was produced in a field area of the Institute of Soil and
Environmental Sciences (ISES), University of Agriculture of Faisalabad, Pakistan. For
production of Fe biofortified rice grain, soil pH was was decreased with elemental S and rice
seedlings were grown with Fe fertilizer (FeSO4.7H2O) along with two organic amendments
i.e. biochar and poultry manure. After harvesting the rice, it was analyzed and grouped into
four different categories of grain having different levels of Fe (i.e. 40, 60, 85 and 100 mg
kg-1 DW). Rice were also purchased from the market that was not Fe biofortified and these
grains were considered the control having an Fe concentration of only 26 mg kg-1 DW.
Chemical analysis of Fe in rice was performed in the nutritional laboratory ISES, University
of Agriculture Faisalabad, Pakistan.
6.2.2 Animal

82
Eighty male Wistar strain albino rats having initial body weights of 100 ± 10 g were
purchased from the Institute of Pharmacy, Physiology, and Pharmacology in the University
of Agriculture Faisalabad, Pakistan. The rats were acclimated for 5 days prior to experiments
with an evaluation of their health status.
6.2.3 Anemia development
Forty male Albino rats were subjected to the procedure of anaemisation (by the method of
exclusion Fe from their diet). The Fe limited diet was prepared according to AIN (Americn
Institute of Nutrition) standards (Borel et al., 1991) eliminating iron citrate (III) as a source
of iron. For this purpose AIN-76A semipurified diet was mixed in rice grains diet to develop
anemia. Hemoglobin level in rat blood was monitored by collecting blood every seven days.
After 4 weeks of anaemisation, hemoglobin concentration in rat blood decreased to an
average value of ≤9.57 g dL-1, while normal rats have Hb concentration ≥11 g dL-1.
6.2.4 Experiment setup
The research was conducted in the Institute of Pharmacy, Physiology, and Pharmacology,
University of Agriculture Faisalabad, Pakistan. Rats were divided into two major groups
(non-anemic and anemic) and each major group was subdivided into five subgroups on the
basis of Fe concentration in grain, and treatments are:
Control: Rats feed a diet containing 26 mg Fe kg-1 DW of rice
G1: Rats feed a diet containing 40 mg Fe kg-1 DW of rice
G2: Rats feed a diet containing 60 mg Fe kg-1 DW of rice
G3: Rats feed a diet containing 85 mg Fe kg-1 DW of rice
G4: Rats feed a diet containing 100 mg Fe kg-1 DW of rice
The animals were kept in metabolic cages and maintained in an environmentally controlled
room at 24±2 C, with relative air humidity of 55±5%, and optimum lighting in a daily cycle,
(i.e., 12 h light/12 h darkness). The experiments were performed according to the rules and
protocols accepted by Local Ethical Commission for Investigations on Animals. Rats were
maintained in collective cages (4 rats per cage) as treatment plan. Rat feed was made by
following AIN standards and during the whole period of the experiment all rats were
supplied with deionized water to eliminate additional Fe sources. The animals with induced

83
Fe deficiency anemia before the beginning of experiment were divided into experimental
groups in such a way that the standard deviations in hemoglobin concentration inside the
groups were minimized.
All animals were observed twice a day for general appearance, behavior, signs of morbidity
and mortality. After feeding 8 weeks of Fe biofortified rice grains and a control diet, which
was not Fe biofortified, the animals were subjected to dislocation and decapitation. Rats
organs (liver, kidney, hurt and spleen) were collected and weighed.
6.2.5 Hematological Parameters
Blood was collected in EDTA-K2 solution tubes for the determination of red blood cell
(RBC) hematocrit (HCT), mean corpuscular volume (MCV), mean corpuscular haemoglobin
(MCH), mean corpuscular haemoglobin concentration (MCHC) and haemoglobin (Hb)
concentration using an automated hematology analyzer (Sysmex, Tokyo, Japan).
6.2.6 Serum analysis
A few mL of blood was allowed to stand for 2 hours and thereafter centrifuged at 1500g for
10 min to separate serum. The serum was stored at −80 ºC until further analysis. Serum urea,
protein, cholesterol, albumin, creatinine, and glucose were measured by kit method (Merck
Specialties Pvt. Ltd. Germany) according to the instructions from the manufacturer.
6.2.7 Determination of iron in rat organs and serum
Approximately 1 g of sample was wet mineralized in spectrally pure concentrated nitric acid
(65% HNO3 GR ISO Merck) in a microwave system MARS-5 (CEM). The resultant clear
mineralisate was quantitatively moved to 25-ml polypropylene flasks (PP) and made to
volume with deionized water. Iron content in mineralisate was determined using flame
atomic absorption spectrometry, with a wavelength of 248.3 nm and gap width of 0.15 nm,
(PerkinElmer, AAnalyst 100, Waltham, USA) (Zielińska-Dawidziak et al., 2014).
6.2.8 Ferritin quantification
The content of ferritin was determined in centrifuged blood serum and liver sample. Analyses
were performed by using a kit (Catalog Number: BC-1025, California) for rat ferritin

84
determination by the sandwich ELISA method. Ferritin isolation from the liver was
conducted according to the procedure described by Drysdale and Ramsay (1964).
6.2.9 Statistical analysis
The study analyses of results were conducted by employing descriptive statistics and one-
factor analysis of variance in SPSS Version 22 statistical software. Values are given as
means ± SD for eight rats in each group. Significant means were separated by Duncan’s
Multiple Range Test (DMRT) with significant probability (p < 0.05).
6.3 Results
6.3.1 Rat body organ weight
Among different body organs, liver weight was significantly increased in the non-anemic
group compared to the anemic group; however reduction in remaining body organs weight
was observed in the non-anemic group relative to the anemic group (Table 6.1). Maximum
increase (21%) in liver weight was observed in the group feed with diet containing 100 mg
Fe relative to the control in the non-anemic group. The minimum increase (5%) in liver
weight was observed in group feed with diet containing 40 mg Fe relative to the control in
the anemic group. Similarly, kidney weight was significantly increased (31%) within the
group feed with diet containing 85 mg Fe and group feed with diet containing 100 mg Fe
compared to the control in the non-anemic group; however in the anemic group, kidney
weight decreased with the Fe containing diet and the maximum decrease (7%) was observed
in group feed with diet containing 100 mg Fe compared to the control.
Similar results were found in heart and spleen weight; the maximum increase in weight was
observed (as a % of body mass) in the control of the anemic rats compared to the rest of the
rats groups (Table 6.1).
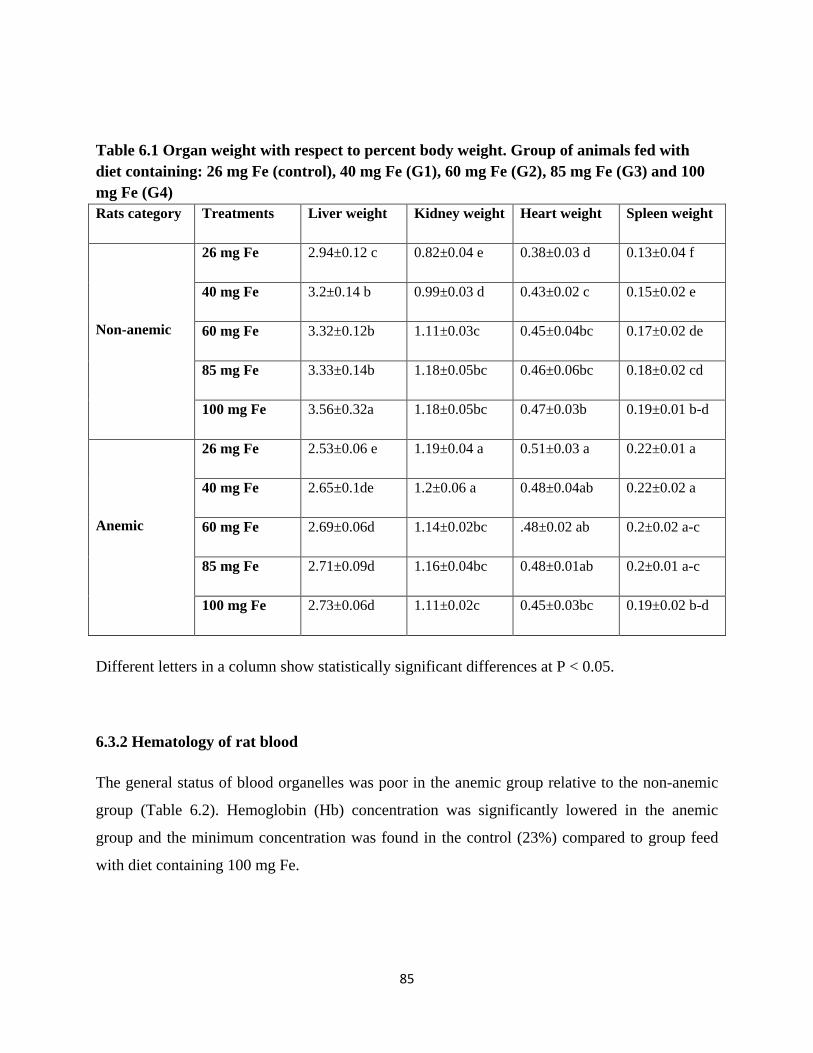
85
Table 6.1 Organ weight with respect to percent body weight. Group of animals fed with
diet containing: 26 mg Fe (control), 40 mg Fe (G1), 60 mg Fe (G2), 85 mg Fe (G3) and 100
mg Fe (G4)
Rats category Treatments Liver weight Kidney weight Heart weight Spleen weight
Non-anemic
26 mg Fe 2.94±0.12 c 0.82±0.04 e 0.38±0.03 d 0.13±0.04 f
40 mg Fe 3.2±0.14 b 0.99±0.03 d 0.43±0.02 c 0.15±0.02 e
60 mg Fe 3.32±0.12b 1.11±0.03c 0.45±0.04bc 0.17±0.02 de
85 mg Fe 3.33±0.14b 1.18±0.05bc 0.46±0.06bc 0.18±0.02 cd
100 mg Fe 3.56±0.32a 1.18±0.05bc 0.47±0.03b 0.19±0.01 b-d
Anemic
26 mg Fe 2.53±0.06 e 1.19±0.04 a 0.51±0.03 a 0.22±0.01 a
40 mg Fe 2.65±0.1de 1.2±0.06 a 0.48±0.04ab 0.22±0.02 a
60 mg Fe 2.69±0.06d 1.14±0.02bc .48±0.02 ab 0.2±0.02 a-c
85 mg Fe 2.71±0.09d 1.16±0.04bc 0.48±0.01ab 0.2±0.01 a-c
100 mg Fe 2.73±0.06d 1.11±0.02c 0.45±0.03bc 0.19±0.02 b-d
Different letters in a column show statistically significant differences at P < 0.05.
6.3.2 Hematology of rat blood
The general status of blood organelles was poor in the anemic group relative to the non-anemic
group (Table 6.2). Hemoglobin (Hb) concentration was significantly lowered in the anemic
group and the minimum concentration was found in the control (23%) compared to group feed
with diet containing 100 mg Fe.

86
However, a significant increase (12%) in Hb concentration was observed in group feer with
diet containing 100 mg Fe relative to its control in the non-anemic group (Figure 6.1).
Nevertheless, red blood cells (RBC) were significantly increased (28%) in rat blood with the
group feer with diet containing 100 mg Fe relative to the control in the anemic group. The
maximum increase (25%) in RBC was observed in the non-anemic group feed with diet
containing 100 mg Fe compared to the control (Table 6.2). Among other morphological
parameters, hematocrit (HCT), mean corpuscular volume (MCV), mean corpuscular
hemoglobin (MCH), and mean corpuscular hemoglobin concentration (MCHC) showed
higher concentration in rat blood in the non-anemic groups compared to the anemic groups
(Table 6.2). But in rats fed with Fe biofortified rice grain, the percent increase in all these
parameters was much higher in the anemic group compared to the non-anemic group. There
was a 44% increase in MCV observed in rat blood with group feer with diet containing 100
mg Fe relative to its control in the anemic group while only a 17% increase in MCV was
observed in rat blood with the group feed with diet containing 100 mg Fe relative to its
control in non-anemic conditions. All these parameters are considered indicators of
improvement in hematology in anemic rats with Fe biofortified rice grain having a high
concentration of bioavailable Fe.
6.3.3 Iron concentration in rat organs (liver, kidney, heart, and spleen) and serum
Iron concentration in different body organs remained meager in Fe deficient rats (anemic
group) and Fe recovery also remain on the lower side even with Fe application at different
concentrations (Table 6.3). Among different body organs like the liver, kidney, spleen, heart,
and serum, Fe concentration was significantly increased with Fe application in both anemic
and non-anemic groups; however, the increment was variable among both groups. Among
these organs the largest deposit of Fe was found in the spleen. Maximum increase in spleen
Fe (96%), liver (36%), kidney (64%), heart (39%) and serum (43%) was observed with the
group feed with diet containing 100 mg Fe, of anemic rats compared to their respective
control. In non-anemic rats, the highest deposited Fe in organs and serum was found in that
group of rat feed with diet containing 100 mg Fe, when compared with the control.

87
Table 6.2 Hematological parameters of rats in different groups. RBC - red blood cell, HCT - hematocrit, MCV - mean
corpuscular volume, MCH - mean corpuscular hemoglobin, MCHC - mean corpuscular hemoglobin concentration. Group
of animals fed with diets containing: 26 mg Fe (control), 40 mg Fe (G1), 60 mg Fe (G2), 85 mg Fe (G3) and 100 mg Fe (G4). Rats category Treatments RBC (%) HCT (%) MCV (fl) MCH (pg) MCHC (g/dL)
Non-anemic
26 mg Fe 5.13±0.13d 29.69±3.06 cd 47.41±4.55 cd 15.25±1.23 bc 26.4±2.19 cd
40 mg Fe 5.5±0.19 c 32.03±2.65 bc 50.50±8.33 bc 15.75±1.52 bc 27.95±2.64 bc
60 mg Fe 5.64±0.15 c 33.63±3.01 ab 54.05±4.95 ab 16.63±2.55 ab 29.88±2.94 b
85 mg Fe 6.35±0.25 b 34.83±3.46 ab 56.74±4.69 a 16.97±1.96 ab 33.26±3.02 a
100 mg Fe 6.86±0.26 a 35.5±3.76 a 57.85±6.1 a 17.93±2.36 a 32.75±2.97 a
Anemic
26 mg Fe 3.53±0.09 h 23.05±1.98 e 25.18±3.07 f 11.23±1.37 e 22.43±2.23 e
40 mg Fe 4.11±0.26 g 25±2.28 e 27.9±3.19 f 12.31±1.19 e 22.91±2.67 e
60 mg Fe 4.53±0.23 f 28±2.58 d 35.49±3.64 e 12.78±1.21 de 24.91±2.43 de
85 mg Fe 4.67±0.2 ef 32±2.98 bc 38.39±3.51 e 14.3±1.21 cd 24.98±2.67 de
100 mg Fe 4.87±0.22 e 35±3.63 ab 45.25±4.06 d 14.8±1.78 c 28.01±2.79 bc
Different letters in a column show statistically significant differences at P < 0.05.

88
Figure 6.1 Hemoglobin concentration (g/dL) in rats at the end of experiment. Group of
animals fed with diets containing: 26 mg Fe (control), 40 mg Fe (G1), 60 mg Fe (G2), 85 mg
Fe (G3) and 100 mg Fe (G4).
6.3.4 Ferritin contents in serum and liver
Rats fed with Fe biofortified grain significantly increased serum ferritin in all groups of non-
anemic rats compared to the control (Figure 6.2a). The highest increase of serum ferritin was
in the group feed with diet containing 100 mg Fe of non-anemic rats which was 55% higher
than the control. A significant increase in serum ferritin was observed in the anemic rat
groups when compared with their control. The mean maximum value of serum ferritin was
calculated in group feed with diet containing 85 mg Fe and group feed with diet containing
100 mg Fe, anemic rats (1.93 and 2.63 µg/ml, respectively). A strong accumulation of
ferritin in the liver of anemic and non-anemic groups of rats was observed after feeding Fe
biofortified rice grain, and results show significant variation when compared with their
respective controls (Figure 6.2b). In non-anemic rats, liver ferritin increased up to 41 and
61% in group feed with diet containing 85 mg Fe and group feed with diet containing 100 mg
Fe, respectively, over the anemic control.
de cd bcb
a
ih
gf
e
0
2
4
6
8
10
12
14
16
18
26 mg Fe 40 mg Fe 60 mg Fe 85 mg Fe 100 mg Fe
Hea
mo
glo
bin
Co
nc.
g/d
L
Treatment
Non-Anemic Anemic

89
Table 6.3 Iron reserves in rat organs and serum. Group of animals fed with a diet containing: 26 mg Fe (control), 40 mg Fe
(G1), 60 mg Fe (G2), 85 mg Fe (G3) and 100 mg Fe (G4). Rats category Treatments Fe in spleen (mg) Fe in kidney (mg) Fe in liver (mg) Fe in heart (mg) Fe in serum (ug/%)
Non-anemic
26 mg Fe 2.11±0.14 f 2.11±0.14 f 1.2±0.04 e 0.44±0.03 c 170.1±11.95 c
40 mg Fe 2.9±0.32 d 2.9±0.32 d 1.4±0.07 d 0.46±0.3 c 194.3±15.88 b
60 mg Fe 3.21±0.14 c 3.21±0.14 c 1.79±0.09 c 0.5±0.06 b 202.5±19.57 b
85 mg Fe 3.68±0.16 b 3.68±0.16 b 2.19±0.11b 0.52±0.04 b 207.8±18.19 ab
100 mg Fe 4.09±0.18 a 4.09±0.18 a 2.35±0.15 a 0.62±0.08 a 222.1±21.7 a
Anemic
26 mg Fe 1.2±0.08 i 1.2±0.08 i 0.88±0.06 h 0.33±0.03 f 142.1±13.54 d
40 mg Fe 1.45±0.08 h 1.45±0.08 h 0.99±0.05 g 0.37±0.02 e 149.1±13.76 c
60 mg Fe 1.77±0.13 g 1.77±0.13 g 1.03±0.06 fg 039±0.03 de 169±14.83 c
85 mg Fe 2.03±0.1 f 2.03±0.1 f 1.08±0.08 g 0.42±0.04 cd 176.1±17.43 c
100 mg Fe 2.36±0.18 e 2.36±0.18 e 1.2±0.06 e 0.46±0.03 c 203.8±17.75 b
Different letters in a column show statistically significant differences at P < 0.05.

90
6.3.5 Serum biochemical analysis
In relation to the control group, rats with Fe biofortified rice grain (60, 85, and 100 mg Fe),
had significantly greater levels of serum urea, cholesterol, protein, albumin, and creatinine in
both anemic and non-anemic rats compared to the respective controls (Table 6.4). In non-
anemic rat groups the highest increase in serum urea (49%), cholesterol (42%), protein
(23%), albumin (41%) and creatinine (39%) was observed in the group feed with diet
containing 100 mg Fe compared to the control. Among anemic group, the group feed with
diet containing 85 mg Fe and group feed with diet containing 100 mg Fe, remained best, with
maximum values of these biochemical parameters equal to or more than the non-anemic
control and group feed with diet containing 40 mg Fe. Elevated levels of glucose were
observed in groups of anemic rats compared to non-anemic rats. In control and group feed
with diet containing 40 mg Fe, of anemic rats, the highest glucose levels were calculated
compared to the group feed with diet containing 60 mg Fe, group feed with diet containing
85 mg Fe and group feed with diet containing 100 mg Fe, of anemic and all non-anemic rats
groups. The maximum mean value of glucose (115.75 mg/dl) was observed in the control of
anemic rats and that was 43 and 40% higher than the group feed with diet containing 100 mg
Fe of anemic and non-anemic rats groups, respectively.

91
Figure 6.2 a, b: Ferritin contents in serum and liver of rats as affected by various treatments.
Group of animals fed with diet containing: 26 mg Fe (control), 40 mg Fe (G1), 60 mg Fe
(G2), 85 mg Fe (G3) and 100 mg Fe (G4).
d
cc
b
a
h
g
f
e
d
0
0.5
1
1.5
2
2.5
3
3.5
4
4.5
Seru
m f
err
itin
co
nte
nts
(µg
/ml)
Non-anemic Anemic
fg
d
c
ba
ih
gh fe
0
5
10
15
20
25
30
26 mg Fe 40 mg Fe 60 mg Fe 85 mg Fe 100 mg Fe
Liv
er f
erri
tin
co
nte
nts
(m
g)
Treatments
Non-anemic Anemic

92
Table 6.4 Rat serum biochemical analysis. Group of animals fed with diets containing: 26 mg Fe (control), 40 mg Fe (G1),
60 mg Fe (G2), 85 mg Fe (G3) and 100 mg Fe (G4). Rats category Treatments Serum Urea
(mg/dl)
Cholesterol
(mg/dl)
Protein (g/dl) Albumin (g/dl) Creatinine
(mg/dl)
Glucose
(mg/dl)
Non-anemic
26 mg Fe 37.88±2.5 d 60.5±3.25 de 4.80±0.09 de 3.41±0.05 g 0.43±0.03 cd 65.75±5.47 e
40 mg Fe 40.38± 2.5 d 61.88±4.7 d 5.03±0.16 c 3.52±0.13 f 0.47±0.04 c 69.75±4.23 e
60 mg Fe 46.63±3.02 bc 68.5±4.87 c 5.61±0.15 b 3.76±0.07 c 0.47±0.04 c 76±4.2 d
85 mg Fe 48.88±3.4 b 76.63±5.68 b 5.94±0.16 a 4.42±0.06 b 0.56±0.05 b 77.63±3.02 d
100 mg Fe 56.63±5.45 a 86.25±5.73 a 5.94±0.21 a 4.84±0.12 a 0.6±0.05 a 82.38±4.66 cd
Anemic
26 mg Fe 29.75±2.87 e 56.5±3.78 e 4.19±0.13 f 3.32±0.11 g 0.39±0.03 d 115.75±4.8 a
40 mg Fe 32.5±2.39 e 61.75±5.15 d 4.19±0.24 f 3.53±0.11 ef 0.42± 0.05 d 111.5±6.61 a
60 mg Fe 37.75±3.77 d 64.5±4.99 cd 4.67±0.14 e 3.59±0.14 d-f 0.46±0.04 c 95±12.31 b
85 mg Fe 40.5±3.42 d 62.25±3.49 cd 4.93±0.12 cd 3.63±0.1d e 0.47±0.04 c 86.75±5.47 c
100 mg Fe 44±3.55 c 69.25±5.18 c 5.09±0.11 c 3.69±0.1 cd 0.53±0.04 b 80.75±3.58 cd
Different letters in a row show statistically significant differences at P < 0.05

93
6.4 Discussion
The main purpose of this research was to investigate the potential effects of Fe biofortified
rice grain containing different concentration of Fe on anemic and non-anemic rats. Rats with
induced Fe deficiency anemia showed poor general status and were apathetic, due to loss of
appetite due to daily feed diet. Macroscopic results further indicated that the anemic rats also
suffered from hair loss and were lethargic. This condition can be attributed to the inefficiency
and ineffectiveness in the blood circulatory system which is responsible for oxygen and
nutrient supply to body tissues and hair follicles (body cells). These findings corroborate with
Ebuehi and Mbara (2011). Rats fed with Fe biofortified grains had significantly improved
appetite and overall condition. This finding is also positively correlated with observations
made by Yun et al. (2011) and Zielin´ska-Dawidziak et al. (2012).
In my experiment, significant increase in liver weight was observed in non-anemic rats while
reduction in volume and liver weight was observed in anemic rats. Iron biofortified rice grain
having high concentrations of Fe caused hyperplasia in the liver compared to anemic rats.
Similarly, Zielin´ska-Dawidziak et al. (2012) and Yun et al. (2011) also reported their
observation of liver volume reduction caused by iron deficiency and increased liver weight
after Fe supplementation. Hypertrophy of the spleen was observed in rats of anemic groups
because iron deficiency activated spleen cells and cell proliferation (Kuvibidila et al., 2012).
In contrast, it was also observed in this research that the anemic rats also had a higher organ
coefficient of heart as compare to non-anemic rats. This finding is also supported by Hedge
et al (2006) who reported that heart weight increase in iron deficient animals is a common
outcome - cardiomegaly. The findings of this research and those of Hedge et al. (2006)
further supports Zielińska-Dawidziak et al. (2014) who reported similar results of their
research.
In terms of percent body mass, anemic animals of the control observed with the highest
increase in kidney mass. This increased coefficient in anemic rats was partly due to the
oedema stimulated by iron deficiency anemia. This previous argument and finding further
corroborates with researchers such as Zielińska-Dawidziak et al. (2014) and Wang et al.
(2015).

94
The main aim of this experiment was to examine Fe bioavailability from Fe biofortified
grain. Iron therapy is recommended for patients who suffer from severe or intravascular
hemolysis. In this situation, a persistent hemoglobinuria turns into significant Fe loss (Ebuehi
and Mbara, 2011). Iron is known as vital for hemoglobin synthesis and it can be reasonably
assumed that any inadequacy in Fe level will result in a slower hemoglobin synthesis rat
(Gârban, et al., 2013). Following this assumption, anemic group rats of control group and
group feed with diet containing 40 mg Fe continued to be anemic in the whole experiment.
Hence, the high concentration of hemoglobin in these anemic groups was due to the
enhanced supply of iron and increased consumption. Results obtained under such
assumptions also support the observations made by Zielin´ska-Dawidziak et al. (2012) and
Tang et al. (2014). These previous researchers made similar observations from rats that were
supplied with FeSO4 and heme iron enriched peptide, respectively.
Throughout the experiment, anemic rats which were fed with a 26 and 40 mg kg-1 Fe
containing diet, showed the lowest average values of some parameters associated with blood
counts such as MCV, RBC, HCT, MCH, and MCHC (Table 6.2). On the other hand, the
highest values were found from animals fed with a 85 and 100 mg Fe containing diet. These
findings also support Zielińska-Dawidziak et al. (2012) and Tang et al. (2014) who obtained
similar results from animals that were treated withheme iron enriched peptide and with iron
ferritin isolate.
Red blood cells (RBC) play an important role supporting tissue metabolism. Therefore,
normal RBC should be present to sustain tissue oxygenation and to maintain a normal acid-
base balance in the system (Carley, 2003). However, often hemoglobin production is
restrained due to the absence of sufficient Fe, consequently, RBC are impacted. Further,
Carley (2003) argued that the RBC decline in equal proportion to the hemoglobin
concentration particularly in Fe deficient anemia. As Table 6.2 shows, the RBC counts of
non-anemic rats groups were higher that the anemic rat groups. Because, the anemic rat
groups showed significantly lower readings (p<0.05). However, the RBC numbers of anemic
rat groups were found to be dramatically increased after feeding Fe biofortified rice grain.
These results and findings also support Tang et al. (2014). They also found increased RBC
after feeding Fe enriched peptide to the rats.

95
The proportion of the blood that is occupied by the RBC is indicated by HCT (Modepalli et
al., 2013). This further depends upon the concentration of hemoglobin in the RBC. Table 6.2
also shows that the hematocrit value of anemic rats was significantly lower (p < 0.05) than
non-anemic rats, but significantly increased after feeding Fe biofortified rice grain.
Hematocrit increased significantly compared to the remaining groups of anemic and non-
anemic rats. The high concentration of Fe in Fe biofortified rice feed was the reason of this
increase. These groups also showed an increase in MCV value, which further reflects an
increase in the plasma volume (Table 6.2). These findings corroborate with those of Smol
2001. Zielińska-Dawidziak et al. (2012) also found the same results from animals previously
treated with Fe ferritin isolate.
Knight et al. (1983) reported the mean corpuscular hemoglobin (MCH) as a good
haematological indicator of Fe deficiency. In my experiment due to the low Fe concentration
in the diet of control and G1 group of anemic rats, MCH and MCHC increased non-
significantly. Further, rats supplied with Fe biofortified rice grain containing enhanced Fe
concentration (60, 85, or 100 mg Fe) significantly increased MCH and MCHC in anemic rats
compared to anemic controls.
Generally, it was observed that feeding Fe (60, 85, or 100 mg Fe) biofortified rice grain
brought improvements in anemic rats in their hemoglobin RBC, MCV, HCT, MCH and
MCHC from normal to better. Similar observations were reported by Tang et al. (2014) and
Bertinato et al. (2014) after feeding heme Fe enriched peptide and diet containing a 70 mg Fe
kg-1 diet.
Angelucci et al. (2000) suggested that to test the complete body Fe store, liver Fe
concentration is a reliable indicator. Similarly, Emerit et al. (2001) mentioned that the spleen
and liver are two main Fe storage sites. In this research, non-anemic rat group had higher Fe
contents in their organs (liver, spleen, kidney and hurt) compared to anemic rat groups (Table
6.3). The highest iron deposition was observed in the spleen, followed by the liver, kidney,
and heart irrespective of groups. It is suggested by the authors that depletion of Fe storage
from rat organs can be ameliorated by adding Fe in their diet (Zielin´ska-Dawidziak et al.,
96
2012; Chaturvedi et al., 2014; Wang et al., 2014). This research confirms the hypothesis that
the rats fed with Fe biofortified rice grain containing greater concentrations of Fe (60, 85, or
100 mg kg-1 DW) improved the depleted Fe storage in rat organs. Cancado et al. (2001)
indicated that serum Fe concentration is a measure of the total quantity of Fe in the serum
and the concentration increases with the supply of dietary Fe.
Ferritin is a protein that operates in vivo as an Fe storage complex. The level of Fe body
stores can be reflected by serum ferritin; where serum ferritin level is low it indicates Fe
deficiency (Wang et al., 2014). The literature suggested serum ferritin levels are a reliable
indicator for Fe stores in the body that can be mobilized, and further reliable measurements
in finding Fe deficiency at a very early stage and usually directly proportional to body Fe
stores (Reddy et al., 2006).
Pollock et al. (1978) and Powell et al. (2013) reported that Fe deficiency treatment is quickly
reflected in serum ferritin, which further reflects the storage size of the Fe compartment. This
research found lower serum ferritin in the control of anemic rats as compared to all rats
groups feeding with Fe biofortified grains. The observations made in our research further
support studies by Xiao et al. (2015) and Zielin´ska-Dawidziak et al. (2012). They reported
that enhanced levels of Fe in diet serum ferritin levels also increased and returned to normal.
An increase in ferritin levels in the liver is due to its increased synthesis rate and does not
depend on its degradation rate. This showed that the production of anemia did not result in a
complete Fe reserve decline in the liver. Therefore, based upon changes in ferritin level, it is
hypothesized that Fe biofortified rice grain has a positive impact in Fe reserve reconstruction.
This research further demonstrated that in all groups of non-anemic rats there was a
maximum concentration of serum urea, cholesterol, protein, albumin and creatinine
compared to anemic rats (Table 6.4). It is also believed that changes in lipid metabolism, in
serum levels, and in tissue lipids are usually caused by high doses of Fe. Further, it is also
reported that changes in the gene expression of hepatic enzymes mainly HMG-COA
reductase also causes an Fe induced increase in cholesterol in serum and tissues.
Kojima et al. (2004) reported that heavy metals stimulate changes in the gene expression of
HMG-COA reductase. On the other hand, Gielen and Tiekink, (2005) and Gârban et al.
97
(1989) reported serum creatinine increases in the circumstance of multiple metal compound
administration can be elaborated by their interaction with phosphate groups. Katsumata et al.
(2009) reported that Fe deficiency anemia decreases the proportion of serum total protein and
albumin and increased with enough Fe supplied diet, similar observation was noticed in our
experiment. An increased glucose level was observed in control anemic rats that were
supplied with a 26 and 40 mg Fe diet, respectively. Further, these values were statistically
significant compared to the remaining anemic and non-anemic rat groups. Kamei et al.
(2010) reported that increases in serum glucose levels in Fe deficient rats are due to the
increases in the initial stages of gluconeogenesis. They also reported that, in the case of
anemia, serum glucose level increase and further that the Fe deficiency potentially stimulates
gluconeogenesis instead of glycolysis. Thses results showa that Fe biofortified rice grains
have a positive effect on rats health and CBC recovery.
6.5 Conclusions
Due to the toxic effects of high doses of Fe and the negative impacts of dietary fortified Fe, it
is believed that Fe deficiencies are not able to be compensated by fortification and
supplementation. Biofortification is reported as a cost effective process that enables sufficient
provision of mineral contents with a one time investment to the target population. Based on
the results of this research, it can be argued that Fe absorption from Fe biofortified rice grain
at the rate of 60, 85 and 100 mg Fe, leads to positive effects by eliminating Fe deficiency
anemia. However, the author believes that Fe biofortified grain should be further exploited as
a safe and efficient new Fe supplement approach compared to outdated supplements and
fortification processes and practices. The increased deposits of Fe in non-anemic rat organs
demonstrates the need for future studies in this area to further investigate the Fe biofortified
rice grain effects on humans or other animals.

98
Chapter 7
Summary
Food security is a serious issue in developing countries because of ever-increasing
population. The FAO states that in developing countries about 13.5% of the total population
lacks enough food for their daily intake of calories. However, in last 40 years, agricultural
research has focused only on production but not on quality of produce, which leads farmers
to maximize profits by adopting the latest production technology for fewer crops, especially
in developing countries. This inclusion of cash crops and high yielding varieties in cropping
schemes has resulted in micronutrient malnutrition (i.e. Fe, Zn) and less food diversity.
According to one estimate, every 3rd person in the world suffers from hidden hunger due to
essential nutrient and vitamin deficiency, resulting in poor health conditions.
Calcareous soils are one of the main reasons for increasing micronutrient (especially Fe)
malnutrition problems. High pH and high HCO3 contents are two most important factors that
limit Fe availability in calcareous soil. Iron is not lacking in mineral soil, but due to high pH
and calcareousness it is unavailable to plants because at high pH Fe+2 ions are converted into
less soluble Fe+3 oxides and hydroxides and disappear from the soil solution. Iron
fertilization may not be effective in calcareous soil due to its rapid conversion. Mixing
inorganic salts of micronutrients with different organic materials can enhance the efficacy of
micronutrients. Organic matter is an important nutrient source, but due to harsh climatic
conditions of Pakistan its decomposition is very quick.
Soil acidity favors the solubilization of mineral cations in soil with high calcium carbonate
contents. Thus, elemental S is a common and cost effective acidifying matter. Microbial
oxidation of S leads to dissolution of nutrients by releasing H+. To combat these limitations
we developed a strategy to increase Fe solubility in soil solution and availability for plant
uptake using some acidifying agents in calcareous soil.
Phytate and polyphenols are major inhibitors of Fe present in cereals that reduce Fe
bioavailability and lead to anemia in developed and developing countries; its consequences
are greater in developing countries. Along with anemia, Fe deficiency results in increased
susceptibility to infection, mental and psychomotor retardation in children, and impaired

99
immune system. In contrast, ferritin is a stable Fe storage protein present in cereals grains
and doesn’t form complexes with other cations, thus increasing Fe availability to humans.
Iron stored in ferritin is completely bioavailable because it doesn’t denature in the human
alimentary tract.
Conventionally, both short term (i.e. supplementation, fortification, food diversification) and
long term solutions (i.e. breeding, genetic engineering, and agronomic) approaches have been
proosed to combat Fe deficiency in crops and in humans. Compared to these approaches
biofortified crops may not provide as high a level of nutrients as per day demand, but it is a
promising approach to provide adequate micronutrients throughout the life cycle. It is a cost
effective approach that sustainably provide minerals and vitamins to target populations.
To combat these described limitations, we developed a strategy in which we evaluated the
effect of Fe fertilizer combined with organic amendments (BC and PM) for Fe
biofortification of cereals grains in S treated low pH calcareous soil. The main conclusions
drawn from this research work are summarized below:
Initially, we used elemental S to reduce the soil pH and to solubilize Fe in calcareous soil. As
demonstrated in Chapter 3, soil pH decreased gradually in pots receiving different doses of
S and was stable after 4 weeks of incubation. Among the four organic amendments, S
application in soil amended with biochar and poultry manure lowered soil pH consistently
compared to soil amended with compost and farmyard manure. Addition of S decreased soil
pH by about 1-1.9 units in biochar and poultry manure amended soil compared to the control.
Iron is not deficient in mineral soil but due to high pH and calcareousness it is merely
unavailable to plants because at high pH Fe+2 ions converts into less soluble Fe+3 oxides and
hydroxides and disappears from soil solution. However in Chapter 3 our result showed that
DTPA-extractable Fe concentration increased with biochar and poultry manure amendment
along with different rates of Fe fertilizer in low pH soil compared to the control. Among the
different rates of Fe fertilizer, Fe at a rate of 0.0075 g kg-1 combined with biochar and poultry
manure in low pH soil gave DTPA-extractable Fe of 10.3 and 9.9 ppm, respectively, which
was double the amount as required by cereal plants to complete their life cycle.

100
In Chapter 3 it was concluded that soil pH manipulation with S improved Fe solubilization
and its bioavailability in wheat grain . Hence, Fe application along with organic amendments
could be an effective strategy to enhance Fe biofortification of wheat in pH manipulated soil.
Ferritin concentration in wheat grain grown in calcareous soil was enhanced by optimizing
Fe bioavailability in low pH soil.
In Chapters 4 and 5 it was observed that Fe bioavailability and nutritional quality of maize
and rice grain wasenhanced by combined use of Fe with organic amendments in acidified
calcareous soil. Iron (FeSO4.7H2O, 0.0075 g kg-1) applied with 1% biochar and 1% poultry
manure increased grain Fe concentration and ferritin in low pH calcareous soil when
compared with a control (in non-acidified soil). Maximum decrease in anti-nutrients in maize
and rice grain was observed in treatments where Fe was applied with biochar in low pH soil.
Highest increase in growth, physiology, chemical, and biochemical parameters was observed
when Fe was applied with biochar in S treated low pH soil compared to unacidified soil.
It was reported that due to the toxic effects of high doses of Fe supplementation and negative
impacts of dietary fortified iron, Fe deficiencies were not possible to be compensated by
fortification and with supplementations. So, a rate study was conducted in anemic and non-
anemic rats to find out the absorption rate of Fe from Fe biofortified rice grains.
Bioavailable Fe (ferritin) increased up to 65-230%, Fe concentrations up to 60-200%, Zn up
to 9-32% and protein up to 19-58% in Fe biofortified rice grains and it was necessary to
determine its fate with regards to Fe deficiency anemia eliminartion. So a comprehensive rate
study was conducted to evaluate the Fe biofortified grains effect on rats CBC and organs.
It was concluded from Chapter 6 that out of five rate of Fe, three rates (i.e. 60, 85 and 100
mg Fe kg-1 DW) produced effective restorative action returning the hemoglobin (Hb) up to
23%, mean corpuscular volume (MCV) up to 17%, red blood cells (RBC) up to 28%,
hematocrit (HCT) up to 44%, mean corpuscular hemoglobin (MCH) 22%, mean corpuscular
hemoglobin concentration (MCHC) up to 31%, serum, and liver ferritin in anemic animals to
normal values or in some cases better than normal values. Furthermore, it was observed that
Fe biofortified rice grain had a significant positive effect on Fe concentration in organs and
serum biochemical parameters compared to controls. Based on the results of this research, it

101
can be argued that Fe absorption from Fe biofortified rice grain at rates of 60, 85, or 100 mg
Fe, lead to positive effects by eliminating Fe deficiency anemia.
Overall, soil pH manipulation of calcareous soil with S improved Fe solubilization and its
bioavailability. Iron application along with organic amendments could be an effective
strategy to enhance Fe biofortification of cereals in pH manipulated calcareous soil. Ferritin
concentration in wheat, maize, and rice grain grown in calcareous soil was enhanced by
optimizing Fe bioavailability in low pH soil and its translocation in the plant body could
serve as a valuable approach to fight the malnutrition problem in the humans.
Future Suggestions: The combined use of Fe fertilizer with biochar and poultry manure for
improving Fe biofortification in S treated acidified soil could be an effective approach to
compensate for Fe deficiency in plants and humans. However, multi-site field experiments
are required through combined use of organic and inorganic amendments in acidified
calcareous soils to further confirm this experimental approach. Moreover, the rate study
confirmed that Fe biofortified rice grain has a positive effect on Fe deficiency anemia
elimination in rats. But further trials in humans are required to determine the fate of Fe
biofortification. Therefore, increased deposits of Fe in non-anemic rat organs demonstrates
the need for future studies in this area to furthr investigate the Fe biofortified rice grain
effects on humans and other animals.
102
References
Abd El Rahaman, S.M., H.B.El Maki, W.H. Idris, A.B. Hassan, E.E. Babiker and A.H. El
Tinay. 2007. Antinutritional factors content and hydrochloric acid extractability of
minerals in pearl millet cultivars as affected by germination. Int. J. Food Sci. Nutr.
58: 6–17.
Abd El-Haleem, A.A.1996. Iron availability as affected by CaCO3 particle size and Fe:P ratio
in Fe-P-containing compounds. Egypt. J. Appl. Sci. 11: 308-327.
Aggelides, S.M. and P.A. Londra. 2000. Effects of compost produced from town wastes and
sewage sludge on the physical properties of a loamy and a clay soil. Bioresource
Technol. 71: 253–259.
Aggett, P.J., J. Hathcock, D. Jukes, D.P. Richardson, P.C. Calder, H. Bischoff-Ferrari, T.
Nicklas, S, Mu¨hlebach, O. Kwon, J. Lewis, M.J.F. Lugard and P. Prock. 2012.
Nutrition issues in Codex: health claims, nutrient reference values and WTO
agreements: a conference report. Eur. J. Nutr. 51: 1–7.
Aguilar-Garcia, C., G. Gavino, M. Baragaño-Mosqueda, P. Hevia and V.C. Gavino. 2007.
Correlation of tocopherol, tocotrienol, γ-oryzanol and total polyphenol content in rice
bran with different antioxidant capacity assays. Food Chem. 102: 1228-1232.
Akinrinde, E.A. 2006. Issues of optimum nutrient supply for sustainable crop production in
tropical developing countries. Pak. J. Nutr. 5: 387-397.
Akhtar S.S., M.N. Andersen and F. Liu. 2015. Residual effects of biochar on improving
growth, physiology and yield of wheat under salt stress. Agri. Water Manag. 158: 61–
68.
Albacar, G., T. Sans, R. Martin-Santos, L. Garcia-Esteve, R. Guillamat, J. Sanjuan, F.
Canellas, M. Gratacos, P. Cavalle, V. Arija, A. Gaviria, A. Gutierrez-Zotes and E.
Vilella. 2011. An association between plasma ferritin concentrations measured 48 h
after delivery and postpartum depression. J. Affect. Disord. 131: 136–142.

103
Alburquerque, J.A., M. Cabello, R. Avelino, V. Barro´n, M.C. del Campillo and J. Torrent.
2015. Plant growth responses to biochar amendment of Mediterranean soils deficient
in iron and phosphorus. J. Plant Nutr. Soil Sci. 178: 567–575.
Alburquerque, J.A., P. Salazar, V. Barron, J. Torrent, M.D. del Campillo. A. Gallardo and R.
Villar. 2013. Enhanced wheat yield by biochar addition under different mineral
fertilization levels. Agron. Sustain. Dev. 33: 475–484.
Alcantara, E., F.J. Romera, M. Canete and M.D. Guardia. 2002. Effect of bicarbonate
andiron supply on Fe (III) reducing capacity of roots and leaf chlorosis of the
susceptible peach rootstock nema guard. J. Plant Nutr. 23: 1607–1617.
Allison, L.E. and C.D. Moodie. 1965. Carbonate. p. 1379–1396. In: C.A. Black (ed.)
Methods Soil Analysis Part 2: Chemical and Microbiological Properties. Am Soc
Agron Madison USA.
Al-Rejaie, S.S., A.M. Aleisa, M.M. Sayed-Ahmed, O.A. Al-Shabanah, H.M. Abuohashish,
M.M. Ahmed, K.A. Al-Hosaini and M.M. Hafez. 2013. Protective effect of rutin on
the antioxidant genes expres-sion in hypercholestrolemic male Westar rat. BMC
Complement Altern Med. 13:136–44.
Aly, S.S.M. and S.M. Soliman. 1998. Impact of some organic acids on correcting iron
chlorosis in two soybean geneotypes grown in calcareous soil. Nutr. Cycl.
Agroecosys. 51: 185-191.
Ambe, S., F. Ambe and T. Nozuki. 1987. Mossbauer study of iron in soybean seeds. J. Agric.
Food Chem. 35: 292–296.
Angelucci, E., G.M. Brittenham, C.E. McLaren, M. Ripalti, D. Baronciani, C. Giardini, M.
Galimberti, P. Polchi and G. Lucarelli. 2000. Hepatic iron concentration and total
body iron stores in Thalassemia major. N. Engl. J. Med. 343: 327–333.
Anjum, F.M., I. Pasha, M. Anwar, Bugti and M.S. Butt. 2007. Mineral composition of
different rice varieties and their milling fractions. Pak. J. Agri. Sci. 44: 332-336.

104
AOAC, 2003. Official methods of analysis of the association of official analytical chemists,
17th ed. Association of Official Analytical Chemists, Arlington, Virginia.
Arosio, P., R. Ingrassia and P. Cavadini. 2009. Ferritins: A family of molecules for iron
storage, antioxidation and more. Biochim. Biophys. Acta. 1790: 589–599.
Asai, H., B.K. Samson, H.M. Stephan, K. Songyikhangsuthor, K. Homma, Y. Kiyono, Y.
Inoue, T. Shiraiwa and T. Horie. 2009. Biochar amendment techniques for upland
rice production in Northern Laos 1. Soil physical properties, leaf SPAD and grain
yield. Field Crops Res. 111: 81–84.
Ascher, J.E., R.D. Graham, D.E. Elliott, J.M. Scott and R.S. Jessop. 1994. Agronomic value
of seed with high nutrient content. In: Saunders, D.A, Hettel, G.P. (Eds). Wheat in
heat-stressed environments: irrigated, dry areas and rice-wheat farming systems (pp.
297308). Mexico DF. CIMMYT Press.
Aung, M.S, H. Masuda, T. Kobayashi, H. Nakanishi, T. Yamakawa and N.K. Nishizawa.
2013. Iron biofortification of Myanmar rice. Front. Plant Sci. 4: 158. doi:
10.3389/fpls.2013.00158
Azam, F., M.M. Iqbal, C. Inayatullah and K.A. Malik. 2001. Technologies for sustainable
agriculture. Nuclear Institute for Agriculture and Biology, Faisalabad, 144 p.
Azeez, J.O., W. Van Averbeke and A.O.M. Okorogbona. 2010. Differential responses in
yield of pumpkin (Cucurbita maxima L.) and nightshade (Solanum retroflexum Dun.)
to the application of three animal manures. Bioresour. Tech. 101: 2499–2505.
Bailey, R.L., K.P. West Jr, and R.E. Black. 2015. The epidemiology of global micronutrient
deficiencies. Ann. Nutr. Metab. 66:22-33.
Bandyopadhyay, K.K., A.K. Misra, P.K. Ghosh and K.M. Hati. 2010. Effect of integrated
use of farmyard manure and chemical fertilizers on soil physical properties and
productivity of soybean. Soil Till. Res. 110: 115–125.
105
Barikmoa, I., F. Ouattara and A. Oshaug. 2007. Differences in micronutrients content found
in cereals from various parts of Mali. J. Food Comp. Anal. 20: 681–687.
Başar, H. 2000. Factors affecting iron chlorosis observed in peach trees in the Bursa region.
Turk. J. Agric. 24: 237-245.
Başar, H. 2003a. Analytical methods for evaluating iron chlorosis in peach trees. Commun.
Soil Sci. Plant Anal. 34: 327-341.
Başar, H. 2005. Methods for estimating soil iron availability to chlorotic peach trees.
Commun. Soil Sci. Plant Anal. 36: 1187-1198.
Bashir, K., R. Takahashi, H. Nakanishi and N.K. Nishizawa. 2013a. The road to
micronutrient biofortification of rice: progressand prospects. Front. Plant Sci. 4:15.
doi:10.3389/fpls.2013.00015
Beard, J.L., M.K. Hendricks, E.M. Perez, L.E. Murray-Kolb, A. Berg, L. Vernon-Feagans,
W.I. Isaacs, A. Sive and M. Tomlinson. 2005. Maternal iron deficiency anemia
affects postpartum emotions and cognition. J. Nutr. 135: 267–272.
Beckwith, R.S., K.G. Tiiier and E. Suwadji. 1975. The effect of flooding on the availability
of trace metals to rice in soils of differing organic matter status. Trac. Elem. Soil-
Plant- Animal Sys. 4: 128-135.
Beesley, L. and M. Marmiroli. 2011. The immobilisation and retention of soluble arsenic,
cadmium and zinc by biochar. Environ. Pollut. 159: 474–480.
Benoist, B.D., E. Mclean, M. Anderrson and L. Rogers. 2008. Iodine deficiency in 2007:
Global progress since, 2003. Food Nutr Bull. 29: 195-202.
Bertinato, J.. C. Aroche, L.J. Plouffe, M. Lee, Z. Murtaza, L. Kenney, C. Lavergne, A. Aziz.
2014. Diet-induced obese rats have higher iron requirements and are more vulnerable
to iron deficiency. Eur. J. Nutr. 53: 885–895

106
Besharati, H. and N. Salehrastin. 1999. The effect of sulfur inoculated with Thiobacillus
bacteria to increase P uptake. J. Soil Water Sci. 13: 23-39.
Bhutta, Z.A. and B.Z. Haider. 2009. Prenatal micronutrient supplementation: Are we there
yet? CMAJ. 180(12): 1188–1189.
Black, R.E., L.H. Allen, Z.A. Bhutta, L.E. Caulfield, M. de Onis, M. Ezzati, C. Mathers,
J. Rivera. Maternal and child under nutrition: global and regional exposures and
health consequences. Lancet 371: 243–260.
Bloom, P.R. and W.P. Inskeep. 1988. Factors affecting bicarbonate chemistry and iron
chlorosis in soils. J. Plant Nutr. 9: 215-228.
Bloom, P.R. and W.P. Inskeep. 1988. Factors affecting bicarbonate chemistry and iron
chlorosis in soils. J Plant Nutr. 9: 215-228.
Borel, M.J., S.H. Smith, D.E. Brigham and J. L. Beard. 1991. The impact of varying degrees
of iron nutrition on several functional consequences of iron deficiency in rats. J. Nutr.
121: 729–736.
Bothwell, T., H. Cori, R. Glahn, E. Hertrampf, Z. Kratky, D. Miller, M. Rodenstein, H.
Streekstra, B. Teucher, E. Turner, C.K. Yeung and M.B. Zimmerman. 2004.
Enhancing the absorption of fortification iron - a sustain task force report. Int. J.
Vitam. Nutri. Res. 74: 387–401.
Bothwell, T.H. and A.P. MacPhail. 2004. The potential role of NaFeEDTA as an iron
fortificant. Food Chem. Toxicol. 74: 421–434.
Bouis, H.E. and R.M. Welch. 2010. Biofortification: a sustainable agricultural strategy for
reducing micronutrient malnutrition in the global south. Crop Sci. 50: 20–32.
Bouis, H.E., C. Hotz, B. McClafferty, J.V. Meenakshi and W.H. Pfeiffer. 2011.
Biofortification: a new tool to reduce micronutrient malnutrition. Food Nutr. Bull. 32:
31-40.

107
Bradford, M.M. 1976. A rapid and sensitive method for the quantitation of microgram
quantities of protein utilizing the principle of protein-dye binding. Anal. Biochem. 72:
248–254.
Bremner, J.M. and C.S. Mulvaney. 1982. Nitrogen total. p. 595 – 624. In A. L. Page (ed.),
Methods of Soil Analysis. Agron. No. 9, Part 2: Chemical and microbiological
properties, 2nd ed., Am Soc Agron Madison WI USA.
Briat, J.F. and S. Lobréaux. 1997. Iron transport and storage in plants. Trend. Plant Sci. 2:
187–193
Briat, J.F., C. Duc, K. Ravet and F. Gaymard. 2010a. Ferritins and iron storage in plants.
Biochim. Biophy. Acta. 1800: 806–814.
Briat, J.F., I. Fobis-Loisy, N. Grignon, S. Lobreaux, N. Pascal, G. Savino, S. Thoiron, N.V.
Wiren and O.V. Wuytswinkel. 1995. Cellular and molecular aspects of iron
metabolism in plants. Biol. Cell. 84: 69–81.
Briat, J.F., K. Ravet, N. Arnaud, C. Duc, J. Boucherez, B. Touraine, F. Cellier and F.
Gaymard. 2010b. New insights into ferritin synthesis and function highlight a link
between iron homeostasis and oxidative stress in plants. Annal. Bot. 105: 811-822.
Brinch-Pedersen, H., S. Borg, B. Tauris and P.B. Holm. 2007. Molecular genetic approaches
to increasing mineral availability and vitamin content of cereals. J. Cereal. Sci. 46:
308-326.
Brock, D. and J. Gustafson. 1976. Ferric iron reduction by sulfur- and iron-oxidizing
bacteria. Appl. Environ. Microbiol. 32: 567–571.
Brzóska, M.M., M. Gala˙zyn-Sidorczuk and I. Dzwilewska. 2012. Ethanol consumption
modifies the body turnover of cadmium: a study in a rat model of human exposure. J.
Appl. Toxicol. 33: 784–98.
Bujoczek, G., J. Oleszkiewicz, R. Sparling and S. Cenkowski. 2000. High solid anaerobic
digestion of chicken manure. J. Agric. Eng. Res. 76: 51–60.
108
Cakmak, I., W.H. Pfeiffer and B. McClafferty. 2010a. Biofortification of durum wheat with
zinc and iron. Cereal Chem. 87: 10–20.
Cancado, R.D., C.S. Chiattone, F.F. Alonso, D.M.L. Junior and R.C.S. Alves. 2001. Iron
deficiency in blood donors. Sao. Paulo. Med. J. 119: 132–134.
Cao, H., Z.H. Han, X.F. Xu and Y. Zhang. 2002. Iron nutrition in higher plants. Plant
Physiol. Commun. 38: 180–186.
Carley, A. 2003. Anemia: when is it iron deficiency? Pediatric Nursing 29: 127.
Carlson, D., J.V. Nørgaard, B. Torun, I. Cakmak and H.D. Poulsen. 2012. Bioavailability of
trace elements in beans and zinc-biofortified wheat in pigs. Biol. Trace Elem. Res.
150: 147–153.
Celik, H. and A.V. Katkat. 2007. Some parameters in relation to iron nutrition status of
peach orchards. J. Biol. Environ. Sci. 1: 111-115.
Chandles, G., S. Banerjee, S. See, R. Meena, D.J. Sharma and S.B. Verulkar. 2010. Effects of
different nitrogen fertilizer levels and native soil properties on rice grain Fe, Zn and
protein contents. Rice Sci. 17: 213–227.
Chatterjee, C., R. Gopal and B.K. Dube. 2006. Impact of iron stress on biomass, yield,
metabolism and quality of potato (Solanumtuberosum L.). Scr. Hortic. 108: 1-6.
Chaturvedi, R., P. Chattopadhyay, S. Banerjee, C.R. Bhattacharjee, P. Raul, K. Borah, L.
Singh, and V. Veer. 2014. Iron-rich drinking water and ascorbic acid supplementation
improved hemolytic anemia in experimental Wistar rats. Int. J. Food Sci. Nutr. 65:
856–861
Cheryan, M. 1980. Phytic acid interactions in food systems. Crit. Rev. Food Sci. Nutri. 13:
297–335.
Chojnacka, K., M. Mikulewicz and J. Cieplik. 2011. Biofortification of food with
microelements. Ame. J. Agri. Biolo. Sci. 6: 544-548.
109
Cifuentes, F.R. and W.C. Lindemann. 1993. Organic matter stimulation of elemental sulfur
oxidation in a calcareous soil. Soil Sci. Soc. Am. J. 57: 727-731.
Claudio, C., G. Palumbo, J. He, R. Pinton and S. Cesco. 2014. Review on iron availability in
soil: interaction of Fe minerals, plants, and microbes. J. Soils Sedim. 14: 538–548.
Curie, C., G. Cassin, D. Couch, F. Divol, K. Higuchi, M. Jean, J. Misson, A. Schikora, P.
Czernic and S. Mari. 2009. Metal movement within the plant: contribution of
nicotianamine and yellow stripe 1-liketransporters. Ann. Bot. Lond. 103:1–11.
de Cesare Barbosa, G.M., J.F. de Oliveira, M. Miyazawa, D.B. Ruiz and J.T. Filho. 2015.
Aggregation and clay dispersion of an oxisol treated with swine and poultry manures.
Soil Till. Res. 146: 279–285.
del Campillo, M. C. and J. Torrent. 1992. Predicting the incidence of iron chlorosis in
calcareous soils of southern Spain. Commun. Soil Sci. Plan. Anal. 23: 399–416.
del Campillo, M., C. V. Barron, J. Oglesias, R. Dalmao and X. Marce. 1998. Fertilization
with iron (II) phosphate effectively prevents iron chlorosis in pear trees. 2-7 August
2008. In: Abstract XXV International Horticulture Congress ISHS, Bruxelles.
Del Pozo-Insfran, D., S.S. Percival and S.T. Talcott. 2006. Acai (Euterpe oleracea Mart.)
polyphenolics in their glycoside and aglycone forms induce apoptosis of HL-60
leukemia cells. J. Agric. Food Chem. 54: 1222-1229.
Deluca, T.H., E.O. Skogley and R.E. Engle. 1989. Band-applied elemental sulfur to enhance
the phytoavailability of phosphorus in alkaline calcareous soils. Biol. Fertil. Soil. 7:
346-350.
Demir, K., O. Sahin, Y.K. Kadioglu, D.J. Pilbeam and A. Gunes. 2010. Essential and non-
essential element composition of tomato plants fertilized with poultry manure. Sci.
Hort. 127: 16–22.
Dent, D. 1986. Acid sulphate soils: A baseline for research and development. Wageningen,
The Netherlands: International Institute for Land Reclamation and Improvement.

110
Doria, E., L. Galleschi, L. Calucci, C. Pinzino, R. Pilu and E. Cassani. 2009. Phyticacid
prevents oxidative stress in seeds: Evidence from a maize (Zea mays L.) low phytic
acid mutant. J. Exp. Bot. 60: 967–978.
Drakakaki, G., S. Marcel, R.P. Glahn, E.K. Lund, S. Pariagh, R. Fischer, P. Christou and E.
Stoger. 2005. Endosperm-specific co-expression of recombinant soybean ferritin and
Aspergillus phytase in maize results in significant increases in the levels of
bioavailable iron. Plant Mol. Biol. 59: 869–880.
Drysdale, J.W. and W.N.M. Ramsay. 1964. The separation of ferritin and hemosiderin for
studies in the metabolism of iron. Biochem. J. 95: 282–288.
Du Laing, G., J. Rinklebe, B. Vandecasteele, E. Meers and F.M. Tack. 2009. Trace metal
behaviour in estuarine and riverine floodplain soils and sediments: a review. Sci.
Total Environ. 407: 3972–3985.
Dudley, L.M., B.L. McNeazl and J.E. Baham. 1986. Time-dependent changes in soluble
organics, copper, nickel and zinc from sludge amended soils. J. Environ. Quality. 15:
188–192.
Duque, X., H. Martinez, J. Vilchis-Gil, E. Mendoza, S. Flores-Hernández, S. Morán, F.
Navarro, V. Roque-Evangelista, A. Serrano and R.M Mera. 2014. Effect of
supplementation with ferrous sulfate or iron bis-glycinate chelate on ferritin
concentration in Mexican school children: a randomized controlled trial. Nutr. J. 13:
71–80.
Ebuehi, O.A.T. and K.C. Mbara. 2011. Biochemical studies of iron fortified Gari fed to
phenyl hydrazine induced anemic rats. Am. J. Food Technol. 6: 472–482.
Eichert, T., J.J. Peguero-Pina, E. Gil-Pelegrín, A. Heredia and V. Fernández. 2010. Effects of
iron chlorosis and iron resupply on leaf xylem architecture, water relations, gas
exchange and stomatal performance of field-grown peach (Prunus persica). Physiol.
Plant. 138: 48–59.

111
Emerit, J., C. Beaumont and F. Trivin. 2001. Iron metabolism, free radicals, and oxidative
injury, Biomed. Pharmacother. 55: 333–339.
Erika, F., W. Stauffer, S.K. Gupta and R. Schulin. 2012. Effects and limitations of elemental
sulphur applications for enhanced phytoextraction. Inter. J. Phytoremed. 14: 681–690.
Etebary, S., S. Nikseresht, H.R. Sadeghipour and M.R. Zarrindast. 2010. Postpartum
depression and role of serum trace elements. Iran J. Psychiatry 5: 40–46.
Fageria, N.K., V.B.C. Aligar and C.Y. Li. 2008. The role of nutrient efficient plants in
improving crop yields in the twenty first century. J. Plant Nutr. 31: 1121–1157.
Fageria, N.K., V.C.B. Aligar and R.B. Clark. 2002. Micronutrients in crop production. Adv.
Agric. 77: 85–268.
Fairweather-Tait, S., S. Lynch, C.H. Hotz, R. Hurrell, L. Abrahamse and S. Beebe. 2005. The
usefulness of in vitro models to predict the bioavailability of ironand zinc: a
consensus statement from the harvest plus expert consultation. Inter. J. Vitam. Nutr.
Res. 75: 371-374.
Fan, J.L., Z.Y. Hu, N. Ziadi, X. Xia and C.Y.H. Wu. 2010. Excessive sulfur supply reduces
cadmium accumulation in brown rice (Oryza sativa L.). Environ. Pollut. 158: 409–
415.
Fang, Y., L. Wand, Z. Xin, L. Zhao, X. An and Q. Hu. 2008. Effect of foliar application of
zinc, selenium, and iron fertilizers on nutrients concentration and yield of rice grain in
China. J. Agric. Food Chem. 56: 2079–2084
Fanrong, Z., S. Ali, H. Zhang, Y. Ouyang, B. Qiu, F. Wu and G. Zhang. 2011. The influence
of pH and organic matter content in paddy soil on heavy metal availability and their
uptake by rice plants. Environ. Pollut. 159: 84-91.
FAO. 2014. The State of Food Insecurity in the World 2014, FAO.

112
FAO. 2015. The State of Food Insecurity in the World 2015. Meeting the 2015 international
hunger targets: taking stock of uneven progress. Rome, FAO.
Fardet, A., E. Rock and C. Remesy. 2008. Is the in vitro antioxidant potential of whole-grain
cereals and cereal products well reflected in vivo? J. Cereal Sci. 48: 258-276.
Fitzgerald, M.A., S.R. McCouch, and R.D. Hall. 2009. Not just a grain of rice: The quest for
quality. Trend. Plant Sci. 14: 133–139.
Frossard, E., M. Bucher, F. Ma- chler, A. Mozafar and R. Hurrell. 2000. Potential for
increasing the content and bioavailability of Fe, Zn, and Ca in plants for human
nutrition. J. Sci. Food Agri. 80: 861–879.
Gao, M.X., Z.Y. Hu and G.D. Wang. 2010. Effect of elemental sulfur supply on cadmium
uptake into rice seedlings when cultivated in low and excess cadmium soils.
Commun. Soil Sci. Plant Anal. 41: 990–1003.
Gârban, G., R. Silaghi-Dumitrescu, H. Ioniţă, Z. Gârban., N.G Hădărugă, G.D. Ghibu, C.
Baltă, F.D. Simiz and C. Mitar. 2013. Influence of novel gallium complexes on the
homeostasis of some biochemical and hematological parameters in rats. Biol. Trace.
Elem. Res. 155: 387–395
Gârban, Z., G. Dancău, G. Daranyi, R. Erdelean, G. Văcărescu, V. Precob, I. Eremia and C.
Udrişte. 1989. Implication of chronobiochemistry–metabolism relationship in the
induction of homeostasis changes. I. The action of cis-platinum on hepatic DNA
biosynthesis and on some serum metabolites in rats. Rev. Roum. Biochim. 26: 107–
117.
Garcia, E.R., E.G. Hernandez and B.G. Villanova. 1999. Phytic acid content in milled
cereal products and breads. Food Res. Int. 32: 217–221.
Garcia-Mina, J., G.R. Cantera and A. Zamarreno. 2003. Interaction of different iron chelates
with and alkaline and calcaresous soil: a complementaty methodology to evaluate the
performance of iron compounds in the correction of iron chlorosis. J. Plant Nutr. 26:
1943-1954.

113
Gardiner, D.T., R.W. Miller, B. Badamchian, A.S. Azzari and D.R. Sisso. 1995. Effects of
repeated sewage sludge applications on plant accumulation of heavy metals. Agric.
Ecosys. Environ. 55: 1–6.
Gartler, J., B. Robinson, K. Burton and L. Clucas. 2013. Carbonaceous soil amendments to
biofortify crop plants with zinc. Sci. Total Environ. 465: 308–313.
Gautam, S., K. Patel and K. Srinivasan. 2010. Higher bioaccessibility of iron and zinc from
food grains in the presence of garlic and onion. J. Agri. Food Chem. 58: 8426-8429.
Gee, G.W. and J.W. Bauder. 1986. Particle-size analysis. p. 383–409. In: A. Klute (ed.)
Methods Soil Anal. Part 1: Physical and mineralogical methods. Agron. Monogr. 9.,
Soil Sci. Soc. Am., Madison, USA.
Gibson, R.S., K.B. Bailey, M. Gibbs and E.L. Ferguson. 2010. A review of phytate, iron,
zinc, and calcium concentrations in plant-based complementary foods used in low-
income countries and implications for bioavailability. Food Nutr. Bull. 31:134–146
Gielen, M. and E.R.T. Tiekink. (eds) (2005) Metallotherapeutic drugs and metal-based
diagnostic agents: the use of metals in medicine. Wiley, Chichester.
Golub, M.S., C.E. Hogrefe, K.F. Widaman and J.P. Capitanio. 2009. Iron deficiency anemia
and affective response in rhesus monkey infants. Dev. Psychobiol. 51: 47–59
Gómez-Alonso, S., E. García-Romere and I. Hermosín- Gutiérrez. 2007. HPLC analysis of
diverse grape and wine phenolics using direct injection and multidetection by DAD
fluorescence. J. Food Com. Anal. 20: 618-626.
Goodman, B.A. 1987. The characterization of Fe complexes with soil organic matter. pp.
677-687. In: J. W. Stucki, B. A. Goodman and U. Schwertmann (Eds.). Iron in soil
and clay minerals. Reidel, Dordrecht. The Netherlands.
Goto F. and Yoshihara T. 2001 Improvement of micronutrient contents by genetic
engineering – development of high iron content crops. Plant Biotechnol. 18: 7–15.
114
Goto, F., T. Yoshihara, N. Shigemoto, S. Toki and F. Takaiwa. 1999. Iron fortification of rice
seed by the soybean ferritin gene. Nat. Biotechnol. 17: 282–286.
Graber, E.R., L. Tsechansky, B. Lew and E. Cohen. 2014. Reducing capacity of water
extracts of biochars and their solubilization of soil Mn and Fe. Eur. J. Soil Sci. 65:
162–172.
Graber, E.R., Y.M. Harel, M. Kolton, E. Cytryn, A. Silber, D.R. David, L. Tsechansky, M.Y.
Borenshtein and Y. Elad. 2010. Biochar impact on development and productivity of
pepper and tomato grown in fertigated soilless media. Plant Soil. 337: 481–496.
Graham, R.., D. Senadhira, S. Beebe, C. Iglesias and I. Monasterio. 1999. Breeding for
micronutrient density in edible portions of staple food crops: conventional
approaches. Field Crops Res. 60: 57–80.
Graham, R.D. 2003. Biofortification: a global challenge. Int. Rice Res. Notes 28: 4–8.
Graham, R.D., R.M. Welch and H.E. Bouis. 2001. Addressing micronutrient malnutrition
through enhancing the nutritional quality of staple foods: principles, perspectives and
knowledge gaps. Advanc. Agron. 70: 77–142.
Gregorio, G., D. Senadhira, H. Htut and R.R. Graham. 2000. Breeding for trace mineral
density in rice. Food Nutr. Bull. 21: 382–386.
Grusak, M.A. and P.D. Della. 1999. Improving the nutrient composition of plants to enhance
human nutrition and health. Annu. Rev. Plant Physiol. Plant Mol. Biol. 50: 133-161.
Gupta, G. and W. Gardner. 2005. Use of clay mineral (montmorillonite) for reducing poultry
litter leachate toxicity (EC50). J. Hazard. Mat. 118: 81–83.
Haas, J.D., J.L. Beard, L.E. Murray-Kolb, A.M. del Mundo, A. Felix and G.B. Gregorio.
2005. Iron-biofortified rice improves the iron stores of non-anemic Filipino women. J.
Nutri. 135: 2823–2830.
115
Habib, M. 2009. Effect of foliar application of Zn and Fe on wheat yield and quality. Afr. J.
Biotech. 8: 6795-6798.
Hallberg, L., M. Brune and L. Rossander. 1989. Iron absorption in man: ascorbic acid and
dose-dependent inhibition by phytate. Am. J. Clin. Nutr. 49: 140–144.
Hammond, J., S. Shackley, M. Prendergast-Miller, J. Cook, S. Buckingham and V.P. Pappa.
2013. Biochar field testing in the UK: Outcomes and implications for use. Carbon
Manag. 4: 159–170.
Hansen, N.C., V.D. Jolley, S.L. Naeve and R.J. Goos. 2004. Iron deficiency of soybean in the
north central US and associated soil properties. Soil Sci. Plant Nutr. 50: 983-987.
Hass, J.D., J.L. Beard, L.E. Murray-Kolb, A.M. del Mundo, A. Felix and G.B. Gregorio.
2005. Iron-biofortified rice improves the iron stores of non-anemic Filipino women. J.
Nutr. 135: 2823–2830.
Hassan, N.A. and R.A.Olson.1966. Influence of applied sulphur on availability of soil
nutrients for corn nutrition. Soil Sci. Am. Proc.30: 286-288.
Hati, K.M., K.G. Mandal, A.K. Misra, P.K. Ghosh and K.K. Bandyopadhyay. 2006. Effect of
inorganic fertilizer and farmyard manure on soil physical properties root distribution,
and water-use eciency of soybean in Vertisols of central India. Bioresour. Technol.
97: 2182–2188.
Haug, W. and H. Lantzsch. 1983. Sensitive method for the rapid determination of phytate in
cereals and cereal products. J. Sci. Food Agric. 34: 1423–1426.
Hegde, N., M.W. Rich and C. Gayomali. 2006. The cardiomyopathy of iron deficiency.
Texas Heart Insti. J. 33: 340-344.
Hess, S.Y. and J.C. King. 2009. Effects of maternal zinc supplementation on pregnancy and
lactation outcomes. Food Nutr. Bull. 30: 60–78.

116
Heydarnezhad, F., P. Shahinrokhsa, H.S. Vahed and H. Besharati. 2012. Influence of
elemental sulfur and sulfur oxidizing bacteria on some nutrient deficiency in
calcareous soils. Inter. J. Agri. Crop Sci. 4: 735-739.
Hinsinger, P., A.G. Bengough, D. Vetterlein and I.M. Young. 2009. Rhizosphere: biophysics,
biogeochemistry and ecological relevance. Plant Soil. 321: 117-152.
Hoefer, C., J. Santner, M. Puschenreiter and W.W. Wenzel. 2015. Localized metal
solubilization in the rhizosphere of Salix smithiana upon sulfur application. Environ.
Sci. Technol. 49: 4522-4529.
Holden, M.J., D.G. Luster, R.L. Chaney, T.J. Buckout and C. Robinson. 1991. Fe3+-chelate
reductase activity of plasma membranes isolated from tomato (Lycopersicon
esculentum Mill.) roots. Plant Physiol. 197: 537–544.
Hori, A., T. Mizoue, H. Kasai, K. Kawai, Y. Matsushita, A. Nanri, M. Sato and M. Ohta.
2010. Body iron store as a predictor of oxidative DNA damage in healthy men and
women. Cancer Sci.101: 517–522.
Hu, Z.Y. and C.K. Xu. 2002. Soil sulfur and environmental quality. In Behaviors of chemical
substances in soils and environmental quality, ed. H.M. Chen, 283–307. Beijing,
China: Science Press.
Hu, Z.Y., Y.G. Zhu, M. Li, L.G. Zhang, Z.H. Cao and F.A. Smith. 2007. Sulfur (S)–induced
enhancement of iron plaque formation in the rhizosphere reduces arsenic
accumulation in rice (Oryza sativa L.) seedlings. Environ. Pollut. 147: 387–393.
Hunt, J. 2003. Bioavailability of iron, zinc, and other trace minerals from vegetarian diets.
Am. J. Clin. Nutr. 78: 633–639.
Hurrell, R. and I. Egli. 2010. Iron bioavailability and dietary reference values. Am. J. Clin.
Nutr. 91: 1461-1467.

117
Hurrell, R. F., M.B. Reddy, M.A. Juillerat and J.D. Cook. 2003. Degradation of phytic acid
in cereal porridges improves iron absorption by human subjects. Am. J. Clin. Nutr.
77: 1213−1219.
Hurrell, R.F. 2002. Fortification: overcoming technical and practical barriers. J. Nutri. 132:
806-812.
Hussain, S., M.A. Maqsood ans L.V. Miller. 2012a. Bioavailable zinc in grains of bread
wheat varieties of Pakistan. Cereal Res. Commun. 40: 62–73.
Ibrahim, W., U.S. Lee, C.C. Yeh, J. Szabo, G. Bruckner and C.K. Chow. 1997. Oxidative
stress and antioxidant status in mouse liver: effects of dietary lipid, vitamin E and
iron. J. Nutr. 127: 1401-1406.
Idris, W.H., S.M. Abd El Rahaman, H.B. El Maki, E.E. Babiker and A.H. El Tinay. 2006.
Effect of malt pretreatment on phytate and tannin level of two sorghum (Sorghum
bicolor) cultivars. Int. J. Food Sci. Technol. 41: 1229–1233.
Imdad, A. and Z.A. Bhutta. 2012. Routine iron/folate supplementation during pregnancy:
effect on maternal anaemia and birth outcomes. Paediatric and perinatal
epidemiology. 26(s1): 168-177.
Iqbal, M., M. Puschenreiter, E. Oburger, J. Santner and W.W. Wenzel. 2012. Sulfur-aided
phytoextraction of Cd and Zn by Salix smithiana combined with in situ metal
immobilization by gravel sludge and red mud. Environ. Pollut. 170: 222-231.
Jackson, M.L. 1962. Soil Chemical Analysis. Constable and Co. Ltd., London, UK
Jeffery, S., T.M. Bezemer, G. Cornelissen, T.W. Kuyper, J. Lehmann , L. Mommer, S.P.
Sohi, T.F.J. van de Voorde, D.A. Wardle and J.W. Van Groenigen. 2015. The way
forward in biochar research: targeting trade-offs between the potential wins. Glob.
Change Biol. Bioenergy. 7: 1–13.

118
Jeong, J. and M.L. Guerinot. 2008. Biofortified and bioavailable: The gold standard for
plant- based diets. Proc. Nat. Acad. of Sci. of the United States of Am. 105:
1777–1778
Jin, C.W., X.H. Yu and S.J. Zhao. 2005. Latent function of microorganisms on plant iron
acquisition. Plant Nutr. Fertil. Sci. 11: 688–695.
Jin, F.X., C. Frohman, T.W. Thannhauser, R.M. Welch and R.P. Glahn. 2009. Effects of
ascorbic acid, phytic acid and tannic acid on iron bioavailability from reconstituted
ferritin measured by an in vitro digestion-Caco-2 cell model. Br. J. Nutr. 101:
972−981.
Jomova, K. and M. Valko. 2011. Advances in metal-induced oxidative stress and human
disease. Toxicology 283: 65–87.
Jones, J.R.J. and V.W. Case. 1990. Sampling, handling, and analyzing plant tissue samples.
In: Westerman RL (ed) Soil testing and plant analysis. Soil Science Society of
America, Madison, pp 389–428.
Jou, M.Y., X. Du, C. Hotz and B. Lonnerdal. 2012. Biofortification of rice with zinc:
assessment of the relative bioavailability of zinc in a Caco-2 cell model and suckling
rat pups. J. Agric. Food Chem. 60: 3650−3657.
Kabir, A.H., N.G. Paltridge, U. Rossener and J.C.R. Stangoulis. 2013. Mechanisms
associated with Fe-deficiency tolerance and signalling in shoots of Pisum sativum L.
Physiologia Planta. 147: 381–395.
Kaiser, D.E., A.P. Mallarino and J.E. Sawyer. 2010. Utilization of poultry manure
phosphorus for corn production. Soil Sci. Soc. Am. J. 74: 2211–2222.
Kalbasi, M. and H. Sharimatmadari. 1993. Blood powder, a source of iron for plants. J. Plant
Nutr. 16: 2213-2223.

119
Kamei, A., Y. Watanabe, T. Ishijima, M. Uehara, S. Arai, H. Kato, Y. Nakai and K. Abe.
2010. Dietary iron deficient anemia induces a variety of metabolic changes and even
apoptosis in rat liver: A DNA microarray study. Physiol. Genomics. 42: 149–156.
Kaplan, M. and S. Orman. 1998. Effect of elemental sulfur and sulfur containing waste in a
calcareous soil in Turkey. J. Plant Nutr. 21: 1655-1665.
Kappler, A., M.L. Wuestner, A. Ruecker, J. Harter, M. Halama and S. Behrens. 2014.
Biochar: As an electron shuttle between bacteria and Fe (III) minerals. Environ. Sci.
Technol. Lett. 1: 339–344.
Katkat, A.V., A. Ozgumus, H. Basar and B. Altınel. 1994. Iron, manganese, zinc and copper
nutrition of peach trees growing in the Bursa region. Turk. J. Agric. For. 18: 447-456.
Katsumata, S., R. Katsumata-Tsuboi, M. Uehara and K. Suzuki. 2009. Severe iron deficiency
decreases both bone formation and bone resorption in rats. J. Nutr. 139: 238–243.
Kavamura, V.N., S.N. Santos, J.L. Silva, M.M. Parma, L.A. Avila, A. Visconti, T.D. Zucchi,
R.G. Taketani, F.D. Andreote and I.S. Melo. 2013. Screening of Brazilian cacti
rhizobacteria for plant growth promotion under drought. Microbiol. Res. 168: 183-
191.
Kennedy, G., G. Nantel and P. Shetty. 2003. The scourge of ‘‘hidden hunger’’: global
dimensions of micronutrient deficiencies. Food Nutr. Agric. 32: 8–16.
Kimetu, J.M., J. Lehmann, S.O. Ngoze, D.N. Mugendi, J.M. Kinyangi, S. Riha, L. Verchot,
J.W. Recha and A.N. Pell. 2008. Reversibility of soil productivity decline with
organic matter of differing quality along a degradation gradient. Ecosystems 11: 726–
739.
King, S.M., C.M. Donangelo, M.D. Knutson, P.B. Walter, B.N. Ames, F.E. Viteri and J.C.
King. 2008. Daily supplementation with iron increases lipid peroxidation in young
women with low iron stores. Exp. Biol. Med. (Maywood) 233: 701–707
120
Kingery, W.L., C.W. Wood, D.P. Delaney and J.L. Mullins. 1994. Impact of long-term land
application of broiler litter on environmentally related soil properties. J. Environ.
Qual. 23: 139–147.
Knight, G.J., V. Heese Hde, W.S. Dempster and G. Kirsten. 1983. Diagnosis of iron
deficiency: mean corpuscular hemoglobin (MCH) as a predictor of iron deficiency in
infants. Pediatr. Res. 17: 168–170.
Kobayashi, T. and N.K. Nishizawa, 2012. Iron uptake ,translocation, and regulation in higher
plants. Annu. Rev. Plant Biol. 63: 131–152.
Kojima, R., J.D. Randall, E. Ho, H. Manshio, Y. Suzuki and S.R. Gullans. 2004. Regulation
of expression of the stress response gene. Biochem. J. 380: 783–794.
Kosegarten, H., B. Hoffmann, E. Rroco, F. Grolig, K. Glusenkamp and K. Mengel. 2004.
Apoplastie pH and Fe3+ reduction in young sunflower (Helianthus annuus) roots.
Physiol. Plant. 122: 95-106.
Kuvibidila, S.R., M. Velez, R. Gardner, K. Penugonda, L.C. Chandra and Y. Yu. 2012. Iron
deficiency reduces serum and in vitro secretion of interleukin-4 in mice independent
of altered spleen cell proliferation. Nutr. Res. 32: 107–115.
Laird, D., P. Fleming, B. Wang, R. Horton and D. Karlen. 2010. Biochar impact on nutrient
leaching from a Midwestern agricultural soil. Geoderma. 158: 436-442.
Latimer, W.M. 1952. The oxidation status of elements and their potentials in aqueous
solutions. 2 ed. New York. Prentice, Hall Inc.
Lawrence, J.R. and J.J. Germida. 1988. Relationship between microbial biomass and
elemental sulfur oxidation in agricultural soils. Soil Sci. Soc. Am. J. 52: 672-677.
Lee, S., J.S. Jeon and G. An. 2012b. Iron homeostasis and fortification in rice. J. Plant Biol.
55: 261–267.

121
Lehmann, J., M.C. Rillig, J. Thies, C.A. Masiello, W.C. Hockaday and D. Crowley. 2011.
Biochar effects on soil biota: a review. Soil Biol. Biochem. 43: 1812–1836.
Lewu, M.N., P.O. Adebola and A.J. Afolayan. 2010. Effect of cooking on the mineral
contents and anti-nutritional factors in seven accessions of Colocasia esculenta (L.)
Schott growing in South Africa. J. Food Comp. Anal. 23: 389–393.
Li, M., L.G. Zhang and Z.Y. Hu. 2007. Elemental sulphur oxidation in the rhizosphere of rice
and its impact on iron, manganese, phosphorus, and sulphur uptake in rice. J. Anhui.
Agri. Uni. 34: 426–431.
Lindemann, W.C., J.J. Aburtto, W.M. Haffner and A.A. Bono. 1991. Effect of sulfur source
on sulfur oxidation. Soil Sci. Soc. Am. J. 55: 85-90.
Lindsay, W.L. 1995. Chemical reactions in soils that affect iron availability to plants: A
quantitative approach. pp. 7-14. In: J. Abadia (Ed). Iron nutrition in soil and plants.
Kulwer Acacdemic Publishers. Dordrecht. The Netherlands.
Lindsay, W.L. 1979. Chemical equilibrium in soil. Wileyinter-science, New York.
Lindsay, W.L. and W.A. Norvell. 1978. Development of a DTPA soil test for zinc, iron,
manganese and copper. Soil Sci. Soc. Am. J. 42: 421–428.
Lippman, J.G., H.C. Mclean and H.C. Lint. 1916. The oxidation of sulfur in soils as a means
of increasing the availability of mineral sulphates. Soil Sci. 1: 533–539.
Liu, W.J. and Y.G. Zhu. 2005. Iron and Mn plaques on the surface of roots of wetland plants.
Acta. Ecologica. Sinica. 25: 358–363.
Liu, X.Y., A.F. Zhang, C.Y. Ji, S. Joseph, R.J. Bian, L.Q. Li, G.X. Pan and J. Paz-Ferreiro.
2013. Biochar’s effect on crop productivity and the dependence on experimental
conditions-a meta-analysis of literature data. Plant Soil. 373: 583–594.
Liyana-Pathirana, C.M. and F. Shahidi. 2005. Optimization of extraction of phenolic
compounds from wheat using response surface methodology. Food Chem. 93: 47–56.

122
Loeppert, R.H. 1988. Chemistry of iron in calcareous systems. In" Iron in soils and clay
minerals" J.W. Stucki, et. al. (eds). D. Reidel. pp. 689-713.
Lonnerdal B. 2007. The importance and bioavailability of phytoferritin- bound iron in cereals
and legume foods. Int. J. Vitam. Nutr. Res. 77: 152–157.
Lonnerdal, B., A. Bryant, L. Xiaofeng and L. Theil. 2006. Iron absorption from soybean
ferritin in nonanemic women. Am. J. Clin. Nutr. 83: 103–107.
López-Millán, A.F., F. Morales, A. Abadía and J. Abadía. 2001. Changes induced by Fe
deficiency and Fe resupply in the organic acid metabolism of sugar beet (Beta
vulgaris) leaves. Physiol. Plant. 112: 31–38.
Lorenz, K. and R. Lal. 2014. Biochar application to soil for climate change mitigation by soil
organic carbon sequestration. J. Plant Nutr. Soil Sci. 177: 651–670.
Low, M., A. Farrell, B.A. Biggs and S.R. Pasricha. 2013. Effects of daily iron
supplementation in primary-school-aged children: systematic review and meta-
analysis of randomized controlled trials. Can. Med. Assoc. J. 185: 791–802
Lozoff, B. and M.K. Georgieff. 2006. Iron deficiency and brain development. Semin. Pediatr.
Neurol. 13: 158–165.
Lukac, R.J., M.A. Aluru and M.B. Reddy. 2009. Quantification of ferritin from staple food
crops. J. Agri. Food. Chem. 57: 2155–2161.
Malakouti, M.J. and N. Gheibi. 1988. Determine the critical nutrients strategic and proper
fertilizer recommendations in the country. Publication of agricultural education,
training and equipping the human resources department of Tat, the Ministry of
Agriculture, Karaj, Iran
Malakouti, M.J. and S.A.H. Riazi Hamedani. 1991. Fertilizer and Fertility. University of
Tehran press.

123
Marschner, H. 1995. Mineral Nutrition of Higher Plants.2nd Ed. Academic Press Inc., San
Diego, USA.
Martínez, C., J. Borrero, R. Taboada, J.L. Viana, P. Neves and L. Narvaez. 2010. Rice
cultivars with enhanced iron and zinc content to improve human nutrition. Paper
Presenteda the 28th International Rice Research Conference, Hanoi.
Masuda, H., M. Suzuki, K.C. Morikawa, T. Kobayashi, H. Nakanishi and M. Takahashi.
2008. Increase in iron and zinc concentrations in rice grains via the introduction of
barley genes involved in phytosiderophore synthesis. Rice. 1: 100–108.
Masuda, H., T. Kobayashi, Y. Ishimaru, M. Takahashi, M.S. Aung, H. Nakanishi, S. Mori
and N.K. Nishizawa. 2013. Iron-biofortification in rice by the introduction of three
barley genes participated in mugineic acid biosynthesis with soybean ferritin gene.
Front. Plant Sci. 4: 132: 1–12.
Masuda, H., Y. Ishimaru, M.S. Aung, T. Kobayashi, Y. Kakei and M. Takahashi. 2012. Iron
biofortification in rice by the introduction of multiple genes involved in iron
nutrition. Sci. Rep. 2: 1–7.
Mata, C.G., L. Lamattina and R.O. Cassia. 2001. Involvement of iron and ferritin in the
potato- Phytophera infestans interaction. Euro. J. Plant Pathol. 107: 557-562.
Matz, S.A. 1991. The chemistry and technology of cereals as food and feed. AVI Book
Springer
May, L., E.R. Morris and R. Ellis. 1980. Chemical identity of iron in wheat by Mossbauer
spectroscopy. J. Agric. Food Chem. 28: 1004–1006.
Mayer, J. E., W. H. Pfeiffer and P. Beyer. 2008. Biofortified crops to alleviate micronutrient
malnutrition. Curr. Opin. Plant Biol. 11: 166–170.
McCauley, A., C. Jones and J. Jacobsen. 2009. Soil pH and organic matter. (Nutrient
management modules 8, #4449-8). Montana State University Extension Service,
Bozeman, Montana, 1-12.

124
McDonagh, M.S., I. Blazina, T. Dana, A. Cantor, and C. Bougatsos. 2015. Screening and
routine supplementation for iron deficiency anemia: A Systematic
Review. Pediatrics. 135: 723-733
Mengel, K. and E.A. Kirkby. 1987. Principles of Plant Nutrition. 4th Ed. International Potash
Institute. Bern, Switzerland.
Mimura, É.C.M., J.W. Breganó, J.B. Dichi, E.P. Gregório and I. Dichi. 2008. Comparison of
ferrous sulfate and ferrous glycinate chelate for the treatment of iron deficiency
anemia in gastrectomized patients. Nutr. 24: 663–668
Min, L., Z. Li-gan, H. Zheng-yi. 2007. Elemental sulphur oxidation in the rhizosphere of rice
and its impact on iron, manganese, phosphorus, and sulphur uptake in rice. J. Anhui
Agric. Univ. 34: 426–431.
Modaihsh, S., W.A. Al-mustafa and A.E. Metwally. 1989. Effect of elemental sulfur on
chemical changes and nutrient availability in calcareous soils. Plant Soil. 116: 95-
101.
Modepalli, N., S. Jo, M.A. Repka and S.N. Murthy. 2013. Microporation and
‘iron’tophoresis for treating iron deficiency anemia, Pharm. Res. 30: 889–898.
Moore, P.A., T.C. Daniel, A.N. Sharpley and C.W. Wood. 1995. Poultry manure
management: environmentally sound options. J. Soil Water Conserv. 50: 321–327.
Mortvedt, J.J. 2000. Bioavailability of micronutrients. In Handbook of Soil Sci. (M.E.
Sumer, Ed.). 78-81.
Mühlbachová, G., T. Simon and M. Pechová. 2005. The availability of Cd, Pb and Zn and
their relationships with soil pH and microbial biomass in soils amended by natural
clinoptilolite. Plant Soil Environ. 51: 26–33.
Murase, J. and M. Kimura. 1997. Anaerobic reoxidation of Mn2+, Fe2+, S0, and S2– in
submerged paddy soil. Biol. Fertil. Soil. 25: 302–306.

125
Murata, Y., J.F. Ma, N. Yamaji, D. Ueno, K. Nomoto and T. Iwashita. 2008. A specific
transporter for iron (III)- phytosiderophore in barley roots. Plant J. 46: 563–572.
Murray, C.J.L. ans A.D. Lopez. 2013. Measuring the global burden of disease. N. Engl. J.
Med. 369: 448–457.
Murray-Kolb, L.E. and J. L. Beard. 2009. Iron deficiency and child and maternal health. Am.
J. Clin. Nutr. 89: 946–950.
Murray-Kolb, L., F. Takaiwa and F. Goto. 2002. Transgenic rice is a source of iron for iron-
depleted rats. J. Nutr. 132: 957−960.
Murray-Kolb, L.E., R. Welch, E.C. Theil and J.L. Beard. 2003. Women with low iron stores
absorb iron from soybeans. Am. J. Clin. Nutr. 77: 180–184.
Na, G.N. and D.E. Salt. 2011. The role of sulfur assimilation and sulfur-containing
compounds in trace element homeostasis in plants. Environ. Exp. Bot. 72: 18–25.
Nagesh, R.V., G. Usharani and R.T. Dayakar. 2012. Heterosis studies for grain iron and zinc
content in rice (Oryza sativa L.). Anal. Biol. Res. 3: 179–184.
Naigamwalla, D.Z., J.A. Webb and U. Giger. 2012. Iron deficiency anemia. Can. Vet. J. 53:
250-256
Nelson, D.W and L.E. Sommers. 1982. Total carbon, organic carbon and organic matter. In:
Klute A (ed) Methods of soil analysis, Part 2: chemical and microbiological
properties. Soil Sci Soci Amer Madison pp 570–571.
Ngo, P.T., C. Rumpel, T.D. Thu, T.H.D. Tureaux, D.K. Dang and P. Jouquet. 2014. Use of
organic substrates for increasing soil organic matter quality and carbon sequestration
of tropical degraded soil: a 3-year mesocosms experiment. Carbon Manage. 5: 155-
168.
Niazmi, M.I. and N.A. Khan. 1989. The effect of soil crust on yield of maize crop on three
soil families under rainfed condition. Pak. J. Soil Sci. 4: 25-29.

126
Novak, J. M., I.M. Lima, B. Xing, J.W. Gaskin, C. Steiner, K.C. Das, M. Ahmedna, D.
Rehrah, D.W. Watts, W.J. Busscher and H. Schomberg. 2009. Charcaterization of
designer biochar produced at different temperatures and their effects on a loamy sand.
Ann. Environ. Sci. 3: 195-206.
Nyamangara, J. 1998. Use of sequential extraction to evaluate zinc and copper in a soil
amended with sewage sludge and inorganic metal salts. Agric. Ecosys. Environ. 69:
135–141.
Oliva, N., P. Chadha-Mohanty, S. Poletti, E. Abrigo, G. Atienza and L. Torrizo. 2014. Large
scale production and evaluation of marker-free indica rice IR64 expressing
phytoferritin genes. Mol. Breed. 33: 23–37.
Osman, M.A. 2011. Effect of traditional fermentation process on the nutrient and antinutrient
contents of pearl millet during preparation of Lohoh. J. Saudi Soc. Agric. Sci. 10: 1–
6.
Pahlavan-Rad, M. and M. Pessarakli. 2009. Response of wheat plants to zinc, iron, and
manganese applications and uptake and concentration of zinc, iron, and manganese in
wheat grains. Commun. Soil Sci. Plant Anal. 40: 1322-1332.
Palmgren, M.G., S. Clemens, L.E. Williams, U. Kramer, S. Borg, J.K. Schjorriing and D.
Sanders. 2008. Zinc biofortification of cereals: problems and solutions. Trends Plant
Sci. 13: 464-473.
Park, H.J., G.K. Choppala, N.S. Bolan, J.W. Chung and T. Chuasavathi. 2011. Biochar
reduces the bioavailability and phytotoxicity of heavy metals. Plant Soil. 348: 439–
451.
Perez-Jimenez, J. and F. Saura-Calixto. 2005. Literature data may underestimate the actual
antioxidant capacity of cereals. J. Agric. Food Chem. 53: 5036–5040.
Pestana, M., A. de Vsrennes and E.A. Faria. 2003. Diagnosis and correction of iron chlorosis
in fruit trees: A Review. Food Agric. Environ. 1: 46-51.

127
Pollock, A.S., D.A. Lipschitz and J.D. Cook. 1978. The kinetics of serum ferritin, Exp. Biol.
Med. 157: 481–485.
Powell, J.J., W.B. Cook, C. Hutchinson, Z. Tolkien, M. Chatfield, D.I. Pereira and M.C.E.
Lomer. 2013. Dietary fortificant iron intake is negatively associated with quality of
life in patients with mildly active inflammatory bowel disease. Nutr. Metab. 10: 9–22
Pronk, J.T., J.C. de Bruyn, P. Bos and J.G. Kuenen. 1992. Anaerobic growth of Thiobacillus
ferrooxidans. Appl. Environ. Microbiol. 58: 2227–2230.
Raboy, V., P.F. Gerbasi, K.A. Young, S.D. Stoneberg, S.G. Pickett, A.T. Bauman, P.P.N.
Murthy, W.F. Sheridan and D.S. Ertl. 2000. Origin and seed phenotype of maize low
phytic acid 1-1 and low phytic acid 2-1. Plant Physiol. 124: 355–368.
Rajkovich, S., A. Enders, K. Hanley, C. Hyland, A.R. Zimmerman and J. Lehmann. 2012.
Corn growth and nitrogen nutrition after additions of biochars with varying properties
to a temperate soil. Biol. Fertil. Soil. 48: 271–284.
Rashid, A. and J. Ryan. 2004. Micronutrient constraints to crop production in soils with
Mediterranean-type characteristics: review. J. Plant Nutr. 27: 959-975.
Reddy, M.B., R.F. Hurrell and J.D. Cook. 2000. Estimation of nonheme-iron bioavailability
from meal composition. Am. J. Clin. Nutr. 71: 937–943.
Reddy, M.B., R.F. Hurrell and J.D. Cook. 2006. Meat consumption in a varied diet
marginally influences nonheme iron absorption in normal individuals. J. Nutr. 136:
576–581.
Reinhold, J.G., A. Lahimgarzadeh, K. Nasr and H. Hedayati. 1973. Effects of purified
phytate and phytate-rich bread upon metabolism of zinc, calcium, phosphorus, and
nitrogen in man. Lancet. 301: 283-288.
Rengel, Z., G.D. Batten and D.E. Crowley. 1998. Agronomic approaches for improving the
micronutrient density in edible portions of field crops. Field Crops Res. 60: 27-40.

128
Richards, L.A. 1954. Diagnosis and improvement of saline and alkali soils. USDA Agric.
Handbook 60. Washington DC.
Rodrıguez-Lucena, P., E. Ropero, L. Hernandez-Apaolaza and J.J. Lucena. 2010. Iron supply
to soybean plants through the foliar application of IDHA/Fe3+ effect of plant
nutritional status and adjuvants. J. Sci. Food Agric. 90: 2633–2640.
Rosado, R., M.C. del Campillo and J. Torrent. 2000. Long term effectiveness of vivianite in
reducing iron chlorois in olive trees. Plant Soil. 241: 139-144.
Ruiz Diaz, D.A., J.E. Sawyer and A.P. Mallarino. 2011. On-farm evaluation of poultry
manure as a nitrogen source for corn. Soil Sci. Soc. Am. J. 75: 729–737.
Sabbagh, T.E., N. Aliasgharzadeh, Y. Rameshknia, S.N. Rad and B. Tahmasebpoor. 2012.
Microbial sulfur oxidation effect on micronutrients availability of municipal compost
for wheat plant. Plant Sci. 2: 551–559.
Saltzman, A, E. Birol, H.E. Bouis, E. Boy, F.F. De Moura, Y. Islam, and W.H. Pfeiffer.
2013. Biofortification: progress toward a more nourishing future. Glob. Food Secur. 2
(1): 9–17. doi:10.1016/j. gfs.2012.12.003
Scholz-Ahrens, K.E. and J. Schrezenmeir. 2007. Inulin and oligofructose and mineral
metabolism: the evidence from animal trials. J. Nutr. 137: 2513-2523.
Schulz, H. and B. Glaser. 2012. Effects of biochar compared to organic and inorganic
fertilizers on soil quality and plant growth in a greenhouse experiment. J. Plant Nutr.
Soil Sci. 175: 410–422.
Schwertmann, U. 1991. Solubility and dissolution of iron-oxide. Plant Soil. 130: 1-25.
Schwertmann, U. and R.M. Taylor, 1989. Iron-oxides. In: J. B. Dixon and S. B. Weed
(Eds.). Minerals in the soil environment. SSSA, ASA: Madison, WI, USA. pp. 379-
438.

129
Seher, B.A., L. Ozturk, O.O. Gokmen, V. Ro¨mheld and I. Cakmak. 2011. Effect of nitrogen
on root release of phytosiderophores and root uptake of Fe(III)-phytosiderophore in
Fe-deficient wheat plants. Physiol. Plantarum. 142: 287–296.
Schulte, E.E. and K.A. Kelling. 2004. Understanding Plant Nutrients: Soil and Applied
Sulfur. University of Wisconsin-Extension, WI, USA: Cooperative Extension
Publications.
Sharma, A., Kapoor, A.C., 1997. Effect of processing on the nutritional quality of pearl
millet. J. Food Sci. Technol. 34: 50–53.
Shekhar, C. 2013. Hidden hunger: Addressing micronutrient deficiencies using improved
crop varieties. Chem. Biol. 20: 1305-1306.
Singh, M. and S.S. Dahiya. 1975. Effect of calcium carbonate and iron on availability of iron
in a light textured soil. J. Ind. Soc. Soil Sci. 23: 247-252.
Slaton, N.A., T.L. Roberts, B.R. Golden, W.J. Ross and R.J. Norman. 2013. Soybean
response to phosphorus and potassium supplied as inorganic fertilizer or poultry litter.
Agron. J. 105: 812–820.
Sleper, D.A. and J.M. Poehlman. 2006. Breeding Field Crops. 5th Ed. Blackwell Pub. 277-
281
Smól, J. 2001. Molecular properties of plant ferritin conditioning its biological functions and
practical applications. Dissertation, IChB PAN, Poznań.
Soumare, M., F.M.G. Tack and M.G. Verloo. 2007. Redistribution and availability of iron,
manganese, zinc, and copper in four Malian agricultural soils amended with solid
municipal waste compost. Commun. Soil Sci. Plant Anal. 38: 2567–2579.
Soumare, M., F.M.G. Tack and M.G. Verloo. 2003a. Ryegrass response to mineral
fertilization and organic amendment with municipal waste compost in two tropical
agricultural soils of Mali. J. Plant Nutr. 26: 1169–1188.

130
Sperotto, R.A., F.K. Ricachenevsky, V.A. Waldow and J.P. Fett. 2012a. Iron biofortification
in rice: it’s a long way to the top. Plant Sci. 190: 24–39.
Stein, A.J. 2010. Global impacts of human mineral malnutrition. Plant Soil. 335: 133-154.
Sullivan, G.T. 1935. Estimation of starch. Ind. Eng. Chem. Anal. Ed. 7: 311- 314.
Tagliavini, M. and A.D. Rambola. 2001. Iron deficiency and chlorosis in orchard and
vineyard ecosystems. Eur. J. Agron. 15: 71-92.
Taglivaini, M., A.D. Rombola and B. Marangoni. 1995. Response to iron-deficiency stress of
pear and quince genotypes. J. Plant Nutr. 18: 2465-2482.
Taglivaini, M., C. Zavalioni, A.D. Romola, M. Quartieri, D. Malahuti, F. Mazzanti. P.
Millard and B. Marangoni, 2000. Mineral nutrients partitioning to fruits of deciduous
trees. In: Proceedings XXV International Horticultural Congress ISHS, Bruxelles,
Belgium, 2-7 August 1998 Acta. Hortic. 512: 131-140.
Tako, E. and R.P. Glahn. 2011. White beans provide more bioavailable iron than redbeans:
studies in poultry (Gallus gallus) and an in vitro digestion/Caco-2model. Int. J.
Vitam Nutr. Res. 81: 1–14.
Tako, E., O.A. Hoekenga, L.V. Kochian and R.P. Glahn. 2013. High bioavailability iron
maize (Zea mays L.) developed through molecular breeding provides more
absorbable iron in vitro (Caco-2 model) and in vivo (Gallus gallus). Nutr. J. 12:
Doi: 10.1186/1475-2891-12-3
Tang, N., L. Chen and H. Zhuang. 2014. Effects of heme iron enriched peptide on iron
deficiency anemia in rats. Food Funct. 5: 390–399.
Tazeh, E.S., N. Aliasgharzadeh, Y. Rameshknia, S.N. Rad and B. Tahmasebpoor. 2012.
Microbial sulfur oxidation effect on micronutrients availability of municipal compost
for wheat plant. Plant Sci. 2: 551-559.

131
Theil, E. C., A. Huber, R. Poulos and T. Weighards. 2001. Ferritin. Handbook of
Metalloproteins; Messerschmidt Wiley: Chichester, U.K. 771-781
Theil, E.C. and J.F. Briat. 2004. Plant Ferritin and Non-Heme Iron Nutrition in Humans;
HarvestPlus Technical Monograph 1; International Food Policy Research Institute
and International Center for Tropical Agriculture: Washington DC.
Tisdale, S.L, W.L. Nelson, J.D. Beaton and J.L. Havlin. 1993. Soil fertility and fertilizers.
5th ed. Mcmillon publishing co._ New York Lawrence JR, Germida JJ. 1988.
Relationship between microbial biomass and elemental sulfur oxidation in
agricultural soils. Soil Sci. Soc. Am. J. 52: 672-677
Toulon, V., H. Sentenac, J.C. Davidian, C. Moulineau and C. Grignon. 1992. Role of
apoplast acidification by the H+ pump: Effect on the sensitivity to pH and CO2 of iron
reduction by roots of Brassica napus L. Planta. 186: 551–556.
Trost, L.B., W.F. Bergfeld and E. Calogeras. 2006. The diagnosis and treatment of iron
deficiency and its potential relationship to hair loss. J. Am. Aca. Dermatol. 54: 824-
844.
Turnlund, J.R., J.C. King, W.R. Keyes, B. Gong and M.C. Michel. 1984. A stable isotope
study of zinc absorption in young men: effects of phytate and α-cellulose. Am. J.
Clin. Nutr. 40: 1071–1077.
Ullah, I., G. Jilani, K.S. Khan, M.S. Akathar and M. Rasheed. 2013. Phosphorous
solubilization from phosphate rock by the interactive effect of Thiobacilli and
elemental sulfur. J. Agric. Res. 51: 431-442.
United Nation System Standing Committee on Nutrition (UNSSCN). 2010. 6th Report on the
World 20 Nutrition Situation, Geneva.
United Nations. 2012. World population prospects: The 2010 Revision.

132
Uprety, D., M. Hejcman, J. Száková, E. Kunzová and P. Tlustoˆs. 2009. Concentration of
trace elements in arable soil after long-term application of organic fertilizers. Nutr.
Cycl. Agroecosyst. 85: 241–252.
Uzoma, K.C., M. Inoue, H. Andry, H. Fujimaki, A. Zahoor and E. Nishihara. 2011. Effect of
cow manure biochar on maize productivity under sandy soil condition. Soil Manage.
27: 205–212.
Van Zwieten, L., S. Kimber, S. Morris, K.Y. Chan, A. Downie, J. Rust, S. Joseph and A.
Cowie. 2010. Effects of biochar from slow pyrolysis of papermill waste on agronomic
performance and soil fertility. Plant Soil. 327: 235–246.
Vrdoljak, G.A. and G. Sposito. 2002. Soil aggregate hierarchy in a Brazilian Oxisol. In:
Violante, A., Huang, P.M., Bollag, J.M., Gianfreda, L. (Eds.), Soil Mineral–
OrganicMatter–MicroOrganism Interactions and Ecosystem Health, Developments in
Soil Science, 28A. Elsevier Science, Amsterdam, pp. 197–217.
Vasconcelos, M., K. Datta, N. Oliva, M. Khalekuzzaman, L. Torrizo, S. Krishnan, M.
Oliveira, F. Goto and S.K. Datta. 2003. Enhanced iron and zinc accumulation in
transgenic rice with the ferritin gene. Plant Sci. 164: 371-378.
Wallace, A. 1991. Rational approaches to control iron deficiency other than plant breeding
and choice of resistant cultivars. Plant Soil. 130: 281-288.
Wallace, G. A. and A. Wallace. 1986. Correction of iron deficiency in tress by injection with
ferric ammonium citrate solution. J. Plant Nutr. 9: 981-986.
Wang, A.S., J.S. Angle, R.L. Chaney, T.A. Delorme and M. McIntosh. 2006. Changes in soil
biological activities under reduced soil pH during Thlaspi caerulescens
phytoextraction. Soil Biol. Biochem. 38: 1451-1461.
Wang, F.R., Z.G. Xie, X.Q. Ye, S.G. Deng, Y.Q. Hu, X. Guo and S.G. Chen. 2014.
Effectiveness of treatment of iron deficiency anemia in rats with squid ink melanin-
Fe. Food Funct. 5: 123–128.

133
Wardle, D.A., M.C. Nilsson and O. Zackrisson. 2008. Fire-derived charcoal causes loss of
forest humus. Sci. 320: 629-629.
Watanabe, F.S. and S.R. Olsen. 1965. Test of an ascorbic acid method for determining
phosphorus in water and NaHCO3 extracts. Soil Sci. Soc. Am. Proc. 29: 677-678.
Watts, D.B., H.A. Torbert, S.A. Prior and G. Huluka. 2010. Long-term tillage and poultry
litter impacts soil carbon and nitrogen mineralization and fertility. Soil Sci. Soc. Am.
J. 74: 1239–1247.
Weaver, C.M. and S. Kannan. 2002. Phytate and mineral bioavailability. In: Reddy NR,
Sathe SK (eds) Food phytate Florida: CRC. p. 211–223
Wei, Y., M. Shohag, X. Yang and Y. Zhang. 2012. Effects of foliar iron application on iron
concentration in polished rice grain and its bioavailability. J. Agric. Food Chem. 60:
11433–11439.
Welch, R. 2002. The impact of mineral nutrients in food crops on global human health. Plant
Soil. 247: 83–90.
Welch, R.M. and R.D. Graham. 2004. Breeding for micronutrients in staple food crops from
a human nutrition perspective. J. Exp. Bot. 55: 353–364.
Wen, J.C., Z.L. Zhang, S.L. Jin, L. Tang, J. Xu, and X.L. Tan. 2005. Iron and zinc contents
in Iaponica hybrid rice based on CMS-D1 system. Scientia Agricultura Sinica. 38:
l182–1187.
White, P.J. and M.R. Broadley. 2005. Biofortifying crops with essential mineral elements.
Trend. Plant Sci. 10: 586–593
White, P.J. and M.R. Broadley. 2009. Biofortification of crops with seven mineral elements
often lacking in human diets – iron, zinc, copper, calcium, magnesium, selenium and
iodine. New Phytol. 182: 49–84.

134
WHO. 2004. Iron, vitamin and mineral requirement in human. 12 nutrition, Second edition,
World Health Organization, Geneva. P. 246-272.
WHO. 2007. Micronutrient deficiencies: iron deficiency anaemia. Geneva: WHO.
WHO. 2010. Progress on the health-related Millennium Development Goals MDGs
WHO. 2011. Micronutrient Deficiencies, Iron Deficiency Anemia. Retrieved December 4.
http://www.who.int/nutrition/topics/ida/en/
Wiersma, J.V. 2005. High rates of Fe-EDDHA and seed iron concentration suggest partial
solutions to iron deficiency in soybean. Agron. J. 97: 924-934.
Winichagoon, P. 2002. Prevention and control of anemia: Thailand Experiences, J. Nutr. 132:
862-866.
Wirth, J., S. Poletti, B. Aeschlimann, N. Yakandawala, B. Drosse and S. Osorio. 2009. Rice
endosperm ironbiofortification by target edandsynergistic action of nicotianamine
synthase and ferritin. Plant Biotech. J. 7: 631–644.
Wo´jciak, R.W., E. Mojs, J. Kowalska and W. Samborski. 2012. The assessment of trace
elements nutritional habits in patients with HCV with or without interferon therapy.
Trace Elem. Electrol. 29: 189–193.
Woli, K.P., D.A. Ruiz-Diaz, D.E. Kaiser, A.P. Mallarino and J.E. Sawyer. 2015 Field-scale
evaluation of poultry manure as a combined nutrient resource for corn production.
Soil Fert. Crop Nutri. 107: 1789-1800.
Wu, C.Y.H., J. Lu and Z.Y. Hu. 2014. Influence of sulfur supply on the iron accumulation in
rice plants. Commun. Soil Sci. Plant Anal. 45: 1149–1161.
Xiao, C., X. Lei, Q. Wang, Z. Du, L. Jiang, S. Chen, M. Zhang, H. Zhang and F. Ren. 2015.
Effects of a tripeptide iron on iron-deficiency anemia in rats. Biol. Trace. Elem. Res.
169: 211-217.
135
Xu, G., L.L. Wei, J.N. Sun, H.B. Shao and S.X. Chang. 2013. What is more important for
enhancing nutrient bioavailability with biochar application into a sandy soil: Direct or
indirect mechanism? Ecol. Eng. 52: 119–124.
Yadav, G.S., Y.S. Shivay, D. Kumar and S. Babu. 2013. Enhancing iron density and uptake
in grain and straw of aerobic rice through mulching and rhizo-foliar fertilization of
iron. Afri. J. Agri. Res. 8: 5447-5454.
Yandigeri, M.S., K.K. Meena, D. Singh, N. Malviya, D.P. Singh, M.K. Solanki, A.K. Yadav
and D.K. Arora. 2012. Drought-tolerant endophytic actinobacteria promote growth of
wheat (Triticum aestivum) under water stress conditions. Plant Growth Regu. 68:
411-420.
Yang, B., W. Shu, Z. Ye, C. Lan and M. Wong. 2003. Growth and metal accumulation in
vetiver and two Sesbania species on lead/zinc mine tailings. Chemosphere 52: 1593–
1600.
Ye, X., S. Al-Babili, A. Klöti, J. Zhang, P. Lucca, P. Beyer and I. Potrykus. (2000).
Engineering the provitamin A (β-carotene) biosynthetic pathway into (carotenoid-
free) rice endosperm. Science 87: 303-305.
Yun, S., T. Zhang, M. Li, B. Chen and G. Zhao. 2011. Proanthocyanidins inhibit iron
absorption from soybean (Glycine max) seed ferritin in rats with iron deficiency
anemia. Plant Food Hum. Nutr. 66: 212–217.
Zhang, A., Y. Liu, G. Pan, Q. Hussain, L. Li, J. Zheng and X. Zheng. 2012. Effect of biochar
amendment on maize yield and greenhouse gas emissions from a soil organic carbon
poor calcareous loamy soil from central China plain. Plant Soil. 351: 263–275.
Zhao, G. 2010. Phytoferritin and its implications for human health and nutrition. Biochim.
Biophys. Acta. 1800: 815–823.
Zhao, K.L., X.M. Liu, J.M. Xu and H.M. Selim. 2010. Heavy metal contaminations in a soil-
rice system: Identification Identification of spatial dependence in relation to soil
properties of paddy fields. J. Hazard. Mat. 181: 778–787.

136
Zheng, L., Z. Cheng, C. Ai, X. Jiang, X. Bei and Y. Zheng. 2010. Nico-tianamine, a novel
enhancer of rice iron bioavailability to humans. PLoS ONE 5:e10190.
doi:10.1371/jour- nal.pone.0010190
Zhou, H., X. Peng, E. Perfect, T. Xiao and G. Peng. 2013. Effects of organic and inorganic
fertilization on soil aggregation in an ultisol as characterized by synchrotron based X-
ray micro-computed tomography. Geoderma 195–196: 23–30.
Zielińska-Dawidziak, M., I. Hertig, D. Piasecka-Kwiatkowska, H. Staniek, K.W. Nowak and
T. Twardowski. 2012. Study on iron availability from prepared soybean sprouts using
an iron-deficient rat model. Food Chem. 135: 2622–2627.
Zielińska-Dawidziak, M., I. Hertig, H. Staniek, D. Piasecka-Kwiatkowska and K.W. Nowak.
2014. Effect of iron status in rats on the absorption of metal ions from plant ferritin.
Plant Foods Hum. Nutr. 69: 101–107.
Zimmermann, M. B. and R. Hurrell. 2002. Improving iron, zinc and vitamin A nutrition
through plant biotechnology. Curr. Opin. Biotech. 13: 142–5.
Zuo, Y. and F. Zhang. 2011. Soil and crop management strategies to prevent iron deficiency
in crops. Plant Soil. 339: 83–95.
Zuzana, Š., E. Gregováb and E. Šturdík. 2009. Chemical composition and nutritional quality
of wheat grain. Acta. Chimica. Slovaca. 2: 115–138.