Biofeedback Tools for On-line Stress Detection and Reduction · Biofeedback Tools for On-line...
39
Biofeedback Tools for On-line Stress Detection and Reduction Zhuoqi Qiu A report submitted in partial fulfilment of the degree of Bachelor of Advanced Computing (Honours) at Research School of Computer Science Australian National University October 2016
Transcript of Biofeedback Tools for On-line Stress Detection and Reduction · Biofeedback Tools for On-line...

Biofeedback Tools for On-line Stress
Detection and Reduction
Zhuoqi Qiu
A report submitted in partial fulfilment of the degree of
Bachelor of Advanced Computing (Honours) at
Research School of Computer Science
Australian National University
October 2016

2
Acknowledgement
Sincere thanks to Prof. Tom Gedeon who was my mentor of my project. Thank you for
always being supportive and offering great help, advices and guidance throughout my
entire project period.
Thank you to Miss Leana and Mr. Zakir for being my supervisors to share their study
experience and skill with me. Also thanks for all the kind help offered by them to my
project.
A further thanks to Xuanying Zhu and Nandita Sharma for providing me with their
thesis, models and data to develop this project.
Last but not least, sincere thanks to Prof. Weifa Liang who was the course convener of
COMP4560. Thank you for offering all the useful instructions and advices on the
development of my project.

3
Abstract
This individual project aims to develop a real-time stress biofeedback tool using the
physiological data collected by E4 wristband to detect individual’s stress level and help
individual reduce stress through biofeedback method. The development of this tool is
based on Xuanying Zhu’s real-time stress model and Nandita Sharma’s computational
stress model developed in their thesis. Galvanic Skin Response and Blood Volume
Pulse are selected as the input physiological data of this tool. E4 wristband is chosen as
the physiological signals sensor to collect these two types of physiological data from
user. After the data procession and calculation on the collected data over each second,
a real-time stress curve which indicates user’s current stress level will be generated by
the tool as a biofeedback to the user. This report firstly describes a literature survey
which involves all the relevant studies conducted in this project to offer the necessary
background knowledge and academic support. Then a detailed explanation on the real-
time stress biofeedback tool is described, which includes the workflow, structure and
construction of the tool. Upon the completion of the prototype of the tool, an evaluation
on its performance is introduced as well. Lastly, due to the time limitation of this one
semester individual project, the relevant future tasks to improve the performance of the
developed tool prototype are concluded and explained in the future work chapter.

4
Contents
Acknowledgment ........................................................................................................ 2
Abstract ....................................................................................................................... 3
List of Figures ............................................................................................................. 6
1. Introduction ............................................................................................................ 7
1.1 Motivation ......................................................................................................... 7
1.2 Main Tasks ...................................................................................................... 8
2. Literature Survey ................................................................................................... 9
2.1 Stress .................................................................................................................. 9
2.2 Stress Response ............................................................................................... 10
2.3 Relative Physiological Signals Measurement ............................................... 10
2.3.1 Skin Conductivity .................................................................................... 10
2.3.2 Heart Rate Variability ............................................................................ 11
2.3.3 Physiological Sensor Update ................................................................... 12
2.4 Stress Management ........................................................................................ 14
2.5 Bluetooth Wireless Connection ..................................................................... 15
2.6 Transmission Control Protocol ..................................................................... 15
2.7 Previous Work ................................................................................................ 16
2.7.1 Sharma’s Stress Degree Classifier ......................................................... 16
2.7.2 Xuanying’s Real-time Stress Model ....................................................... 17
3. Real-time Stress Biofeedback Tool ..................................................................... 19
3.1 Real-time Data Streaming Client .................................................................. 19
3.2 Trained Stress Degree Classifier ................................................................... 21
3.3 Stress Curve Generator ................................................................................. 24
4. Evaluation ............................................................................................................. 26
5. Future Work ........................................................................................................... 29
5.1 New Training Data Collection ....................................................................... 29
5.2 Re-training Stress Classifier .......................................................................... 30
5.3 Experimental Evaluation ............................................................................... 30

5
6. Conclusion ............................................................................................................ 31
7. Appendix ............................................................................................................... 33
7.1 Independent Study Contract ......................................................................... 33
7.2 BLE Client User Manual ............................................................................... 35
Reference .................................................................................................................. 38

6
List of Figures and Tables
Figure 2.1 Relationship between HRV and stress level ........................................ 11
Figure 2.2 An ECG waveform for one heartbeat .................................................. 12
Figure 2.3 BVP curve (bottom) displayed by E4 wristband on EmpaticaRT app
...................................................................................................................................... 12
Table 2.1 Main differences between Neulog and E4 ............................................. 13
Figure 3.1 Bluegiga BLED112 Bluetooth Smart Dongle ...................................... 19
Figure 3.2 How real-time data streaming client (BLEClient) works .................. 20
Figure 3.3 Sample of collected E4 wristband data format ................................... 20
Figure 3.4 The process of training a stress degree classifier ................................ 21
Figure 3.5 The structure of the trained stress degree classifier ........................... 22
Figure3.6 The process of generating a real-time stress degree curve ................. 24
Figures 4.1 Stress Curve of Participant 1 .............................................................. 26
Figures 4.2 Stress Curve of Participant 2 .............................................................. 27
Figures 4.3 Stress Curve of Participant 3 .............................................................. 27

7
1. Introduction
This chapter provides an introduction to the report. It presents the motivation, goals and
tasks involved for the proposed development of a stress biofeedback tool based on the
original real-time stress model constructed by Xuanying.
1.1 Motivation
Currently, many people face different kinds of stress on a daily basis. It can be described
as the body’s psychological and physical reaction to the imbalance between the
demands and resources available to a person [37]. Stress can be both positive and
negative. Under some circumstances, stress can have a positive impact on an individual
by causing mental and physical excitement, which can increase their focus and enhance
their ability to study or work efficiently. Negative stress, however, can cause serious
psychological and physiological problems, which may lead to physical and mental
illness. For example, many students can feel particularly stressed when facing
impending exams or assignment deadlines. If the stress endured by the student is
excessive and prolonged, then he or she is more likely to develop anxiety that could
negatively impact the performance of study. Therefore, there is currently a need for an
effective method or tool that can be used to help people manage their stress.
Previously, Xuanying Zhu, a Master of Computing with Honours student mentored by
Prof. Tom Gedeon at Australia National University (ANU), completed a thesis whose
title is using physiological feedback to reduce observer stress. The first step in
controlling and reducing stress involves the measurement of stress using mathematic
values. Therefore, Xuanying developed a real-time stress model in her thesis that was
used to calculate a stress degree value, which indicated a user’s stress level at the time
of measurement. This was achieved by using certain types of physiological data
collected from the sensors that were placed on the user. The findings from Xuanying’s
project demonstrate that biofeedback is an appropriate method that can be used to help
alleviate stress.
Previously, Xuanying used Neulog sensors to measure real-time stress, which are not
portable and are overly sensitive to a user’s movement. However, the Research School
of Computer Science at ANU now offers the Empatica E4 wristband, which is a new
physiological sensor with advanced technology that can be worn on the user’s wrist like
a watch. Therefore, it has the portability that the Neulog sensors did not have and is
unaffected by user’s movement, allowing for the collection of real-time stress data at
any time. This device has the potential to update Xuanying’s real-time stress model to

8
one that can serve as a real-time stress biofeedback tool, showing a user’s real time
stress curve at any given place or time.
1.2 Main Tasks
The main goal of this individual project is to update Xuanying’s real-time stress model
to a real-time stress biofeedback tool using the E4 wristband as new monitoring sensor.
The detailed tasks to achieve this goal are described as follows:
a. Complete literature survey on relevant academic resources, focusing particularly on
Xuanying Zhu’s thesis [9] and Nandita Sharma’s thesis [17] which introduced the
initial ideas and models of measuring observer stress.
b. Construct a software tool to collect physiological signals data from E4 wristband
for real-time data streaming. Data includes Galvanic Skin Response and Blood
Volume Pulse, as well as other accessible physiological signals data, such as
Interbeat Interval and Skin Temperature.
c. Modify and update Xuanying’s original real-time stress model to work with the new
data streaming interface developed in task (b), which is supposed to be the prototype
of the real-time stress biofeedback tool.
d. Design software capable of collecting training data for the stress classifier re-
training in the future.
e. Organize the ideas and make a plan to improve the prototype of the real-time stress
biofeedback tool based on the experience in this project for future use.
f. Integrate all relevant code into the HCC workshop tool

9
2. Literature Survey
This chapter presents the background knowledge of this report and the previous work
contributing to the development of this individual project.
2.1 Stress
The concept of “stress” was first scientifically introduced by Hans Selye in 1936, who
defined it as “a complex reaction pattern that often has psychological, cognitive and
behavioural components” [1]. The definition of stress can vary depending on the
individual and the situation. Furthermore, how scholars define stress is also based
predominantly on their field of study. This paper will focus on analysing the concept of
stress in the medical and psychological fields, which define it as the human body’s
psychological and physical reaction to the perceived imbalance between a
circumstance’s demands and the resources available for coping with obstructions [2].
In 1974, Hans Selye divided stress into two categories, eustress and distress [3].
Eustress contributes to positive states, like hard-working and striving for goals, while
distress causes negative states like anxiety, despair and even physical body damage [3].
Additionally, distress can be classified into further sub-categories based on the source
and duration of the stress. One of the most common stress types is short-term or acute
distress [4]. This kind of stress is usually caused by a sudden extreme fear, like
witnessing a bad car accident or watching a horrible clip in a horror movie. In this
situation, distress induces the body’s release of large amounts of adrenaline and cortisol
for the emergency response. This enhances the individual’s strength, endurance and
ability to react to imminent danger [4]. Typically, this short-term acute distress does not
last long and the body will return to normal, assuming that the source of the stress has
been removed. Given its short duration, acute distress generally does not cause
physiological or psychological damage. However, it is possible for short-term acute
distress to transform into long-term chronic distress if the individual is exposed to the
stressor for a longer period or on a more frequent basis. Long-term chronic stress can
cause considerable physical and mental damage to the human body. Sufferers of chronic
stress may develop asthma, back pain, arrhythmias, fatigue, headaches, hypertension
(HTN), irritable bowel syndrome, ulcers and a suppressed immune system [5].
When considering the effects caused by stress, it is apparent that a limited amount of
stress can help encourage or motivate individuals to strive for goals. However, too much
stress will significantly impact performance by decreasing concentration and attention
levels, and weakening learning and decision making abilities [8]. Since short-term acute

10
distress is the most common and can develop into long-term chronic distress in some
cases, this project aims to help people on detecting, measuring and controlling their
short-term acute stress.
2.2 Stress Response
There are three main phases of the stress response, which are alarm reaction, resistance
and exhaustion [6]. The first phase, alarm reaction, is initiated when the person
recognises something as a threat. The autonomic arm of the peripheral nervous system
will immediately give various orders to the human body by generating and signaling
more hormones [7]. This communication system helps to prepare the human body so
that it can react accordingly to incoming threats or dangers. The next phase, resistance,
is caused by extended exposure to a stressor. Since an individual already recognises
something as stressful, the level of physiological signaling is no longer as high as it was
during the alarm reaction. The release of stress hormones is stablised during this phase
and the human body’s reaction capacity will decrease to a level slightly above baseline
[7]. Prolonged exposure to stress, however, can lead to exhaustion because the body is
in a constant, abnormal state of preparedness to deal with the perceived stressor. In this
situation, the human body may become damaged and unable to resist the stress [6].
2.3 Relative Physiological Signals Measurement
The first step to help people manage their stress is to develop an accurate, reliable, real-
time, and intuitionistic method to measure their stress level. The best way to measure
this objectively is to monitor different physiological and physical changes in the human
bodies that occur due to stress. Similar to XuanYing’s previous work, the focus of this
project is to measure real-time stress by monitoring real-time changes in Electrodermal
Activity (also called Galvanic skin response) and Heart Rate Variability.
2.3.1 Skin Conductivity
Skin conductivity, also known as electro-dermal response or psycho-galvanic reflex,
represents the electrical conductance of an individual’s skin. This physiological signal
changes according to the amount of sweat present on the skin. Typically, when a person
experiences stress, he or she will perspire more, which increases the conductivity of the
skin. Likewise, the skin conductivity will decrease when the person’s stress has been
reduced [18].
The Galvanic skin response (GSR), which is determined by calculating the electrical
potential between electrodes placed on the skin’s surface, is the most common and
effective way to measure skin conductivity[19]. Similar to Xuanying, GSR data will be

11
used to construct the real-time stress biofeedback tool in this project [9]. Moreover,
Xuanying already re-constructed Sharma’s stress degree classifier based the data pair
of GSR and ECG data in Sharma’s training data set and this stress classifier is also
supposed to be used in this project. Therefore, the GSR data has been chosen as one of
the input data to be measured and processed in the real-time stress biofeedback tool.
2.3.2 Heart Rate Variability
Heart rate variability (HRV) is the physiological phenomenon involving a variation in
the time interval between heartbeats. In her thesis, Xuanying selected this physiological
signal as another stress indicator in her real-time stress model [9]. Furthermore, there
are several studies published previously that used HRV as a primary measure for
monitoring stress and assessing its effects on the human body [20-25]. Therefore, HRV
has been chosen as another physiological signal to be applied to the real-time stress
biofeedback tool. Figure 2.1 shows a strong relationship between HRV and stress level,
which demonstrates that measuring HRV will serve as a good indicator of stress level.
Figure 2.1 Relationship between HRV and stress level [36]
HRV can be determined by recording Electrocardiogram (ECG), Blood Volume Pulse,
ballistocardiograms,[26][27] and the pulse wave signal derived from a
photoplethysmograph (PPG). In Xuanying’s project, ECG was chosen as the superior
method to measure HRV because it excludes unnecessary heartbeats and displays a
clear waveform [9]. Figure 2.2 shows an example of the ECG waveform recorded for
one heartbeat, which has six labelled components (P, Q, R, S, T, and U). These
waveform components indicate the electrical changes during one heartbeat. As seen in
Figure 2.2, a single heartbeat starts with the contraction of the atria, which results in a
change in electrical voltage as the P sub-wave shows. Following this, the “signal”
passes through both the right and left atrium to the ventricles, where there is an elevated
peak as QRS shows, caused by the depolarization of the ventricles. T and U represent
the final parts of the heartbeat, which are irrelevant for heartbeat counting [28]. So each
peak of QRS represents one heartbeat in an ECG curve.

12
Figure 2.2 An ECG waveform for one heartbeat [35]
However, the chosen E4 wristband sensor in this project does not have the ability to
collect ECG data. It is only able to measure Blood Volume Pulse (BVP), which is the
phasic change in blood volume with each heartbeat. When the heart pumps blood
throughout the whole human body, the arteries of the wrist become more opaque, which
allows less light to pass from the emitter on the E4 wristband through to the receiver.
As shown in Figure 2.3, each heartbeat will be reflected by producing a peak on the
BVP curve. Similar to ECG, BVP can be used to accurately measure heartbeat in real-
time. Therefore, BVP has been chosen as the new physiological signal that will replace
ECG as the input for the real-time stress biofeedback tool.
Figure 2.3 BVP curve (bottom) displayed by E4 wristband on EmpaticaRT app
2.3.3 Physiological Sensor Update
As mentioned previously, Xuanying used Neulog GSR Logger Sensors in her project,
whereas the newer E4 wristband from the Empatica Company will be used in this
Q
R
S

13
project. The following table illustrates the main differences between these two sensors.
E4 wristband Neulog sensors
Table 2.1 Main differences between Neulog and E4
In the future work section of her thesis, Xuanying proposed reducing the sensor’s
sensitivity to user’s movement as a way to improve the accuracy of results [9].
Equipment
Name
Streaming
Interface
Advantage Disadvantage
Neulog USB wire connection
Neulog software suite
1. Allows real-time
data streaming
2. High sampling rate
on GSR data:10Hz
1. Not
portable/users
can only sit with
the equipment
2. Very sensitive to
equipment
movement
3. Low sampling
rate on ECG
data:10HZ
E4 Bluetooth wireless
connection
Self-developed client
with an official TCP
server
1. Allows real-time
data streaming
2. Very portable
3. Not sensitive to
equipment
movement
4. High sampling
rate on BVP data:
64HZ
1. A low sampling
rate on GSR data:
4HZ

14
Therefore, one goal of this project is to update the original real-time stress model by
using a portable sensor that is not influenced by an individual’s movements. While the
E4 wristband has a lower sampling rate on GSR data compared to the older Neulog
sensor, it still has the capacity to collect both GSR and BVP data for the new real-time
stress biofeedback tool with much less sensitivity to user’s movement.
2.4 Stress Management
At present, there is an increasing number of people reporting episodes of occasional
stress. In addition, the proportion of people with major depressive disorder (MDD) or
other mental diseases has risen significantly in recent years. In 2013, MDD affected
approximately 253 million people worldwide, which accounts for 3.6% of the global
population [10]. Therefore, the demand for appropriate stress management strategies is
increasing rapidly. Current methods to control stress include progressive muscle
relaxation [11], autogenic training [12], relaxation response [13], emotional freedom
[14] and transcendental meditation [15]. This project will use the same biofeedback
method as Xuanying’s previous work, which shows people their real-time stress level
curve in order to help them control short-term acute stress.
Biofeedback is a method used to enable individuals to perceive bodily functions that
are unconscious. By doing this, people gain the capacity to learn and modulate these
activities in ways that may improve their overall health or their control ability on the
mood [16]. During a biofeedback session, various physiological signals from an
individual’s body will be monitored by sensors. Collected data will be processed, then
direct and intuitional feedback will be given to the individual, which involves either a
sound, a flash of light or an image representing the key features of the individual’s body.
In this project, data points indicating the stress level over the past one second from real-
time measurements will be used to create a stress curve. The participant will therefore
be able to watch this real-time biofeedback stress curve and will attempt to control their
stress on their own by using traditional relaxation methods, like deep breath, thinking
about some happy things or other simple methods. Xuanying’s previous work
demonstrated that these methods for stress management were both valid and efficient
with biofeedback information’s help [9].
In order to help people control their stress efficiently and prevent the further negative
influence of a short-term acute stress, the stress management work should be done
during the second phase of human stress response, resistance, mentioned in Section 2.2.
This requires a real-time biofeedback model to represent the stress level just with a little
delay after individual firstly recognize the stress resource. To achieve the goals of this
project, a real-time stress curve generator is required. In addition, participants must be
taught how to use the biofeedback model prior to experiment initiation.

15
2.5 Bluetooth Wireless Connection
Bluetooth technology uses short-wavelength UHF radio waves in the ISM band from
2.4 to 2.485 GHz to achieve a short distance wireless data exchange [29]. At present,
Bluetooth is managed by the Bluetooth Special Interest Group (SIG). There are
currently more than 25,000 member companies in the areas of telecommunication,
computing, networking, and consumer electronics of SIG [32]. SIG oversees
specification development, manages the qualification program and protects the
trademarks [33]. All manufacturers must meet Bluetooth SIG standards when
marketing Bluetooth devices, which gives them all the capacity to connect with each
other without any need for adjustment or modification. As shown in Figure 2.3, the E4
sensor used in this project has a built-in Bluetooth program, which allows the user to
access real-time data directly in the EmpaticaRT app on his or her smart phone. At
present, there is no official relevant software that is compatible with the E4 wristband
for data streaming on Windows. The wristband’s Bluetooth module, however, still
makes transferring data to a computer possible with a Bluetooth Dongle.
Given that its effective range is limited to 10 meters [31], all connected Bluetooth
devices must remain in close proximity to one another. Generally, a master Bluetooth
device can communicate simultaneously with a maximum of seven devices in a piconet,
which is an ad-hoc computer network using Bluetooth connection. The devices can
agree to switch roles in a Bluetooth connection. In the Bluetooth connection between a
smart phone and E4 wristband, the E4 wristband works as the ‘master’, using its built-
in function to send data to the smart phone under a specific mode (with blue light
blinking on E4). The smart phone is the recipient of all physiological data and therefore
serves as the ‘slave’ in this scenario. However, in this project, the computer carrying
the real-time stress biofeedback tool is supposed to be the ‘master’ Bluetooth device,
while the E4 wristband should work as ‘slave’ to get the command from user and give
response. Given that the E4 wristband is not equipped with the necessary operating
system to communicate with the computer directly, the sole way to stream data is to
supply the instructions from the computer via an operable client.
2.6 Transmission Control Protocol
Transmission Control Protocol (TCP) is one of the primary procedures found on the
Internet protocol suite. During the initial Internet implementation, TCP was developed
to complement Internet Protocol (IP). In May 1974, researchers at the Institute of
Electrical and Electronic Engineers (IEEE) introduced an internetworking protocol for
sharing resources using packet-switching among the nodes, which is the prototype of
the TCP used today [30]. TCP can deliver a stream of octets between applications
running on hosts communicating within an IP network. It can achieve a reliable, ordered
and error-checked message exchange between different Internet applications, including

16
the World Wide Web, email, remote administration and file transfer, which all rely on
TCP.
TCP is a transport level protocol, while Bluetooth would be described as a lower level
protocol. However, it is possible to use TCP in conjunction with Bluetooth to control a
Bluetooth connected device. Although the Empatica Company does not offer a working
software to stream real-time operations and data to Windows, it does offer a TCP server
for users to achieve a protocol-based communication between the E4 wristband and
Windows through a specifically designed BlueGiga BLED112 Bluetooth Smart Dongle
(BLE Bluetooth dongle) [34]. Under the constraints of the TCP server, which is based
on TCP socket connections, each TCP connection is permitted to link to only one
Empatica Device at a time. The company recommends using the programming
language, C#, for building the client on the Windows to work under TCP server. After
a successful connection with a developed client, the server will wait for a formally
formatted command message from this client. After receiving a valid command
message, the server will provide relevant instructions to the E4 wristband and
subsequently receive the response message to pass to the client. All of these message
exchanges reply on the Bluetooth connection between the E4 wristband and BLE
Bluetooth dongle. An relevant example of the type of transmitted response message is
the real-time physiological signal data from the E4 wristband user. Therefore, the
computer has the capacity to access the physiological signals and receive real-time data
that is streaming from the E4 wristband.
2.7 Previous Work
This section contains a simple description and explanation on both Xuanying Zhu’s and
Nandita Sharma’s thesis and models developed in their projects.
2.7.1 Sharma’s Stress Degree Classifier
During her PhD, Sharma developed the core stress degree classifier to make stress
classification on a certain group of physiology signals [17]. For the initial part of her
study, participants were asked to watch a series of either stressful or soothing, non-
stressful film clips that each lasted approximately one minute. Various physiological
signals were monitored during this period, including ECG, GSR, Blood Pressure (BP),
eye gaze and pupil dilation. The stressful film clips featured scenes depicting distress,
fear, and tension, while the non-stressful films included scenes of comfort, relaxation
and meditation. Study participants were required to complete an evaluation form at the
end of the experiment, detailing the stress levels experienced when watching each type
of film.
Following statistical analysis, 215 statistic and measure values were derived and

17
normalised by individual to minimise the individual bias. Using these derived features
as input, Sharma built several classification models, including Support Vector Machine
(SVM) and Artificial Neural Network (ANN), for comparison and used a Genetic
Algorithm to identify the best representative features among the 215 candidate features.
Finally, the GA-ANN and GA-SVM models were proven to perform similarly in stress
degree classification and GA also successfully selected a group of the best
representative features according to the pre-set stopping criteria. Xuanying also
selected Sharma’s GA-ANN model to construct and optimise the stress degree classifier
used in her real-time stress model.
2.7.2 Xuanying’s Real-time Stress Model
Xuanying developed a real-time stress model using physiological feedback to reduce
observer stress based on Sharma’s stress classifier [9]. Initially, the stress degree
classifier used in Xuanying’s project was trained by only using GSR and ECG data.
Because Xuanying want to accelerate the training phase of the classifier re-construction
and reduce the time cost on each classification process to achieve real-time biofeedback,
she only kept these two physiological signals as types of training data and real-time
sampling data to generate stress curve. What’s more important, it is hard to find some
real-time data streaming sensors on the other physiological signals such as eye gaze and
pupil dilation. So Xuanying’s stress classifier can only “understand” the GSR and ECG
data. Similar to Sharma’s strategy on constructing the original stress degree classifier,
Xuanying firstly set the neuron network structure with only one hidden layer and
selected Logistic function as the activation function. Meanwhile, a Genetic Algorithm
was applied during the training phase to the feature selections among the 215 statistic
and different values defined by Sharma previously, such as gradients, rate of change,
mean, variance of GSR and ECG data, were measured. Finally 59 features from the 215
candidate features were been selected by GA as the best representative features to serve
as the input data for the stress degree classifier. While the 59 input features were set,
the relevant trained neuron network structure was also stored. By using 10-fold cross
validation on Sharma’s training data set, the accuracy of this re-constructed stress
classifier was tested as 81% which satisfied the requirements of the project [9].
Subsequently, the trained neuron network was later used as the stress degree classifier
for Xuanying’s real-time stress mode. In addition, the selection results from the 215
candidate features were stored as a one-dimensional vector with 215 elements with
values of either 0, which indicates that the corresponding feature is excluded and not
going to be input to the neuron network, or 1, which signifies that the corresponding
feature is one of the 59 filtered best representative features.
Xuanying created a stress curve generator once she had re-constructed Sharma’s stress
degree classifier. Additionally, she used data spanning two seconds in order to ensure
that the number of samples collected for feature derivation was appropriate for
generating a precise stress index. Initially, Sharma’s code was used to derive 215

18
statistic and measure values defined by Sharma, and subsequently Xuanying used the
stored vector which is the result of the GA on the features selection in classifier training
phase to make the input vector for the trained stress classifier. Each of the filtered 59
feature values was set as an input for each of the 59 input neurons in the input layer of
the neuron network. Finally, the trained neuron network generated a stress degree
ranging from -3 and 3 by its calculation on the input data. By completing this process
iteratively, a stress curve showing the stress degree of the user from the past two seconds
was produced. In this project, the stress classifier constructed by Xuanying is directly
used since there is no sufficient time to collect the new training data and then conduct
a re-training on the current stress classifier. Even if enough training data has been
collected which may also take over one month to design and conduct experiment, it will
still cost over 3 month to apply the GA on feature selection to build a new stress
classifier with the similar strategy used by both Xuanying and Sharma [9]. As this
project is just a one semester individual project, the stress classifier replacement will
not be considered.

19
3. Real-time Stress Biofeedback Tool
The real-time stress biofeedback tool developed in this project uses the E4 wristband to
collect GSR and BVP data from the user. The data is then processed by using a trained
stress classifier to calculate a stress index which is used to generate a real-time stress
curve as biofeedback method. This will determine the user’s level of stress. In
Xuanying’s previous study, she demonstrated that the degree of stress observed was
reduced when the user was shown his or her stress curve in real-time [9]. Therefore, the
primary function of this biofeedback method is to measure a user’s real-time degree of
stress, while simultaneously helping them control the stress. The real-time stress
biofeedback tool is composed of three parts, including a neuron network stress degree
classifier, a stress curve generator and a real-time data streaming client originally
developed in this project.
3.1 Real-time Data Streaming Client
Certain changes were made to the experimental procedure to improve upon Xuanying’s
original real-time stress model. Firstly, a new sensor, the portable E4 wristband, was
used to make monitoring physiological signals easier. Secondly, a client was created for
the efficient and rapid streaming of real-time data. The TCP server, named as BLEServe,
supplied by Empatica Company enables the transmission of signals straight from the
E4 wristband to the Windows client exclusively via the Bluegiga BLED112 Bluetooth
Smart Dongle. So the real-time data streaming client developed in this project is named
as BLEClient. This facilitates the quick readout of physiological data in real-time as
well as sending command message to E4 wristband.
Figure 3.1 Bluegiga BLED112 Bluetooth Smart Dongle [34]
All command script from the Windows client and response messages from the E4

20
wristband on the TCP server are limited to a canned format. Each relevant valid
command will be explained in the BLEClient User Manual in the Appendix Chapter.
The socket package in Virtual Studio 2015 is used to achieve a stable connection
between the client and the TCP server. Furthermore, the introduction of a buffer
facilitates the concurrent exchange of messages, while eliminating the chance of data
loss. To transmit the signals from the sensor to the server, the E4 wristband is attached
to the Bluetooth dongle by Bluetooth wireless connection. The client’s IP will be set to
match the target IP in BLEServe. As shown in Figure 3.2, real-time data streaming is
activated following connection by transmitting a specific command message through
the client to the BLEServe then finally to the E4 wristband via Bluetooth connection
between E4 wristband and dongle. As shown in Figure 3.3, the received response
message will carry the real-time GSR and BVP data from the E4 wristband to the client,
which will then be stored in a txt file.
Figure 3.2 How real-time data streaming client (BLEClient) works
Figure 3.3 Sample of collected E4 wristband data format
The rate of sampling from the E4 wristband for GSR and BVP data is 4Hz and 64Hz,
respectively. The timestamp, in seconds, for the sample data is a measurement of the
time interval from when the response message is received to the reference date, 1

21
January 1970, GMT. This is the raw data that will be pre-processed in the next phase.
3.2 Trained Stress Degree Classifier
Given that the sensor in this project has been updated, the input data of the stress
biofeedback tool has been changed to GSR and BVP, where BVP is a new data type to
be applied to the stress classifier. Furthermore, there is no BVP data in Sharma’s
training data set. Therefore, it is anticipated that a re-training will be necessary on
Xuanying’s stress degree classifier, which was trained by GSR and ECG data
previously by Xuanying. However, given the time constraints of this one semester
project, time is too limited to use the similar training strategy to Xuanying’s strategy
using GA on features selection over 215 candidate features which is believed to take
over 3 month. In addition, there is insufficient amount of training data on the new data
pair, GSR and BVP, available to complete this re-training in a timely fashion. On the
other hand, both the ECG data and BVP data are similar for representing the Heart Rate
Variability (HRV) in the stress degree classification. Therefore, Xuanying’s original
stress degree classifier will be used in this project as the core calculator of the real-time
stress biofeedback tool. While the precision of the classification may be reduced by
using BVP instead of ECG data as the input to the original stress degree classifier, it
should not have a significant impact on its overall performance according to the
previous description. However, a detailed re-training plan will still be presented to
demonstrate how a better classifier will be trained in the future. This proposed re-
training plan is based on Xuanying’s reconstruction plan of Sharma’s original stress
degree classifier which can also help understanding how the Xuanying’s stress classifier
was built previously. As shown in Figure 3.4, there are five main steps involved in
reconstructing the stress degree classifier in the re-training plan.
Figure 3.4 The process of training a stress degree classifier [9]
Firstly, large GSR and BVP training data sets are required. Each group in the training
data set must be labelled manually with a specifically allocated stress degree. Training
data sets will be obtained using a similar data collection strategy as the one used by
Sharma in her thesis [17]. Training data will be loaded and pre-processed to eliminate
any noise and outliers that may exist among each physiological signal type. Following
the normalization of the data, a certain number of features, derived from the
physiological signals data, will be calculated first. Then these features will be the
candidate features and later filtered by GA to capture the most relative and decisive
22
ones for stress degree classification. The neuron network will then be trained for many
times by applying each different group of selected features as input to neuron network.
A considerable number of iterations on filtering relative features and training neuron
network will be conducted to choose a best-performance trained classifier as well as a
group of best representative features. After a complete training phase with GA, a group
of the best representative features will be chosen in conjunction with a corresponding
trained neuron network, which will serve as the best classifier structure. The weights
matrices of the neuron network as well as the best representative features group will
both be stored. This stored classifier will be regarded as the optimal stress degree
classifier and will be used to decide a stress degree based on the collected real-time
physiological data in a stress curve generator.
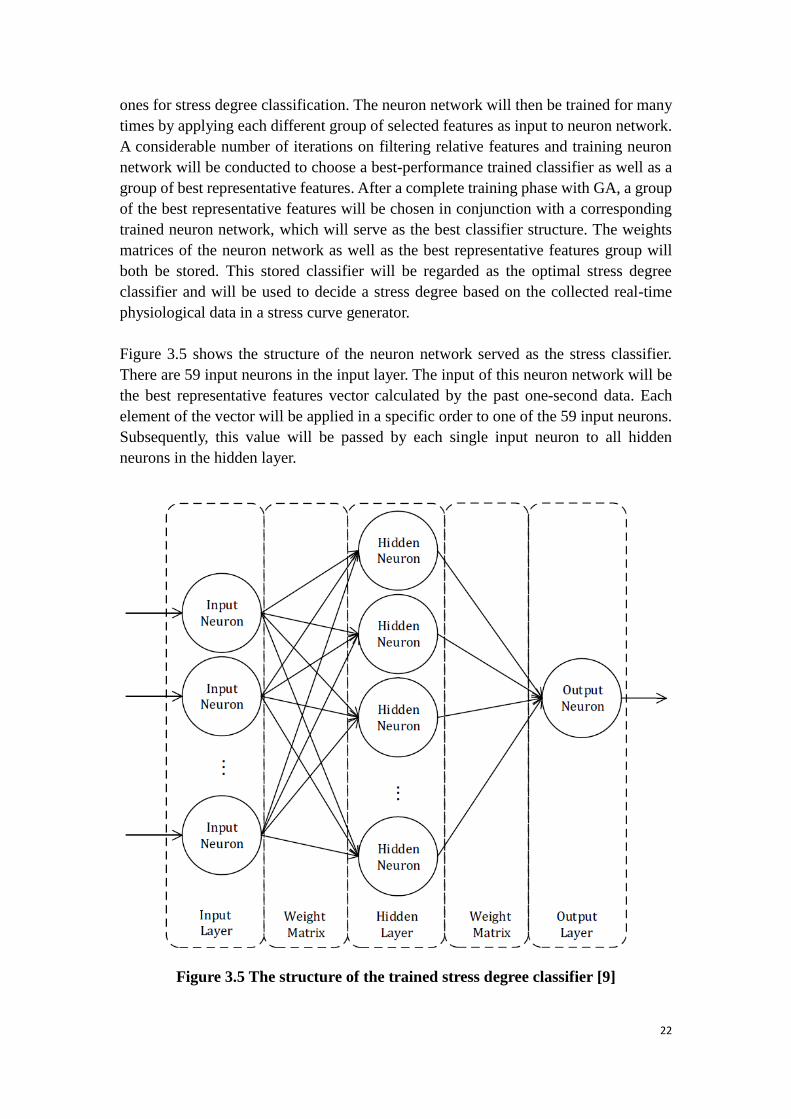
Figure 3.5 shows the structure of the neuron network served as the stress classifier.
There are 59 input neurons in the input layer. The input of this neuron network will be
the best representative features vector calculated by the past one-second data. Each
element of the vector will be applied in a specific order to one of the 59 input neurons.
Subsequently, this value will be passed by each single input neuron to all hidden
neurons in the hidden layer.
Figure 3.5 The structure of the trained stress degree classifier [9]

23
There are 400 hidden neurons in the hidden layer. The input value of each hidden
neuron will be calculated using the equation below [9]
x = ∑ 𝑤𝑖𝑝𝑖𝑛𝑖=1
Where
𝑥---is the input value of a hidden neuron
n---is the number of input neurons connected to this hidden neuron
i---is the 𝑖𝑡ℎ input neuron connected to this hidden neuron
𝑤𝑖---is the weight of the 𝑖𝑡ℎ input neuron in the first weight matrix
between input layer and hidden layer
𝑝𝑖---is the output value of the 𝑖𝑡ℎ input neuron
Each hidden neuron processes the input value to generate its output value via an
activation function which is represented by the equation below [9]
y = 1
1 + 𝑒−𝑥
Where
y---is the output value of a hidden neuron
x---is the input value of a hidden neuron
e---is the Euler’s constant, which is the base of natural logarithms
Once the output of each hidden neurons is calculated, the final step will involve
calculating the output value of the neuron network using the equation below [9]
S = ∑ 𝑤𝑖𝑦𝑖𝑚𝑖=1
Where
S---is the output value of the neuron network, which is also the value of the stress degree
and will be used as a stress index to generate stress curve
m---is the number of hidden neurons connected to the output neuron
i---is the 𝑖𝑡ℎ hidden neuron connected to the output neuron
𝑤𝑖---is the weight of the 𝑖𝑡ℎ hidden neuron in the second weight matrix
between hidden layer and output layer
𝑦𝑖---is the output value of the 𝑖𝑡ℎ hidden neuron
Once the stress index is calculated and stored, it is displayed by stress curve generator.

24
3.3 Stress Curve Generator
A stress curve generator is used to display a stress index for the development of a stress
curve. The physiological signal data, GSR and BVP, is acquired by the user’s E4
wristband and is transmitted by the real-time data streaming client to be loaded by the
stress curve generator. After data pre-processing, this stress curve generator uses the
processed data to display a stress index showing the current stress degree of the tool
user. By repeatedly yielding single stress index, a stress degree curve will be generated.
As shown in Figure 3.6, a real-time stress curve is produced through five cyclical steps.
Figure3.6 The process of generating a real-time stress degree curve [9]
The process is initiated when data is loaded. In Xuanying’s project, the data sampling
rate for Neulog sensors was 10Hz for both GSR and ECG signals. The previous two
seconds of data are loaded in order to strike a balance between obtaining an appropriate
number of samples and reducing stress curve delay. To satisfy sample size requirements,
twenty sample points will be loaded for each physiological signal. Based on Xuanying’s
previous work, this is a sufficient number of sample points for generating an accurate
stress index. As mentioned previously, the E4 wristband sampling rate for GSR and
BVP is 4Hz and 64Hz, respectively, which means that for one second of time, 4 GSR
data points and 64 BVP data points will be collected. Since these rates are inconsistent,
4 GSR data points will be duplicated to 64 GSR data points to make 64 ordered pairs
with each BVP data point. Using this strategy, 64 pairs of GSR and BVP data points
will be obtained during each one second interval, which will allow for the development
of an accurate stress index.
The next stage involves converting the scale of the input data values to match the
training data values. The GSR data falls within a range of 0 and 30 in Sharma’s original
training data set, which is similar to the data set used by the current stress classifier in
this project. The numerical scale for the GSR data collected from the E4 wristband,
however, ranges from 0 to 10. The equation below will be used for GSR data conversion.
𝒅𝒊_𝒏𝒆𝒘 = 𝒅𝒊−𝑬𝒎𝒊𝒏
𝑬𝒎𝒂𝒙−𝑬𝒎𝒊𝒏 × (𝑺𝒎𝒂𝒙 − 𝑺𝒎𝒊𝒏)

25
Where
𝒅𝒊_𝒏𝒆𝒘---is the new data after conversion
𝒅𝒊---is the data before conversion
𝑬𝒎𝒊𝒏---is the minimum value captured by E4 wristband
𝑬𝒎𝒂𝒙---is the maximum value captured by E4 wristband
𝑺𝒎𝒊𝒏---is the minimum value captured by Sharma’s Biopac sensors in training data set
𝑺𝒎𝒂𝒙---is the maximum value captured by Sharma’s Biopac sensors in training data set
At present, no training data set exists for the BVP data. As mentioned previously, the
E4 wristband will also be used to gather the BVP data. In that case, the training and the
real-time collected data will be in the same scale so a conversion will not be necessary
if a new stress classifier is trained on the new training data. For now, a simple
conversion will be applied to the BVP data so that the Xuanying’s stress classifier is
compatible with the new sensor. The BVP data collected by the E4 wristband lands
within a range from -100 to 100. Given that the values of ECG data in Sharma’s training
data set range from 0 to 1, the BVP data value will be converted using the same GSR
conversion equation presented above into a corresponding ECG data value. Since the
meaning of using ECG and BVP data are both counting the heartbeats and being derived
to the features indicating HRV, so it is believed that the direct replacement from ECG
data to GSR is not supposed to impact the performance of the stress classifier
significantly.
After data pre-processing, 59 representative features are derived by calculating the
statistical and measures values of the one-second data and using the features choosing
vector stored in the classifier training phase. Summary statistical values include the
mean, standard derivation, skewness, interquartile range, minimum and maximum.
Measures values reflect the number of peaks for periodic signals. The 59 features are
those that have been selected by GA in the stress classifier training phase. They will be
made into an input vector that will be applied to the trained stress degree classifier.
Through the classifier’s calculation described in section 3.2, a stress index will be
produced, showing the level of stress ranging from -3 to 3. Finally, a stress curve will
be displayed by repeating this process.

26
4. Evaluation
This chapter delivers a simple evaluation of the performance of the stress biofeedback
tool prototype developed in this project. Given that the stress classifier developed by
Xuanying is still used in this project, it is unlikely that further experimental evaluation
will be considered until a new and improved stress classifier, trained with GSR and
BVP data, is available. There was already a detailed experimental evaluation of the
current stress classifier conducted by Xuanying in her thesis [9].
A simple test on the stress biofeedback tool prototype has been conducted to ensure that
the new sensors and data streaming interface can work effectively with the original
stress classifier. Three male students were enrolled as test participants, all aged around
22 years old with no reported mental illnesses. Whilst wearing the E4 wristband, each
participant was asked to view a different YouTube video showing different contents for
around 400 seconds to 450 seconds. Before initiating the experiment, the participants
were instructed to try to control their levels of stress using the biofeedback information
offered by the real-time stress biofeedback tool, which is the real-time stress curve.
They were suggested to use the general relaxation techniques, like deep breathing, to
manage their stress if they find that their stress curve goes too high. Figures 4.1, 4.2
and 4.3 illustrate the stress curves collected for each participant.
Figures 4.1 Stress Curve of Participant 1
Participant 1 was asked to watch a clip from a zombie movie. Though this participant
said he likes zombie movies, his stress level showed by tool is still above 0 at most time
which indicates he was a little anxious and stressful during the whole process. Then at
around 250 second, there was suddenly a zombie who jumped out in the movie which
lead to a significant increasing of his stress level to around 2.6 at that time. Then by
showing this curve to him, he started to control his stress immediately with a strong

27
consciousness. So the stress level decreased into the average level for the rest of the
time.
Figure 4.2 Stress Curve of Participant 2
Participant 2 was asked to watch a clip from a car racing movie. This kind of movie
clip should make people excited which should lead to a high average stress level. But
since there was not any very incitant scene during the entire clip, there was not a high
peak in this participant’s stress curve. He kept watching the movie and the stress curve
at the same time, so his stress was controlled well. There were several times when he
looked at the stress curve and tried relax consciously his stress level decreased
significantly.
Figure 4.3 Stress Curve of Participant 3
Participant 3 was asked to watch a clip from a time-lapse video on nature scenery. This
kind of video is believed to give people a comfortable and relax feeling. Then the stress
curve of the participant shows his stress level kept being low during the test, where his
stress level is smaller than 0 at most time. Whilst watching at his stress curve at same
time, sometimes the stress level even got further decreased due to a conscious stress
control.
The results obtained demonstrated that the stress biofeedback tool prototype performed
accordingly. Furthermore, they showed that the new sensors and data streaming

28
interface work well with the original real-time stress model, illustrating that the
prototype of the stress biofeedback tool was a success. Unfortunately due to time
constraints, further experimentation was not possible. The stress level measurement
accuracy of the tool actually relates to the precision of the stress classifier on stress
degree classification. A similar experimental evaluation on the current stress classifier
has already been performed previously by Xuanying [9]. The results from this project
agree with those from Xuanying’s work. Both demonstrated that the biofeedback tool
is capable of detecting stress in participants when exposed to a virtual environment. In
addition, both studies illustrated that this tool can be used to help alleviate a user’s stress
levels by offering them biofeedback information, which in this case was the real-time
stress degree curve. While these findings are promising, further modifications and
improvements are necessary to achieve a completed version of the stress biofeedback
tool. As mentioned previously, this will require the future development of a new stress
classifier trained by a new GSR and BVP training data set.

29
5. Future Work
Due to the time limitations of this one-semester project, there is still extensive work
required to deliver a completed version of the stress biofeedback tool. This chapter will
introduce some future directions.
5.1 New Training Data Collection
The current stress biofeedback tool uses a different type of input data compared to the
previous real-time stress model developed by Xuanying. The present model utilises
GSR and BVP data rather than the GSR and ECG data that was used previously.
However, similar mathematical features of BVP to ECG data have been used in the new
tool, which both indicate the features of HRV. Replacing ECG with BVP data as the
source of input data is believed not to influence the stress classifier performance
significantly. Therefore, an entirely new training data set of GSR and BVP data should
be generated first to improve the current tool’s performance.
It is anticipated that an experiment, similar to one performed previously by Sharma,
will be conducted in the future to collect labelled training data [17]. The intention is
that all participants will be exposed to a variety of abstract virtual environments for the
measurement of computational observer stress in Sharma’s standard at each specific
virtual environment. Finally, a group of stress degree values within a range from -3 to
3 will be labelled with each participant’s GSR and BVP data set, which indicates a
participant’s stress level during the entire experimental period. A large training set is
required to appropriately train the neuron network. Based on the work previously
conducted by Sharma and Xuanying, at least 30 participants should be enrolled in the
project and sufficient time should be allocated to include diversiform virtual
environments in each experiment.
To collect this training data set, the BLE client developed in this project has been
updated to be able to conduct and evaluate such an data collection task. The usage of
BLE client is detailed in BLE Client User Manual in the appendix chapter. In addition,
while collecting GSR and BVP data, this client can be used to simultaneously measure
other physiological signals as well, like skin temperature and Interbeat Interval. This
data is also be possible to be used to assist the manual stress classification on the
training data set.

30
5.2 Re-training Stress Classifier
Once an optimal amount of training data has been gathered, it will be used to re-train
the stress classifier. The training strategy discussed in section 3.2 can be implemented
again. Furthermore, Sharma and Xuanying only applied the Genetic Algorithm to the
feature selection but not to the neuron network structure. If time permits, GA could be
used initially for feature selection to derive the best representative features with only
one hidden layer pattern net neuron network. Then, with the selected best representative
features, the GA can also be used to select the best neuron network structure by finding
the optimal number of the hidden layers and the number of hidden neurons in each
hidden layer. While this process is expected to take a quite long period to complete, it
should enhance the stress classifier’s overall function and performance significantly.
5.3 Experimental Evaluation
Following the completion of a new stress classifier based on GSR and BVP data, a
group of experiment should be designed and conducted to evaluate the performance of
the new stress classifier scientifically. Furthermore, it is anticipated that Xuanying’s
stress classifier and the new stress classifier based on the GSR and BVP data will be
compared on their performance. Following this, the completed version of real-time
stress biofeedback tool with the new stress classifier should be tested in a real
environment rather than an abstract virtual environment. The new portable E4
wristband sensor will enable test participants to move around rather than remain
stationary throughout experimentation. This will allow the sensor to measure stress
levels while participants perform real-life tasks, like taking exams or exercising at the
gym. Therefore, the performance of the new stress biofeedback tool can be tested in
real-life situations where users are exposed to a myriad of stressors. This will offer a
comprehensive evaluation on the performance of the real-time stress biofeedback tool
as well as the validity of Xuanying’s and Sharma’s thesis.

31
6. Conclusion
This chapter summarises the main outcomes of this project. The aim of this project was
to develop a real-time stress biofeedback tool based on Xuanying’s real-time stress
model. This section will also detail the progress that was made for each task initially
set in Chapter 1.
This report presented a literature survey of topics that were relevant to this project,
including stress identification, stress management, a description of physiological
sensors and a summary of work conducted previously by Xuanying and Sharma. This
research enhanced the author’s understanding of the subject. Furthermore, it provided
an overview of the current real-time stress model and the basic thesis for biofeedback
methods, as well as the relevant skills required for developing a new stress biofeedback
tool.
A real-time data streaming client, BLEClient, has been developed to obtain the real-
time streaming data from the E4 wristband. By working with a specific Bluetooth
dongle and having the ability to communicate via protocol-based messages on
BLEServe, all the physiological signals data relevant to the stress classification could
be monitored in real-time and recorded on a Windows computer. This sensor has the
capacity to measure four types of physiological signal, including Galvanic Skin
Response, Blood Volume Pulse, Skin Temperature and Interbeat Interval.
A prototype of the real-time stress biofeedback tool was developed in this project. By
making a new input data interface with the BLEClient, Xuanying’s original real-time
stress model works perfectly with the new portable E4 wristband sensor. Several other
modifications to Xuanying’s real-time stress model code were also made to ensure its
functionality. The current tool’s newly developed BLEClient and input data interface
has the capacity to efficiently pass the physiological signals data from the E4 wristband
to the stress classifier on the computer. This data can then be rapidly processed into a
stress curve to display the user’s real-time stress level. A simple test on this tool was
also conducted in this project, which confirmed that the performance of this prototype
tool was acceptable. Although it will be necessary to re-train the stress classifier on the
new training data to develop a completed version of the real-time stress biofeedback
tool.
The primary function of the BLEClient is to stream data for a trained stress classifier in
order to generate a stress curve in real-time. In addition, it has the capacity to collect
training data, which can subsequently be used to train a new stress classifier, based on
GSR and BVP data. All of the relevant physiological signals data is simultaneously

32
transmitted by the client to the stress classifier as input and stored as a local txt file in
a clear and formulated format. In the future, this client can be used in a training data
collection task to gain a sufficient amount of sample labelled data for re-training.
Given the time constraints associated with a one-semester independent undergraduate
project, training data on GSR and BVP could not be collected in a short time.
Furthermore, the re-training task to construct a new stress classifier with the similar
strategy to Xuanying and Sharma will still take over 3 months even if there is a
sufficient training data set on GSR and BVP. However, these are the only tasks
remaining to produce a complete and fully functional real-time stress biofeedback tool.
The future plan for collecting the training data set and re-training the stress classifier is
discussed in the future work chapter. This plan outlines the necessary steps required for
the further improvement of this real-time stress biofeedback tool prototype. Last but
not least, the developed code works from this project have also been integrated into the
HCC workshop tool recorded as a prototype to be developed in the future.

33
7. Appendix
7.1 Independent Study Contract

34

35
7.2 BLEClient User Manual
Introduction
BLE client is a self-developed client for the Windows to link to the BLE TCP Serve
offered by Empatica Company. And BLE TCP serve can achieve a protocol-based
communication between E4 wristbands and Bluegiga BLED112 Bluetooth Smart
Dongle which is the only permitted Bluetooth dongle for the BLE TCP serve.
Setup
1. The BLED112 Bluetooth dongle should be firstly plugin on the computer, then user
should download and install the newest version driver for the dongle.
2. User should download and install Empatica BLEServe software from Empatica
Company official website. Besides, an API key is required to run this TCP Serve.
3. Use the purchase code of your E4 wristband to add it to the linked device list of
your API
4. Run BLEServe and set serve port and serve address same as the pre-set address and
port in the client.
5. If Bluetooth Dongle is working, then there be a message “Dongle connected” shown
in BLEServe.
6. Turn on the E4 wristband and it will go in searching mode automatically (with a
flashing blue light). Meanwhile click the start search button of the BLEServe.
7. If BLEServe successfully connects with the E4 wristband, your device’s ID will be
shown on the device list.
8. Run the BLE Client and you can see the command window open.
9. Type in the command and press enter key to get the response.
10. To record all the response messages, you need to modify the text file path in
AsynchronousClient.cs
Commands and Response Messages Details
All the following command messages are designed and formulated by Empatica
Company. A message starts with R indicates it is a response message. And for C sharp,
all the command is case-sensitive.

36
server_status
To check the current TCP serve status.
Response Message:
R server_status OK
R server_status ERR <reason>
device_list
To check the list of current linked devices to the BLEServe by Bluetooth connection.
Response Message:
R device_list <NUMBER_OF_DEVICES> | <DEVICE_INFO_1> |
<DEVICE_INFO_2>
device_connect <DEVICE_ID>
To let the client connect a specific device by DEVICE_ID, then be ready to receive,
display and record the messages from this device.
Response Message:
R device_connect OK
R device_connect ERR <reason>
device_disconnect
To disconnect a specific device from the client by DEVICE_ID.
Response Message:
R device_disconnect OK
R device_disconnect ERR <reason>
device_subscribe <DATA_TYPE> ON
To start the data streaming of a specific data type
device_subscribe gsr ON
To start Galvanic Skin Response data real-time streaming
device_subscribe bvp ON
To start Blood Volume Pulse data real-time streaming
Response Message:
R device_subscribe <DATA_TYPE> OK
R device_subscribe <DATA_TYPE> ERR <REASON>
device_subscribe <DATA_TYPE> OFF
To shut down the current data streaming on a specific data type.
Response Message:
R device_subscribe <DATA_TYPE> OFF
R device_subscribe <DATA_TYPE> ERR <REASON>
pause ON
To suspend all the data streaming process.
Response Message:

37
R pause ON
R pause ERR <REASON>
pause OFF
To continue all the suspended data streaming process.
Response Message:
R pause OFF
R pause ERR <REASON>
Data Streaming Message format
E4_<DATA_TYPE> <TIMESTAMP> <DATA_VALUE>
Where <TIMESTAMP> is defined as time interval in seconds between the sample
received and the reference date, 1 January 1970, GMT.
Known Issues
1. To make each experiment results distinguished, it is supposed to restart the client
for each experiment and the txt file will also be overwritten if the previous txt file
is created and existed.
2. The data streaming messages are also displayed in the command window to help
user watch the streaming process directly. This will cause an inconvenience for
typing in new command on the command Windows. Now this is still an initial
version of the client. Such a problem can be solved by using the pause ON function
to help user type in new command

38
Reference
[1] H. Selye, “A syndrome produced by diverse nocuous agents”, Nature, Vol. 138,
1936, pp.32
[2] M. Feuerstein, E. Labbé, and A. Kuczmierczyk, Health psychology: A
psychobiological perspective, 1986.
[3] H. Selye, Stress without distress. Philadelphia: J.B. Lippincott Company, 1974
[4] H. Ursin, Psychobiology of stress: A study of coping men, Elsevier, 2012.
[5] Schneiderman N.; Ironson G.; Siegel S. D. (2005). "Stress and health: psychological,
behavioral, and biological determinants". Annual Review of Clinical Psychology. 1 (1):
607–628.
[6] H. Selye, “Stress and the general adaptation syndrome”, British medical journal,
Vol.1, 1950, pp.1383.
[7] Stress, Coping and Health (2014). The human stress response.
[8] S. C. Segerstrom and G. E. Miller, “Psychological stress and the human immune
system: a meta-analytic study of 30 years of inquiry”, Psychological bulletin, Vol.
1302004, pp.601.
[9] X. Zhu, Using Physiological Feedback to Reduce Observer Stress, Master with
Honours thesis, the Australian National University, Canberra, 2014
[10] Global Burden of Disease Study 2013, Collaborators (22 August 2015). "Global,
regional, and national incidence, prevalence, and years lived with disability for 301
acute and chronic diseases and injuries in 188 countries, 1990-2013: a systematic
analysis for the Global Burden of Disease Study 2013.". Lancet (London, England).
386 (9995): 743–800.
[11] M. S. McCallie, C. M. Blum and C. J. Hood, “Progressive muscle relaxation”,
Journal of Human Behavior in the Social Environment, Vol. 13, 2006, pp. 51-66.
[12] E. Ernst and N. Kanji, N. (2000). “Autogenic training for stress and anxiety: a
systematic review”, Complementary therapies in Medicine, Vol. 8, 2000, pp. 106-110.
[13] M. D. Herbert Benson and M. Z. Klipper, The relaxation response. Harper
Collins, 1992.
[14] T. Karatzias, K. Power, K. Brown, T. McGoldrick, M. Begum, J. Young and S.
Adams, “A controlled comparison of the effectiveness and efficiency of two
psychological therapies for posttraumatic stress disorder: eye movement desensitization
and reprocessing vs. emotional freedom techniques”, The Journal of nervous and
mental disease, Vol. 199, 2011, pp. 372-378.
[15] R. R. Michaels, M. J. Huber and D. S. McCann, (1976). “Evaluation of
transcendental meditation as a method of reducing stress”, Science, Vol. 192, 1976,
pp.1242-‐‑1244.
[16] H.L. Epstein, and E. B. Blanchard, "ʺBiofeedback, self-control, and self-
management."ʺ Biofeedback and Self-regulation 2, no. 2, 1977, pp.201-211.
[17] N. Sharma, A Computational Model of Observer Stress, PhD thesis, the Australian

39
National University, Canberra, 2013
[18] W. Liao, W. Zhang, Z. Zhu and Q. Ji, “A real-‐‑time human stress monitoring
system using dynamic bayesian network”, Computer Vision and Pattern Recognition-
Workshops, 2005. CVPR Workshops. IEEE Computer Society Conference on, 2005,
pp. 70
[19] N. Sharma & T. Gedeon, “Modeling a stress signal”, Applied Soft Computing, Vol.
14, 2014, pp. 53-61.
[20] T. G. Vrijkotte, L. J. van Doornen and E. J. de Geus, “Effects of work stress on
ambulatory blood pressure, heart rate, and heart rate variability”, Hypertension, Vol. 35,
2000, pp.880-886.
[21] M. Malik, J. T. Bigger, A. J. Camm, R. E. Kleiger, A. Malliani, A.J. Moss and P. J.
Schwartz, “Heart rate variability standards of measurement, physiological
interpretation, and clinical use”, European heart journal, Vol. 17, 1996, pp. 354-381.
[22] R. M. Carney, J. A. Blumenthal, P. K. Stein, L. Watkins, D. Catellier, L. F. Berkman
and K. E. Freedland, “Depression, heart rate variability, and acute myocardial
infarction”, Circulation, Vol. 104, 2001, pp.2024-2028.
[23] M. Hall, R. Vasko, D. Buysse, H. Ombao, Q. Chen, J. D. Cashmere and J. F. Thayer,
“Acute stress affects heart rate variability during sleep”, Psychosomatic medicine, Vol.
66, 2004, pp.56-62.
[24] HeartMath Australia (2011). emWave. Available: http://www.emwave.com.au/
[25] Z. Ori, G. Monir, J. Weiss, X. Sayhouni and D. H. Singer, “Heart rate variability:
Frequency domain analysis”, Cardiology clinics, Vol. 10, 1992, pp.499-537.
[26] Brüser, Christoph; Stadlthanner, Kurt; de Waele, Stijn; Leonhardt, Steffen (2011).
"Adaptive Beat-to-Beat Heart Rate Estimation in Ballistocardiograms". IEEE
Transactions on Information Technology in Biomedicine. IEEE. 15 (5): 778–786.
[27] Brüser, Christoph; Winter, Stefan; Leonhardt, Steffen (2012). "Unsupervised Heart
Rate Variability Estimation from Ballistocardiograms". 7th International Workshop on
Biosignal Interpretation (BSI 2012), Como, Italy.
[28] Neulog (2011). Electrocardiogram logger sensor NUL-218.
Available from:http://neulog.com/electrocardiogram/
[29] "basic rate/enhanced data rate (br/edr)". Bluetooth.com. Retrieved 3 June 2016.
[30] Vinton G. Cerf; Robert E. Kahn (May 1974). "A Protocol for Packet Network
Intercommunication" (PDF). IEEE Transactions on Communications. 22 (5): 637–648.
[31] "Basics | Bluetooth Technology Website". Bluetooth.com. 23 May 2010.
[32] Newton, Harold. (2007). Newton’s telecom dictionary. New York: Flatiron
Publishing.
[33] "Bluetooth.org". Bluetooth.org. Retrieved 3 May 2011.
[34]http://www.silabs.com/products/wireless/bluetooth/bluetooth-smart
modules/Pages/bled112-bluetooth-smart-dongle.aspx
[35] Picture from Page: https://en.wikipedia.org/wiki/Electrocardiography
[36] Picture from Page: https://en.wikipedia.org/wiki/Heart_rate_variability
[37] M. Feuerstein, E. Labbé, and A. Kuczmierczyk, Health psychology: A
psychobiological perspective, 1986.