
Bioenergetic Responses by Pacific Salmon to Climate and ... No. 4/257... · Bioenergetic Responses...
13
North Pacific Anadromous Fish Commission Bulletin No. 4: 257–269, 2007 Abstract: Salmon growth can respond to changes in temperature, food availability, food quality, and activity. Cli- matic variability can affect one or more of these factors, because different climate regimes are associated with different temporal-spatial patterns of temperature, salinity, and other oceanographic features that can alter ocean distribution patterns of salmon and cause shifts in assemblages of other organisms. Consequently, climate vari- ability can simultaneously change the availability or productivity of exploitable prey, and the intensity of competi- tion or predation experienced by salmon at various stages of ocean life. Variability across multiple factors can potentially confound the understanding and prediction of salmon growth or survival. Bioenergetics models can account for changing thermal and food conditions explicitly, and are valuable analytical tools for isolating and evaluating the relative contribution of different factors (e.g., temperature, feeding rate, food availability, food qual- ity) to the consumption and growth of salmon during different life stages. Model simulations, coupled with data on growth trajectories, diet composition, and thermal experience, provide estimates of: 1) consumption rates on each prey (measures of both the importance of various prey to the energy budget of salmon, and the predation impact of salmon on prey species); 2) feeding rate as a proportion of the theoretical maximum consumption rate, a measure of relative food availability; and 3) growth efficiency, a measure of how much food was required to achieve the observed growth rate. We applied bioenergetics models to juvenile pink salmon in the Gulf of Alaska during years of low (2001) versus high (2002) ocean survival to examine feeding and growth performance between years while explicitly accounting for significant variability in stage-specific distribution, diet, growth, and consumption. From these simulations, we determined that higher feeding rates on pteropods, primarily during July–August 2002, ex- plained the higher growth rates and larger body mass of juveniles that were associated with higher stage-specific marine survival for juveniles in 2002. Current bioenergetics models for salmonids provide valuable diagnostic and analytical tools. However, as modeling applications become more predictive and demanding, modifications and improvements will be required to address important topics like behavior, variable activity costs, seasonal and ontogenetic energy allocation, and foraging models. All correspondence should be addressed to D. Beauchamp. e-mail: [email protected] Bioenergetic Responses by Pacific Salmon to Climate and Ecosystem Variation David A. Beauchamp 1 , Alison D. Cross 2 , Janet L. Armstrong 2 , Katherine W. Myers 2 , Jamal H. Moss 3 , Jennifer L. Boldt 2,4 , and Lewis J. Haldorson 4 1 US Geological Survey, University of Washington, School of Aquatic and Fisheries Sciences, Box 355020, Seattle, Washington 98105-5020, USA 2 University of Washington, School of Aquatic and Fisheries Sciences, Box 355020, Seattle, Washington 98105-5020, USA 3 NOAA, NMFS, Alaska Fisheries Science Center, Auke Bay Laboratory, 11305 Glacier Highway, Juneau, Alaska 99108, USA 4 School of Fisheries and Ocean Sciences, University of Alaska-Fairbanks, 11120 Glacier Highway, Juneau, Alaska 99108, USA Keywords: salmon, feeding rate, temperature, climate, food supply, bioenergetics, marine survival, ecosystems INTRODUCTION Climate change can impose direct and indirect effects on the energetics of Pacific salmon in marine ecosystems, and these effects can have both immediate and delayed con- sequences for their growth and survival. Climate-driven changes in the physical characteristics of water masses deter- mine temporal-spatial patterns of temperature, salinity, light, and nutrients in the epipelagic waters inhabited by salmon (Hare and Francis 1995; Mantua et al. 1997; Batchelder and Beauchamp, D.A., A.D. Cross, J.L. Armstrong, K.W. Myers, J.H. Moss, J.L. Boldt, and L.J. Haldorson. 2007. Bioenergetic responses by Pacific salmon to climate and ecosystem variation. N. Pac. Anadr. Fish Comm. Bull. 4: 257–269. © 2007 The North Pacific Anadromous Fish Commission Powell 2002). Direct behavioral responses can alter move- ment and distribution patterns of salmon in coastal, shelf, and open ocean environments. Direct metabolic responses to different temperatures or salinities determine what frac- tion of an organism’s energy budget must support basal and active metabolism rather than be allocated into somatic growth, reproduction, or high-energy lipid storage. Climate change can also affect the energetics of salmon indirectly by altering other biological components of the ecosystem. Biotic responses to the physical environment 257
Transcript of Bioenergetic Responses by Pacific Salmon to Climate and ... No. 4/257... · Bioenergetic Responses...
North Pacific Anadromous Fish CommissionBulletin No. 4: 257–269, 2007
Abstract: Salmon growth can respond to changes in temperature, food availability, food quality, and activity. Cli-matic variability can affect one or more of these factors, because different climate regimes are associated with different temporal-spatial patterns of temperature, salinity, and other oceanographic features that can alter ocean distribution patterns of salmon and cause shifts in assemblages of other organisms. Consequently, climate vari-ability can simultaneously change the availability or productivity of exploitable prey, and the intensity of competi-tion or predation experienced by salmon at various stages of ocean life. Variability across multiple factors can potentially confound the understanding and prediction of salmon growth or survival. Bioenergetics models can account for changing thermal and food conditions explicitly, and are valuable analytical tools for isolating and evaluating the relative contribution of different factors (e.g., temperature, feeding rate, food availability, food qual-ity) to the consumption and growth of salmon during different life stages. Model simulations, coupled with data on growth trajectories, diet composition, and thermal experience, provide estimates of: 1) consumption rates on each prey (measures of both the importance of various prey to the energy budget of salmon, and the predation impact of salmon on prey species); 2) feeding rate as a proportion of the theoretical maximum consumption rate, a measure of relative food availability; and 3) growth efficiency, a measure of how much food was required to achieve the observed growth rate. We applied bioenergetics models to juvenile pink salmon in the Gulf of Alaska during years of low (2001) versus high (2002) ocean survival to examine feeding and growth performance between years while explicitly accounting for significant variability in stage-specific distribution, diet, growth, and consumption. From these simulations, we determined that higher feeding rates on pteropods, primarily during July–August 2002, ex-plained the higher growth rates and larger body mass of juveniles that were associated with higher stage-specific marine survival for juveniles in 2002. Current bioenergetics models for salmonids provide valuable diagnostic and analytical tools. However, as modeling applications become more predictive and demanding, modifications and improvements will be required to address important topics like behavior, variable activity costs, seasonal and ontogenetic energy allocation, and foraging models.
All correspondence should be addressed to D. Beauchamp.e-mail: [email protected]
Bioenergetic Responses by Pacific Salmon to Climate and Ecosystem Variation
David A. Beauchamp1, Alison D. Cross2, Janet L. Armstrong2, Katherine W. Myers2,Jamal H. Moss3, Jennifer L. Boldt2,4, and Lewis J. Haldorson4
1US Geological Survey, University of Washington, School of Aquatic and Fisheries Sciences, Box 355020, Seattle, Washington 98105-5020, USA
2University of Washington, School of Aquatic and Fisheries Sciences, Box 355020, Seattle, Washington 98105-5020, USA
3NOAA, NMFS, Alaska Fisheries Science Center, Auke Bay Laboratory, 11305 Glacier Highway, Juneau, Alaska 99108, USA
4School of Fisheries and Ocean Sciences, University of Alaska-Fairbanks,11120 Glacier Highway, Juneau, Alaska 99108, USA
Keywords: salmon, feeding rate, temperature, climate, food supply, bioenergetics, marine survival, ecosystems
IntroDuCtIon
Climate change can impose direct and indirect effects on the energetics of Pacific salmon in marine ecosystems, and these effects can have both immediate and delayed con-sequences for their growth and survival. Climate-driven changes in the physical characteristics of water masses deter-mine temporal-spatial patterns of temperature, salinity, light, and nutrients in the epipelagic waters inhabited by salmon (Hare and Francis 1995; Mantua et al. 1997; Batchelder and
Beauchamp, D.A., A.D. Cross, J.L. Armstrong, K.W. Myers, J.H. Moss, J.L. Boldt, and L.J. Haldorson. 2007. Bioenergetic responses by Pacific salmon to climate and ecosystem variation. N. Pac. Anadr. Fish Comm. Bull. 4: 257–269.
© 2007 The North Pacific Anadromous Fish Commission
Powell 2002). Direct behavioral responses can alter move-ment and distribution patterns of salmon in coastal, shelf, and open ocean environments. Direct metabolic responses to different temperatures or salinities determine what frac-tion of an organism’s energy budget must support basal and active metabolism rather than be allocated into somatic growth, reproduction, or high-energy lipid storage. Climate change can also affect the energetics of salmon indirectly by altering other biological components of the ecosystem. Biotic responses to the physical environment
257

NPAFC Bulletin No. 4
258
Beauchamp et al.
are expressed as differences in the species composition and productivity of phytoplankton, zooplankton, and vertebrates associated with different water masses (Brodeur et al. 2004; Coyle and Pinchuk 2005), and are modified by the trophic dynamics among these organisms (Aydin et al. 2005). The interacting effects of food supply, competition, predation, environmental stressors, and disease determine the growth and survival of Pacific salmon. Trophic dynamics and these other processes are mediated to some degree by ambient en-vironmental conditions which vary through time and space, and consequences for growth or survival can differ among sizes or life stages. Climate change can affect all life stages of salmon through temporal-spatial changes in the physical environ-ment and biological responses, leading to immediate or delayed consequences for survival or growth. The energy stores of returning adults determine their ability to reach the spawning grounds, find, prepare, and defend stable redd sites, select quality mates, and produce high numbers of em-bryos with the highest possible probability of survival. For smolts, factors affecting spawning, incubation, or freshwater rearing conditions could alter their vulnerability to predation or create spatial-temporal mismatches in foraging conditions during early marine life. Climate-forcing can affect the distribution (Welch et al. 1998), feeding, growth, and survival for juvenile and older life stages of salmon in freshwater, estuarine, and marine habitats (Furnell and Brett 1986; Fisher and Pearcy 1988; Hinch et al. 1995). Many species of salmon exhibit coher-ent growth and survival patterns at regional spatial scales (i.e. 100–500 km), thus suggesting that overall ocean perfor-mance is influenced by environmental or ecological condi-tions experienced in localized regions during early marine life, but that conditions and performance differ among re-gions (Mueter et al. 2002, 2005; Pyper et al. 2005). Distribution and movement patterns will influence temporal-spatial overlap of salmon with food (Aydin et al. 2005), potential competitors and predators, whereas ambi-ent temperature determines the amount of prey that can be consumed, and temperature, activity rates, and prey quality will determine the efficiency with which ingested energy can be converted into growth. The energetic status of adults in the ocean influences the allocation of energy to gonadal and lipid stores, whereas ocean distribution patterns will deter-mine the time and energy required for migration back to the spawning grounds (Blackbourne 1987; Welch et al. 1998). Time and energy shifts away from foraging to migration mean less energy acquired from foraging but more energy spent migrating (Nottestad et al. 1999). Because adult salm-on often acquire significant fractions of their maximum body mass and energy during the final months of ocean growth, the timing, location, and degree of transition from feeding to migration activity likely involves significant evolutionary trade-offs between the benefits and consequences of arrival timing on the spawning grounds and the energetic scope for
reproductive investment and activity. Size-selective mortality has commonly been invoked as an important factor influencing survival of juvenile salmon in freshwater, estuarine, and marine habitats (Parker 1968; Hartt 1980; Healey 1982; Bax 1983; Holtby et al. 1990; Koe-nings et al. 1993; Willette et al. 1999; Beamish and Mahnken 2001; Moss et al. 2005). Growth integrates the combined effects of feeding rate, food quality, temperature, and addi-tional metabolic costs attributed to unusual levels of activity or environmental stress. Therefore, these factors that affect juvenile growth performance and body size should be linked to survival at current or subsequent life stages. The quantity and quality of exploitable prey can vary spatially and temporally in response to climate-driven bot-tom-up control (Fisher and Pearcy 1988; Aydin et al. 2005; Coyle and Pinchuk 2005; Zamon and Welch 2005), but if food supply is limiting, intra- or inter-specific competition could exacerbate localized reductions in food (Ruggerone et al. 2003; Beauchamp et al. 2004; Ruggerone and Goetz 2004). Organisms are termed “exploitable prey” here if they commonly contribute significant fractions of the biomass in the diet (e.g., prey contribution ≥ 10% of the average diet contents by wet weight), if they fall within the edible size ranges consumed by salmon, and if these prey are available at locations, depths, and times that salmon can detect and feed on them. Juvenile salmon in marine systems generally feed during daylight (Armstrong et al. 2005) in the upper mixed layer (e.g., 0–10 m or 0–20 m depths) on prey ≥ 1 mm; therefore, estimates of prey availability should be fil-tered through similar temporal, spatial, and size-based crite-ria. Prey quality can affect net energy intake rate. Prey qual-ity explicitly includes energy density (J∙g-1 wet body mass), body mass (g wet body mass), and digestibility (indigestible proportion of the body mass) of prey, whereas differences in prey detection, capture, and handling times are generally only implicitly reflected in measures of diet composition and prey electivity. Understanding the effects of climate change is compli-cated because of the simultaneous change across a suite of physical and biological factors that directly or indirectly in-fluence growth and survival of salmon in the ocean; howev-er, bioenergetics modeling provides a conceptual framework to mechanistically account for energetic responses to chang-ing temperature, diet, body size and growth (Brandt and Hartman 1993; Ney 1993). Bioenergetics models are energy balance equations where energy inputs from consumption equal energy losses due to metabolism and waste, with the remaining energy surplus or deficit allocated to growth (or weight loss) of the consumer. The Wisconsin Bioenergetics Model (Hanson et al. 1997) is the most widely used form of this type of model (Hansen et al. 1993; Ney 1993) and pro-vides parameters for numerous freshwater and some marine species of fish and several invertebrates. The models for Pacific salmon (Beauchamp et al. 1989; Stewart and Ibarra 1991) and steelhead (Rand et al. 1993)
NPAFC Bulletin No. 4
259
Bioenergetic responses by salmon to climate and ecosystem
contain weight-dependent functions for maximum daily con-sumption and metabolism, temperature-dependent functions for maximum daily consumption and metabolism (basal res-piration and activity), and a temperature- and ration-depen-dent function for waste. Specific dynamic action (SDA) is treated as a constant proportion of consumption. The model operates on a daily time step, thus enabling simulations to account for changing conditions at fine-scale temporal reso-lution, if appropriate. For many species, including Pacific salmon, parameters have often been “borrowed” from other species, thus call-ing into question how accurately the specific physiological responses of a species can be simulated (Boisclair and Tang 1993; Ney 1993; Trudel and Welch 2005). Despite these concerns, salmonid models have generally performed well at estimating consumption when compared to independent measures of consumption and growth in controlled labora-tory conditions (Madenjian et al. 2004), or to estimates of in situ consumption in both freshwater (Beauchamp et al. 1989; Ruggerone and Rogers 1992) and marine environments (Brodeur et al. 1992). In these cases, the model produced consumption estimates within ± 10% of independently de-rived, field-generated estimates for the same consumers, and these examples were applied to the same life stages or size ranges as that of salmon spending their first growing season in the ocean. Although comparing one estimate to another does not ensure that either one represents the true value, such corroborations encourage confidence in these approaches and support the applications of these models to compare con-sumption and growth performance, in at least relative terms at a minimum, with reasonable expectation that the model estimates are considerably better than that. When evaluat-ing these models, the key consideration should be the level of uncertainty associated with a specific application of the model (i.e., estimation of consumption versus estimating growth, respiration, or waste). Because growth is easier to estimate than consumption, and is more commonly measured in field studies, the most common application of these models has been to compute the consumption (in terms of biomass and associated energy of prey) required to satisfy a particular growth rate, given the body mass, thermal experience, and diet of the consumer. Conversely, the model can compute growth, given a speci-fied level of energy consumption and thermal experience. In this latter application, independent estimates of consumption are rare, so this approach often relies on foraging models that use either a functional response model (Stockwell and Johnson 1997, 1999) or a prey encounter-capture rate model (Burke and Rice 2002; Mazur and Beauchamp 2006). The objectives of this paper are: 1) to describe how bioenergetics modeling, when coupled to directed field sam-pling, can quantify consumption rates or growth performance of salmon in the wild by accounting for effects of feeding rate (an indicator of food supply), prey quality, temperature, and body size; 2) to provide an example application of this
approach that contrasts juvenile pink salmon growth in the coastal Gulf of Alaska (GOA) during years of low versus high marine survival; and 3) discuss some important limi-tations and suggested improvements for the model with re-spect to current and future applications.
MEtHoDS
Simulating Consumption and Growth Performance with a Bioenergetics Model
We used the physiological functions for pink/sockeye salmon in the Wisconsin bioenergetics model (Hanson et al. 1997) to demonstrate how salmon would be expected to re-spond to changes in body size, temperature, feeding rate, and food quality over a range of conditions that were relevant to the first year of ocean growth. Parameters from the sockeye salmon model (Beauchamp et al. 1989) have been used as a surrogate pink salmon model (Hanson et al. 1997; Aydin et al. 2005; Cross et al. 2005). All of the salmonid bioenerget-ics models (with the exception of lake trout), share the same functional forms of equations for maximum consumption, metabolism and waste, although the parameter values differ somewhat among species (Hanson et al. 1997). Therefore, the description using the sockeye/pink salmon model should apply to general relationships for other salmonid species, although the actual magnitude of the responses at different body sizes or temperatures differ among species due to spe-cies-specific parameterizations of these functions. We generated response curves from the model to com-pare the relationship between maximum consumption Cmax and metabolism (standard + active respiration costs) over a range of body masses (0.3–300 g) to demonstrate how al-lometric responses lead to differences in the ratio of gross food intake to metabolic costs through the ontogeny of fish. To compare Cmax and daily metabolic rates (standard, active, and SDA) in comparable units, metabolic rates were con-verted from energy rates (J∙g-1∙d-1) into mass equivalents of food (g∙g-1∙d-1), assuming a prey energy density of 4000 J/g. Modeled values for Cmax, Cmax – waste, and metabolism were plotted across a range of temperatures (0–25°C) for a 10-g sockeye/pink salmon. The resulting temperature-dependent growth rates were computed for a 10-g fish eating at Cmax:
Growth = Cmax – Waste – Metabolism
These calculations were repeated for a 100-g consumer to demonstrate the proportional difference in scope for growth as a proportion of consumer body mass (g∙g-1∙d-1). To examine the predicted temperature-dependent growth response of juvenile salmon to different daily ration sizes and prey quality, the daily growth rate for a 10-g salmon was simulated at 1°C temperature increments for one day over a range of 0–25°C. The simulations were run at daily con-sumption rates of 100%, 50%, and 20% of Cmax (p-value =
NPAFC Bulletin No. 4
260
Beauchamp et al.
1.0, 0.5, and 0.2 in the Wisconsin model, respectively). The prey energy density for these simulations was set at 2800 J/g to emulate a relatively low-energy diet composed primarily of copepods and pteropods (Davis et al. 1998; Aydin et al. 2005). To demonstrate the effect of higher prey quality on growth, the low-feeding rate simulation (20% Cmax) was repeated us-ing a higher prey energy density of 5000 J/g to emulate a diet composed primarily of higher quality prey like euphausiids, larval/juvenile fish, and squid (Aydin et al. 2005).
Simulations of Pink Salmon in the Coastal Gulf of Alaska
The bioenergetics model was used to evaluate growth performance and consumption requirements of juvenile pink salmon during their first growing season in Prince William Sound (PWS) and the coastal Gulf of Alaska (CGOA) dur-ing contrasting years of low marine survival (2001, aver-age hatchery juvenile-adult survival S = 3%) and three-fold higher survival (2002, S = 9%). Spatial-temporal distribu-tion, diet, thermal experience, and juvenile growth rates also differed considerably between 2001 and 2002, in addition to the difference in survival. We focused on identifiable release groups from PWS hatcheries both because marine survival rates could be linked directly to these groups, and to minimize variation due to size, location, and timing of entry and prior growth history from the broader mix of stocks co-occurring in these sam-ples. PWS hatcheries applied unique thermal otolith marks to each release group; thus the origin, time, and average size at release could be linked to hatchery fish subsequently cap-tured at various life stages by decoding their otolith marks. The modal juvenile feeding and growth conditions for these hatchery groups were simulated by entering the weight-ed-average size, growth, diet, and temperature regimes (Armstrong et al. 2005; J. Armstrong and A. Cross, unpub-lished data) from the water masses yielding the highest catch per unit effort (CPUE) of hatchery salmon each month as inputs to the bioenergetics model (Table 1). Monthly energy densities measured for pink salmon in Prince William Sound were taken from Boldt and Haldorson (2002), and prey en-ergy densities were taken from literature values (Davis et al. 1998; Cross et al. 2005) and direct laboratory measurements (Mazur et al. 2007) of the major prey organisms (Table 2). Juvenile pink salmon were sampled monthly from July through September or October 2001 and 2002 at three locations in PWS (PWS 1–3) and six stations along the GLOBEC-designated Seward line (GAK 1–6). Fork lengths (FL, mm) at specific life stages were back-calculated from scale circuli spacing patterns (Courtney et al. 2000; Fisher and Pearcy 2005; Moss et al. 2005) based on regressions of FL versus the radius of the total scale size (SS, μm) for PWS hatchery fish sampled in PWS and CGOA during 2001 (see Moss et al. 2005; R2 = 0.78, p < 0.001):
FL = 0.216∙SS + 44.49
and during 2002 (R2 = 0.77, p < 0.001):
FL = 0.202∙SS + 47.42
The back-calculated stage-specific lengths were con-verted to body mass (W, g wet weight) using a regression based on all PWS hatchery fish sampled from all locations and dates during 2001 and 2002 (R2 = 0.99; p < 0.001):
W = 0.0000073∙FL3.064
Using back-calculated lengths and weights enabled us to track the average growth trajectories of known individu-als rather than simply computing the mean monthly weights for juveniles sampled from open, mixed populations that could inflate variability due to a wider diversity of origins and growth histories. In addition, the latter approach is sus-ceptible to potential bias from size-selective mortality or migration. By examining monthly frequency histograms of back-calculated size-at-circuli patterns, we determined that the hatchery fish sampled from each month displayed very similar growth histories, and could thus dismiss the concern about size-selective bias in the back-calculated growth esti-mates. Moss et al. (2005) demonstrated that juveniles from the same hatchery cohorts that survived to adulthood were sig-nificantly larger than the average size of juveniles rearing in CGOA during their first growing season in 2001, and that significant size-selective mortality occurred after the first summer of life. To compare the feeding and growth per-formance of the average juveniles to those that survived to adulthood, we assumed that both groups of juveniles experi-enced similar thermal regimes and diet composition, but fed at different rates. For 2001, the back-calculated body weight of both the average juveniles sampled during summer 2001 and those for comparable life stages of the surviving adults were used in parallel simulations to estimate how much more food biomass and energy would have been required for the average juvenile to support the observed growth rate of the average survivor, assuming the same diet and thermal expe-rience between groups (Table 1).
rESuLtS
Generalized Bioenergetics responses
An examination of the combined effects of weight- and temperature-dependent responses of the functions in the pink/sockeye salmon model (Beauchamp et al. 1989) pro-vides insights into the physiological constraints facing Pa-cific salmon in the ocean under different environmental con-ditions (different thermal regimes, food availability and food quality). The specific rates (g∙g-1∙d-1) of both maximum con-sumption (Cmax) and metabolic costs (basal and active me-tabolism) decline asymptotically with increasing body mass,

NPAFC Bulletin No. 4
261
Bioenergetic responses by salmon to climate and ecosystem
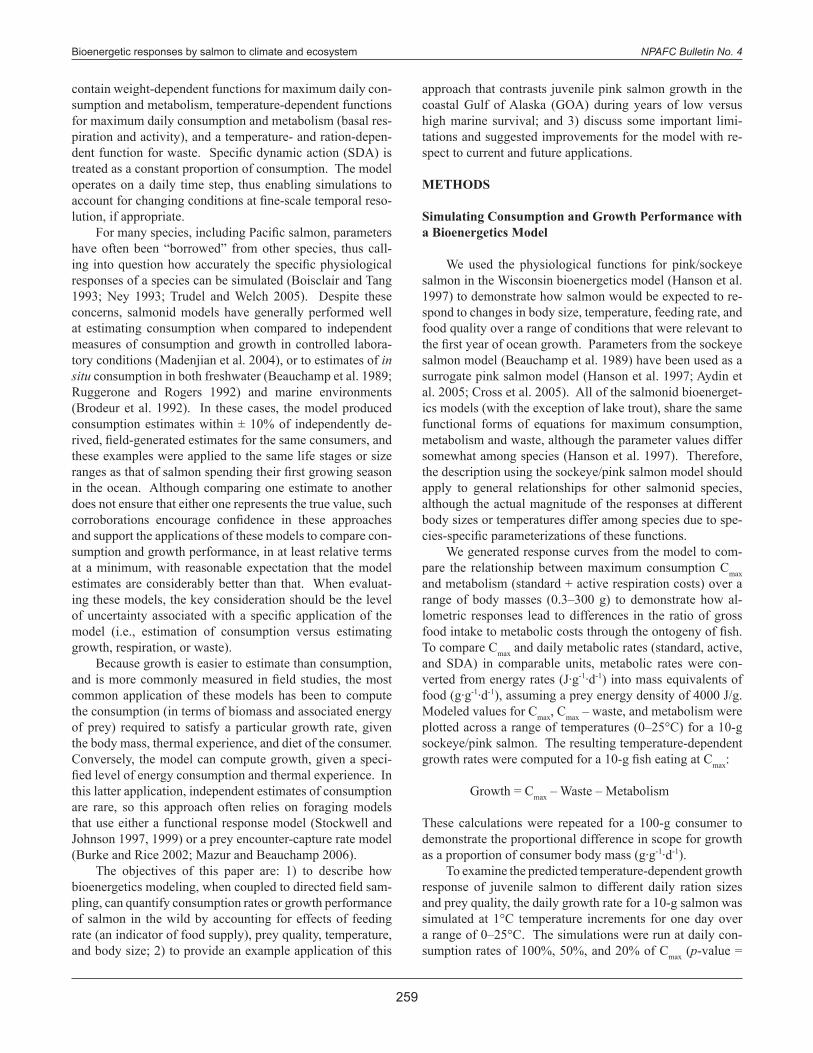
but Cmax declines more rapidly than metabolism (Fig. 1). For example, assuming a diet that averages 4000 J∙g-1, the meta-bolic costs for fry weighing 0.3 g represent 13% of the en-ergy consumed at Cmax, but metabolism rapidly increases to 21% of the energy in Cmax for 10-g juvenile salmon and 51% for 1000-g salmon. The energy budget of sockeye salmon changes consid-erably as a function of temperature as well (Fig. 2). When food is unlimited, the maximum consumption rate responds to increasing temperature as a dome-shaped curve. Waste losses and SDA are nearly constant proportions of consump-tion (Ney 1993), so the energy remaining after waste is sub-tracted from consumption also forms a dome-shaped curve in response to increasing temperature. Metabolic costs increase exponentially with temperature; therefore, the distance be-tween the respiration + SDA line and the Cmax – Waste lines represent the amount of energy remaining for growth (Fig. 2a). When plotting just the growth component of the energy budget under unlimited food conditions (Fig. 2b), growth potential also forms a dome-shaped response to temperature, and larger consumers (e.g., 100-g versus 10-g consumers) grow at slower rates in proportion to their body mass. Fish do not frequently feed at Cmax; therefore, we must consider how growth responds to temperature and other fac-
Fig. 1. Weight-dependent functions for maximum daily consump-tion Cmax and metabolic losses from basal and active metabolism. The curves are generated for sockeye salmon (0.3–300 g) at 20°C and represent specific daily rates of food consumption (g food eaten per g body mass per day) and the equivalent mass of food (with an assumed energy density of 4000 J∙g-1) needed to satisfy standard and active metabolic costs. The 20°C temperature represents the temperature where Cmax is greatest for any given body mass.
Body mass (g)
0 50 100 150 200 250 300
Cm
ax &
M
g Fo
od e
quiv
alen
t / (g
Bod
y m
ass
* d)
0.00
0.02
0.04
0.06
0.08
0.10
0.12
Cmax
Metabolism (Basal + Active)
Pink salmon Diet composition (proportions by wet weight)
Date Day Primary water mass
occupied
BodyWt. (g)
Energy density
(J/g)
Thermal exper-ience
Small cope-pod
Large cope-pod
Euph-ausiid
Amphi-pod
Crab Shrimp Ptero-pods
Larva-ceans
Insect Fish Other
2001 Avg., Surv.
5/18/01 139 PWS 0.53, 0.53 4,102 8.0 0.00 0.74 0.05 0.00 0.02 0.00 0.04 0.00 0.02 0.04 0.09
7/11/01 193 PWS 8.4, 9.7 3,665 12.0 0.02 0.03 0.01 0.19 0.03 0.02 0.42 0.20 0.01 0.01 0.06
8/15/01 228 ALL 23.4, 28.2 4,134 14.1 0.02 0.26 0.09 0.33 0.06 0.01 0.08 0.01 0.04 0.02 0.06
9/19/01 263 Trans 51.1, 68.9 4,248 11.7 0.00 0.27 0.07 0.15 0.02 0.00 0.17 0.11 0.05 0.11 0.04
2002
5/21/02 142 PWS 0.56 4,102 8.0 0.00 0.74 0.05 0.00 0.02 0.00 0.04 0.00 0.02 0.04 0.09
7/21/02 203 PWS 14.28 3,665 12.7 0.00 0.34 0.02 0.12 0.03 0.00 0.42 0.02 0.00 0.02 0.03
8/29/02 242 Trans 51.80 4,134 12.9 0.00 0.00 0.04 0.10 0.01 0.00 0.68 0.00 0.00 0.15 0.01
Table 1. Bioenergetics model inputs for simulations of the modal growth cohorts of hatchery pink salmon in Prince William Sound and Gulf of Alaska during the first spring-summer growing season. For 2001, the back-calulated body weight of both the average (Avg.) juveniles sampled during summer 2001 and those for comparable life stages of surviving adults (Surv.) were used in parallel simulations to estimate how much more food biomass and energy would have been required for the average juvenile to support the observed growth rate of the average survivor, assuming the same diet and and thermal experience between groups. Water masses refer to PWS = Prince William Sound; Trans = Transition Zone; ALL = PWS, Alaska Coastal Current and Trans.
Simulation days
Small copepod
Large copepod
Euphausiid Amphipod Crab Shrimp Pteropods Larva-ceans
Insect Fish 2001 Other
2002 Other
May-July 139-193 2,625 2,625 3,110 2,466 2,980 2,980 2,612 3,177 3,117 3,760 2,655 2,578
August 193-228 2,625 2,625 3,110 2,466 2,980 2,980 2,612 3,177 3,117 3,760 2,501 2,752
September 228-263 3,040 3,040 4,259 2,787 4,458 4,458 2,630 1,434 3,117 3,760 2,995
Table 2. Model inputs for the temporal change in energy densities (J/g wet weight) of the major prey taxa consumed by juveniles in Prince William Sound and Coastal Gulf of Alaska during spring-summer 2001 and 2002. Note that energy densities for “other” prey differ between 2001 and 2002 due to different diet compositions.
NPAFC Bulletin No. 4
262
Beauchamp et al.
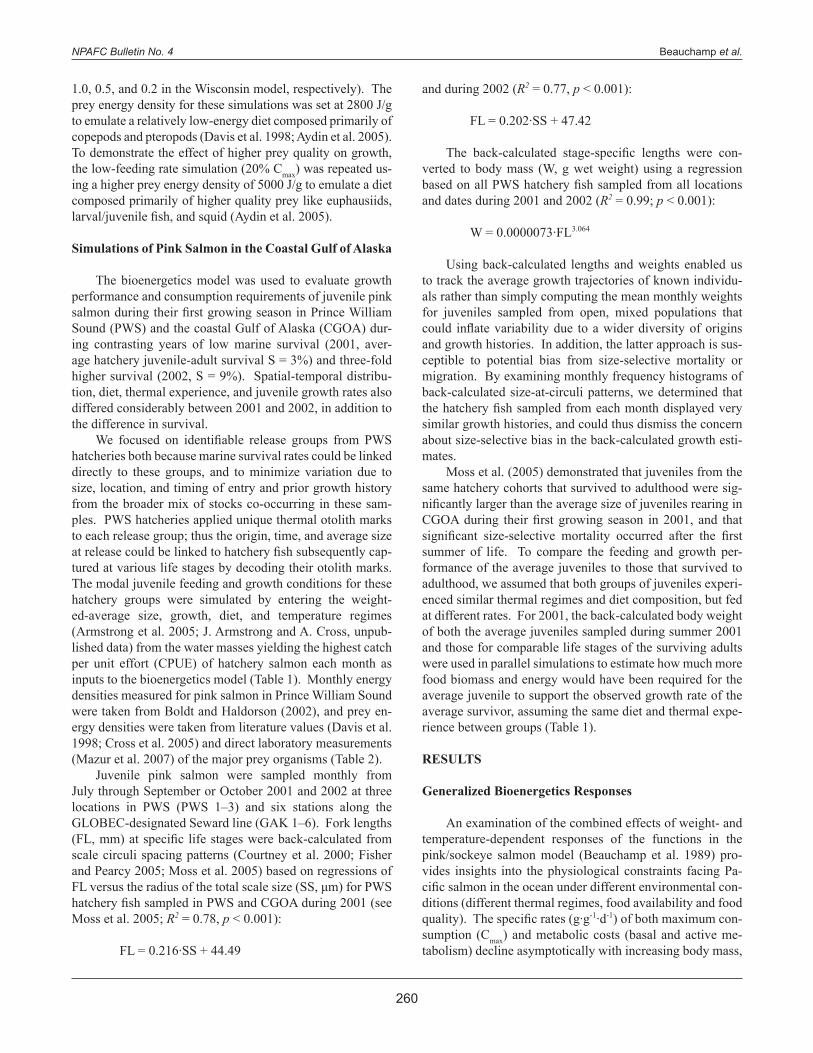
tors when feeding rates are considerably lower than maxi-mum. Growth rates declined with reduced daily ration as expected, but the shape of the growth response to tempera-ture also changed. As daily rations declined, growth was maximized at progressively lower temperatures (Fig. 3), and temperatures that permitted positive growth declined dramatically from 24°C at the maximum feeding rate, to 17°C when feeding at 20% of the maximum rate. For any given feeding rate, if the diet shifted from the normal mix of crustacean and gelatinous zooplankton with average energy density of 2800 J∙g-1 to a higher-energy diet of squid, eu-phausiids, and fish, averaging 5000 J∙g-1 (Aydin et al. 2005; Mazur et al. 2007), growth at the same feeding rate improved considerably (Fig. 3). Improved prey quality dramatically expanded the range of temperatures that could be tolerated at low ration sizes. For instance, at feeding rates of 20% of Cmax, when prey energy density increased from 2800 J∙g-1 to 5000 J∙g-1, growth rates more than doubled across all tem-peratures, and temperatures that allowed positive growth in-creased from 17°C to 22°C (Fig. 3). At higher feeding rates, higher prey energy densities increase growth rates dispro-portionately more than at lower feeding rates, but have much less effect on the range of temperatures that support posi-
tive growth. At higher rations, metabolic losses represent a smaller fraction of the total energy budget, so a larger pro-portion of the surplus energy from high quality prey can be converted directly into growth. For any given feeding rate (constant p-value), growth remained within 10% of the maximum growth rate over a range of 11°C (8–19°C) at the maximum feeding rate and at the 50% feeding rate (5–16°C), but compressed to a 6°C range (4–10°C) at the 20% feeding rate. Outside these tem-perature ranges, feeding and growth rates declined at an ac-celerated rate. These results suggest that over a relatively broad range of temperatures and feeding rates, the direct thermal effects of climate change on growth are relatively minor, compared to the effects of differences in feeding rate or prey quality caused by climate-induced changes to the species composition and productivity of the water masses inhabited by salmon. However, outside those broad ther-mal growth plateaus, temperature becomes an increasingly important limit to growth, and the range of temperatures over which direct thermal effects become important will be strongly influenced by the effect of food availability on feed-ing rate (Fig. 3).
Juvenile Pink Salmon Simulations in Prince William Sound and Coastal Gulf of Alaska during 2001 and 2002
Higher growth and feeding rates were associated with 3-fold higher marine survival rates in 2002 compared to 2001 (Fig. 4A-C). Although growth and feeding were consistently higher during May–August 2002 than 2001, the biggest dif-
Temperature0 5 10 15 20 25
Gro
wth
g/(g
*d)
0.00
0.01
0.02
0.03
0.04100% Cmax
50% Cmax
20% Cmax
20%, 5000 J/g
Gmax
Gmax
Gmax
Gmax
Fig. 3. A comparison of temperature-dependent daily growth rates for 10-g sockeye salmon feeding at different percentages of the max-imum daily consumption rate Cmax on prey containing energy density of 2800 J∙g-1, except the second lowest curve represents growth at 20% Cmax with a diet containing high-energy prey (5000 J∙g-1). The maximum growth rate for each consumption level is indicated by Gmax.
Fig. 2. A-Temperature-dependent functions for Cmax, Cmax – Waste losses, and Metabolic losses (Basal, Active, and SDA) for a sockeye salmon of any given body mass; and (B) a comparison of tempera-ture-dependent daily growth rates between 10-g and 100-g sockeye salmon feeding at the theoretical maximum daily consumption rate Cmax on prey containing an energy density of 2800 J∙g-1.
Temperature0 5 10 15 20 25
Gro
wth
g/(g
*d)
0.00
0.01
0.02
0.03
0.04
10 g
100 g
0 5 10 15 20 25
Rate
s g/
(g*d
)
0.00
0.05
0.10
0.15
0.20
0.25
Cmax
Cmax- Waste
Resp. + SDA
Growth
A
B
Bod
y m
ass
(g)
0
10
20
30
40
50
60
2001, S = 3% 2002, S = 9%
Con
sum
ptio
n (g
/ pe
riod)
0
25
50
75
100
125 Copepod Larvacean PteropodAmphipod Euphausiid Fish Other
May-Jun Jun-Jul Jul-Aug Aug-Sep0
25
50
75
100
125
2001
2002
A
B
C
NPAFC Bulletin No. 4
263
Bioenergetic responses by salmon to climate and ecosystem
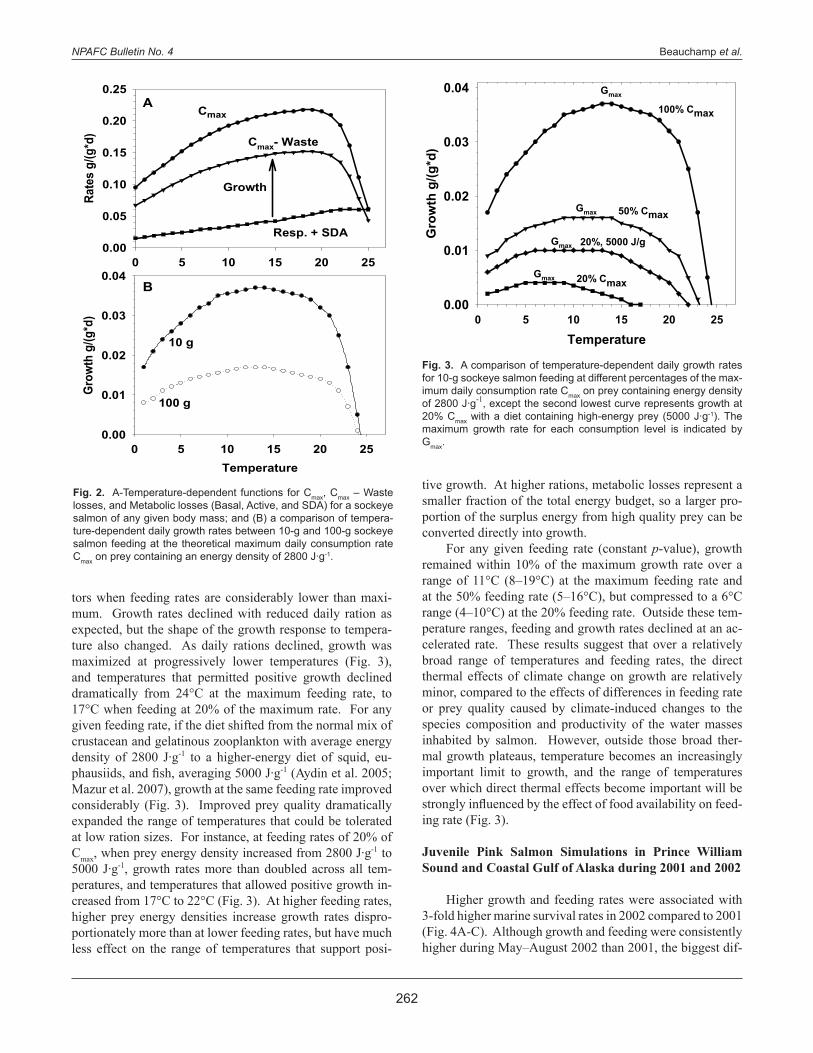
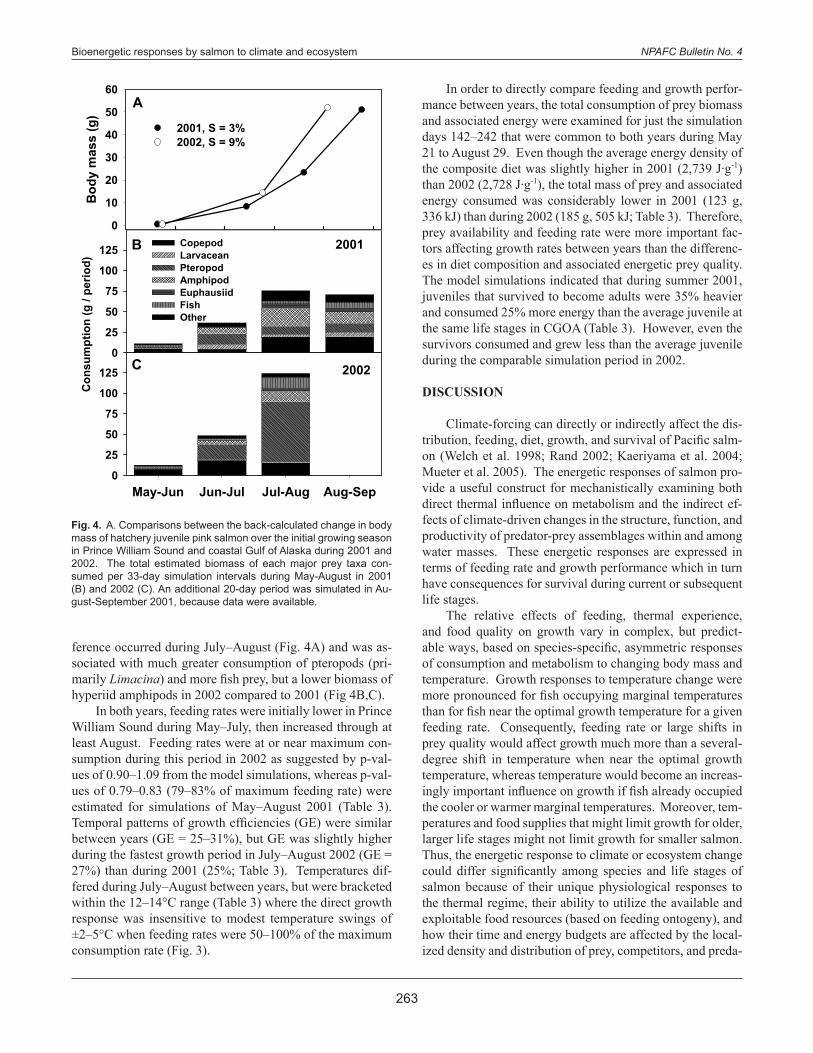
ference occurred during July–August (Fig. 4A) and was as-sociated with much greater consumption of pteropods (pri-marily Limacina) and more fish prey, but a lower biomass of hyperiid amphipods in 2002 compared to 2001 (Fig 4B,C). In both years, feeding rates were initially lower in Prince William Sound during May–July, then increased through at least August. Feeding rates were at or near maximum con-sumption during this period in 2002 as suggested by p-val-ues of 0.90–1.09 from the model simulations, whereas p-val-ues of 0.79–0.83 (79–83% of maximum feeding rate) were estimated for simulations of May–August 2001 (Table 3). Temporal patterns of growth efficiencies (GE) were similar between years (GE = 25–31%), but GE was slightly higher during the fastest growth period in July–August 2002 (GE = 27%) than during 2001 (25%; Table 3). Temperatures dif-fered during July–August between years, but were bracketed within the 12–14°C range (Table 3) where the direct growth response was insensitive to modest temperature swings of ±2–5°C when feeding rates were 50–100% of the maximum consumption rate (Fig. 3).
In order to directly compare feeding and growth perfor-mance between years, the total consumption of prey biomass and associated energy were examined for just the simulation days 142–242 that were common to both years during May 21 to August 29. Even though the average energy density of the composite diet was slightly higher in 2001 (2,739 J∙g-1) than 2002 (2,728 J∙g-1), the total mass of prey and associated energy consumed was considerably lower in 2001 (123 g, 336 kJ) than during 2002 (185 g, 505 kJ; Table 3). Therefore, prey availability and feeding rate were more important fac-tors affecting growth rates between years than the differenc-es in diet composition and associated energetic prey quality. The model simulations indicated that during summer 2001, juveniles that survived to become adults were 35% heavier and consumed 25% more energy than the average juvenile at the same life stages in CGOA (Table 3). However, even the survivors consumed and grew less than the average juvenile during the comparable simulation period in 2002.
DISCuSSIon
Climate-forcing can directly or indirectly affect the dis-tribution, feeding, diet, growth, and survival of Pacific salm-on (Welch et al. 1998; Rand 2002; Kaeriyama et al. 2004; Mueter et al. 2005). The energetic responses of salmon pro-vide a useful construct for mechanistically examining both direct thermal influence on metabolism and the indirect ef-fects of climate-driven changes in the structure, function, and productivity of predator-prey assemblages within and among water masses. These energetic responses are expressed in terms of feeding rate and growth performance which in turn have consequences for survival during current or subsequent life stages. The relative effects of feeding, thermal experience, and food quality on growth vary in complex, but predict-able ways, based on species-specific, asymmetric responses of consumption and metabolism to changing body mass and temperature. Growth responses to temperature change were more pronounced for fish occupying marginal temperatures than for fish near the optimal growth temperature for a given feeding rate. Consequently, feeding rate or large shifts in prey quality would affect growth much more than a several-degree shift in temperature when near the optimal growth temperature, whereas temperature would become an increas-ingly important influence on growth if fish already occupied the cooler or warmer marginal temperatures. Moreover, tem-peratures and food supplies that might limit growth for older, larger life stages might not limit growth for smaller salmon. Thus, the energetic response to climate or ecosystem change could differ significantly among species and life stages of salmon because of their unique physiological responses to the thermal regime, their ability to utilize the available and exploitable food resources (based on feeding ontogeny), and how their time and energy budgets are affected by the local-ized density and distribution of prey, competitors, and preda-
Fig. 4. A. Comparisons between the back-calculated change in body mass of hatchery juvenile pink salmon over the initial growing season in Prince William Sound and coastal Gulf of Alaska during 2001 and 2002. The total estimated biomass of each major prey taxa con-sumed per 33-day simulation intervals during May-August in 2001 (B) and 2002 (C). An additional 20-day period was simulated in Au-gust-September 2001, because data were available.

NPAFC Bulletin No. 4
264
Beauchamp et al.
tors. The ecosystem response to climate change will affect the species assemblage and density of food, competitors, and predators which will affect feeding rate, prey quality, and du-ration of foraging activity. Significant shifts in daily feeding rate or prey quality will always measurably influence growth performance at any temperature, whereas the direct effects of temperature change only become important to growth as ambient temperature deviates further from the maximum growth temperature for a given feeding rate. Hatchery pink salmon from Prince William Sound ex-hibited higher feeding, growth, and ocean survival for ju-veniles inhabiting CGOA during 2002 than in 2001. Using bioenergetics model simulations, we determined that a high-er feeding rate was the primary mechanism for improved growth during 2002, rather than because of changes in ther-mal regime or prey quality. Inter-annual temperature differ-ences had little effect because all changes occurred within the relatively flat plateau at the top of the temperature-dependent growth curve. Inter-annual diet shifts resulted in a minimal change in energy density of the composite diets between years. Although a similar suite of prey groups appeared in the diet both years, the primary prey shifted from predomi-nantly crustaceans during the low-survival year in 2001 (Hy-periid amphipods and copepods) to predominantly pteropods (Limacina spp.) in 2002. These significantly higher feeding rates suggested that the biomass of pteropods was consider-ably higher in CGOA during 2002. Higher proportions of Limacina spp. in the diet were also reported during August
1999 and 2000 (Armstrong et al. 2005), and were also as-sociated with higher ocean survival rates. The dietary im-portance of gelatinous zooplankton like pterpods and larva-ceans, especially the apparent correlation with higher growth and survival of pink salmon deserves further attention. Although the energetic quality of these gelatinous zooplank-ton is slightly lower than crustacean prey, when oceano-graphic conditions permit, their apparently high densities in the shallow (0–10 m) epipelagic layer during daylight sup-port near maximum consumption rates without measurably sacrificing growth efficiency. Temporal-spatial responses of pteropods and other gelatinous zooplankton to climatic shifts and correlations with oceanographic conditions have been reported recently (Coyle and Pinchuk 2005; Zamon and Welch 2005). However, a closer examination of the seasonal dynamics and vertical density distributions of these prey and crustacean zooplankton during daylight, especially in the upper 10 m layer, will be needed before mechanistic links can be quantified between biophysical processes affecting exploitable zooplankton and salmon feeding, growth, and survival. An initial investigation suggests that routine zoo-plankton sampling methods severely underestimate densi-ties of pteropods and other zooplankton that overlap with the depths of foraging salmon during daylight (L. Haldorson, unpublished data). Understanding the mechanisms behind interannual dif-ferences in growth performance is particularly important, be-cause stage-specific size-selective mortality appears to play
Initial date Final date Initial Julian day Final day
Primary water mass occupied
Initial Wt Final Wt P-value C GEDiet
energy density
Initial temp.
Final temp.
2001 Average juveniles
5/18/01 7/11/01 139 193 PWS 0.53 8.4 0.79 25 31% 2,891 8.0 12.0
7/11/01 8/15/01 193 228 PWS-All 8.4 23.4 0.83 59 25% 2,708 12.0 14.1
8/15/01 9/19/01 228 263 All-Trans 23.4 51.1 0.83 109 25% 2,723 14.1 11.7
Std. period 2001: 142 242 123 2,739 (Total 336 kJ)
2001 Surviving adults
5/18/01 7/11/01 139 193 PWS 0.53 9.7 0.84 29 31% 2,891 8.0 12.0
7/11/01 8/15/01 193 228 PWS-All 9.7 28.2 0.89 72 26% 2,708 12.0 14.1
8/15/01 9/19/01 228 263 All-Trans 28.2 68.9 0.98 155 26% 2,723 14.1 11.7
Std. period 2001: 142 242 154 2,739 (Total 421 kJ)
% increase compared to average juveniles in 2001: 35% 25% 25% kj
2002
5/21/02 7/21/02 142 203 PWS 0.56 14.3 0.9 45 30% 2,747 8.0 12.7
7/21/02 8/29/02 203 242 PWS-Trans 14.3 51.8 1.09 140 27% 2,669 12.7 12.9
Std. period 2002: 142 242 185 2,728 (Total 505 kJ)
Table 3. Results of the bioenergetics model simulations including proportion of the theoretical maximum daily consumption rate (P-value), total consumption C (g), growth G (g), growth efficiency (GE = G/C), and mean energy density of the diet (Diet energy density, J/g) over the simulation intervals. For direct comparison between years, total consumption in g and kJ, and average diet energy density are reported for a standardized period of simulation days 142–242 during both 2001 (juveniles and juvenile stages of surviving adults) and 2002. Water masses refer to PWS = Prince William Sound; Trans = Transition Zone; ALL = PWS, Alaska Coastal Current and Trans.

NPAFC Bulletin No. 4
265
Bioenergetic responses by salmon to climate and ecosystem
a significant role in regulating marine survival of salmon (Beamish and Mahnken 2001; Beamish et al. 2004). Moss et al. (2005) demonstrated that juveniles that survived to adult-hood were significantly larger than the average size of juve-niles rearing in CGOA during their first growing season in 2001, and that significant size-selective mortality occurred after the first summer of life. The model simulations indi-cated that surviving adults were 35% heavier and consumed 25% more energy than the average juvenile at the same life stages in CGOA during summer 2001. Thus, average feed-ing and growth performance during 2001 was substantially lower than was necessary for survival through subsequent life stages. As data become available, these analyses can be extended to more years, enabling a mechanistic examination of how different factors potentially contribute to temporal-spatial feeding, growth performance, and survival patterns among years and in response to climate and ecosystem vari-ability. We might discover that different processes drive tro-phic dynamics and survival rates under different climatic and oceanographic conditions. When closely coupled with a directed sampling pro-gram, bioenergetics modeling can help identify and quantify the major factors contributing to the growth rates observed and the rates needed to improve survival under a variety of oceanographic conditions. If food limitation, as indicated by lower feeding rates, is the primary cause, then we can focus on the relative importance of climate-forcing effects versus competition by hatchery fish or other species on ocean carry-ing capacity (Cooney et al. 1998; Hilborn and Eggers 2000; Wertheimer et al. 2004). The delayed size-selective mor-tality scenario described by Moss et al. (2005) allows more consumers to live and feed through the summer, thus deplet-ing more of the food supply, reducing per capita growth, and mutually contributing to more severe size-selective mortal-ity after the growing season. This size-selective over-winter mortality scenario imposes much greater consumption de-mand on ocean carrying capacity than either an acute, high initial marine mortality scenario or a constant mortality rate scenario. The latter two scenarios would both substantially reduce the consumer population before or during the first growing season, thus reducing prey depletion and enabling higher per capita feeding rates for the remaining consumers. Data on spatial-temporal heterogeneity in temperature, prey availability, and prey quality can also be synthesized with bioenergetics models or linked foraging-bioenergetics models into a time series of maps displaying the distribution of high or low growth regions (Brandt et al. 1992). Spatial-temporal patterns in growth potential can then be compared to the distribution, growth performance, and survival of salmon during specific life stages as a bioenergetically-based application of the ideal-free distribution theory (Hughes and Grand 2000) to salmon in the ocean. Climate-induced shifts in seasonal ocean distribution patterns (Welch et al. 1998) could also be examined or predicted in terms of bioenergetic responses to the net effects of thermal conditions and food
supply. Welch et al. (1998) reported sharp upper thermal boundaries in ocean distribution patterns of sockeye salmon, but that these limits shifted monthly. The authors developed a bioenergetics-based conceptual argument for the sharp ther-mal boundaries, based on temperature-dependent responses of basal metabolism and maximum consumption. Their ap-proach could be developed further by explicitly incorporat-ing the effects of body size, activity costs, and feeding rate or food supply. Recall that as body mass increases, metabolic costs represent an increasing fraction of maximum energy intake. Therefore, older and larger life stages of salmon will have lower scope for growth or activity than younger, small-er salmon across all temperatures. Larger salmon should re-spond more sensitively to reductions in food supply or prey quality, because the temperatures that support the maximum possible growth rate (or even just a positive growth rate) for a given feeding rate should decline more rapidly than for smaller consumers as feeding rates decline. Therefore, bio-energetics modeling can provide a mechanistic framework for diagnosing and potentially predicting the effects of cli-mate-induced changes in thermal regime and ecosystem pro-ductivity and structure on salmon distribution, production, and survival. Despite broad acceptance and application of bioenerget-ics models, they should be used cautiously, and the objec-tives of model applications should be consistent with the capabilities for which they were originally developed. For many species, including Pacific salmon, parameters have of-ten been “borrowed” from other species (Ney 1993), or con-structed opportunistically from existing data sets that were generated for entirely different purposes. As demands for more predictive models increase, bioen-ergetics-based models will need to be modified and refined to ensure that modeling capability can satisfy these expecta-tions appropriately. Bioenergetics models have historically been used most effectively in a diagnostic or hind-casting role: predation impacts, food limitation, or thermal restric-tion would be simulated, based on existing data, to quanti-tatively diagnose which factors limited production, and then these results would be used to infer how similar scenarios applied to current and future conditions. To become more predictive, bioenergetics models need to link with comple-mentary models that address important factors like behav-ioral shifts in movement, distribution, and feeding (e.g., migration or foraging models), variable activity costs, sea-sonal and ontogenetic energy allocation, and energetic feed-backs due to disease or environmental stressors. Potential modifications and complementary models are developing rapidly for environmentally- and behaviorally-driven forag-ing models (e.g., Stockwell and Johnson 1999; Hardiman et al. 2004; Mazur and Beauchamp 2006), feeding-migration models (Rand et al. 1997; Walters et al. 1997; Nottestad et al. 1999), and others. Existing bioenergetics models respond explicitly to temperature, but other important environmental factors should be included like salinity, dissolved oxygen,

NPAFC Bulletin No. 4
266
Beauchamp et al.
and perhaps changes in physiological responses like growth compensation and seasonal or ontogenetic energy alloca-tion. The most contentious issue surrounding bioenergetics models for salmonids centers around the accuracy of func-tions for active and standard metabolism (Boisclair and Tang 1993; Trudel et al. 2004; Trudel and Welch 2005); therefore, some important advances in bioenergetics models for salmo-nids would be refinements to the functions for total metabo-lism (basal [standard] + activity). Trudel and Welch (2005) empirically derived and tested models for standard, active, and total metabolic rates for a wide range of body masses in both fresh water and salt water for sockeye salmon and steelhead. They determined that metabolic costs became in-creasingly biased as body mass increased, and that functions parameterized for one species did not necessarily perform well for even closely-related species. Because metabolism becomes an increasingly large fraction of the total energy budget for larger salmon, the implications of these results are particularly important for sub-adult and adult life stages (e.g., fish > 1 kg). For instance, if metabolism only repre-sents 20% of the total energy budget (i.e., M + W + G) for a 10-g juvenile salmon, then a 40% error in M translates into an 8% error for estimates of either consumption or growth; however, if metabolism equals 50% of the energy budget for a 1-kg salmon, then a 40% error in M becomes a 20% er-ror in consumption or growth estimates. For some modeling objectives, the magnitude of these errors might be perfectly acceptable, but for objectives that require very accurate and precise estimates for metabolism or other components of the energy budget, the application of some of the current models would not be appropriate. Ideally, species-specific parameters would be generated from extended laboratory experiments involving factorial combinations of the body sizes and temperatures experi-enced by that species over its geographic range. Accurate daily measures of food intake (preferably using common prey types or reasonable surrogates), waste, and metabolic costs coupled with repeated measures of growth over mul-tiple weeks or months of the experiment would be highly desirable. The consumption and growth experiments should be coupled with parallel factorial experiments to measure basal and active metabolism and SDA. In reality, the ide-al experiments have never been accomplished, although some admirable subsets have been published recently (Madenjian et al. 2004; Bajer et al. 2004a, b). More of these experiments should be encouraged by management, research, and funding institutions. Over the 15–25 years since the current bioenergetics models for salmon were developed, we have experienced major advances in and prevalence of physiological and posi-tioning telemetry, hydroacoustics, remote sensing, respirom-eters, calorimeters, and other technologies, in addition to substantial increases in knowledge about the distribution, growth, trophic dynamics, and survival of salmon in fresh-
water and marine ecosystems. These advances provide the opportunity to generate improved parameterized functions when necessary and to integrate currently disparate informa-tion and data in creative new ways. The table is set to ad-vance our mechanistic understanding of salmon production ecology by synthesizing existing information with current models and other analytical tools, and by continued develop-ment of the promising avenues for improving existing mod-els and linking with complementary foraging, migration, and behavior models.
ACKnoWLEDGMEntS
This work was supported by the National Science Foun-dation under Grant number 0106139, contribution number 295, Global Ocean Ecosystem Dynamics (GLOBEC) Pro-gram. We are grateful for the informative discussions with our colleagues Nancy Davis, Trey Walker, Jack Piccolo, Ed Farley, and Jack Helle.
rEFErEnCES
Armstrong, J.L., J.L. Boldt, A.D. Cross, J.H. Moss, N.D. Davis, K.W. Myers, R.V. Walker, D.A. Beauchamp, and L.J. Haldorson. 2005. Distribution, size and interannu-al, seasonal and diel food habits of the northern Gulf of Alaska juvenile pink salmon, Oncorhynchus gorbuscha. Deep Sea Res. II 52: 247–265.
Aydin, K.Y., G.A. McFarlane, J.R. King, B.A. Megrey, and K.W. Myers. 2005. Linking oceanic food webs to coastal production and growth rates of Pacific salmon (Oncorhynchus spp.), using models on three scales. Deep Sea Res. II 52: 757–780.
Bajer, P.J., G.W. Whitledge, and R.S. Hayward. 2004a. Widespread consumption-dependent systematic error in fish bioenergetics models and its implications. Can. J. Fish. Aquat. Sci. 61: 2158–2167.
Bajer, P.J., R.S. Hayward, G.W. Whitledge, and R.D. Zweifel. 2004b. Simultaneous identification and correction of systematic error in bioenergetics models: demonstrations with a white crappie (Pomoxis annularis) and its implications. Can. J. Fish. Aquat. Sci. 61: 2168–2182.
Batchelder, H.P., and T.M. Powell. 2002. Physical and bio-logical conditions and processes in the northeast Pacific Ocean. Prog. Oceanogr. 53: 105–114.
Bax, N.J. 1983. Early marine mortality of marked juvenile chum salmon (Oncorhynchus keta) released into Hood Canal, Puget Sound, Washington, in 1980. Can. J. Fish. Aquat. Sci. 40: 426–435.
Beamish, R.J., and C. Mahnken. 2001. A critical size and period hypothesis to explain natural regulation of salm-on abundance and the linkage to climate and climate change. Prog. Oceanogr. 49: 423–437.
Beamish, R.J., C. Mahnken, and C.M. Neville. 2004. Evi-dence that reduced early marine growth is associated

NPAFC Bulletin No. 4
267
Bioenergetic responses by salmon to climate and ecosystem
with lower marine survival of coho salmon. Trans. Am. Fish. Soc. 133: 26–33.
Beauchamp, D.A., D.J. Stewart, and G.L. Thomas. 1989. Corroboration of a bioenergetics model for sockeye salmon. Trans. Am. Fish. Soc. 118: 597–607.
Beauchamp, D.A., C.J. Sergeant, M.M. Mazur, J.M. Scheuerell, D.E. Schindler, M.D. Scheuerell, K.L. Fresh, D.E. Seiler, and T.P. Quinn. 2004. Temporal-spatial dynamics of early feeding demand and food sup-ply of sockeye salmon fry in Lake Washington. Trans. Am. Fish. Soc. 133: 1014–1032.
Blackbourne, D.J. 1987. Sea surface temperature and pre-season prediction of return timing in Fraser River sock-eye salmon (Oncorhynchus nerka). Can. Sp. Pub. Fish. Aquat. Sci. No. 96, pp. 296–306.
Boldt, J.L., and L.J. Haldorson. 2002. A bioenergetics ap-proach to estimating consumption of zooplankton by juvenile pink salmon in Prince William Sound. Alaska Fish. Res. Bull. 9: 111–127.
Brandt, S.B., and K.J. Hartman. 1993. Innovative approach-es with bioenergetics models—Future applications to fish ecology and management. Trans. Am. Fish. Soc. 122: 731–735.
Brandt, S.B., D.M. Mason, and E.V. Patrick. 1992. Spa-tially-explicit models of fish growth rate. Fisheries 17 (2): 23–35.
Brodeur, R.D., R.C. Francis, and W.G. Pearcy. 1992. Food consumption of juvenile coho (Oncorhynchus kisutch) and chinook (O. tshawytscha) on the continental shelf off Washington and Oregon. Can. J. Fish. Aquat. Sci. 49: 1670–1685.
Brodeur, R.D., J.P. Fisher, D.J. Teel, R.L. Emmett, E. Casillas, and T.W. Miller. 2004. Juvenile salmonid distribution, growth, condition, origin, and environmental and species associations in the Northern California Current. Fish. Bull. 102: 25–46.
Cooney, R.T., and R.D. Brodeur. 1998. Carrying capacity and North Pacific salmon production: stock-enhance-ment implications. Bull. Mar. Sci. 62(2): 443–464.
Courtney, D.L., D.G. Mortensen, and J.A. Orsi. 2000. Digi-tized scale and otolith microstructures as correlates of juvenile pink salmon size. N. Pac. Anadr. Fish Comm. Bull. 2: 337–345. (Available at http://www.npafc.org).
Coyle, K.O., and A.I. Pinchuk. 2005. Seasonal cross-shelf distribution of major zooplankton taxa on the northern Gulf of Alaska shelf relative to water mass properties, species depth preferences and vertical migration behav-ior. Deep Sea Res. II 52: 217–245.
Cross, A.D., D.A. Beauchamp, J.L. Armstrong, M. Blikshteyn, J.L. Boldt, N.D. Davis, L.J. Haldorson, J.H. Moss, K.W. Myers, and R.V. Walker. 2005. Consumption demand of juvenile pink salmon in Prince William Sound and the coastal Gulf of Alaska in relation to prey biomass. Deep Sea Res. II 52: 347–370.
Davis, N.D., K.W. Myers, and Y. Ishida. 1998. Caloric val-
ue of high-seas salmon prey organisms and simulated salmon growth and prey consumption. N. Pac. Anadr. Fish Comm. Bull. 1: 146–162. (Available at http://www.npafc.org).
Fisher, J.P., and W.G. Pearcy. 1988. Growth of juvenile coho salmon (Oncorhynchus kisutch) in the ocean off Oregon and Washington, USA, in years of differing coastal up-welling. Can. J. Fish. Aquat. Sci. 45: 1036–1044.
Fisher, J.P., and W.G. Pearcy. 2005. Seasonal changes in growth of coho salmon (Oncorhynchus kisutch) off Or-egon and Washington and concurrent changes in the spacing of scale circuli. Fish. Bull. 103:34–51.
Furnell, D.J., and J.R. Brett. 1986. Model of monthly ma-rine growth and mortality for Babine Lake sockeye salmon (Oncorhynchus nerka). Can. J. Fish. Aquat. Sci. 43: 999–1004.
Hansen, M.J., D. Boisclair, S.B. Brandt, and S.W. Hewett. 1993. Applications of bioenergetics models to fish ecol-ogy and management-where do we go from here. Trans. Am. Fish. Soc. 122: 1019–1030.
Hanson, P.C., T.B. Johnson, D.E. Schindler, and J.F. Kitch-ell. 1997. Fish Bioenergetics 3.0 for Windows. Center for Limnology, University of Wisconsin-Madison and the University of Wisconsin Sea Grant Institute.
Hardiman, J.M., B.M. Johnson, and P. J.Martinez. 2004. Do predators influence the distribution of age-0 kokanee in a Colorado reservoir? Trans. Am. Fish. Soc. 133: 1366–1378.
Hare, S.R., and R.C. Francis. 1995. Climate change and salmon production in the northeast Pacific Ocean. In Climate change and northern fish populations. Edited by R.J. Beamish. Can. Sp. Pub. Fish. Aquat. Sci. No. 121. pp. 357–372.
Hartt, A.C. 1980. Juvenile salmonids in the oceanic ecosys-tem—the first critical summer. In Salmonid ecosystems of the North Pacific. Edited by W.J. McNeil and D.C. Himsworth. Oregon State University Press, Corvallis. pp. 25–57.
Healey, M.C. 1982. Timing and relative intensity of size-selective mortality of juvenile chum salmon (Oncorhyn-chus keta) during early sea life. Can. J. Fish. Aquat. Sci. 39: 952–957.
Hilborn, R., and D. Eggers. 2000. A review of the hatch-ery programs for pink salmon in Prince William Sound and Kodiak Island, Alaska. Trans. Am. Fish. Soc. 129: 333–350.
Hinch, S.G., M.C. Healey, R.E. Diewert, K.A. Thomson, M.A. Henderson, R. Hourston, and F. Juanes. 1995. Climate change on marine growth and survival of Fra-ser River sockeye salmon. Can. J. Fish. Aquat. Sci. 52: 2651–2659.
Holtby, L.B., B.C. Anderson, and R.K. Kadowaki. 1990. Importance of smolt size and early ocean growth to in-ter-annual variability in marine survival of coho salmon (Oncorhynchus kisutch). Can. J. Fish. Aquat. Sci. 47:

NPAFC Bulletin No. 4
268
Beauchamp et al.
2181–2194. Hughes, N.F., and T.C. Grand. 2000. Physiological ecology
meets the ideal-free distribution: predicting the distribu-tion of size-structured fish populations across tempera-ture gradients. Environ. Biol. Fish. 59: 285–298.
Kaeriyama, M., M. Nakamura, R. Edpalina, J.R. Bower, H. Yamaguchi, R.V. Walker, and K.W. Myers. 2004. Change in feeding ecology and trophic dynamics of Pa-cific salmon (Oncorhynchus spp.) in the central Gulf of Alaska in relation to climate events. Fish. Oceanogr. 13: 197–207.
Kitchell, J.F., and L.B. Crowder. 1986. Predator-prey inter-actions in Lake Michigan: model predictions and recent dynamics. Environ. Biol. Fish. 16: 205–211.
Koenings, J.P., H.J. Geiger, and J.J. Hasbrouck. 1993. Smolt to adult survival of sockeye salmon (Oncorhyn-chus nerka): effects of smolt length and geographic lati-tude when entering the sea. Can. J. Fish. Aquat. Sci. 50: 600–611.
Madenjian, C.P., D.V. O’Connor, S.M. Cheryak, R.R. Re-diske, and J.P. O’Keefe. 2004. Evaluation of a Chinook salmon (Oncorhynchus tshawytscha) bioenergetics model. Can. J. Fish. Aquat. Sci. 61: 627–635.
Mantua, N., S.R. Hare, Y. Zhang, J.M. Wallace, and R.C. Francis. 1997. A Pacific interdecadal climate oscilla-tion with impacts on salmon production. Bull. Am. Me-teorol. Soc. 78: 1069–1079.
Mazur, M.M., and D.A. Beauchamp. 2006. Linking pi-scivory to spatial-temporal distributions of pelagic prey fishes with a visual foraging model. J. Fish Biol. 69: 151-175.
Mazur, M.M., M.T. Wilson, A.B. Dougherty, A. Buchheis-ter, and D.A. Beauchamp. 2007. Temperature and prey quality effects on growth of juvenile walleye pollock Theragra chalcogramma (Pallas): a spatially explicit bioenergetics approach. J. Fish Biol. 70: 816-836.
Mortensen, D., A. Wertheimer, S. Taylor, and J. Landingham. 2000. The relation between early marine growth of pink salmon, Oncorhynchus gorbuscha, and marine water temperature, secondary production, and survival to adulthood. Fish. Bull. 98: 319–335.
Moss, J.H., D.A. Beauchamp, A.D. Cross, K. Myers, E.V. Farley, Jr., J.M. Murphy, and J.H. Helle. 2005. Higher marine survival associated with faster growth for pink salmon (Oncorhynchus gorbuscha). Trans. Am. Fish. Soc. 134: 1313–1322.
Mueter, F.J., D.M. Ware, and R.M. Peterman. 2002. Spatial correlation patterns in coastal environmental variables and survival rates of Pacific salmon in the northeast Pa-cific Ocean. Fish. Oceanogr. 11: 205–218.
Mueter, F.J, B.J. Pyper, and R.M. Peterman. 2005. Relation-ship between coastal ocean conditions and survival rates of northeast Pacific salmon at multiple lags. Trans. Am. Fish. Soc. 134: 105–119.
Ney, J.J. 1993. Bioenergetics modeling today—Growing
pains on the cutting edge. Trans. Am. Fish. Soc. 122: 736–748.
Nottestad, L., J. Giske, J.C. Holst, and G. Huse. 1999. A length-based hypothesis for feeding migrations in pelag-ic fish. Can. J. Fish. Aquat. Sci. 56(Suppl. 1): 26–34.
Parker, R.R. 1968. Marine mortality schedules of pink salmon of the Bella Coola River, central British Colum-bia. J. Fish. Res. Board Can. 25: 757–794.
Pyper, B.J., F.J. Mueter, and R.M. Peterman. 2005. Across-species comparisons of spatial scales of environmental effects on survival rates of northeast Pacific salmon. Trans. Am. Fish. Soc. 134: 86–104.
Rand, P.S. 2002. Modeling stomach fullness and growth potential of sockeye salmon in the Gulf of Alaska: im-plications for high seas distribution and migration. Mar. Ecol. Prog. Ser. 234: 265–280.
Rand, P.S., D.J. Stewart, P.W. Seelback, M.L. Jones, and L.R. Wedge. 1993. Modeling steelhead population energet-ics in Lakes Michigan and Ontario. Trans. Am. Fish. Soc. 122: 977–1001.
Rand, P.S., J.P. Scandol, and E.E. Walter. 1997. NerkaSim: a flexible research and educational tool to simulate the marine life history of salmon in a dynamic environment. Fisheries 22: 6–13.
Ruggerone, G.T and F.A. Goetz. 2004. Survival of Puget Sound chinook salmon (Oncorhynchus tshawytscha) in response to climate-induced competition with pink salmon (Oncorhynchus gorbuscha). Can. J. Fish. Aquat. Sci. 61: 1756–1770.
Ruggerone, G.T., and D.E. Rogers. 1992. Predation on sockeye salmon fry by juvenile coho salmon in Chignik Lakes, Alaska: implications for salmon management. N. Am. J. Fish. Manage. 12: 87–102.
Ruggerone, G.T., M. Zimmermann, K.W. Myers, J.L. Nielsen, and D.E. Rogers. 2003. Competition between Asian pink salmon (Oncorhynchus gorbuscha) and Alaskan sockeye salmon (O. nerka) in the North Pacific Ocean. Fish. Oceanogr. 12: 209–219.
Stewart, D.J., and M. Ibarra. 1991. Predation and produc-tion by salmonid fishes in Lake Michigan, 1978–88. Can. J. Fish. Aquat. Sci. 48: 909–922.
Stewart, D.J., J.F. Kitchell, and L.B. Crowder. 1981. Forage fishes and their salmonid predators in Lake Michigan. Trans. Am. Fish. Soc. 110: 751–763.
Stockwell, J.D., and B.M. Johnson. 1999. Field evaluation of a bioenergetics-based foraging model for kokanee (Oncorhynchus nerka). Can. J. Fish. Aquat. Sci. 56 (Suppl. 1): 140–151.
Trudel, M., and D.W. Welch. 2005. Modeling the oxygen consumption rates in Pacific salmon and steelhead: model development. Trans. Am. Fish. Soc. 134: 1542–1561.
Trudel, M., S. Tucker, J.E. Zamon, J.F.T. Morris, D.A. Higgs, and D.W. Welch. 2002. Bioenergetic response of coho salmon to climate change. N. Pac. Anadr. Fish Comm.

NPAFC Bulletin No. 4
269
Bioenergetic responses by salmon to climate and ecosystem
Tech. Rep. 4: 59–61. (Available at http://www.npafc.org).
Walter, E.E., J.P. Scandol, and M.C. Healey. 1997. A reap-praisal of the ocean migration patterns of Fraser River sockeye salmon by individual-based modeling. Can. J. Fish. Aquat. Sci. 54: 847–858.
Welch, D.W., Y. Ishida, and K. Nagasawa. 1998. Thermal limits and ocean migrations of sockeye salmon (On-corhynchus nerka): long-term consequences of global warming. Can. J. Fish. Aquat. Sci. 55: 937–948.
Wertheimer, A.C., W.R. Heard, J.M. Maselko, and W.W. Smoker. 2004. Relationship of size at return with en-vironmental variation, hatchery production, and pro-ductivity of wild pink salmon in Prince William Sound, Alaska: Does size really matter? Rev. Fish Biol. Fish.
14: 321–334.Willette, T.M., R.T. Cooney, and K. Hyer. 1999. Predator
foraging mode shifts affecting mortality of juvenile fish-es during the subartic spring bloom. Can. J. Fish. Aquat. Sci. 56: 364–376.
Willette, T.M., R.T. Cooney, V. Patrick, D.M. Mason, G.L. Thomas, and D. Scheel. 2001. Ecological processes influencing mortality of juvenile pink salmon (Onco-rhynchus gorbuscha) in Prince William Sound, Alaska. Fish. Oceanogr. 10(Suppl. 1): 14–41.
Zamon, J.E., and D.W. Welch. 2005. Rapid shift in zoo-plankton community composition on the northeast Pa-cific shelf during the 1998–1999 El Niño-La Niña event. Can. J. Fish. Aquat. Sci. 62: 133–144.