Biodiversity and ecology of the Ningaloo Reef
72
Ningaloo Collaboration Cluster: Biodiversity and ecology of the Ningaloo Reef lagoon M. van Keulen and M.W. Langdon Ningaloo Collaboration Cluster Final Report No. 1c 01 March, 2011
Transcript of Biodiversity and ecology of the Ningaloo Reef

Ningaloo Collaboration Cluster:
Biodiversity and ecology of the Ningaloo
Reef lagoon
M. van Keulen and M.W. Langdon
Ningaloo Collaboration Cluster Final Report No. 1c
01 March, 2011

ISBN 978-0-86905-967-8

This report is an outcome from the Ningaloo Collaboration Cluster – a partnership between Murdoch University, The University of Western Australia, the Australian National University, The University of Queensland, Edith Cowan University, Curtin University of Technology, the Sustainable Tourism Cooperative Research Centre and CSIRO’s Wealth from Oceans Flagship. The Cluster is funded through CSIRO’s Flagship Collaboration Fund and the partners’ in-kind support. www.csiro.au/partnerships/NingalooCluster
Enquiries should be addressed to:
M. van Keulen
Biological Sciences
Murdoch University
Murdoch WA 6150
Distribution list
Tom Hatton, CSIRO Wealth from
Oceans Flagship
1
Ian Cresswell, CSIRO Wealth from
Oceans Flagship
1
Dr Chris Simpson and Dr Kellie
Waples, DEC
2
Dr Rick Fletcher, DoF
Dr Jane Fromont, WA Museum
1
1
Murdoch Library 1
CSIRO Library 1
Pdf to website Ningaloo.org.au 1
WA Museum Library
DEC Library DoF Library
1
1
1
Copyright and Disclaimer
© 2011 CSIRO To the extent permitted by law, all rights are reserved and no part of this
publication covered by copyright may be reproduced or copied in any form or by any means
except with the written permission of CSIRO.

Important Disclaimer
CSIRO advises that the information contained in this publication comprises general statements
based on scientific research. The reader is advised and needs to be aware that such
information may be incomplete or unable to be used in any specific situation. No reliance or
actions must therefore be made on that information without seeking prior expert
professional, scientific and technical advice. To the extent permitted by law, CSIRO (including
its employees and consultants) excludes all liability to any person for any consequences,
including but not limited to all losses, damages, costs, expenses and any other compensation,
arising directly or indirectly from using this publication (in part or in whole) and any
information or material contained in it.

Contents
1. Overview ............................................................................................................ 9
1.1 Benefits and management implications .................................................................. 11
1.2 Further Developments ............................................................................................ 11
1.3 Acknowledgements ................................................................................................. 12
1.4 Planned Publications .............................................................................................. 12
1.5 Communications: .................................................................................................... 12
1.5.1 List publications .................................................................................................. 12
1.5.2 Student Projects ................................................................................................. 13
1.6 Data Accessibility (Data Summary) ........................................................................ 13
1.6.1 Meta data description ......................................................................................... 13
1.6.2 Who is the custodian of the data ........................................................................ 14
1.6.3 Raw data and data products description ............................................................ 14
2. Data Chapters .................................................................................................. 15
2.1 Summary................................................................................................................. 15
2.2 Introduction ............................................................................................................. 15
2.2.1 Background on NMP – history, management, previous studies. ........................ 15
2.2.2 Aims .................................................................................................................... 17
2.3 Methods .................................................................................................................. 18
2.3.1 Study area .......................................................................................................... 18
2.3.2 Site selection ...................................................................................................... 19
2.3.3 Sampling ............................................................................................................. 20
2.3.4 Data analysis ...................................................................................................... 30
2.4 Results .................................................................................................................... 33
2.5 Discussion............................................................................................................... 58
2.6 Acknowledgements ................................................................................................. 61
2.7 References ............................................................................................................. 62
Appendix A – Sponges and soft corals of Ningaloo Lagoon: Gnaraloo and
Tantabiddi regions. ......................................................................................... 64
SUMMARY ........................................................................................................................ 64
A.1 Introduction ................................................................................................................. 64
A.2 Methods ...................................................................................................................... 65
A.2.1 Field sampling methods. ............................................................................................ 65
A.2.2 Specimen collection. .................................................................................................. 65
A.3 Results. ....................................................................................................................... 66
A.4 Discussion. ................................................................................................................. 67
A.5 Acknowledgements ..................................................................................................... 68
Appendix B – The role of sea urchins in Ningaloo Reef: key points to date. ...... 71

vi
List of Figures
Figure 1 Map of Ningaloo Marine Park & Muiron Islands (including DEC zoning scheme) (CALM, 2005). ................................................................................................................................... 21
Figure 2 Sampling sites overview – NW Cape to Red Bluff (locations indicated by ◘). .............. 22
Figure 3 Layout of nested quadrat design (left) indicating orientation, order of sampling and location of sub-quadrats and photo-quadrats. GPS points were taken in the centre of sub-quadrats 1, 3, 5, 7 and 9. The graphic on the right indicates the relationship between the nested quadrat and the remote sensed imagery (3.5 m pixel size). ............................................. 23
Figure 4 Sampling sites – Coral Bay Region (locations indicated by ◘). ..................................... 27
Figure 6 Sampling sites – NW Cape to Yardie Creek (locations indicated by ◘). ....................... 28
Figure 7 Sampling sites – Cape Farquhar to Red Bluff (locations indicated by ◘). ..................... 29
Figure 7 cover of benthic habitats at Bundegi, using broad sampling categories. ...................... 34
Figure 8 Percent cover of benthic habitats north of Jurabi, using broad sampling categories. ... 34
Figure 9 Regional overview of percent cover of substrate types in the nearshore habitats in the Tantabiddi to Yardie Creek region. ....................................................................................... 35
Figure 10 Regional overview of percent cover of substrate types in the lagoonal habitats in the Tantabiddi to Yardie Creek region. ....................................................................................... 36
Figure 11 Regional overview of percent cover of substrate types in the back reef habitats in the Tantabiddi to Yardie Creek region. ....................................................................................... 36
Figure 12 Regional overview of percent cover of substrate types in the nearshore habitats in the Coral Bay region. .................................................................................................................. 39
Figure 13 Regional overview of percent cover of substrate types in the lagoonal habitats in the Coral Bay region. .................................................................................................................. 40
Figure 14 Regional overview of percent cover of substrate types in the back reef habitats in the Coral Bay region. .................................................................................................................. 40
Figure 15 Regional overview of percent cover of substrate types in the nearshore habitats in the Cape Farquhar region. ......................................................................................................... 41
Figure 16 Regional overview of percent cover of substrate types in the nearshore habitats in the Gnaraloo Bay region. ............................................................................................................ 42
Figure 17 Regional overview of percent cover of substrate types in the nearshore habitats in the 3 Mile region. ........................................................................................................................ 43
Figure 18 Regional overview of percent cover of substrate types in the nearshore habitats in the Red Bluff region. ................................................................................................................... 43
Figure 19 Densities of key macroinvertebrate groups in the nearshore habitat north of Jurabi Point. .................................................................................................................................... 45

Figure 20 Densities of key macroinvertebrate groups in all habitats in the Tantabiddi to Yardie Creek region. ........................................................................................................................ 46
Figure 21 Densities of key macroinvertebrate groups in the nearshore habitat in the Tantabiddi to Yardie Creek region. ........................................................................................................ 46
Figure 22 Densities of key macroinvertebrate groups in the lagoonal habitat in the Tantabiddi to Yardie Creek region. ............................................................................................................ 47
Figure 23 Densities of key macroinvertebrate groups in the back reef habitat in the Tantabiddi to Yardie Creek region. ............................................................................................................ 47
Figure 24 Densities of key macroinvertebrate groups in all habitats in the Coral Bay region. .... 48
Figure 25 Densities of key macroinvertebrate groups in the nearshore habitat in the Coral Bay region (Maud Sanctuary zone). ............................................................................................ 49
Figure 26 Densities of key macroinvertebrate groups in the nearshore habitat in the Coral Bay region (southern recreational zone). .................................................................................... 49
Figure 27 Densities of key macroinvertebrate groups in the lagoonal habitat in the Coral Bay region (Maud Sanctuary zone). ............................................................................................ 50
Figure 28 Densities of key macroinvertebrate groups in the nearshore habitat in the Coral Bay region (southern recreational zone). .................................................................................... 50
Figure 29 Densities of key macroinvertebrate groups in the back reef habitat in the Coral Bay region. .................................................................................................................................. 51
Figure 30 Densities of key macroinvertebrate groups in the nearshore habitat in the Cape Farquhar region. ................................................................................................................... 51
Figure 31 Densities of key macroinvertebrate groups in the nearshore habitat in the Gnaraloo region. .................................................................................................................................. 52
Figure 32 Densities of key macroinvertebrate groups in the nearshore habitat in the 3 Mile region. .................................................................................................................................. 52
Figure 33 Densities of key macroinvertebrate groups in the nearshore habitat in the Red Bluff region. .................................................................................................................................. 53
Figure 34 nMDS plot indicating differences in macroinvertebrate composition of nearshore benthic habitats between regions (North West Cape (NW) vs. Tantabiddi to Yardie Creek (T-Y)). ................................................................................................................................... 54
Figure 35 nMDS plot indicating differences in macroinvertebrate composition of nearshore benthic habitats between regions (Tantabiddi to Yardie Creek (T-Y) and South Ningaloo (S)). ...................................................................................................................................... 55
Figure 36 nMDS plot indicating differences in macroinvertebrate composition of nearshore benthic habitats between sanctuary (S) and recreation (R) zones in the Coral Bay region. 56
Figure 37 nMDS plot indicating differences in macroinvertebrate composition of nearshore benthic habitats between sanctuary (S) and recreation (R) zones in the Gnaraloo region. . 57

viii
List of Tables
Table 4-1 Benthic life form categories used for substrate cover identification in the field (modified from English et al., 1994, Abdo et al., 2004). ....................................................... 25
Table 4-2 Sampling effort for mapping validations at Ningaloo Marine Park, 2008. ................... 26
Table 4-3 Condensed substrate categories and descriptive definitions (adapted from Abdo et al., 2004). ................................................................................................................................... 32
Table 4-4 Ningaloo Marine Park Major regions and sub-regions, North to South (* indicates regions with lagoonal areas). ................................................................................................ 33
Table 4-5 Regional summary of benthic substrates: Tantabiddi to Yardie. ................................. 37
Table 4-6 Seagrass species of Ningaloo Reef. ........................................................................... 44
Table 4-7 Regional SIMPER results output – North West Cape (NW) vs. Tantabiddi to Yardie Creek (T-Y). .......................................................................................................................... 54
Table 4-8 Regional SIMPER results output – South Ningaloo (red symbols) vs. Tantabiddi to Yardie Creek (T-Y). .............................................................................................................. 55
Table 4-9 Management zoning SIMPER results output – Coral Bay (Maud Sanctuary). ............ 56
Table 4-10 Management zoning SIMPER results output – Ningaloo south (Gnaraloo Sanctuary). .............................................................................................................................................. 57

OVERVIEW
Habitats and Biodiversity of Ningaloo Lagoon: Biodiversity and Ecology • 1 March, 2011, Version 1.0 9
1. OVERVIEW
Surveys were undertaken of key invertebrate and plant groups in lagoonal areas throughout the Ningaloo Marine Park. Work in this study has focused on identifying and quantifying soft corals, sponges, echinoderms (urchins and sea cucumbers) and seagrasses; this information was linked to the underlying habitat structure in the Ningaloo Reef lagoons. These groups have been poorly studied within the Marine Park to date, even though they play a critical role in the ecology of the Ningaloo Reef ecosystem. Other taxonomic groups have been studied by researchers involved in the C-Reefs (Census of Marine Life) project coordinated by the Australian Institute of Marine Science, as well as other studies addressing species of commercial importance through WAMSI. In addition to the biodiversity work, we provided validation support for the development of high resolution habitat maps generated from hyperspectral aerial remote sensing (Kobryn et al., 2011). This involved extensive sampling of benthic habitats in the lagoon environments within the Marine Park by SCUBA divers. Many of the major taxonomic groups have received little or no attention at Ningaloo; by conducting surveys of selected particularly poorly-studied groups (soft corals, sponges, urchins and sea cucumbers and seagrasses) we hope to obtain information that will improve our understanding of how the complex Ningaloo Reef ecosystem operates. This is expected to provide significant benefits for managers seeking to optimise the effective management of the Marine Park. All of the groups targeted in this study are known to play critical roles in coral reef ecosystems elsewhere and therefore improved understanding of these groups locally is important. The clear waters of Ningaloo make it an ideal location to use aerial photography, with seabed imagery obtainable to a depth of 20 m. Hyperspectral imagery is a relatively new technique that may allow habitat characterisation using additional light wavelengths to those commonly used in photography. Field validation is required to test the accuracy and effectiveness of the models used to develop these habitat maps. Modelled habitat information was validated by extensive field surveys. In situ sampling of the habitat classifications derived from the hyperspectral data was used to help refine the models, while reflectance information, collected from a diverse range of marine plants, benthic animals and substrates, was used to build up a reflectance library for interpreting the hyperspectral imagery. Ningaloo Marine Park runs for approximately 300 km along the coast of North West Cape in Western Australia and sampling was conducted at various locations throughout the length of the Ningaloo reef system. As a fringing reef, Ningaloo coral reefs have developed out from the shoreline, varying from an extensive structure with offshore reef crest, back reef and lagoon to small fragmented reefs that extend only a small distance from the shore. Sampling design included a stratified approach, encompassing back reef, lagoon and nearshore reef zones, where these were present. Emphasis was also placed on sampling sandy areas and seagrass meadows where these occurred. The biodiversity surveys of sponges, soft corals and seagrasses, conducted principally in the Tantabiddi region in the north of the Marine Park and the Gnaraloo region in the south, have shown that there are clear differences in the lagoon systems in different parts of the Marine

OVERVIEW
10 Habitats and Biodiversity of Ningaloo Lagoon: Biodiversity and Ecology • 1 March, 2011, Version 1.0
Park. Other groups have been surveyed by scientists in the AIMS-led C-Reefs programme and WAMSI. The northern section of the Marine Park (north of Point Cloates) is more strongly tropical than the southern section, which has many temperate species present. There are also several locations within the Ningaloo Reef system that are quite unique and don’t necessarily match the surrounding lagoon environment. Examples of these locations include Coral Bay, Bateman Bay and the Point Cloates region. Several new species of sponges and soft corals were collected from various locations and await further taxonomic work. Subsequent studies examined the benthic habitat structure and key macroinvertebrate groups throughout the Ningaloo Marine Park, particularly in relation to the nature of the underlying reef structure. The presence or absence of a distinct lagoon environment determines the overall composition of benthic substrate types within each region, which in turn determines habitat structure and density of key macroinvertebrates. Key macroinvertebrate groups were examined at 97 sites throughout the Marine Park, using a combination of nested quadrat and transect designs. Sampling was conducted inside and outside 12 sanctuary zones, thus permitting a perspective on the role of sanctuary zones in the Marine Park. Conditions within the sheltered lagoonal areas in the Ningaloo Marine Park permit the development of extensive coral and algal-dominated communities, whereas regions without a protected lagoon were more exposed to ocean swell and therefore showed greatly reduced biological diversity. The Coral Bay data revealed a difference in macroinvertebrate composition between management zones, with urchins in near-shore areas driving the observed differences (more urchins were present in the recreation zone). The South Ningaloo region data produced the greatest dissimilarity in macroinvertebrate composition between management zones, although in this instance there were more urchins in the sanctuary zone; Drupella and other invertebrates also contributed significantly. These results show there is no clear pattern in macroinvertebrate abundance and density resulting from zonation at this stage. Our validation work has enabled the development of detailed (3.5 m resolution) habitat maps for the entire Ningaloo Marine Park and highlighted several areas requiring further research, to improve the usefulness of the habitat maps in a biological sense (see Kobryn et al. (2011) for details of the marine habitat mapping) . There are clear differences between the northern and southern lagoon systems at Ningaloo Reef in terms of the reef structure and the marine flora and fauna that dominate the different regions, as highlighted by differences in distribution of sponges, soft corals and seagrasses. This has important implications for the distribution and abundance of many animals, including some of commercial importance. These observations will be important in the management of the Ningaloo Marine Park; the northern and southern sections of the Marine Park may need to be managed differently. The habitat maps are already being used by DEC in their management of the Marine Park.
Surveying biological groups over the whole Marine Park is difficult and time consuming; further sampling in more locations and at different times of year are required to build on the findings of our study. There are clear seasonal differences in primary productivity in the lagoons, which likely drive significant community-wide changes throughout the year. These seasonal variations will also affect the validity of the habitat maps, which were based on imagery collected at only one time of year. Seasonal sampling will improve the reliability of the habitat maps and also give a better understanding of how the Ningaloo system operates.

OVERVIEW
Habitats and Biodiversity of Ningaloo Lagoon: Biodiversity and Ecology • 1 March, 2011, Version 1.0 11
Additional work is required to further identify some of the sponge and soft coral samples collected as part of this study. Resource limitations meant that large areas of the Ningaloo Reef system could not be sampled adequately, resulting in gaps in our knowledge. These include the reef crest and fore reef areas and stretches of the Ningaloo Marine Park between Cape Farquhar and Point Anderson and between Bateman Bay and Yardie Creek.
1.1 Benefits and management implications
In-water validation work has provided verification of the habitat maps produced from
hyperspectral imagery, producing the first high-resolution maps for the Ningaloo Marine Park
(see Kobryn et al., 2011). These maps and the associated bathymetry and biological data will
provide an excellent baseline for managers to work with and plan around.
Biodiversity work on sponges and soft corals in the lagoon ecosystems, combined with deep-
water collections carried out by AIMS provide an excellent start for a holistic, shore-to-shelf
edge view of the distribution of these organisms. Collections of sponges, soft corals and
seagrasses from around the Ningaloo Marine Park have confirmed some expected patterns of
distribution, but also raised the possibility of new range extensions. These studies have
reinforced the idea of Point Cloates as a biogeographical barrier where the Leeuwin and
Ningaloo Currents are disrupted, as suggested by previous oceanographic research (Woo et
al., 2006).
Quantitative studies of benthic macroinvertebrates have highlighted patterns of distribution
of several key groups of organisms. Urchins appear to be a key indicator of assemblage
structures in different types of benthic ecosystems; i.e., differences in the structure of many
benthic macroinvertebrate communities appear to be explained by differences in urchin
populations. Urchins may therefore have potential as surrogates for ecosystem
characterisation in the region.
1.2 Further Developments
The validation work has highlighted potential gaps in the information provided by remote
sensing, identifying areas for further research; in particular, seasonal blooms of organisms and
associated ecological phenomena are a key feature of the Ningaloo biological calendar,
however the remote sensing was conducted over only a few weeks. This means that key
processes may go undetected and unremarked in the resulting habitat maps. Further research
is needed to establish the significance of seasonal blooms and events; these include
phytoplankton blooms, mass spawning event and aggregations of fish and other organisms.
Several regions within the Ningaloo Marine Park could not be sampled due to funding
constraints. Additional research is required to fill these gaps in our knowledge. Some of this
work will be accomplished by PhD candidate Mark Langdon, researching the distribution and
ecology of urchins at Ningaloo Reef. Further research on seagrass distribution will be carried
out on an opportunistic basis.

OVERVIEW
12 Habitats and Biodiversity of Ningaloo Lagoon: Biodiversity and Ecology • 1 March, 2011, Version 1.0
Additional work on the biodiversity of benthic organisms at Ningaloo will be carried out as
funding permits. The Ningaloo Collaboration Cluster has provided a research impetus that will
continue driving biodiversity and ecological studies in the region for years to come.
1.3 Acknowledgements
We thank Kimberley Marrs Ekamper for her help in the field and with some of the preliminary
analysis. We are grateful to Jane Fromont and Oliver Gomez from the WA Museum for
participating in the sponge and soft coral work. Thanks also to our many field assistants who
have cheerfully helped collect these new data on innumerable field trips.
1.4 Planned Publications
Final report provided to the Cluster; summaries of the report and information on further
scientific publications will be available via the Cluster and related databases.
van Keulen, M., Langdon, M.W., Fromont, J., Schlacher, M. (2011) Habitats and biodiversity of
Ningaloo Reef lagoon. Presentation to be made at the Australian Marine Sciences
Association Annual Conference, Fremantle, July 2011.
van Keulen, M. The seagrasses of Ningaloo Reef. Proposed for Journal of the Royal Society of
Western Australia.
van Keulen, M., Langdon, M.W. and Fromont, J. Patterns in biodiversity of lagoonal habitats,
Ningaloo Reef. Proposed for Biological Conservation.
1.5 Communications:
1.5.1 List publications
van Keulen, M., Loneragan, N., Skilleter, G., Langdon, M., Marrs, K., Pinnel, N., Kobryn, H. T. and Beckley, L. E. (2008) Habitats and Biodiversity of Ningaloo Reef Lagoon, Western Australia. In: Proceedings of the 11th International Coral Reef Symposium. pp. 1397-1400. Ft. Lauderdale, Florida.
Presentations
Kobryn, H.T., Pinnel, N., van Keulen, M., Beckley, L.E., Harvey, M.M., Hausknecht, P. and Heyward, A. (2007) Through the looking glass! Revealing the habitats and biodiversity of Ningaloo Reef using hyperspectral imagery. 83rd Australian Coral Reef Society Annual Conference, Fremantle.
Kobryn, H.T., Pinnel, N., Beckley, L.E., Harvey, M.M., van Keulen, M., Heege, T. and
Hausknecht, P. (2007) Habitats and biodiversity of Ningaloo Reef. Mapping the habitat

OVERVIEW
Habitats and Biodiversity of Ningaloo Lagoon: Biodiversity and Ecology • 1 March, 2011, Version 1.0 13
components and bathymetry with hyperspectral remote sensing. 83rd
Australian Coral Reef Society Annual Conference, Fremantle.
Kobryn, H.T., Pinnel, N., van Keulen, M. and Beckley, L.E. (2008) Mapping habitats and
biodiversity of Ningaloo Reef lagoon using hyperspectral remote sensing data.
Ningaloo Research Symposium, Perth.
Langdon, M.W. (2010) The trophic ecology of the grazing sea urchin Echinometra mathaei
within Ningaloo Marine Park: Comparing the effects of different closure regimes on
urchin distribution and trophodynamics. WAMSI Student Research Day, Perth.
Pinnel, N., Kobryn, H.T., Heege, T., Harvey, M.M., Beckley, L.E., van Keulen, M., Collins, L. and Hausknecht, P. (2007) Spectral discrimination of marine habitats at Ningaloo Reef, Western Australia. 83
rd Australian Coral Reef Society Annual Conference, Fremantle.
van Keulen, M. (2007) Ningaloo Cluster Project 1: Habitat Mapping and Biodiversity. Ningaloo
Research Programme Symposium, Murdoch University, Perth van Keulen, M. (2009) Biodiversity studies in the Ningaloo Reef lagoon. Ningaloo Research
Symposium, Exmouth. van Keulen, M. (2010) Habitats and biodiversity of Ningaloo Reef lagoon. WAMSI/AMSA(WA)
Marine Science Show and Tell, Perth. van Keulen, M. and Shortland-Jones, H. (2006) A preliminary evaluation of seagrasses in
Bateman Bay, Ningaloo Reef, Western Australia. International Seagrass Biology Workshop, Zanzibar, Tanzania.
1.5.2 Student Projects
Mark Langdon – PhD – The trophic ecology of the grazing sea urchin Echinometra mathaei: a
study of the effects of closure regimes within Ningaloo Marine Park, Western Australia.
Murdoch University (supervisors Dr Mike van Keulen, Murdoch and Dr Eric Paling, SKM); start
date 2008, expected completion 2012.
Janja Ceh – PhD – The role of microbial communities in reef-building corals of Ningaloo Reef,
Western Australia. Murdoch University (supervisors Dr Mike van Keulen, Murdoch and Dr
David Bourne, AIMS); start date 2008, submitted May, 2011.
1.6 Data Accessibility (Data Summary)
1.6.1 Meta data description
WA-AODN MEST: http://waodn.ivec.org/geonetwork/srv/en/metadata.show?uuid=2feb5e4e-
27aa-4433-97af-84c525616d94

OVERVIEW
14 Habitats and Biodiversity of Ningaloo Lagoon: Biodiversity and Ecology • 1 March, 2011, Version 1.0
1.6.2 Who is the custodian of the data
Dr Mike van Keulen.
1.6.3 Raw data and data products description
None.

DATA CHAPTERS
Habitats and Biodiversity of Ningaloo Lagoon: Biodiversity and Ecology • 1 March, 2011, Version 1.0 15
2. DATA CHAPTERS
2.1 Summary
Surveys were undertaken of key invertebrate and plant groups in lagoon areas throughout the
Ningaloo Marine Park, focussing on identifying and quantifying soft corals, sponges,
echinoderms (urchins and sea cucumbers) and seagrasses; this information was linked to the
underlying habitat structure in the Ningaloo Reef lagoons, used in a parallel habitat mapping
project based on hyperspectral aerial photography. The biodiversity surveys conducted
throughout the Ningaloo Reef system have shown that there are clear differences in the
lagoon systems in different parts of the Marine Park, with clear biogeographic separation of
sponges, soft corals and seagrasses. This has important implications for the distribution and
abundance of many animals, including some of commercial importance. The northern section
of the Marine Park (north of Point Cloates) is more strongly tropical than the southern section,
which has many temperate species present. There are also several locations within the
Ningaloo Reef system that are quite unique and don’t necessarily match the surrounding
lagoon environment. Examples include Coral Bay, Bateman Bay and the Point Cloates region.
These observations will be important in the management of the Ningaloo Marine Park; the
northern and southern sections of the Marine Park may need to be managed differently.
Surveying biological groups over the whole Marine Park is difficult and time consuming;
further sampling in more locations and at different times of year are required to build on the
findings of our study. There are clear seasonal differences in primary productivity in the
lagoons, which likely drive significant community-wide changes throughout the year. These
seasonal variations will also affect the validity of the habitat maps, which were based on
imagery collected at only one time of year. Seasonal sampling will improve the reliability of
the habitat maps and also give a better understanding of how the Ningaloo system operates.
2.2 Introduction
2.2.1 Background on NMP – history, management, previous studies.
The Ningaloo Marine Park (NMP), gazetted in 1987 and extended in 2005, encompasses the Ningaloo Reef fringing reef communities that run along the western coast of Cape Range Peninsula, from Red Bluff to Northwest Cape and around to Bundegi in Exmouth Gulf. The reef straddles the Tropic of Capricorn and the interaction of northerly-flowing coastal currents and the southward-flowing Leeuwin Current produces a unique overlap of tropical and temperate biological organisms. Many organisms occur at the northern or southern limits of their range within Ningaloo Reef. The region’s remoteness and limited shoreline development has meant relatively low disturbance to the reef system overall; however intensive recreational fishing and shell collecting have impacted some areas severely. Commercial turtle and lobster fishing in the early-mid twentieth century severely depleted stocks of target species along the reef. Nevertheless, a lack of coastal development and inputs from the adjacent watershed has meant the coral reef as a whole is in remarkably good natural condition.

DATA CHAPTERS
16 Habitats and Biodiversity of Ningaloo Lagoon: Biodiversity and Ecology • 1 March, 2011, Version 1.0
The same isolation that has protected Ningaloo Reef from many potential human impacts has also resulted in relatively little scientific research. Distance from the institutional infrastructure of Perth and lack of local logistical support has been a major impediment to carrying out baseline studies of the reef systems and regular monitoring of natural and human disturbances. The gazetting of the NMP has resulted in an increased need for relevant information to satisfy management performance criteria. The increasing impact of global climate change on coral reef systems around the world has put pressure on both management and scientific interests to document the Ningaloo Reef system and understand its role as a relatively high latitude coral reef.
With the exception of an outbreak of the corallivorous snail Drupella in the 1980s (Turner,
1994a, b), Ningaloo Reef has been spared major, wide-spread disturbances such as invasive or
pest species and climate change impacts such as warm water bleaching. Localised
deoxygenation events related to synchronised coral spawning have been reported for the
Coral Bay region, resulting in mass fish kills on occasion (Simpson et al., 1993); however these
events are restricted to relatively small areas. Rapid recovery of corals from a cold water
bleaching event in 2006 highlighted the resilience of Ningaloo Reef to disturbance (van
Schoubroek and Long, 2007). As a relatively pristine, well-managed coral reef Ningaloo is
starting to be recognised as an important focus for study.
Minor stochastic natural events (e.g. cyclones and minor tsunamis) appear to have a relatively
minor impact on the reef as a whole, although its isolation and relatively recent recorded
history mean that little is known about the effect of major episodic (1 in 100+ years) natural
events on the coral reef community. Evidence exists that large tsunami events have impacted
on the area in the past (Scheffers et al., 2008) and would be expected to have a significant
implications for coral communities.
The limited amount of research done at Ningaloo Reef to date means there is a need for a
comprehensive, integrated biodiversity survey and inventory of the NMP. This would
effectively generate a biodiversity snapshot of the NMP, which can then be used as a baseline
against which to judge human impacts and management performance, and as a guide for
strategic research funding. Many major taxonomic groups have received very little attention
to date; this study will provide an opportunity to find out more about these groups.
Ningaloo Reef
Ningaloo Reef extends north-south for some 300 km along the western shore of Cape Range
Peninsula, from Red Bluff in the south to Northwest Cape in the north; the reef also extends
into Exmouth Gulf to Bundegi, some 10 km north of Exmouth. Point Cloates, approximately
half-way up Cape Range Peninsula protrudes into the Indian Ocean, disrupting the currents
flowing along the continental shelf. The prevailing Leeuwin Current flows south from the
tropics during autumn and early winter, supplying tropical larvae and spores. From spring
through summer the northward flowing Ningaloo Current, driven by wind forcing, pushes the
Leeuwin Current offshore in the southern portion of Ningaloo Reef, supplying temperate
larvae and spores. Ningaloo Reef is therefore a zone of biogeographical overlap, with both
tropical and temperate plants and animals represented. Point Cloates provides a point of

DATA CHAPTERS
Habitats and Biodiversity of Ningaloo Lagoon: Biodiversity and Ecology • 1 March, 2011, Version 1.0 17
discontinuity, where the inshore Ningaloo Current is forced into an eddy, in turn forcing the
Leeuwin Current further offshore. The portion of Ningaloo Reef north of Point Cloates remains
exposed largely to tropical waters, while the portion south is alternately exposed to tropical
and temperate waters. While taxonomic sampling to date has been limited, it is expected that
this may lead to a distinct separation of tropical and temperate flora and fauna in northern
and southern parts of the reef system. Any study of marine communities at Ningaloo Reef
therefore needs to consider this oceanographic discontinuity in planning sampling strategies.
The Ningaloo Cluster programme
In April 2006 the entire Ningaloo Reef was photographed by an airborne hyperspectral
imaging instrument (HyMap). The imagery was intended to provide better understanding of
human impacts on the region, but also permitted modelling of bathymetry and marine
substrates and habitats at an unprecedented spatial resolution. Key to analysing the remotely
sensed hyperspectral imagery was collection of a spectral library, to assist in interpreting the
hyperspectral data set; and ground-truthing of a variety of habitats throughout the reef
system, to validate the imagery. This information would be used to develop a marine habitat
classification model at very high resolution (3.5 m pixel size) to a water depth of 20 m.
Built around this unique data set, a range of projects was established to:
examine biodiversity and ecology of the lagoon areas of Ningaloo Reef;
map human usage of the Ningaloo region;
undertake a social and economic assessment of tourism at Ningaloo; and
estimate socioeconomic values of human use at Ningaloo in a Management Strategy
Evaluation model.
This report presents the biodiversity and ecology results of Project 1: Habitats and Biodiversity
of Ningaloo Reef lagoon.
2.2.2 Aims
Verification of classification
Field sampling of spectral signatures of a range of living and non-living components in the marine environment was required to develop a library of information that could be used to process the remotely sensed data. Ground-truthing of identifiable features was carried out to validate the habitat maps as they were being modelled. The large size of the project meant that sampling was required across a range of habitats at different locations throughout the Ningaloo Reef.

DATA CHAPTERS
18 Habitats and Biodiversity of Ningaloo Lagoon: Biodiversity and Ecology • 1 March, 2011, Version 1.0
Qualitative measures of biodiversity
To permit a snap-shot view of the biodiversity of Ningaloo Reef, it was intended that a broad-scale taxonomic survey be undertaken of key lagoon habitats throughout the Ningaloo Marine Park. Of the major taxonomic groups, most have had little or no work done at Ningaloo, despite the fact that they are critical components of coral reef community structure. The groups of particular concern are the macroalgae, Cyanobacteria, seagrasses, the Cnidaria other than hard corals, sponges, ascidians, bryozoans, crustaceans and the various worms. The fishes and hard corals of Ningaloo have been surveyed a number of times and would be likely to provide an excellent summary of the species present in the Ningaloo Marine Park. CSIRO and AIMS researchers were to collate datasets produced by previous surveys and sampling, identify gaps and analyse the data for species distribution and community structure. While the original intention was that this project was to collect information about the distribution and abundance of the less well-known groups, the C-Reefs programme (co-ordinated by AIMS) announced that it would have a sampling node at Ningaloo Reef during the planning stages of the Cluster programme. Linked with the Census of Marine Life programme, C-Reefs has resources and taxonomic expertise not available to this project and it was decided to focus on a limited set of taxonomic groups not extensively covered by C-Reefs. The aim of the biodiversity component of this project was therefore limited to addressing the seagrasses, sponges, Cnidaria other than hard corals, echinoids and holothurians. Specialist staff from the WA Museum were sub-contracted to work on the sponges and soft corals.
Quantitative measures of biodiversity
In addition to spectral and taxonomic sampling, this component presents an ideal opportunity to elucidate some of the processes linking and driving biodiversity patterns in the region. By designing the sampling programme to encompass linked taxonomic and functional groups at key locations it is possible to address important questions about community structure, offshore/inshore linkages across the Ningaloo Reef and aspects of benthic/pelagic coupling. The composition of benthic communities and relative abundance measures for key organism groups were assessed. The biodiversity studies of this component provide comprehensive information on habitats, biodiversity and land forms for assessing future changes in the system (either natural or human induced), evaluating alternative development and management scenarios and providing information for the review of the marine zoning in the Park.
2.3 Methods
2.3.1 Study area
The Ningaloo Reef fringes the western shore of Northwest Cape, Western Australia, in the Eastern Indian Ocean (Figure 1); it is Australia’s longest fringing coral reef and one of the longest in the world. The Ningaloo Reef is protected by the Ningaloo Marine Park and extends south from Northwest Cape to Gnaraloo (21°40’S to 23°34’S and 113°45’E) for approximately 290 km (Westera et al., 2003). The west-facing reef system is influenced by both the Leeuwin Current, which transports warm, nutrient-poor water southward and the Ningaloo Current,

DATA CHAPTERS
Habitats and Biodiversity of Ningaloo Lagoon: Biodiversity and Ecology • 1 March, 2011, Version 1.0 19
which begins as the Capes Current in the south of Western Australia and transports cold, nutrient-rich water northward during the summer (Woo et al., 2006). The reef crest lies between ~200 m and 7 km from the shore at its outermost points, enclosing large lagoonal areas (Cassata and Collins, 2008). Lagoonal areas have an average width of 2.5 km and average depth of 2-4 m (CALM, 2005). They are a feature of the reef system from Jurabi Point to Cape Farquhar and include intermittent patch reefs and nearshore platform reefs. North of Jurabi Point, the reef becomes discontinuous and eventually disappears. The southern end of the reef is more fragmented and closer to shore, becoming a nearshore reef from Gnaraloo Bay to Red Bluff (CALM, 2005).
2.3.2 Site selection
To obtain a comprehensive picture of the ecology and biodiversity of Ningaloo Reef, site selection included a latitudinal component and addressed the following major habitats:
Intertidal
Lagoonal/back reef
Seagrass beds
Sand The site selection process and fieldwork incorporated as much prior information as was available, including existing low resolution Conservation and Land Management (now Department of Environment and Conservation) habitat maps and preliminary hyperspectral survey data. As the hyperspectral data was refined, the habitat mapping and biodiversity
components increasingly supported each other. Fieldwork was carried out and data obtained through a series of staged intensive field expeditions. Two major geographical regions were initially sampled: Coral Bay and Yardie Creek-Osprey Bay; the geographic range was subsequently expanded to include Red Bluff-Gnaraloo in the south and Lighthouse Bay-Bundegi in the north, to give better spatial coverage of the entire Ningaloo Reef system. A variety of locations within each of these regions was examined to incorporate as much diversity of habitat as possible, based on aerial photographs. Key habitat types were identified using information from hyperspectral remote sensing and were used to develop a stratified sampling approach. Study areas were also selected to encompass differences caused by current flows along the Ningaloo Reef. The Coral Bay region in the south and Yardie Creek/Osprey Bay in the north were selected as representative of the northern and southern geographic regions of the reef; the geographic range was subsequently expanded to include Red Bluff-Gnaraloo in the extreme south of the Ningaloo Reef and Lighthouse Bay-Bundegi in the extreme north. Habitat surveys were conducted within 12 sanctuary zones and adjacent recreation zones within Ningaloo Marine Park. In lagoonal areas, sampling was undertaken at nearshore, lagoon and back reef locations with additional nearshore surveys completed in areas north of Jurabi Point and south of Cape Farquhar (Figure 2). The nature of the Ningaloo Reef system facilitates shore-based access, using small boats to reach lagoon sites. Lagoon, back-reef and inner reef flat habitats were sampled at each location; however not all habitats were present in all locations sampled. For example, the reef
DATA CHAPTERS
20 Habitats and Biodiversity of Ningaloo Lagoon: Biodiversity and Ecology • 1 March, 2011, Version 1.0
structures at Red Bluff and Lighthouse Bay were considerably constrained and consisted solely of narrow inner reef flats.
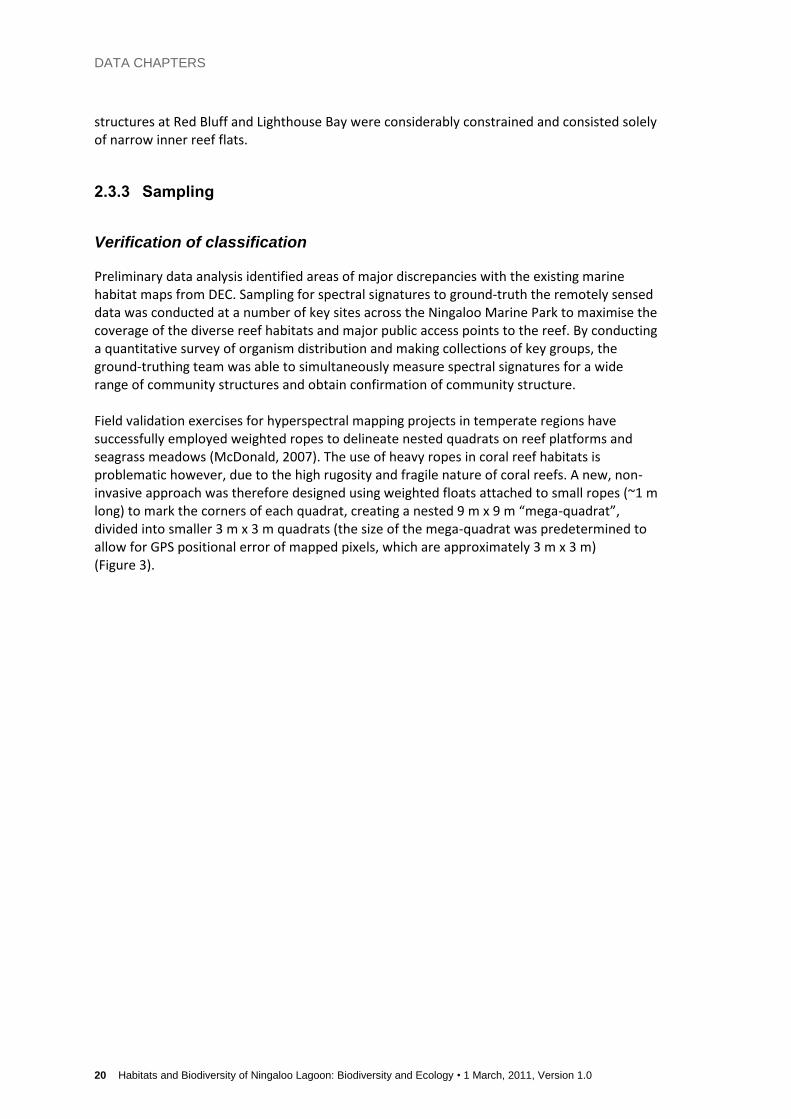
2.3.3 Sampling
Verification of classification
Preliminary data analysis identified areas of major discrepancies with the existing marine habitat maps from DEC. Sampling for spectral signatures to ground-truth the remotely sensed data was conducted at a number of key sites across the Ningaloo Marine Park to maximise the coverage of the diverse reef habitats and major public access points to the reef. By conducting a quantitative survey of organism distribution and making collections of key groups, the ground-truthing team was able to simultaneously measure spectral signatures for a wide range of community structures and obtain confirmation of community structure. Field validation exercises for hyperspectral mapping projects in temperate regions have successfully employed weighted ropes to delineate nested quadrats on reef platforms and seagrass meadows (McDonald, 2007). The use of heavy ropes in coral reef habitats is problematic however, due to the high rugosity and fragile nature of coral reefs. A new, non-invasive approach was therefore designed using weighted floats attached to small ropes (~1 m long) to mark the corners of each quadrat, creating a nested 9 m x 9 m “mega-quadrat”, divided into smaller 3 m x 3 m quadrats (the size of the mega-quadrat was predetermined to allow for GPS positional error of mapped pixels, which are approximately 3 m x 3 m) (Figure 3).

DATA CHAPTERS
Habitats and Biodiversity of Ningaloo Lagoon: Biodiversity and Ecology • 1 March, 2011, Version 1.0 21
Figure 1 Map of Ningaloo Marine Park & Muiron Islands (including DEC zoning scheme) (CALM, 2005).

DATA CHAPTERS
22 Habitats and Biodiversity of Ningaloo Lagoon: Biodiversity and Ecology • 1 March, 2011, Version 1.0
Figure 2 Sampling sites overview – NW Cape to Red Bluff (locations indicated by ◘).

DATA CHAPTERS
Habitats and Biodiversity of Ningaloo Lagoon: Biodiversity and Ecology • 1 March, 2011, Version 1.0 23
Initial validation sites (nearshore, lagoon and back reef locations) were chosen at Coral Bay in
March 2008 to trial sampling methods. After successful trials, further validation sampling was
conducted between Tantabiddi and Yardie Creek in April and October 2008 and at Gnaraloo in
December 2008. At each selected site, two divers using SCUBA set out a mega-quadrat
comprised of 16 colour-coded weighted floats that correspond to the corners of each nested
quadrat. The central 3m x 3m quadrat was then used to provide a GPS reference point for
validation. To minimise bias, the same two observers were used for all mega-quadrat sampling;
one diver recorded substrate cover while the other recorded macroinvertebrates.
Initial validation sites (nearshore, lagoon and back reef locations) were chosen at Coral Bay in
March 2008 to trial sampling methods. After successful trials, further validation sampling was
conducted between Tantabiddi and Yardie Creek in April and October 2008 and at Gnaraloo in
December 2008. At each selected site, two divers using SCUBA set out a mega-quadrat
comprised of 16 colour-coded weighted floats that correspond to the corners of each nested
quadrat. The central 3m x 3m quadrat was then used to provide a GPS reference point for
validation. To minimise bias, the same two observers were used for all mega-quadrat
sampling; one diver recorded substrate cover while the other recorded macroinvertebrates.
In each quadrat urchins (predominantly Echinometra mathaei), holothurians, tridacnid clams, the corallivorous snail, Drupella cornus and other macroinvertebrates were counted. Visual identification and estimates of substrate % cover were recorded using substrate categories, adapted from the Australian Institute of Marine Science benthic life form categories used in their long-term benthic monitoring programme (English et al., 1994, Abdo et al., 2004) (Table 1). On occasions where substrate types were difficult to identify in the field (for example, various macroalga), photographs were taken for later identification. This method enabled visual percent cover estimates to be obtained at a scale that not only was compatible with ground-truthing of the substrate classifications for the hyperspectral habitat maps, but also provided finer-scale biodiversity data for floral/faunal surveys at the same time. Additional boat-based field validations were undertaken by targeting pre-determined areas of interest from the unvalidated hyperspectral images. GPS waypoints and tracks were recorded to mark outlines of different features and transition zones between features (e.g. limestone pavement, sediment patches, lagoonal coral patch reefs (bommies), macroalgae and seagrass beds). A total of 2,932 waypoints (including the 52 mega-quadrats), were recorded for the mapping validation exercise (Table 2).
Figure 3 Layout of nested quadrat design (left) indicating orientation, order of sampling and location of sub-
quadrats and photo-quadrats. GPS points were taken in the centre of sub-quadrats 1, 3, 5, 7 and 9. The
graphic on the right indicates the relationship between the nested quadrat and the remote sensed imagery (3.5
m pixel size).

DATA CHAPTERS
24 Habitats and Biodiversity of Ningaloo Lagoon: Biodiversity and Ecology • 1 March, 2011, Version 1.0
Further details of the verification of classification process are reported separately (Kobryn, 2010). Habitat Surveys Fine-scale habitat surveys were also conducted in 2009 (to complement validation data) in nearshore, lagoon and back reef locations in the Coral Bay region (Figure 4) and from Tantabiddi to Yardie Creek (Figure 5). Further nearshore sampling was later conducted from Jurabi Point to Bundegi, in the north of the park (Figure 5) and from Point Farquhar to Red Bluff in the South (Figure 6). Five haphazardly selected 50 m transects were completed at each site, with visual estimates of percent cover and macroinvertebrate counts recorded for ten 50 cm x 50 cm quadrats along each transect. To ensure that sampling was conducted over reasonably homogeneous substrates at each site, transects were swum to suit the individual site characteristics (i.e. when sites were not compatible with swimming straight 50 m line transects, 10 quadrats were haphazardly placed every 5 m within the sampling area).

DATA CHAPTERS
Habitats and Biodiversity of Ningaloo Lagoon: Biodiversity and Ecology • 1 March, 2011, Version 1.0 25
Table 2-1 Benthic life form categories used for substrate cover identification in the field (modified from
English et al., 1994, Abdo et al., 2004).
Substrate Category Code
Sand S
Sand and Microalgae SA
Rubble R
Limestone pavement LP
Recently dead coral DC
Intact Dead Coral IDC
Branching IDC B-IDC
Digitate IDC D-IDC
Massive IDC M-IDC
Tabulate IDC T-IDC
Turf Algae TA
Coralline Algae CA
Macroalgae MA
Sargassum SR
Dictyota DY
Halimeda spp. HA
Padina PA
Ulva UL
Seagrass SG
Sponge Sp
Branching Acropora ACB
Branching Acropora Blue Tip ACBT
Digitate Acropora ACD
Tabulate Acropora ACT
Bottlebrush Acropora ACX
Sub-massive Acropora ACS
Encrusting Acropora ACE
Massive coral CM
Sub-massive coral CS
Foliaceous non-Acropora CF
Mushroom coral CMR
Branching non-Acropora CB
Digitate non-Acropora CD
Encrusting non-Acropora CE
Soft Coral SC

DATA CHAPTERS
26 Habitats and Biodiversity of Ningaloo Lagoon: Biodiversity and Ecology • 1 March, 2011, Version 1.0
Table 2-2 Sampling effort for mapping validations at Ningaloo Marine Park, 2008.
Month 2008
Region sampled
Number of 3m quadrats
Number of GPS points
March Coral Bay 81 22
April Yardie 72 124
June- July Coral Bay 0 1,389
October Mandu 225 171
December Gnaraloo 90 1,226
Totals 468 2,932
Qualitative measures of biodiversity
Of the major taxonomic groups, most have had little or no work done at Ningaloo; groups of particular concern that will be targeted are the seagrasses, Cnidaria other than hard corals (i.e. soft corals) and the sponges. These groups have had very little work done on them despite the fact that they are critical components of coral reef community structure. The fishes, hard corals and molluscs of Ningaloo have been surveyed a number of times and information on the species present in the Ningaloo Marine Park is already available. CSIRO and AIMS researchers have collated data produced by previous surveys and sampling, and analysed the data for species distribution and community structure. Seagrasses were sampled opportunistically while conducting validation field work and quantitative macro-invertebrate sampling. Information collected in this study was combined with existing data obtained in previous studies. Dr Jane Fromont and Oliver Gomez from the Western Australian Museum were sub-contracted to collect and identify soft corals and sponges; soft coral material was subsequently sent to Dr Monica Schlacher at the Queensland Museum for further taxonomic analysis. Sampling for these groups was conducted in line with standard procedures established by the WA Museum; full details of the sponge and soft coral sampling programme are provided in an appendix to this report (Appendix 1. Fromont and Gomez, 2010). With the establishment of the C-Reefs programme run through AIMS, aspects of invertebrate and macroalgal biodiversity sampling proposed for this study have become redundant; in particular, the macroalgae were examined by Rainbo Dixon, under the supervision of Dr John Huisman (Murdoch University/WA Herbarium). Additional sampling of the soft corals and sponges was also carried out through C-Reefs; sampling in the Ningaloo Cluster programme supplemented sampling undertaken at Tantabiddi and Ningaloo Station during C-Reefs expeditions.

DATA CHAPTERS
Habitats and Biodiversity of Ningaloo Lagoon: Biodiversity and Ecology • 1 March, 2011, Version 1.0 27
Figure 4 Sampling sites – Coral Bay Region (locations indicated by ◘).

DATA CHAPTERS
28 Habitats and Biodiversity of Ningaloo Lagoon: Biodiversity and Ecology • 1 March, 2011, Version 1.0
Figure 5 Sampling sites – NW Cape to Yardie Creek (locations indicated by ◘).

DATA CHAPTERS
Habitats and Biodiversity of Ningaloo Lagoon: Biodiversity and Ecology • 1 March, 2011, Version 1.0 29
Figure 6 Sampling sites – Cape Farquhar to Red Bluff (locations indicated by ◘).

DATA CHAPTERS
30 Habitats and Biodiversity of Ningaloo Lagoon: Biodiversity and Ecology • 1 March, 2011, Version 1.0
Quantitative measures of biodiversity
The composition of benthic communities and relative abundance measures for key organism groups were obtained using photo transects and supplementary techniques; in particular, nested quadrat sampling and analysis permitted quantitative studies of macroalgae, seagrasses and related fauna to be carried out. These field results were used to verify and refine the classifications generated from the hyperspectral data as well as provide a basis for comparison of similar habitats at different sites. Protocols for the benthic biodiversity sampling programme were finalized following discussion with project partners and extensive testing. Sampling strategies included monitoring benthic habitat types along transects, nested quadrats to match up with the pixel size obtained by remote sensing, and transects to quantify numbers of key invertebrate species (echinoids, holothurians, tridacnid clams, and the corallivorous snail, Drupella). Sampling for macro-invertebrates was conducted using five 50 m transects at each site, with 0.25 m
2 quadrats sampled every 5 m along each transect. A visual estimate was made of
substrate cover, using the AIMS long-term monitoring categories (Abdo et al., 2004). Counts were also made of echinoids, holothurians, tridacnid clams, and the corallivorous snail, Drupella, within each quadrat. The GPS location of all transects was recorded.
2.3.4 Data analysis
Benthic life form categories (Table 1) that were rarely recorded throughout sampling were further condensed into broader categories during data collation (Table 3). All algae were grouped into turf, coralline or macroalgae (Total MA) and hard corals were condensed from 14 to 8 categories. Intact dead corals were also grouped together (Total IDC). Habitat characteristics data were collated and expressed as mean percent substrate cover (± 1 SE) for each location.
Mapping Validations
Validation data collected in this study was an integral component of the development of the Ningaloo Marine Park maps. However, the analytical techniques used for refining and classifying the hyperspectral images to produce these maps were not an element of this study and are reported elsewhere (see Kobryn et al., 2010). Unvalidated hyperspectral images were provided as a guide for targeting validation sites and the resultant classified baseline habitat maps produced broad-scale habitat descriptions that provide a framework for use in this study and other related biodiversity studies in the region (van Keulen et al., 2008).
Habitat data analyses
Data from the 2008 validation surveys and the 2009 habitat surveys were tested for homogeneity of variance by using one-way Analysis of Variance (ANOVA) on data collected using both sampling methods at the same sites (n=5). No significant difference was found (p> 0.05) so data was pooled for further analyses.

DATA CHAPTERS
Habitats and Biodiversity of Ningaloo Lagoon: Biodiversity and Ecology • 1 March, 2011, Version 1.0 31
Multivariate analyses
The data was analysed to examine spatial trends in the macroinvertebrate composition of benthic habitats between regions and between habitats within regions (nearshore, lagoon and back reef) where lagoonal areas were surveyed. Multivariate analyses were conducted using the PRIMER v6 statistical package (Clarke and Warwick, 2001). The tests were based on a Bray-Curtis rank similarity matrix, calculated using log(x+1) transformed data (Clarke and Warwick, 2001). Non-metric multidimensional scaling (nMDS) was used for initial interpretation of spatial patterns and one-way Analysis of Similarity (ANOSIM) was used to determine the significance of any spatial differences in habitat composition (Clarke and Warwick, 2001). A Similarity Percentage routine (SIMPER) (Clarke and Warwick, 2001) was then used to examine the contribution of individual macroinvertebrate categories to any observed similarities in composition (within regions and locations) or differences in composition between regions and locations.

DATA CHAPTERS
32 Habitats and Biodiversity of Ningaloo Lagoon: Biodiversity and Ecology • 1 March, 2011, Version 1.0
Table 2-3 Condensed substrate categories and descriptive definitions (adapted from Abdo et al., 2004).
Substrate Category Definition
Sand
Fine silt to calcareous sand <0.5 cm diameter.
Sand + Microalgae Sand mostly covered in fine microalgae.
Rubble Unconsolidated dead hard coral fragments.
Limestone pavement Consolidated limestone substrate, can be bare or colonised by turf or other algae < 5cm.
Total IDC Intact dead coral skeleton that has maintained form. Usually colonised by turf algae.
Turf Algae Encrusting algae <5cm with no apparent structural features.
Coralline Algae Crustose, calcareous red algae.
Total MA All macroalgae > 5cm (e.g. Sargassum, Padina).
Seagrass All seagrasses (e.g. Posidonia, Halophila).
Sponge All sponges. No further ID.
Branching corals Arborescent corals where branches are generally narrower than they are wide. Includes branching Acropora and non-Acropora.
Digitate corals Short digit like branches arising from an encrusting base (e.g. Acropora humilis).
Tabulate Acropora Table like horizontal plate corals originating from a small base (e.g. A. spicifera, A. hyacinthus).
Encrusting corals Low lying colonies encrusting the substrate.
Sub-massive corals Irregular shaped colony. Can be rounded, bulbous or with column like structures (e.g. Pocillopora).
Massive corals Usually solid and hemispherical in shape (e.g. Porites).
Foliaceous corals Leaf like or floral morphology (e.g. Echinopora).
Mushroom corals Solitary mushroom like coral.
Soft Corals All soft corals. No further ID.

DATA CHAPTERS
Habitats and Biodiversity of Ningaloo Lagoon: Biodiversity and Ecology • 1 March, 2011, Version 1.0 33
2.4 Results
Verification of classification
Verification data was incorporated into the habitat mapping project (see Kobryn, 2010) and the details will not be reported here.
Qualitative measures of biodiversity
Site Characteristics Ningaloo Marine Park covers almost 300km of coastline (Westera et al., 2003), so survey results have been grouped into appropriate regions, from Bundegi in the north to Red Bluff in the south. In lagoonal areas, habitat descriptions have been additionally separated into nearshore, lagoon and back reef locations (Table 4). Habitat characteristics are expressed as mean percent substrate cover (± 1 SE) for each location. Macroinvertebrate results are shown as mean number of individuals per square metre (± 1 SE).
Table 2-4 Ningaloo Marine Park Major regions and sub-regions, North to South (* indicates regions with
lagoonal areas).
Major Region Sub-regions
NW Cape Bundegi
North of Jurabi Point
*Tantabiddi to Yardie Creek Tantabiddi
Mangrove Bay
Mandu
Osprey
*Point Maud to Point Anderson Coral Bay North (Maud Sanctuary)
Coral Bay South
South Ningaloo Cape Farquhar
Gnaraloo Bay
3 Mile
Red Bluff
(a) NW Cape Region Habitat surveys in this region were limited to nearshore areas because North of Jurabi Point; the fringing reef becomes discontinuous and eventually disappears, with no distinct lagoon or back reef areas (CALM, 2005). Eight sites were surveyed at Bundegi, Lighthouse and Jurabi (four in sanctuary zones and four in adjacent recreational zones) within the region (Figure 5). Bundegi Bundegi Sanctuary lies on the eastern side of NW Cape, in Exmouth Gulf. Nearshore habitats south of Bundegi beach were sampled and are typically sandy to muddy intertidal areas,

DATA CHAPTERS
34 Habitats and Biodiversity of Ningaloo Lagoon: Biodiversity and Ecology • 1 March, 2011, Version 1.0
framed by narrow beaches and intermittent mangrove stands. Sand is by far the dominant substrate (87 %), interspersed with patches of sand covered limestone pavement (4.5 %) with isolated outcrops of turf (4.35 %) and macro algae (4.15 %) (Figure 7).
Figure 5 cover of benthic habitats at Bundegi, using broad sampling categories.
North of Jurabi Point Nearshore areas at Graveyards, Baudin, Trisel, and Hunters were predominantly subtidal and intertidal reef platforms extending from the water's edge, framed by rocky shores with intermittent small sandy beaches. Reef platforms varied in width from around 10 m up to 50 m from the shore. Lighthouse Bay, north of Hunters also had extensive subtidal and intertidal reef platforms that extended up to 60-70 m offshore with the shoreline consisting of a long (~5km) sandy beach with extensive fore dunes. Average depths of nearshore platforms at high tide were 1.5 m. Reef platforms consisted of bare limestone pavement (32.33 %) with sandy patches (21.33 %) and the underlying pavement was covered in a mosaic of turf algae (20.8 %), macro algae (18.39 %) and coralline algae (6.06 %). Seagrass (4.97 %) had also colonised a small number of sandy patches (Figure 8).
Figure 6 Percent cover of benthic habitats north of Jurabi, using broad sampling categories.

DATA CHAPTERS
Habitats and Biodiversity of Ningaloo Lagoon: Biodiversity and Ecology • 1 March, 2011, Version 1.0 35
(b) Tantabiddi to Yardie Creek Region The fringing reef lies offshore from Tantabiddi to Yardie Creek (0.3 – 4.1 km offshore, average lagoon width is about 2.5 km), enclosing large lagoonal areas. Habitat surveys in this region were therefore stratified into nearshore, lagoon and back reef areas within each sub-region (Table 4). A total of 43 sites were surveyed at Tantabiddi, Mangrove Bay, Mandu and Osprey Sanctuary zones and their adjacent recreation zones (Figure 5). Regional Overview: Tantabiddi to Yardie Creek Nearshore areas consisted of limestone substrates (10.22 %) predominantly covered by a layer of sand (25.94 %), or in some locations finer silty sand or mud, supporting patches of microalgae (10.05 %) and macroalgae (35.32 %). Intertidal or subtidal reef platforms were not well defined and did not support dense mosaics of turf and macroalgae but rather consisted of sand-covered pavement supporting small patches of turf (2.54 %) and stands of algae such as Padina, Hincksia and Hydroclathrus. Rubble (4.25 %) and small intermittent patch reefs of sub-massive (3.38 %) and branching corals (2.32 %) were also evident at nearshore sampling sites (Figure 9).
Figure 7 Regional overview of percent cover of substrate types in the nearshore habitats in the Tantabiddi
to Yardie Creek region.
Lagoonal areas surveyed were mostly sand-covered pavement (40.03 % sand, 8.03 % bare limestone pavement) with patches of turf (2.91 %) and macroalgae (15.99 %); e.g., Padina. Lagoonal patch reefs consisted of dead coral (11.24 %) and a variety of hard corals such as branching (3.04 %) and sub-massive corals (2.34 %). Soft corals (2.6 %) and cryptic sponges (<1 %) were also present in isolated colonies (Figure 10). Back reef areas (Figure 11) were found to be more diverse, with much less sand (15.27 %) and higher coverage of hard corals than nearshore and lagoonal areas. Tabulate Acropora (11.96 %) was the most common hard coral, followed by digitate (5.62 %) and branching corals (3.38 %). Other hard corals (encrusting, sub-massive, foliaceous and massive) accounted for almost 8 % of substrate cover. Limestone pavement (11.35 %), rubble (10.93 %) and dead corals (9.40
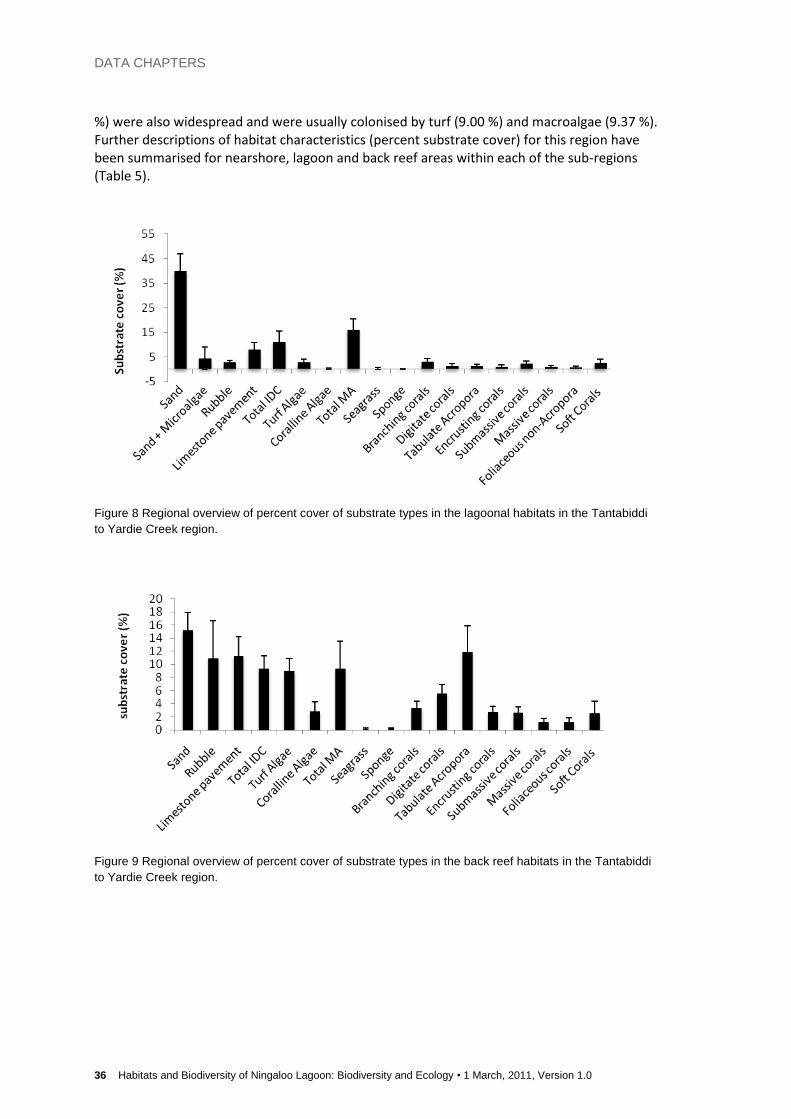
DATA CHAPTERS
36 Habitats and Biodiversity of Ningaloo Lagoon: Biodiversity and Ecology • 1 March, 2011, Version 1.0
%) were also widespread and were usually colonised by turf (9.00 %) and macroalgae (9.37 %). Further descriptions of habitat characteristics (percent substrate cover) for this region have been summarised for nearshore, lagoon and back reef areas within each of the sub-regions (Table 5).
Figure 8 Regional overview of percent cover of substrate types in the lagoonal habitats in the Tantabiddi
to Yardie Creek region.
Figure 9 Regional overview of percent cover of substrate types in the back reef habitats in the Tantabiddi
to Yardie Creek region.

DATA CHAPTERS
Habitats and Biodiversity of Ningaloo Lagoon: Biodiversity and Ecology • 1 March, 2011, Version 1.0 37
Table 2-5 Regional summary of benthic substrates: Tantabiddi to Yardie.
a) Tantabiddi nearshore * lagoon
back reef *
Substrate Category % ± 1 SE % ± 1 SE % ± 1 SE
Sand 45.00 45.00 30.95 25.95 19.17 19.17
Rubble 2.75 2.75 9.29 4.29 5.42 5.42
Limestone pavement 12.75 12.75 7.14 2.14 12.50 12.50
Total IDC 0.25 0.25 5.12 4.89 14.17 14.17
Turf Algae
2.50 2.50 17.71 17.71
Coralline Algae
0.63 0.63
Total MA 39.00 39.00 12.26 7.26 3.75 3.75
Sponge 0.25 0.25 0.24 0.24 1.67 1.67
Branching corals
10.00 10.00 8.96 8.96
Digitate corals
4.38 4.38
Tabulate Acropora
2.50 2.50 Encrusting corals
5.00 5.00 8.13 8.13
Sub-massive corals
7.50 7.50 3.13 3.13
Massive corals
2.50 2.50 0.42 0.42
Foliaceous corals
5.00 5.00 *Note: Large SEs for nearshore and back reef are because only 1 site sampled for each
b) Mangrove Bay nearshore
lagoon
back reef Substrate Category % ± 1 SE % ± 1 SE % ± 1 SE
Sand 48.19 1.84 42.51 15.04 18.15 5.19
Rubble 5.68 2.45 2.23 1.30 21.30 11.23
Limestone pavement 3.20 0.86 5.79 2.96 4.54 4.43
Total IDC 0.70 0.38 11.63 5.87 9.44 4.77
Turf Algae 1.42 0.61 5.22 3.26 10.09 3.58
Coralline Algae 0.35 0.19 0.33 0.33 5.93 2.66
Total MA 33.19 4.91 15.06 3.18 12.41 8.12
Seagrass
0.28 0.28
Sponge 6.32 5.25 0.54 0.19 Branching corals
5.12 5.12 1.02 0.54
Digitate corals
1.50 1.55 1.57 0.95
Tabulate Acropora
0.61 0.61 6.67 6.67
Encrusting corals 0.54 0.54 1.46 1.46 0.37 0.19
Sub-massive corals
4.17 3.00 2.04 1.80
Massive corals 0.41 0.41 1.06 1.06 1.11 1.42
Foliaceous corals
0.74 0.64
Soft Corals
2.78 2.78 4.35 3.80
Cont…

DATA CHAPTERS
38 Habitats and Biodiversity of Ningaloo Lagoon: Biodiversity and Ecology • 1 March, 2011, Version 1.0
c) Mandu nearshore
lagoon
back reef Substrate Category % ± 1 SE % ± 1 SE % ± 1 SE
Sand 24.47 9.80 42.29 15.46 11.18 5.06
Sand + Microalgae 2.00 2.00 Rubble 5.52 3.41 3.76 1.60 2.23 1.72
Limestone pavement 10.76 3.17 22.29 8.28 19.65 4.74
Total IDC 3.11 3.11 2.04 1.51 9.86 2.19
Turf Algae 1.91 1.20 3.49 1.35 5.58 2.42
Coralline Algae 1.56 1.30 0.25 0.25 0.23 0.16
Total MA 41.86 14.33 12.20 5.53 12.41 8.09
Sponge 1.05 0.85 0.22 0.22 Branching corals 5.11 5.11 1.99 1.99 2.89 0.73
Digitate corals 0.67 0.67 2.80 2.80 7.72 0.84
Tabulate Acropora
4.30 4.30 13.55 4.21
Encrusting corals 0.78 0.78 1.41 0.96 3.98 1.80
Sub-massive corals 1.11 1.11 1.83 1.83 3.78 2.61
Massive corals 0.11 0.11 0.78 0.66 2.10 0.72
Foliaceous corals
2.83 1.80
Soft Corals
0.35 0.24 1.99 1.99
d) Osprey nearshore
lagoon
back reef Substrate Category % ± 1 SE % ± 1 SE % ± 1 SE
Sand 7.22 5.64 40.38 10.21 12.29 2.41
Sand + Microalgae 33.52 24.92 7.78 7.78 Rubble 1.67 1.67 1.54 0.70 0.74 0.14
Limestone pavement 13.15 8.53 4.91 3.72 16.31 1.53
Total IDC 0.19 0.19 14.75 7.21 7.25 1.14
Turf Algae 5.19 2.89 2.20 1.70 7.34 0.42
Coralline Algae 2.22 1.47 0.37 0.35 0.17 0.17
Total MA 24.63 15.93 17.96 7.57 2.13 0.55
Seagrass
0.61 0.61 Sponge
0.30 0.30
Branching corals
1.49 0.89 6.75 2.83
Digitate corals 0.37 0.37 1.29 1.15 12.03 0.65
Tabulate Acropora
0.48 0.45 24.94 4.50
Encrusting corals 0.74 0.74 0.30 0.30 4.61 1.29
Sub-massive corals 10.56 10.56 1.04 0.77 2.79 1.94
Massive corals 0.56 0.56 0.91 0.66 0.80 0.41
Foliaceous corals
0.35 0.32 1.07 1.07
Soft Corals
3.64 2.46 0.48 0.48
DATA CHAPTERS
Habitats and Biodiversity of Ningaloo Lagoon: Biodiversity and Ecology • 1 March, 2011, Version 1.0 39
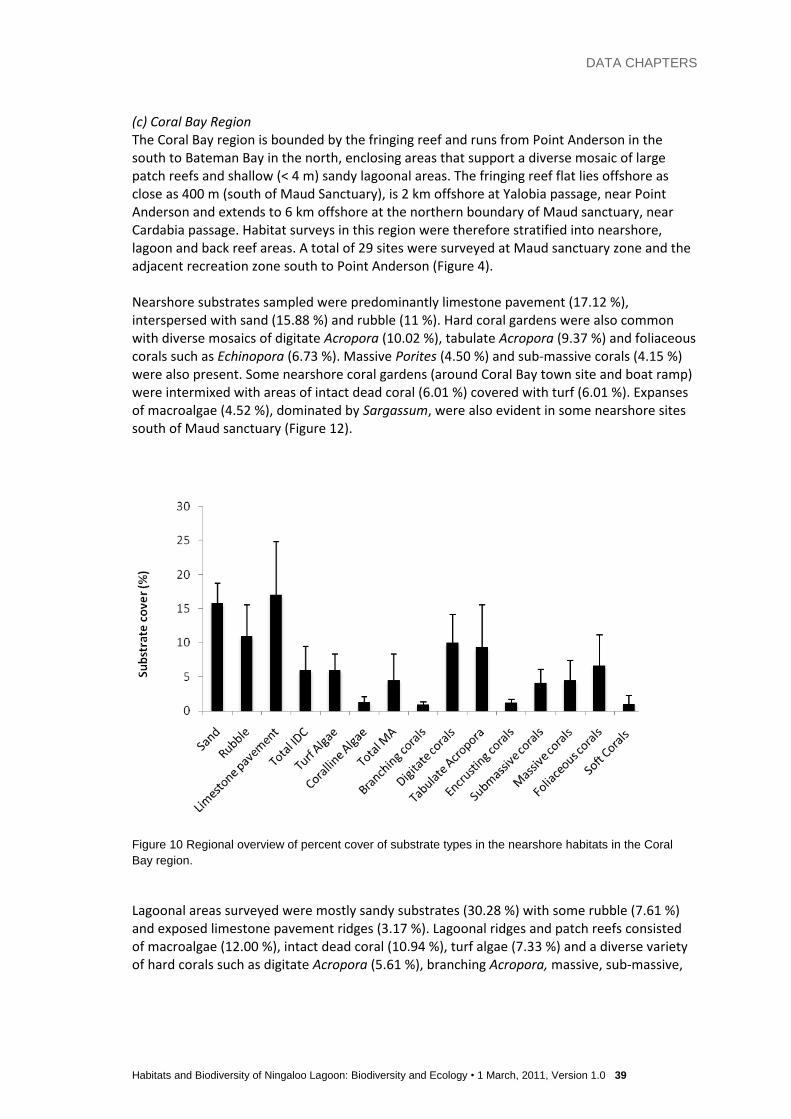
(c) Coral Bay Region The Coral Bay region is bounded by the fringing reef and runs from Point Anderson in the south to Bateman Bay in the north, enclosing areas that support a diverse mosaic of large patch reefs and shallow (< 4 m) sandy lagoonal areas. The fringing reef flat lies offshore as close as 400 m (south of Maud Sanctuary), is 2 km offshore at Yalobia passage, near Point Anderson and extends to 6 km offshore at the northern boundary of Maud sanctuary, near Cardabia passage. Habitat surveys in this region were therefore stratified into nearshore, lagoon and back reef areas. A total of 29 sites were surveyed at Maud sanctuary zone and the adjacent recreation zone south to Point Anderson (Figure 4). Nearshore substrates sampled were predominantly limestone pavement (17.12 %), interspersed with sand (15.88 %) and rubble (11 %). Hard coral gardens were also common with diverse mosaics of digitate Acropora (10.02 %), tabulate Acropora (9.37 %) and foliaceous corals such as Echinopora (6.73 %). Massive Porites (4.50 %) and sub-massive corals (4.15 %) were also present. Some nearshore coral gardens (around Coral Bay town site and boat ramp) were intermixed with areas of intact dead coral (6.01 %) covered with turf (6.01 %). Expanses of macroalgae (4.52 %), dominated by Sargassum, were also evident in some nearshore sites south of Maud sanctuary (Figure 12).
Figure 10 Regional overview of percent cover of substrate types in the nearshore habitats in the Coral
Bay region.
Lagoonal areas surveyed were mostly sandy substrates (30.28 %) with some rubble (7.61 %) and exposed limestone pavement ridges (3.17 %). Lagoonal ridges and patch reefs consisted of macroalgae (12.00 %), intact dead coral (10.94 %), turf algae (7.33 %) and a diverse variety of hard corals such as digitate Acropora (5.61 %), branching Acropora, massive, sub-massive,

DATA CHAPTERS
40 Habitats and Biodiversity of Ningaloo Lagoon: Biodiversity and Ecology • 1 March, 2011, Version 1.0
and foliaceous corals (around 4 % each). Coralline algae and encrusting corals (<3 %) were also noted (Figure 13).
Figure 11 Regional overview of percent cover of substrate types in the lagoonal habitats in the Coral Bay
region.
Back reef areas were found to be more diverse than lagoonal areas, with sandy patches (18.91 %), rubble (13.22 %) and a higher coverage of intact dead coral (20.56 %), usually colonised by and macroalgae (6.21 %) and turf (1.2 %). Tabulate Acropora (14.29 %) was the most common hard coral, followed by branching corals (10.84 %) and digitate Acropora (7.98 %). Other hard corals (encrusting, sub-massive, foliaceous, mushroom and massive) accounted for less than 5 % of substrate cover (Figure 14).
Figure 12 Regional overview of percent cover of substrate types in the back reef habitats in the Coral Bay
region.

DATA CHAPTERS
Habitats and Biodiversity of Ningaloo Lagoon: Biodiversity and Ecology • 1 March, 2011, Version 1.0 41
(d) South Ningaloo Region The southern end of Ningaloo reef is patchy and closer to shore. South from Cape Farquhar the fragmented fringing reef becomes a nearshore reef through to Gnaraloo Bay, 3 Mile sanctuary and Red Bluff, which is the southernmost point of Ningaloo Marine Park. Sampling was therefore conducted at nearshore reef platform and patch reef sites. A total of 17 sites were surveyed at Cape Farquhar, Gnaraloo Bay, 3 Mile and Turtles sanctuary zones and their adjacent recreation zones (Figure 6). Sampling at Cape Farquhar and Turtles / Red Bluff was limited to intertidal and subtidal limestone reef platforms whereas Gnaraloo Bay and 3 Mile sampling sites consisted of both nearshore reef platform and patch reef sites.
Cape Farquhar Nearshore areas sampled at Cape Farquhar were predominantly narrow (3-5 m) subtidal and intertidal reef platforms extending out at an angle from a sandy shoreline for 30-50 m and surrounded on all sides by shallow (<2 m) sandy substrate. The platforms were parallel to each other and around 10 m apart. Reef platforms consisted of bare limestone pavement (65 %) with sandy patches (7.5 %) and some areas of pavement were colonised by turf algae (14.58 %) and macroalgae (3.61 %). Soft corals (5.56 %) had also colonised the seaward edges of some platforms (Figure 15).
Figure 13 Regional overview of percent cover of substrate types in the nearshore habitats in the Cape
Farquhar region.
Gnaraloo Bay Sites surveyed at Gnaraloo Bay were intertidal/subtidal platforms and shallow (<2 m) nearshore patch reefs in calm sandy areas. The bay comprises a diverse variety of benthic habitats, including macroalgae, hard and soft corals, sponges and seagrass. Branching coral (24.31 %) was the most common hard coral, followed by digitate Acropora (9.51 %) and tabulate Acropora (6.32 %). Other hard corals (encrusting, sub-massive, foliaceous and massive) accounted for around 8 % of substrate cover. Intact dead corals (11.81 %) and limestone pavement (6.04 %) were also common and were typically colonised by turf (3.78 %) and macroalgae (8.01 %). Soft corals (6.18 %) and seagrass (2.36 %) were also recorded in the bay area (Figure 16).

DATA CHAPTERS
42 Habitats and Biodiversity of Ningaloo Lagoon: Biodiversity and Ecology • 1 March, 2011, Version 1.0
Figure 14 Regional overview of percent cover of substrate types in the nearshore habitats in the Gnaraloo
Bay region.
3 Mile and Red bluff Nearshore sites sampled at 3 Mile and Turtles sanctuaries and adjacent recreation zones were predominantly subtidal and intertidal reef platforms, framed by rocky shores. Intermittent nearshore patch reefs and shallow coral gardens were widespread at 3 Mile but were not evident at Red Bluff, where the subtidal platforms dropped off into deep water. At 3 Mile, limestone pavement (39.33 %) was the dominant substrate on subtidal and intertidal reef platforms, with mixed patches of turf (14.33 %), macroalgae (5.33 %) and coralline algae (3.00 %). Tabulate Acropora (9.67 %), digitate Acropora (7.67 %), and branching corals (6.33 %) accounted for almost 25 % of habitat in nearshore patch reefs and shallow coral gardens. Other corals (intact dead corals, sub-massive, foliaceous and soft corals) accounted for around 8 % of substrate cover at 3 mile (Figure 17). At Red Bluff, nearshore limestone pavement (38.78 %) platforms, covered in dense mats of turf (43.73 %) and macroalgae (17.50 %) were the dominant characteristic of the region (Figure 18).

DATA CHAPTERS
Habitats and Biodiversity of Ningaloo Lagoon: Biodiversity and Ecology • 1 March, 2011, Version 1.0 43
Figure 15 Regional overview of percent cover of substrate types in the nearshore habitats in the 3 Mile
region.
Figure 16 Regional overview of percent cover of substrate types in the nearshore habitats in the Red Bluff
region.
Descriptive biodiversity
Seagrasses The presence of seagrasses was recorded opportunistically during field work for validation and sampling for macro-invertebrates. Material was collected growing in situ and also from drift washed up on the shore. Nine species of seagrass have been found in various locations throughout the Ningaloo Reef (Table 6). There are some clear temperate/tropical separations; however several species are found throughout the Ningaloo Reef region.

DATA CHAPTERS
44 Habitats and Biodiversity of Ningaloo Lagoon: Biodiversity and Ecology • 1 March, 2011, Version 1.0
Table 2-6 Seagrass species of Ningaloo Reef.
Species Biogeographical affinity Range limit
Posidonia australis Temperate N to Coral Bay (drift) Posidonia coriacea Temperate N to Bateman Bay Amphibolis antarctica Temperate N to Bateman Bay Cymodocea serrulata Tropical S to Coral Bay Thalassia hemprichii Tropical Rare, S to Tantabiddi (drift) Syringodium isoetifolium Tropical/Cross-zone Throughout Halodule uninervis Tropical/Cross-zone Throughout Halophila spinulosa Cross-zone Rare, S to Bateman Bay Halophila ovalis Cross-zone Throughout
The large meadow-forming temperate species Posidonia australis, P. coriacea and Amphibolis antarctica are found at their northern limit in Bateman Bay. P. coriacea forms sizeable clumps in water 5 m or more deep; it is tolerant of rough water and is likely found in deeper channels. It is frequently found washed up in drift and will often accumulate in windrows on the water surface during periods of continuous wind. A. antarctica can be found growing in large circular clumps in Bateman Bay, particularly near Bruboodjoo Point. It also grows in rocky areas, such as the Lagoon. P. australis was not found growing in situ; it is possible that the material found was washed up from meadows growing further south. Cymodocea serrulata and Thalassia hemprichii were only found rarely; both are considered tropical and C. serrulata was found only as far south as Coral Bay, while T. hemprichii was only found in the drift near Tantabiddi. The other species, while largely tropical, are more commonly found and have broader distributions throughout Ningaloo. Halophila ovalis is the most commonly found seagrass at Ningaloo, frequently found growing in sandy patches between coral heads. Halophila spinulosa is less common, although unconfirmed reports suggest it forms extensive beds near Point Cloates. It tends to prefer deeper water; a single specimen was collected at 8 m depth near the Porites in Bateman Bay. Halodule uninervis, primarily a tropical species, is very common and often found growing together with Halophila ovalis in sandy areas. Syringodium isoetifolium, also considered tropical, is generally found growing with Halophila ovalis and sometimes Halodule uninervis, although it will also grow in isolation. Sponges and soft corals Twenty-three stations were sampled for sponges and soft corals by Dr Jane Fromont and Oliver Gomez of the WA Museum; 13 stations in the Gnaraloo region and ten in the Tantabiddi region. Thirty-six species of sponges were collected and nine species of soft corals. There was little overlap of species from the two sampling locations, showing clear biogeographical separation between northern and southern populations. Only five sponges and one soft coral were found to occur in both regions of Ningaloo. Most species were rarely encountered, with 27 sponges and six soft corals having five or less individuals recorded from all stations. Further collections were made from the Point Cloates region, as part of the C-Reefs project; extensive collections have also been made of deep water sponges in the waters offshore of Ningaloo Reef. Further funding is required to match the lagoon specimens from Gnaraloo and Tantabiddi with those from Point Cloates and the deep water samples.

DATA CHAPTERS
Habitats and Biodiversity of Ningaloo Lagoon: Biodiversity and Ecology • 1 March, 2011, Version 1.0 45
A full description of the results is presented in Appendix 1 (Fromont and Gomez, 2010).
Quantitative measures of biodiversity
Macroinvertebrate surveys
Macroinvertebrate counts were conducted at all sites (97 sites, see Figures 4-6) for individual urchins (predominantly Echinometra mathaei), holothurians, tridacnid clams, the corallivorous snail, Drupella cornus and soft corals. Other macroinvertebrates, such as sea stars, trochus, large bivalves, sponges and octopus were grouped together as “other”. Macroinvertebrate results are given as mean number of individuals per square metre (± 1 SE). (a) NW Cape Region
Bundegi Nearshore habitats south of Bundegi beach were sampled and no macroinvertebrates were observed at any of the sites.
North of Jurabi Point Nearshore areas at Graveyards, Baudin, Trisel, and Hunters were predominantly inhabited by urchins (5.37 m-2) and clams (0.91 m-2). Low densities (<0.2 m-2) of holothurians, soft corals and sponges were also noted (Figure 19).
Figure 17 Densities of key macroinvertebrate groups in the nearshore habitat north of Jurabi Point.
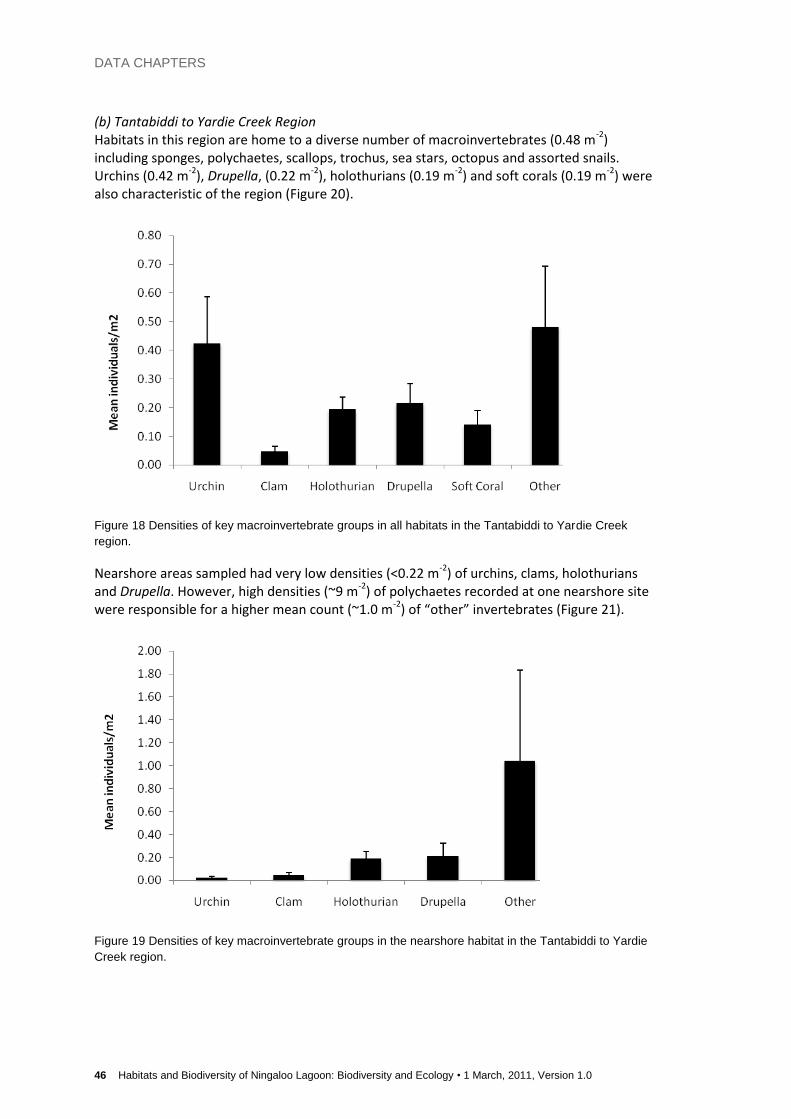
DATA CHAPTERS
46 Habitats and Biodiversity of Ningaloo Lagoon: Biodiversity and Ecology • 1 March, 2011, Version 1.0
(b) Tantabiddi to Yardie Creek Region Habitats in this region are home to a diverse number of macroinvertebrates (0.48 m
-2)
including sponges, polychaetes, scallops, trochus, sea stars, octopus and assorted snails. Urchins (0.42 m-2), Drupella, (0.22 m-2), holothurians (0.19 m-2) and soft corals (0.19 m-2) were also characteristic of the region (Figure 20).
Figure 18 Densities of key macroinvertebrate groups in all habitats in the Tantabiddi to Yardie Creek
region.
Nearshore areas sampled had very low densities (<0.22 m-2
) of urchins, clams, holothurians and Drupella. However, high densities (~9 m
-2) of polychaetes recorded at one nearshore site
were responsible for a higher mean count (~1.0 m-2) of “other” invertebrates (Figure 21).
Figure 19 Densities of key macroinvertebrate groups in the nearshore habitat in the Tantabiddi to Yardie
Creek region.

DATA CHAPTERS
Habitats and Biodiversity of Ningaloo Lagoon: Biodiversity and Ecology • 1 March, 2011, Version 1.0 47
Lagoonal areas surveyed had higher densities of urchins (0.61 m-2
) on patch reefs and low densities of holothurians and soft corals (~0.2 m
-2) in sandy lagoons. Other
macroinvertebrates (~0.4 m-2
) included sponges, trochus, sea stars and assorted snails (Figure 22).
Figure 20 Densities of key macroinvertebrate groups in the lagoonal habitat in the Tantabiddi to Yardie
Creek region.
Back reef sites sampled were found to have a diverse mix of invertebrates, with urchins (0.49 m
-2) and Drupella (0.33 m
-2) present in back reef coral gardens. Holothurians (0.18 m
-2), and
soft corals (0.16 m-2
) were also evident in small numbers in shallow sandy patches. Other macroinvertebrates (0.14 m-2) included trochus, sea stars, anemones and octopus (Figure 23).
Figure 21 Densities of key macroinvertebrate groups in the back reef habitat in the Tantabiddi to Yardie
Creek region.

DATA CHAPTERS
48 Habitats and Biodiversity of Ningaloo Lagoon: Biodiversity and Ecology • 1 March, 2011, Version 1.0
(c) Coral Bay Region Habitats surveyed in this region are a diverse mosaic of large patch reefs and shallow (< 4m) sandy lagoonal areas and nearshore limestone platforms. They support a range of invertebrate communities, including urchins (1.33 m-2), Drupella (0.52 m-2) clams (0.30 m-2), holothurians (0.15 m-2) and a variety of other invertebrates (0.47 m-2) such as sea stars, trochus, bivalves, and snails (Figure 24). The Coral Bay region can be divided into two sub-regions; North (Maud Sanctuary zone) and South (Recreation Zone).
Figure 22 Densities of key macroinvertebrate groups in all habitats in the Coral Bay region.
Nearshore sites surveyed in Maud Sanctuary zone (Figure 25) were typically inhabited by Tridacnid clams (0.37 m-2), soft corals (0.33 m-2), urchins (0.27 m-2) and Drupella (0.27 m-2). In contrast, nearshore sites in the southern recreation zone (Figure 26) were typically populated by higher densities of urchins (4.06 m
-2) on limestone ridges and platforms and a small number
of holothurians (0.49 m-2
) in sandy nearshore patches.

DATA CHAPTERS
Habitats and Biodiversity of Ningaloo Lagoon: Biodiversity and Ecology • 1 March, 2011, Version 1.0 49
Figure 23 Densities of key macroinvertebrate groups in the nearshore habitat in the Coral Bay region
(Maud Sanctuary zone).
Figure 24 Densities of key macroinvertebrate groups in the nearshore habitat in the Coral Bay region
(southern recreational zone).
Lagoonal areas surveyed in Maud Sanctuary zone had much greater densities of the corallivorous snail, Drupella cornus (1.49 m-2), when compared to densities in the southern recreation zone (0.08 m-2). However urchin densities in Maud Sanctuary zone were around 40 % of densities recorded at sites in the southern recreation zone (0.85 m-2 compared to 2.13 m-
2) and clams, holothurians and other invertebrate densities recorded in Maud sanctuary zone (Figure 27) were noted to be around half of those recorded in the southern recreation zone (Figure 28).

DATA CHAPTERS
50 Habitats and Biodiversity of Ningaloo Lagoon: Biodiversity and Ecology • 1 March, 2011, Version 1.0
Figure 25 Densities of key macroinvertebrate groups in the lagoonal habitat in the Coral Bay region (Maud
Sanctuary zone).
Figure 26 Densities of key macroinvertebrate groups in the nearshore habitat in the Coral Bay region
(southern recreational zone).
Back reef habitat types were found to be fairly consistent between Maud Sanctuary zone and the southern recreation zone. Urchins (0.86 m-2) and Drupella (0.64 m-2) were typically found inhabiting back reef patch reefs as well as clams (0.34 m-2) and other invertebrates (0.63 m-2) such as sea stars, trochus, bivalves, and snails. A small number of holothurians (0.15 m-2) were also typically found in sheltered sandy areas (Figure 29).

DATA CHAPTERS
Habitats and Biodiversity of Ningaloo Lagoon: Biodiversity and Ecology • 1 March, 2011, Version 1.0 51
Figure 27 Densities of key macroinvertebrate groups in the back reef habitat in the Coral Bay region.
(d) South Ningaloo Region
Cape Farquhar Nearshore habitats sampled at Cape Farquhar (Figure 30) were mainly limestone platforms surrounded by shallow sandy substrates. The platforms were typically colonised by urchins (1.36 m-2), holothurians (0.43 m-2), clams (0.2 m-2) and soft corals (0.19 m-2).
Figure 28 Densities of key macroinvertebrate groups in the nearshore habitat in the Cape Farquhar
region.
Gnaraloo Bay Sites surveyed at Gnaraloo Bay were limestone platforms and shallow (<2m) nearshore patch reefs in calm sandy areas. These sites were inhabited by a diverse macroinvertebrate community including urchins (0.54 m-2), soft corals (0.31 m-2), Drupella (0.29 m-2) clams (0.22

DATA CHAPTERS
52 Habitats and Biodiversity of Ningaloo Lagoon: Biodiversity and Ecology • 1 March, 2011, Version 1.0
m-2
) and a variety of other invertebrates (0.56 m-2
) such as sea stars, trochus, anemones, and assorted snails (Figure 31).
Figure 29 Densities of key macroinvertebrate groups in the nearshore habitat in the Gnaraloo region.
3 Mile Nearshore sites sampled at 3 Mile Sanctuary and the neighbouring recreation zone were mostly nearshore subtidal and intertidal reef platforms, patch reefs and shallow coral gardens. Sites were predominantly urchin habitats (3.55m
-2) and reasonably high densities of Drupella
(2.24 m-2
) were also present in coral gardens. Lower densities of soft corals (0.53 m-2
), Tridacnid clams (0.51 m-2) and holothurians (0.40 m-2) were also evident (Figure 32).
Figure 30 Densities of key macroinvertebrate groups in the nearshore habitat in the 3 Mile region.

DATA CHAPTERS
Habitats and Biodiversity of Ningaloo Lagoon: Biodiversity and Ecology • 1 March, 2011, Version 1.0 53
Red Bluff Sites surveyed at Turtles Sanctuary and the neighbouring recreation zone at Red Bluff were characterised by subtidal and intertidal reef platforms nearshore. At Red Bluff, the subtidal platforms dropped off into deep water. All nearshore platforms were predominantly urchin habitat, with very high densities (12.36 m
-2) of Echinometra mathaei present. Tridacnid clams
(1.10 m-2
) were also present in high densities on shallow limestone platforms (Figure 33).
Figure 31 Densities of key macroinvertebrate groups in the nearshore habitat in the Red Bluff region.
Multivariate analyses - Macroinvertebrates
Further analyses were conducted to examine spatial trends in the macroinvertebrate community composition of benthic habitats between regions, between management zones (Sanctuary v Recreation) and between locations within regions (near-shore, lagoon and back reef) where lagoonal areas were surveyed. Multivariate analyses were conducted using the PRIMER v6 statistical package (Clarke and Warwick, 2001). Relevant results are presented below. a) Comparisons between regions
NW Cape v Tantabiddi - Yardie Creek (nearshore) Initial interpretation of spatial patterns using a non-metric multidimensional scaling (nMDS) plot indicated differences in macroinvertebrate composition of benthic habitats between regions (Figure 34). One-way analysis of similarity (ANOSIM) using region as a group factor confirmed a significant dissimilarity in invertebrate community structure exists between regions (average dissimilarity = 92.31, R = 0.456, p = 0.001), where R is based on the difference of mean ranks between groups and within groups (R= 0 indicates no differences between groups, R=1 indicates no similarities between groups). Further similarity percentage analysis (SIMPER) indicated that urchins were the key species contributing to the regional dissimilarities in composition (55.38 %) with an average 80 times greater abundance at NW Cape. Clams (17.63 %) and other invertebrates (12.70 %) also contributed to dissimilarities in community composition (Table 7).

DATA CHAPTERS
54 Habitats and Biodiversity of Ningaloo Lagoon: Biodiversity and Ecology • 1 March, 2011, Version 1.0
Figure 32 nMDS plot indicating differences in macroinvertebrate composition of nearshore benthic
habitats between regions (North West Cape (NW) vs. Tantabiddi to Yardie Creek (T-Y)).
Table 2-7 Regional SIMPER results output – North West Cape (NW) vs. Tantabiddi to Yardie Creek (T-Y).
Region NW T-Y Average dissimilarity = 92.31
Species Av.Abund Av.Abund Av.Diss Diss/SD Contrib% Cum.%
URCHIN 1.66 0.02 51.12 3.84 55.38 55.38
CLAM 0.60 0.04 16.27 2.10 17.63 73.01
OTHER 0.10 0.39 11.72 0.72 12.70 85.71
HOLOTHURIAN 0.13 0.16 7.18 0.91 7.77 93.49
South Ningaloo v Tantabiddi - Yardie Creek (nearshore) Initial analysis of spatial patterns using an nMDS plot indicated differences in macroinvertebrate composition of benthic habitats between regions (Figure 35). One-way ANOSIM using “region” as a group factor confirmed a significant dissimilarity in invertebrate community structure exists between regions (average dissimilarity = 82.53, R = 0.338, p = 0.001). Further SIMPER analysis indicated that urchins were the key species contributing to the regional dissimilarities in composition (36.74 %) with average abundances 50 x more at South Ningaloo. Other invertebrates (17.51 %), Drupella (15.14 %), clams and holothurians (~11 % each) also contributed to dissimilarities in community composition (Table 8).

DATA CHAPTERS
Habitats and Biodiversity of Ningaloo Lagoon: Biodiversity and Ecology • 1 March, 2011, Version 1.0 55
Figure 33 nMDS plot indicating differences in macroinvertebrate composition of nearshore benthic
habitats between regions (Tantabiddi to Yardie Creek (T-Y) and South Ningaloo (S)).
Table 2-8 Regional SIMPER results output – South Ningaloo (red symbols) vs. Tantabiddi to Yardie Creek
(T-Y).
Region T-Y S Ningaloo Average dissimilarity = 82.53
Species Av.Abund Av.Abund Av.Diss Diss/SD Contrib% Cum.%
URCHIN 0.02 1.05 30.32 1.43 36.74 36.74
OTHER 0.39 0.24 14.45 0.90 17.51 54.25
DRUPELLA 0.16 0.33 12.50 0.80 15.14 69.39
CLAM 0.04 0.33 9.51 1.48 11.53 80.92
HOLOTHURIAN 0.16 0.19 9.14 0.89 11.08 92.00
b) Comparisons within regions and sub-regions (Sanctuary vs. Recreation zones) Initial interpretation of spatial patterns using nMDS plots and ANOSIM ( with a group factor of “zoning”) indicated no significant differences in the macroinvertebrate community composition of benthic habitats between management zones for Lighthouse, Jurabi, Tantabiddi, Mangrove Bay, Mandu, Osprey, Turtles or Cape Farquhar Sanctuary zones and their neighbouring recreation zones. However, analyses of zoning data from Coral Bay and South Ningaloo indicated some differences between management zones.
Coral Bay Although no significant differences in the macroinvertebrate community composition in back reef or lagoonal benthic habitats were evident between Maud Sanctuary and adjacent recreation zones, nearshore habitats differed in community composition. Preliminary analysis of spatial patterns using an nMDS plot indicated differences in macroinvertebrate composition

DATA CHAPTERS
56 Habitats and Biodiversity of Ningaloo Lagoon: Biodiversity and Ecology • 1 March, 2011, Version 1.0
of benthic habitats between zones (Figure 36). One-way ANOSIM using “zoning” as a group factor confirmed a considerable (90 % confidence interval) dissimilarity in invertebrate community structure exists between nearshore management zones (average dissimilarity = 79.29, R = 0.444, p = 0.057). Further SIMPER analysis indicated that urchins (37.22 %) were the key species contributing to the dissimilarities in composition between zones with holothurians (18.51 %) also contributing to dissimilarities in community composition (Table 9).
Figure 34 nMDS plot indicating differences in macroinvertebrate composition of nearshore benthic
habitats between sanctuary (S) and recreation (R) zones in the Coral Bay region.
Table 2-9 Management zoning SIMPER results output – Coral Bay (Maud Sanctuary).
Region Sanctuary Rec Average dissimilarity = 79.29
Species Av.Abund Av.Abund Av.Diss Diss/SD Contrib% Cum.%
URCHIN 0.03 1.11 29.51 1.64 37.22 37.22
HOLOTHURIAN 0.03 0.39 14.68 1.64 18.51 55.73
DRUPELLA 0.3 0.16 9.94 1.05 12.54 68.27
OTHER 0.06 0.29 8.53 1.77 10.76 79.03
SOFT CORAL 0.27 0 8.34 0.53 10.51 89.54
South Ningaloo Data analysis of spatial trends using an nMDS plot indicated differences in macroinvertebrate composition of benthic habitats between Gnaraloo Sanctuary and the adjacent recreation zone (Figure 37). One-way ANOSIM using “zoning” as a group factor confirmed that a significant dissimilarity in invertebrate community structure exists between nearshore

DATA CHAPTERS
Habitats and Biodiversity of Ningaloo Lagoon: Biodiversity and Ecology • 1 March, 2011, Version 1.0 57
management zones (average dissimilarity = 81.11, R = 0.67, p = 0.036). Further SIMPER analysis indicated that urchins (32.65 %) were the key species contributing to the dissimilarities in composition between zones with Drupella (20.25 %) and other invertebrates (19.01 %) also contributing to dissimilarities in community composition (Table 10).
Figure 35 nMDS plot indicating differences in macroinvertebrate composition of nearshore benthic
habitats between sanctuary (S) and recreation (R) zones in the Gnaraloo region.
Table 2-10 Management zoning SIMPER results output – Ningaloo south (Gnaraloo Sanctuary).
Region Sanctuary Rec Average dissimilarity = 81.11
Species Av.Abund Av.Abund Av.Diss Diss/SD Contrib% Cum.%
URCHIN 1.05 0.45 26.49 1.38 32.65 32.65
DRUPELLA 0 0.53 16.43 1.17 20.25 52.91
OTHER 0.02 0.41 15.42 1.24 19.01 71.92
SOFT CORAL 0 0.33 9.45 1.11 11.64 83.56
CLAM 0.3 0.24 8.88 1.62 10.94 94.5

DATA CHAPTERS
58 Habitats and Biodiversity of Ningaloo Lagoon: Biodiversity and Ecology • 1 March, 2011, Version 1.0
2.5 Discussion
The Biodiversity and Habitat Mapping project of the Ningaloo Cluster programme has generated significant information about the distribution of habitat types throughout the shallow lagoonal habitats of Ningaloo Marine Park. Surveys were conducted from Red Bluff at the southern-most boundary of the Marine Park to Bundegi in Exmouth Gulf, at the northern limit of the Marine Park. Due to funding constraints the central (Point Cloates) region could not be sampled within this study; however additional sampling will be carried out opportunistically as part of field studies undertaken by PhD candidate Mark Langdon and other studies.
Verification of classification
Verification data was incorporated into the habitat mapping project (see Kobryn, 2010) and will not be discussed further here.
Qualitative measures of biodiversity
Site characteristics Because of the extent and diversity of the Ningaloo Marine Park habitat it was decided to group survey activities into four major regions: North West Cape, Tantabiddi to Yardie Creek, Point Maud to Point Anderson and South Ningaloo. Within each major region, two to four sub-regions were sampled, with specific habitat types (nearshore, lagoon and back reef) sampled depending on their presence or absence. Of these, Tantabiddi to Yardie Creek and Point Maud to Point Anderson have lagoonal habitats; North West Cape and South Ningaloo only have nearshore habitats. The presence or absence of a distinct lagoon environment clearly determines the overall composition of benthic substrate types; the regions without a protected lagoon were overall more exposed to ocean swell and therefore showed greatly reduced biological diversity. Nearshore habitats in these areas were dominated by bare sand and sand-covered limestone pavement; exceptions were small nearshore lagoon areas, as at 3 Mile, in the South Ningaloo region. The more benign conditions within the lagoonal areas in the two central regions within the Ningaloo Marine Park permit the development of extensive coral- and algal-dominated communities. Seagrasses Sampling at several locations along Ningaloo Reef provided evidence of biogeographic differences in species assemblages, with Point Cloates as a biogeographic barrier. Posidonia coriacea and Amphibolis antarctica both grow in large patches in Bateman Bay but do not occur further north than Point Cloates. Posidonia australis was also collected from the drift south of Coral Bay; however without having been observed growing in situ it is possible that this material was washed north from Shark Bay. To date this species has only been recorded to Shark Bay. Further sampling in locations immediately south of Coral Bay would be required to confirm the presence of this species at Ningaloo.

DATA CHAPTERS
Habitats and Biodiversity of Ningaloo Lagoon: Biodiversity and Ecology • 1 March, 2011, Version 1.0 59
With the exception of Thalassia hemprichii and Cymodocea serrulata, many of the tropical seagrasses are distributed throughout the Ningaloo Marine Park and have broad distributions
along the central west coast of WA. Halophila ovalis occurs to Cape Leeuwin, Syringodium isoetifolium is found to Perth, Halophila spinulosa and Halodule uninervis are found to Dongara. Further sampling is required in the northern Bateman Bay / Point Cloates region to confirm range limits of several species.
Sponges and Soft Corals Sampling at sites in the south (Gnaraloo region) and north (Tantabiddi region) of the Ningaloo Marine Park produced a total of 36 species of sponges and 9 soft corals. There was little overlap of species from the two sampling locations, showing clear biogeographical separation between northern and southern populations. Only three sponges and one soft coral were found to occur in both regions of Ningaloo. Most species were rarely encountered, with 27 sponges and six soft corals having five or less individuals recorded from all stations; however destructive sampling of coral thickets was not carried out and additional cryptic species of sponges might be expected to be found in a more thorough survey. Additional sampling of sponges and soft corals has been conducted in the Point Cloates region as part of the C-Reefs series of expeditions. Collections of deep-water sponges and soft corals were made as part of AIMS-led deep-water surveys outside the fringing reef. It has not been possible to further work up the samples or integrate the results of the C-Reefs and offshore sampling programmes with the present Wealth from Oceans Cluster programme due to funding constraints; it is hoped that future funding will permit this work to be carried out and thereby provide a holistic view of sponge and soft coral distribution in the entire Ningaloo region.
Quantitative measures of biodiversity
Sampling of a range of locations across most of the Ningaloo Marine Park has confirmed differences in habitat structure and biogeography and density of key macroinvertebrate species. As described above, gross structural differences in habitats produce markedly different levels of substrate diversity at different locations within the Ningaloo Marine Park, with concomitant differences in abundance and diversity of associated organisms. The exposed habitats of North West Cape and Red Bluff resulted in dominance by urchins with little else present. The more diverse habitats in central Ningaloo locations permit the presence of a variety of other macroinvertebrates. These differences were confirmed using multivariate analysis of macroinvertebrate composition. Comparison of macroinvertebrate composition of the exposed North West Cape region with the lagoon-dominated Tantabiddi-Yardie Creek region confirmed significant differences in invertebrate community structure. This difference was driven largely by differences in urchin populations, which had a markedly higher abundance around North West Cape than in the Tantabiddi-Yardie Creek region. This may be a reflection of the cryptic nature of the dominant urchin species (Echinometra mathaei), which lives within shallow burrows in limestone reef habitats and can therefore tolerate more exposed wave conditions. Similar results were obtained when comparing macroinvertebrate populations in Tantabiddi-Yardie Creek with those from the South Ningaloo region. Again, the more exposed environment characteristic of the unprotected nearshore reefs in the South Ningaloo region was reflected

DATA CHAPTERS
60 Habitats and Biodiversity of Ningaloo Lagoon: Biodiversity and Ecology • 1 March, 2011, Version 1.0
in a significantly greater density of urchins than in the lagoon-dominated Tantabiddi-Yardie Creek region. An important driver of the recent suite of studies conducted at Ningaloo Reef has been the need to obtain appropriate data to support management of the Marine Park. To help examine the effectiveness of sanctuary zones in the protection of reef ecosystems, comparisons of macroinvertebrate communities were made inside and outside sanctuary zones at most locations sampled. While no differences were observed in macroinvertebrate community composition in most sanctuary zones sampled, or for lagoonal and back reef environments, some differences were observed in nearshore environments within the Coral Bay and South Ningaloo regions. Multivariate analysis of the Coral Bay data revealed a difference in macroinvertebrate composition, with urchins driving the observed differences (more urchins were present in the recreation zone). When examining the South Ningaloo region nearshore data urchins again produced the greatest dissimilarity, although in this instance there were more urchins in the sanctuary zone; Drupella and other invertebrates also contributed significantly. These results show there is no clear pattern in macroinvertebrate abundance and density resulting from zonation at this stage. Although urchins have been associated with overgrazing in coral reef ecosystems elsewhere (McClanahan, 1994), they appear not to have a dominant grazing role at Ningaloo Reef. The dominant urchin, Echinometra mathaei, is primarily cryptic and is a relatively insignificant grazer in comparison to herbivorous fish (Webster, 2008).
Summary
The studies undertaken on seagrasses, sponges and soft corals show clear latitudinal differences in distribution, with little overlap of species. This reinforces the concept of a biogeographical discontinuity in the Point Cloates region, resulting in a partial separation of tropical and temperate species. Unfortunately funding constraints precluded sampling in the Point Cloates region as part of this project; PhD candidate Mark Langdon will be undertaking further sampling in this region as part of his studies. Further funding is also required to complete the work on sponges and soft corals; in particular, further work is required on identification of specimens and analysis of affinities between shallow- and deep-water species. Species distributions are complicated by physical oceanographic impacts, seasonal variability and fine-scale habitat requirements. Fine-scale variability in distribution of species therefore places limitations on the effectiveness of remotely-sensed broad scale habitat mapping. This was reinforced by a study examining the use of habitat maps for biodiversity; habitat maps were not a suitable surrogate for either habitat or macroinvertebrate assemblages (McCarthy, 2009). This implies that either a more detailed approach is required to elucidate biodiversity and habitat patterns, or such patterns are too weak to be useful at this scale. This study supports the broad-scale biogeographical separation of Ningaloo Reef into northern and southern regions with tropical and temperate affinities, respectively. This supports observations of oceanographic patterns suggesting tropical waters are diverted offshore during summer at Point Cloates by northerly currents (Woo, 2006).
DATA CHAPTERS
Habitats and Biodiversity of Ningaloo Lagoon: Biodiversity and Ecology • 1 March, 2011, Version 1.0 61
Management implications
The cryptic nature and high diversity of the targeted groups makes it difficult to quantify them and obtain accurate estimates of their diversity. Fine-scale variability of habitats and highly specific habitat preferences by many species makes it difficult to generate any clear patterns from remotely-sensed habitat mapping without extensive ground-truthing. Numerous important taxonomic groups have been omitted from this study to date. Some of these have significant implications for remotely-sensed habitat maps; in particular, seasonal blooms of microphytobenthos occur across broad areas of the Ningaloo lagoons, significantly discolouring the typically white calcareous sands. These blooms can persist for extended periods, up to several months, contributing significantly to lagoonal primary production. The role of microbial organisms in association with corals and coral reef communities is an area receiving considerable scientific attention and may have implications for the resistance of coral reef ecosystems to long-term climatic impacts (Rosenberg et al., 2007). Only minimal work has been carried out to date on the diversity and function of bacteria in the coral reef communities of Ningaloo Reef; the first studies to date are currently underway by PhD candidate Janja Ceh. The role of microbial interactions with coral reef organisms at Ningaloo Reef clearly requires significantly more attention. While it is difficult to produce meaningful fine-scale habitat maps of the Ningaloo Reef system, several conclusions can be drawn from this study. Firstly, there is a clear biogeographic divide between the tropically-influenced northern section of Ningaloo and the more temperately-influenced south. Secondly, this means that the lagoonal environment of Ningaloo Reef cannot be treated as a single undifferentiated ecosystem; there are clear differences in important benthic lagoonal communities, such as the presence of significant seagrass communities in Bateman Bay. Thirdly, seasonal variability may be significant, both in species presence/absence and in ecological impacts. The annual patterns of mass coral spawning and migration of megafauna such as the seasonal arrival of whale sharks at Ningaloo are well known; however the ecological role of less obvious organisms, such as macroalgae and microphytobenthos are poorly understood and require further consideration. We are fortunate to have Ningaloo Reef in Western Australia; a relatively undamaged coral reef not subject to heavy human pressure and with the prospect of strong environmental management, unlike most other reefs around the world. Ningaloo Reef provides us with the opportunity to understand some of the processes that take place in coral reef ecosystems under relatively natural conditions. This is important, as it may allow us to identify ways in which all coral reefs, not just Ningaloo Reef, can resist the inexorable pressures of global climate change.
2.6 Acknowledgements
We thank Kimberley Marrs Ekamper for her help in the field and with some of the preliminary
analysis. We are grateful to Jane Fromont and Oliver Gomez from the WA Museum for
participating in the sponge and soft coral work. Thanks also to our many field assistants who
have cheerfully helped collect these new data on innumerable field trips.

DATA CHAPTERS
62 Habitats and Biodiversity of Ningaloo Lagoon: Biodiversity and Ecology • 1 March, 2011, Version 1.0
2.7 References
Abdo, D., Burgess, S., Coleman, G. and Osborne, K. (2004) Surveys of benthic reef communities using underwater video. Long-term monitoring of the Great Barrier Reef Standard Operating Procedure No. 2. Australian Institute of Marine Science, Townsville.
CALM (2005) Management Plan for the Ningaloo Marine Park and Muiron Islands Marine Management Area 2005 - 2015. Department of Conservation and Land Management, Perth, Western Australia.
Cassata, L. and Collins, L. B. (2008) Coral Reef Communities, Habitats, and Substrates in and near Sanctuary Zones of Ningaloo Marine Park. Journal of Coastal Research, 24, 139-151.
Clarke, K. R. and Warwick, R. M. (2001) Change in marine communities: an approach to
statistical analysis and interpretation, 2nd edition, PRIMER-E: Plymouth.
English, S., Wilkinson, C. and Baker, V. J. (1994) Survey manual for tropical marine resources, ASEAN-Australian Marine Science Project: Living Coastal Resources, Australian Institute of Marine Science, Townsville.
Fromont, J. and Gomez, O. (2010) Sponges and soft corals of Ningaloo Lagoon: Gnaraloo and
Tantabiddi regions. WA Museum, Perth (unpublished report).
Kobryn, H. T. (2010) Cluster report – need full reference.
McCarthy, A.R. (2009) Mapping coral reef biodiversity, surrogacy at two levels. University of Queensland, Brisbane (unpublished Honours thesis).
McClanahan, T.R. (1994) Kenyan coral reef lagoon fish: effects of fishing, substrate complexity,
and sea urchins. Coral Reefs, 13, 231-241. McDonald, A.J. (2007) Marine benthic habitat mapping at Rottnest Island: implications of
sampling scale when linking field ecology and remote sensing. Murdoch University, Perth (unpublished Honours thesis).
Rosenberg, E. , Koren, O., Reshef, L., Efrony, R. and Zilber-Rosenberg, I. (2007) The role of
microorganisms in coral health, disease and evolution. Nature Reviews Microbiology, 5, 355-362.
Simpson, C.J., Cary, J.L. and Masini, R.J.. (1993) Destruction of corals and other reef animals by
coral spawn slicks on Ningaloo Reef, Western Australia. Coral Reefs, 12, 185-191. Scheffers, S.R., Scheffers, A., Kelletat, D. and Bryant, E.A. (2008) The Holocene paleo-tsunami
history of West Australia. Earth and Planetary Science Letters, 270, 137-146. Turner, S.J. (1994a) The biology and population outbreaks of the corallivorous
gastropod Drupella on Indo-Pacific reefs. Oceanography and Marine Biology Annual

DATA CHAPTERS
Habitats and Biodiversity of Ningaloo Lagoon: Biodiversity and Ecology • 1 March, 2011, Version 1.0 63
Reviews, 32, 461-530.
Turner, S.J. (1994b) Spatial variability in the abundance of the corallivorous gastropod Drupella cornus. Coral Reefs, 13, 41-48.
Van Keulen, M., Loneragan, N., Skilleter, G., Langdon, M., Marrs, K., Pinnel, N., Kobryn, H. T.
and Beckley, L. E. (2008) Habitats and Biodiversity of Ningaloo Reef Lagoon, Western Australia. 11th International Coral Reef Symposium. Ft. Lauderdale, Florida.
van Schoubroeck P and Long S (2007) Disturbance history of coral reef communities in Bill’s Bay, Ningaloo Marine Park, 1989-2007. Data Report: MSP-2007_06. Marine Science Program, Department of Environment and Conservation, Perth, Western Australia (unpublished report).
F. Webster, F. (2008) Coral reef resilience: balancing production and herbivory. Unpublished
PhD. Thesis. Perth: Murdoch University. Westera, M., Lavery, P. and Hyndes, G. (2003) Differences in recreationally targeted fishes
between protected and fished areas of a coral reef marine park. Journal of Experimental Marine Biology and Ecology, 294, 145-168.
Woo, M., Pattiaratchi, C. and Schroeder, W. (2006) Dynamics of the Ningaloo Current off Point
Cloates, Western Australia. Marine and Freshwater Research, 57, 291-301.

APPENDIX A – SPONGES AND SOFT CORALS OF NINGALOO LAGOON: GNARALOO AND TANTABIDDI REGIONS.
64 Habitats and Biodiversity of Ningaloo Lagoon: Biodiversity and Ecology • 1 March, 2011, Version 1.0
APPENDIX A – SPONGES AND SOFT CORALS OF NINGALOO
LAGOON: GNARALOO AND TANTABIDDI REGIONS.
Fromont, J., Gomez, O. Western Australian Museum, Locked Bag 49, Welshpool DC, Western Australia 6986, Australia. [email protected]
SUMMARY Quantitative surveys documenting the diversity and abundance of sponges and soft corals at Gnaraloo and Tantabiddi regions, Ningaloo Marine Park, were conducted in September and November 2009. Five lagoon habitats (intertidal reefs, coral patch reefs, shallow back reefs, subtidal pavements and macroalgal dominated habitats) were surveyed by recording numbers of sponge individuals and soft coral colonies on replicate transects, providing baseline data on sponge and soft coral species present and their abundance. In total 36 sponge and 9 soft coral species were recorded from these regions. The majority of the sponge species found (33) were unique to one of the regions, 11 species were only recorded from Gnaraloo and 22 only from Tantabiddi. Only 3 sponge species were common to both regions. The majority of the soft coral species (8) were also unique to one of the regions with 5 species only recorded from Gnaraloo and 3 only from Tantabiddi. Only 1 soft coral species was common to both regions. These results suggest a clear difference in the composition of the sponge and soft coral assemblages between Gnaraloo and Tantabiddi lagoons. Many of the species were infrequently recorded (rare) species. Twenty seven of the sponge and 6 of the soft coral species were rare, having five or fewer individuals recorded from all stations in the study. The species have been identified to lowest taxonomic units (OTUs) until time and funding are available to match the sponges collected in this project to those collected from shallow waters off Ningaloo Station (CReefs project), and the deeper water fauna collected during a WAMSI node 3 project. It will also be essential to examine the historic Indian Ocean literature to determine full species identifications. This is the first documentation of the sponge and soft coral faunas occurring in the shallow waters of Ningaloo Marine Park.
A.1 Introduction
The distribution and abundance of sponge and soft coral species in the shallow lagoonal waters of Ningaloo Marine Park have never been studied. This project, funded by the Ningaloo Cluster, aimed to record the distribution and abundance of these taxa from the southern park region of Gnaraloo and the northern region around Tantabiddi. The central section of the park was examined in a parallel study funded by CReefs in May 2009 based out of Ningaloo Station. The sponges of the marine park in depths of 18 to 144 metres were examined during a WAMSI project in collaboration with the Australian Institute of Marine Science (AIMS) and the Western Australian Museum (WAM). The sponge and soft coral faunas in depths of greater than 100 metres were collected in a 2005 sampling program in collaboration with CSIRO and

APPENDIX A – SPONGES AND SOFT CORALS OF NINGALOO LAGOON: GNARALOO AND TANTABIDDI REGIONS.
Habitats and Biodiversity of Ningaloo Lagoon: Biodiversity and Ecology • 1 March, 2011, Version 1.0 65
WAM. This current study collecting shallow water species, allows for a cross shelf assessment of the sponges of Ningaloo Marine Park from the intertidal to 800 metres depth. The aims of this study were twofold, firstly to determine the sponge and soft coral species present and their abundance at each of the regions studied. Secondly assemblages were compared between the habitats and regions surveyed to determine if species composition differed significantly between regions or between different habitats. This report documents the field design and collecting methods for the project. Sponge specimens will be compared with the deeper water studies and the CReefs project in the future should funds become available. A paper on the distribution and abundance of the shallow water sponge and soft coral species as a result of this study is proposed.
A.2 Methods
A.2.1 Field sampling methods.
A total of 23 stations were surveyed (13 in the Gnaraloo region and 10 in the Tantabiddi area). Stations were chosen to represent dominant lagoonal habitat types: intertidal reefs, coral patch reefs, shallow back reefs, subtidal pavements and macroalgal dominated habitats. Subtidal station surveys were carried out on SCUBA or snorkel, and intertidal station surveys were carried out by reef walking at low tide. Transect lines (5 x 1 m, n=3, total area 15 m
2)
were laid over the dominant habitat and all sponge individuals and soft coral colonies were counted. Where possible images of each species were taken in situ.
A.2.2 Specimen collection.
A voucher specimen of each sponge and soft coral species was collected: voucher specimens were also collected if there were morphological or colour differences from previous vouchers. Specimens were separated immediately in situ to avoid contamination by mucous exudation from other specimens. After collection, records were made of natural colour, changes in coloration on exposure to air, mucous exudation, and gross morphology for each specimen collected. Specimens were labeled, photographed, and preserved individually in 75 % ethanol. Preliminary sponge and soft coral identifications were undertaken at the end of each survey day by preparing bleach preparations of all specimens collected. These were examined with a Leitz DME compound microscope with a calibrated eyepiece graticule. Details and sizes of spicule and skeletal characters (for sponges) and sclerites (for soft corals) were recorded for comparison with other specimens.

APPENDIX A – SPONGES AND SOFT CORALS OF NINGALOO LAGOON: GNARALOO AND TANTABIDDI REGIONS.
66 Habitats and Biodiversity of Ningaloo Lagoon: Biodiversity and Ecology • 1 March, 2011, Version 1.0
A.3 Results.
General patterns.
Sponges Thirty-six species of sponges were collected from the 23 stations examined (Table 1, 3). The greatest number of species at any station (10) was found at Tantabiddi (TN) station 3, followed by 8 species at TN station 2 and 6 at TN station 5. These were all shallow pavement habitats. Seven stations at Gnaraloo and 1 station at Tantabiddi had no sponges recorded, and 5 of these were coral patch reefs among sand. The three remaining stations that lacked sponges were not coral dominated and were scoured, one was subtidal in the surge zone at Gnaraloo (GN stn 3) and two were intertidal (GN 11 & 13). The remaining stations examined had between 1 and 5 sponge species present. Twenty seven of the sponge species were rare, having five or fewer individuals recorded from all stations in the study. A few sponge species were common. Clathrinida sp. J6 had 35 individuals at GN stn 9, the deepest limestone pavement habitat sampled in the study. Spirastrella NR3 was common at TN stns 3, 5 and 7 with 20, 13 and 20 individuals present in 15 m2 respectively. These stations were shallow pavement habitats. The massive ochre cup sponge, Rhabdastrella globostellata, was found at both Gnaraloo and Tantabiddi with highest numbers at TN stns 1 and 8 (12 and 11 individuals respectively). Both stations were coral patch reef habitats. Other species with fewer numbers, but more than 5 individuals were: Haliclona cymaeformis, Iotrochota cf. coccinea and Aka sp TB1. This study found a large number of the species were only found in 1 of the regions. Eleven species were recorded only at Gnaraloo and 22 only at Tantabiddi. Therefore a total of 33 species were unique to one of the areas examined and only 3 species were widespread and common to both areas. Of the 36 species of sponges collected only 7 species could be fully identified with the basic laboratory techniques used (Table 1), and a further 8 species were assigned to a known species but require comparison with type material (signified as cf. in Table 1). The remaining 21 species were only able to be assigned to a genus and given a species number. These are most likely poorly known species described in old taxonomic literature or are new to science. The 36 species recorded were assigned to 29 genera and 22 families of the Demospongiae and 2 belonged to the Class Calcarea (Table 1).
Soft Corals Nine species of soft corals were collected from the 23 stations examined (Table 2, 3). Soft coral species were poorly represented at all stations with 1 or 2 species occurring at 15 stations and no soft corals reported at the remaining 8 stations. Unlike sponges, soft corals were usually found on coral patch reefs, and occasionally on some of the shallow limestone pavement habitats. Four of the 13 stations at Gnaraloo and 4 of the 10 stations at Tantabiddi lacked soft coral species. Six of the soft coral species were rare, having five or fewer individuals recorded from all stations in the study. The remaining three species were more common. Klyxum 5328 had 33,

APPENDIX A – SPONGES AND SOFT CORALS OF NINGALOO LAGOON: GNARALOO AND TANTABIDDI REGIONS.
Habitats and Biodiversity of Ningaloo Lagoon: Biodiversity and Ecology • 1 March, 2011, Version 1.0 67
16 and 10 colonies in 15 m2
at GN stn 6, 8 and 13 respectively. The former 2 stations were coral patch reef and the latter intertidal pavement. Sinularia 5331 had 11 colonies at GN stn 7, a shoreline pavement habitat, and Sinularia 5333 had 23 and 30 colonies respectively at TB stn 4 and 8, both coral patch reefs. The majority of the soft coral species (8) were also unique to one of the regions with 5 species only recorded from Gnaraloo and 3 only from Tantabiddi with 1 species, Sinularia 5333, found at both locations. Of the 9 species of soft corals collected only 1 species could be fully identified and the remaining 8 species require detailed taxonomic research beyond the scope of this study. The 9 soft coral species were assigned to 6 genera from 3 families (Table 2).
A.4 Discussion.
This study has found relatively low species diversity of sponges and soft corals in shallow water habitats in Gnaraloo and Tantabiddi lagoons. Some cryptic species in coral patch reef habitats may not have been seen and consequently not collected, as destructive sampling of coral thickets was not undertaken. Small sponges and soft corals can occur in coral thickets and can be missed if damage to corals is minimized which was the method adopted here. Diversity of sponges was higher than soft corals with 36 species of sponges collected compared to 9 species of soft corals. A significant finding for both sponges and soft corals was that very few species were found at both Gnaraloo and Tantabiddi (3 species of sponges and 1 soft coral species). Two explanations are possible: 1) that species did occur at both sites but because they were rare they were not detected with the sampling regime used or 2) different assemblages occurred in the two locations. It would be of value to examine current regimes within these lagoons to determine if they entrain recruits, thereby restricting gene flow to inside the lagoons. It would also be useful to compare these results with other phyla to see if different species assemblages occur in other taxa in these lagoons. In addition, comparison of the species found in this study with those in Ningaloo lagoon would determine if some species were found in this third lagoon, or it also contained unique species assemblages. In Gnaraloo Bay large numbers of individuals of Clathrinida sp J6 were found on deep limestone pavement (12.6 metres depth). This species is common in Jurien Bay southwards suggesting it is a temperate species. It was not found at the more northward Tantabiddi stations. In contrast, the tropical Indo-Pacific species, Neopetrosia exigua, was found north of Cape Faraquar (Gnaraloo region) but not to the north in Tantibiddi. Possibly Gnaraloo has some overlap of faunas with sponges of a tropical and more temperate origin occurring in this region. In the Tantabiddi lagoon some tropical Indo-Pacific species were common, e.g. Haliclona cymaeformis, the small ramose branching sponge that occurs in symbiosis with a macroalgae. Three dark coloured sponges were abundant on shallow limestone pavements around Tantabiddi: the dark purple encrusting Iotrochota cf. coccinea, the dark brown burrowing sponge Aka sp TB1, and the dark brown bioeroding sponge Spirastrella NR3. The dark colouration of these species may offer some protection against predators or high light, and their cryptic habit would prevent damage during high turbulence. In general most sponge and soft coral species were rare and only a few were common. At some stations soft corals dominated the benthic cover and this was particularly evident at TB

APPENDIX A – SPONGES AND SOFT CORALS OF NINGALOO LAGOON: GNARALOO AND TANTABIDDI REGIONS.
68 Habitats and Biodiversity of Ningaloo Lagoon: Biodiversity and Ecology • 1 March, 2011, Version 1.0
stn 8 (Turquoise Bay). Many colonies were also found in patches among coral thickets at TB stn 4 (Mangrove Bay back reef). Sinularia 5333 was the predominant species at both these stations forming extensive monospecific stands in Turquoise Bay. Sponges did not dominate benthic cover to the same extent as some species of soft corals, although Rhabdastrella globostellata, a massive cup sponge, was common on some coral patch reefs, for example TB stns 1 and 8, Tantabiddi lagoon mooring and Turquoise Bay respectively. Soft coral species were found mainly on coral patch reef and abundance of colonies was highest in this habitat, while sponges occurred mainly in pavement habitats within the lagoons.
A.5 Acknowledgements
We thank the Ningaloo Cluster and Dr. Mike van Keulen, Murdoch University for supporting and funding this research project. Many thanks to Mike van Keulen and Mark and Pam Langford for overseeing the smooth operation of the fieldtrips and logistics, and their helpful assistance in the field. We thank Dr Monika Schlacher, Queensland Museum for identifying the soft corals.

APPENDIX A – SPONGES AND SOFT CORALS OF NINGALOO LAGOON: GNARALOO AND TANTABIDDI REGIONS.
Habitats and Biodiversity of Ningaloo Lagoon: Biodiversity and Ecology • 1 March, 2011, Version 1.0 69
Table A-1 summary of sponge species found.
No. of stations No. of individuals
Class Demospongiae:
Gnaraloo Tantabiddi Total station Gnaraloo Tantabiddi
Total individuals
Family Species GN1-13 TB1-10 sightings
Ancorinidae Rhabdastrella globostellata 2 3 5 6 29 35
Tetillidae Cinachyra cf isis 0 1 1 0 6 6
Chondrillidae Chondrilla australiensis Carter, 1873 0 2 2 0 2 2
Clionaidae Cliona cf orientalis Thiele, 1900 0 1 1 0 3 3
Hemiasterella sp 1 0 1 1 0 1
Spirastrella NR3 0 4 4 0 56 56
Spirastrella TB1 0 1 0 0 1 2
Terpios cf symbioticus 1 0 1 2 0 2
Axinellidae Cymbastela sp. 1 1 2 1 1 2
Halichondriidae Topsentia cf halichondriodes 0 1 1 0 1 1
?Amorphinopsis sp 1 1 0 1 1 0 1
Amorphinopsis cf excavans 0 1 1 0 1 1
Hymeniacidon TB1 0 1 1 0 1 1
Coelosphaeridae Coelocarteria singaporense 0 1 1 0 1 1
Crellidae Crella (Yvesia) cf. spinulata (Hentschel, 1911) 1 0 1 1 0 1
Chondropsidae Chondropsis sp G1 1 0 1 4 0 4
Myxillidae Iotrochota cf. coccinea (Carter, 1886) 0 4 4 0 19 19
Microcionidae Clathria (Thalysias) reinwardti Vosamer, 1880 0 3 3 0 3 3
Tedaniidae Tedania TB1 0 1 1 0 2 2
Mycalidae Mycale TB1 0 1 1 0 2 2
Rhabderemiidae Rhabderemia TB1 0 1 1 0 1 1
Chalinidae Haliclona cymaeformis (Esper, 1794) 0 4 4 0 22 22
Haliclona (Reniera) TB1 0 2 2 0 7 7
Haliclona (Haliclona) TB1 0 2 2 0 5 5
Niphatidae Amphimedon cf paraviridis Fromont, 1993 1 1 2 2 1 3
Petrosiidae Neopetrosia exigua (Kirkpatrick, 1900) 1 0 1 7 0 7

APPENDIX A – SPONGES AND SOFT CORALS OF NINGALOO LAGOON: GNARALOO AND TANTABIDDI REGIONS.
70 Habitats and Biodiversity of Ningaloo Lagoon: Biodiversity and Ecology • 1 March, 2011, Version 1.0
Phloeodictyidae Aka TB1 0 3 3 0 33 33
Spongiidae Spongia (Spongia) TB1 0 2 2 0 4 4
Coscinoderma 2 0 2 3 0 3
Irciniidae Ircinia cf. 0 1 1 0 1 1
Sarcotragus spNW1 1 0 1 1 0 1
Dysideidae Lamellodysidea herbacea (Keller, 1889) 1 0 1 2 0 2
Aplysinidae Aplysina TB1 0 1 1 0 5 5
?Aplysina TB2 0 2 2 0 2 2
Class Calcarea: Clathrinida sp J6 1 0 1 35 0 35
Calcarea spNR3 pink encrusting 1 0 1 1 0 1
Total number of species 36
Table A-2 Summary of soft coral species found.
No. of stations No. of individuals
Gnaraloo Tantabiddi total station Gnaraloo Tantabiddi Total individuals
Family Species GN1-13 TB1-10 sightings
Alcyoniidae Klyxum 5328 4 0 4 64 0 64
Cladiella 5330 1 0 1 1 0 1
Lobophytum 5335 0 1 1 0 5 5
Lobophytum 5336 0 1 1 0 5 5
Sinularia 5331 1 0 1 11 0 11
Sinularia 5332 3 0 3 8 0 8
Sinularia 5333 2 3 5 3 56 59
Nephtheidae Chromonephthea exosis Oefwegen, 2005 1 0 1 1 0 1
Briareidae Briareum 5334 0 1 1 0 1 1
Total number of species 9

APPENDIX B – THE ROLE OF SEA URCHINS IN NINGALOO REEF: KEY POINTS TO DATE.
Habitats and Biodiversity of Ningaloo Lagoon: Biodiversity and Ecology • 1 March, 2011, Version 1.0 71
APPENDIX B – THE ROLE OF SEA URCHINS IN NINGALOO
REEF: KEY POINTS TO DATE.
Langdon, M.W. School of Biological Sciences & Biotechnology, Western Australia 6150, Australia. [email protected]
The presence or absence of a distinct lagoon environment determines the overall composition
of benthic substrate types within each region, which in turn determines habitat structure and
density of key macroinvertebrates.
Conditions within the sheltered lagoonal areas in the Ningaloo Marine Park permit the
development of extensive coral and algal-dominated communities, whereas regions
without a protected lagoon were more exposed to ocean swell and therefore showed
greatly reduced biological diversity.
The Coral Bay data revealed a difference in macroinvertebrate composition between
management zones, with urchins driving the observed differences (more urchins were
present in the recreation zone).
The South Ningaloo region data produced the greatest dissimilarity in
macroinvertebrate composition between management zones, although in this instance
there were more urchins in the sanctuary zone; Drupella and other invertebrates also
contributed significantly.
These results show there is no clear pattern in macroinvertebrate abundance and
density resulting from zonation at this stage.