Biodegradability of wastewater and activated sludge ...
13
Biodegradability of wastewater and activated sludge organics in anaerobic digestion D.S. Ikumi, T.H. Harding, G.A. Ekama* Water Research Group, Department of Civil Engineering, University of Cape Town, Rondebosch, 7700 Cape, South Africa article info Article history: Received 10 October 2013 Received in revised form 21 December 2013 Accepted 2 February 2014 Available online 28 February 2014 Keywords: Municipal wastewater Unbiodegradable particulate or- ganics Primary sludge Activated sludge Endogenous residue Anaerobic digestion Plant wide modelling abstract The investigation provides experimental evidence that the unbiodegradable particulate organics fractions of primary sludge and waste activated sludge calculated from activated sludge models remain essentially unbiodegradable in anaerobic digestion. This was tested by feeding the waste activated sludge (WAS) from three different laboratory activated sludge (AS) systems to three separate anaerobic digesters (AD). Two of the AS systems were Modified Ludzack e Ettinger (MLE) nitrification-denitrification (ND) systems and the third was a membrane University of Cape Town (UCT) ND and enhanced biological P removal system. One of the MLE systems and the UCT system were fed the same real settled wastewater. The other MLE system was fed raw wastewater which was made by adding a measured constant flux (gCOD/d) of macerated primary sludge (PS) to the real settled wastewater. This PS was also fed to a fourth AD and a blend of PS and WAS from settled wastewater MLE system was fed to a fifth AD. The five ADs were each operated at five different sludge ages (10e60d). From the measured performance results of the AS systems, the unbiodegradable particulate organic (UPO) COD fractions of the raw and settled wastewaters, the PS and the WAS from the three AS systems were calculated with AS models. These AS model based UPO fractions of the PS and WAS were compared with the UPO fractions calculated from the performance results of the ADs fed these sludges. For the PS, the UPO fraction calculated from the AS and AD models matched closely, i.e. 0.30 and 0.31. Provided the UPO of heterotrophic (OHO, f E_OHO ) and phosphorus accumulating (PAO, f E_PAO ) biomass were accepted to be those associated with the death regeneration model of organism “decay”, the UPO of the WAS calculated from the AS and AD models also matched well - if the steady state AS model f E_OHO ¼ 0.20 and f E_PAO ¼ 0.25 values were used, then the UPO fraction of the WAS calculated from the AS models deviated signifi- cantly from those calculated with the AD models. Therefore in plant wide wastewater treatment models the characterization of PS and WAS as defined by the AS models can be applied without modification in AD models. The observed rate limiting hydrolysis/acido- genesis rates of the sludges are listed. ª 2014 Elsevier Ltd. All rights reserved. * Corresponding author. Tel.: þ27 21 650 2585; fax: þ27 21 689 7471. E-mail address: [email protected] (G.A. Ekama). Available online at www.sciencedirect.com ScienceDirect journal homepage: www.elsevier.com/locate/watres water research 56 (2014) 267 e279 http://dx.doi.org/10.1016/j.watres.2014.02.008 0043-1354/ª 2014 Elsevier Ltd. All rights reserved.
Transcript of Biodegradability of wastewater and activated sludge ...
ww.sciencedirect.com
wat e r r e s e a r c h 5 6 ( 2 0 1 4 ) 2 6 7e2 7 9
Available online at w
ScienceDirect
journal homepage: www.elsevier .com/locate/watres
Biodegradability of wastewater and activatedsludge organics in anaerobic digestion
D.S. Ikumi, T.H. Harding, G.A. Ekama*
Water Research Group, Department of Civil Engineering, University of Cape Town, Rondebosch, 7700 Cape,
South Africa
a r t i c l e i n f o
Article history:
Received 10 October 2013
Received in revised form
21 December 2013
Accepted 2 February 2014
Available online 28 February 2014
Keywords:
Municipal wastewater
Unbiodegradable particulate or-
ganics
Primary sludge
Activated sludge
Endogenous residue
Anaerobic digestion
Plant wide modelling
* Corresponding author. Tel.: þ27 21 650 258E-mail address: [email protected]
http://dx.doi.org/10.1016/j.watres.2014.02.0080043-1354/ª 2014 Elsevier Ltd. All rights rese
a b s t r a c t
The investigation provides experimental evidence that the unbiodegradable particulate
organics fractions of primary sludge and waste activated sludge calculated from activated
sludge models remain essentially unbiodegradable in anaerobic digestion. This was tested
by feeding the waste activated sludge (WAS) from three different laboratory activated
sludge (AS) systems to three separate anaerobic digesters (AD). Two of the AS systems were
Modified Ludzack e Ettinger (MLE) nitrification-denitrification (ND) systems and the third
was a membrane University of Cape Town (UCT) ND and enhanced biological P removal
system. One of the MLE systems and the UCT system were fed the same real settled
wastewater. The other MLE system was fed raw wastewater which was made by adding a
measured constant flux (gCOD/d) of macerated primary sludge (PS) to the real settled
wastewater. This PS was also fed to a fourth AD and a blend of PS and WAS from settled
wastewater MLE system was fed to a fifth AD. The five ADs were each operated at five
different sludge ages (10e60d). From the measured performance results of the AS systems,
the unbiodegradable particulate organic (UPO) COD fractions of the raw and settled
wastewaters, the PS and the WAS from the three AS systems were calculated with AS
models. These AS model based UPO fractions of the PS and WAS were compared with the
UPO fractions calculated from the performance results of the ADs fed these sludges. For the
PS, the UPO fraction calculated from the AS and AD models matched closely, i.e. 0.30 and
0.31. Provided the UPO of heterotrophic (OHO, fE_OHO) and phosphorus accumulating (PAO,
fE_PAO) biomass were accepted to be those associated with the death regeneration model of
organism “decay”, the UPO of the WAS calculated from the AS and AD models also
matched well - if the steady state AS model fE_OHO ¼ 0.20 and fE_PAO ¼ 0.25 values were
used, then the UPO fraction of the WAS calculated from the AS models deviated signifi-
cantly from those calculated with the AD models. Therefore in plant wide wastewater
treatment models the characterization of PS and WAS as defined by the AS models can be
applied without modification in AD models. The observed rate limiting hydrolysis/acido-
genesis rates of the sludges are listed.
ª 2014 Elsevier Ltd. All rights reserved.
5; fax: þ27 21 689 7471.(G.A. Ekama).
rved.
List of abbreviations
AD Anaerobic digestion
ADM1 Anaerobic digestion models No 1
AS Activated sludge
ASM1, 2, 2d Activated sludge models No 1, 2 and 2d
BPO Biodegradable particulate organics
BSM2 Benchmark simulation model No 2
BSO Biodegradable soluble organics
COD Chemical oxygen demand
d Day
DSVI Diluted sludge volume index
EBPR Enhanced biological phosphorus removal
F Filtered
F-BSO Fermentable biodegradable soluble organics
FSA Free and saline ammonia
g gram
ISS Inorganic suspended solids
l Litre
m Metre
MLE Modified Ludzack-Ettinger system
N Nitrogen
ND Nitrification-denitrification
OHO Ordinary heterotrophic organism
OUR Oxygen utilization rate
P Phosphorus
OP Ortho-phosphate
PAO Phosphorus accumulating organisms
PP Polyphosphate
PS Primary sludge
pH Negative log of the hydrogen ion activity
SRT Solids retention time (or sludge age)
TKN Total Kjeldahl nitrogen
TP Total phosphorus
TSS Total suspended solids
UCT University of Cape Town
UF Unfiltered
UPO Unbiodegradable particulate organics
USO Unbiodegradable soluble organics
VFA Volatile fatty acids
VSS Volatile suspended solids
WAS Waste activated sludge
WRC Water Research Commission
WW Wastewater
WWTP Wastewater treatment plant
List of symbols1
b, /d general parameter for endogenous respiration
rate
E, � Proportion of influent COD flux (gCOD/d) exiting
system as sludge production (gCOD/d)
fE, e general parameter for unbiodegradable fraction of
biomass
fCOD_VSS, gCOD/gVSS COD content of organics (COD/VSS
ratio, fcv)
fOHO_VSS, gVSS/gVSS OHO/VSS ratio of activated sludge
(¼XOHO/XVSS, fav)
fxE_OHO, e OHO unbiodegradable fraction associated with
endogenous respiration in steady state ND AS
model (¼0.20, fEH)
f’xE_OHO, e OHO unbiodegradable fraction associated with
death regeneration in dynamic ASM1 (¼0.08,
f0EH)fxE_PAO, e PAO unbiodegradable fraction associated with
endogenous respiration in steady state NDEBPR
AS model (¼0.25, fEG)
f0xE_PAO, e PAO unbiodegradable fraction when assigned
the same value as OHOs associated with death
regeneration (¼0.08, f’EG)
fP_VSS, gP/gVSS Phosphorus content of particulate organics
or biomass (fp)
fxU,CODInf, gCOD/gCOD fraction of influent total COD that is
unbiodegradable and particulate
(fS0up)fSU,CODInf, gCOD/gCOD fraction of influent total COD that is
unbiodegradable and soluble (fS0us)kh, /d Specific hydrolysis/acidogenesis rate of BPO in AD
kH, gCOD/(l.d) First order specific hydrolysis/acidogenesis
rate of BPO in AD
km, gCOD/gCOD/d Maximum BPO hydrolysis/acidogenesis
rate in AD in Monod kinetics in AD
kM, gCOD/gCOD/d Maximum BPO hydrolysis/acidogenesis
rate in AD in saturation kinetics in AD
Ks, gCOD/l Half saturation concentration for BPO
hydrolysis/acidogenesis in Monod kinetics in
AD
KS, gCOD/l Half saturation concentration for BPO
hydrolysis/acidogenesis in saturation kinetics
in AD
rhyd, gCOD/(l.d) Volumetric BPO hydrolysis rate in AD
XB,Eff, mgCOD/l effluent biodegradable particulate COD
concentration (Sbpe)
XB,Inf, mgCOD/l influent biodegradable particulate COD
concentration (Sbpi)
SB,Inf, mgCOD/l influent biodegradable soluble COD
concentration (Sbsi)
XU,Eff, mgCOD/l effluent unbiodegradable particulate COD
concentration (Supe)
1 As recommended by Corominas et al. (2010) with the UCTequivalent given in brackets for easy cross reference to the paperson the AS and AD steady state models in the old units.
wat e r r e s e a r c h 5 6 ( 2 0 1 4 ) 2 6 7e2 7 9268
1. Introduction
In plant wide modelling, a question that arises is “do organics
that are unbiodegradable in the activated sludge (AS) system,
namely, the unbiodegradable particulate organics (UPO, XU,Inf)
XU,Inf, mgCOD/l influent unbiodegradable particulate COD
concentration (Supi)
SU,Inf, mgCOD/l influent unbiodegradable soluble COD
concentration (Susi)
CODT,Eff, mgCOD/l effluent total COD concentration (Ste)
CODT,Inf, mgCOD/l influent total COD concentration (Sti)
XAFO, mgCOD/l Acid forming organism (AFO)
concentration in AD (ZAD)
XOHO, mgCOD/l Ordinary heterotrophic organism (OHO)
concentration (ZBH)
XOHO,VSS, mgVSS/l Ordinary heterotrophic organism (OHO)
concentration (XBH)
XU,E,OHO,mgCOD/l OHOendogenous residue concentration
(ZEH)
XU,E,OHO,VSS, mgVSS/l OHO endogenous residue
concentration (XEH)
XPAO, mgCOD/l Phosphorus accumulating organism (PAO)
concentration (ZBG)
XPAO,VSS, mgVSS/l Phosphorus accumulating organism
(PAO) concentration (XBG)
XU,E,PAO, mgCOD/l PAO endogenous residue concentration
(ZEG)
XU,E,PAO,VSS, mgVSS/l PAO endogenous residue
concentration (XEG)
XU,Reac, mgCOD/l Unbiodegradable particulate COD
concentration originating from the
influent in the reactor (ZI)
XU,Reac,VSS, mgVSS/l Unbiodegradable particulate VSS
concentration originating from the
influent in the reactor (XI)
XVSS, mgCOD/l volatile solids concentration in COD units
(Zv)
XVSS,VSS, mgVSS/l volatile solids concentration in VSS
units (Xv)
Y, gCOD/gCOD biomass yield coefficient
m, e micrometre (10�6 m)
wat e r r e s e a r c h 5 6 ( 2 0 1 4 ) 2 6 7e2 7 9 269
from the influentwastewater and endogenous residue (XU,E) of
the biomass, remain unbiodegradable in the anaerobic
digester (AD)?”. This question has been asked for a long time.
Gossett and Belser (1982) fed waste activated sludge (WAS)
grown on synthetic wastewater to AD systems. While they
concluded that the endogenous residue of the ordinary het-
erotrophic organisms (OHO) remained unbiodegradable in the
AD, their value determined for the endogenous residue frac-
tion of the OHOs (fE_OHO ¼ 0.37) differed significantly from that
used in AS models for real wastewater, i.e. fE_OHO ¼ 0.20 in
endogenous respiration based steady state models, or equiv-
alently, f’E_OHO ¼ 0.08 in death-regeneration based dynamic
models. van Haandel et al. (1998) grew AS on real domestic
wastewater in a 2 d retention time aerated lagoon and
decreased itsOHOactive fractionwith respect to VSS (fOHO_VSS)
by aerobic digestion at different retention times before feeding
it to ADs. They concluded from an empirical graphical proce-
dure that about 15% of the OHO endogenous residue was
degraded in AD. Ekama et al. (2006a,b) evaluated the Van
Haandel data and a limited data set of their ownwith themass
balanced steady state AD model of Sotemann et al. (2005) and
concluded that theunbiodegradableparticulate organics (UPO)
from the influentwastewater (XU,Inf) and the OHO endogenous
residue (XU,E,OHO) remain unbiodegradable in the AD. Based on
this experimental evidence, it was accepted in benchmark
simulation model no 2 (BSM2, Jeppsson et al., 2006) and the
steady state plant wide model of Ekama (2009), that the or-
ganics that are unbiodegradable in the AS system remain
unbiodegradable in AD. However, an experimental investiga-
tion with real wastewater that examines this in a compre-
hensive and integrated plant wide set-up appears not to have
been done yet.
2. Objectives
In the development of plant wide wastewater treatment plant
(WWTP) models, considerations for including phosphorus (P)
have commenced, e.g. linking ASM2 or ASM2d to ADM1
(Jeppsson et al., 2013). This opens a range of challenging issues
in wastewater treatment plant (WWTP) modelling recently
summarized by Vanrolleghem et al. (2014), e.g. upgrading
ADM1 from two (aqueous-gas) to three phases (aqueous-gas-
solid) to model mineral precipitation in the AD and elsewhere
in the WWTP e this not only requires a comprehensive eval-
uation of ADM1 but also of the modelling of the physico-
chemical phenomena associated with mineral precipitation
(Batstone et al., 2012; Tait et al., 2012).
To investigate mineral precipitation in AD, a plant wide
investigation with real wastewater was undertaken by Ikumi
et al. (2011), which also provided the data to revisit the issue
of the biodegradability of wastewater and AS organics. This
paper describes this plant wide experimental set-up and
focusses on the biodegradability of PS and AS organics in AD.
The results of including P andmineral precipitation in ADwill
be presented in subsequent papers.
3. Methods and materials
3.1. Plant wide experimental system layout andoperation
The experimental layout comprised three laboratory AS
systems and five ADs (Fig 1). Two of the AS systems were
Modified Ludzack e Ettinger (MLE) nitrification-
denitrification (ND) systems and the third was a membrane
University of Cape Town (UCT) ND and enhanced biological P
removal (EBPR) system. One of the MLE systems (MLE1) and
the UCT system were fed the same real screened (1 mm
mesh) settled wastewater, which was collected from the
Mitchells Plain WWTP (Cape Town, South Africa) in 1.2 m3
batches. The other MLE system (MLE2) was fed raw waste-
water which was made by adding a measured constant flux
(7.2 gCOD/d) of macerated primary sludge (PS) to the
collected settled wastewater. The waste activated sludge

17.5 l/day
(Raw WW)
Sti=1000mg/l
AD 1NDBEPR WAS
15 l
AD 5 ND WAS
15 l
AD 3ND WAS
15 l
Effluent
AD 4PS-WAS Blend
15 l
AD 2 (PS)15 l
150 l/day
(Settled WW)
Sti= 800mg/l
36 l/day
(Settled WW)
Sti = 600mg/l
Raw WW
PS
Sewage Activated Sludge & PST ADs
Settled WW
PST
Aerobic Zone
32 l
Anoxic Zone
Anaerobic Zone19 l
-Re-Aera-tion3 l
3:
1
1.2:1
UCT NDBEPR
:
40%COD Removal
Effluent
Aerobic Zone 16.2 l
Anoxic Zone 6.2 l
SST2:1
1:1
MLE 1: Fed settled WW
Effluent
Aerobic Zone
16.2 l
Anoxic Zone6.2 l
SST2:1
1:1
MLE 2: Fed raw WW
SST
21 l
Fig. 1 e Experimental set-up for the investigation.
wat e r r e s e a r c h 5 6 ( 2 0 1 4 ) 2 6 7e2 7 9270
(WAS) from the MLE1, MLE2 and UCT systems was fed to
AD3, AD5 and AD1 respectively. The same PS used to make
the rawwastewater was fed to AD2 and a blend of this PS and
WAS from MLE1 was fed to AD4.
The design and operating parameters of the AS systems are
given in Table 1. To increase the P removal in the UCT system,
200 mgCOD/l acetate and 40 mgP/l of potassium dihydrogen
phosphate (KH2PO4) were dosed to its settledwastewater feed.
For each AD1 to AD5, there was one large (AD1L to AD5L, 20 l)
and one small (AD1S to AD5S, 5 l) digester. The five large ADs
were operated at 4 different sludge ages during the investi-
gation, viz. 10, 18, 25 and 40 d, and the five small ADs only at
60 d. The small ADs were operated in parallel with the large
ones so that they could reach steady state while the large ADs
were tested.
3.2. Control and monitoring of activated sludge (AS)systems
The three AS systems were operated with hydraulic control of
sludge age by withdrawing the required volume of mixed li-
quor (including samples) directly from the aerobic reactor to
establish 10 d sludge age in all three systems (Table 1). This
waste activated sludge (WAS) was retained for feeding to the
ADs (and for the UCT system WAS, also to anoxic-aerobic di-
gesters, which will be presented in subsequent papers). No
attempt was made to control the AS systems’ aerobic reactor
TSS concentrations, which adopted their own value in
response to the established sludge age and feed wastewater
fluxes and characteristics (Ekama, 2010). Every second day,
the three systems were monitored by measuring the param-
eters listed in Table 2 and the recycle flow rates checked.
Each 1.2 m3 wastewater (WW) batch lasted 2e3 weeks,
which was accepted to represent a steady-state period. This
was necessary because the TKN/COD ratio of some consecu-
tive wastewater batches were significantly different. The re-
sults measured every second day over a wastewater batch
were averaged (after analysis for and rejection of outliers).
These steady-state averages were used to assess the perfor-
mance of the systems and the following AS system charac-
teristics were calculated: System COD, N, P, Mg, K and Ca flux
balances; influent unbiodegradable soluble (USO, fSU,CODInf)
and particulate (UPO, fxU,CODInf) COD fractions with the
method of Ekama and Wentzel (1999) (explained below); aer-
obic reactor suspended solids (mixed liquor) VSS/TSS, COD/
VSS, TKN/VSS and TP/VSS mass ratios; nitrate and filtered TP

Table 1 e Design and operating parameters and targetfeed COD concentrations of the three AS systems.
Parameter UCTsystem
MLE1system
MLE2 system
WW type SettledWW
SettledWW
Raw WW
Sludge age (d) 10.4 10 10
Influent COD (mg/l) 600 þ 200a 600 600 þ 400b
Influent flow (l/d) 150 36 18
Waste flow (l/d)
(from aerobic reactor)
5.74 2.24 2.24
Volume (l)/Mass
fractions: Anaerobic
19; 0.133 e e
Volume (l)/Mass
fractions: Anoxic
21/0.275 6.2/0.28 6.2/0.28
Volume (l)/Mass
fractions: Aerobic
35/0.592 16.2/0.72 16.2/0.72
Recycle ratios: a
(aerobic to anoxic)
3.40 2.0 2.0
Recycle ratios: s
(from settling tank)
e 1.0 1.0
Recycle ratios: r
(anoxic to anaerobic)
1.15 e e
HRT e nominal/actual
(h): Anaerobic
3.04/1.41 e e
HRT e nominal/actual
(h): Anoxic
3.36/0.61 4.13/1.03 8.26/2.06
HRT e nominal/actual
(h): Aerobic
5.6/1.27 10.8/2.7 21.6/5.4
a Dosed 200 mgCOD/l sodium acetate.b Added per day 400 mgCOD/l (i.e. 7.24 gCOD) primary sludge.
Fig. 2 e Schematic diagram of the large anaerobic
digesters.
wat e r r e s e a r c h 5 6 ( 2 0 1 4 ) 2 6 7e2 7 9 271
flux changes across each reactor, and the influent (readily)
biodegradable soluble organics (BSO) COD concentration (Sbsi)
from the difference between the 0.45 mm membrane filtered
influent and effluent COD concentrations.
3.3. Operation of anaerobic digester (AD) systems
The five large ADs were 20 l clear Perspex continuously stirred
tank reactors sealed with upper and lower lids bolted together
with eight vertical stainless steel rods around the external
periphery to ensure a gas-tight seal and provide structural
support (Fig 2). Gas volume was measured by a gas volume
counter directly connected to theADs. The five small ADswere
Table 2 e Activated sludge system sampling position and para
Test COD TKN VFA FSA NO3 NO2 TP
Influent F; UF UF UF F UF;
Anaerobic F F F
Anoxic F F F
Aerobic UF UF F F UF
Final effluent F F; UF F F F F F; U
F ¼ 0.45 mm filtered; UF ¼ Unfiltered samples; D ¼ Direct measurement ta
COD (Chemical Oxygen Demand), TKN (Total Kjeldahl Nitrogen), FSA (Free
suspended solids), VSS (volatile suspended solids) according to Standard
Analyser Industrial Method 33.68 and 35.67W; Meþ (metals e Mg, K, Ca) b
atomic adsorption analysis. DSVI (Diluted Sludge Volume Index) according
directly in aerobic reactor according to Randall et al. (1991). VFA (vola
Moosbrugger et al. (1992).
5 l conical glass flasks placed on magnetic stirrers and sealed
with rubber stoppers to leaveminimal headspace. Gas volume
was measured by downward displacement of water and the
inverted floating plastic measuring cylinder was fitted with a
vent port sealed with a screw clamp. For the large and small
ADs, gas was collected into 5 l Tedlar gas bags. Because PS
hydrolyses faster thanWAS, the AD2L fed PS and AD4L fed the
PS-WAS blend were fed more frequently (three or two times
daily) at the short sludgeages toavoidhighVFAconcentrations
and lowpHafter feeding.At each sludgeage change, aperiodof
2e3 sludge ages was allowed to elapse before experimental
tests and measurements were performed on the ADs.
3.4. Anaerobic digester feed preparation and monitoring
AD1L&S were fed UCT system WAS taken directly from the
aerobic reactor at a concentration of w9 gCOD/l without
thickening. The daily feed volume was changed to establish
the required sludge age on AD1L and AD1S. So for AD1, the
shorter the sludge age, the higher the gCOD/d feed was
applied. Because the two MLE systems did not produce a high
flux of WAS, the WAS from these systems was thickened to a
higher concentration to decrease the daily feed volume with
increase in AD sludge age and maintained a constant daily
meter measurement.
OP Meþ Alk TSS VSS OUR DSVI pH
F F UF; F UF
UF UF
UF UF
UF; F UF UF D D D
F F F
ken.
and Saline Ammonia), TP (Total Phosphorus), OP (Ortho-P), TSS (total
Methods (1998). NO3 (Nitrate) and NO2 (Nitrite) by Technicon Auto-
y acid digestion of unfiltered (UF) and filtered (F) samples followed by
to Ekama andMarais (1984); OUR (Oxygen Utilization Rate) measured
tile fatty acids) and H2CO3 alkalinity with the 5 point titration of
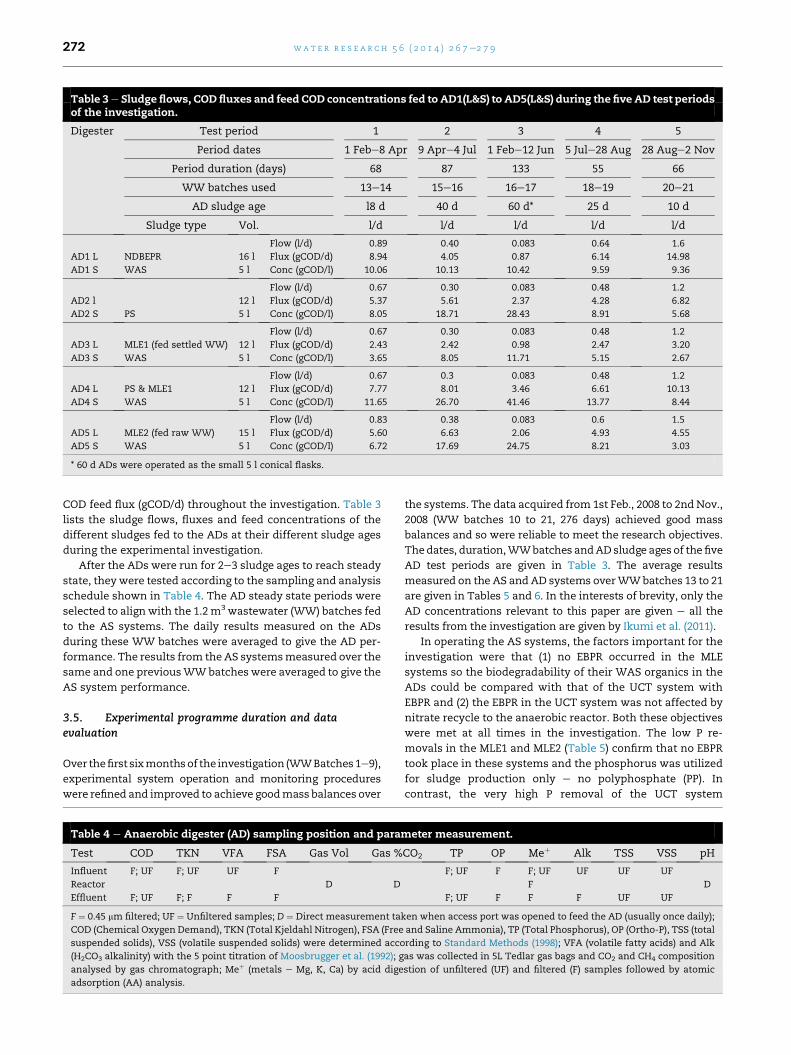
Table 3e Sludge flows, CODfluxes and feed COD concentrations fed to AD1(L&S) to AD5(L&S) during the five AD test periodsof the investigation.
Digester Test period 1 2 3 4 5
Period dates 1 Febe8 Apr 9 Apre4 Jul 1 Febe12 Jun 5 Jule28 Aug 28 Auge2 Nov
Period duration (days) 68 87 133 55 66
WW batches used 13e14 15e16 16e17 18e19 20e21
AD sludge age l8 d 40 d 60 d* 25 d 10 d
Sludge type Vol. l/d l/d l/d l/d l/d
Flow (l/d) 0.89 0.40 0.083 0.64 1.6
AD1 L NDBEPR 16 l Flux (gCOD/d) 8.94 4.05 0.87 6.14 14.98
AD1 S WAS 5 l Conc (gCOD/l) 10.06 10.13 10.42 9.59 9.36
Flow (l/d) 0.67 0.30 0.083 0.48 1.2
AD2 l 12 l Flux (gCOD/d) 5.37 5.61 2.37 4.28 6.82
AD2 S PS 5 l Conc (gCOD/l) 8.05 18.71 28.43 8.91 5.68
Flow (l/d) 0.67 0.30 0.083 0.48 1.2
AD3 L MLE1 (fed settled WW) 12 l Flux (gCOD/d) 2.43 2.42 0.98 2.47 3.20
AD3 S WAS 5 l Conc (gCOD/l) 3.65 8.05 11.71 5.15 2.67
Flow (l/d) 0.67 0.3 0.083 0.48 1.2
AD4 L PS & MLE1 12 l Flux (gCOD/d) 7.77 8.01 3.46 6.61 10.13
AD4 S WAS 5 l Conc (gCOD/l) 11.65 26.70 41.46 13.77 8.44
Flow (l/d) 0.83 0.38 0.083 0.6 1.5
AD5 L MLE2 (fed raw WW) 15 l Flux (gCOD/d) 5.60 6.63 2.06 4.93 4.55
AD5 S WAS 5 l Conc (gCOD/l) 6.72 17.69 24.75 8.21 3.03
* 60 d ADs were operated as the small 5 l conical flasks.
wat e r r e s e a r c h 5 6 ( 2 0 1 4 ) 2 6 7e2 7 9272
COD feed flux (gCOD/d) throughout the investigation. Table 3
lists the sludge flows, fluxes and feed concentrations of the
different sludges fed to the ADs at their different sludge ages
during the experimental investigation.
After the ADs were run for 2e3 sludge ages to reach steady
state, they were tested according to the sampling and analysis
schedule shown in Table 4. The AD steady state periods were
selected to align with the 1.2m3 wastewater (WW) batches fed
to the AS systems. The daily results measured on the ADs
during these WW batches were averaged to give the AD per-
formance. The results from the AS systemsmeasured over the
same and one previousWWbatcheswere averaged to give the
AS system performance.
3.5. Experimental programme duration and dataevaluation
Over thefirst sixmonthsof the investigation (WWBatches1e9),
experimental system operation and monitoring procedures
were refined and improved to achieve goodmass balances over
Table 4 e Anaerobic digester (AD) sampling position and para
Test COD TKN VFA FSA Gas Vol Gas %
Influent F; UF F; UF UF F
Reactor D D
Effluent F; UF F; F F F
F ¼ 0.45 mm filtered; UF ¼ Unfiltered samples; D ¼ Direct measurement ta
COD (Chemical Oxygen Demand), TKN (Total Kjeldahl Nitrogen), FSA (Free
suspended solids), VSS (volatile suspended solids) were determined acco
(H2CO3 alkalinity) with the 5 point titration of Moosbrugger et al. (1992); g
analysed by gas chromatograph; Meþ (metals e Mg, K, Ca) by acid dige
adsorption (AA) analysis.
the systems. The data acquired from 1st Feb., 2008 to 2nd Nov.,
2008 (WW batches 10 to 21, 276 days) achieved good mass
balances and so were reliable to meet the research objectives.
Thedates, duration,WWbatches andADsludge ages of the five
AD test periods are given in Table 3. The average results
measured on the AS and AD systems overWWbatches 13 to 21
are given in Tables 5 and 6. In the interests of brevity, only the
AD concentrations relevant to this paper are given e all the
results from the investigation are given by Ikumi et al. (2011).
In operating the AS systems, the factors important for the
investigation were that (1) no EBPR occurred in the MLE
systems so the biodegradability of their WAS organics in the
ADs could be compared with that of the UCT system with
EBPR and (2) the EBPR in the UCT system was not affected by
nitrate recycle to the anaerobic reactor. Both these objectives
were met at all times in the investigation. The low P re-
movals in the MLE1 and MLE2 (Table 5) confirm that no EBPR
took place in these systems and the phosphorus was utilized
for sludge production only e no polyphosphate (PP). In
contrast, the very high P removal of the UCT system
meter measurement.
CO2 TP OP Meþ Alk TSS VSS pH
F; UF F F; UF UF UF UF
F D
F; UF F F F UF UF
ken when access port was opened to feed the AD (usually once daily);
and Saline Ammonia), TP (Total Phosphorus), OP (Ortho-P), TSS (total
rding to Standard Methods (1998); VFA (volatile fatty acids) and Alk
as was collected in 5L Tedlar gas bags and CO2 and CH4 composition
stion of unfiltered (UF) and filtered (F) samples followed by atomic
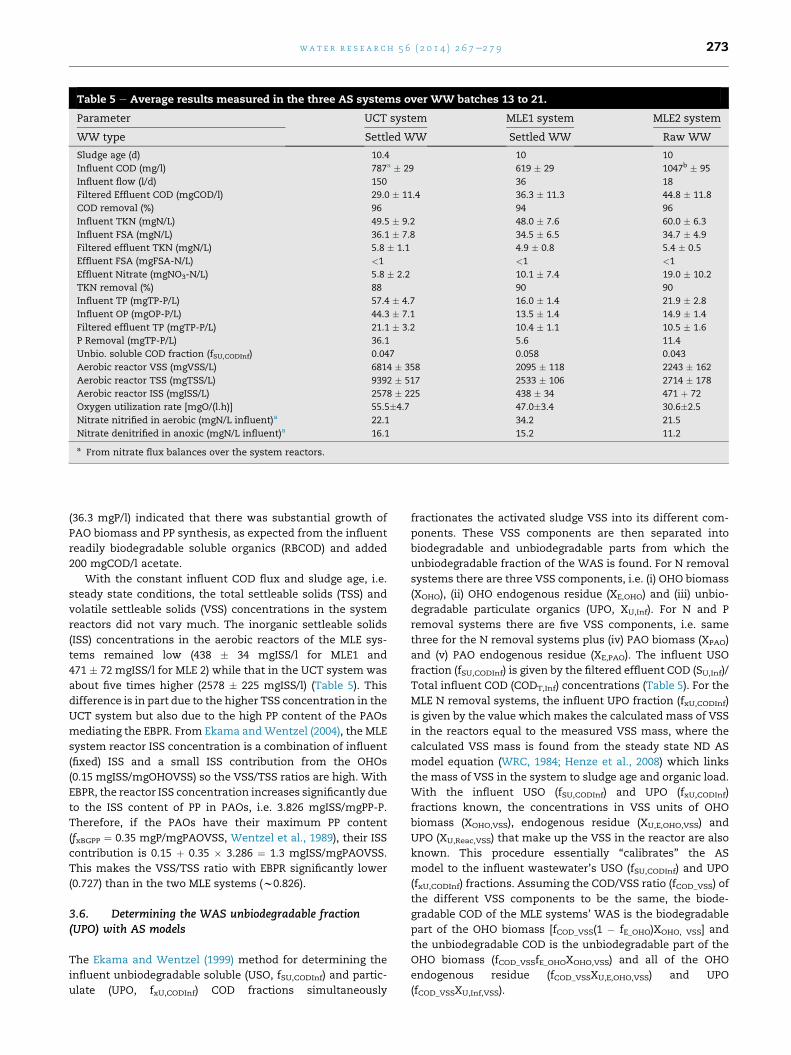
Table 5 e Average results measured in the three AS systems over WW batches 13 to 21.
Parameter UCT system MLE1 system MLE2 system
WW type Settled WW Settled WW Raw WW
Sludge age (d) 10.4 10 10
Influent COD (mg/l) 787a � 29 619 � 29 1047b � 95
Influent flow (l/d) 150 36 18
Filtered Effluent COD (mgCOD/l) 29.0 � 11.4 36.3 � 11.3 44.8 � 11.8
COD removal (%) 96 94 96
Influent TKN (mgN/L) 49.5 � 9.2 48.0 � 7.6 60.0 � 6.3
Influent FSA (mgN/L) 36.1 � 7.8 34.5 � 6.5 34.7 � 4.9
Filtered effluent TKN (mgN/L) 5.8 � 1.1 4.9 � 0.8 5.4 � 0.5
Effluent FSA (mgFSA-N/L) <1 <1 <1
Effluent Nitrate (mgNO3-N/L) 5.8 � 2.2 10.1 � 7.4 19.0 � 10.2
TKN removal (%) 88 90 90
Influent TP (mgTP-P/L) 57.4 � 4.7 16.0 � 1.4 21.9 � 2.8
Influent OP (mgOP-P/L) 44.3 � 7.1 13.5 � 1.4 14.9 � 1.4
Filtered effluent TP (mgTP-P/L) 21.1 � 3.2 10.4 � 1.1 10.5 � 1.6
P Removal (mgTP-P/L) 36.1 5.6 11.4
Unbio. soluble COD fraction (fSU,CODInf) 0.047 0.058 0.043
Aerobic reactor VSS (mgVSS/L) 6814 � 358 2095 � 118 2243 � 162
Aerobic reactor TSS (mgTSS/L) 9392 � 517 2533 � 106 2714 � 178
Aerobic reactor ISS (mgISS/L) 2578 � 225 438 � 34 471 þ 72
Oxygen utilization rate [mgO/(l.h)] 55.5�4.7 47.0�3.4 30.6�2.5
Nitrate nitrified in aerobic (mgN/L influent)a 22.1 34.2 21.5
Nitrate denitrified in anoxic (mgN/L influent)a 16.1 15.2 11.2
a From nitrate flux balances over the system reactors.
wat e r r e s e a r c h 5 6 ( 2 0 1 4 ) 2 6 7e2 7 9 273
(36.3 mgP/l) indicated that there was substantial growth of
PAO biomass and PP synthesis, as expected from the influent
readily biodegradable soluble organics (RBCOD) and added
200 mgCOD/l acetate.
With the constant influent COD flux and sludge age, i.e.
steady state conditions, the total settleable solids (TSS) and
volatile settleable solids (VSS) concentrations in the system
reactors did not vary much. The inorganic settleable solids
(ISS) concentrations in the aerobic reactors of the MLE sys-
tems remained low (438 � 34 mgISS/l for MLE1 and
471 � 72 mgISS/l for MLE 2) while that in the UCT system was
about five times higher (2578 � 225 mgISS/l) (Table 5). This
difference is in part due to the higher TSS concentration in the
UCT system but also due to the high PP content of the PAOs
mediating the EBPR. From Ekama andWentzel (2004), the MLE
system reactor ISS concentration is a combination of influent
(fixed) ISS and a small ISS contribution from the OHOs
(0.15 mgISS/mgOHOVSS) so the VSS/TSS ratios are high. With
EBPR, the reactor ISS concentration increases significantly due
to the ISS content of PP in PAOs, i.e. 3.826 mgISS/mgPP-P.
Therefore, if the PAOs have their maximum PP content
(fxBGPP ¼ 0.35 mgP/mgPAOVSS, Wentzel et al., 1989), their ISS
contribution is 0.15 þ 0.35 � 3.286 ¼ 1.3 mgISS/mgPAOVSS.
This makes the VSS/TSS ratio with EBPR significantly lower
(0.727) than in the two MLE systems (w0.826).
3.6. Determining the WAS unbiodegradable fraction(UPO) with AS models
The Ekama and Wentzel (1999) method for determining the
influent unbiodegradable soluble (USO, fSU,CODInf) and partic-
ulate (UPO, fxU,CODInf) COD fractions simultaneously
fractionates the activated sludge VSS into its different com-
ponents. These VSS components are then separated into
biodegradable and unbiodegradable parts from which the
unbiodegradable fraction of the WAS is found. For N removal
systems there are three VSS components, i.e. (i) OHO biomass
(XOHO), (ii) OHO endogenous residue (XE,OHO) and (iii) unbio-
degradable particulate organics (UPO, XU,Inf). For N and P
removal systems there are five VSS components, i.e. same
three for the N removal systems plus (iv) PAO biomass (XPAO)
and (v) PAO endogenous residue (XE,PAO). The influent USO
fraction (fSU,CODInf) is given by the filtered effluent COD (SU,Inf)/
Total influent COD (CODT,Inf) concentrations (Table 5). For the
MLE N removal systems, the influent UPO fraction (fxU,CODInf)
is given by the value which makes the calculated mass of VSS
in the reactors equal to the measured VSS mass, where the
calculated VSS mass is found from the steady state ND AS
model equation (WRC, 1984; Henze et al., 2008) which links
the mass of VSS in the system to sludge age and organic load.
With the influent USO (fSU,CODInf) and UPO (fxU,CODInf)
fractions known, the concentrations in VSS units of OHO
biomass (XOHO,VSS), endogenous residue (XU,E,OHO,VSS) and
UPO (XU,Reac,VSS) that make up the VSS in the reactor are also
known. This procedure essentially “calibrates” the AS
model to the influent wastewater’s USO (fSU,CODInf) and UPO
(fxU,CODInf) fractions. Assuming the COD/VSS ratio (fCOD_VSS) of
the different VSS components to be the same, the biode-
gradable COD of the MLE systems’ WAS is the biodegradable
part of the OHO biomass [fCOD_VSS(1 � fE_OHO)XOHO, VSS] and
the unbiodegradable COD is the unbiodegradable part of the
OHO biomass (fCOD_VSSfE_OHOXOHO,VSS) and all of the OHO
endogenous residue (fCOD_VSSXU,E,OHO,VSS) and UPO
(fCOD_VSSXU,Inf,VSS).
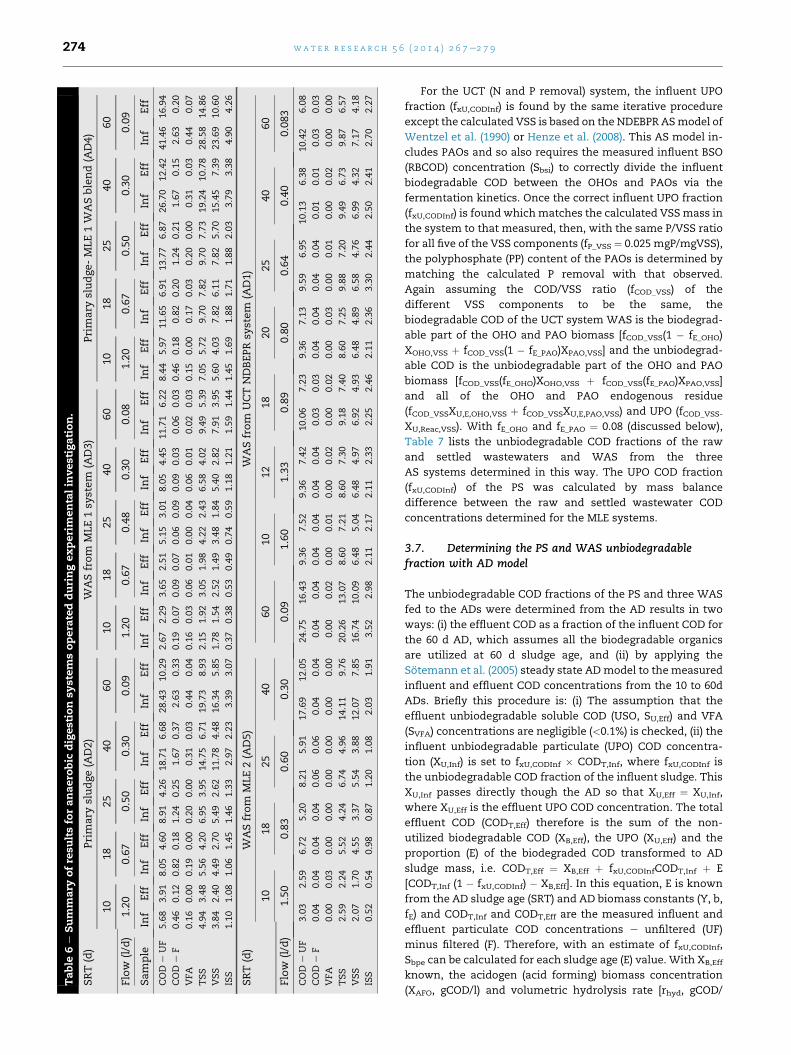
Table
6e
Sum
mary
ofresu
ltsforanaero
bic
digestionsy
stem
sopera
tedduringexperim
entalin
vestigation.
SRT(d)
Primary
sludge(A
D2)
WASfrom
MLE1sy
stem
(AD3)
Primary
sludge-MLE1W
ASblend(A
D4)
10
18
25
40
60
10
18
25
40
60
10
18
25
40
60
Flow
(l/d
)1.20
0.67
0.50
0.30
0.09
1.20
0.67
0.48
0.30
0.08
1.20
0.67
0.50
0.30
0.09
Sam
ple
Inf
Eff
Inf
Eff
Inf
Eff
Inf
Eff
Inf
Eff
Inf
Eff
Inf
Eff
Inf
Eff
Inf
Eff
Inf
Eff
Inf
Eff
Inf
Eff
Inf
Eff
Inf
Eff
Inf
Eff
COD
eUF
5.68
3.91
8.05
4.60
8.91
4.26
18.71
6.68
28.43
10.29
2.67
2.29
3.65
2.51
5.15
3.01
8.05
4.45
11.71
6.22
8.44
5.97
11.65
6.91
13.77
6.87
26.70
12.42
41.46
16.94
COD
eF
0.46
0.12
0.82
0.18
1.24
0.25
1.67
0.37
2.63
0.33
0.19
0.07
0.09
0.07
0.06
0.09
0.09
0.03
0.06
0.03
0.46
0.18
0.82
0.20
1.24
0.21
1.67
0.15
2.63
0.20
VFA
0.16
0.00
0.19
0.00
0.20
0.00
0.31
0.03
0.44
0.04
0.16
0.03
0.06
0.01
0.00
0.04
0.06
0.01
0.02
0.03
0.15
0.00
0.17
0.03
0.20
0.00
0.31
0.03
0.44
0.07
TSS
4.94
3.48
5.56
4.20
6.95
3.95
14.75
6.71
19.73
8.93
2.15
1.92
3.05
1.98
4.22
2.43
6.58
4.02
9.49
5.39
7.05
5.72
9.70
7.82
9.70
7.73
19.24
10.78
28.58
14.86
VSS
3.84
2.40
4.49
2.70
5.49
2.62
11.78
4.48
16.34
5.85
1.78
1.54
2.52
1.49
3.48
1.84
5.40
2.82
7.91
3.95
5.60
4.03
7.82
6.11
7.82
5.70
15.45
7.39
23.69
10.60
ISS
1.10
1.08
1.06
1.45
1.46
1.33
2.97
2.23
3.39
3.07
0.37
0.38
0.53
0.49
0.74
0.59
1.18
1.21
1.59
1.44
1.45
1.69
1.88
1.71
1.88
2.03
3.79
3.38
4.90
4.26
SRT(d)
WASfrom
MLE2(A
D5)
WASfrom
UCTNDBEPRsy
stem
(AD1)
10
18
25
40
60
10
12
18
20
25
40
60
Flow
(l/d
)1.50
0.83
0.60
0.30
0.09
1.60
1.33
0.89
0.80
0.64
0.40
0.083
COD
eUF
3.03
2.59
6.72
5.20
8.21
5.91
17.69
12.05
24.75
16.43
9.36
7.52
9.36
7.42
10.06
7.23
9.36
7.13
9.59
6.95
10.13
6.38
10.42
6.08
COD
eF
0.04
0.04
0.04
0.04
0.06
0.06
0.04
0.04
0.04
0.04
0.04
0.04
0.04
0.04
0.03
0.03
0.04
0.04
0.04
0.04
0.01
0.01
0.03
0.03
VFA
0.00
0.03
0.00
0.00
0.00
0.00
0.00
0.00
0.00
0.02
0.00
0.01
0.00
0.02
0.00
0.02
0.00
0.03
0.00
0.01
0.00
0.02
0.00
0.00
TSS
2.59
2.24
5.52
4.24
6.74
4.96
14.11
9.76
20.26
13.07
8.60
7.21
8.60
7.30
9.18
7.40
8.60
7.25
9.88
7.20
9.49
6.73
9.87
6.57
VSS
2.07
1.70
4.55
3.37
5.54
3.88
12.07
7.85
16.74
10.09
6.48
5.04
6.48
4.97
6.92
4.93
6.48
4.89
6.58
4.76
6.99
4.32
7.17
4.18
ISS
0.52
0.54
0.98
0.87
1.20
1.08
2.03
1.91
3.52
2.98
2.11
2.17
2.11
2.33
2.25
2.46
2.11
2.36
3.30
2.44
2.50
2.41
2.70
2.27
wat e r r e s e a r c h 5 6 ( 2 0 1 4 ) 2 6 7e2 7 9274
For the UCT (N and P removal) system, the influent UPO
fraction (fxU,CODInf) is found by the same iterative procedure
except the calculated VSS is based on the NDEBPR ASmodel of
Wentzel et al. (1990) or Henze et al. (2008). This AS model in-
cludes PAOs and so also requires the measured influent BSO
(RBCOD) concentration (Sbsi) to correctly divide the influent
biodegradable COD between the OHOs and PAOs via the
fermentation kinetics. Once the correct influent UPO fraction
(fxU,CODInf) is found whichmatches the calculated VSSmass in
the system to that measured, then, with the same P/VSS ratio
for all five of the VSS components (fP_VSS ¼ 0.025 mgP/mgVSS),
the polyphosphate (PP) content of the PAOs is determined by
matching the calculated P removal with that observed.
Again assuming the COD/VSS ratio (fCOD_VSS) of the
different VSS components to be the same, the
biodegradable COD of the UCT system WAS is the biodegrad-
able part of the OHO and PAO biomass [fCOD_VSS(1 � fE_OHO)
XOHO,VSS þ fCOD_VSS(1 � fE_PAO)XPAO,VSS] and the unbiodegrad-
able COD is the unbiodegradable part of the OHO and PAO
biomass [fCOD_VSS(fE_OHO)XOHO,VSS þ fCOD_VSS(fE_PAO)XPAO,VSS]
and all of the OHO and PAO endogenous residue
(fCOD_VSSXU,E,OHO,VSS þ fCOD_VSSXU,E,PAO,VSS) and UPO (fCOD_VSS-
XU,Reac,VSS). With fE_OHO and fE_PAO ¼ 0.08 (discussed below),
Table 7 lists the unbiodegradable COD fractions of the raw
and settled wastewaters and WAS from the three
AS systems determined in this way. The UPO COD fraction
(fxU,CODInf) of the PS was calculated by mass balance
difference between the raw and settled wastewater COD
concentrations determined for the MLE systems.
3.7. Determining the PS and WAS unbiodegradablefraction with AD model
The unbiodegradable COD fractions of the PS and three WAS
fed to the ADs were determined from the AD results in two
ways: (i) the effluent COD as a fraction of the influent COD for
the 60 d AD, which assumes all the biodegradable organics
are utilized at 60 d sludge age, and (ii) by applying the
Sotemann et al. (2005) steady state ADmodel to themeasured
influent and effluent COD concentrations from the 10 to 60d
ADs. Briefly this procedure is: (i) The assumption that the
effluent unbiodegradable soluble COD (USO, SU,Eff) and VFA
(SVFA) concentrations are negligible (<0.1%) is checked, (ii) the
influent unbiodegradable particulate (UPO) COD concentra-
tion (XU,Inf) is set to fxU,CODInf � CODT,Inf, where fxU,CODInf is
the unbiodegradable COD fraction of the influent sludge. This
XU,Inf passes directly though the AD so that XU,Eff ¼ XU,Inf,
where XU,Eff is the effluent UPO COD concentration. The total
effluent COD (CODT,Eff) therefore is the sum of the non-
utilized biodegradable COD (XB,Eff), the UPO (XU,Eff) and the
proportion (E) of the biodegraded COD transformed to AD
sludge mass, i.e. CODT,Eff ¼ XB,Eff þ fxU,CODInfCODT,Inf þ E
[CODT,Inf (1 � fxU,CODInf) � XB,Eff]. In this equation, E is known
from the AD sludge age (SRT) and AD biomass constants (Y, b,
fE) and CODT,Inf and CODT,Eff are the measured influent and
effluent particulate COD concentrations e unfiltered (UF)
minus filtered (F). Therefore, with an estimate of fxU,CODInf,
Sbpe can be calculated for each sludge age (E) value. With XB,Eff
known, the acidogen (acid forming) biomass concentration
(XAFO, gCOD/l) and volumetric hydrolysis rate [rhyd, gCOD/
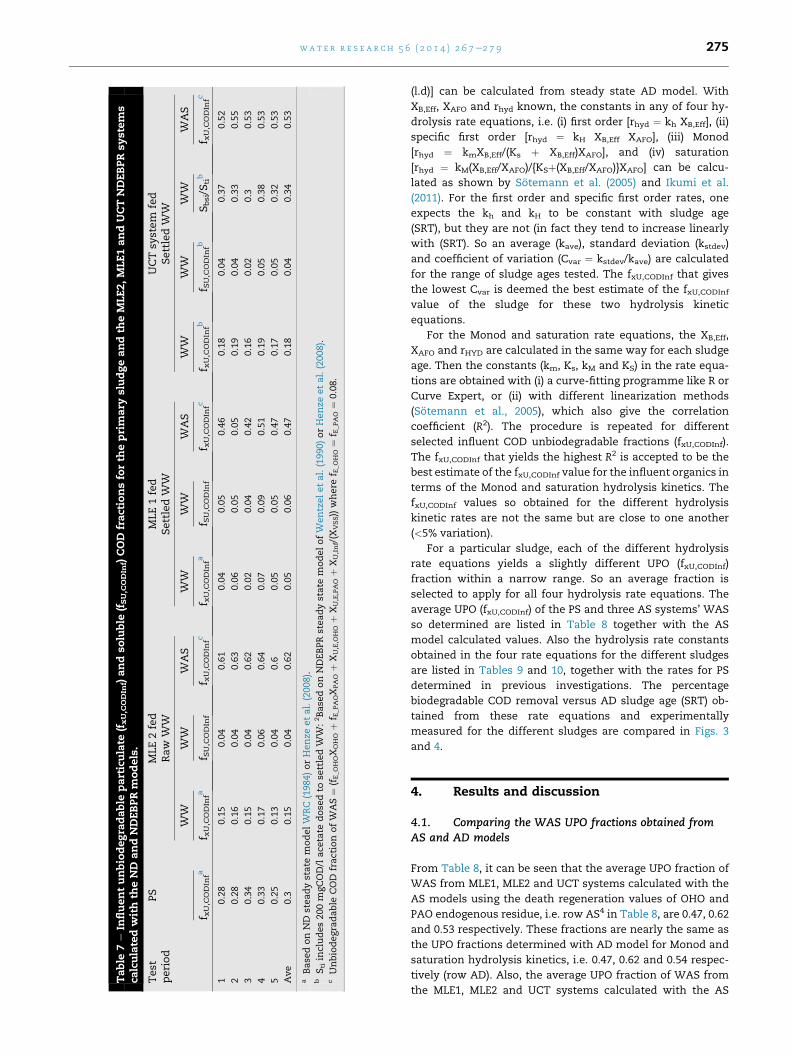
Table
7e
Influentunbiodegra
dable
particulate
(fxU,CODIn
f)andso
luble
(fSU,CODIn
f)COD
fractionsforth
eprim
ary
sludgeandth
eMLE2,MLE1andUCTNDEBPRsy
stem
sca
lculatedwithth
eND
andNDEBPRm
odels.
Test
period
PS
MLE2fed
Raw
WW
MLE1fed
SettledW
WUCTsy
stem
fed
SettledW
W
WW
WW
WAS
WW
WW
WAS
WW
WW
WW
WAS
f xU,CODInfa
f xU,CODInfa
f SU,CODInf
f xU,CODInfc
f xU,CODInfa
f SU,CODInf
f xU,CODInfc
f xU,CODInfb
f SU,CODInfb
Sbsi/Stib
f xU,CODInfc
10.28
0.15
0.04
0.61
0.04
0.05
0.46
0.18
0.04
0.37
0.52
20.28
0.16
0.04
0.63
0.06
0.05
0.05
0.19
0.04
0.33
0.55
30.34
0.15
0.04
0.62
0.02
0.04
0.42
0.16
0.02
0.3
0.53
40.33
0.17
0.06
0.64
0.07
0.09
0.51
0.19
0.05
0.38
0.53
50.25
0.13
0.04
0.6
0.05
0.05
0.47
0.17
0.05
0.32
0.53
Ave
0.3
0.15
0.04
0.62
0.05
0.06
0.47
0.18
0.04
0.34
0.53
aBase
donND
steadystate
modelW
RC(1984)orHenze
etal.(2008).
bStiincludes200mgCOD/lace
tate
dose
dto
settledW
W:2Base
donNDEBPRsteadystate
modelofW
entzeletal.(1990)orHenze
etal.(2008).
cUnbiodegradable
COD
fractionofW
AS¼
(fE_OHOXOHOþ
f E_PAOXPAOþ
XU,E,O
HOþ
XU,E,PAOþ
XU,Inf/(X
VSS))where
f E_OHO¼
f E_PAO¼
0.08.
wat e r r e s e a r c h 5 6 ( 2 0 1 4 ) 2 6 7e2 7 9 275
(l.d)] can be calculated from steady state AD model. With
XB,Eff, XAFO and rhyd known, the constants in any of four hy-
drolysis rate equations, i.e. (i) first order [rhyd ¼ kh XB,Eff], (ii)
specific first order [rhyd ¼ kH XB,Eff XAFO], (iii) Monod
[rhyd ¼ kmXB,Eff/(Ks þ XB,Eff)XAFO], and (iv) saturation
[rhyd ¼ kM(XB,Eff/XAFO)/{KSþ(XB,Eff/XAFO)}XAFO] can be calcu-
lated as shown by Sotemann et al. (2005) and Ikumi et al.
(2011). For the first order and specific first order rates, one
expects the kh and kH to be constant with sludge age
(SRT), but they are not (in fact they tend to increase linearly
with (SRT). So an average (kave), standard deviation (kstdev)
and coefficient of variation (Cvar ¼ kstdev/kave) are calculated
for the range of sludge ages tested. The fxU,CODInf that gives
the lowest Cvar is deemed the best estimate of the fxU,CODInf
value of the sludge for these two hydrolysis kinetic
equations.
For the Monod and saturation rate equations, the XB,Eff,
XAFO and rHYD are calculated in the same way for each sludge
age. Then the constants (km, Ks, kM and KS) in the rate equa-
tions are obtained with (i) a curve-fitting programme like R or
Curve Expert, or (ii) with different linearization methods
(Sotemann et al., 2005), which also give the correlation
coefficient (R2). The procedure is repeated for different
selected influent COD unbiodegradable fractions (fxU,CODInf).
The fxU,CODInf that yields the highest R2 is accepted to be the
best estimate of the fxU,CODInf value for the influent organics in
terms of the Monod and saturation hydrolysis kinetics. The
fxU,CODInf values so obtained for the different hydrolysis
kinetic rates are not the same but are close to one another
(<5% variation).
For a particular sludge, each of the different hydrolysis
rate equations yields a slightly different UPO (fxU,CODInf)
fraction within a narrow range. So an average fraction is
selected to apply for all four hydrolysis rate equations. The
average UPO (fxU,CODInf) of the PS and three AS systems’ WAS
so determined are listed in Table 8 together with the AS
model calculated values. Also the hydrolysis rate constants
obtained in the four rate equations for the different sludges
are listed in Tables 9 and 10, together with the rates for PS
determined in previous investigations. The percentage
biodegradable COD removal versus AD sludge age (SRT) ob-
tained from these rate equations and experimentally
measured for the different sludges are compared in Figs. 3
and 4.
4. Results and discussion
4.1. Comparing the WAS UPO fractions obtained fromAS and AD models
From Table 8, it can be seen that the average UPO fraction of
WAS from MLE1, MLE2 and UCT systems calculated with the
AS models using the death regeneration values of OHO and
PAO endogenous residue, i.e. row AS4 in Table 8, are 0.47, 0.62
and 0.53 respectively. These fractions are nearly the same as
the UPO fractions determined with AD model for Monod and
saturation hydrolysis kinetics, i.e. 0.47, 0.62 and 0.54 respec-
tively (row AD). Also, the average UPO fraction of WAS from
the MLE1, MLE2 and UCT systems calculated with the AS
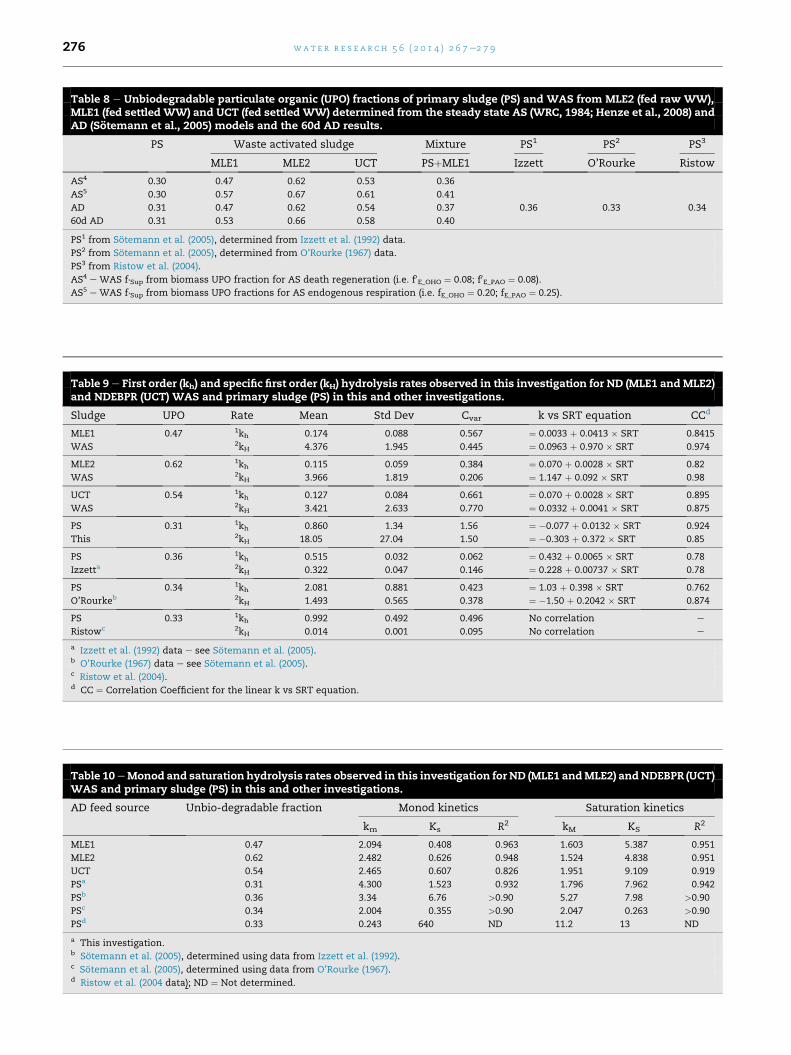
Table 8 e Unbiodegradable particulate organic (UPO) fractions of primary sludge (PS) and WAS from MLE2 (fed raw WW),MLE1 (fed settled WW) and UCT (fed settled WW) determined from the steady state AS (WRC, 1984; Henze et al., 2008) andAD (Sotemann et al., 2005) models and the 60d AD results.
PS Waste activated sludge Mixture PS1 PS2 PS3
MLE1 MLE2 UCT PSþMLE1 Izzett O’Rourke Ristow
AS4 0.30 0.47 0.62 0.53 0.36
AS5 0.30 0.57 0.67 0.61 0.41
AD 0.31 0.47 0.62 0.54 0.37 0.36 0.33 0.34
60d AD 0.31 0.53 0.66 0.58 0.40
PS1 from Sotemann et al. (2005), determined from Izzett et al. (1992) data.
PS2 from Sotemann et al. (2005), determined from O’Rourke (1967) data.
PS3 from Ristow et al. (2004).
AS4 e WAS f’Sup from biomass UPO fraction for AS death regeneration (i.e. f0E_OHO ¼ 0.08; f0E_PAO ¼ 0.08).
AS5 e WAS f’Sup from biomass UPO fractions for AS endogenous respiration (i.e. fE_OHO ¼ 0.20; fE_PAO ¼ 0.25).
Table 9 e First order (kh) and specific first order (kH) hydrolysis rates observed in this investigation for ND (MLE1 andMLE2)and NDEBPR (UCT) WAS and primary sludge (PS) in this and other investigations.
Sludge UPO Rate Mean Std Dev Cvar k vs SRT equation CCd
MLE1 0.47 1kh 0.174 0.088 0.567 ¼ 0.0033 þ 0.0413 � SRT 0.8415
WAS 2kH 4.376 1.945 0.445 ¼ 0.0963 þ 0.970 � SRT 0.974
MLE2 0.62 1kh 0.115 0.059 0.384 ¼ 0.070 þ 0.0028 � SRT 0.82
WAS 2kH 3.966 1.819 0.206 ¼ 1.147 þ 0.092 � SRT 0.98
UCT 0.54 1kh 0.127 0.084 0.661 ¼ 0.070 þ 0.0028 � SRT 0.895
WAS 2kH 3.421 2.633 0.770 ¼ 0.0332 þ 0.0041 � SRT 0.875
PS 0.31 1kh 0.860 1.34 1.56 ¼ �0.077 þ 0.0132 � SRT 0.924
This 2kH 18.05 27.04 1.50 ¼ �0.303 þ 0.372 � SRT 0.85
PS 0.36 1kh 0.515 0.032 0.062 ¼ 0.432 þ 0.0065 � SRT 0.78
Izzetta 2kH 0.322 0.047 0.146 ¼ 0.228 þ 0.00737 � SRT 0.78
PS 0.34 1kh 2.081 0.881 0.423 ¼ 1.03 þ 0.398 � SRT 0.762
O’Rourkeb 2kH 1.493 0.565 0.378 ¼ �1.50 þ 0.2042 � SRT 0.874
PS 0.33 1kh 0.992 0.492 0.496 No correlation e
Ristowc 2kH 0.014 0.001 0.095 No correlation e
a Izzett et al. (1992) data e see Sotemann et al. (2005).b O’Rourke (1967) data e see Sotemann et al. (2005).c Ristow et al. (2004).d CC ¼ Correlation Coefficient for the linear k vs SRT equation.
Table 10eMonod and saturation hydrolysis rates observed in this investigation for ND (MLE1 andMLE2) andNDEBPR (UCT)WAS and primary sludge (PS) in this and other investigations.
AD feed source Unbio-degradable fraction Monod kinetics Saturation kinetics
km Ks R2 kM KS R2
MLE1 0.47 2.094 0.408 0.963 1.603 5.387 0.951
MLE2 0.62 2.482 0.626 0.948 1.524 4.838 0.951
UCT 0.54 2.465 0.607 0.826 1.951 9.109 0.919
PSa 0.31 4.300 1.523 0.932 1.796 7.962 0.942
PSb 0.36 3.34 6.76 >0.90 5.27 7.98 >0.90
PSc 0.34 2.004 0.355 >0.90 2.047 0.263 >0.90
PSd 0.33 0.243 640 ND 11.2 13 ND
a This investigation.b Sotemann et al. (2005), determined using data from Izzett et al. (1992).c Sotemann et al. (2005), determined using data from O’Rourke (1967).d Ristow et al. (2004 data); ND ¼ Not determined.
wat e r r e s e a r c h 5 6 ( 2 0 1 4 ) 2 6 7e2 7 9276
wat e r r e s e a r c h 5 6 ( 2 0 1 4 ) 2 6 7e2 7 9 277
models using the endogenous respiration values of OHO and
PAO endogenous residue (fE_OHO ¼ 0.20; fE_PAO ¼ 0.25) are 0.57,
0.67 and 0.61 respectively, i.e. row AS5 in Table 8. These are
reasonably close to the UPO fractionsmeasured on 60d sludge
ADs, i.e. 0.53, 0.66 and 0.58 respectively. It would appear that
the UPO fraction calculated from the ADmodel is consistently
underestimated compared with that measured on the 60 d
ADs. If it is accepted that the best estimate of the sludge UPO
fraction is calculated from the AD results over the full
sludge age range, then the best AS model estimate for the
sludge UPO in AD is based on the death-regeneration model
values of OHO and PAO endogenous residue (i.e. fE_OHO ¼ 0.08;
fE_PAO ¼ 0.08).
Being a wastewater characteristic, one expects the
influent UPO (fxU,CODInf) fraction for same WW fed to
different systems to be the same. However, this is not the
case e the influent UPO (fxU,CODInf) fraction of the settled
wastewater determined for the UCT system is significantly
higher (0.18) than that determined for the MLE1 system
(0.05). Although the higher influent UPO (fxU,CODInf) fraction
in the UCT system is in part the result of the membranes (Du
Toit et al., 2007 reported a higher fxU,CODInf for a membrane
UCT system than a parallel settling tank UCT system fed
the same wastewater), a considerably higher influent UPO
(fxU,CODInf) for NDEBPR systems than in ND systems has been
consistently observed in the past in the UCT laboratory
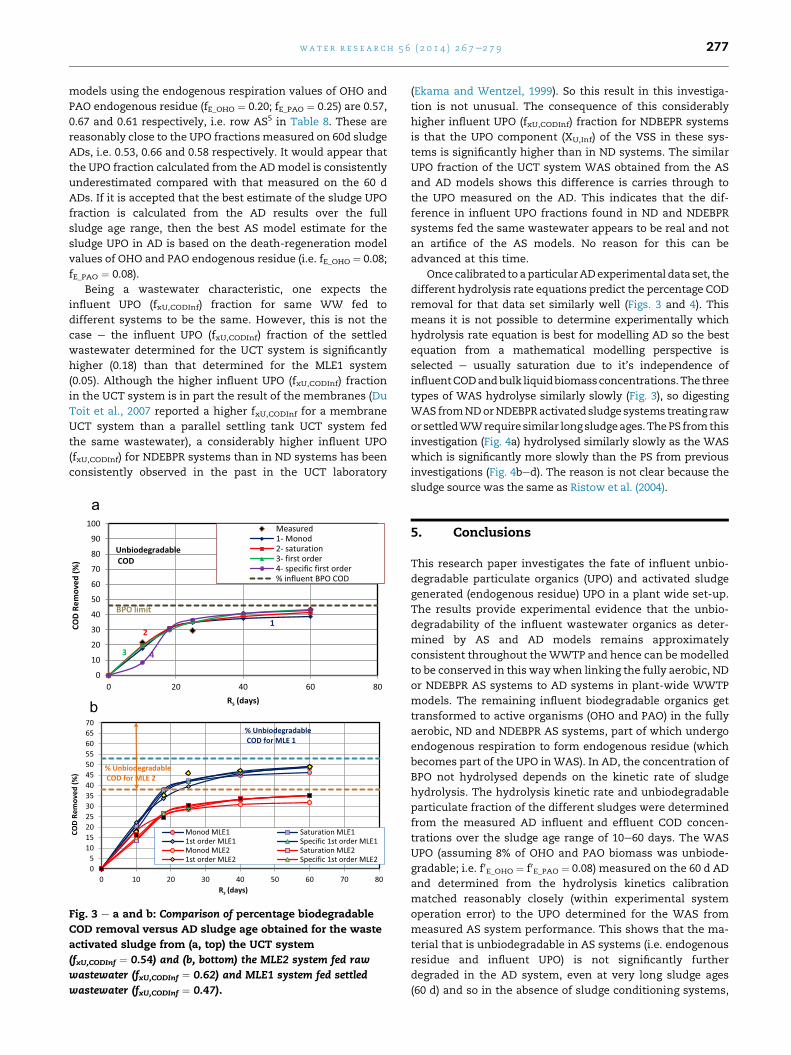
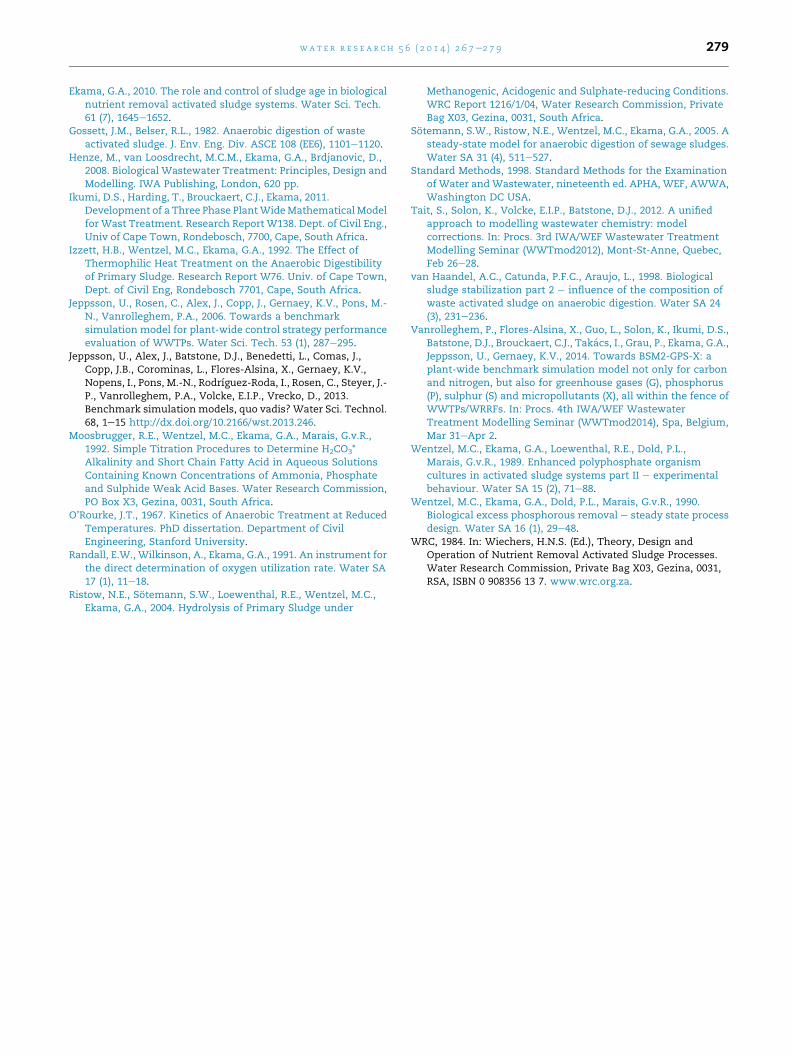
Fig. 3 e a and b: Comparison of percentage biodegradable
COD removal versus AD sludge age obtained for the waste
activated sludge from (a, top) the UCT system
(fxU,CODInf ¼ 0.54) and (b, bottom) the MLE2 system fed raw
wastewater (fxU,CODInf ¼ 0.62) and MLE1 system fed settled
wastewater (fxU,CODInf ¼ 0.47).
(Ekama and Wentzel, 1999). So this result in this investiga-
tion is not unusual. The consequence of this considerably
higher influent UPO (fxU,CODInf) fraction for NDBEPR systems
is that the UPO component (XU,Inf) of the VSS in these sys-
tems is significantly higher than in ND systems. The similar
UPO fraction of the UCT system WAS obtained from the AS
and AD models shows this difference is carries through to
the UPO measured on the AD. This indicates that the dif-
ference in influent UPO fractions found in ND and NDEBPR
systems fed the same wastewater appears to be real and not
an artifice of the AS models. No reason for this can be
advanced at this time.
Once calibrated to aparticularADexperimental data set, the
different hydrolysis rate equations predict the percentage COD
removal for that data set similarly well (Figs. 3 and 4). This
means it is not possible to determine experimentally which
hydrolysis rate equation is best for modelling AD so the best
equation from a mathematical modelling perspective is
selected e usually saturation due to it’s independence of
influentCODandbulk liquidbiomassconcentrations.The three
types of WAS hydrolyse similarly slowly (Fig. 3), so digesting
WAS fromNDorNDEBPRactivatedsludge systems treating raw
orsettledWWrequire similar longsludgeages.ThePS fromthis
investigation (Fig. 4a) hydrolysed similarly slowly as the WAS
which is significantly more slowly than the PS from previous
investigations (Fig. 4bed). The reason is not clear because the
sludge source was the same as Ristow et al. (2004).
5. Conclusions
This research paper investigates the fate of influent unbio-
degradable particulate organics (UPO) and activated sludge
generated (endogenous residue) UPO in a plant wide set-up.
The results provide experimental evidence that the unbio-
degradability of the influent wastewater organics as deter-
mined by AS and AD models remains approximately
consistent throughout theWWTP and hence can be modelled
to be conserved in this waywhen linking the fully aerobic, ND
or NDEBPR AS systems to AD systems in plant-wide WWTP
models. The remaining influent biodegradable organics get
transformed to active organisms (OHO and PAO) in the fully
aerobic, ND and NDEBPR AS systems, part of which undergo
endogenous respiration to form endogenous residue (which
becomes part of the UPO inWAS). In AD, the concentration of
BPO not hydrolysed depends on the kinetic rate of sludge
hydrolysis. The hydrolysis kinetic rate and unbiodegradable
particulate fraction of the different sludges were determined
from the measured AD influent and effluent COD concen-
trations over the sludge age range of 10e60 days. The WAS
UPO (assuming 8% of OHO and PAO biomass was unbiode-
gradable; i.e. f0E_OHO ¼ f0E_PAO ¼ 0.08) measured on the 60 d AD
and determined from the hydrolysis kinetics calibration
matched reasonably closely (within experimental system
operation error) to the UPO determined for the WAS from
measured AS system performance. This shows that the ma-
terial that is unbiodegradable in AS systems (i.e. endogenous
residue and influent UPO) is not significantly further
degraded in the AD system, even at very long sludge ages
(60 d) and so in the absence of sludge conditioning systems,
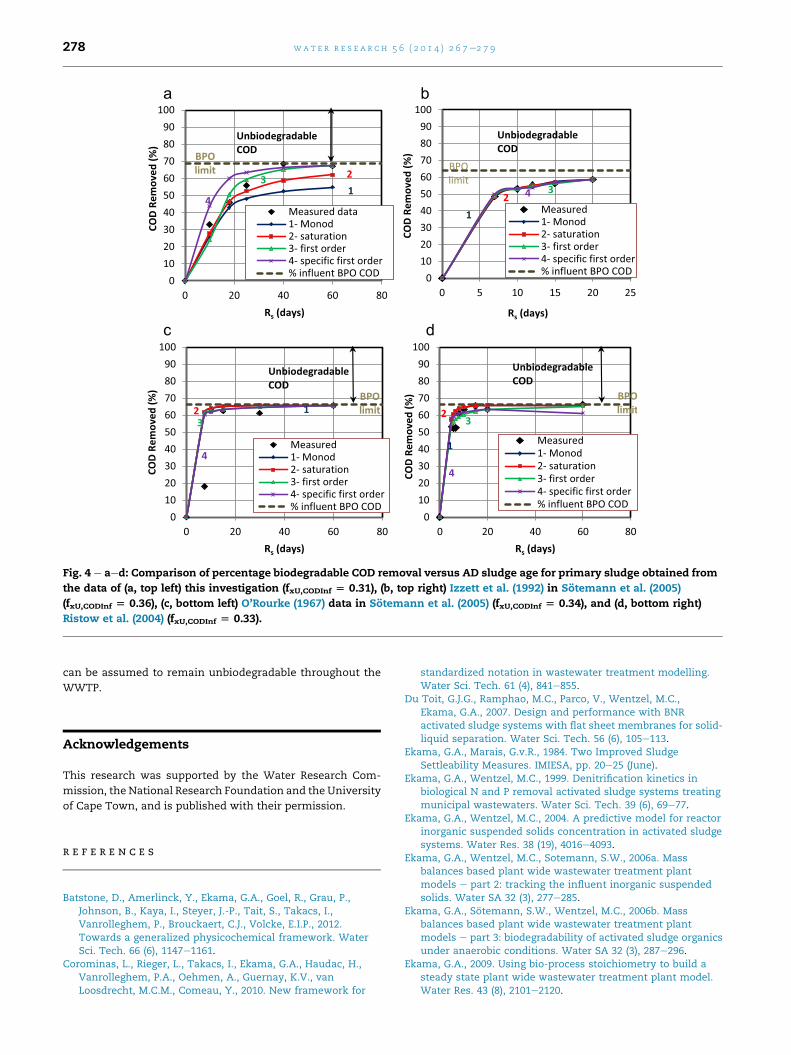
Fig. 4 e aed: Comparison of percentage biodegradable COD removal versus AD sludge age for primary sludge obtained from
the data of (a, top left) this investigation (fxU,CODInf [ 0.31), (b, top right) Izzett et al. (1992) in Sotemann et al. (2005)
(fxU,CODInf [ 0.36), (c, bottom left) O’Rourke (1967) data in Sotemann et al. (2005) (fxU,CODInf [ 0.34), and (d, bottom right)
Ristow et al. (2004) (fxU,CODInf [ 0.33).
wat e r r e s e a r c h 5 6 ( 2 0 1 4 ) 2 6 7e2 7 9278
can be assumed to remain unbiodegradable throughout the
WWTP.
Acknowledgements
This research was supported by the Water Research Com-
mission, the National Research Foundation and the University
of Cape Town, and is published with their permission.
r e f e r e n c e s
Batstone, D., Amerlinck, Y., Ekama, G.A., Goel, R., Grau, P.,Johnson, B., Kaya, I., Steyer, J.-P., Tait, S., Takacs, I.,Vanrolleghem, P., Brouckaert, C.J., Volcke, E.I.P., 2012.Towards a generalized physicochemical framework. WaterSci. Tech. 66 (6), 1147e1161.
Corominas, L., Rieger, L., Takacs, I., Ekama, G.A., Haudac, H.,Vanrolleghem, P.A., Oehmen, A., Guernay, K.V., vanLoosdrecht, M.C.M., Comeau, Y., 2010. New framework for
standardized notation in wastewater treatment modelling.Water Sci. Tech. 61 (4), 841e855.
Du Toit, G.J.G., Ramphao, M.C., Parco, V., Wentzel, M.C.,Ekama, G.A., 2007. Design and performance with BNRactivated sludge systems with flat sheet membranes for solid-liquid separation. Water Sci. Tech. 56 (6), 105e113.
Ekama, G.A., Marais, G.v.R., 1984. Two Improved SludgeSettleability Measures. IMIESA, pp. 20e25 (June).
Ekama, G.A., Wentzel, M.C., 1999. Denitrification kinetics inbiological N and P removal activated sludge systems treatingmunicipal wastewaters. Water Sci. Tech. 39 (6), 69e77.
Ekama, G.A., Wentzel, M.C., 2004. A predictive model for reactorinorganic suspended solids concentration in activated sludgesystems. Water Res. 38 (19), 4016e4093.
Ekama, G.A., Wentzel, M.C., Sotemann, S.W., 2006a. Massbalances based plant wide wastewater treatment plantmodels e part 2: tracking the influent inorganic suspendedsolids. Water SA 32 (3), 277e285.
Ekama, G.A., Sotemann, S.W., Wentzel, M.C., 2006b. Massbalances based plant wide wastewater treatment plantmodels e part 3: biodegradability of activated sludge organicsunder anaerobic conditions. Water SA 32 (3), 287e296.
Ekama, G.A., 2009. Using bio-process stoichiometry to build asteady state plant wide wastewater treatment plant model.Water Res. 43 (8), 2101e2120.
wat e r r e s e a r c h 5 6 ( 2 0 1 4 ) 2 6 7e2 7 9 279
Ekama, G.A., 2010. The role and control of sludge age in biologicalnutrient removal activated sludge systems. Water Sci. Tech.61 (7), 1645e1652.
Gossett, J.M., Belser, R.L., 1982. Anaerobic digestion of wasteactivated sludge. J. Env. Eng. Div. ASCE 108 (EE6), 1101e1120.
Henze, M., van Loosdrecht, M.C.M., Ekama, G.A., Brdjanovic, D.,2008. Biological Wastewater Treatment: Principles, Design andModelling. IWA Publishing, London, 620 pp.
Ikumi, D.S., Harding, T., Brouckaert, C.J., Ekama, 2011.Development of a Three Phase PlantWideMathematical Modelfor Wast Treatment. Research Report W138. Dept. of Civil Eng.,Univ of Cape Town, Rondebosch, 7700, Cape, South Africa.
Izzett, H.B., Wentzel, M.C., Ekama, G.A., 1992. The Effect ofThermophilic Heat Treatment on the Anaerobic Digestibilityof Primary Sludge. Research Report W76. Univ. of Cape Town,Dept. of Civil Eng, Rondebosch 7701, Cape, South Africa.
Jeppsson, U., Rosen, C., Alex, J., Copp, J., Gernaey, K.V., Pons, M.-N., Vanrolleghem, P.A., 2006. Towards a benchmarksimulation model for plant-wide control strategy performanceevaluation of WWTPs. Water Sci. Tech. 53 (1), 287e295.
Jeppsson, U., Alex, J., Batstone, D.J., Benedetti, L., Comas, J.,Copp, J.B., Corominas, L., Flores-Alsina, X., Gernaey, K.V.,Nopens, I., Pons, M.-N., Rodrıguez-Roda, I., Rosen, C., Steyer, J.-P., Vanrolleghem, P.A., Volcke, E.I.P., Vrecko, D., 2013.Benchmark simulation models, quo vadis? Water Sci. Technol.68, 1e15 http://dx.doi.org/10.2166/wst.2013.246.
Moosbrugger, R.E., Wentzel, M.C., Ekama, G.A., Marais, G.v.R.,1992. Simple Titration Procedures to Determine H2CO3*Alkalinity and Short Chain Fatty Acid in Aqueous SolutionsContaining Known Concentrations of Ammonia, Phosphateand Sulphide Weak Acid Bases. Water Research Commission,PO Box X3, Gezina, 0031, South Africa.
O’Rourke, J.T., 1967. Kinetics of Anaerobic Treatment at ReducedTemperatures. PhD dissertation. Department of CivilEngineering, Stanford University.
Randall, E.W., Wilkinson, A., Ekama, G.A., 1991. An instrument forthe direct determination of oxygen utilization rate. Water SA17 (1), 11e18.
Ristow, N.E., Sotemann, S.W., Loewenthal, R.E., Wentzel, M.C.,Ekama, G.A., 2004. Hydrolysis of Primary Sludge under
Methanogenic, Acidogenic and Sulphate-reducing Conditions.WRC Report 1216/1/04, Water Research Commission, PrivateBag X03, Gezina, 0031, South Africa.
Sotemann, S.W., Ristow, N.E., Wentzel, M.C., Ekama, G.A., 2005. Asteady-state model for anaerobic digestion of sewage sludges.Water SA 31 (4), 511e527.
Standard Methods, 1998. Standard Methods for the Examinationof Water and Wastewater, nineteenth ed. APHA, WEF, AWWA,Washington DC USA.
Tait, S., Solon, K., Volcke, E.I.P., Batstone, D.J., 2012. A unifiedapproach to modelling wastewater chemistry: modelcorrections. In: Procs. 3rd IWA/WEF Wastewater TreatmentModelling Seminar (WWTmod2012), Mont-St-Anne, Quebec,Feb 26e28.
van Haandel, A.C., Catunda, P.F.C., Araujo, L., 1998. Biologicalsludge stabilization part 2 e influence of the composition ofwaste activated sludge on anaerobic digestion. Water SA 24(3), 231e236.
Vanrolleghem, P., Flores-Alsina, X., Guo, L., Solon, K., Ikumi, D.S.,Batstone, D.J., Brouckaert, C.J., Takacs, I., Grau, P., Ekama, G.A.,Jeppsson, U., Gernaey, K.V., 2014. Towards BSM2-GPS-X: aplant-wide benchmark simulation model not only for carbonand nitrogen, but also for greenhouse gases (G), phosphorus(P), sulphur (S) and micropollutants (X), all within the fence ofWWTPs/WRRFs. In: Procs. 4th IWA/WEF WastewaterTreatment Modelling Seminar (WWTmod2014), Spa, Belgium,Mar 31eApr 2.
Wentzel, M.C., Ekama, G.A., Loewenthal, R.E., Dold, P.L.,Marais, G.v.R., 1989. Enhanced polyphosphate organismcultures in activated sludge systems part II e experimentalbehaviour. Water SA 15 (2), 71e88.
Wentzel, M.C., Ekama, G.A., Dold, P.L., Marais, G.v.R., 1990.Biological excess phosphorous removal e steady state processdesign. Water SA 16 (1), 29e48.
WRC, 1984. In: Wiechers, H.N.S. (Ed.), Theory, Design andOperation of Nutrient Removal Activated Sludge Processes.Water Research Commission, Private Bag X03, Gezina, 0031,RSA, ISBN 0 908356 13 7. www.wrc.org.za.