Biochemical Characterization of a Novel Lysosomal Membrane ...
115
Biochemical Characterization of a Novel Lysosomal Membrane Protein Disrupted in Renal Carcinoma 2 (DIRC2) Dissertation in fulfillment of the requirement for the degree “Dr. rer. nat” of the Faculty of Mathematics and Natural Sciences at Kiel University submitted by Lalu Rudyat Telly Savalas Kiel 2011
Transcript of Biochemical Characterization of a Novel Lysosomal Membrane ...

Biochemical Characterization of a Novel
Lysosomal Membrane Protein
Disrupted in Renal Carcinoma 2 (DIRC2)
Dissertation
in fulfillment of the requirement for the degree “Dr. rer. nat”
of the Faculty of Mathematics and Natural Sciences
at Kiel University
submitted by
Lalu Rudyat Telly Savalas
Kiel 2011

Referees:
1. Prof. Dr. Paul Saftig
2. Prof. Dr. Matthias Leippe
Date of oral examination : 13.05.2011
Approved for publication : 24.05.2011
Signed: Dean

Herewith I declare that:
1. Apart from the supervisor`s guidance, the contents and design of this dissertation
are my own work.
2. This thesis has not been in partially or wholly as part of a doctoral degree to
another examining body.
Parts of this work have been submitted for scientific publication
3. This thesis has been prepared according to the Rules of Good Scientific Practice of
the German Research Foundation.
Kiel, March 9, 2011
Lalu Rudyat Telly Savalas

Acknowledgement
I would like to thank to Prof. Dr. Paul Saftig and Dr. Bernd Schroeder who guided me
throughout my PhD thesis.
I would like to express my grateful to the Saftig´s present and former members: Eeva-Liisa
Eskelinen, Karine Reiss, Seenu, Beimi, Marc, Alex, Christina Wehling, Marion, Jenny, Kathi,
Micha, Judith, Marlies, Inez, Fr. Z, Michelle, Johann, Janna, Sebastian, Raffi, Andrea, Nur,
Jockel, Hannes, Silvio, Christian Raab, Mirka.
I would especially thank to the DAAD (Deutsher Akademischer Austaushdienst), the
Directorate of Higher Education, Republic of Indoensia, the Rector of University of Mataram
and the Dean of the Faculty of Teacher Training and Education, University of Mataram,
Indonesia for facilitating my study in Germany.
I am heartily indebted by the encouragement from my former teachers and lecturers: pak
Supardi, Dr. Dessy Natalia.
Thank you to the former and present PPI Kiel colleagues.
Thank you to Ibunda Baiq Nai´mah and Siti Syamsiyah serta Ayahanda Ahmad Ramli and
Sri Bintoro Hadiwidjojo, to my brothers and sisters Rully el Faraby, Very el Viera, Yudi
Islami Firdaus, Mba Uun, Mba Fivi, Dek Hudaya, Dek Ibadurrahman, Dek Hanif.
I would like to thank to my lovely wife Jannatin Àrdhuha and our sons Mukhlis and Hasan
Abdulhaq, who fueled me up to accomplish this work.
i
Table of contents
Table of Contents i
List of Figures iv
List of Tables vi
Abbreviations vii
Summary x
Zusammenfassung xii
1 Introduction …………………………………………………………… 1
1.1 Lysosomes ……………………………………………………………… 1
1.2 Targeting of lysosomal proteins .................................................................. 1
1.3 Soluble lysosomal proteins ……………………………………………… 6
1.4 Lysosomal membrane proteins …………………………………………… 9
1.4.1 Proteomic study of lysosomal membrane proteins ...................................... 9
1.4.2 Lysosomal transporter proteins…………………………………………… 10
1.4.3 Disrupted in Renal Carcinoma 2 (DIRC2) ……………………………… 12
1.5 Major Facilitator Superfamily…………………………………………… 13
1.6 Objectives …………………………………………………........................ 15
2 Materials and Methods ………………………………………………..... 16
2.1 Materials ……………………………………………….............................. 16
2.1.1 Equipments ……………………………………………….......................... 16
2.1.2 Disposable materials ………………………………………………............ 18
2.1.3 Cells ………………………………………………..................................... 18
2.1.4 Chemicals ………………………………………………............................ 19
2.1.5 Plasmids ……………………………………………................................... 20
2.1.6 Primers and oligonucleotides …………………………………………….. 22
2.1.7 Constructs ……………………………………………................................ 22
2.1.8 Antibodies ……………………………………………................................ 23
2.1.9 Media ……………………………………………....................................... 24
2.1.10 Kits …………………………………………….......................................... 25
2.1.11 Buffers ……………………………………………..................................... 25
2.1.12 Enzymes …………………………………………….................................. 29

ii
2.1.13 Softwares and web-based tools ………………………………………… 29
2.2 Methods ………………………………………………............................... 30
2.2.1 Molecular biology ……………………………………………................... 30
2.2.1.1 Basic PCR ……………………………………………................................ 30
2.2.1.2 Fusion PCR …………………………………………….............................. 31
2.2.1.3 Reverse transcription PCR ……………………………………………...... 33
2.2.1.4 DNA isolation …………………………………………….......................... 33
2.2.1.5 Agarose gel electrophoresis ……………………………………………..... 35
2.2.1.6 Gel elution ……………………………………………............................... 36
2.2.1.7 Determination of nucleic acid concentration …………………………… 36
2.2.1.8 DNA sequencing ……………………………………………..................... 36
2.2.1.9 RNA isolation …………………………………………….......................... 37
2.2.1.10 DNA digestion by restriction enzyme …………………............................. 37
2.2.1.11 Ligation …………………………………………….................................... 38
2.2.1.12 Dephosphorylation …………………………………………….................. 39
2.2.2 Biochemistry ……………………………………………............................ 39
2.2.2.1 Total lysate preparation ……………………………………………........... 39
2.2.2.2 Membrane protein preparation …………………………………………… 40
2.2.2.3 Protein determination …………………………………………….............. 40
2.2.2.4 Percoll® fractionation …………………………………………….............. 40
2.2.2.5 SDS-PAGE …………………………………………….............................. 41
2.2.2.6 Western blot ……………………………………………............................. 42
2.2.2.7 Enzyme assays …………………………………………............................. 44
2.2.2.8 Immunofluorescence …………………………………………................... 45
2.2.3 Cell biology …………………………………………................................. 46
2.2.3.1 Preparation of electro-competent E. coli ………………………………. 47
2.2.3.2 E. coli transformation ………………………………………….................. 47
2.2.3.3 DNA transfection …………………………………………......................... 48
2.2.3.4 siRNA transfection …………………………………………...................... 48
2.2.3.5 Protease inhibition in vivo …………………………………………........... 49
3 Results …………………………………………......................................... 50
3.1 Analysis of DIRC2 sequence …………………………………………… 50
3.2 DIRC2 is proteolytically processed ……………………………………… 53

iii
3.3 DIRC2 is a lysosomal membrane protein ………………………………… 53
3.4 DIRC2 is N-glycosylated at Asn-209 …………………………………… 56
3.5 Lysosomal targeting of DIRC2 depends on a lysosomal sorting motif at
its N-terminus …………………………………………..............................
58
3.5.1 Expression of dileucine and ER retention mutants of DIRC2 …………… 58
3.5.2 Stepwise post-translational modification of DIRC2 .................................... 59
3.6 Detection of endogenous DIRC2 ………………………………………… 62
3.7 Inhibitory profiling indicates involvement of the lysosomal cysteine
protease cathepsin L ………………………………………….................
64
3.8 Processing of DIRC2 is abolished in Cathepsin L deficient fibroblasts … 66
3.9 Rescue of DIRC2 proteolysis by coexpression of cathepsin L in cathepsin
deficient MEF …………………………………………..............................
70
3.10 Determination of the DIRC2 cleavage site ……………………………… 71
3.11 Overexpression of GFP-tagged DIRC2 and formation of
enlarged/clustered lysosomes …………………………………………......
74
3.11.1 Overexpression of DIRC2 in mammalian cells lead to the formation of
enlarged and/or clustered of acidic compartments ………………………
74
3.11.2 Effects of bafilomycin A1, vinblastine and Rab5 on the DIRC2-GFP
driven enlargement of acidic organelles ………………………………….
74
4 Discussion …………………………………………................................... 78
4.1 DIRC2 is a novel lysosomal protein ……………………………………… 78
4.2 DIRC2 is a glycoprotein ………………………………………….............. 79
4.3 DIRC2 is proteolytically processed …………………………………….. 80
4.4 Cathepsin L is involved in the processing of DIRC2 …………………… 81
4.5 Cleavage site of DIRC2 …………………………………………............... 83
4.6 Putative function of DIRC2 …………………………………………......... 85
4.7 Outlook …………………………………………........................................ 86
Bibliography ……………………………………....................................... 88
Curriculum Vitae ……………………………………............................... 98
iv
List of Figures
Figure 1.1 Schematic description of lysosomal system ………………………….. 2
Figure 1.2 Targeting of lysosomal proteins ……………………………………… 3
Figure 2.1 pEGFP-N1 ……………………………………………………………. 20
Figure 2.2 peGFP-C1 ……………………………………………………………. 21
Figure 2.3 pcDNA3.1/Hygro+ …………………………………………………… 21
Figure 2.4 Fusion PCR strategy ………………………………………………….. 32
Figure 2.5 Semi-dry transfer of protein ………………………………………….. 43
Figure 3.1 Proposed topology of human DIRC2…………………………………. 51
Figure 3.2 Expression of GFP and 3xmyc-tagged DIRC2 analyzed by Western
blot ……………………………………………………………………
52
Figure 3.3 Localization of DIRC2 ……………………………………………….. 54
Figure 3.4 Percoll® fractionation of the extract of HeLa cells transiently
transfected with DIRC2-3xmyc ………………………………………
55
Figure 3.5 Deglycosylation of DIRC2 by PNGase F ……………………………. 57
Figure 3.6 Immunofluorescence analyses of dileucine and ER retention mutants
of DIRC2 ……………………………………………………………...
60
Figure 3.7 Post-translational modification of DIRC2 takes place in multiple
steps …………………………………………………………………...
61
Figure 3.8 Downregulation of DIRC2 with siRNA ……………………………… 63
Figure 3.9 Inhibition of DIRC2 proteolysis ……………………………………... 64
Figure 3.10 Inhibition of DIRC2 proteolysis by cysteine protease inhibitors …….. 66
Figure 3.11 Localization of hDIRC2 in cathepsin deficient MEFs ……………….. 67
Figure 3.12 Expression of DIRC2 in cathepsin deficient MEFs ………………….. 68
Figure 3.13 Expression of endogenous mouse DIRC2 in wild-type and CtsL-/-
mouse liver ……………………………………………………………
69
Figure 3.14 Rescue of DIRC2 processing in cathepsin L deficient MEF ………… 71
Figure 3.15 Expression of internal HA-tagged and alanine mutants of DIRC2 …... 73
Figure 3.16 Overexpression of DIRC2-GFP ……………………………………… 75
Figure 3.17 Large acidic organelle formations upon overexpression of GFP-
DIRC2 ………………………………………………………………...
75
v
Figure 3.18 Effect of bafilomycin A1, vinblastine and Rab5 on the formation of
large organelles ……………………………………………………….
76
Figure 4.1 Secondary structure prediction of DIRC2 generated by I-TASSER
program ……………………………………………………………….
79
Figure 4.2 Sequence of loop5 of DIRC2 and alanine scanning mutants ………… 84
Figure 4.3 Putative role of DIRC2 as an electrogenic metabolite transporter …… 85
vi
List of Tables
Table 1.1 Examples of dileucine-based and tyrosine-based sorting signals
(adapted from Braulke and Bonifacino 2009) ……………………….
6
Table 1.2 Human lysosomal cysteine proteases: Nomenclature and properties
(taken from Turk et al 2001) ………………………………………….
7
Table 1.3 Lysosomal transport activities and proteins from the lysosomal
membrane with demonstrated or putative transport function (modified
from Sagné and Gasnier, 2008) ……………………………………….
11
Table 2.1.1 Equipments …………………………………………............................ 16
Table 2.1.2 Materials …………………………………………................................ 18
Table 2.1.3 Mammalian cells used in this study ………………………………….. 18
Table 2.1.4 Chemicals used in this study …………………………………………. 19
Table 2.1.5 Primers used to generate construts in this study ……………………... 22
Table 2.1.6 DIRC2 siRNA (Stealth Select RNAi™, Invitrogen, CA, USA) ……... 22
Table 2.1.7 Constructs used in this study …………………………………………. 23
Table 2.1.8 Primary antibodies used in Western blot or immunofluorescence …... 23
Table 2.1.9 Secondary antibodies used in Western blot or immunofluorescence… 24
Table 2.1.10 Kits used in this study ………………………………………………... 25
Table 2.1.11 List of enzymes used in this study ………………………………….... 29
Table 2.1.12 Softwares and web-based tools aided the analysis in this study ……... 29
Table 2.2.1 Standard PCR reaction mixture for 50 µL volume PCR ……………... 30
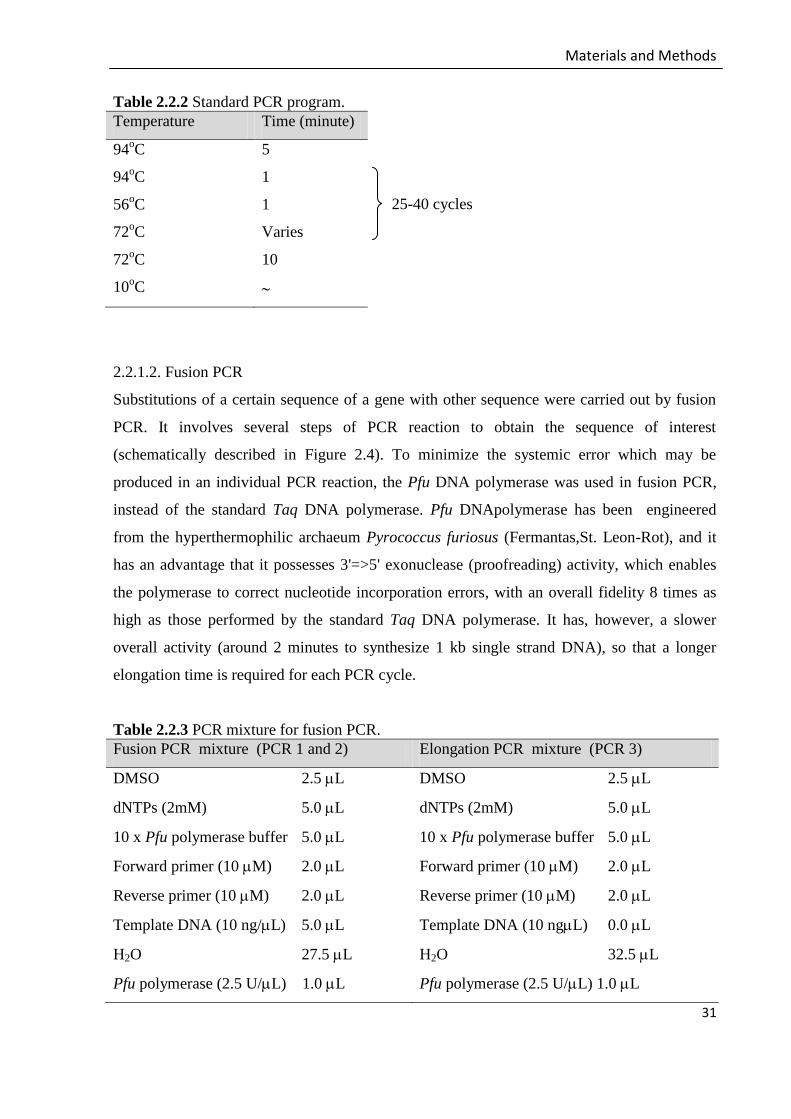
Table 2.2.2 Standard PCR programe ……………………………………………… 31
Table 2.2.3 PCR mixture for fusion PCR ………………………………………… 31
Table 2.2.4 PCR programe for fusion PCR ……………………………………….. 32
Table 2.2.5 Reverse transcriptase reaction ………………………………………... 33
Table 2.2.6 Digestion of DNA by restriction enzymes …………………………… 38
Table 2.2.7 Ligation reaction mixture …………………………………………….. 38
Table 2.2.8 Recipe for polyacrylamide gel ……………………………………….. 42
Table 2.2.9 siRNA transfection mixture ………………………………………….. 49
Table 2.2.10 Concentration of protease inhibitors in cells media ………………….. 49
Table 4.1 Combinatorial substrate analyses of cathepsin L …………………….. 84

vii
Abbreviations
anti or alpha
micro
g micro gram
GC beta-Glucocerebrosidase
L micro Liter
m micro meter, 10-6
meter
M micro molar
µg micro gram
ADP Adenosine diphosphate
Amp Ampicilin
AP Adaptor protein, Alkaline phosphatase
ARF ADP-ribosylation factor
ATP Adenosine triphosphate
BCA Bicinchoninic acid
bp base pair
BSA Bovine serum albumin
CD63 Cluster of differentiation 63
CD68 Cluster of differentiation 68
CD-MPR Cation dependent MPR
cDNA complementary Deoxyribose nucleic acid
CI-MPR Cation independent MPR
CLN7 Ceroid-lipofuscinosis 7
cm centimeter
CTNS Cystinosin
CtsB Cathepsin
CtsL Cathepsin L
CtsD Cathepsin D
DEPC Diethylpyrocarbonat
DIRC2 Disrupted in renal carcinoma
DMEM Dulbecco´s modified eagle medium
DMSO Dimethyl sulphonyl
DMSZ Deutsche Sammlung von Mikroorganismen und Zellkulturen/German
Collection of Microorganisms and Cell Cultures
DNA Deoxyribonucleotide acid
dNTPs deoxynucleotide triphosphates
E. coli Escherichia coli
ECL Enhanced chemiluminescence
EDTA Ethylene diamine tetraacetic acid
EmrD E. coli multidrug resistance protein D
Endo H Endoglycosidase H
ER Endoplasmic reticulum
viii
FCS Fetal calf serum
FLVCR Feline leukemia virus subgroup C cellular receptor
GalNAc N-Acetylgalactosamine
GFP Green fluorescence protein
GGA Golgi-localized -ear containing ARF
GlcNAc N-Acetylglucosamine
GLUT Glucose transporter
HA Hemagglutinin
HCl Hydrochloric acid
HEPES 4-(2-hydroxyethyl)-1-piperazineethanesulfonic acid kbp kilo base pair
KCl Kalium chloride
kDa kilo Dalton
kg kilo gram
KH2PO4 Kalium dihydrogen phosphate
L Liter
LacY Lactose permease from E. coli
LAMPs Lysosomal associated membrane proteins
LB Lysogenic Broth
LBPA Lysobiphosphatidic acid
LC-MS/MS Liquid chromatography-Mass spectrometry/Mass spectrometry
LIMPs Lysosomal integral membrane proteins
m meter, milli
M Molar
mA milli Ampere
MCS Multi cloning site
mCtsB mouse cathepsin B
mCtsL mouse cathepsin L
MFS Major facilitator superfamily
MFSD8 Major facilitator superfamily domain containing 8
mg milli gram
MHC Major histocompability complex
min minute
mL milli Liter
mM milli Molar
MPR300 Mannose-6-phosphate receptor 300 kDa
MPR46 Mannose-6-phosphate receptor 46 kDa
MPS IIIC Mucopolysaccharidosis IIIC
mRNA messenger RNA
MS Mass spectrometry
MVB Multivesicular body
Na2HPO4 Dinatrium hydrogen phosphate
NaCl Natrium chloride

ix
NaOAc Natrium acetic acid
NaOH Natrium hydroxide
ng nano gram
NH4Cl Ammonium chloride
O. formigenus Oxalobacter formigenus oC Celcius degree
PBS Phosphate buffered saline
PCR Polymerase chain reaction
PDI Protein disulfide isomerase
Pfu Pyrococcus furiosus
pH potentia Hydrogenii
PMSF Phenylmethylsulfonyl fluoride
PNGase F Peptide-N4-(N-acetyl-beta-glucosaminyl) asparagine amidase
PNS Post nuclear supernatant
RNA ribonucleotide acid
rpm rotation per minute
RT-PCR Reverse transcription PCR
s second
SARS-CoV Severe acute respiratory syndrome coronavirus
SDS Sodium dodecyl sulfate
SDS-PAGE Sodium dodecyl sulfate polyacrylamide gel electrophoresis
SH3 Src homology 3
siRNA small interfering RNA
SLC Solute carrier (protein)
SSB single-strand DNA binding
SV40 Simian virus 40
TAE Tris-acetate-EDTA
Taq Thermus aquaticus
TBS Tris-buffered saline
TEMED Tetramethylethylenediamine
TGN trans-Golgi network
TIP47 Tail interacting protein of 47 kDa
TMDs Transmembrane domains
Tris-Cl Tris-chloride
U Unit
V Volt
V-ATPase Vacuolar-type H+-ATPase
VHS domain domain present in Vps27p, Hrs, Stam protein

x
Summary
The human Disrupted In Renal Carcinoma 2 (DIRC2) protein consists of 478
amino acids and is a putative member of the major facilitator superfamily. Bioinformatic
analysis suggested that DIRC2 has twelve transmembrane spanning domains. Both ends of
DIRC2 are facing the cytosolic milieu. By immunofluorescence and subcellular
fractionation analysis, it could be shown that DIRC2 localizes to lysosomes.
The sequence of DIRC2 exhibits a dileucine lysosomal targeting motif of the
[DE]XXXL[LI] type and two tyrosine-based lysosomal targeting sequences of the YXXØ
type at its N- and C-terminus, respectively. Mutation of these lysosomal sorting motifs
followed by analysis of the mutants by immunofluorescence showed that the dileucine
motif at the N-terminus is indispensable for lysosomal targeting, whereas the two tyrosine-
based lysosomal targeting motifs are irrelevant to lysosomal targeting of DIRC2. Linear
sequence analysis of DIRC2 also revealed two potential N-glycosylation sites. By using a
N209A mutant and PNGase F digestion, it could be demonstrated that only Asn-209 in
loop5 is utilized.
Immunoblot detection of either overexpressed or endogenous DIRC2 in HeLa cells
showed that DIRC2 is processed into two asymmetric fragments. Proteolysis of DIRC2
takes place in lysosomes and can be prevented by ER retention or redirection of newly
synthesized DIRC2 to the plasma membrane. The present study also showed that
processing of DIRC2 depends on the activity of the lysosomal protease cathepsin L.
However, DIRC2 is only partially processed in mouse liver deficient in cathepsin L,
indicating that the role of cathepsin L in the proteolysis of DIRC2 in cathepsin L deficient
mouse liver may be compensated by other still unknown proteases. The exact cleavage site
of DIRC2 by cathepsin L still needs to be determined but the proteolysis is likely to take
place between residue 214 and 261.
Downregulation of DIRC2 with siRNAs in HeLa cells did not detectably influence
lysosomal functions, as assessed by the activity of lysosomal enzymes or the expression
level of lysosomal proteins. While the function of DIRC2 is currently unknown, the need
for (or the consequence of) DIRC2 proteolysis remains unclear. Since under steady state

xi
condition the bulk of both overexpressed and endogenous DIRC2 are observed in
processed form, it seems unlikely that the observed proteolysis corresponds to degradation.
Hence, the possibility that the proteolytic processing modulates the function of DIRC2
cannot be excluded. Initial functional analysis of the full length form of DIRC2, expressed
in Xenopus oocytes, indicated that DIRC2 is an electrogenic transporter protein. However
the actual substrate of DIRC2-mediated transport is still unknown.

xii
Zusammenfassung
Das humane Protein Disrupted In Renal Carcinoma 2 (DIRC2) besteht aus 478
Aminosäuren und ist ein vermeintliches Mitglied der Major-Facilitator-Superfamilie.
Bioinformatische Analysen lassen vermuten, dass DIRC2 ein zwölf
Transmembrandomänen umfassendes Protein ist, dessen Enden beide im Cytosol liegen.
Mit Hilfe von Immunfluoreszenzexperimenten und subzellulärer Fraktionierung konnte
gezeigt werden, dass DIRC2 eine lysosomale Lokalisation besitzt.
DIRC2 weist drei lysosomale Zielsequenzen auf. Neben einem Dileucinmotiv des
[DE]XXXL[LI]-Typs sind zwei tyrosinbasierte YXXØ-Sequenzen jeweils am N- und C-
Terminus enthalten. Mutationen innerhalb dieser Sortierungsmotive, gefolgt von
anschließender immunfluoreszenzbasierter Analyse, zeigten die Notwendigkeit des N-
terminalen Dileucinmotifs, nicht aber der YXXØ-Motive für den zielgerichteten Transport
von DIRC2 zu den Lysosomen. Weitere Sequenzanalysen von DIRC2 ergaben zwei
potentielle N-Glykosylierungsstellen. Unter Verwendung einer DIRC2-N209A Mutante
und deren Deglykosylierung mittels PNGase F konnte gezeigt werden, dass nur dieses
Asn-209 glykosyliert vorliegt.
Immunoblotanalysen des überexprimierten oder endogenen DIRC2 in HeLa-Zellen
zeigten, dass eine Prozessierung des Proteins in zwei asymmetrische Fragmente erfolgt.
Die Proteolyse von neusynthetisiertem DIRC2 findet in den Lysosomen statt und kann
durch eine ER-Retention oder einen umgeleiteten Transport zur Plasmamembran
verhindert werden. Die Untersuchung zeigte außerdem, dass die DIRC2-Prozessierung von
der lysosomalen Protease Cathepsin L abhängt. Eine jedoch weiterhin stattfindende
partielle DIRC2-Prozessierung in Lebern Cathepsin L-defizienter Mäuse könnte auf eine
Kompensation von Cathepsin L durch andere, noch nicht identifizierte Proteasen
hindeuten. Die genaue Cathepsin L-Schnittstelle im DIRC2 Protein muss zwar noch
aufgeklärt werden, konnte aber auf einen Bereich zwischen den Aminosäureresten 214 und
261 eingegrenzt werden.
Durch eine siRNA-induzierte Verhinderung der DIRC2-Expression in HeLa-Zellen
konnte kein messbarer Effekt auf die Aktivität lysosomaler Enzyme, sowie die
xiii
Expressionsspiegel lysosomaler Proteine festgestellt werden. Die genaue Funktion von
DIRC2 bleibt also weiterhin unklar und somit auch die Notwendigkeit (oder die
Konsequenz) der Proteolyse von DIRC2. Jedoch scheint es unwahrscheinlich, dass die
Proteolyse nur auf den Abbau von DIRC2 zurückzuführen ist, da unter steady state-
Bedingungen der Hauptanteil, sowohl des überexprimierten, als auch des endogenen
DIRC2 in prozessierter Form vorliegt. Demnach kann eine Modulierung der Funktion,
durch proteolytische Prozessierung nicht ausgeschlossen werden. Kürzlich begonnene,
funktionell Analysen des unprozessierten, in Xenopus oocyten exprimierten DIRC2,
deuteten darauf hin, dass es sich bei dem Protein um ein elektrogenes Transporterprotein
handeln könnte. Allerdings sind dessen mutmaßliche Substrate bis jetzt unbekannt.

Introduction
1
1. Introduction
1.1 Lysosomes
Lysosomes are acidic membrane-bound cytoplasmic organelles that serve as a major
degradative compartment in eukaryotic cells. They were first described by de Duve over 50
years ago (de Duve 1955, de Duve 1959), and were also termed “suicide bags”, referring to
their potential function as subcellular particles responsible for protein turnover. Until the
discovery of the ubiquitin-proteasome system, lysosomes were thought to be the sole major
players in intracellular protein degradation or turnover (Chiechanover 2005). The discovery of
the ubiquitin-proteasome system has indeed changed the knowledge in the field of protein
degradation. However, this advance did not marginalize the study of lysosomes, because it
turned out that varieties of biomacromolecules, such as glycoconjugates, lipids, and nucleic
acids, are also degraded within the lysosome, followed by the releasing their building blocks
and transporting the catabolic products back to the cytoplasm for reuse (Cuervo and Dice
1998).
Both endogenous and exogenous macromolecules can be delivered to lysosomes
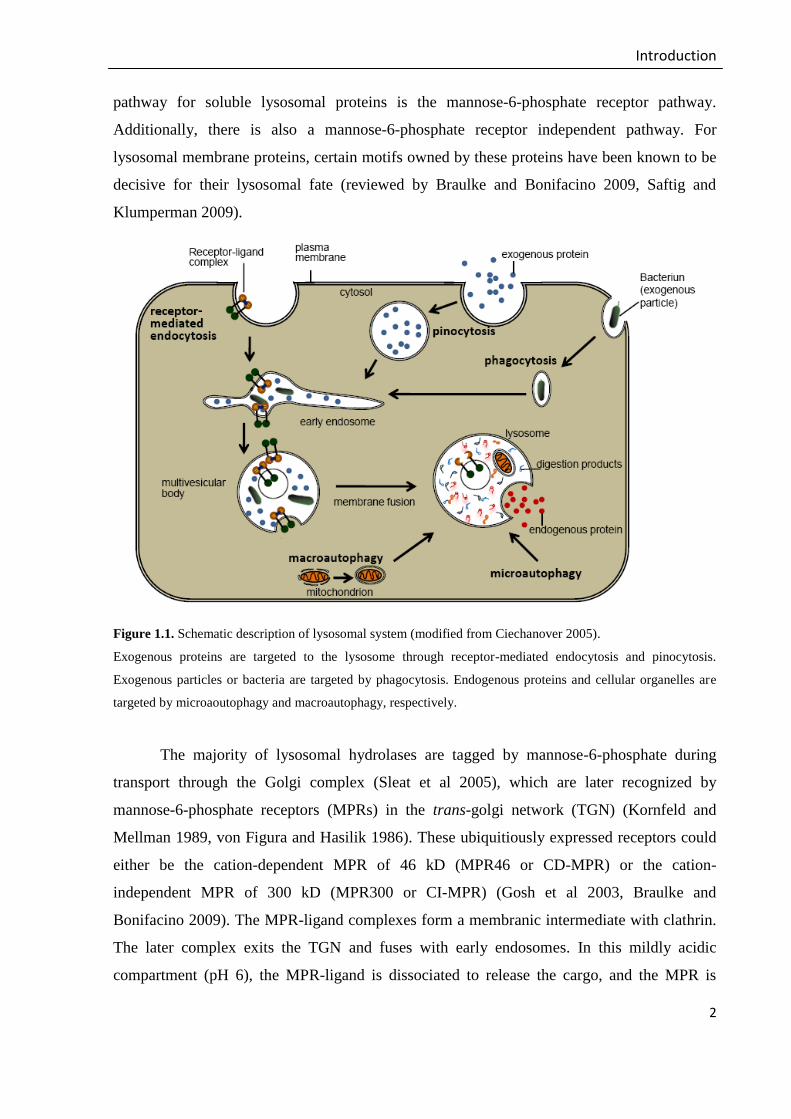
through the biosynthetic, autophagic, and endocytic pathway, respectively (Figure 1.1). The
degradative function of these organelles is carried out by around 50 acid hydrolases within
their lumen, such as proteinases, lipases and glycosidases. The acidic nature of lysosomes is
due to the activity of the vacuolar H+-type ATP-ase which pumps protons into the lysosomal
lumen and thereby maintains the pH at 4.5-5 (Mellman et al 1986). Lysosomes also serve as
the destination for cytoplasmic constituents taken up via autophagy which are targeted for
degradation and recycling. Lysosomes also have a role in the downregulation of cell surface
receptors, inactivation of pathogenic organisms, repair of the plasma membrane after
wounding, and loading of processed antigens onto MHC class II molecules (Storch and
Braulke 2005).
1.2 Targeting of Lysosomal Proteins
The correct localization of both soluble lysosomal proteins and membrane proteins
results from highly regulated sequential events. The best characterized lysosomal targeting
Introduction
2
pathway for soluble lysosomal proteins is the mannose-6-phosphate receptor pathway.
Additionally, there is also a mannose-6-phosphate receptor independent pathway. For
lysosomal membrane proteins, certain motifs owned by these proteins have been known to be
decisive for their lysosomal fate (reviewed by Braulke and Bonifacino 2009, Saftig and
Klumperman 2009).
Figure 1.1. Schematic description of lysosomal system (modified from Ciechanover 2005).
Exogenous proteins are targeted to the lysosome through receptor-mediated endocytosis and pinocytosis.
Exogenous particles or bacteria are targeted by phagocytosis. Endogenous proteins and cellular organelles are
targeted by microaoutophagy and macroautophagy, respectively.
The majority of lysosomal hydrolases are tagged by mannose-6-phosphate during
transport through the Golgi complex (Sleat et al 2005), which are later recognized by
mannose-6-phosphate receptors (MPRs) in the trans-golgi network (TGN) (Kornfeld and
Mellman 1989, von Figura and Hasilik 1986). These ubiquitiously expressed receptors could
either be the cation-dependent MPR of 46 kD (MPR46 or CD-MPR) or the cation-
independent MPR of 300 kD (MPR300 or CI-MPR) (Gosh et al 2003, Braulke and
Bonifacino 2009). The MPR-ligand complexes form a membranic intermediate with clathrin.
The later complex exits the TGN and fuses with early endosomes. In this mildly acidic
compartment (pH 6), the MPR-ligand is dissociated to release the cargo, and the MPR is

Introduction
3
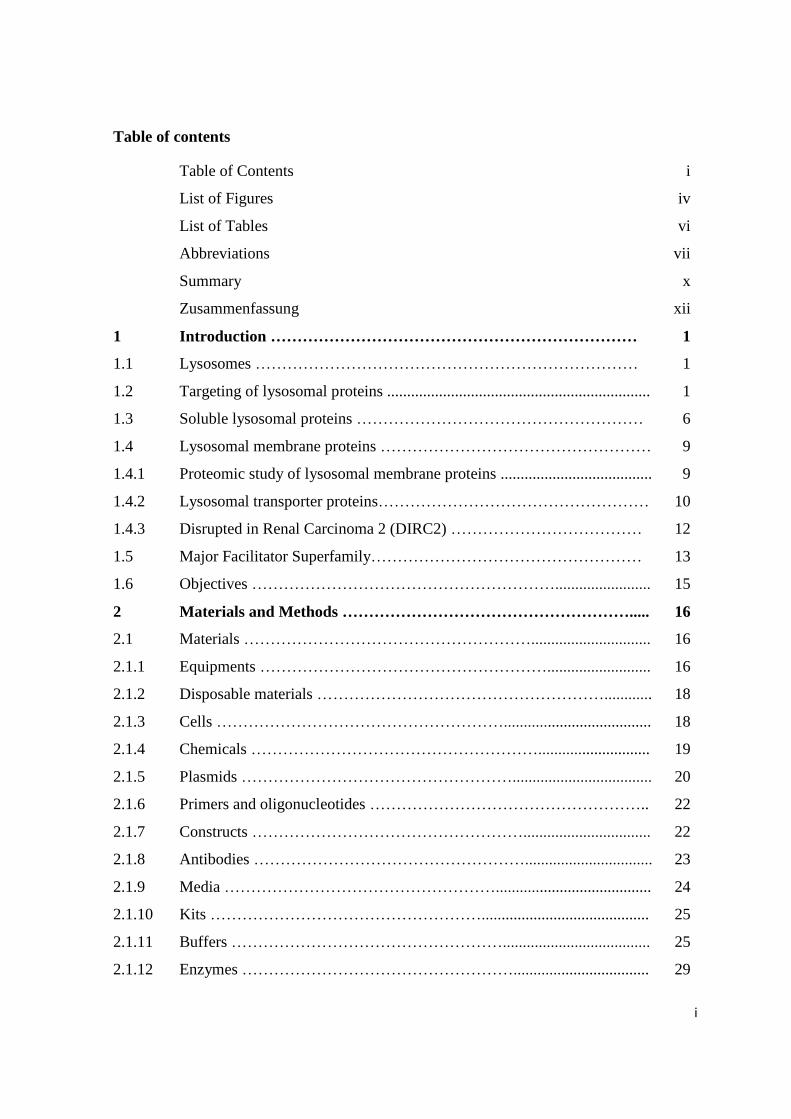
transported back to the TGN for further cycles of transport (Figure 1.2). The acid hydrolases
follow subsequent maturation steps of early endosomes, which involve several fusion evens,
and are finally contained in mature lysosomes (Figure 1.2). A minor amount of MPRs (up to
10%), exclusively of the CI-MPR/MPR300 type, are also found at the plasma membrane and
reported to be involved in the endocytosis of exogenous ligands (Braulke et al 1987, Breuer et
al 1997, Braulke and Bonifacino 2009).
Figure 1.2 Targeting of lysosomal proteins (taken from Braulke and Bonifacino 2009).
All mannose-6-phosphate modified hydrolases bind to mannose-6-phosphate receptor or to sortilin in the TGN,
whereas beta-glucocerebrosidase binds to LIMP-2. The enzyme-receptor complex concentrates in the
clathrin/GGA/AP-1-coated areas of the TGN followed by transport to endosomes. In this acidic compartment,
hydrolases are released from their receptors and follow subsequent maturation steps. MPR and sortilin are
transported back to the TGN by a set of retrograde transport machinery, which includes retromer and TIP47,
whereas LIMP-2 resides in the limiting membrane of lysosomes. MPR and other receptor may also act as a
receptor for extracellular proteins. TGN, trans-Golgi network; βGC, beta-glucocerebrosidase; LIMP-2, lysosome
integral membrane protein 2; MVB, multivesicular body; GGA, golgi-localized -ear containing adenosine
diphosphate ribosylation factor-binding protein; AP, adaptor protein; TIP47, tail interacting protein of 47 kDa.
LIMP-2
Introduction
4
Study of patients with I-cells disease (mucolipidosis type II) demonstrated that they,
despite the lack of mannose-6-phosphate tagged lysosomal hydrolases due to defective
GlcNAc-1-phosphotransferase, do have normal lysosomal enzyme levels in many organs
(Waheed et al 1982, Kornfeld and Sly 2001). Further studies on either GlcNAc-1-
phosphotransferase-knockout mice (Gelfman et al 2007) or mice deficient for both type sof
MPR46 and MPR300 (Dittmer et al 1999) have also revealed similar observations. This led to
the unravelling of the existence of MPR-independent route(s) for the transport of lysosomal
hydrolases. To date, however, very limited information is known about the MPR-independent
pathway. Among these alternative receptor proteins sortilin has been described to mediate
lysosomal trafficking of prosaposin and acid sphingomyelinase (Lefrancois et al 2003, Ni and
Morales 2006), and more recently the lysosomal integral membrane protein type 2 (LIMP-2)
has been identified as a specific receptor for lysosomal transport of -glucocerebrosidase
(GC, Figure 1.2) (Reczek et al 2007).
In contrast to most soluble lysosomal proteins, lysosomal membrane proteins are not
modified with mannose-6-phosphate and their transport from TGN to the lysosome is mostly
independent of MPRs. The transport of lysosomal membrane proteins is achieved either by
direct intracellular route or by indirect route through plasma membrane followed by
subsequent endocytic evens (Janvier and Bonifacino 2005). The signals for lysosomal
targeting of lysosomal membrane proteins are mostly contained in their cytosolic tails
(Bonifacino and Traub 2003). The best characterized lysosomal targeting signals for
lysosomal membrane proteins are the tyrosine motif YXXØ (Peters et al 1990, Williams and
Fukuda 1990) and the dileucine motif DEXXXLLI, where X represents any amino acid
and Ø represents hydrophobic amino acid (Letourneur and Klausner 1992). Additionally, it
has also been known that the mannose-6-phosphate receptor proteins have their own sorting
signals (Gosh 2003). This signal consists of a cluster of acidic residues followed by a
dileucine motif (DDSDEDLL in the MPR300 and EESEERDDHLL in the MPR46, or simply
DXXLL motif) (Braulke and Bonifacino 2009). Some examples of lysosomal membrane
proteins with their respective lysosomal targeting signals are listed in Table 1.1. The role of
LIMP-2 as a receptor for GC and the fact that this protein itself is a lysosomal membrane
protein, which is not recycled back to the TGN after releasing of GC, has shown that the
lysosomal targeting pathways of membrane protein and soluble lysosomal protein can overlap
(Saftig and Klumperman 2009).

Introduction
5
DXXLL signals are also known as the minimal motif, since alteration of either aspartic
acid or any of the two leucines to small amino acid such alanine leads to inactivation of the
signals and causes mis-targeting of protein to the cells surface membrane. Most DXXLL
signals are located nearly at the end of carboxy termini of cytosolic tail of lysosomal
membrane proteins. DXXLL signals are recruited by the mammalian GGAs through their
VHS domain (domain present in Vps27p, Hrs, Stam protein; Bonifacino and Traub 2003).
GGAs belong to the family of ADP-ribosylation factor (ARF)-dependent clathrin adaptors
localized to the TGN and endosomes (Figure 1.2; Bonifacino and Traub 2003). It has also
noticed that the interaction between GGAs and DXXLL is highly specific, as VHS domains
from other proteins, such as Hrs, STAM1, TOM1 and TOM1L1 do not bind DXXLL signals.
Accordingly, the VHS domains of the GGAs recruit neither DEXXXLLI nor YXXØ
signals (Bonifacino and Traub 2003).
DEXXXLLI Signals are very important in sorting of many of type I, type II and
multispanning transmembrane proteins (Table 1.1). As in the case of DXXLL signals, the
DEXXXLLI signals commonly have acidic cluster preceding the dileucine motif. In
addition, the first leucine of this signal is not interchangeable with isoleucine without loss of
activity, whereas substitution of the second leucine with isoleucine retains signal activity
(Letourneur and Klausner 1992). In contrast to the DXXLL signals, the DEXXXLLI
signals of late endosomal or lysosomal proteins are commonly located close to
transmembrane domains (typically 6-11 residues apart). Additionally, these signals can be
either at the carboxy termini (e.g. NPC1, LIMP-2) or at the amino termini (e.g. Ii) (Bonifacino
and Traub 2003). These signals are recruited by adaptor proteins (APs) which later form
complex with clathrin (Figure 1.2).
Also known as tyrosine-based sorting signals, the YXXØ motifs interact with the
subunits of adaptor protein which later form complexes with clathrin. These signals also
require that they are located close to transmembrane domains (6-11 residues) to be effectively
recruited by the adaptor proteins.

Introduction
6
Table 1.1 Examples of dileucine-based and tyrosine-based sorting signals (adapted from Braulke and Bonifacino 2009).
Protein Motif Sequence
Type DXXLL
MPR300/Cl-MPR SFHDDSDEDLL
MPR46/CD-MPR EESEERDDHLL
Sortilin GYHDDSDEDLL
SorLA/SORL1 ITGFSDDVPMV
GGA1 (1) ASVSLLDDELM
GGA1 (2) ASSGLDDLDLL
GGA2 VQNPSADRNLL
GGA3 NALSWLDEELL
Type DEXXXLLI
LIMP-2 DEGTADERAPLI
NPC1 EERYKGTERERLL
Mucolipin-1 PAGPRGSETERLL
Sialin DGEESTDRTPLL
GLUT8 PEDPEETQPLL
Invariant chain (Ii) EDQKPVMDDQRDL
I
Type YXXØ
LAMP-1 GYQTI
LAMP-2A GYEQF
LAMP-2B GYQTL
LAMP-2C GYQSV
CD63 GYEVM
CD68 AYQAL
Endolyn AYQAL
DC-LAMP GYQRI
Cystinosin GYDQL
Sugar phosphate exchanger 2 GYKEI
Acid phosphatase GYRHV
1.3 Soluble Lysosomal Proteins
Degradative function of lysosomes are carried out by hydrolytic enzymes which are,
according to their substrates, classified as proteases, glycosidases, lipases, nucleases,
phosphatases and sulfatases (Journet et al 2002, Kollmann et al 2005, Sleat et al 2005).
Lysosomal proteases include three subgroups which represent their active site amino acids:
cysteine, aspartic and serine proteases (Brix 2005, Siintola 2008). Although they are
contained within the lumen of lysosomes and protected by the lysosomal membrane, the
proteases are usually detected within all vesicles of the endocytic pathway, i.e. early
endosomes, late endosomes, autophagic vacuoles, and lysosomes. Several lysosomal
proteases such as the aspartic proteinase cathepsin D or cysteine proteases cathepsin B, H and
L, were reported to be ubiquitiously expressed, while others tend to be tissue-specific (Brix
2005).

Introduction
7
Among lysosomal proteases, lysosomal cysteine proteases have long been subject of
many studies. Lysosomal cysteine proteases, also known as cathepsins, are optimally active in
the acidic and reducing condition found in lysosomes. Nevertheless, recent studies emphasize
that cathepsins are not only active in the acidic milieu of endosomes/lysosomes. A nuclear
isoform of cathepsin B has been reported to be involved in the development of thyroid
malignancies (Tedelind et al 2010). Similarly, a cathepsin L isoform devoid of a signal
peptide has also been reported to be localized in the mammalian cell nucleus (Goulet et al
2004). Cathepsin cysteine proteases share similar amino acid sequences and folds, and
comprise a group of papain-related enzymes (Turk 2001).
Table 1.2 Human lysosomal cysteine proteases: Nomenclature and properties (taken from Turk et al 2001).
Name Synonyms Endopeptidase Exopeptidase Chromosome
localization Carboxypeptidase Aminopeptidase
cathepsin L - + - - 9q21
cathepsin V cathepsin L2 + - - 9q21
cathepsin U
cathepsin S - + - - 1q21
cathepsin K cathepsin O + - - 1q21
cathepsin O2
cathepsin X
cathepsin W Lymphopain n.d. n.d. n.d. 11q13
cathepsin F - + - - 11q13
cathepsin O - n.d. n.d. n.d. 4q31-32
cathepsin B cathepsin B1 + + - 8p22-23
dipeptidase
cathepsin X cathepsin Z - + - 20q13
cathepsin P monopeptidase
cathepsin Y also dipeptidase
cathepsin H cathepsin I + - + 15q24-25
monopeptidase
cathepsin C dipeptidyl peptidase I - - +
cathepsin J dipeptidase 11q14
The majority of cathepsins are endopeptidases with exception of cathepsin C
(aminopeptidase, Barret et al 1998), cathepsin X (carboxy mono- or dipeptidase, Klemencic et
al 2000). Cathepsin B and H, which are endopeptidases, also show carboxypeptidase and

Introduction
8
aminopeptidase activity, respectively (Turk et al 2001). Cathepsins are synthesized as
proenzymes which require activation step(s). In vivo activation of procathepsins of the
endopeptidase subgroup can be achieved by autoactivation in acidic environment or by
glycosaminoglycans (Turk et al 2000). In contrast, the true exopeptidases, cathepsin X and
cathepsin C, need to be activated by the activity of endopeptidases, such as cathepsin L and S
(Nägler et al 1999, Dahl et al 2001, Turk et al 2001). Table 1.2 summarizes the nomenclature
and properties of lysosomal cathepsins.
An example of a well described cathepsin cysteine protease is given by the cathepsin
B. It is the first cathepsin being crystallized (Musil et al 1991, Turk 2001) and the first
cathepsin being knocked out (Deussing et al 1998, Foghsgaard et al 2001, Brix 2005).
However, cathepsin B knockout mice have shown no overall alteration in their phenotype
(Deussing et al 1998), but a reduction in premature intrapancreatic trypsinogen activation, and
increased resistance to tumor necrosis factor-alpha mediated hepatocyte apoptosis
(Foghsgaard et al 2001, Guicciardi et al 2001). Its activity is inhibited by cysteine protease
inhibitor such as leupeptin, cystatin B and E-64.
Cathepsin L represents one of the most potent lysosomal cysteine protease. It is 10 to
15 times more active than cathepsin B (Gordon et al 1995). It is involved in the processing of
the spike (S) protein of severe acute respiratory syndrome coronavirus (SARS-CoV) (Bosch
et al 2008) and in the perforin processing (Konjar et al 2010). However, as in the case of
cathepsin B, cathepsin L deficient mice show only a mild phenotype, i.e. a reduction in CD+ T
cells (Nakagawa et al 1998) and recurrent hair loss (Roth et al 2000) and in the turnover of
autophagolysosomes (Dennemaerker et al 2010). This suggests that lysosomal cysteine
proteases are likely to be redundant (Nagler and Menard 2003, Brix 2005). On the other hand,
a severe phenotype was reported in cathepsin B and L double deficient mice, which showed
an early-onset brain atrophy which led to the death of animal four weeks after birth (Felbor
2002).
The above description of cathepsins, represented by cathepsin B and L, highlights the
challenges in the understanding of the specific roles and natural substrates of individual
lysosomal proteases.

Introduction
9
1.4 Lysosomal Membrane Proteins
The limiting membrane of lysosomes contains a set of highly glycosylated lysosomal-
associated membrane proteins (LAMPs) such as LAMP-1 and LAMP-2, and lysosomal
integral membrane proteins such as LIMP-1 (CD63/LAMP-3) and LIMP-2. The limiting
membrane has multiple functions including acidification of the lysosomal matrix,
sequestration of the lysosomal enzymes from the rest of the cytoplasm, mediation of fusion
events between lysosomes and other organelles, and transport of degradation products back to
the cytosol (Eskelinen et al 2003).
Lysosomes were initially thought to be non-specifically permeable to small molecules,
allowing the degraded materials within the lysosomes to be transported out of lysosomes for
further use. This view was changed after the identification of protein-mediated pathway for
cystine across the lysosome membrane (Gahl et al 1982, Jonas et al 1982). Further studies
have also revealed the existence of transport pathways for amino acids, di- or tripeptides,
sugars, inorganic ions and nutrients in purified lysosomal fractions (Pisoni and Thoene 1991,
reviewed by Sagné and Gasnier 2008). Thereafter, many studies have been carried out to
unravel the composition and the dynamic of lysosomal membrane.
1.4.1 Proteomic study of lysosomal membrane proteins
The study of lysosomal membrane proteins relies mostly on the availability of a highly
pure lysosomal fraction. A comprehensive study of lysosomal membrane composition has
been performed by Bagshaw and colleagues (Bagshaw et al 2005). This study has taken
advantage of shifting the buoyant density of rat lysosomes by treating the rat with Triton
WR1339, which provides a comfortable fractionation step in a sucrose gradient. In this way,
the Triton WR1339-filled lysosomes (Tritosomes) retain their lysosomal enzymes activities,
as well as their ability to fuse with endosomes/phagosomes. The subsequent tandem MS
analysis of the fraction enriched in lysosomes has revealed over 200 proteins, with many of
which were previously associated with lysosomes/endosomes (Bagshaw et al 2005).
However, copurification of endoplasmic reticulum, golgi, cytosol, plasma membrane and lipid
raft proteins in the lysosome enriched fraction could not be avoided.

Introduction
10
Subsequent advance in the proteomics study of lysosomal membrane protein has been
reported by Schroeder et al (Schroeder et al 2007). In this study, lysosomal membrane
proteins were isolated from human placenta and statistical analysis was introduced to
significantly exclude co-purified proteins. A lysosome enriched fraction was initially
produced by percoll gradient centrifugation, followed by selective disruption of lysosomes of
the lysosome enriched fraction by applying osmotic stress during incubation with methionine
methyl ester. The co-purified mitochondria and lipofuscin were then removed in the sucrose
and iodixanol gradient centrifugation, consecutively. LC-MS/MS data of the lysosomal
membrane enriched fraction were compared to the data from material after the first density
gradient centrifugation. By using this strategy, Schroeder et al were able to exclude the
majority of known mitochondrial, ER, plasma membrane and peroxisomal membrane
proteins. 58 proteins previously known to reside at least partially in lysosomes were
confirmed, and additional 86 proteins were significantly enriched in the lysosomal membrane
fraction, 12 of which were novel proteins with unknown function (Schroeder et al 2007,
reviewed in Lübke et al 2009).
1.4.2 Lysosomal transporter proteins
The significance of the lysosome is underlined by the fact that around 50 diseases are
related to lysosomal storage dysfunction. The majority of the diseases are caused by defects in
soluble lysosomal proteins, whereas only few are related to defect in lysosomal membrane
proteins. With the sole exception in the Mucopolysaccharidosis IIIC disorder (MPS IIIC, or
Sanfilippo C syndrome, Hrebicek et al 2006), all of the known diseases related to the defect in
the lysosomal membrane proteins are caused by defects in non-enzymatic membrane proteins,
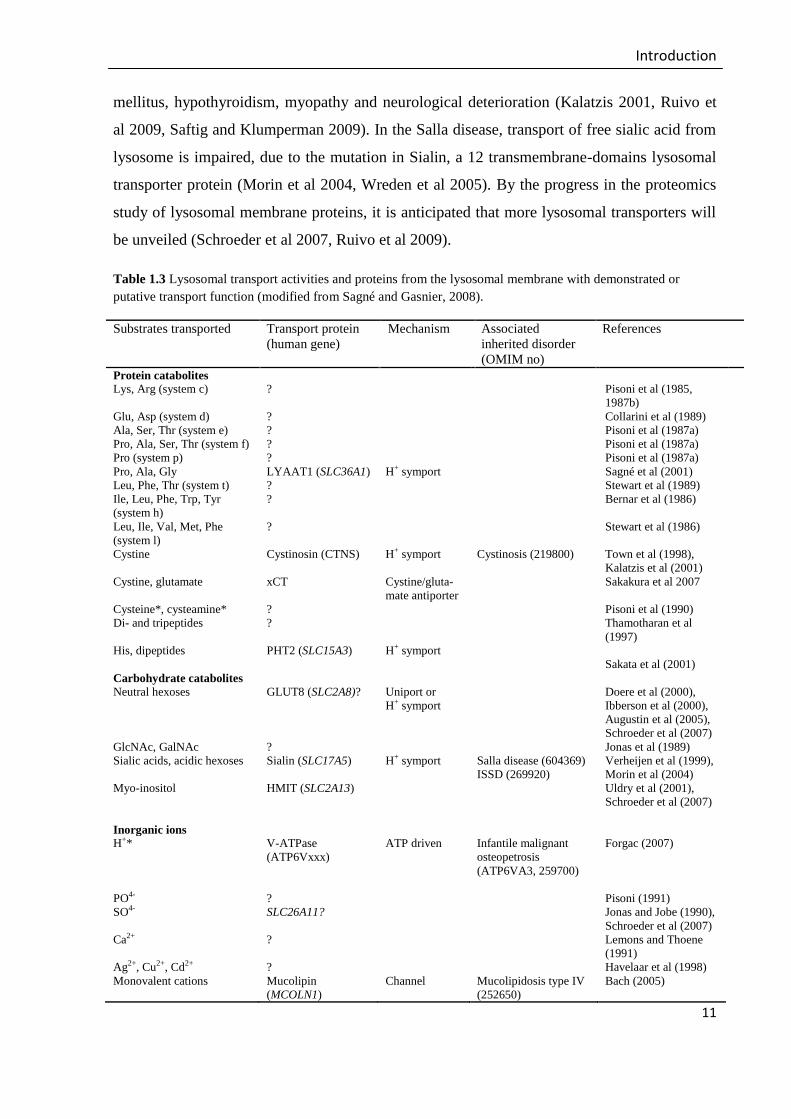
i.e. lysosomal transporter, channel or receptor proteins (Ruivo et al 2009). Table 1.3 lists a
number of lysosomal transport proteins, which includes those related to lysosomal storage
diseases.
The first characterized lysosomal storage disorder caused by failure of the transport of
catabolism products across lysosomal membrane is cystinosis. In this disease, Cystinosin, a 7-
transmembrane-domain transporter, is defective and result in the failure to export cystine out
of lysosomes. Clinical pathology of this disease are found in the kidney, eye, liver, muscles,
pancreas, brain and white blood cells and are manifested in growth retardation, diabetes
Introduction
11
mellitus, hypothyroidism, myopathy and neurological deterioration (Kalatzis 2001, Ruivo et
al 2009, Saftig and Klumperman 2009). In the Salla disease, transport of free sialic acid from
lysosome is impaired, due to the mutation in Sialin, a 12 transmembrane-domains lysosomal
transporter protein (Morin et al 2004, Wreden et al 2005). By the progress in the proteomics
study of lysosomal membrane proteins, it is anticipated that more lysosomal transporters will
be unveiled (Schroeder et al 2007, Ruivo et al 2009).
Table 1.3 Lysosomal transport activities and proteins from the lysosomal membrane with demonstrated or
putative transport function (modified from Sagné and Gasnier, 2008).
Substrates transported Transport protein
(human gene)
Mechanism Associated
inherited disorder
(OMIM no)
References
Protein catabolites
Lys, Arg (system c) ? Pisoni et al (1985,
1987b)
Glu, Asp (system d) ? Collarini et al (1989)
Ala, Ser, Thr (system e) ? Pisoni et al (1987a)
Pro, Ala, Ser, Thr (system f) ? Pisoni et al (1987a)
Pro (system p) ? Pisoni et al (1987a)
Pro, Ala, Gly LYAAT1 (SLC36A1) H+ symport Sagné et al (2001)
Leu, Phe, Thr (system t) ? Stewart et al (1989)
Ile, Leu, Phe, Trp, Tyr
(system h)
? Bernar et al (1986)
Leu, Ile, Val, Met, Phe
(system l)
? Stewart et al (1986)
Cystine Cystinosin (CTNS) H+ symport Cystinosis (219800) Town et al (1998),
Kalatzis et al (2001)
Cystine, glutamate xCT Cystine/gluta-
mate antiporter
Sakakura et al 2007
Cysteine*, cysteamine* ? Pisoni et al (1990)
Di- and tripeptides ? Thamotharan et al
(1997)
His, dipeptides PHT2 (SLC15A3) H+ symport
Sakata et al (2001)
Carbohydrate catabolites
Neutral hexoses GLUT8 (SLC2A8)? Uniport or
H+ symport
Doere et al (2000),
Ibberson et al (2000),
Augustin et al (2005),
Schroeder et al (2007)
GlcNAc, GalNAc ? Jonas et al (1989)
Sialic acids, acidic hexoses Sialin (SLC17A5) H+ symport Salla disease (604369)
ISSD (269920)
Verheijen et al (1999),
Morin et al (2004)
Myo-inositol HMIT (SLC2A13) Uldry et al (2001),
Schroeder et al (2007)
Inorganic ions
H+*
V-ATPase
(ATP6Vxxx)
ATP driven Infantile malignant
osteopetrosis
(ATP6VA3, 259700)
Forgac (2007)
PO4- ? Pisoni (1991)
SO4- SLC26A11? Jonas and Jobe (1990),
Schroeder et al (2007)
Ca2+ ? Lemons and Thoene
(1991)
Ag2+, Cu2+, Cd2+ ? Havelaar et al (1998)
Monovalent cations Mucolipin
(MCOLN1)
Channel Mucolipidosis type IV
(252650)
Bach (2005)

Introduction
12
Fe2+ and other divalent
metal ions
DMT1 (SLC11A2),
IRE + splicing
isoform
H+ symport Gunshin et al (1997),
Tabuchi et al (2002)
K+, Cl- KCC1 (SLC12A4) K+, Cl- symport Schroeder et al (2007)
Zn2+* ZnT2 (SLC30A2) Palmiter et al (1996),
Schroeder et al (2007)
Cl- CLC-7 (CLCN7) +
Ostm1 (OSTM1)
H,, Cl-
antiporter
Infantile malignant
osteopetrosis (259700)
Kornak et at (2001),
Lange et al (2006),
Weinert et al (2010)
Other
Polymannose* ? Saint-Pol et al (1997,
1999)
Nucleosides ENT3 (SLC29A3) Uniport or
H+ symport
Baldwin et al (2005)
Folylpolyglutamate ? Barrueco and Sirotnak
(1991), Barrueco et al
(1992)
Vitamin B12 LMBD1 (LMBRD1) Rutsch et al (2009)
6-mer peptides* TAP-like (ABCB9) ATP-driven Wolters et al (2005)
Unknown
Arg, Lys? CLN3 Juvenil neuronal
ceroid-lipofuscinosis
(204200)
Consortium (1995),
Kim et al (2006),
Ramirez-Montealegre
and Pearce (2005)
? CLN7 (MFSD8) Late infantile neuronal
ceroid-lipofuscinosis
(610951)
Bagshaw et al (2005),
Schroeder et al (2007),
Siintola et al (2007)
Fatty acids? NPC1 Niemann-Pick disease
type C1 (257220)
Carstea et al (1997),
but see Passeggio and
Liscum (2005)
? P40 Boonen et al (2006)
? Spinster-like protein
1
Bagshaw et al (2005),
Schroeder et al (2007)
Choline? CTL2 (SLC44A2) Schroeder et al (2007)
? C19orf28 Schroeder et al (2007)
Asterisks (*) indicate the substrates which are imported into the lysosomes under physiological conditions.
Transport proteins underlying these activities are indicated in the second column. Most known proteins are
secondary active transporters indirectly driven by the lysosomal ATPase through an H+ coupling mechanism.
The table also lists primary transporters which are directly coupled to ATP hydrolysis and ion channels.
Inherited diseases resulting from mutations of the corresponding genes are indicated in the fourth column.
1.4.3 Disrupted in Renal Carcinoma 2 (DIRC2)
The DIRC2 gene was initially reported in the context of renal carcinoma as this gene
spans the breakpoint of a chromosomal translocation observed in a few cases of familial renal
cancer (Bodmer et al 2002). DIRC2 gene is expressed in various tissues, including kidney.
DIRC2 encodes a predicted protein of 478 amino acids residues with a high homology to the

Introduction
13
human feline leukaemia virus subgroup C receptor, FLVCR (Bodmer et al 2002). FLVCR
involves in the transport of free heme out of cytoplasm, which is other ways toxic for the cells
(Keel et al 2008). DIRC2 shows also similarity to various putative transporters of major
facilitator superfamily (MFS, section 1.5) transporter proteins. Transcript of the DIRC2 shows
a high homology (80%) to the transcripts from different species, including monkey, pig, dog
and mouse (Bodmer et al 2002). A significant degree of homology (30-45%) of human
DIRC2 to different proteins from Leishmania major and Arabidopsis thaliana has also
emphasized the conservation of this protein (Bodmer et al 2002).
DIRC2 is predicted to have 12 transmembrane spanning domains, which is the basic
characteristic of MFS. Additionally, it has a conserved MFS-specific signature sequence
which lays between transmembrane domain 2 and 3 (Maiden et al 1987, Law et al 2008,
Bodmer et al 2002). DIRC2 is one of putative lysosomal membrane proteins identified in a
recent proteomics study of lysosomes purified from human placenta (Schroeder et al 2007).
Bioinformatic analysis of this DIRC2 suggests that it contains one glycosylation site and
several phosphorylation sites. Additionally, DIRC2 has a proline rich region (P-x-x-P)
between transmembrane domain 6 and 7, which is known to be a potential interaction site
with Src homology 3 (SH3) domains from several proteins (Rickles et al 1994, Bodmer et al
2002). Apart from this genetic description of DIRC2, there is currently no further report about
the biochemical and molecular aspects of DIRC2.
1.5 Major Facilitator Superfamily
Transport of biomolecules and inorganic materials across cytoplasmic and vesicular
membranes is very important for the life of cells. The transport across membranes can be
driven by the energy released by hydrolysis of ATP (primary transporters), or by the use of
energy stored in the ion or solute gradients generated by primary transporters (so-called
secondary transporters). In the group translocation system commonly found in bacteria,
chemical modification of substrate results in transport of substrate onto the opposite side of
membrane (Law et al 2008). The MFS proteins transport their substrate by uniport
(translocation of a single species), symport (translocation of substrate and an ion in the same
direction) or antiport (translocation of substrate and an ion or another substrate in opposite
directions) (Kaback et al 2001).

Introduction
14
Major facilitator superfamily (MFS) represents a group of secondary transporter
proteins with thousands of members from all kingdoms of life and all living cells (Law et al
2008). In prokaryotes, around 25% of all known membrane transport proteins belong to the
MFS (Saier et al 2003). This large superfamily is subgrouped into tenth of families on the
base of both their functionality and phylogenic data (Saier et al 1999).With exception of only
three families among 58 families known to date, all proteins belonging to MFS are
characterized by twelve -helices transmembrane domains (TMDs) connected by hydrophilic
loops, and both their N- and C-termini reside in the cytoplasm (Pao et al 1998, Saier 2003).
The difficulty to purify, crystallize and resolve the structure of MFS protein has long
kept the gap between structural and functional study of MFS proteins. Despite the lack of
structural evidence, a growing list of human diseases has been related to the mutation of
transporter proteins (Kaback et al 2001). Nevertheless, the current understanding of MFS
transporter protein was boosted by the high-resolution structures of two proteins from this
superfamily: the lactose permease symporter (LacY; Abramson et al 2003) and the glycerol-3-
phosphate antiporter (GlpT; Huang et al 2003) from Escherichia coli. An intriguing fact of the
two MFS proteins of different family is that they have very similar structure, although they
share only 21% sequence identity. Significant sequence similarities are only identified among
MFS proteins within the same family (Pao et al 1998). This leads to the hypothesis that all
members of the MFS share a common structure (Vardy et al 2004).
The above hypothesis is further strengthened after the high-resolution structure of E.
coli multidrug transporter emrD (Yin et al 2006) and the lower-resolution structure of
O. formigenes OxlT (Hirai and Subramaniam 2004) have been resolved. Structural analysis
of MFS has also revealed that the 12 transmembrane domains of MFS protein are clustered
into two halves of 6 transmembrane-domains, and that the two halves are pseudo-symmetric
to each other with a pore between the clusters which is essential for substrate binding (Law et
al 2008). In accordance with this view, the only MFS protein consisting of 6 transmembrane
domains likely functions as a homodimer, whereas the MFS family with 24 transmembrane
domains is likely to be a result of gene fusion event (Pao et al 1998, Saier 2003).
Additionally, the two transmembrane domain clusters are separated by a long central loop,
typically more than 30 residues, which is very important for efficient insertion of MFS protein

Introduction
15
into biological membranes. It has also noted that the central loop is unlikely to be involved in
transport activity, as the two clusters can be expressed separately and demonstrate similar
transport activity as the wild type (Weinglass and Kaback 2000).
1.6 Objectives
Since its first genetic description on 2002 (Bodmer et al 2002), followed by
confirmation of its putative lysosomal residence by a proteomics approach (Schroeder et al
2007), there is no further study reported about the DIRC2. Hence, this study aims at the
characterization of biochemical properties of the DIRC2 protein. This includes verification of
its lysosomal localization, trafficking, post-translational modification, processing of the
protein and downregulation of its expression.
This study takes an advantage from bioinformatic tools which help in the modelling of
the topology of DIRC2, as well as in the designing of several DIRC2 mutants aimed at
elaborating possible motifs, such as lysosomal targeting motif and glycosylation motif.
Subcellular colocalization and trafficking of DIRC2 and DIRC2 mutants were investigated by
using organelles immunostaining. In the course of this study, an intriguing fact was revealed
that the DIRC2 is proteolytically processed. Efforts have been made to investigate the
protease account for the DIRC2 processing. This involves the use of several protease
inhibitors, from wide range protease inhibitors to specific protease inhibitors, to analyze the
processing of DIRC2. Some mouse embryonic fibroblasts (MEFs) cells deficient in several
proteases were also used to investigate the protease responsible for the processing of DIRC2.
The results of this study are expected to be the first biochemical characterization of
DIRC2, as well as an advance for further studies of other lysosomal transporter proteins.

Materials and Methods
16
2 Materials and Methods
2.1 Materials
2.1.1 Equipments
Table 2.1.1 below lists the equipments used in this study
Table 2.1.1 Equipments.
Equipment Model Company
Autoclave Tecnomara Integra Bioscience, Fernwald
Agarose gel electrophoresis
chamber
(Mini) Sub-Cell GT BioRad, Hercules, USA
Analytical balance Model 770-60 Kern and Sohn, Duerwangen
Sartorius Sartorius, Goettingen
Binocular CKX41 Olympus, Tokyo, Japan
Centrifuges Biofuge fresco Heraeus, Hanau
J6-HC Beckman, California, USA
J2-HS Beckman, California, USA
Centrifuge 5418 Eppendorf, Hamburg
Multifuge 3SR+ Heraeus, Hanau
Optima™ TLX
Ultracentrifuge
Beckman, California, USA
Optima™ LE-80K
Ultracentrifuge
Beckman, California, USA
Density gradient fractionator Auto Densi Flow Labconco, Missouri, USA
Fluorescence microscope Axiovert 200M Carl Zeiss, Jena
Ice machine AF30 Scotsman, Illinois, USA
Imager LAS-3000 mini Fujifilm, Carrolton, USA
Electric pipette Accu-jet®pro Brand, Wertheim
Electroporator Gene Pulse BioRad, Hercules, USA
Freezer -20oC Liebherr Liebherr, Bulle, Switzerland
Freezer -80oC Hera Freeze Heraeus, Hanau
Horizontal shaker KL2 Edmund Buehler, Hechingen
Swip Edmund Buehler, Hechingen
Incubator Certomat®H B. Braun Biotech
International, Melsungen
Modell 200 Memmert, Schwabach
Orbital incubator Gallenkamp, Loughborough,
UK

Materials and Methods
17
Liquid nitrogen tank Consartic Consartic, Schoellkippen
Magnetic stirrer IKAMAG®REO ScienceLab, Houston, USA
Microplate reader Sunrise™ Tecan, Männedorf,
Switzerland
Synergi™ 4 BioTek, USA
Take 3Modul BioTek, USA
Microwave NN-E245W China Panasonic
pH- Electrode Digital-pH-Meter 646 Krick, Langenselbold
Photometer GeneQuant pro Biochrom, Cambridge, UK
Nanodrop ND-1000 Peqlab Biotech, Erlangen
Power supply PowerPac 200/300/HC BioRad, Munich
Roller shaker RM 5 Assistent, Sondheim
Refrigerator GKS 500 Wolfram Ungermann, Wetter
SDS-PAGE electrophoresis
chamber
Mini-Protean 3 BioRad, Hercules, USA
Twin Model L Peqlab Biotech, Erlangen
Semi dry protein transfer Trans-Blot® SD-Cell BioRad, Hercules, USA
Thermobloc Thermomixer 5436 Eppendorf, Hamburg
Thermocycler GeneAmp Perkin Elmer, USA
PCR System 2400
Biometra® Tpersonal Analytik Jena
Biometra® TGRADIENT Analytik Jena
Ultrasonicator Micro Ultrasonic Cell Kimble/Kontes
Disrupter KT-50 Vineland, USA
UV-Documentation device Gel Jet Imager Intas, Goettingen
UV light Reprostar CAMAG, Berlin
Ultracentrifuge rotor JA 17 Beckman, California, USA
TLA55 Beckman, California, USA
Vortex minivortex Heidolph, Kelheim
Water purification Mili-Q Plus Ultra Pure Water
System
Milipore, Massachusetts,
USA

Materials and Methods
18
2.1.2 Disposable materials
Table 2.1.1 lists the materials used in this study
Table 2.1.2 Materials.
Material Type Company
96-Well Microplate Flat bottom Sarstedt, Nuembrecht
Blot paper Whatman Roth, Karlsruhe
Culture dishes Ø 3.5, 6, 10 cm Sarstedt, Nuembrecht
Gloves Rotiprotect-LATEX Roth, Karlsruhe
Rotiprotect-NITRIL Roth, Karlsruhe
Lens paper No. 1019 Assistant, Sondheim
Microscope cover glasses Ø 13 mm Assistent, Sondheim
Microscope slides Menzel-Glaeser Thermo Scientific,
Braunschweig
Mini tubes 1.5 mL, 2.0 mL Sarstedt, Nuembrecht
Conical tubes 15 mL, 50 mL Sarstedt, Nuembrecht
Nitrocellulose membrane Protran Whatman, UK
Parafilm Grösse M Pechiney Plastic Packaging,
Chicago, USA
Pipette tips Different sizes Sarstedt, Nuembrecht
Serological pipettes 5, 10, 25 mL Sarstedt, Nuembrecht
2.1.3 Cells
2.1.3.1 Bacteria:
Escherichia coli XL1-Blue (Stratagene, La Jolla, California, USA) endA1 gyrA96(nalR) thi-1
recA1 relA1 lac glnV44 F'[ ::Tn10 proAB+ lacI
q Δ(lacZ)M15] hsdR17(rK
- mK
+)
2.1.3.2 Mammalian cells:
Table 2.1.3 Mammalian cells used in this study.
Cell Source/Reference
HeLa (DSMZ, Deutsche Sammlung von Mikroorganismen und
Zellkulturen/German Collection of Microorganisms and Cell
Cultures, Braunschweig)
Cos7 DMSZ, Braunschweig
PS1+/+
wild type MEF De Strooper et al 1999

Materials and Methods
19
CathB-/-
MEF Halangk et al 2000; Reinheckel et al 2001
Cath BL-/-
MEF Sevenich et al 2006
Cath L-/-
MEF Roth et al 2000; Reinheckel et al 2001
Cath D-/-
MEF Saftig et al 1995
2.1.4 Chemicals
Below is list of chemicals used. Common chemicals used for buffers and solutions are given
separately in the section 2.1.11.
Table 2.1.4 Chemicals used in this study.
Chemical Company
β-D-glucopyranoside Sigma-Aldrich, Taufkirchen
Acrylamide/bis-acrylamide solution Roth, Karlsruhe
Agarose Roth, Karlsruhe
Ammonium persulfate Roth, Karlsruhe
Bacto agar Roth, Karlsruhe
Bacto pepton Roth, Karlsruhe
Bafilomycin A1 Sigma-Aldrich, Taufkirchen
Brefeldin A Sigma-Aldrich, Taufkirchen
CA-074-Me cathepsin B inhibitor Biomol, Pennsylvania, USA
Complete Protease Inhibitor Roche, Mannheim
Dabco Sigma-Aldrich, Taufkirchen
DMEM with L-Glutamine PAA, Pasching, Austria
DMSO Roth, Karlsruhe
dNTPs 2 mM Fermentas, St. Leon-Rot
E-64 cysteine protease inhibitor Merck, Darmstadt
Ethidium bromide 1% solution Roth, Karlsruhe
Fetal calf albumin (FCS) PAA, Pasching, Austria
FuGENE HD transfection reagent Roche, Mannheim
Leupeptin Sigma-Aldrich, Taufkirchen
Mowiol®4-88 Sigma-Aldrich, Taufkirchen
NH4Cl Roth, Karlsruhe
Non-fat milk powder Roth, Karlsruhe

Materials and Methods
20
Pefabloc Roth, Karlsruhe
Penicillin-Streptomycin PAA, Pasching, Austria
Pepstatin A Sigma-Aldrich, Taufkirchen
Percoll®
GE Healthcare, UK
PMSF Sigma-Aldrich, Taufkirchen
TEMED Roth, Karlsruhe
TRANSFERin siRNA trasnfection Polyplus, Strasbourg, French
Turbofect transfection reagent Fermentas, St. Leon-Rot
Vinblastine Lilly, Indiana, USA
Yeast extract Roth, Karlsruhe
Z-FY-CHO cathepsin L inhibitor II Calbiochem, San Diego, USA
2.1.5 Plasmids
1. pEGFP-N1 (Clontech)
Figure 2.1 pEGFP-N1.
pEGFP-N1 vector encodes a red-shifted variant of wild-type GFP which has been optimized for brighter
fluorescence (excitation maximum 488 nm and emission maximum 507 nm) and higher expression in
mammalian cells. It has a classical pUC origin of replication (ori) for propagation in E. coli, and SV40 ori for
replication in mammalian cells. The multi cloning site (MCS) of pEGFP-N1 is located between the pCMV
promoter and the N-terminus of EGFP, which allows the EGFP tag to be conjugated at the C-terminus of the
protein of interest. Cloning marker is provided by a neomycin-resistance cassette (Neor), consisting of the SV40
early promoter, and the neomycin/kanamycin resistance gene of Tn5).

Materials and Methods
21
2. pEGFP-C1(Clontech)
Figure 2.2 pEGFP-C1.
The vector pEGFP-C1 is similar
to the pEGFP-N1, except that the
genes cloned into the MCS will
be expressed as a fusion protein
to the C-terminus of EGFP.
3. pcDNA™3.1/Hygro(+) (Invitrogen)
Figure 2.3 pcDNA3.1/Hygro+.
The pcDNA3.1/Hygro+ vector is a mammalian
expression vector. It has a CMV promoter and a
hygromycin resistance coding gene and allows high level
transient and stable expression in mammalian cells

Materials and Methods
22
2.1.6 Primers and Oligonucleotides
Table 2.1.5 primers used to generate constructs in this study.
Name of primer Oligonucleotide sequence 5’→ 3’ Construct nr
pEGFP.C1_DIRC2 Fw CATGCAAGATCTATGGGCTCTCGCTGGAGCA 2
pEGFP.C1_DIRC2 Rv TAGAATTCTTAAACGGAGACAACCACAT 2
CLN7_3xMyc_XhoI_Rev
CCGCTCGAGTTACAGATCCTCTTCTGAGATGAGTTTTT
GTTCCAGATCCTCTTCTGAGATGAGTTTTTGTTCCAGA
TCTTCTTCAGAAATAAGTTTTTGTTCGGATCCTTCCTG
AATCCT
All, except
GFP construct
CLN7_HindIII_Fw GCTTAAGCTTGCCACCATGGCCGGCCTGCGG All, except
GFP construct
DL5A1.Ext.F TCCCAATGGGACAGCCGCAGCTGCAGCTGCG
GAGAGCAG 9
DL5A1.Ext.R CGCAGCTGCAGCTGCGGCTGTCCCATTGGGAGCTGG 9
DL5A2.Ext.F CTCTTCTTGCTGCAGCGGCTGCAGCTGCAGCCATTAAA
GATC 10
DL5A2.Ext.R TGCTGCTGCTGCTGCTGCTGCAGCAAGAAGAGGTGAT
G 10
DL5A3.Ext.F AGCAGGGCGCATGCAGCGGCCGCAGCTGCGGCTGTGT
TA TAT 11
DL5A3.Ext.R TGCTGCTGCTGCTGCTGCATGCGCCCTGCTGCTCTCTG
C 11
mCtsB_HindIII_Fw CTAGAAGCTTATGTGGTGGTCCTTG 12
mCtsB_XhoI_Rv CAGTCTCGAGTTAGAATCTTCCCCAG 12
mCtsL_HindIII_Fw CTAGAAGCTTATGAATCTTTTACTC 13
mCtsL_XhoI_Rv CAGTGAGCTCTCAATTCACGACAGGATAGC 13
Table 2.1.6 DIRC2 siRNA (Stealth Select RNAi™, Invitrogen, CA, USA).
Nr siRNA Oligonucleotide sequence 5’→ 3’
1 HSS131473 GGA GGC UGU GUU GUU GGA AUA GCU A
2 HSS131474 UCU UGA AUA GCA GCG UGC CUA UAU U
3 HSS131475 GCA GAA UUU GGA GUU GUC UGC UUA A
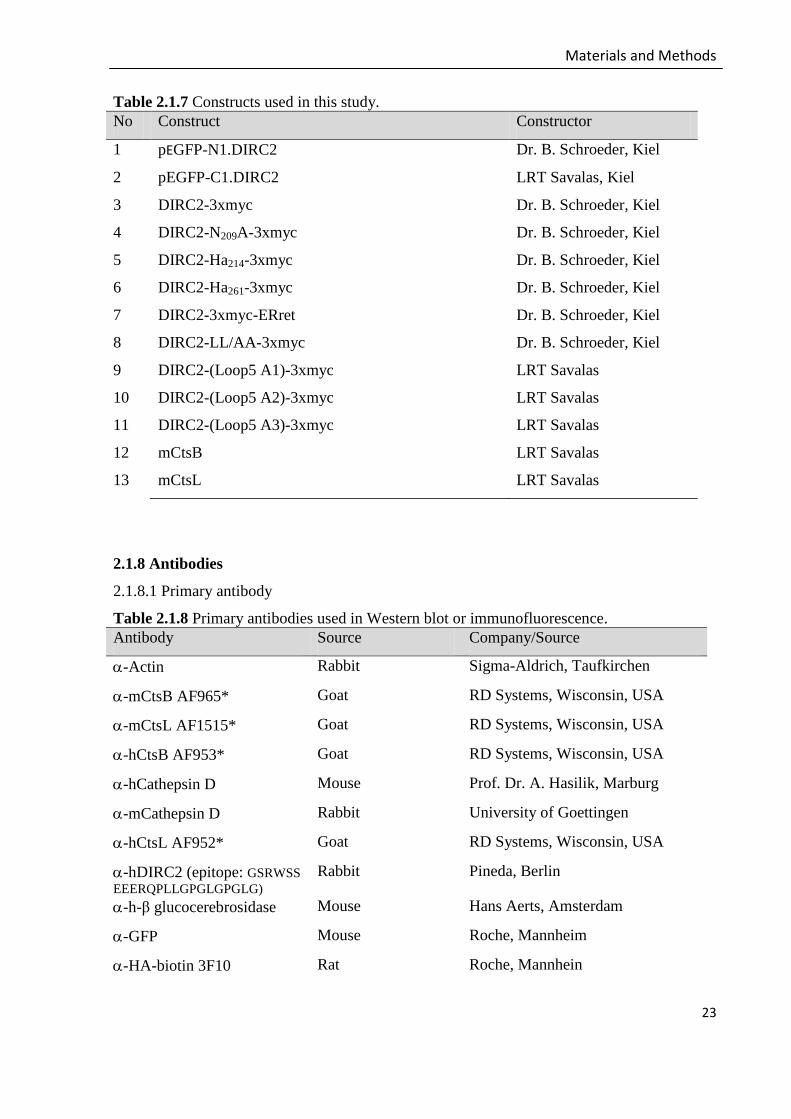
2.1.7 Constructs
Except otherwise indicated, all constructs below are placed in the multicloning site of
pcDNA3.1 mammalian expressing vector
Materials and Methods
23
Table 2.1.7 Constructs used in this study.
No Construct Constructor
1 pEGFP-N1.DIRC2 Dr. B. Schroeder, Kiel
2 pEGFP-C1.DIRC2 LRT Savalas, Kiel
3 DIRC2-3xmyc Dr. B. Schroeder, Kiel
4 DIRC2-N209A-3xmyc Dr. B. Schroeder, Kiel
5 DIRC2-Ha214-3xmyc Dr. B. Schroeder, Kiel
6 DIRC2-Ha261-3xmyc Dr. B. Schroeder, Kiel
7 DIRC2-3xmyc-ERret Dr. B. Schroeder, Kiel
8 DIRC2-LL/AA-3xmyc Dr. B. Schroeder, Kiel
9 DIRC2-(Loop5 A1)-3xmyc LRT Savalas
10 DIRC2-(Loop5 A2)-3xmyc LRT Savalas
11 DIRC2-(Loop5 A3)-3xmyc LRT Savalas
12 mCtsB LRT Savalas
13 mCtsL LRT Savalas
2.1.8 Antibodies
2.1.8.1 Primary antibody
Table 2.1.8 Primary antibodies used in Western blot or immunofluorescence.
Antibody Source Company/Source
-Actin Rabbit Sigma-Aldrich, Taufkirchen
-mCtsB AF965* Goat RD Systems, Wisconsin, USA
-mCtsL AF1515* Goat RD Systems, Wisconsin, USA
-hCtsB AF953* Goat RD Systems, Wisconsin, USA
-hCathepsin D Mouse Prof. Dr. A. Hasilik, Marburg
-mCathepsin D Rabbit University of Goettingen
-hCtsL AF952* Goat RD Systems, Wisconsin, USA
-hDIRC2 (epitope: GSRWSS
EEERQPLLGPGLGPGLG) Rabbit Pineda, Berlin
-h-β glucocerebrosidase Mouse Hans Aerts, Amsterdam
-GFP Mouse Roche, Mannheim
-HA-biotin 3F10 Rat Roche, Mannhein
Materials and Methods
24
-KDEL clon 10C3 Mouse Stressgen, San Diego, USA
-KDEL receptor clon KR10 Mouse Stressgen, San Diego, USA
-hLAMP-2 Mouse Prof. Dr. A. Hasilik, Marburg
-mLAMP-2 ABL93 Rat DSHB, Univ of Iowa, USA
-LBPA Mouse J. Gruenberg, Geneva
-myc Rabbit Santa Cruz, California, USA
-myc 9B11 Mouse Cell signaling, Danvers, MA, USA
-PDI Rabbit Santa Cruz, California, USA
-Tubulin-E7-beta Mouse DSHB, University of Iowa, USA
*) Catalog numbering system of the RnD Systems
2.1.8.2 Secondary antibody
Table 2.1.9 Secondary antibodies used in Western blot or immunofluorescence.
Antibody Source Company
α-Rabbit-IgG AF350#, AF488
#, AF594
# Goat Molecular Probes, Oregon, USA
α-Mouse-IgG AF350#, AF488
#, AF594
# Goat Molecular Probes, Oregon, USA
α-Rat-IgG AF350#, AF488
#, AF594
# Goat Molecular Probes, Oregon, USA
α-Rabbit-IgG HRP Donkey Santa Cruz, California, USA
α-Mouse-IgG HRP Sheep Dianova, Hamburg
α-Rat-IgG HRP Donkey Santa Cruz, California, USA
#) AF: Alexa Fluor, refers to the synthetic fluorescent dyes developed by the Molecular Probes,
Oregon, USA (currently part of Invitrogen)
2.1.9 Media
Bacterial culture:
Lysogeny Broth (LB) liquid media:
1% (w/v) tryptone
1% (w/v) NaCl
0.5% (w/v) yeast extract
Autoclaved at 121oC

Materials and Methods
25
LB plate
1% (w/v) tryptone
1% w/v) NaCl
0.5% (w/v) yeast extract
2% (w/v) bacto agar
Autoclaved at 121oC
Optional: for clone selection, appropriate antibiotic was added to the final concentration of 50
g/mL of ampicillin or kanamycin.
Cell culture
Dulbecco's Modified Eagle Medium (DMEM) with L-Glutamine
10% (v/v) fetal calf albumin (FCS)
100 I.U. Penicillin
100 g/mL Streptomycin
2.1.10 Kits
Table 2.1.10 Kits used in this study.
Kit Product Company
DNA recovery High Pure PCR Purification
Kit
Roche, Mannheim
Plasmid isolation PureYield™ Plasmid
Midiprep System
Promega, Madison, WI, USA
Gen JET™ Plasmid
Miniprep Kit
Fermentas, St. Leon-Rot
Protein determination BCA Protein Assay Kit Pierce, USA
Reverse transcription kit RevertAid™ Fermentas, St. Leon-Rot
RNA isolation NucleoSpin®
RNA II Macherey Nagel, Dueren
Western blot detection ECL™ Advance GE Healthcare, UK
2.1.11 Buffers
Below are the buffer used in this study. Except otherwise stated, chemicals are obtained from
Merck (Darmstadt), Roche (Mannheim), Roth (Karlsruhe), Serva (Heidelberg) or Sigma
Aldrich (Taufkirchen) with “p.a.” grades
Materials and Methods
26
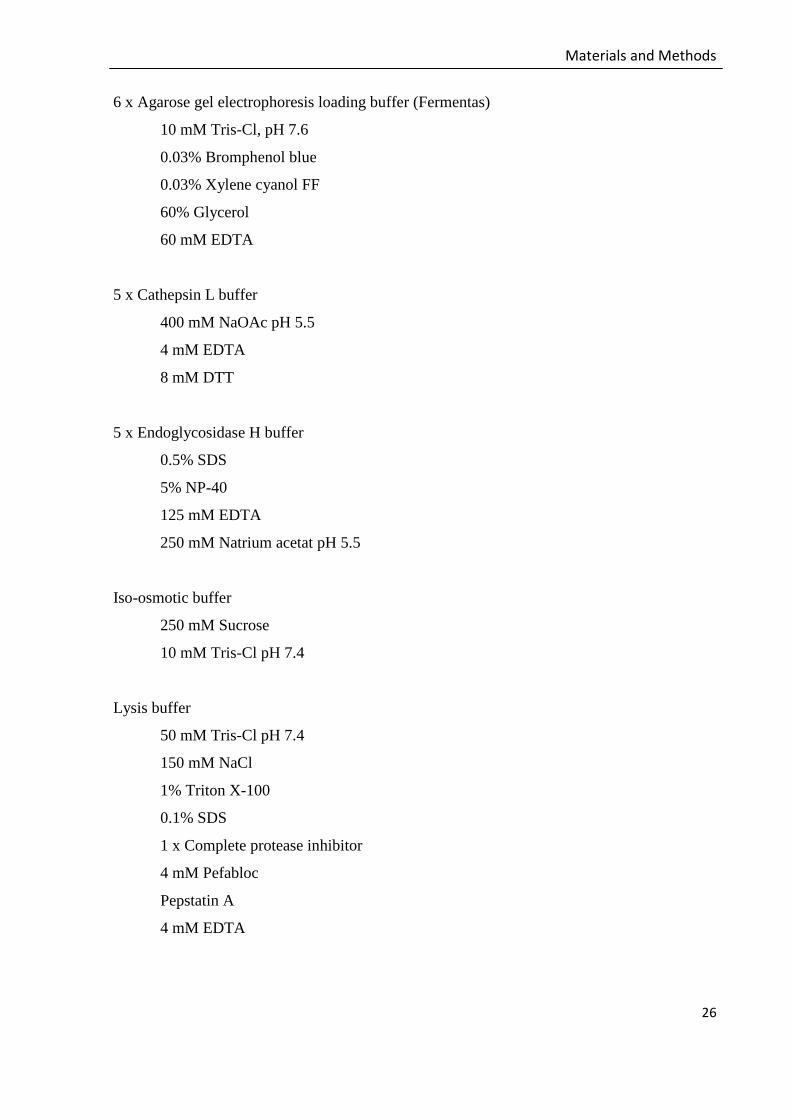
6 x Agarose gel electrophoresis loading buffer (Fermentas)
10 mM Tris-Cl, pH 7.6
0.03% Bromphenol blue
0.03% Xylene cyanol FF
60% Glycerol
60 mM EDTA
5 x Cathepsin L buffer
400 mM NaOAc pH 5.5
4 mM EDTA
8 mM DTT
5 x Endoglycosidase H buffer
0.5% SDS
5% NP-40
125 mM EDTA
250 mM Natrium acetat pH 5.5
Iso-osmotic buffer
250 mM Sucrose
10 mM Tris-Cl pH 7.4
Lysis buffer
50 mM Tris-Cl pH 7.4
150 mM NaCl
1% Triton X-100
0.1% SDS
1 x Complete protease inhibitor
4 mM Pefabloc
Pepstatin A
4 mM EDTA
Materials and Methods
27
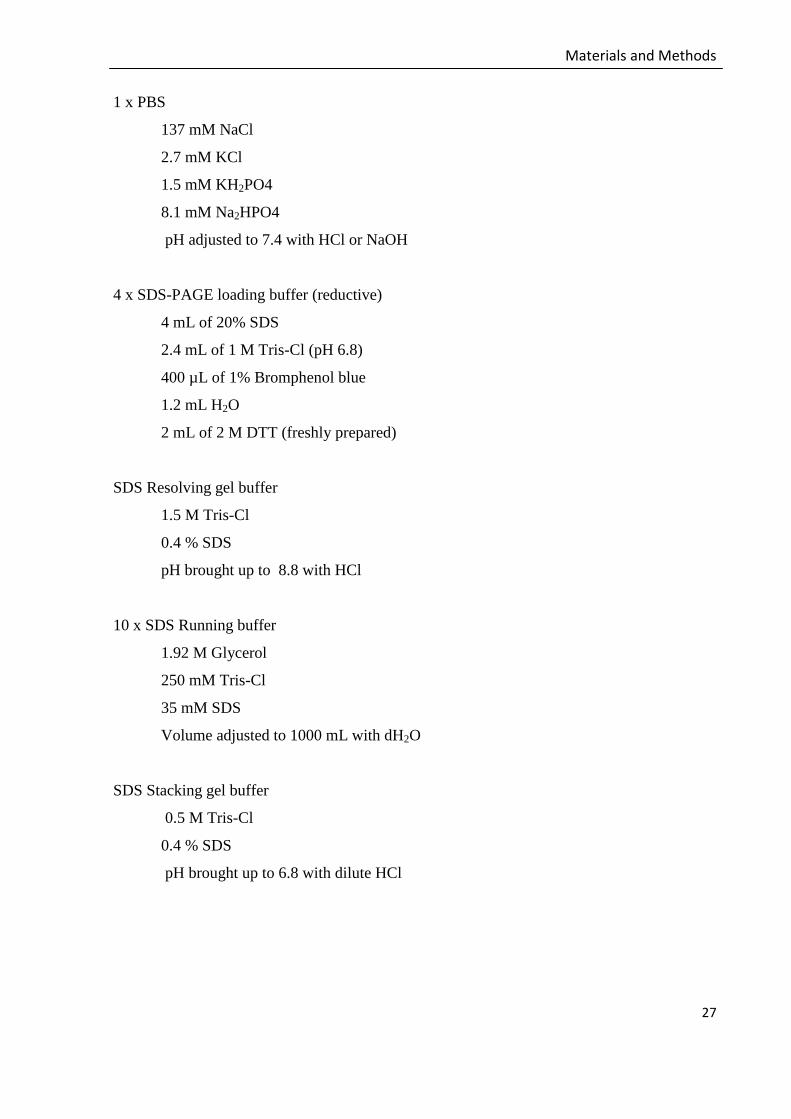
1 x PBS
137 mM NaCl
2.7 mM KCl
1.5 mM KH2PO4
8.1 mM Na2HPO4
pH adjusted to 7.4 with HCl or NaOH
4 x SDS-PAGE loading buffer (reductive)
4 mL of 20% SDS
2.4 mL of 1 M Tris-Cl (pH 6.8)
400 µL of 1% Bromphenol blue
1.2 mL H2O
2 mL of 2 M DTT (freshly prepared)
SDS Resolving gel buffer
1.5 M Tris-Cl
0.4 % SDS
pH brought up to 8.8 with HCl
10 x SDS Running buffer
1.92 M Glycerol
250 mM Tris-Cl
35 mM SDS
Volume adjusted to 1000 mL with dH2O
SDS Stacking gel buffer
0.5 M Tris-Cl
0.4 % SDS
pH brought up to 6.8 with dilute HCl
Materials and Methods
28
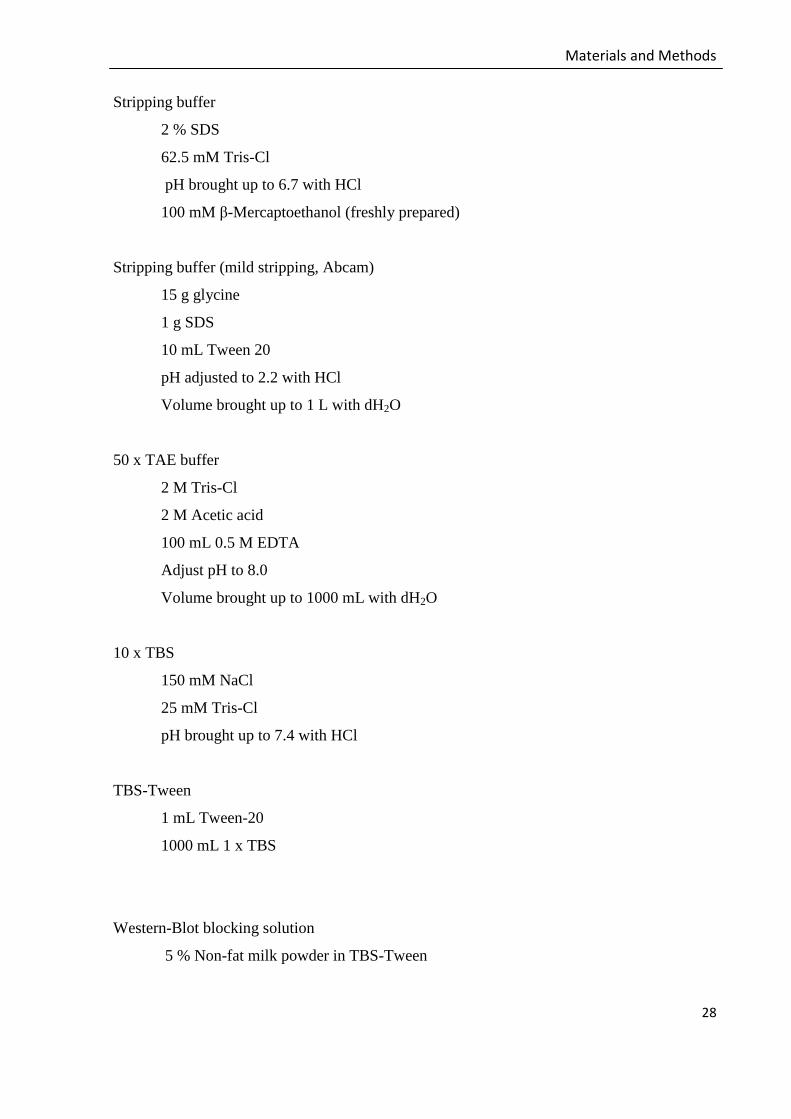
Stripping buffer
2 % SDS
62.5 mM Tris-Cl
pH brought up to 6.7 with HCl
100 mM β-Mercaptoethanol (freshly prepared)
Stripping buffer (mild stripping, Abcam)
15 g glycine
1 g SDS
10 mL Tween 20
pH adjusted to 2.2 with HCl
Volume brought up to 1 L with dH2O
50 x TAE buffer
2 M Tris-Cl
2 M Acetic acid
100 mL 0.5 M EDTA
Adjust pH to 8.0
Volume brought up to 1000 mL with dH2O
10 x TBS
150 mM NaCl
25 mM Tris-Cl
pH brought up to 7.4 with HCl
TBS-Tween
1 mL Tween-20
1000 mL 1 x TBS
Western-Blot blocking solution
5 % Non-fat milk powder in TBS-Tween

Materials and Methods
29
2.1.12 Enzymes
Table 2.1.11 List of enzymes used in this study.
Enzymes Function Company
BglII Restriction (A^G A T C T) Fermentas, St. Leon-Rot
Dream Taq Polymerase Fermentas, St. Leon-Rot
EcoRI Restriction G^A A T T C Fermentas, St. Leon-Rot
Endoglycosidase H Hydrolysis of N-linked
oligosaccharides
Roche, Mannheim
PNGase F Hydrolysis of N-glycan chains Roche, Mannheim
Hind III Restriction (A^A G C T T) Fermentas, St. Leon-Rot
Pfu polymerase Polymerase Fermentas, St. Leon-Rot
PfuUltra™ Polymerase Agilent/Stratagene, USA
Recombinan human cathepsin L Cysteine protease Biozol, Massachusetts, USA
Reverse transcriptase Synthesis of DNA from RNA Fermentas, St. Leon-Rot
T4DNA ligase Ligase Fermentas, St. Leon-Rot
XhoI Restriction (C^T C G A G) Fermentas, St. Leon-Rot
2.1.13 Softwares and web-based tools
Table 2.1.12 Softwares and web-based tools aided the analysis in this study.
Software Product Company/Resource
DNA analysis Lasergene DNASTAR, Madison, Wisconsin, USA
Image processing Photoshop Adobe, California, USA
AxioVision Release 4.8 Carl Zeiss MicroImaging, Jena
Image-Reader LAS-3000 Fujifilm, Carrolton, USA
Protein topology TMHMM http://www.cbs.dtu.dk/services/TMHMM/
(Krogh et al 2001)
I-TASSER http://zhanglab.ccmb.med.umich.edu/
(Zhang 2008, Roy et al 2010)
N-glycosylation site
prediction
NetNGlyc 1.0 Server http://www.cbs.dtu.dk/services/NetNGlyc/
(Gupta et al 2004)
Materials and Methods
30
2.2 Methods
2.2.1 Molecular biology
2.2.1.1 Basic PCR
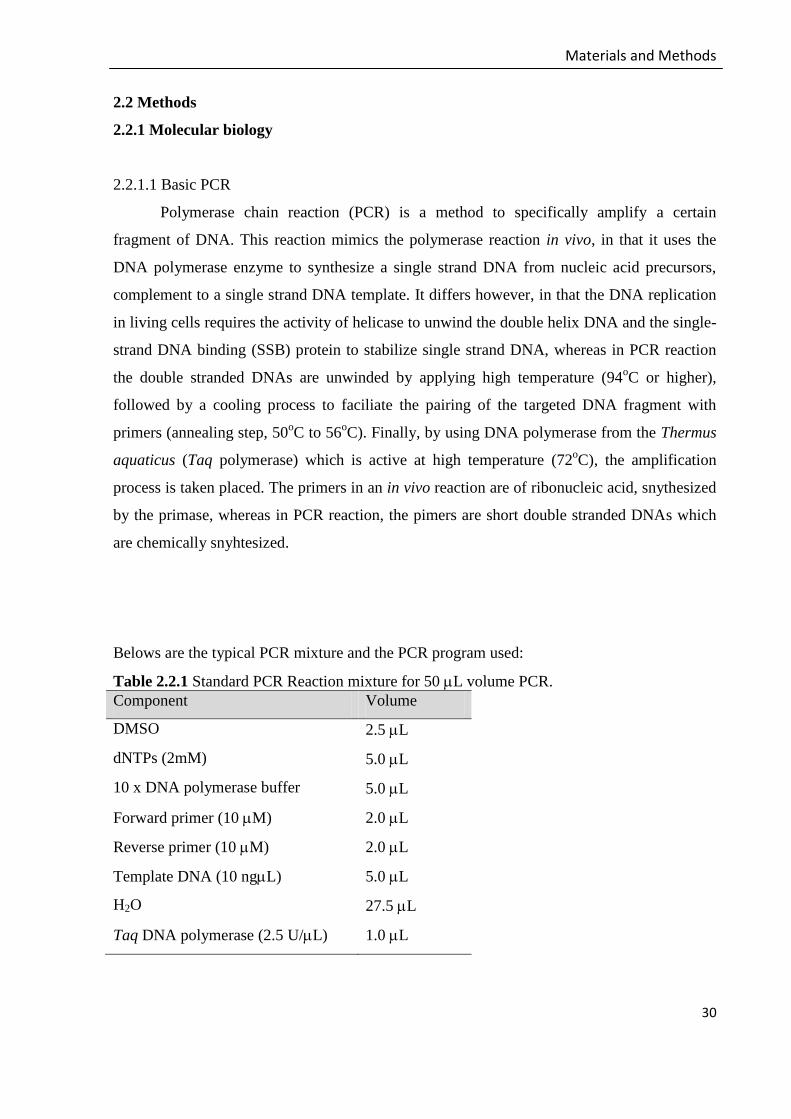
Polymerase chain reaction (PCR) is a method to specifically amplify a certain
fragment of DNA. This reaction mimics the polymerase reaction in vivo, in that it uses the
DNA polymerase enzyme to synthesize a single strand DNA from nucleic acid precursors,
complement to a single strand DNA template. It differs however, in that the DNA replication
in living cells requires the activity of helicase to unwind the double helix DNA and the single-
strand DNA binding (SSB) protein to stabilize single strand DNA, whereas in PCR reaction
the double stranded DNAs are unwinded by applying high temperature (94oC or higher),
followed by a cooling process to faciliate the pairing of the targeted DNA fragment with
primers (annealing step, 50oC to 56
oC). Finally, by using DNA polymerase from the Thermus
aquaticus (Taq polymerase) which is active at high temperature (72oC), the amplification
process is taken placed. The primers in an in vivo reaction are of ribonucleic acid, snythesized
by the primase, whereas in PCR reaction, the pimers are short double stranded DNAs which
are chemically snyhtesized.
Belows are the typical PCR mixture and the PCR program used:
Table 2.2.1 Standard PCR Reaction mixture for 50 L volume PCR.
Component Volume
DMSO 2.5 L
dNTPs (2mM) 5.0 L
10 x DNA polymerase buffer 5.0 L
Forward primer (10 M) 2.0 L
Reverse primer (10 M) 2.0 L
Template DNA (10 ngL) 5.0 L
H2O 27.5 L
Taq DNA polymerase (2.5 U/L) 1.0 L
Materials and Methods
31
Table 2.2.2 Standard PCR program.
Temperature Time (minute)
94oC 5
94oC 1
56oC 1
72oC Varies
72oC 10
10oC
2.2.1.2. Fusion PCR
Substitutions of a certain sequence of a gene with other sequence were carried out by fusion
PCR. It involves several steps of PCR reaction to obtain the sequence of interest
(schematically described in Figure 2.4). To minimize the systemic error which may be
produced in an individual PCR reaction, the Pfu DNA polymerase was used in fusion PCR,
instead of the standard Taq DNA polymerase. Pfu DNApolymerase has been engineered
from the hyperthermophilic archaeum Pyrococcus furiosus (Fermantas,St. Leon-Rot), and it
has an advantage that it possesses 3'=>5' exonuclease (proofreading) activity, which enables
the polymerase to correct nucleotide incorporation errors, with an overall fidelity 8 times as
high as those performed by the standard Taq DNA polymerase. It has, however, a slower
overall activity (around 2 minutes to synthesize 1 kb single strand DNA), so that a longer
elongation time is required for each PCR cycle.
Table 2.2.3 PCR mixture for fusion PCR.
Fusion PCR mixture (PCR 1 and 2) Elongation PCR mixture (PCR 3)
DMSO 2.5 L
dNTPs (2mM) 5.0 L
10 x Pfu polymerase buffer 5.0 L
Forward primer (10 M) 2.0 L
Reverse primer (10 M) 2.0 L
Template DNA (10 ng/L) 5.0 L
H2O 27.5 L
Pfu polymerase (2.5 U/L) 1.0 L
DMSO 2.5 L
dNTPs (2mM) 5.0 L
10 x Pfu polymerase buffer 5.0 L
Forward primer (10 M) 2.0 L
Reverse primer (10 M) 2.0 L
Template DNA (10 ngL) 0.0 L
H2O 32.5 L
Pfu polymerase (2.5 U/L) 1.0 L
25-40 cycles

Materials and Methods
32
Table 2.2.4 PCR program for fusion PCR.
Temperature Time (minute)
94oC 5
94oC 1
56oC 1
72oC 3-5
72oC 10
10oC
Figure 2.4 Fusion PCR strategy.
The sequence depicted in grey will be replaced by the yellow sequence. Two primer pairs (Fw1 and Rv1; Fw2
and Rv2) are used in the PCR 1 and PCR 2 to amplify the left and the right region of the targeted gene,
respectively. Rv1 and Fw2 contain an overlap region (20 to 25 base pairs) which is required as a “self template”
for the fusion PCR (PCR 3). The resulted fusion product was reamplified by using Fw1 and Rv2 primer pair
(PCR 4) to ensure that the both ends contain the intended restriction sites which are important in the cloning step
of the chimeric gene with an expression vector.
35-40 cycles
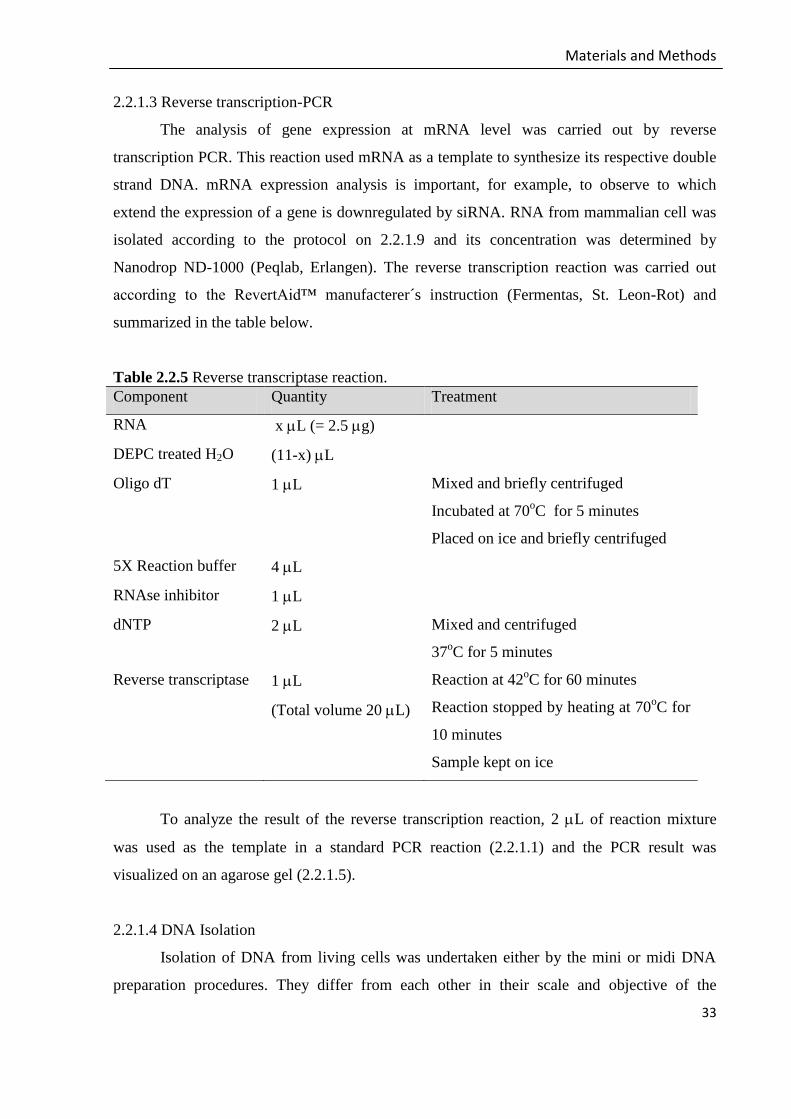
Materials and Methods
33
2.2.1.3 Reverse transcription-PCR
The analysis of gene expression at mRNA level was carried out by reverse
transcription PCR. This reaction used mRNA as a template to synthesize its respective double
strand DNA. mRNA expression analysis is important, for example, to observe to which
extend the expression of a gene is downregulated by siRNA. RNA from mammalian cell was
isolated according to the protocol on 2.2.1.9 and its concentration was determined by
Nanodrop ND-1000 (Peqlab, Erlangen). The reverse transcription reaction was carried out
according to the RevertAid™ manufacterer´s instruction (Fermentas, St. Leon-Rot) and
summarized in the table below.
Table 2.2.5 Reverse transcriptase reaction.
Component Quantity Treatment
RNA x L (= 2.5 g)
DEPC treated H2O (11-x) L
Oligo dT 1 L Mixed and briefly centrifuged
Incubated at 70oC for 5 minutes
Placed on ice and briefly centrifuged
5X Reaction buffer 4 L
RNAse inhibitor 1 L
dNTP 2 L Mixed and centrifuged
37oC for 5 minutes
Reverse transcriptase 1 L
(Total volume 20 L)
Reaction at 42oC for 60 minutes
Reaction stopped by heating at 70oC for
10 minutes
Sample kept on ice
To analyze the result of the reverse transcription reaction, 2 L of reaction mixture
was used as the template in a standard PCR reaction (2.2.1.1) and the PCR result was
visualized on an agarose gel (2.2.1.5).
2.2.1.4 DNA Isolation
Isolation of DNA from living cells was undertaken either by the mini or midi DNA
preparation procedures. They differ from each other in their scale and objective of the

Materials and Methods
34
preparation. Additionally, in a gel elution procedure, DNA is recovered after electrophoretic
separation in an agarose gel (Gel elution 2.2.1.5).
Mini DNA preparation (Gene JET™ Plasmid Miniprep Kit, Fermentas, St. Leon-Rot)
Mini DNA preparation is used for the screening of E. coli colonies bearing plasmid
DNA of interest. Following the transformation of E. coli, bacterial colonies spread out on an
agar plate containing an antibiotic marker. Only E. coli colonies bearing recombinant plasmid
DNA are expected to grow on a selective media. However, in false positive cases, linear
vector are recircularized and regain their ability to grow on a selective media despite the lack
of gene of interest. Several colonies of E. coli were picked up with sterile tooth picks and
transferred into 3 to 5 mL LB medium containing an appropriate antibiotic. Bacteria were
grown overnight (14 to 18 hours) at 37oC. On the second day, cells from individual colonies
were harvested by centrifugation.
A typical volume or 1.0 to 1.5 mL of culture was pelleted in a microcentrifuge (7.000
x g for 5 minute at room temperature). The rest of medium was decanted, and cell pellet was
resuspended by 250 L resuspension solution containing RNAse. Cells were lysed by 250 L
of lysis solution containing SDS/alkaline and suspension was mixed by inverting
microcentrifuge tube for 4-6 times. Plasmid DNA was neutralized by the addition of 350 L
neutralization solution (mixed by inverting the microcentrifuge tube for 4-6 times). Cell
debris and chromosomal DNA are pelleted in the next centrifugation step (12.000 x g, 5
minutes) and lysate containing plasmid DNA is transferred into the spin column. Plasmid
DNA will bind to the silica membrane in a spin column in the next centrifugation step.
Plasmid DNA was washed twice with 500 L of wash solution containing ethanol followed
by an empty centrifugation to ensure the removal of washing solution. Plasmid DNA was
finally eluted by 50 L ultrapure H2O.
An enzymatic restriction was usually performed to check whether the gene of interest
is present in the plasmid DNA (Restriction assay 2.2.1.10). Plasmid DNA which was positive
in the restriction assay was then sequenced to proof the correct sequence and framing of the
gene of interest (2.2.1.8).

Materials and Methods
35
Midi DNA preparation (PureYield™ Plasmid Midiprep System, Promega, Madison, WI, USA)
Expression study of a certain construct requires a substantially amount of plasmid
DNA. This has been mostly achieved by the midi preparation of plasmid DNA. Individual
clone of E. coli with sequence-proofed plasmid DNA was cultured in 50 to 100 mL LB media
supplemented with an appropriate antibiotic. Culture was cultivated in 50 mL conical tubes
and centrifuged at 3.500 x g for 15 minutes (room temperature). Cell pellet was resuspended
with 3 mL resuspension solution and lysed with 3 mL lysis solution. The mixture was
homogenized by inverting the tube 3-5 times. To this mixture, 6 mL neutralization solution
was added and the mixture was centrifuged at 15.000 x g for 15 minutes at room temperature.
The resulted lysate was filtered through a filtering column (blue column) and the plasmid
DNA in the overflow was trap in a binding column. The plasmid DNA was washed first with
5 mL detoxification solution and followed by 20 mL ethanol-containing washing solution.
The DNA was left air-dried prior to elution with 600 L ultra pure H2O. The concentration of
the isolated plasmid DNA was determined by Take 3 Modul of BioTek Multiplate Reader.
2.2.1.5 Agarose gel electrophoresis
Following the PCR reaction or enzymatic cleavage, DNA needs to be purified from
the unwanted products or contaminants. This is achieved by first performing electrophoresis
in an agarose gel, which separated the DNA according to the molecular weight, followed by
the elution of DNA fragment from the agarose gel (see 2.2.1.6 below).
Agarose gel electrophoresis is a simple way to separate DNA samples from their
contaminants or undesired products. In this method samples DNA are separated according to
their molecular weight. The supporting matrix through which the DNA samples were
separated is made of a network of polysaccharide derived from seaweed powder (agarose).
The typical concentration of agarose used to make the agarose gel lies between 1% to 2%
(w/v) agarose in TAE buffer. Agarose powder was boiled in TAE buffer and cooled down to
around 50oC. At this point, chelating dye ethidium bromide was added, which later aided the
visualization of the DNA. The mixture was poured into a casting tray with a comb to provide
sample pockets and let hardened. DNA samples were diluted with water and 6x loading dye
and loaded into sample pockets. Separation of samples was achieved by applying 5V current
per electrodes distance (cm).

Materials and Methods
36
2.2.1.6 Gel elution (High Pure PCR Purification Kit, Roche, Mannheim)
DNA fragments resulted from PCR reaction or restriction enzyme digestions were
eluted from agarose gel by High Pure Purification Kit (Roche, Mannheim). DNA band of
interest was cut from the agarose gel and placed in a 1.5 mL microtube. 150 L isopropanol
and 350 L of binding solution were added to the DNA fragment. The Mixture was incubated
in Thermo bloc at 62oC until the gel was dissolved. The lysate was then transferred into spin
column and centrifuged at 12.000 x g for 1 minute. DNA will bind to the silica matrix at the
bottom of spin column. DNA was washed twice with 500 L and 200 L washing solution,
sequentially, and finally eluted with 50 L ultrapure H2O. The purified PCR fragment can
further be digested with restriction enzyme, or used in the fusion PCR, whereas the purified
DNA from restriction reaction can be used in the ligation reaction (2.2.1.11).
2.2.1.7 Determination of nucleic acid concentration
The DNA concentrations of each plasmid DNA preparation were determined
spectrophotometrically by GeneQuant Pro spectrophotometer (Biochrom, Cambridge, UK) or
by the Take 3 Modul of BioTek Multiplate Reader (BioTek, USA). The RNA concentration
was determined by the Nanodrop ND-1000 (Peqlab, Erlangen). The devices basically
measured the absorption of the nucleic acids at 260 nm. Close to that wavelength,
contaminant proteins also show a peak at 280 nm, so that the ratio of A260 to A280 nm
indicated the purity of nucleic acid samples. For most application, the ratio A260/280 of 1.80 or
higher met the requirement for further use of samples (plasmid DNA for cell line transfection
2.2.3.3 or reverse transcriptase reaction 2.2.1.3).
2.2.1.8 DNA sequencing
The critical step in the molecular cloning is confirmation of the sequence of the gene
of interest. Following the E. coli transformation by the ligation mixture and screening of E.
coli colonies bearing the intended plasmid DNA and restriction digestion assay of the isolated
plasmid DNA, the sequence of DNA needs to be determined. The DNA sequencing
throughout this study was done by MWG Biotech (Martinsried) or GATC Biotech
(Konstanz).

Materials and Methods
37
2.2.1.9 RNA isolation
The total RNA isolation protocol referred to the NucleoSpin RNA®
II User Manual
(Macherey Nagel, Dueren) optimized for mammalian cell culture. The basic principle of RNA
purification using this kit resembles the isolation of DNA by the majority of commercial
DNA isolation kits, except that a measure needs to be taken to prevent the degradation of
RNA, and that there is an additional on-column DNA digestion by DNAse to allow only RNA
is left in a spin column prior to elution step.
The RNA isolation steps are described as follow: Cell pellet was lysed by chaotropic
ions within the lysis buffer and filtered by the NucloeSpin® Filter column. The lysate was
homogenized with 70% Ethanol and transferred into the NucleoSpin® RNA II Column. Upon
centrifugation, nucleic acids (RNA dan DNA) were bound to the silica matrix in the column.
The high salt concentration which facilitates the nucleic acid binding in previous step was
reduced by the membrane desalting buffer. On-membrane digestion of DNA was achieved by
adding RNase-free rDNase for 15 minutes. The salt removal is important for the activity of
the rDNase. Three washing steps were the carried out, and the RNA was finally eluted with
RNase free H2O. RNA samples were stored in -80oC prior to further use.
2.2.1.10 DNA digestion by restriction enzyme
Restriction enzymes have the ability to cut a specific sequence of DNA. They are
frequently used in molecular cloning to produce overhang at both 5’ and 3’ end of DNA
fragment, which can later be fused with a linearized plasmid cut by the same restriction
enzyme. The fusion of a DNA fragment with a vector is termed ligation reaction (2.2.1.11).
In a typical cloning procedure, a certain sequence of DNA or a gene was amplified in
a PCR reaction (2.2.1.1) by using a pair of primers with known restriction recognition sites.
These recognition sites were included in the primers. The primers in this study were ordered
from Sigma-Aldrich Genosys (Steinheim). The choice of the restriction enzyme recognition
sites in the design of PCR primers took into account the recognition sites available in the
multi cloning sites (MCS) of the plasmid vector, i.e. that the overhang ends of both DNA
fragment and vector were compatible to each other, to ensure that the DNA fragment can be
ligated to the vector. The restriction reactions were carried out overnight at 37oC.
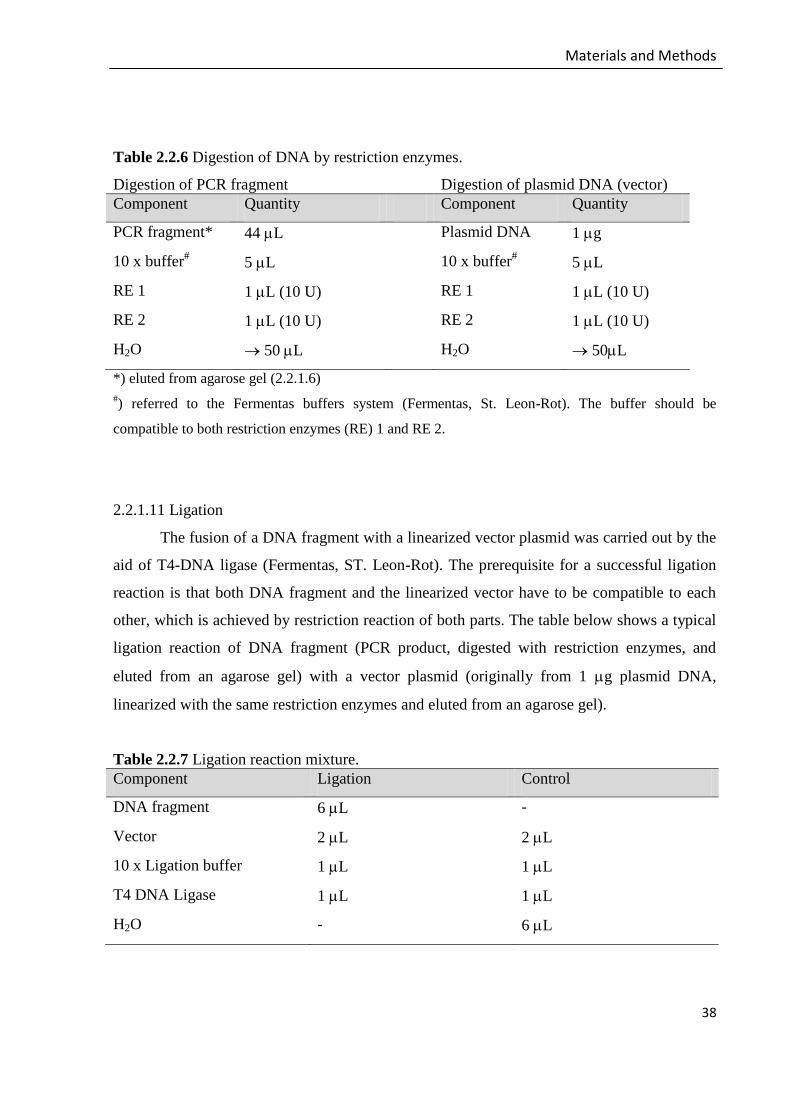
Materials and Methods
38
Table 2.2.6 Digestion of DNA by restriction enzymes.
Digestion of PCR fragment Digestion of plasmid DNA (vector)
Component Quantity Component Quantity
PCR fragment* 44 L Plasmid DNA 1 g
10 x buffer# 5 L 10 x buffer
# 5 L
RE 1 1 L (10 U) RE 1 1 L (10 U)
RE 2 1 L (10 U) RE 2 1 L (10 U)
H2O 50 L H2O 50L
*) eluted from agarose gel (2.2.1.6)
#) referred to the Fermentas buffers system (Fermentas, St. Leon-Rot). The buffer should be
compatible to both restriction enzymes (RE) 1 and RE 2.
2.2.1.11 Ligation
The fusion of a DNA fragment with a linearized vector plasmid was carried out by the
aid of T4-DNA ligase (Fermentas, ST. Leon-Rot). The prerequisite for a successful ligation
reaction is that both DNA fragment and the linearized vector have to be compatible to each
other, which is achieved by restriction reaction of both parts. The table below shows a typical
ligation reaction of DNA fragment (PCR product, digested with restriction enzymes, and
eluted from an agarose gel) with a vector plasmid (originally from 1 g plasmid DNA,
linearized with the same restriction enzymes and eluted from an agarose gel).
Table 2.2.7 Ligation reaction mixture.
Component Ligation Control
DNA fragment 6 L -
Vector 2 L 2 L
10 x Ligation buffer 1 L 1 L
T4 DNA Ligase 1 L 1 L
H2O - 6 L
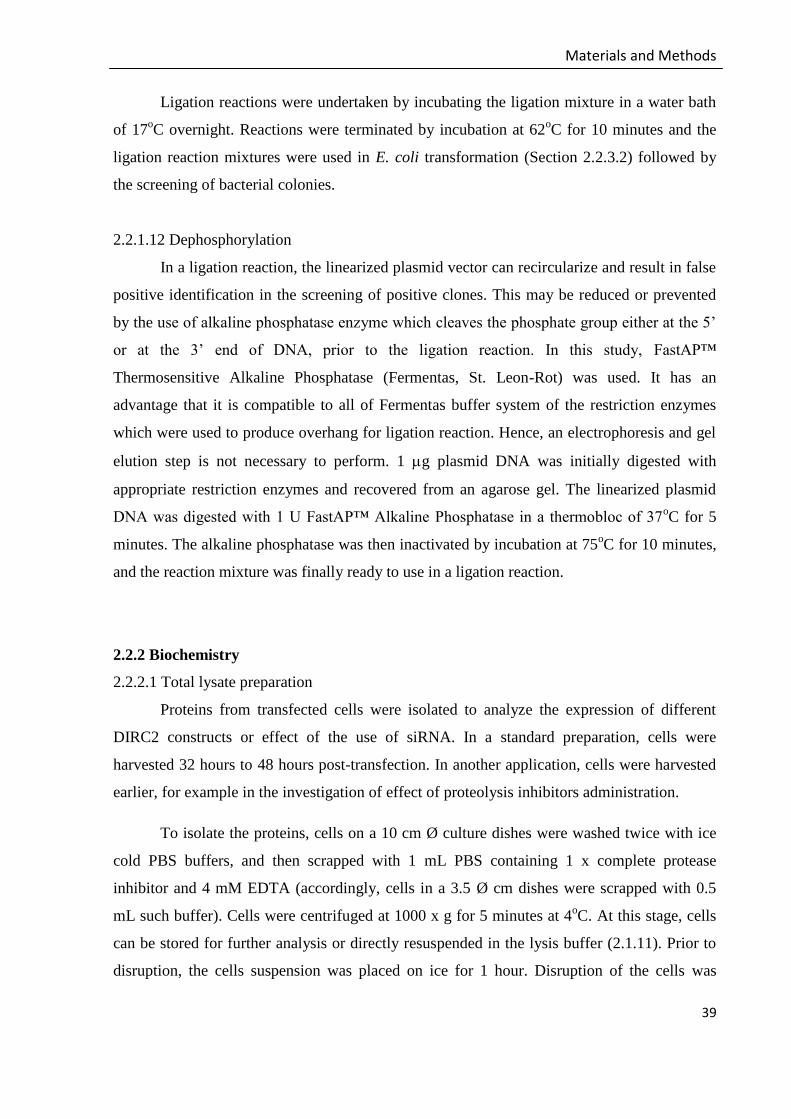
Materials and Methods
39
Ligation reactions were undertaken by incubating the ligation mixture in a water bath
of 17oC overnight. Reactions were terminated by incubation at 62
oC for 10 minutes and the
ligation reaction mixtures were used in E. coli transformation (Section 2.2.3.2) followed by
the screening of bacterial colonies.
2.2.1.12 Dephosphorylation
In a ligation reaction, the linearized plasmid vector can recircularize and result in false
positive identification in the screening of positive clones. This may be reduced or prevented
by the use of alkaline phosphatase enzyme which cleaves the phosphate group either at the 5’
or at the 3’ end of DNA, prior to the ligation reaction. In this study, FastAP™
Thermosensitive Alkaline Phosphatase (Fermentas, St. Leon-Rot) was used. It has an
advantage that it is compatible to all of Fermentas buffer system of the restriction enzymes
which were used to produce overhang for ligation reaction. Hence, an electrophoresis and gel
elution step is not necessary to perform. 1 g plasmid DNA was initially digested with
appropriate restriction enzymes and recovered from an agarose gel. The linearized plasmid
DNA was digested with 1 U FastAP™ Alkaline Phosphatase in a thermobloc of 37oC for 5
minutes. The alkaline phosphatase was then inactivated by incubation at 75oC for 10 minutes,
and the reaction mixture was finally ready to use in a ligation reaction.
2.2.2 Biochemistry
2.2.2.1 Total lysate preparation
Proteins from transfected cells were isolated to analyze the expression of different
DIRC2 constructs or effect of the use of siRNA. In a standard preparation, cells were
harvested 32 hours to 48 hours post-transfection. In another application, cells were harvested
earlier, for example in the investigation of effect of proteolysis inhibitors administration.
To isolate the proteins, cells on a 10 cm Ø culture dishes were washed twice with ice
cold PBS buffers, and then scrapped with 1 mL PBS containing 1 x complete protease
inhibitor and 4 mM EDTA (accordingly, cells in a 3.5 Ø cm dishes were scrapped with 0.5
mL such buffer). Cells were centrifuged at 1000 x g for 5 minutes at 4oC. At this stage, cells
can be stored for further analysis or directly resuspended in the lysis buffer (2.1.11). Prior to
disruption, the cells suspension was placed on ice for 1 hour. Disruption of the cells was

Materials and Methods
40
achieved by ultrasonication (2 x 10 seconds by a micro-ultrasonic cell disruptor
Kimble/Kontes, Vineland, NJ). Lysate containing protein was separated from the cell debris
by centrifugation at 13.000 x g for 10 minutes.
2.2.2.2 Membrane protein preparation
The membranic fraction of transfected cells was prepared as follows: cells were
seeded in 4 dishes (10 cm), transfected by plasmid DNA (2.2.6.1) and harvested two days
after transfection. Cells were washed two times with ice cold PBS, then scrapped in 1 mL iso-
osmotic buffer for each dish. Cells were centrifuged at 1.000 x g for 5 minutes (4oC). Cell
pellet from individual tubes were pooled and resuspended in 1 mL iso-osmotic buffer. Cells
were disrupted by pipetting through a 27G cannula (30x up and down) and the lysate was
centrifuged at 1.500 x g for 10 minutes (4oC). The membranic fraction was gained by
centrifugation of the resulted post nuclear supernatant (PNS) at 100.000 x g for 30 minutes.
2.2.2.3 Protein determination
Protein determination of the lysate was carried out according to the manual of the
BCA Protein Assay Kit (Pierce, USA). The basic of this protein determination lies on the
reduction of Cu2+
to Cu1+
in an alkaline environment by protein (known as biuret reaction). In
the second reaction step, two molecules of bicinchoninic acid (BCA) within the assay kit react
one Cu1+
ion which produces an intense purple color complex. Bovine serum albumin (BSA)
proteins of different concentration were used as the standard in this protein determination.
The color intensities of both sample and standards were determined by measuring their
absorbance at 562 nm, after incubation of the reaction mixture at 37oC for 15 to 30 minutes.
The sample protein concentration was calculated from the linear regression path produced by
a set of standard BSA proteins.
2.2.2.4 Percoll® fractionation
To analyze the cellular distribution of a certain protein, subcellular fractionation has
been carried out. This was done by the Percoll® fractionation which separated cellular
components according to their density. Percoll® consists of silica particles (15-30 nm in
diameter) coated with non-dialyzable polyvinylpyrrolidone (PVP). Percoll® is non-toxic,
almost chemically inert and does not adhere to membranes. Upon centrifugation, it produces a

Materials and Methods
41
self-formed gradient from 1.0 to 1.3 g/mL, which makes it is highly versatile for many
applications in the separation of biological samples. It has been long time used in the
fractionation of many biological materials, such as sperma from semen, blood components,
bacteria, viruses and subcellular components.
In this study, subcellular distribution of the DIRC2 has been analyzed. HeLa cells
were transfected with pcDNA3.1 DIRC2-3xmyc (4 x 10 cm dishes, each transfected with 2.5
g plasmid DNA). Cells were harvested 32 hours after transfection. Cells were washed two
times with ice cold PBS buffer, then with homogenization buffer (250 mM sucrose, 10 mM
HEPES pH 7.4, 1 mM EDTA, Complete protease inhibitor). Cells were scrapped from the
dish in homogenization buffer. After centrifugation, cells were pooled in one microtube and
resuspended in homogenization buffer. The lysis of cells was done by 10-12 up and down
pipetting by a 27G cannula. PNS was separated from cells debris and nuclear by
centrifugation at 1.000 x g for 5 minutes. PNS lysate was layered on the top of ultracentrifuge
tube previously filled with 0.5 mL 2.5 M sucrose and 5.8 mL 17% Percoll® (w/v). Gradient
centrifuge was performed at 40.000 x g, 47 minutes (70.i.Ti rotor). Fractionation was carried
out by pumping the sample using a density gradient fractionator (Labcono, USA). Sample
was pumped out from the lightest fraction and aliqouted in a volume of 0.5 mL.
Percoll® fractions of DIRC2 transfected HeLa cells were subjected to SDS-PAGE and
Western blot. DIRC2 was detected by an anti-myc antibody, and the Western blot results of
percoll fractions were aligned with several organelle markers, such as cathepsin D and GC
for the lysosomes, and PDI for the endoplasmic reticulum. The Western blot of Percoll®
fraction was also aligned with the enzymatic activity assays of each fraction (Section 2.2.13).
2.2.2.5 SDS-PAGE
Sodium dodecyl sulfate polyacrylamide gel electrophoresis (SDS-PAGE) is an
analytical method to separate protein samples in a polyacrylamide matrix. It offers an
advantage that the protein samples can be separated according to their molecular weight. It,
hence, enables an estimation of molecular weight of a certain protein, as well as the
expression level of a protein of interest. This is especially true if further analysis by Western
blot is performed (2.2.3.6), since overexpression of a protein in mammalian cell culture is not
readily observable in a polyacrylamide gel. The use of SDS from the sample buffer (Laemmli
buffer) in this method facilitates the formation of artificial molecular charges of proteins. As

Materials and Methods
42
almost all proteins are covered by SDS molecules, a total negative charge of protein is
produced, and they move toward the anode during the progress of electrophoresis.
In a standard sample treatment with Laemmli buffer, protein samples and Laemmli
buffer are boiled for 5 to 10 minutes. However, in order to maintain the stability of the DIRC2
protein structure, in most application the DIRC2 protein were incubated with Laemmli buffer
at 37oC for 10 minutes. Electrophoresis was undertaken at 100 V to 140 Volt in a Mini
Protean 3 electrophoresis chamber (BioRad, Hercules, USA) or Twin Model L (Peqlab
Biotechnology, Erlangen). Throughout this study, 10% resolving gels and 4.5% stacking gels
were used and prepared according to the chart below.
Table 2.2.8 Recipe for polyacrylamide gel.
Component 10% Resolving gel 4.5% Stacking gel
Resolving buffer 2.6 mL -
Stacking buffer - 1.35 mL
30% acrylamide solution 3.3 1.75 mL
H2O 4.0 6.85 mL
TEMED 30 L 30 L
10% Ammonium persulfate 60 L 60 L
Total Volume ~10 mL ~10 mL
2.2.2.6 Western blot
The immobilization of protein on a membrane before detection using antibody refers
to protein blotting. The most popular application of this method is the Western blot.
Practically, it is an analytical method which involves the separation of protein samples in a
polyacrylamide gel (protein electrophoresis) followed by the transfer of protein from
polyacrylamide gel onto a membrane surface. The membrane can either be a polyvinylidene
fluoride or nitrocellulose membrane.
In this study, proteins were separated by SDS-PAGE (2.2.3.5) and they were
transferred onto a nitrocellulose membrane in a semi-dry transfer set up. The transfer process
is schematically depicted in the Figure 2.5. Following the transfer, the nitrocellulose can be
considered as the replica of the gel. Membrane was blocked overnight by 5% non-fat milk (in

Materials and Methods
43
TBS Tween buffer) in cold room. To detect the protein band of interest, incubation with the
primary antibody specifically recognizes the protein or tag of protein of interest was
undertaken. The primary antibody was diluted in 5% non-fat milk (in PBS Tween buffer)
according to the manufacturer´s instruction (for commercial antibody). Alternatively,
optimation of the dilution factor for the primary antibody was undertaken.
Figure 2.5 Semi-dry transfer of protein.
Proteins to be transferred were subjected into SDS-PAGE separation. Transfer onto membrane was done by
semi-dry transblot (BioRad, Hercules, USA). 4 filter papers and nitrocellulose membrane were pre wet with
semi-dry transfer buffer. Two filter papers were placed directly on the anode plate, followed by the nitrocellulose
membrane and polyacrylamide gel. Two filter papers covered the gel, and cathode was connected on the top.
Transfer of protein was achieved by applying electric current of 1 mA/cm2 membrane surface for 2 hours.
After 3 x 10 minutes washing steps, the membrane was incubated with a second ary
antibody which specifically recognizes the primary antibody. Finally, the membrane was
washed 3 x 10 minutes with PBS Tween buffer, and luminogen reaction was carried out with
ECL Advance solution (GE Healthcare, UK), and the bands on the membrane was
photographed in LAS-3000 Imager.
For further analysis with an alternative primary antibody, the membrane can be
stripped to get rid of the previous primary antibody and the secondary antibody attached to it.
The stripping process can either be undertaken by a harsh stripping or mild stripping solution
(2.1.11). A harsh stripping solution was used if it is known that sufficient proteins are blotted
on the membrane. The membrane was incubated in the harsh stripping buffer at 55oC with
occasional shaking. The membrane was then washed with PBS Tween buffer. An alternative
Materials and Methods
44
stripping procedure provided by the mild stripping process. In this case, the membrane was
incubated with mild stripping buffer for 5 to 10 minutes at room temperature, washed two
times with PBS (10 minutes each) and two times with PBS Tween buffer (5 minutes each).
After the stripping process, the blocking step was carried out again, followed by the primary
and the secondary antibody incubations, and detection the protein of interest by luminogen
reagents.
2.2.2.7 Enzyme assays
This section compiles the enzymatic reaction performed in this study. Enzymatic
reactions related to molecular cloning (PCR, restriction, dephosphorylation and ligation) are
described in 2.2.1.
PNGase F digestion
Sample protein was incubated with denaturing buffer (containing -mercaptoethanol)
at 56oC for 5 minutes. Triton buffer was added as well as 1 x Complete protease inhibitor
(Roche, Mannheim) and H2O to the sample to the total volume of 70 L. The sample was
divided into two parts, the undigested control and the test. 2 L of PNGase F or steril H2O
were loaded to the test and undigested control tubes, respectively, and both were incubated at
37oC for at least 4 hours or overnight. Laemmli buffer was added to both sample and control
tubes, and the sample was further analysis by SDS-PAGE and Western blot.
Endoglycosidase H
Sample protein of 20 to 100 g was mixed with 5 x Endoglycosidase H buffer and
25 x Complete protease inhibitor (Roche, Mannheim). To that mixture, -mercaptoethanol
was added to final concentration of 50 mM. Sample was digested with 2 L recombinant
Streptomyces plicatus Endoglycosidase H (5mU/L, Roche, Mannheim) and H2O was added
to undigested control. Incubation was completed overnight at 37oC.
Lysosomal enzyme: -hexosaminidase activity
Lysosomal enzyme activities were determined for the DIRC2 siRNA downregulated
HeLa cell extracts or percoll fractions. 10 L of cell extract or percoll fractions was added to

Materials and Methods
45
100 L substrate solution (10 mM p-Nitrophenyl-2-acetoamido-2-deoxy--D-
glucopyranoside in citrate buffer). Reaction was carried out by incubation at 37oC for 15
minute. The reaction was stopped by the addition of 261 L stop solution (0.4 M
Glycin/NaOH, pH 10.4) and the extinction of the solution was measured at 405 nm.
The activity of -hexosaminidase was formulated by the following equation:
Activity (mU/mL) = dE x Total volume (L) x 1000
Extinction coefficient x Sample volume x Incubation time
The specific activity of sample was determined by dividing the activity with the protein
content of the respective sample.
Lysosomal enzyme: -galactosidase
The -galactosidase activity of cell extract was determined as follows: 10 L of cell
extract was added to 100 L of -galactosidase substrate solution (o-nitrophenyl--D-
galactopyranoside in citrate buffer). The reaction was stopped after 30 minutes incubation at
37oC by the addition of 250 L stop solution. The extinction of solution was determined at
405 nm, and the activity of -galactosidase was calculated similarly to the calculation of -
hexosaminidase activity.
Lysosomal enzyme: -mannosidase
The -mannosidase activities of cell extract was determinted as follows: 20 L of cell
extract was added to 100 L -mannosidase substrate solution (10 mM p-Nitrophenyl--D-
mannopyranoside in citrate buffer). The reaction was stopped after 120 minutes incubation at
37oC by the addition of 261 L of stop solution. The extinction of solution was determined at
405 nm, and the -mannosidase activity of each sample were calculated similarly to the
calculation of the -hexosaminidase activity.
2.2.2.8 Immunofluorescence
Subcellular analysis by visualization of target molecule to locate the occurrence or
distribution of target molecule was carried out by immunofluorescence. This technique

Materials and Methods
46
mostly relies on a specific interaction between the molecules of interest with its respective
(primary) antibody. The molecules of interest can be either an endogenous protein/molecules
or an overexpressed protein achieved by cell transfection. To locate the subcellular
distribution of the targeted molecule, a secondary antibody, tagged with a fluorescent dye,
was used. The secondary antibody interacts specifically with the first antibody, and hence
gives a hint where the interaction takes place.
Cells were seeded on coverslips. On the second day, cells were transfected with an
appropriate plasmid DNA and TurboFect transfection reagent (Fermentas, St. Leon-Rot).
Cells were fixed with 4% paraformyldehyde on the next day and stored in PBS buffer in
refrigerator. If the incubation time needs to be prolonged, the cells were washed and new
medium was added, and the cells were further incubated prior to fixation.
Cells were permeabilized by incubation with 0.8% saponin (Roth) in PBS buffer for 5
minutes, followed by incubation in 0.12% glycine fo 10 minutes. Cells were then washed with
0.8% saponin and incubated for at least 15 min in 3% bovine serum albumin (BSA)/PBS
buffer containing 0.8% saponin. Incubation with the first antibody was undertaken in a
humid-chamber. Antibodies were diluted in 3% BSA/PBS/0.8% saponin solution to
appropriate dilutions and applied for 1 hour. The secondary antibodies, chromophore
conjugated antibodies recognizing the primary antibodies, were applied after the primary
antibody incubation, with several washing steps of the coverslips in between. The used
antibodies are listed in the section 2.1. Cells were then washed 5 times in 0.8% saponin/PBS
and 2 times in water. Coverslips were placed on a glass plate and finally mounted with
moviol. Moviol contains DAPI for nuclear straining. Coverslips were protected from light
exposure. Immunofluorescence analysis was carried out on an Axiovert 200M Zeiss
fluorescence microscope.
2.2.3 Cell biology
The introduction of foreign plasmid DNA into bacterial cells is known as
transformation, so called because the transformed bacteria acquire new properties which are
determined by the new genetic information carried by the plasmid DNA. The purpose of this
technique can either be the amplification of plasmid DNA, or employing bacteria as a
production platform of protein encoded by genetic information within the plasmid DNA. Both

Materials and Methods
47
objectives can be achieved because the plasmid DNA is able to replicate within the bacterial
host, and can be transferred from parental bacteria to their daughter cells. In this study, the
objective of bacterial transformation is limited to the amplification of plasmid DNA.
2.2.3.1 Preparation of electro-competent E. coli
Bacterial cell walls are normally impermeable to the hydrophilic plasmid DNA. In
order to permeabilize the bacterial cell walls, the bacteria have to be competent of taking up
plasmid DNA when they are treated under electrical or heat shock. Bacteria used in this study
are of the XL1-Blue strain of Escherichia coli (Stratagene) which have tetracycline resistance.
Bacteria competent of taking up plasmid DNA under electrical shock (electro-competent
cells) are prepared by inoculating a single colony of E. coli XL1-Blue in 50 mL Lysogeny
Broth (LB) liquid media, followed by an overnight incubation in a shaking incubation
chamber of 37oC. All LB media in the preparation of XL1-Blue electro-competent cells
contain 50 g/mL tetracycline. On the next day, two aliquots of 25 mL of the preculture were
transferred into 1 L LB medium in a 2 L flask. Incubation was continued until the optical
density at 600 nm (OD600) of the cultures reaches 0.5 - 0.6, monitored by OD600 measurement
with GeneQuant spectrophotometer. Once this point was reached, cells were cooled on ice
with occasional shaking to ensure the homogenous cooling. Cells were divided into 4 x 250
mL, each in a centrifuge tube, and then collected by cold centrifugation at 2.400 x g for 15
minutes (JA14-Rotor, J2-HS centrifuge, Beckman). Cells were washed two times with ice
cold sterile distilled H2O and centrifuged at 2.400 x g for 15 minutes. Cells were then washed
with 20 mL ice cold 10% glycerol prior to centrifugation at 1.000 x g for 20 minutes. The
resulted electro-competent cells were finally resuspended in 4 mL 10% (v/v) glycerol and
aliquoted each in 50 L volume in a 1.5 mL microtube, frozen immediately with dry ice and
stored in -80oC for further use.
2.2.3.2 E. coli transformation
Transformation of E. coli by means of electrical shock is called electroporation. In this
process, 100 ng of plasmid DNA of known identity or 1 L of ligation product (section
2.2.1.11) is mixed with 50 L electro-competent E. coli on ice. The mixture was transferred
into a pre-chilled electroporation cuvette, and an electrical shock of 2.5 kV, 400 and 25 F
of electroporator (BioRad, Hercules, USA) was applied. Transformation mixture was

Materials and Methods
48
immediately resuspended in 1 mL LB medium, and shaked in a thermobloc of 37oC for 45
minutes. For retransformation of known plasmid DNA, 1 mL of transformation mixture was
directly transferred into 50 mL LB medium containing an appropriate antibiotic (50 g/mL
kanamycin or ampicillin), followed by an overnight incubation in a shaking incubator of
37oC. The plasmid DNA from the retransformation process was isolated according to the
DNA midi preparation protocol (section 2.2.1.4). For screening of ligation reaction, 200 L of
transformation mixture was spread out on an LB agar plate containing an appropriate
antibiotic, followed by an overnight incubation at 37oC. Several colonies from the screening
LB agar plate were isolated according to the mini DNA preparation (section 2.2.1.4), and
subjected to restriction assay to check whether they contain an intended DNA insert.
2.2.3.3 DNA transfection
The introduction of foreign DNA into a mammalian cell-line is called transfection.
TurboFect™ transfection reagent (Fermentas, ST. Leon-Rot) was used in this study. It
consists of cathionic polymer which complexes the DNA, and facilitates the up take up DNA
through cell membrane.
Cells were seeded on a culture dish in DMEM medium. On the second days, cells of
around 70% confluency were transfected by DNA construct of interest. For HeLa cells in a Ø
10 cm dish, 2.5 g DNA was added into 250 L pre-warmed DMEM medium (without
penicillin/streptomycin). The DNA was mixed thoroughly, and 5 L TurboFect transfection
reagent was added and placed in room temperature for 15 minutes. The tranfection mixture
was added into the cells and the culture was incubated in a humid incubator of 37oC
conditioned with 5% CO2. If the incubation time should be more than one day, the medium
was changed 24 hours after the transfection, since the transfection reagent is commonly toxic
to the cells when applied for a longer time. For transfection of cells in a 3.5 cm dish or for one
well of 6-wells plate, 1 g plasmid DNA was diluted in 100 L DMEM medium, followed by
the addition 2 L transfection reagent.
2.2.3.4 siRNA transfection
Transfection of mammalian cells by siRNA was carried out similarly to the
transfection with DNA. A certain amount of siRNA was diluted in DMEM medium (without
FCS or antibiotics penicillin/streptomycin). To that mixture, INTERFERin transfection

Materials and Methods
49
reagent (Polyplus, Strasbourg, French) was added and the mixture was incubated in room
temperature for 15 minutes to allow the formation of complex of siRNA with the transfection
reagent. The mixture was then added to 1-2 days old mammalian cells. The transfection
scheme is summarized in the following table.
Table 2.2.9 siRNA transfection mixture.
Dish diameter (cm ) 20 M siRNA Plain DMEM INTERFERin
Reagent
Vol DMEM (10%
FCS + Pen/Strep)
3.5 1 L 200 L 4 L 2.0 mL
10.0 3.15 L 300 L 24 L 6.0 mL
2.2.3.5 Protease inhibition in vivo
In order to investigate whether a specific protease inhibitor has an ability to prevent
the processing of the DIRC2 protein, inhibitory profiling of DIRC2 with several protease
inhibitors have been tested. HeLa cells were initially transfected with DIRC2-3xmyc. Medium
was changed 6 hours after transfection and inhibitors or relevant solvents were added into the
cells. Cells were harvested 10 hours after the addition of protease inhibitors. Lysates were
prepared and subjected into SDS-PAGE separation and further analyzed by Western blot.
The following table list the protease inhibitor used in this study.
Table 2.2.10 Concentrations of protease inhibitors in cells media. Sources of inhibitors are
included in Table 2.1.4.
Inhibitor (solvent) Function Concentration
Brefeldin A1 (methanol) Inhibits protein transport out of ER 5 µg/mL
NH4HCl (H2O) Lysosomes acidification inhibitor 25 mM
Leupeptin (H2O) Serine and Cysteine protease inhibitor 100 µM
Pepstatin A (DMSO) Aspartyl protease inhibitor 1 µg/mL
E-64 (H2O) Cysteine protease inhibitor 40 µM
CA-074-Me (DMSO) Cathepsin B inhibitor 40 µM
Z-FY-CHO (ethanol) Cathepsin L inhibitor 40 µM

Results
50
3. Results
3.1 Analysis of DIRC2 sequence
The 1434 bps long open reading frame of human DIRC2 gene corresponds to a protein
of 478 amino acids. The sequence of DIRC2 protein shows a high degree of homology to
known members of Major facilitator superfamily (MFS) proteins, such as human feline
leukemia virus type C receptor (FLVCR) with 43% similarity within the amino acid region
69-427, as well as homology to a number of putative MFS members, e.g. 50% similarity in
amino acids 156-215 to inorganic phosphate cotransporter in Arabidopsis thaliana, 44%
similarity in amino acids 278-433 to a putative transporter in Leishmania major (Bodmer et al
2002). In silico analysis of DIRC2 sequence by TMHMM program
(http://www.cbs.dtu.dk/services/TMHMM/, Krogh et al 2001) suggests a protein consisting of
twelve transmembrane domains (Figure 3.1 A and B, transmembrane domains shaded in
grey). The hydrophilic amino acids sequence between TM2 and TM3 also fits well to the
signature sequence of proteins belonging to the MFS superfamily. Individual transmembrane
domains consist of 20-23 amino acid residues (Figure 3.1 B). Furthermore, whereas the length
of individual loops can vary and may contain post-translational modifications, the central loop
between TM6 and TM7 (Figure 3.1 A, B) is predicted to be around 30 amino acid residues
which represents the loop size usually found in members of MFS proteins. It is thought that
this length is required for an efficient insertion of MFS protein into a membrane (Weinglass
and Kaback 2000).
It has been described in the introduction (Section 1.2) that at least three motifs are
involved in lysosomal targeting of membrane proteins, i.e. DXXLL, DEXXXLLI and
YXXØ motifs. The first two are referred to as dileucine motifs, whereas the latter are known
as tyrosine-based motifs. Cation dependent and independent MPRs are examples of lysosomal
proteins utilizing DXXLL motifs. The DEXXXLLI type sorting motifs are found e.g. in
LIMP-2, sialin and GLUT8 proteins. The tyrosine-based motif YXXØ is present in LAMP-1,
LAMP-2 and CD63 proteins. Sequence analysis of the DIRC2 protein revealed a potential
dileucine lysosomal targeting motif –E9ERQPLL15-, which is located at the N-terminal end
(Figure 3.1 A) and two putative tyrosine-based lysosomal targeting motifs at its C-terminal
end (-Y467-D-RL470- and Y471-L-D-V474-).

Results
51
Figure 3.1 Proposed topology of human DIRC2.
(A) Human DIRC2 consists of 478 amino acid residues. It is proposed to have 12 transmembrane spanning
domains (highlighted in grey). The sequence shown in the box represents a dileucine lysosomal
targeting motif (red box) and two potential tyrosine-based motifs (black box). Asn209 is part of a
putative N-glycosylation site (open head arrow). A synthetic peptide (underlined sequence) was used to
generate a rabbit anti hDIRC2 antiserum.
(B) Topology prediction of DIRC2 generated by TMHMM server
(http://www.cbs.dtu.dk/services/TMHMM/, Krogh et al 2001). According to this model, DIRC2
consists of twelve transmembrane spanning domains, with both termini facing the cytosol and a putative
glycosylation site in the lumen of lysosomes (N209). Two sites of internal HA tags are shown by arrow
heads. The epitope used to raise an anti human DIRC2 antiserum in rabbit is depicted along with a
dileucine motif close to the N-terminal end of DIRC2.
(C) Schematic representation of DIRC2 constructs.
A
B
C
DIRC2-3xmyc
DIRC2-HA214-3xmyc
DIRC2-HA261-3xmyc
DIRC2-N209A-3xmyc
GFP-DIRC2
DIRC2-GFP
DIRC2-3xmyc-ERret
DIRC2-LL/AA-3xmyc
GFPDIRC2 DIRC2 epitope HA N209A3xmyc
Color legend:
LL/AA ERret

Results
52
N-glycosylation modification is a common post-translational modification of proteins
exhibiting a consensus sequence of Asn-X-Ser/Thr (X represents any amino acid residue,
except proline), although not all such sequences are used for N-glycosylation (Medzihradszky
2008; Brooks et al 2006). The DIRC2 sequence shows two such consensus sequences, i.e. -
N209-G-T211- and -N394-S-S396-. The first putative N-glycosylation site was analyzed whether
it is used (Section 3.4), whereas the second N-glycosylation motif was not explored, since it is
located within a predicted transmembrane region and is unlikely to be used.
Figure 3.2 Expression of GFP and 3xmyc-tagged DIRC2 analyzed by Western blot.
Two GFP-tagged constructs of DIRC2, pEGFP.C1-DIRC2 and pEGFP.N1-DIRC2 (GFP-DIRC2 and DIRC2-
GFP, respectively), as well as DIRC2-3xmyc and empty vectors were expressed in HeLa cells. Cells were
harvested 24 hours after transfection. Lysates were prepared as described in the Materials and Methods. Aliquots
of total lysates (10 g and 15 g for GFP-tagged and -3xmyc tagged DIRC2, respectively) were subjected to
SDS-PAGE and Western blot analysis.
(A) Detection of GFP-tagged DIRC2 proteins was carried out by an anti-GFP primary antibody followed by
HRP-conjugated secondary antibody. GFP-DIRC2 fusion shows an apparent molecular weight of about 55 kDa,
whereas DIRC2-GFP fusion appears at about 45 kDa.
(B) DIRC2-3xmyc expression detected with anti-DIRC2 recognizing the N-terminal part of DIRC2. The
uppermost bands of about 55 kDa and a slightly smaller band of around 50 kDa may represent the modified and
unmodified form of full length DIRC2, respectively. The band of about 35 kDa is presumably the N-terminal
fragment of DIRC2 which contains its sugar rest
(C) The nitrocellulose membrane in (B) was reprobed with anti-myc antibody recognizing the 3xmyc tag at the
C-terminal end of DIRC2. The bands of about 55 kDa and 50 kDa represent the modified and unmodified full
length DIRC2, respectively. The band of about 26 kDa is likely the C-terminal fragment of DIRC2.
A B C
Results
53
3.2 DIRC2 is proteolytically processed
Expression analysis of DIRC2 was carried out in transiently transfected HeLa cells
with either GFP or 3xmyc tagged DIRC2 constructs (Figure 3.1 C). Cell lysates were
analyzed by Western blot. Interestingly, different bands were observed for overexpressed
DIRC2 when it was tagged with GFP at the N- and C-terminus, respectively (Figure 3.2 A).
GFP-DIRC2 showed a band of about 55 kDa, whereas DIRC2-GFP appeared at molecular
weight of about 45 kDa. Both fusion proteins were detected at a lower apparent molecular
weight as predicted (from the fusion of DIRC2 with GFP), which is expected to be about 75-
80 kDa. This suggests that DIRC2 protein is likely to be proteolytically processed.
The expression of 3xmyc tagged DIRC2 provides substantiation that DIRC2 is
proteolyzed. Figure 3.2 B and C show the expression of DIRC2-3xmyc detected with an
antibody against the N-terminal epitope and 3xmyc tag at the C-terminus of DIRC2,
respectively. In both cases, full length DIRC2 appears at a molecular weight of about 55 kDa,
and a slightly lower band whose apparent size is approximately close to the calculated
molecular weight of 52.1 kDa of the core polypeptide of DIRC2. However, detection with the
anti DIRC2 antibody shows an additional band at a molecular weight of about 35 kDa,
whereas detection with anti-myc antibody reveals a band at a molecular weight of about 26
kDa. Both smaller bands are likely to represent proteolytic products of DIRC2, which may
correspond to the bands at about 55 kDa and 45 kDa when DIRC2 was fused to GFP (Figure
3.2 A).
3.3 DIRC2 is a lysosomal membrane protein
DIRC2 has been identified in a sub-proteomic study as a putative lysosomal
membrane protein (Schroeder et al 2007). In order to experimentally confirm the lysosomal
localization of DIRC2, DIRC2-3xmyc was expressed in HeLa cells and detected with
antibodies against the N-terminal epitope and 3xmyc tag at the C-terminus by indirect
immunofluorescence. Figure 3.3 shows that signals for both the N-terminal epitope and C-
terminal 3xmyc tag colocalize with the lysosomal membrane protein LAMP-2 (A-C and D-F,
respectively). As expected, DIRC2 detected by antibody against the 3xmyc also colocalizes
with another lysosomal marker protein -glucocerebrosidase, GC (G-I) and with a late
endosomal lipid Lysobiphsosphatidic acid, LBPA (J-L). This result suggests that DIRC2 is a
lysosomal membrane protein.

Results
54
DIRC2 is a lysosomal membrane protein Figure 3.2
E LAMP-2 F Merge
A DIRC2 B LAMP-2 C Merge
D Myc
DIRC2-3xmyc
DIRC2-3xmyc
Construct
G Myc H GC I Merge
J Myc K LBPA L Merge
DIRC2-3xmyc
DIRC2-3xmyc
Lysosomal localization of DIRC2 could also be demonstrated by subcellular
fractionation of HeLa cells transiently transfected with DIRC2-3xmyc. Cells were disrupted
mechanically by passage through a 27G cannula in an iso-osmotic buffer. Post nuclear
fraction (PNS) was obtained by centrifugation at lower speed (1.000 x g). PNS was separated
by density gradient centrifugation employing a self-forming Percoll® gradient, with a starting
concentration of 17% (w/v) Percoll® and centrifugation at 40.000 x g for 47 minutes.
Fractions were collected from the resulting gradient from top to bottom.
Figure 3.3 Localization of DIRC2.
HeLa cells were transfected with DIRC2 constructs tagged with 3xmyc at the C-terminus. Cells were fixed and
double stained with primary antibodies recognizing the N-terminus of DIRC2 and the lysosomal marker protein
LAMP-2 (A-C) or with primary antibody recognizing the C-terminal 3xmyc tag and lysosomal markers LAMP-2
(D-E), GC (G-I), and late endosomal lipid LBPA (J-L). Both N- and C-terminal detection of DIRC2
colocalizes with the lysosomal/late endosomal markers. Of note, the primary antibody against the N-terminus of
DIRC2 does not detect endogenous DIRC2 (A). Bars represent 10 m.
Results
55
Figure 3.4 Percoll® fractionation of the extract of HeLa cells transiently transfected with DIRC2-3xmyc.
HeLa cells were transfected with DIRC2-3xmyc and harvested 48 hours after transfection. Cells were disrupted
and suspended in iso-osmotic buffer. Cell homogenate was fractionated in a self-forming Percoll® gradient (17%
w/v) upon centrifugation at 40.000 x g for 47 minutes.
(A) Enzymes activities of -hexosaminidase and alkaline phosphatase were determined in each fraction
using spectrophotometric methods as described in Materials and Methods.
(B) Equal volumes of each fraction were subjected to SDS-PAGE and Western blot analysis. Western blot
detection of each fraction was undertaken with several subcellular markers. DIRC2, as detected by anti-
myc, is shown to be co-sedimenting with lysosomes. It is recovered in the dense fractions (12-14), as
shown by lysosomal markers LAMP-2, cathepsin D and βGC. A minor amount of DIRC2 is distributed
in fraction 6 and 7 where the signal of ER marker PDI appears.
Figure legend: LAMP-2: lysosomal associated membrane
protein type 2; PDI: protein disulfide isomerase; CtsD:
cathepsin D; βGC: beta-glucocerebrosidase.

Results
56
Figure 3.4 A shows the distribution of lysosomal enzyme -hexosaminidase, which is
found in the dense fractions (fraction 12-14). In contrast, activity of alkaline phosphatase, an
enzyme of the plasma membrane, was recovered in two peaks in fractions 1-2 and fractions 4-
5, respectively. Parallel to this observation, the immunoblot analysis of individual fractions of
HeLa cells transfected with DIRC2-3xmyc is depicted in Figure 3.4 B. It is revealed that
proteolytically processed DIRC2 with a molecular weight of 25 kDa is observed in fraction
12-14 co-sedimenting with lysosomes as indicated by the lysosomal markers LAMP-2,
cathepsin D and -glucocerebrosidase. The discrepancy between theoretical and apparent
molecular weight of DIRC2 (55 kDa and 25 kDa, respectively) suggests that DIRC2 may
have been proteolytically processed. Nevertheless, the rather weak signals that presumably
represent full length DIRC2 are observed co-sedimenting with the endoplasmic reticulum
(fraction 5-7, shown by ER marker PDI). Taken together, both immunofluorescence and
subcellular data confirmed the lysosomal localization of DIRC2 protein. However, further
evidence is required to validate whether the processing of DIRC2 first takes place when it
reaches lysosomes.
3.4 DIRC2 is N-glycosylated at Asn-209
Bioinformatics analysis of the DIRC2 sequence (Section 3.1) highlighted the
possibility that DIRC2 may undergo N-glycosylation. Expression of DIRC2 in HeLa cell
analyzed by Western blot (Section 3.2) also indicated that DIRC2 is expressed at an apparent
molecular weight higher than the calculated molecular weight. In order to confirm whether
DIRC2 is N-glycosylated, the lysate of HeLa cells overexpressing DIRC2-3xmyc was treated
with N-glycosidase F (PNGase F). PNGase F is an amidase isolated from Flavobacterium
meningosepticum that cleaves between the innermost N-acetyl-D-glucosamine (GlcNAc) and
asparagine residues of high mannose, hybrid, and complex oligosaccharides from N-linked
glycoproteins (Maley et al 1989). It is shown that wild-type DIRC2 is sensitive to PNGase F
digestion (lane 3 and 4, detected by anti-hDIRC2 and anti-myc in Figure 3.5 A and 3.5 B,
respectively). This result suggests that DIRC2 is an N-linked glycosylated protein.
A closer view on the expression of wild-type, undigested, DIRC2 -upon detection with
anti hDIRC2 antibody- (lane 3 Figure 3.5 A) revealed that wild-type DIRC appears in three
forms: a band of about 55 kDa which represents the full length DIRC2 with its sugar moiety,

Results
57
a band of about 35 kDa which represents the N-terminal half with a sugar moiety, and the
small band slightly lower than the 25 kDa marker, which is supposed to be the deglycosylated
N-terminal half of DIRC2. Incubation of wild-type DIRC2 in the presence of PNGase F (lane
4 Figure 3.5 A) confirmed the identity of the full length DIRC2 bands, as removal of sugar
moiety by PNGase F allowed the identification of the core polypeptide of DIRC2 of about 50
kDa. Additionally, upon PNGase F digestion, the 35 kDa band completely disappeared and
shifted to a band slightly below 25 kDa, thus confirming that the 35 kDa and 25 kDa bands
are the glycosylated and the unglycosylated N-terminal half of DIRC2, respectively. This
suggests that Asn-209 is used for N-glycosylation. On the other hand, redetection of the same
blot with an anti-myc antibody revealed that the undigested DIRC2-3xmyc appears as two
bands: the upper band of 55 kDa which fits the molecular weight of full length DIRC2 and a
smaller band above 25 kDa protein marker, which is likely to be the C-teminus fragment of
DIRC2 (Figure 3.5 B, lane 3). Upon PNGase F digestion, the full length DIRC2 was shifted to
50 kDa which represent the core polypeptide DIRC2, whereas the C-terminal fragment was
not shifted (Figure 3.5 B, lane 4). This validates that Asn-394 in the C-terminal half of DIRC2
is not used for N-glycosylation.
Figure 3.5 Deglycosylation of DIRC2 by PNGase F.
Wild-type DIRC2-3xmyc and DIRC2-N209A-3xmyc were overexpressed in HeLa cells. Cells were harvested 2
days after transfection. Lysates were incubated in the presence or absence of PNGase F prior to SDS-PAGE
separation and Western blot analysis as described in the Materials and Methods.
A) Immunodetection of the full-length DIRC2 and its N-terminal fragment of both wild-type and N209A mutants
of DIRC2 with antibody directed against N-terminal epitope.
(B) Immunodetection of the same blot with an anti-myc antibody. Loading controls as well as PNGase F
digestion control are provided by immunodetection of cathepsin D.
Equal loading and control of PNGase F digestion were shown by cathepsin D detection (A and B).
A B

Results
58
A direct proof that the first N-glycosylation motif (-N209-P-T211-) is instead used for
glycosylation was shown by analyzing the expression of DIRC2-N209A-3xmyc mutant. In
this mutant, Asn-209 is replaced by Ala-209 (construct provided by Dr. B. Schroeder). Lysate
of HeLa cells expressing this mutant was incubated with PNGase F and analyzed by Western
blot. Figure 3.5 A and B (Lane 5 and 6) revealed that both full length and fragments DIRC2
appear at the same molecular weight as that apparently shown by PNGase F digested wild-
type DIRC2 (lane 4), irrespective of PNGase F digestion. These patterns are in agreement
with the prediction that Asn-209 not Asn-394 is used for N-glycosylation. Moreover,
validation of N-glycosylation site gave an indirect substantiation of the topology of DIRC2
(Figure 3.1). The DIRC2 topology suggests that the loop 5 (region between TM5 and TM6
where the N-glycosylation site located) resides on the luminal face of the membrane, whereas
both N-terminal and C-terminal are facing the cytoplasmic environment.
3.5 Lysosomal targeting of DIRC2 depends on a lysosomal sorting motif at its N-
terminus
3.5.1. Expression of dileucine and ER retention mutants of DIRC2
The targeting of proteins into lysosomes, as described in the Introduction (Section
1.2), is defined by several lysosomal sorting motifs. One subclass of lysosomal targeting
motifs is the consensus sequence DEXXXLLI (Table 1.1). Sequence analysis of DIRC2
protein reveals that such a motif resides in its N-terminal region, namely –E9ERQPLL15-. In
order to analyze whether this motif has a functional relevance for the lysosomal targeting of
DIRC2, a DIRC2 mutant was constructed where the dileucine in the putative lysosomal
targeting motif was replaced by alanines (LL/AA mutant, Figure 3.1 C). Expression of this
mutant is shown in Figure 3.6 D-F. It is revealed that replacement of the dileucine motif with
alanines resulted in surface expression of DIRC2. This mutant showed very few or no
colocalization with the lysosomal marker LAMP-2 (Figure 3.6 D-F). On contrary, disruption
of two tyrosine-based lysosomal targeting motifs close to C-terminal end of DIRC2 (Figure
3.1 B) had only minor effect on the lysosomal targeting of DIRC2 (data not shown). It is
concluded that the dileucine motif is important for the lysosomal targeting of DIRC2. This
observation underlines the critical importance of the dileucine motif of DIRC2 in the sorting
of DIRC2 to the lysosomes.

Results
59
Subcellular fractionation of HeLa lysate transfected with DIRC2 indicated that the
majority of DIRC2 was distributed in lysosomal fraction in processed form, whereas only a
small amount of DIRC2 co-sedimented with ER in full-length form (Section 3.3, Figure 3.4
B). In order to validate that the absence of processed form of DIRC2 in the ER fraction was
not due to the minor distribution of DIRC2 in ER, a DIRC2 mutant appended with RR-based
ER targeting motif (DIRC2-3xmyc-ERret, Figure 3.1. C) was generated and overexpressed in
HeLa cells. Expression of this mutant in HeLa cells, analyzed by immunofluorescence,
resulted in an ER localization (Figure 3.6 J-L). This mutant appeared as a full length form on
Western blot (M). It was likely to be retained in the ER or transported back from Golgi to the
ER, and was not able to reach lysosomes (G-I). This result suggests that the ER retention
motif predominantly retains the DIRC2 in the ER, irrespective of the presence of functional
dileucine lysosomal targeting motif. This observation along with the result of subcellular
fractionation (Figure 3.4 B) underlined the fact that DIRC2 was not fragmented in the ER, and
that the processing had to occur in a post ER compartment.
3.5.2 Stepwise post-translational modification of DIRC2
Analysis of DIRC2 expression or localization in the ER can also be achieved by
addition of brefeldin A1 to cultured cells. Brefeldin A has long been known to have an ability
to inhibit the transport of protein out of the ER, although the rate of protein biosynthesis itself
is not affected (Misumi et al 1986). In agreement to the function of brefeldin A, expression of
DIRC2 in the presence of brefeldin A1 prevents proteolysis of DIRC2. Hence, it is concluded
that DIRC2 is not proteolytically processed in the ER (Figure 3.6 M lane 3). It is also shown
that the full length DIRC2 expressed in ER had a lower molecular weight in comparison to
the full length DIRC2 expressed in the lysosomes (Figure 3..6 M lane 2).
In order to analyse the glycosylation of DIRC2, wild-type and N209A mutant DIRC2
were overexpressed in HeLa cells in the presence and absence of brefeldin A1. The lysates
were treated with either PNGase F or Endo-β-N-acetylglucosaminidase H (Endo H). The
latter cleaves oligosaccharides directly linked to an asparagine residue but not of complex
oligosaccharides form (Maley et al 1989). Figure 3.7 shows the expression of wild-type
DIRC2-3xmyc and DIRC2-N209A-3xmyc mutant in HeLa cells in the absence and the
presence of brefeldin A1. As expected, addition of brefeldin A1 prevented the proteolytic of

Results
60
Figure 3.6 Immunofluorescence analyses of dileucine and ER retention mutants of DIRC2.
HeLa cells were transfected either with dileucine and ER retention mutants (DIRC2-LL/AA-3xmyc and DIRC2-
3xmyc-ERret, respectively; Figure 3.1 C). For immunofluorescence assay, transfected cells were fixed two days
after transfection. The DIRC2 LL/AA mutant was mainly expressed at the cell surface (D-F) and did not
colocalize with the lysosomal marker LAMP-2. The DIRC2 ER retention mutant did also not colocalize with the
lysosomal marker LAMP-2 (G-I). Instead, it colocalized with the endoplasmic reticulum marker KDEL (J-L).
Figure A-C shows control of wild-type DIRC2-3xmyc overexpressed in HeLa cells. Bars represent 10 m. For
Western blot analysis (Figure M), DIRC2-3xmyc was expressed in HeLa cells in the presence of brefeldin A1,
which was added 6 hours after transfection to a final concentration of 5 g/mL. Cells were harvested 10 hours
after brefeldin A1 addition. DIRC2 ER retention mutant as well as wild-type and empty vector were also used to
transfect HeLa cells, and cells were harvested 16 hours after transfection. Aliquots of lysates (20 g protein)
were subjected to SDS-PAGE and Western blot analysis as described in the Materials and Methods. Blot was
detected with anti-myc primary antibody followed by HRP-conjugated secondary antibody. Equal loading was
shown by actin detection (Figure M, lower panel).
M
I MergeH LAMP-2G Myc
F Merge
J Myc K KDEL L Merge
D Myc E LAMP-2
A Myc B LAMP-2 C Merge
DIRC2-3xmyc-ERret
DIRC2-3xmyc
Construct
DIRC2-3xmyc-ERret
DIRC2-LL/AA-3xmyc
1 2 3 4
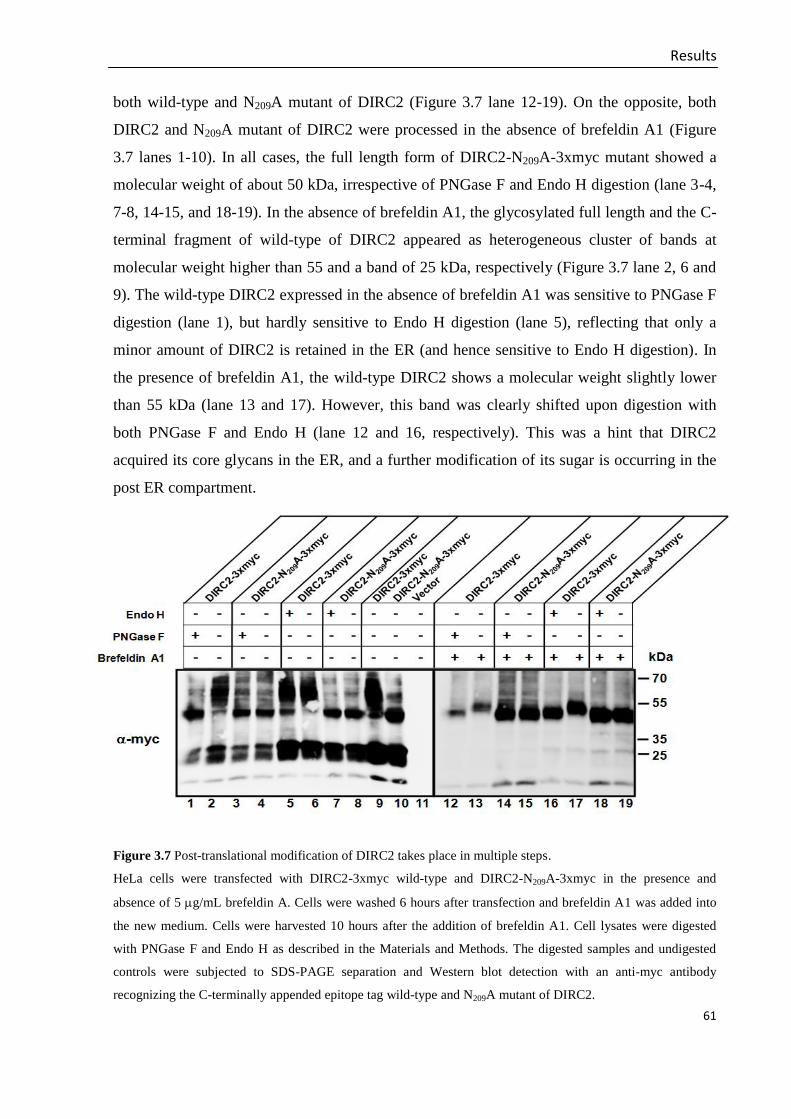
Results
61
both wild-type and N209A mutant of DIRC2 (Figure 3.7 lane 12-19). On the opposite, both
DIRC2 and N209A mutant of DIRC2 were processed in the absence of brefeldin A1 (Figure
3.7 lanes 1-10). In all cases, the full length form of DIRC2-N209A-3xmyc mutant showed a
molecular weight of about 50 kDa, irrespective of PNGase F and Endo H digestion (lane 3-4,
7-8, 14-15, and 18-19). In the absence of brefeldin A1, the glycosylated full length and the C-
terminal fragment of wild-type of DIRC2 appeared as heterogeneous cluster of bands at
molecular weight higher than 55 and a band of 25 kDa, respectively (Figure 3.7 lane 2, 6 and
9). The wild-type DIRC2 expressed in the absence of brefeldin A1 was sensitive to PNGase F
digestion (lane 1), but hardly sensitive to Endo H digestion (lane 5), reflecting that only a
minor amount of DIRC2 is retained in the ER (and hence sensitive to Endo H digestion). In
the presence of brefeldin A1, the wild-type DIRC2 shows a molecular weight slightly lower
than 55 kDa (lane 13 and 17). However, this band was clearly shifted upon digestion with
both PNGase F and Endo H (lane 12 and 16, respectively). This was a hint that DIRC2
acquired its core glycans in the ER, and a further modification of its sugar is occurring in the
post ER compartment.
Figure 3.7 Post-translational modification of DIRC2 takes place in multiple steps.
HeLa cells were transfected with DIRC2-3xmyc wild-type and DIRC2-N209A-3xmyc in the presence and
absence of 5 g/mL brefeldin A. Cells were washed 6 hours after transfection and brefeldin A1 was added into
the new medium. Cells were harvested 10 hours after the addition of brefeldin A1. Cell lysates were digested
with PNGase F and Endo H as described in the Materials and Methods. The digested samples and undigested
controls were subjected to SDS-PAGE separation and Western blot detection with an anti-myc antibody
recognizing the C-terminally appended epitope tag wild-type and N209A mutant of DIRC2.

Results
62
3.6 Detection of endogenous DIRC2
It has been shown that overexpressed DIRC2 in HeLa cells can be detected by anti-
hDIRC2 antibody recognizing an epitope at the N-terminus of DIRC2 (Figure 3.2. B). In
order to validate whether anti-hDIRC2 antibody is able to detect DIRC2 at the endogenous
level, anti-hDIRC2 antibody was used to detect DIRC2 from HeLa lysates transfected either
by DIRC2 siRNAs or non-targeting siRNA. Control lane in Figure 3.8 B shows that
endogenous DIRC2 from HeLa cell can be detected by the anti-hDIRC2 antibody. The
endogenous DIRC2 appeared as a cluster of bands between 30 to 40 kDa. This cluster of
bands resembles the N-terminal half of overexpressed DIRC2-3xmyc detected by an anti-
hDIRC2 antibody (Figure 3.5 A lane 3). This result suggests that endogenous DIRC2 is
glycosylated and proteolytically processed in a similar way as the overexpressed DIRC2.
By using three different DIRC2 siRNAs or combination of them, DIRC2 can be
significantly downregulated as shown by the reduction of DIRC2 mRNA and protein level
(Figure 3.8 A and B, respectively). Following DIRC2 downregulation, expression level of
several lysosomal marker proteins (LAMP-2, -glucocerebrosidase and cathepsin D) and
activities of lysosomal enzymes (-hexosaminidase, -galactosidase and -mannosidase)
were tested. Both types of analyses could not reveal significant alterations of either lysosomal
marker proteins or lysosomal enzymes activities following DIRC2 downregulation by siRNA
(Figure 3.8 C and D, respectively). Immunofluorescence analysis of DIRC2 siRNAs
transfected HeLa cells revealed no apparent morphological alteration of cells and lysosomes
or alteration of lysosomal storage (e.g. cholesterol, tested by filipin staining) (data not
shown).
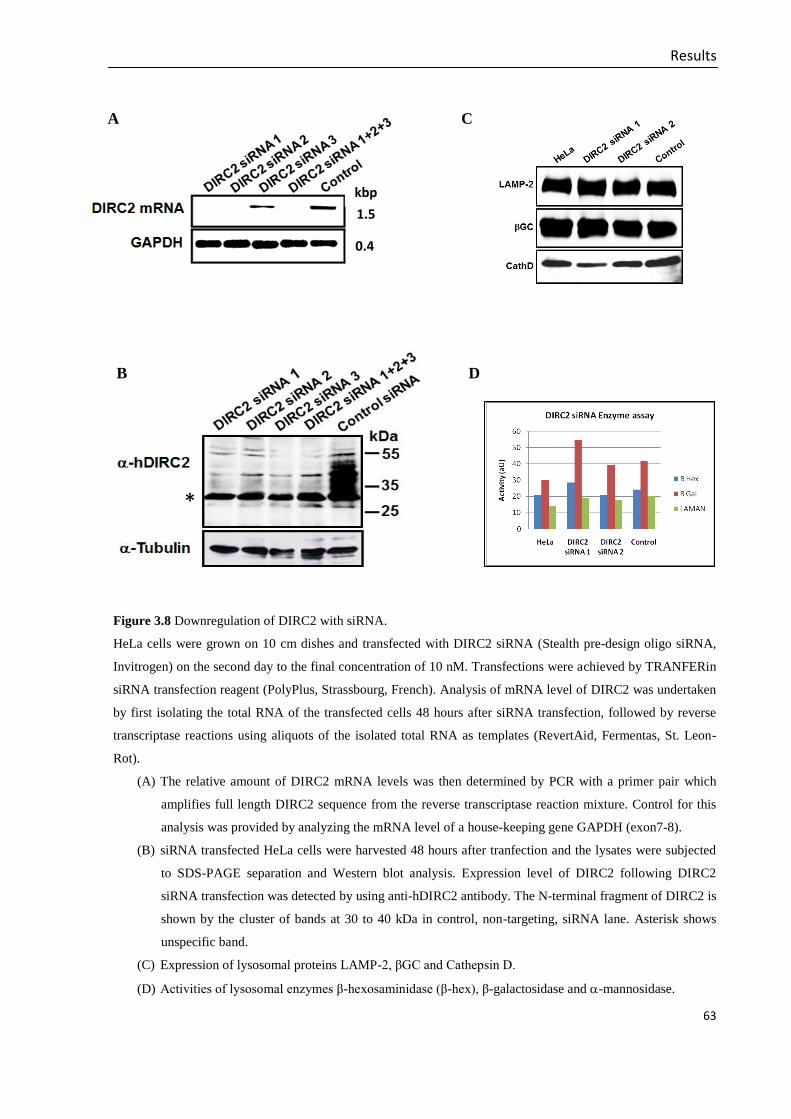
Results
63
Figure 3.8 Downregulation of DIRC2 with siRNA.
HeLa cells were grown on 10 cm dishes and transfected with DIRC2 siRNA (Stealth pre-design oligo siRNA,
Invitrogen) on the second day to the final concentration of 10 nM. Transfections were achieved by TRANFERin
siRNA transfection reagent (PolyPlus, Strassbourg, French). Analysis of mRNA level of DIRC2 was undertaken
by first isolating the total RNA of the transfected cells 48 hours after siRNA transfection, followed by reverse
transcriptase reactions using aliquots of the isolated total RNA as templates (RevertAid, Fermentas, St. Leon-
Rot).
(A) The relative amount of DIRC2 mRNA levels was then determined by PCR with a primer pair which
amplifies full length DIRC2 sequence from the reverse transcriptase reaction mixture. Control for this
analysis was provided by analyzing the mRNA level of a house-keeping gene GAPDH (exon7-8).
(B) siRNA transfected HeLa cells were harvested 48 hours after tranfection and the lysates were subjected
to SDS-PAGE separation and Western blot analysis. Expression level of DIRC2 following DIRC2
siRNA transfection was detected by using anti-hDIRC2 antibody. The N-terminal fragment of DIRC2 is
shown by the cluster of bands at 30 to 40 kDa in control, non-targeting, siRNA lane. Asterisk shows
unspecific band.
(C) Expression of lysosomal proteins LAMP-2, βGC and Cathepsin D.
(D) Activities of lysosomal enzymes β-hexosaminidase (β-hex), β-galactosidase and -mannosidase.
A C
B D
*
kbp
1.5
0.4

Results
64
3.7 Inhibitory profiling indicates involvement of the lysosomal cysteine protease
cathepsin L
In an attempt to unravel the identity of the protease(s) involved in DIRC2 proteolysis,
DIRC2 was overexpressed in HeLa cells in the presence of several protease inhibitors. An
initial screening with a broad panel of inhibitors excluded, for example, a role of proteosome,
aspartyl peptidase and -secretase in the fragmentation of DIRC2 (tested by MG132, pepstatin
A and inhibitor X, subsequently; data not shown). On the contrary, prevention of DIRC2
proteolysis was observed in DIRC2 transfected cells treated with NH4Cl and leupeptin.
Effects of these inhibitors are shown in the Figure 3.9 lane 3 and 4, respectively. NH4Cl is
known to interfere with the acidification of lysosomes (Gahl and Tietze 1985; Galbiati et al
2000), which implied that the fragmentation of DIRC2 takes place in the lysosomes, and
acidic environment is a prerequisite for a successful proteolysis. Leupeptin is known as a
competitive serine/cysteine protease inhibitor (Aoyagi et al 1969). Pepstatin A, an inhibitor
for aspartyl protease (Umezawa et al 1970), did not inhibit the proteolysis of DIRC2 (lane 5).
These observations opened the possibility that DIRC2 is proteolyzed by lysosomal acid
hydrolases of serine or cysteine protease class.
Figure 3.9 Inhibition of DIRC2 proteolysis.
HeLa cells were transfected with DIRC2-3xmyc in DMEM medium supplemented with 10% FCS and
penicillin/streptomycin. Medium was refreshed six hour after transfection and inhibitors were added to final
concentrations of 25 mM, 100 M and 1 g/mL for NH4Cl, leupeptin and pepstatin A, respectively. Cells were
harvested 10 hours after the addition of inhibitors. Cells lysates were subjected to SDS- PAGE followed by
Western blot analysis. Expression of DIRC2 was detected by a mouse anti-myc antibody. Equal loading was
confirmed by detection of actin.
1 2 3 4 5
Results
65
Lysosomes are harbouring a variety of hydrolases, including serine/cysteine proteases.
Most of them are known as cathepsins. Members of this group include cathepsin A and G
(serine protease), cathepsin B, C, F, H, K, L, O, S, W, V and Z (cysteine protease).
Additionally, there are also cathepsin D and E which are known as lysosomal aspartic
proteases (Reiser et al 2010). Further refinement was attempted by the use of additional, more
specific, inhibitors. It is shown in the Figure 3.10 lane 4 that E-64 was able to inhibit the
proteolysis of DIRC2. E-64 was reported to inhibit mostly cysteine proteases (Barrett et al
1982, Katunuma and Kominami 1995). Hence, the result of proteolysis inhibition assay with
E-64 ruled out the role of serine protease, and suggests a protease involved in the processing
of DIRC2 which belongs to the cysteine protease group.
Cathepsin B and L are two prominent cysteine proteases in lysosomes. In order to
investigate their possible role in the processing of DIRC2, an experiment by using CA-074-
Me and Z-FY-CHO, inhibitors of cathepsin B and cathepsin L, respectively, was performed.
Figure 3.10 lane 6 and 8 shows that both cysteine protease inhibitors were able to prevent the
fragmentation of DIRC2. It suggests that cathepsin B and/or cathepsin L may be involved in
the proteolysis of DIRC2.
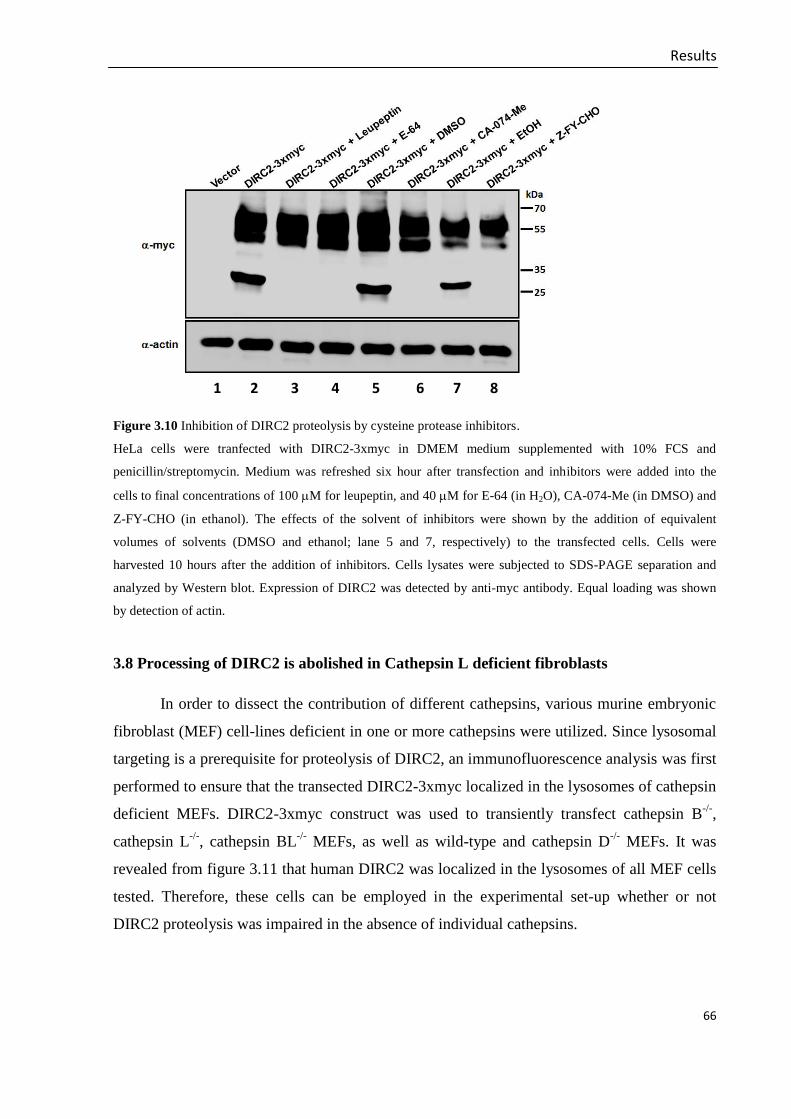
Results
66
Figure 3.10 Inhibition of DIRC2 proteolysis by cysteine protease inhibitors.
HeLa cells were tranfected with DIRC2-3xmyc in DMEM medium supplemented with 10% FCS and
penicillin/streptomycin. Medium was refreshed six hour after transfection and inhibitors were added into the
cells to final concentrations of 100 M for leupeptin, and 40 M for E-64 (in H2O), CA-074-Me (in DMSO) and
Z-FY-CHO (in ethanol). The effects of the solvent of inhibitors were shown by the addition of equivalent
volumes of solvents (DMSO and ethanol; lane 5 and 7, respectively) to the transfected cells. Cells were
harvested 10 hours after the addition of inhibitors. Cells lysates were subjected to SDS-PAGE separation and
analyzed by Western blot. Expression of DIRC2 was detected by anti-myc antibody. Equal loading was shown
by detection of actin.
3.8 Processing of DIRC2 is abolished in Cathepsin L deficient fibroblasts
In order to dissect the contribution of different cathepsins, various murine embryonic
fibroblast (MEF) cell-lines deficient in one or more cathepsins were utilized. Since lysosomal
targeting is a prerequisite for proteolysis of DIRC2, an immunofluorescence analysis was first
performed to ensure that the transected DIRC2-3xmyc localized in the lysosomes of cathepsin
deficient MEFs. DIRC2-3xmyc construct was used to transiently transfect cathepsin B-/-
,
cathepsin L-/-
, cathepsin BL-/-
MEFs, as well as wild-type and cathepsin D-/-
MEFs. It was
revealed from figure 3.11 that human DIRC2 was localized in the lysosomes of all MEF cells
tested. Therefore, these cells can be employed in the experimental set-up whether or not
DIRC2 proteolysis was impaired in the absence of individual cathepsins.
1 2 3 4 5 6 7 8
9

Results
67
7.B. Lysosomal colocalization of DIRC2 in protease-deficient fibroblasts
WT
CtsB -/-
CtsL -/-
CtsBL -/-
CtsD -/-
A B C
D E F
G H I
J K L
M N O
DIRC2-3xmyc LAMP2 MergeMEF
Figure 3.11 Localization of hDIRC2 in cathepsin deficient MEFs.
DIRC2-3xmyc was used to transfect different MEF cell-lines deficient in one or two cathepsins (cathepsin B,
CtsB-/-
; cathepsin L, CtsL-/-
; cathepsin B and L, CtsBL-/-
, cathepsin D, CtsD-/-
) as well as wild-type MEF. Cells
were fixed with 4% paraformaldehyde 24 hours after transfection, permeabilized with 0.2% saponin and blocked
with 3% BSA. DIRC2 expressions were visualized by anti-myc antibody, whereas lysosomes were stained by
anti-LAMP-2 antibody. Nuclei were stained by DAPI (blue). Bars represent 10 m.
Figure 3.12 shows the expression of DIRC2-3xmyc in cathepsin deficient MEF cell-
lines. DIRC2-3xmyc expressed in wild-type MEF cells (lane 4) showed a similar pattern to
the DIRC2-3xmyc expressed in HeLa cells (lane 2): the full length DIRC2 appears at about 55
kDa and the C-terminal fragment appears at about 25 kDa. Among the cathepsin deficient
MEF cells, it was revealed that DIRC2-3xmyc was not proteolyzed in the cathepsin L
deficient and cathepsin B and L double deficient MEF cells (CtsL -/-
in lane 8 and CtsBL-/-

Results
68
10, respectively). In contrast, DIRC2-3xmyc was proteolyzed similar to wild-type cells in
cathepsin B single deficient MEF (lane 6) and cathepsin D deficient MEF (lane 12). This
result ruled out a role of cathepsin B and D in the proteolysis of DIRC2 and showed that
cathepsin L is indispensable for the proteolysis of DIRC2 in MEF cells.
Figure 3.12 Expression of DIRC2 in cathepsin deficient MEFs.
Murine embryonic fibroblast (MEF) cells deficient in cathepsin B (CtsB-/-
), cathepsin L (CtsL-/-
), cathepsin B
and L (CtsBL-/-
) and cathepsin D (CtsD-/-
) were transfected with DIRC2-3xmyc. Controls were DIRC2 expressed
in HeLa and wild-type MEF. Cells were harvested 48 hours after transfection. Aliquots of cell lysates (20 g
protein) of each sample were subjected to SDS-PAGE followed by Western blot detection. The full length
DIRC2 and its C-terminal fragment (detected by anti-myc antibody) are shown by closed and opened arrow
heads, respectively. There was no proteolytic fragment of DIRC2 observed when DIRC2 was expressed in either
cathepsin L single deficient or cathepsin B and L double deficient MEF (upper panel). Lower panels confirm the
absence or presence of respective cathepsins in different cell-lines.
It has been described above that overexpression of human DIRC2 in cathepsin L
deficient MEFs prevents the processing of DIRC2. It is to be expected that endogenous
DIRC2 is not processed in murine tissue deficient in cathepsin L. Murine DIRC2 has a similar
1 2 3 4 5 6 7 8 9 10 11 12

Results
69
sequence to human DIRC2 with about 95% identity. The sequence of synthetic oligopeptide
used to generate anti human DIRC2 antibody in rabbit (-G2SRWSSEEE RQPLLGPGLG
PGLG24-, Figure 3.1 A) was very similar to the N-terminal sequence of mouse DIRC2 (-
G2SGWSSEEE ERQPLLGPGL GPAP24-) so that a cross-reactivity of the antibody against
hDIRC2 with murine DIRC2 was expected. In order to investigate whether endogenous
DIRC2 in cathepsin L knockout mouse was also proteolyzed, lysosome-enriched fractions
from mouse liver was analyzed by Western blot. The lysosome-enriched samples (tritosomes)
were obtained from Dr. Markus Damme (University of Goettingen) and were prepared by
injecting tyloxapol (Triton WR1339) into mice 4 days prior to sacrifice. This treatment alters
the density of mouse lysosomes and facilitates an easy separation of highly-enriched
lysosomes from the lysates of mouse livers. Details of this preparation were recently
published (Damme et al 2010).
Figure 3.13 Expression of endogenous mouse DIRC2 in wild-type and CtsL-/-
mouse liver.
Lysosome-enriched liver lysates (tritosomes) of wild-type mouse and mouse deficient in cathepsin L livers were
provided by Dr. Markus Damme (University of Goettingen). Aliquots of untreated and PNGase F treated
tritosomes (1.5 µg protein) were subjected to SDS-PAGE separation and Western blot analysis. Blot was
detected by anti-hDIRC2 which also recognized murine DIRC2. Full length murine DIRC2 was hardly detected
in wild-type mouse liver tritosomes (lane 1), whereas in CtsL-/-
mouse liver tritosomes a small fraction of DIRC2
was detectable (lane 3, shown by a closed arrow). In both wild-type and CtsL-/-
mouse liver, their bulk of DIRC2
was present at a cluster of bands with an apparent molecular weight of 30 kDa (open arrow) that shifted to a
band of about 20 kDa upon PNGase F digestion (lane 2 and 4, respectively). The PNGase F digested full length
DIRC2 from CtsL-/-
mouse liver was represented in a band of about 40 kDa (lane 4). The presence and the
absence of cathepsin L in the wild-type and knockout mouse liver, respectively, were shown by detection with
anti-mouse cathepsin L (lower panel).
1 2 3 4

Results
70
Unlike the result shown by overexpressing of human DIRC2 in MEF cells deficient
in cathepsin L, DIRC2 was proteolyzed to a significant degree and only a small amount of full
length DIRC2 appeared in endogenous CtsL-/-
mouse liver (Figure 3.13 lane 3 shown by
opened and closed arrows, respectively). Both full length and processed forms of mouse
DIRC2 were shifted to bands of about 40 and 20 kDa upon PNGase digestion, respectively
(lane 4). In contrary, lysosome-enriched fractions from wild-type mouse liver showed very
few or no full length DIRC2 (lane 1). The bulk N-terminal fragment of DIRC2 from wild-type
mouse was shifted from 30 kDa to 20 kDa upon PNGase F digestion (lane 1 and 2,
respectively). There was no observable PNGase F digestion product of full length DIRC2.
The fact that DIRC2 processing in CtsL-/-
mouse liver is only slightly impaired indicates that
the role of cathepsin L in the proteolysis of DIRC2 in CtsL-/-
liver may be compensated by one
or more unknown proteases.
3.9 Rescue of DIRC2 proteolysis by coexpression of cathepsin L in cathepsin deficient
MEF
In order to substantiate the role of cathepsin L in the proteolysis of DIRC2, a rescue
experiment was undertaken. Human DIRC2-3xmyc was co-expressed with mouse CtsL
cDNA in CtsL-/-
MEF. Mouse CtsL cDNA was cloned in the pcDNA3.1 vector and used in
co-transfection experiment. Co-expression of DIRC2-3xmyc together with mCtsL in CtsL-/-
MEF showed that mCtsL had the ability to rescue the proteolysis of DIRC2 (Figure 3.14 lane
2). The rescue of DIRC2-3myc proteolysis by co-expression of mCtsL was abolished in the
presence of cathepsin L inhibitor Z-FY-CHO (Figure 3.14 lane 3), in spite of expression of
mCtsL (lower panel).
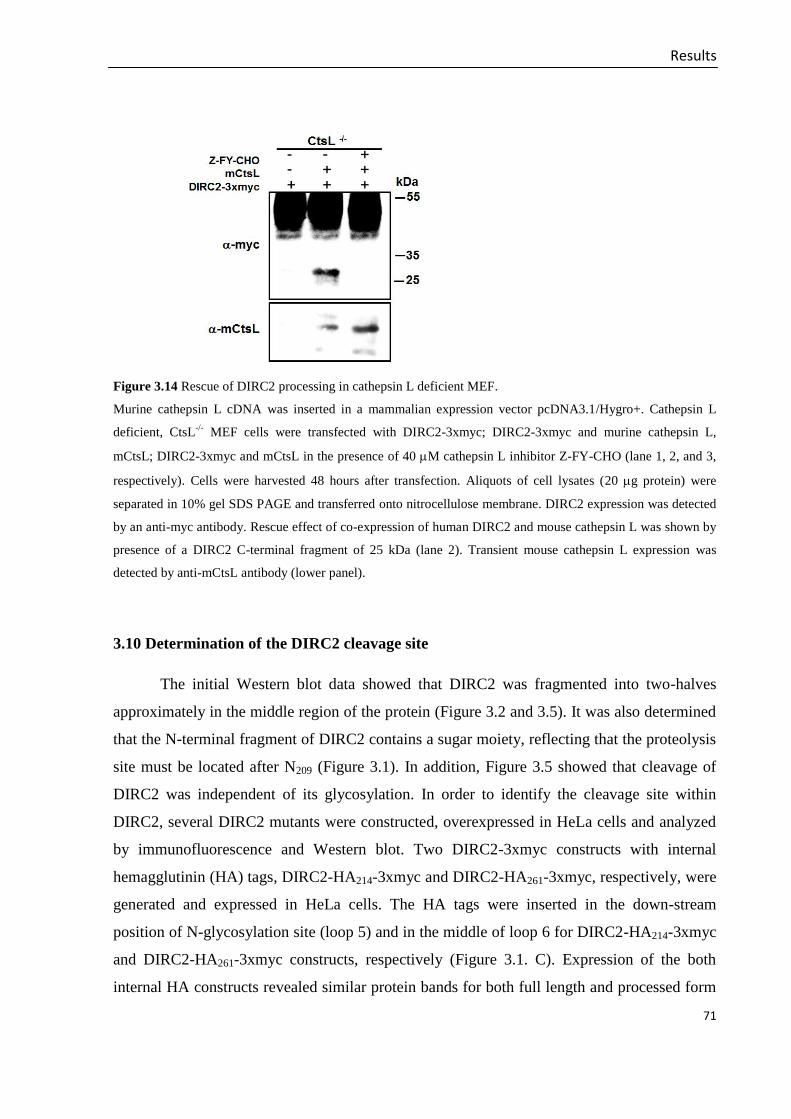
Results
71
Figure 3.14 Rescue of DIRC2 processing in cathepsin L deficient MEF.
Murine cathepsin L cDNA was inserted in a mammalian expression vector pcDNA3.1/Hygro+. Cathepsin L
deficient, CtsL-/-
MEF cells were transfected with DIRC2-3xmyc; DIRC2-3xmyc and murine cathepsin L,
mCtsL; DIRC2-3xmyc and mCtsL in the presence of 40 M cathepsin L inhibitor Z-FY-CHO (lane 1, 2, and 3,
respectively). Cells were harvested 48 hours after transfection. Aliquots of cell lysates (20 g protein) were
separated in 10% gel SDS PAGE and transferred onto nitrocellulose membrane. DIRC2 expression was detected
by an anti-myc antibody. Rescue effect of co-expression of human DIRC2 and mouse cathepsin L was shown by
presence of a DIRC2 C-terminal fragment of 25 kDa (lane 2). Transient mouse cathepsin L expression was
detected by anti-mCtsL antibody (lower panel).
3.10 Determination of the DIRC2 cleavage site
The initial Western blot data showed that DIRC2 was fragmented into two-halves
approximately in the middle region of the protein (Figure 3.2 and 3.5). It was also determined
that the N-terminal fragment of DIRC2 contains a sugar moiety, reflecting that the proteolysis
site must be located after N209 (Figure 3.1). In addition, Figure 3.5 showed that cleavage of
DIRC2 was independent of its glycosylation. In order to identify the cleavage site within
DIRC2, several DIRC2 mutants were constructed, overexpressed in HeLa cells and analyzed
by immunofluorescence and Western blot. Two DIRC2-3xmyc constructs with internal
hemagglutinin (HA) tags, DIRC2-HA214-3xmyc and DIRC2-HA261-3xmyc, respectively, were
generated and expressed in HeLa cells. The HA tags were inserted in the down-stream
position of N-glycosylation site (loop 5) and in the middle of loop 6 for DIRC2-HA214-3xmyc
and DIRC2-HA261-3xmyc constructs, respectively (Figure 3.1. C). Expression of the both
internal HA constructs revealed similar protein bands for both full length and processed form
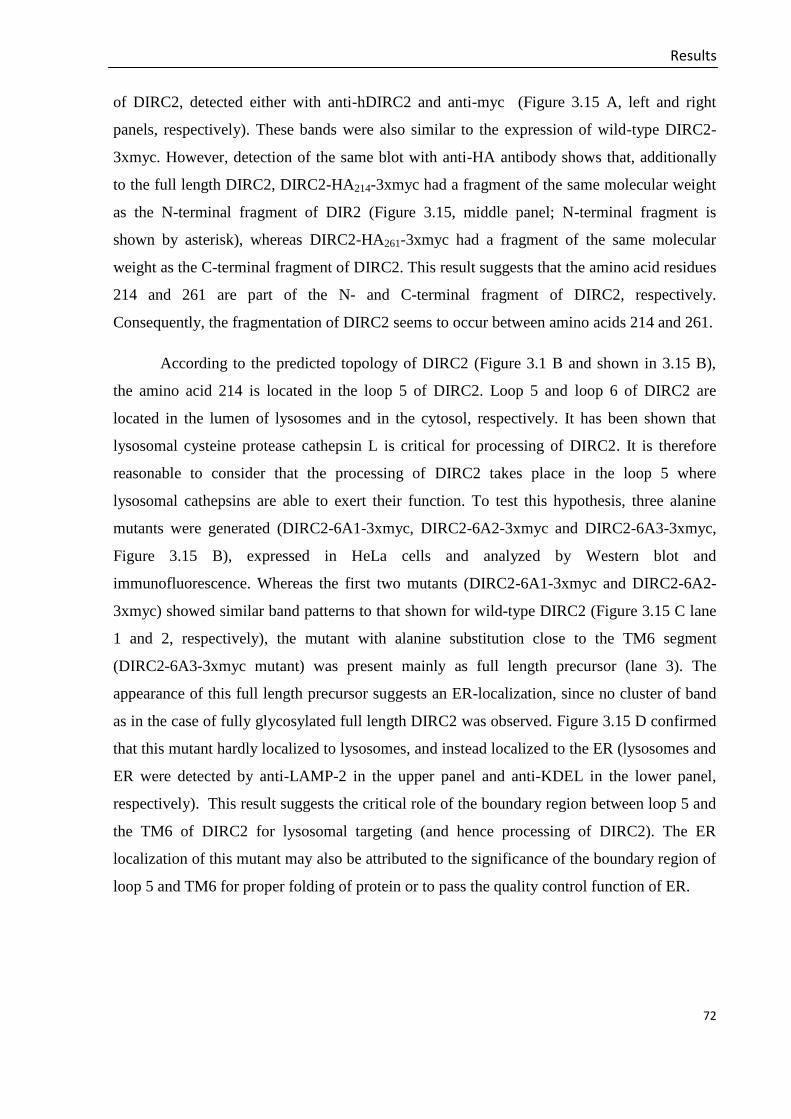
Results
72
of DIRC2, detected either with anti-hDIRC2 and anti-myc (Figure 3.15 A, left and right
panels, respectively). These bands were also similar to the expression of wild-type DIRC2-
3xmyc. However, detection of the same blot with anti-HA antibody shows that, additionally
to the full length DIRC2, DIRC2-HA214-3xmyc had a fragment of the same molecular weight
as the N-terminal fragment of DIR2 (Figure 3.15, middle panel; N-terminal fragment is
shown by asterisk), whereas DIRC2-HA261-3xmyc had a fragment of the same molecular
weight as the C-terminal fragment of DIRC2. This result suggests that the amino acid residues
214 and 261 are part of the N- and C-terminal fragment of DIRC2, respectively.
Consequently, the fragmentation of DIRC2 seems to occur between amino acids 214 and 261.
According to the predicted topology of DIRC2 (Figure 3.1 B and shown in 3.15 B),
the amino acid 214 is located in the loop 5 of DIRC2. Loop 5 and loop 6 of DIRC2 are
located in the lumen of lysosomes and in the cytosol, respectively. It has been shown that
lysosomal cysteine protease cathepsin L is critical for processing of DIRC2. It is therefore
reasonable to consider that the processing of DIRC2 takes place in the loop 5 where
lysosomal cathepsins are able to exert their function. To test this hypothesis, three alanine
mutants were generated (DIRC2-6A1-3xmyc, DIRC2-6A2-3xmyc and DIRC2-6A3-3xmyc,
Figure 3.15 B), expressed in HeLa cells and analyzed by Western blot and
immunofluorescence. Whereas the first two mutants (DIRC2-6A1-3xmyc and DIRC2-6A2-
3xmyc) showed similar band patterns to that shown for wild-type DIRC2 (Figure 3.15 C lane
1 and 2, respectively), the mutant with alanine substitution close to the TM6 segment
(DIRC2-6A3-3xmyc mutant) was present mainly as full length precursor (lane 3). The
appearance of this full length precursor suggests an ER-localization, since no cluster of band
as in the case of fully glycosylated full length DIRC2 was observed. Figure 3.15 D confirmed
that this mutant hardly localized to lysosomes, and instead localized to the ER (lysosomes and
ER were detected by anti-LAMP-2 in the upper panel and anti-KDEL in the lower panel,
respectively). This result suggests the critical role of the boundary region between loop 5 and
the TM6 of DIRC2 for lysosomal targeting (and hence processing of DIRC2). The ER
localization of this mutant may also be attributed to the significance of the boundary region of
loop 5 and TM6 for proper folding of protein or to pass the quality control function of ER.
Results
73
Figure 3.15 Expression of internal HA-tagged and alanine mutants of DIRC2.
(A) Two internally HA-tagged DIRC2 appended with 3xmyc constructs, DIRC2-HA214-3xmyc and DIRC2-
HA261-3xmyc were expressed in HeLa cells. Cells were harvested 24 hours after transfection and lysates
(20 µg protein) were subjected to SDS-PAGE separation and Western blot analysis. Blot was detected
with anti-hDIRC2, anti-HA, and anti-myc. Arrow head (middle figure) shows the N-terminal fragment
of DIRC2 whereas cluster of bands in the left figure show N-terminal half of DIRC2 detected by anti-
hDIRC2. Asterisks show unspecific bands.
(B) Amino acids in the loop 5 of DIRC2 were replaced by three short alanines sequences designated as
DIRC2-6A1-3xmyc, DIRC2-6A2-3xmyc and DIRC2-6A3-3xmyc.
(C) The three alanines mutants were transfected into HeLa cells. Cells were harvested 24 hours after
transfection. Lysates (20 µg protein) were subjected to SDS-PAGE and Western blot analysis. Blot was
detected with anti-myc antibody. The full length DIRC2 forms of DIRC2-6A1-3xmyc and DIRC2-6A2-
3xmyc appear as strong and difused bands at about 55 kDa (lane 1 and 2). The full length, ER-form of
DIRC2-6A3-3xmyc shown by a band at about 50 kDa was the predominant form over they processed
form.
(D) DIRC2-6A3-3xmyc mutant analyzed by immunofluorescence. In the majority of transfected cells,
DIRC2 localized to ER as shown by detection of KDEL (lower panel) and not localized to lysosomes as
shown by detection of LAMP-2 (upper panel). Bars represent 10 µm.
DIRC2-6A3-3xmyc
DIRC2-A3-3xmyc Mutants expressed in HeLa Cells
A Myc
D Myc
G Myc
B LAMP-2
H LAMP-2
E KDEL
C Merge
F Merge
I Merge
C D
A B
Results
74
3.11 Overexpression of GFP-tagged DIRC2 and formation of enlarged/clustered
lysosomes
3.11.1 Overexpression of DIRC2 in mammalian cells lead to the formation of enlarged and/or
clustered of acidic compartments
In an initial attempt to reveal a possible function of DIRC2, GFP-tagged constructs of
DIRC2 were overexpressed in different cell-lines and analyzed by immunofluorescence. It
was revealed that expression of C-terminally GFP-tagged DIRC2 (DIRC2-GFP, Figure 3.1)
led to formation of enlarged or clustered acidic organelles in Cos7, HeLa and HEK293 cells,
as detected by lysotracker (Figure 3.16, shown by arrow heads). Similar effect was also
revealed by N-terminally GFP-tagged DIRC2 (GFP-DIRC2). This result underlines that
enlargement or clustering of acidic organelles induced by overexpression of GFP-tagged
DIRC2 does not depend on the position of the GFP tag.
3.11.2 Effects of bafilomycin A1, vinblastine and Rab5 on the DIRC2-GFP driven
enlargement of acidic organelles
To investigate whether acidification of organelles is a prerequisite for the enlargement
or clustering of organelles, Cos7 cells transfected with DIRC2 were treated with 20 nM
bafilomycin A1, an inhibitor of vacuolar-type H+-ATPase (V-ATPase) (Droese and Altendorf
1997). V-ATPase is the proton pump protein responsible for the proton transport into
lysosomes and inhibition of V-ATPase prevents the acidification of lysosomes. It is shown in
Figure 3.1.3 (A-F) that the formation of large organelles or cluster of organelles is apparently
not affected by the administration of bafilomycin A1. Prolonged treatment with bafilomycin
A1 up to more than 24 hours or increased concentration of bafilomycin up to 200 M did not
change the enlarged vacuole formation (data not shown). This result suggests that lysosome
acidification is not required for the vacuolation or organelle clustering.

Results
75
Figure 3.2 Enlargement or clustering of acidic organelles upon overexpression ofGFP-tagged DIRC2 is independent of tag position
Figure to include: DIRC2-GFP (pEGFP.N1-DIRC2) and GFP-DIRC2 (pEGFP.C1-DIRC2) overexpression in Cos7 cells
B Lysotracker
E LAMP-2 F Merge
C MergeA GFP
D GFP
Figure 3.16 Overexpression of DIRC2-GFP.
Cos7, HeLa and HEK293 cells were transfected with DIRC2-GFP and fixed after 24 to 36 hours. Prior to
fixation, cells were incubated with lysotracker (in plain DMEM). Distribution of DIRC2-GFP and acidic
organelles as indicated by the accumulation of lysosomes was visualized by fluorescence microscopy. Figure A-
C, D-F and G-I show the overexpression of DIRC2-GFP in Cos7, HeLa and HEK293 cells, respectively. Arrow
heads show the clustered organelles. Transfected cells are marked with asterisks. Bars represent 10 m.
Figure 3.17 Large acidic organelle formations upon overexpression of GFP-DIRC2.
Cos7 cells were transfected with N-terminally GFP-tagged DIRC2 (GFP-DIRC2, Figure 3.1 C). Cells were fixed
two days after transfection. Acidic organelles were detected with lysotracker (B-C), and lysosomes were stained
with anti-LAMP-2 followed by a fluorophore conjugated secondary antibody (E-F). Bars represent 10 m.
A GFP B Lysotracker C Merge
D GFP E Lysotracker F Merge
G GFP H Lysotracker I Merge
* **
** *
* * *
HE
K2
93
H
eL
a
C
os7

Results
76
Figure 3.18 Effect of bafilomycin A1, vinblastine and Rab5 on the formation of large organelles.
Cos7 cells were transfected with DIRC2-GFP. Acidic organelles were detected with lysotracker in the absence of
bafilomysin A1 (A-C) or in the presence of 20 nM bafilomycin A (D-F). Bafilomycin was added 3 hours prior
to fixation. Depolymeration of tubulin is visualized by anti-tubulin antibody (K, L). G-I are untreated controls,
whereas J-L are cells treated with 50 µM vinblastine 3 hours prior to fixation. Effects of co-expression of
DIRC2-GFP with the wild-type Rab5 and dominant negative form of Rab5 (Rab5S34N) are shown in M-R. Both
wild-type Rab5 and Rab5S34N were detected by anti-Rab5 antibody followed by Alexa fluor 594 conjugated
secondary antibody. Bars represent 10 m.
R
ab
5
V
inb
lastin
e
BA
filo
ym
cin
A1
S3
4N
W
T
+
-
+
-
A GFP B Lysotracker C Merge
D GFP E Lysotracker F Merge
G GFP H Tubulin I Merge
J GFP K Tubulin L Merge
M GFP N Rab5 O Merge
P GFP Q Rab5 R Merge

Results
77
It has long been known that distribution or movement of lysosomes within a cell can
be interfered by drugs or chemicals acting on microtubule or cell skeleton. One of these drugs
is vinblastine, a chemotherapeutic agent used to treat numerous cancers, such as Hodgkin´s
disease and testicular germ-cell cancer (Jordan and Wilson 2004). It acts by binding tubulin,
thereby preventing the assembly of microtubules.
In order to check whether the administration of vinblastine has an effect to the
formation of enlarged or clustered organelles, DIRC2-GFP transfected Cos7 cells (Figure 3.1.
C) were incubated with 50 µM vinblastine 3 hours prior to fixation. It is shown in the Figure
3.18 that treatment of the cells with 50 µM vinblastine had no obvious effect on the
vacuolation, indicating that the vacuolation and organelle cluster formation does not depend
on the integrity of microtubules.
Kuronita et al (Kuronita et al 2002) have reported that co-expression of LIMP-2 with
the dominant negative form of small GTPase Rab5 can abolish the formation of large
endosome/lysosomes compartment induced by overexpression of LIMP-2. It was emphasized
that the GTP-bound form of Rab5 is important for the formation of large endosome/lysosome.
Therefore, it was tested whether co-expression of the dominant negative form of Rab5 can
also interfere with the formation of enlarged or clustered vacuoles induced by the
overexpression of DIRC2. Figure 3.18 P-R shows that co-expression of DIRC2-GFP with
Rab5S34N allowed the formation of cluster of organelles, similar to the result obtained by co-
expression of wild-type Rab5 (M-O), thus indicating that the formation of enlarged or
clustered of organelles is independent of Rab5.

Discussion
78
4. Discussion
4.1 DIRC2 is a novel lysosomal protein
From its first report (Bodmer et al 2002), DIRC2 has readily been predicted from its
sequence to be a member of the major facilitator superfamily. However, the cellular
localization of DIRC2 was not resolved. In a further work by Schroeder (Schroeder et al
2007), DIRC2 was identified as a putative member of lysosomal membrane proteins. By
using an indirect immunofluorescence and subcellular fractionation, it was demonstrated that
DIRC2 is a lysosomal/late endosomal protein. This protein was shown to colocalize with
lysosomal associated membrane protein type 2 (LAMP-2) and β-glucocerebrosidase (βGC),
as well as with a late endosomal lipid lysobiphosphatidic acid (LBPA) in immunofluorescence
analysis. In addition, DIRC2 was co-sedimenting with LAMP-2, βGC and cathepsin D in
subcellular fractionation experiments.
Like many other lysosomal membrane proteins, lysosomal targeting of DIRC2 was found
to rely on a well known dileucine motif [DE]XXXL[LI] at its N-terminus. Two putative
tyrosine-based lysosomal sorting motifs YXXØ are also identified at the C-terminus of
DIRC2, but they were shown to be irrelevant for lysosomal targeting of DIRC2 (Dr.
Schroeder, unpublished results). Most dileucine motifs of lysosomal proteins are located in
close proximity (around 6 to 11 residues) to a transmembrane domain (Bonifacino and Traub
2003). The short distance is thought to be important for the interaction between the dileucine
signals with adaptor proteins (APs) which later forms complexes with clathrin. However, the
dileucine motif in DIRC2 is 37 residues apart from the adjacent transmembrane segment. It is
conceivable that interaction of the dileucine motif of DIRC2 with an AP complex is facilitated
by a lipid modification. An example of this facilitation mechanism has been reported for
mucolipin-1 which undergoes palmitoylation that promotes its endocytosis. Lipid
modification exemplified here is thought to bring peptide sorting signals closer to the
membrane (Vergarajauregui and Puertollano 2006, Braulke and Bonifacino 2009). Indeed,
DIRC2 has a putative myristoylation modification site at Gly-2 which may help to activate the
dileucine signal. However, experimental evidence is required to validate this presumption.
In a preliminary study, overexpression of GFP-tagged constructs of DIRC2 in different
cell lines led to formation of enlarged and/or clustered lysosomes. These morphological
alterations were shown to be independent of lysosomal acidification, integrity of microtubules
or active form of Rab5. However, overexpression of DIRC2 with a triple myc tag showed no
enlargement and/or clustering of lysosomes. It is likely that the formation of enlarged and/or

Discussion
79
clustered lysosomes resulting from overexpression of GFP-DIRC2 constructs was mainly
caused by the appended GFP tags, although the mechanism is not clear.
4.2 DIRC2 is a glycoprotein
DIRC2 was demonstrated to be a glycoprotein with N-glycosylation of Asn-209. It was
also shown that DIRC2 acquires its core glycan moiety in the ER which is further processed
in a post ER compartment. It has been reported in an N-glycosylation scanning study that
arginine residues require a minimum distance of 12-14 residues to the membrane to be
efficiently used for glycosylation or, in the context of polytopic membrane proteins, the loop
segments must be longer than 30 residues in order to harbor N-glycans (Cheung and
Reithmeier 2007). According to the predicted topology, the N-glycosylation site of DIRC2
(Asn-209) is located in close proximity to the transmembrane segment in loop5 which is
predicted to consist of only 16 residues. This may imply that the algorithm used to predict the
protein topology may not precisely define the transmembrane and loop segments of DIRC2. It
could also imply that the short glycosylation site distance to the closest transmembrane
segment of DIRC2 is an exception from the general rule derived from the N-glycosylation
scanning study described above. In comparison, a newer protein structure prediction software,
I-TASSER (Zhang 2008; Roy et al 2010), would predict the N-glycosylation motif of DIRC2
to be located in the middle region of its putative loop5 (Figure 4.1). However, the overall
topology of DIRC2 described in this study is supported by the luminal residence of Asn-209
as well as cytosolic localization of the dileucine targeting motif at the N- terminus (Figure 3.1
B).
Figure 4.1 Secondary structure prediction of DIRC2 generated by I-TASSER program.
An alternative bioinformatics analysis of DIRC2 generated by I-TASSER program
(http://zhanglab.ccmb.med.umich.edu/, Zhang 2008, Roy et al 2010) shows that the putative N-
glycosylation site Asn-209 is located approximately in the middle of two hydrophobic stretches
corresponding to TM5 and TM6 of DIRC2. (Legends: C = coil, H = helix, S = scramble, Conf. Score =
confidence score range from 0 to 9).

Discussion
80
The unusual large carbohydrate moiety attached to Asn-209 of DIRC2 resembles that
observed in the GLUT8 protein, a membrane protein of twelve transmembrane spanning
domains. GLUT proteins are known to play a role in glucose/fructose transport across the
membrane. Unlike its related proteins such as GLUT1-4 which were reported to localize in
plasma membranes, GLUT8 was identified to localize in late endosomes/lysosomes. An
apparent molecular weight shift of more than 10 kDa was reported upon PNGase digestion of
GLUT8 which has only one N-linked glycosylation site in a loop between transmembrane 9
and 10 (Augustin et al 2005). By the use of brefeldin A1, it could be shown DIRC2 acquires
its core N-glycan in the ER and this glycan is further modified in a post-ER compartment.
4.3 DIRC2 is proteolytically processed
Lysosomes are known to be the degradation compartment of many macromolecules. This
function is carried out by hydrolases within the lumen of lysosomes. Lysosomes are also the
site for degradation of many plasma membrane proteins, including transporter proteins, after
endocytic internalization (Schulze et al 2009). In this study, DIRC2 was shown to be
proteolyzed in lysosomes. In the context described above, processing of DIRC2 in lysosomes
may theoretically be regarded as the beginning of total degradation of DIRC2 proteins after
serving their so far unknown function. However, since both overexpressed and endogenous
DIRC2 showed an enormous stability in lysosomes, it seems likely that the observed
processing of DIRC2 might represent a limited processing event rather than degradation.
Moreover, the data in this study also revealed that endogenous DIRC2 was almost exclusively
present in its proteolyzed form.
Many examples of proteolytic events have recently been reported for numerous membrane
proteins, including transporter proteins. Specific proteolytic cleavage of membrane proteins
may negatively or positively modulate their functions. Glycine transporter 2 (GlyT2) for
example, a member of of Na+/Cl
- -dependent plasma membrane transporters, which exhibits a
cytoplasmic N-terminus that is at least three times longer than that of other members of
neurotransmitter transporter family (Liu et al 1993), is cleaved by calpain proteases. The main
cleavage site of this transporter protein is located in the N-terminal segment, and the
remaining transmembrane fragment of the cleavage has a molecular weight of 70 kDa which
is similar to other members of this protein family. The truncated GlyT2 displays full transport
activity and it was suggested that the processing may contribute to the regulation of GlyT2
Discussion
81
trafficking and/or function in the neuronal plasma membrane (Baliova et al 2004). Toll-like
receptor 9 (TLR9), a pattern-recognition receptor localized in lysosomes/late endosomes, was
reported to acquire its function and trigger signaling cascades activity in truncated form,
although the full-length of TLR9 also exhibits significant activity. Cathepsin L and additional
lysosomal proteases were suggested to be involved in the processing of TLR9 (Park et al
2008).
The current understanding of MFS proteins is deduced from high resolution structural data
obtained for the lactose permease (LacY) (Abramson et al 2003) and the E. coli glycerol-3-
phosphate transporter (GlpT) (Huang et al 2003). Structural analysis of MFS proteins has
revealed that the 12 transmembrane domains of MFS proteins are clustered into two halves of
6 transmembrane-domains. The two clusters are pseudo-symmetric to each other with a pore
between the two halves which is essential for substrate binding (Law et al 2008). In the case
of LacY, it was demonstrated that the continuity of the polypeptide chain of the MFS protein
is not essential for its activity. The two clusters of LacY can be expressed separately as non-
overlapping fragments and they are capable of reconstituting its transport activity comparable
to the wild type protein (Weinglass and Kaback 2000). In addition, many studies have shown
that the substrate binding site and the catalytic site of MFS proteins are largely determined by
charged side chains of amino acid residues within transmembrane domains (reviewed by Law
et al 2008). This may explain the persistent activity of discontinous clusters of LacY. Among
MFS proteins, DIRC2 is the first protein reported to undergo proteolysis. While the function
of DIRC2 is currently unknown, the need for (or the consequence of) DIRC2 proteolysis
remains still illusive. Taken together, the enormous stability of proteolytic fragments of
DIRC2 in lysosomes and the fact that MFS protein, as exemplified by LacY protein, may
preserve it activity as discontinuous fragments, proteolytically processed DIRC2 may possess
transport activity.
4.4 Cathepsin L is involved in the processing of DIRC2
In order to answer the question where the proteolysis of DIRC2 takes place and which
protease(s) play(s) a role in the proteolysis of DIRC2, DIRC2 was overexpressed in HeLa
cells in the presence or absence of different types of inhibitors. It is demonstrated that
treatment of transfected HeLa cells with NH4Cl was able to prevent DIRC2 processing.
NH4Cl is known to interfere with lysosomal acidification (Misinzo et al 2008). This result,

Discussion
82
together with the data obtained from subcellular fractionation analysis, demonstrated that
processing of DIRC2 is likely to take place in lysosomes.
Inhibitory profiling of DIRC2 fragmentation with E-64, an inhibitor of cysteine
proteases, revealed that DIRC2 is likely to be processed by this class of proteases. The
possible involvement of cathepsin B and cathepsin L, two major lysosomal cysteine proteases,
was investigated by addition of CA-074-Me and Z-FY-CHO, respectively, to HeLa cells
transfected with DIRC2. It could be revealed that both cysteine protease inhibitors were able
to prevent proteolysis of DIRC2.
Historically, it has been commonly believed that lysosomal cathepsins may have
common substrates. However, more recent findings indicated non-redundant functions of
individual cathepsins (Roth et al 2000, Nagler and Menard 2003, Brix 2005). TRP-ML1, a
lysosomal monovalent cation channel was reported to undergo proteolytic cleavage which
was impaired by inhibition of cathepsin B (Kiselyov et al 2005). The pore-forming protein
perforin precursor was reported to be activated by proteolytic cleavage, in part, by cathepsin L
but not by cathepsin B (Konjar et al 2010). A further dissection of the role of cathepsin B and
cathepsin L in the processing of DIRC2 was carried out by overexpressing human DIRC2 in
cathepsin deficient MEFs. In contrast to the result described from the inhibitory profiling of
DIRC2 processing, expression of DIRC2 in cathepsin deficient MEFs showed that cathepsin
L, but not cathepsin B, is involved in the processing of DIRC2. This divergent observation is
most likely due to an overlapping specificity of cathepsin B inhibitor CA-074-Me (Ebert et al
2002, Montaser et al 2002).
The sensitivity of DIRC2 to Z-FY-CHO treatment and the fact the DIRC2 is not
proteolyzed in cathepsin L deficient MEF underlined the critical role of cathepsin L in the
processing of DIRC2. However, it was revealed that only small amounts of DIRC2 remain
unprocessed in livers of cathepsin L deficient mice. This result indicated that the role of
cathepsin L in the processing of DIRC2 in mice liver is compensated by unknown proteases
which are either absent or inactive in MEF cells. The fact that individual cathepsins contribute
to certain functions in a tissue and cell type specific manner is highlighted by the proteolysis
of invariant chain (li) which plays a role in the targeting of MHCII complexes in the thymus
and antigen-presenting cells. In cathepsin L deficient mice, the role of cathepsin L in the
processing of li in peripheral antigen-presenting cells such as dendritic cells, B-lymphocytes
and macrophages is compensated by cathepsin S and cathepsin F which results in no
Discussion
83
impairment of li processing in these cell types in cathepsin L deficient mice (Reinheckel et al
2001).
4.5 Cleavage site of DIRC2
To address the question where exactly DIRC2 is cleaved, several mutants of DIRC2
were generated and expressed in HeLa cells. The fragmentation pattern of overexpressed wild
type DIRC2 and the N209A mutant as well as the pattern of DIRC2 after PNGase F digestion
indicated that DIRC2 is cleaved asymmetrically. Insertion of HA tags adjacent to residue 214
and residue 261 within loop5 and loop6, respectively, more specifically showed that
fragmentation of DIRC2 takes place between these two residues. Inhibitory profiling of the
proteases involved in the processing of DIRC2 showed the important role of cathepsin L, a
cysteine protease localized within the lumen of lysosomes.
Together, the above described results narrowed down the likely cleavage site of
DIRC2 within its loop5. According to the predicted DIRC2 topology, loop5 is limited by
residues 210 to 229 connecting TM5 and TM6. As it would be expected for a cysteine
protease, cathepsin L may cleave diverse peptide sequences. Nevertheless, a number of
studies involving positional scanning synthetic combinatorial libraries (PS-SCL) of protease
substrates have analyzed the preference cleavage sites of cathepsin L (examples are given in
Table 4.1).
One possible cleavage site within the loop5 by cathepsin L is the peptide bond
between two alanine residues (-A216-A217-). Two leucine residues at the P2 and P3 positions
are among the preferred target sites of cathepsin L (Choe et al 2006). However, mutation of
amino acid at these positions with alanines in A1 mutant (A1: 211-TSPLLAAESS-220 → 211-
TAAAAAAESS-220; Figure 4.2) did not alter the processing of DIRC2. Oligopeptide sequence
with an Arg at position P1` was reported to be a potential cleavage site for cathepsin L (Table
4.1; Melo et al 2001). Mutation of Arg-221 along with 3 amino acids at N-terminal of Arg-
221 in the A2 mutant (A2: 216-AAESSRAH-223 → 216-AAAAAAAAH-223; Figure 4.2) did also
not prevent proteolysis of DIRC2. Both mutants are shown to be localized in lysosomes and
processed by cathepsin L.
Interestingly, substitution of a short luminal sequence directly bordering loop5 and
TM6 with oligo-alanines resulted in a DIRC2 mutant (A3: 224-IKDRIEA-230 → 224-

Discussion
84
AAAAAAA-230; Figure 4.2) which is partially localized in ER and lysosomes. Oligopeptide
sequence with Lys and Arg in the position P3 and P1, respectively, are preferable for
cathepsin L cleavage. However, Asp and Glu at position P2 and P1´ are not favorable for
cathepsin L digestion (Puzer et al 2004, Choe et al 2006). The fraction which reaches
lysosomes is still processed in this compartment. In contrast, the fraction which is retained in
the ER is not processed. An ER localization was also observed for the DIRC2 mutant where
its TM6 sequence was replaced with a comparable TM6 sequence from an unrelated
lysosomal MFS member CLN7 (data not shown). These results nevertheless underlined the
critical role of amino acid residues bordering the TM6 for lysosomal localization or correct
folding and membrane insertion of DIRC2.
Table 4.1 Combinatorial substrate analyses of cathepsin L.
Cleavage sequence preferences of human cathepsin L generated by positional scanning synthetic combinatorial
libraries (PS-SCL) studies (adapted from http://merops.sanger.ac.uk/). Positions of amino acid residues are
indicated by P4 to P1 and P1´to P4´ for amino acid residues at the N- and C-terminal from scissile sites and
cleavages are taken place between P1 and P1´.
Specificity from combinatorial peptides
Optimal
substrate Note/reference
P4 P3 P2 P1 P1´ P2´ P3´ P4`
- - - - R/A/K - - - XXXX/RXXX Melo et al 2001
- K/R F R H/S S/H - - XKFR/HSXX Puzer et al 2004
H/broad K/R/M/L F/W/Y R/K - - - - HKFR/XXXX Choe et al 2006
Figure 4.2 Sequence of loop5 of DIRC2 and
alanine scanning mutants.
The sequence of loop5 of DIRC2 with
predicted cleavages sites. Three alanine
scanning mutation (A1, A2 and A3) used to
analyse the cleavage site of DIRC2 are
depicted.

Discussion
85
4.6 Putative function of DIRC2
Upon downregulation of DIRC2 with siRNAs in HeLa cells, no alterations in
lysosomal enzyme activities or expression of lysosomal proteins was observed (Figure 3.8)
was observed. In a collaborative work with Prof. Bruno Gasnier (CNRS Paris), it was
suggested that DIRC2 may function as an electrogenic metabolite transporter. The
experimental set-up led to this conclusion is described as follows: the dileucine mutant of
DIRC2 was expressed in Xenopus oocytes which allows a plasma membrane expression of the
full length form of DIRC2. Electrophysiological transport activity was detected by two-
electrode voltage clamp applied on the oocytes in an acidic medium (pH 5.0) which was
supplemented with a metabolic mixture (Bacto Yeast Extract, BYE). Application of this
metabolic mixture induced a significant outward current. Since the extracellular medium is
topologically equivalent to the lysosomal lumen in a whole cell set up, DIRC2 might facilitate
transport of anions from lysosomes or exchange cations from the cytosol into lysosomes
(Figure 4.3).
Figure 4.3 Putative role of DIRC2 as an electrogenic metabolite transporter.
A possible transport function of DIRC2, as described in the text, was analyzed by expression of a dileucine
mutant of DIRC at the plasma membrane of Xenopus oocytes. An equivalent situation in a whole cell where
DIRC2 localizes to lysosomes is described in this figure. A three dimensional model of DIRC2, generated with I-
TASSER program, shows both N- and C-termini in the cytosolic environment and N-glycosylation site at the
loop5 of DIRC2 within the lumen of lysosome. Cleavage site of DIRC2 by cathepsin L is presumably C-terminal
from the glycosylation site. Outward current evoked by metabolites in the experiment with X. oocytes suggested
an inward current from lysosomes. This may indicate that the substrates within the lysosomes are anions which
counterbalance cations transport from the cytosol.
Discussion
86
The model described above with a current toward lysosomes or anions are being
transported out of lysosomes is somehow surprising since lysosomal transporters are
generally coupled with a proton efflux from lysosomes and counterbalanced with an outward
current. Nevertheless, the possibility that anions efflux from lysosomes accounting for DIRC2
activity is also supported by the fact that a high concentration of chloride ions was observed
within lysosomes, as recently reported by Weinert and co-workers (Weinert et al 2010). It is
also plausible that the DIRC2 operates as a symporter where the outward current from
lysosomes is coupled with the efflux of catabolic products from lysosomes.
4.7 Outlook
It was shown in this study that DIRC2 is a lysosomal membrane protein. It is subject
to proteolytic processing within the lysosomes which leads to fragmentation of DIRC2 into
two asymmetric fragments. The cleavage site of DIRC2 is not yet clear. Scanning of amino
acids in the loop5 which are adjacent to TM6 may reveal the exact cleavage site of DIRC2.
Alternatively, the C-terminal fragment from overexpressed DIRC2-3xmyc can be purified by
immunoaffinity chromatography and its N-terminal end representing the cleavage site by
cathepsin L can be determined by Edman degradation of the amino terminus.
Cathepsin L was shown to play a role in the processing of DIRC2. However, it is not
clear whether cathepsin L directly cleaves DIRC2 or indirectly cleaves DIRC2 through
activation of another protease(s). In vitro cleavage assay of DIRC2 with a recombinant
cathepsin L was not successful (data not shown). Optimization of such an in vitro cleavage
assay may be necessary by modifying both DIRC2 preparation and/or cleavage conditions.
Upon successful in vitro cleavage assay, the DIRC2 fragments can be analyzed by MALDI-
TOF to determine the exact mass of each fragments from which the cleavage site of DIRC2
can be deduced.
Bioinformatic analysis of DIRC2 as well as results shown for the biochemical
characterization of DIRC2 are in agreement that DIRC2 is a member of MFS proteins
residing in the lysosomal membrane. However what function it plays in lysosomes is not
clear. As current, there is no knock out mouse available to analyze the functional relevance of
DIRC2 in vivo. Hence, preparation and analysis of such a DIRC2 knock out mouse is a
promising strategy to identify the physiological role of DIRC2.
Discussion
87
In an initial characterization of DIRC2 function by expression of a dileucine mutant of
DIRC2 at the plasma membrane of Xenopus oocytes and testing its ability to take up
metabolites, it was found that DIRC2 may act as an electrogenic transporter. It showed an
outward current which counteracts influx of metabolites from the acidic, rich extracellular
medium. This process is equivalent to efflux of catabolites from lysosomes and inward
current into the lysosomes. By using the same approach, selective uptake of metabolites from
the medium by DIRC2 expressed on the surface of Xenopus oocytes could be the method of
choice to unravel the substrate of DIRC2.
Upon identification of the substrate of full length form of DIRC2, it is of interest to
analyze the influence of proteolytic processing on the function of DIRC2. A possible
interaction between the DIRC2 fragments and the relevance its function could also provide
valuable information in order to have a more comprehensive description of this transporter
protein.

Bibliography
88
Bibliography:
Abramson, J. Smirnova, I., Kasho, V., Verner, G., Kaback, H.R., and Iwata, S. (2003)
Structure and mechanism of the lactose permease of Escherichia coli. Science 301, 610-615.
Aoyagi, T., Takeuchi, T., Matsuzaki, A., Kawamura, K. and Kondo, S. (1969) Leupeptins,
new protease inhibitors from Actinomycetes. Journal of Antibiotics 22, 283-286.
Augustin, R., Riley, J. and Moley, K.H. (2005) GLUT8 contains a [DE]XXXL[LI] sorting
motif and localizes to a late endosomal/lysosomal compartment. Traffic 6, 1196-1212.
Bagshaw, R.D., Mahuran,D.J. and Callahan, J.W. (2005) A proteomic analysis of lysosomal
integral membrane proteins reveals the diverse composition of the organelle. Mol. Cell.
Proteomics, 4, 133-143.
Baliova, M., Betz, H. and Jursky, F. (2004) Calpain-mediated proteolytic cleavage of the
neuronal glycine transporter, GlyT2. Journal of Neurochemistry 88, 227-232.
Bang, B., Baadsgaard, O., Skov, L., and Jaattela, M. (2004) Inhibitors of cysteine cathepsin
and calpain do not prevent ultraviolet-B-induced apoptosis in human keratinocytes and HeLa
cells. Arch. Dermatol. Res. 296, 67-73.
Barrett, A.J., Kembhavi, A.A., Brown, M.A., Kirschke, H., Knight, C.G., Tamai, M., and
Hanada, K. (1982) L-trans-Epoxysuccinyl-leucylamido(4-guanidino)butane (E-64) and its
analogues as inhibitors of cysteine proteinases including cathepsins B, H and L. Biochem. J.
201, 189-198.
Barrett, A.J., Rawlings, N.D. and Woessner, J.F. Jr. (eds). (1998) Handbook of Proteolytic
Enzymes. Academic Press, London, UK.
Bodmer, D., Eleveld, M., Kater-Baats, E., Janssen, I., Janssen, B., Weterman, M.,
Schoenmakers, E., Nickerson, M., Linehan, M., Zbar, B., and van Kessel, A.G. (2002)
Disruption of a novel MFS transporter gene, DIRC2, by a familial renal cell carcinoma-
associated t(2;3)(q35;q21). Hum .Mol. Gen. 11,641-649.
Bonifacino J.S. and Traub, L.M. (2003) Signals for sorting of transmembrane proteins to
endosomes and lysosomes. Annu. Rev. Biochem. 72, 395-447.
Braulke, T. and Bonifacino, J.S. (2009) Sorting of lysosomal proteins. Biochim. Biophys. Acta
1793, 605-614.
Braulke, T., Gartung, C., Hasilik, A., von Figura, K. (1987) Is movement of mannose 6-
phosphate-specific receptor triggered by binding of lysosomal enzymes? J. Cell Biol. 104,
1735–1742.
Breuer, P., Körner, C., Böker, C., Herzog, A., Pohlmann, R., Braulke, T. (1997) Serine
phosphorylation site of the 46-kDa mannose 6-phosphate receptor is required for transport to

Bibliography
89
the plasma membrane in Madin-Darby canine kidney and mouse fibroblast cells. Mol. Biol.
Cell 8, 567–576.
Brix, K. (2005) Lysosomal protease: revival of the sleeping beauty. Eurekah Bioscience 1,
259-264.
Brooks, N.L., Corey, M.J., and Schwalbe, R.S. (2006) Characterization of N-glycosylation
consensus sequences in the Kv3.1 channel. FEBS Journal 273, 3287-3300.
Cheung, J.C. and Reithmeier, R.A.F. (2007) Scanning N-glycosylation mutagenesis of
membrane proteins. Methods 41, 451-459.
Chiechanover, A. (2005) Proteolysis: from the lysosome to ubiquitin and the proteasome. Nat.
Rev. Mol. Cell Biol. 6, 79-86.
Choe, Y., Leonetti, F., Greenbaum, D.C., Lecaille, F., Bogyo, M., Broemme, D., Ellman, J.A.,
and Craik, C.S. (2006) Substrate profiling of cysteine proteases using a combinatorial peptide
library identifies functionally unique specificities. J. Biol. Chem. 281,12824-12832.
Cuervo, A. M. and Dice, J. F. (1998) Lysosomes, a meeting point of proteins, chaperones, and
proteases. J. Mol. Med. 76, 6-12.
Dahl, S.W., Halkier, T., Lauritzen, C., Dolenc, I., Pedersen, J., Turk, V., and Turk, B. (2001)
Human recombinant pro-dipeptidyl peptidase I (cathepsin C) can be activated by cathepsins L
and S but not by autocatalytic processing. Biochemistry 40, 1671-1678.
Damme, M., Morelle, W., Schmidt, B., Andersson, C., Fogh, J., Michalski, J-C. and Luebke,
T. (2010) Impaired lysosomal trimming of N-linked oligosaccharides leads to
hyperglycosylation of native lysosomal proteins in mice with -mannosidosis. Mol. Cell.
Biol. 30, 273-283.
de Duve, C. (1959) in Subcellular Particles (Hayashi, T., ed) The Ronald Press Co., New
York, 128-159.
de Duve, C., Pressman, B.C., Gianetto, R., Wattiaux, R., and Appelmans, F. (1955) Tissue
fractionation studies. 6. Intracellular distribution patterns of enzymes in rat-liver tissue.
Biochem. J. 60, 604–617.
De Strooper, B., Annaert, W., Cupers, P., Saftig, P., Craessaerts, K., Mumm, J.S., Schroeter,
E.H., Schrijvers, V., Wolfe, M.S., Rayk, W.J., Goatek, A., and Kopan, R. (1999) A
presenilin-1-dependent γ-secretase-like protease mediates release of Notch intracellular
domain. Nature 398, 518-522.
Dennemärker, J., Lohmüller, T., Müller, S., Aguilar, S.V., Tobin, D.J., Peters, C., and
Reinheckel, T. (2010) Impaired turnover of autophagolysosomes in cathepsin L deficiency.
Biol. Chem. 391, 913-22.

Bibliography
90
Deussing, J., Roth,W., Saftig, P., Peters, C., Ploegh, H.L., and Villadangos, J.A. (1998)
Cathepsins B and D are dispensable for major histocompatibility complex class II-mediated
antigen presentation. Proc. Natl. Acad. Sci. USA. 95, 4516-4521.
Dittmer, F., Ulbrich, E.J., Hafner, A., Schmahl, W., Meister, T., Pohlmann, R., and von
Figura, K. (1999) Alternative mechanisms for trafficking of lysosomal enzymes in mannose
6-phosphate receptor-deficient mice are cell type-specific. J. Cell Sci.112, 1591-1597.
Drose, S. and Altendorf, K. (1997) Bafilomycins and concanamycins as inhibitors of V-
ATPase and P-ATPase. J. Exp. Biol. 200, 1-8.
Ebert, D. H., Deussing, J., Peters, C., Dermody, T. S. (2002) Cathepsin L and Cathepsin B
mediate reovirus disassembly in murine fibroblast cells. J. Biol. Chem. 277, 24609-24617.
Eskelinen, E-L., Tanaka, Y. and Saftig, P. (2003) At the acidic edge: Emerging functions for
lysosomal membrane proteins. Trends Cell Biol. 13, 137-145.
Felbor, U., Kessler, B., Mothes, W., Goebel, H.H., Ploegh, H.L., Bronson, R.T., and Olsen,
B.R. (2002) Neuronal loss and brain atrophy in mice lacking cathepsins B and L. Proc. Natl.
Acad. Sci. USA 99, 7883-7888.
Foghsgaard, L., Wissing, D., Mauch, D., Lademann, U., Bastholm, L., Boes, M., Elling, F.,
Leist, M., and Jäättelä, M. (2001) Cathepsin B acts as a dominant execution protease in tumor
cell apoptosis induced by tumor necrosis factor. J. Cell Biol. 153, 999-1010.
Gahl, W. A., Bashan, N., Tietze, F., Bernardini, I., and Schulman, J. D. (1982) Cystine
transport is defective in isolated leukocyte lysosomes from patients with cystinosis. Science
217, 1263-1265.
Gahl, W.A. and Tietze, F. (1985) pH effects on cystine transport in lysosome-rich leucocyte
granular fractions. Biochem. J. 228, 263-267.
Galbiati, F., Volonte., Minetti, C., Bregman, D.B. and Lisanti, M.P. (2000) Limb-girdle
muscular dystrophy (LGMD-1C) mutants of caveolin-3 undergo ubiquitination and
proteasomal degradation. Treatment with proteasomal inhibitors blocks the dominant negative
effect of Lgmd-1c mutants and rescues wild-type caveolin-3. J. Biol. Chem. 275, 37702-
37711.
Gelfman, C. M., Vogel, P., Issa, T.M., Turner, C.A., Lee, W-S., Kornfeld, S., and Rice,
D.S. (2007) Mice lacking α/β subunits of GlcNAc-1-phosphotransferase exhibit growth
retardation, retinal degeneration, and secretory cell lesions. Invest. Ophthalmol. Vis. Sci. 48,
5221–5228.
Ghosh, P., Dahms, N.M. and Kornfeld, S. (2003) Mannose 6-phosphate receptors: new twists
in the tale. Nat. Rev. Mol. Cell Biol. 4, 202-212.
Bibliography
91
Goulet, B., Baruch, A., Moon, N-S., Poirier, M., Sansregret, L-L., Erickson, A., Bogyo, M.,
and Nepveu, A. (2004) A cathepsin L isoform that is devoid of a signal peptide localizes to
the nucleus in S phase and processes the CDP/Cus transcription factor. Mol. Cell 14, 207-219.
Guicciardi, M.E., Miyoshi, H., Bronk, S.F., and Gores, G.J. (2001) Cathepsin B Knockout
Mice Are Resistant to Tumor Necrosis Factor-α-Mediated Hepatocyte Apoptosis and Liver
Injury: Implications for Therapeutic Applications. Am. J. Pathol. 159, 2045-2054.
Gupta, R., Jung, E., and Brunak, S. (2004) Prediction of N-glycosylation sites in human
protein, in preparation.
Halangk, W., Lerch, M.M., Brandt-Nedelev, B., Roth, W., Ruthenbuerger, M., Reinheckel,
T., Domschke, W., Lippert, H., Peters, C., and Deussing, J. (2000) Role of cathepsin B in
intracellular trypsinogen activation and the onset of acute pancreatitis. J. Clin. Invest. 106,
773-781.
Hirai, T. and Subramaniam, S. (2004) Structure and transport mechanism of the bacterial
oxalate transporter OxlT. Biophys. J. 87, 3600-7.
Hrebicek, M., Mrazova, L., Seyrantepe, V., Durand, S., Roslin, N.M., Noskova, L.,
Hartmannova, H., Ivanek, R., Cizkova, A., Poupetova, H., Sikora, J., Urinovska, J.,
Stranecky, V., Zeman, J., Lepage, P., Roquis, D., Verner, A., Ausseil, J., Beesley, C.E.,
Maire, I., Poorthuis, B.J., van de Kamp, J., van Diggelen, O.P., Wevers, R.A., Hudson, T.J.,
Fujiwara, T.M., Majewski, J., Morgan, K., Kmoch, S., Pshezhetsky, A.V. (2006) Mutations
in TMEM7 cause mucopolysaccharidosis IIIC (Sanfilippo C syndrome). Am. J. Hum. Genet.
79, 807-819.
Huang, Y., Lemieux, M.J., Song, J., Auer, M., and Wang, D.N. (2003) Structure and
mechanism of the glycerol-3-phosphate transporter from Escherichia coli. Science 301, 616-
620.
Janvier, K. and Bonifacino, J. S. (2005) Role of the endocytic machinery in the sorting of
lysosome-associated membrane proteins. Mol. Biol. Cell 16, 4231-4242.
Jonas, A. J., Greene, A. A., Smith, M. L., and Schneider, J. A. (1982) Cystine accumulation
and loss in normal, heterozygous, and cystinotic fibroblasts. Proc. Natl. Acad. Sci. U.S.A. 79,
4442-4445.
Jordan, A.M and Wilson, L. (2004) Microtubules as a target for Anticancer drugs. Nat. Rev.
Cancer 4, 253-265.
Journet, A., Chapel, A., Kieffer, S., Roux, F., and Garin, J. (2002) Proteomic analysis of
human lysosomes: Application to monocytic and breast cancer cells. Proteomics 2, 1026-
1040.
Kaback, H.R., Sahin-Tóth, M., and Weinglass, A.B. (2001) The kamikaze approach to
membrane transport. Nat. Rev. Mol. Cell Biol. 2, 610–620.

Bibliography
92
Kalatzis, V., Cherqui, S., Antignac, C., and Gasnier, B. (2001) Cystinosin, the protein
defective in cystinosis, is a H(+)-driven lysosomal cystine transporter. EMBO J. 20, 5940-
5949.
Katunuma, N. and Kominami, E. (1995) Structure, properties, mechanisms, and assays of
cysteine protease inhibitors: Cystatins and E-64 derivatives. Methods Enzymol. 251, 382-397.
Keel, S.B., Doty, R.T., Yang, Z., Quigley, J.G., Chen, J., Knoblaugh, S., Kingsley, P.D., De
Domenico, I., Vaughn, M.B., Kaplan, J., Palis, J., and Abkowitz, J.L. (2008) A heme export
protein is required for red blood cell differentiation and iron homeostasis. Science 319, 825-
828.
Kiselyov, K., Chen, J., Rbaibi, Y., Oberdick, D., Tjon-Kon-Sang, S., Shcheynikov, N.,
Muallem, S., and Soyombo, A. (2005) TRP-ML1 is a lysosomal monovalent cation channel
that undergoes proteolytic cleavage. J. Biol. Chem. 280, 43218-43223.
Klemencic, I., Carmona, A. K., Cezari, M. H., Juliano, M. A., Juliano, L., Guncar, G., Turk,
D., Krizaj, I., Turk, V., and Turk, B. (2000) Biochemical characterization of human cathepsin
X revealed that the enzyme is an exopeptidase, acting as carboxymonopeptidase or
carboxydipeptidase. Eur. J. Biochem. 267, 5404-5412.
Kollmann, K., Mutenda, K.E., Balleininger, M., Eckermann, E., von Figura, K., Schmidt, B.,
and Lübke, T. (2005) Identification of novel lysosomal matrix proteins by proteome analysis.
Proteomics 5, 3966-3978.
Konjar, S., Sutton V.R., Hoves, S., Repnik, U., Yagita, H., Reinheckel, T., Peters, C., Turk,
V., Turk, B., Trapani, J.A. and Kopitar-Jerala, N. (2010) Human and mouse perforin are
processed in part through cleavage by the lysosomal cysteine proteinase cathepsin L.
Immunology 131, 257-67.
Kornfeld, S. and Mellman, I. (1989) The biogenesis of lysosomes. Annu. Rev. Cell Biol. 5,
483-525.
Kornfeld, S. and Sly, W.S. (2001) I-cell disease and pseudo-Hurler polydystrophy: disorders
of lysosomal enzyme phosphorylation and localization, in: C.R. Scriver, A.L.Beaudet,W.S.
Sly, D. Valle (Eds.), The Metabolic and Molecular Bases of Inherited Disease, McGraw-Hill,
New York, 3421–3452
Krogh, A., Larsson, B., von Heijne, G., and Sonnhammer, E.L.L. (2001) Predicting
transmembrane protein topology with a Hidden Markov model: application to complete
genomes. J.Mol. Biol. 305, 567-580.
Kuronita, T., Eskelinen, E-L., Fujita, H., Saftig, P., Himeno, M. and Tanaka, Y. (2002) A role
for the lysosomal membrane protein LGP85 in the biogenesis and maintenance of endosomal
and lysosomal morphology. J. Cell Sci. 115, 4117-4131.
Law, C.J., Maloney, P.C., and Wang, D.N. (2008) Ins and outs of major facilitator
superfamily antiporters. Annu. Rev. Microbial. 62, 289-305.
Bibliography
93
Lefrancois, S., Zeng, J., Hassan, A., Canuel, M, Morales, C. (2003) The lysosomal trafficking
of sphingolipid activator proteins (SAPs) is mediated by sortilin. EMBO J. 22, 6430–6437.
Letourneur, F. and Klausner, R.D. (1992) A novel di-leucine motif and a tyrosine-based motif
independently mediate lysosomal targeting and endocytosis of CD3 chains. Cell 69, 1143-
1157.
Lin, C.W., Sasaki, M.m Orcutt, M.L., Miyayama, H. and Singer, R.M., (1976) Plasma
membrane localization of alkaline phosphatase in HeLa cells. J. Histochem. Cytochem. 24,
659-667.
Liu, Q.-R., Lopez-Corcuera, B., Mandiyan, S., Nelson, H., and Nelson, N. (1993) Cloning and
expression of a spinal cord- and brain-specific glycine transporter with novel structural
features. J. Biol. Chem. 268, 22802-22808.
Lübke, T., Lobel, P. and Sleat, D.E. (2009) Proteomics of the lysosome. Biochim. Biophys.
Acta 1793, 625-635.
Maiden, M.C.J., Davis, E.O., Baldwin, S.A., Moore, D.C.M., and Henderson, P.J.F. (1987)
Mammalian and bacterial sugar-transport proteins are homologous. Nature 325, 641-43.
Medzihradszky, K.F. (2008) Post-translational modification of proteins: tools for functional
proteomics, Book Title in Series: Methods in Molecular Biology, Springer, 446; 293-316.
Mellman, I., Fuchs, R. and Helenius, A. (1986) Acidification of the endocytic and exocytic
Pathways. Ann. Rev. Biochem. 55, 663-700.
Melo, R.L., Alves, L.C., Del Nery, E., Juliano, L., and Juliano, M.A. (2001) Synthesis and
hydrolysis by cysteine and serine proteases of short internally quenched fluorogenic peptides.
Anal. Biochem. 293, 71-77.
Misinzo, G., Delputte, P.L. and Nauwynck, H.J. (2008) Inhibition of endosome-lysosome
system acidification enhances porcine circovirus 2 infection of porcine epithelial cells.
Journal of Virology 82, 1128-1135.
Misumi, A., Misumi, Y., Miki, K., Takasugi, A., Tamura, G., and Ikehara, Y. (1986) Novel
blockade by brefeldin A of intracellular transport of secretory protein in cultured rat
hepatocytes. J. Biol. Chem. 261, 11398-11403.
Montaser, M., Lalmanach, G. and Mach, L. (2002) CA-074, but not its methyl ester CA-
074Me, is a selective inhibitor of cathepsin B within living cells. Biol. Chem. 383, 1305-1308.
Morin, P., Sagné, C. and Gasnier, B. (2004) Functional characterization of wild-type and
mutant human sialin. EMBO J. 23, 4560-4570.
Musil, D., Zucic, D., Turk, D., Engh, R.A., Mayr, I., Huber, R., Popovic, T., Turk, V.,
Towatari, T., and Katunuma, N. (1991) The refined 2.15 A X-ray crystal structure of human
liver cathepsin B: the structural basis for its specificity. EMBO J. 10, 2321-2330.

Bibliography
94
Nagler, D.K. and Menard, R. (2003) Family C1 cysteine proteases: Biological diversity of
redundancy? Biol. Chem. 384, 837-843.
Nägler, D., Tam, W., Storer, A.C., Krupa, J.C., Mort, J.S., and Menard, R. (1999) Human
cathepsin X: a cysteine protease with unique carboxypeptidase activity. Biochemistry 38,
4868-4874.
Nakagawa, T., Roth, W., Wong, P., Nelson, A., Farr, A., Deussing, J., Villadangos, J.A.,
Ploegh, H., Peters, C., and Rudensky, A.Y. (1998) Cathepsin L: critical role in Ii degradation
and CD4 T cell selection in the thymus. Science 280, 450-453.
Ni, X. and Morales, C. (2006) The lysosomal trafficking of acid sphingomyelinase is
mediated by sortilin and mannose 6-phosphate receptor. Traffic 7, 889–902.
Pao, S.S., Paulsen, I.T. and Saier, M.H. (1998) Major facilitator superfamily. Microbiol. Mol.
Biol. Rev. 62,1-34.
Park, B., Brinkmann, M.M., Spooner, E., Lee, C.C., Kim, Y. and Ploegh, H.L. (2008)
Proteolytic cleavage in an endolysosomal compartment is required for activation of Toll-like
receptor 9. Nat. Immun. 9, 1407-1414.
Peters, C., Braun, M., Weber, B., Wendland, M., Schmidt, B., Pohlmann, R., Waheed, A., and
von Figura, K. (1990) Targeting of a lysosomal membrane protein: a tyrosine-containing
endocytosis signal in the cytoplasmic tail of lysosomal acid phosphatase is necessary and
sufficient for targeting to lysosomes. EMBO J. 9, 3497-3506.
Pisoni, R.L. and Thoene, J.G. (1991) The transport systems of mammalian lysosomes.
Biochim. Biophys. Acta 1071, 351-373.
Puzer, L., Cotrin, S.S., Alves, M.F.M., Egborge, T., Araujo, M.S., Juliano, A.A., Juliano, L.,
Broemme, D., and Carmona, A.K. (2004) Comparative substrate specificity analysis of
recombinant human cathepsin V and cathepsin L. Arch. Biochem. Biophys. 430, 274-283.
Reczek, D., Schwake, M., Schröder, J., Hughes, H., Blanz, J., Jin, X., Brondyk, W., van
Patten, S., Edmunds, T., Saftig, P. (2007) LIMP-2 is a receptor for lysosomal mannose-6-
phosphate-independent targeting of beta-glucocerebrosidase. Cell 131, 770–783.
Reinheckel, T., Deussing, J., Roth, W., and Peters, C. (2001) Towards specific functions of
lysosomal cysteine peptidases: phenotypes of mice deficient for cathepsin B or cathepsin L.
Biol. Chem. 382, 735-741.
Reiser, J., Adair, B. and Reinheckel, T., (2010) Specialized roles for cysteine cathepsins in
health and disease. J. Clin. Invest. 120, 3421-3431.
Rickles, R.J., Botfield, M.C., Weng, Z., Taylor, J.A., Green, O.M., Brugge, J.S., and
Zoller,M.J. (1994) Identification of Src, Fyn, Lyn and Abl SH3 domain ligands using phage
display libraries. EMBO J., 13, 5598-5604.
Bibliography
95
Roth, W., Deussing, J., Botchkarev, V.A., Pauly-Evers, M., Saftig, P., Hafner, A., Schmidt,
P., Schmahl, W., Scherer, J., Anton-Lamprecht, I., von Figura, K., Paus, R. and Peters, C.
(2000) Cathepsin L deficiency as molecular defect of furless: hyperproliferation of
keratinocytes and pertubation of hair follicle cycling. FASEB J. 14, 2075-2086.
Roy, A., Kucukural, A. and Zhang, Y. (2010) I-TASSER: a unified platform for automated
protein structure and function prediction. Nature Protocols 5, 725-738.
Ruivo, R., Anne, C., Sagné, C., Gasnier, B. (2009) Molecular and cellular basis of lysosomal
transmembrane protein dysfunction. Biochim. Biophys. Acta 1793, 636-649.
Saftig, P., Hetman, M.m Schmahl, W., Weber, K., Heine, L., Mossmann, H.m Koester, A.,
Hess, B., Evers, M., von Figura, K., and Peters, C. (1995) Mice deficient for the lysosomal
proteinase cathepsin D exhibit progressive atrophy of the intestinal mucosa and profound
destruction of lymphoid cells. EMBO J. 14, 3599-3608.
Saftig, P and Klumperman, J. (2009) Lysosome biogenesis and lysosomal membrane proteins:
trafficking meets function. Nat. Rev. Mol. Cell Biol. 10, 623-635.
Sagné, C. and Gasnier, B. (2008) Molecular physiology and pathophysiology of lysosomal
membrane transporters. J. Inherit. Metab. Dis. 31, 258-266.
Saier, M.H. Jr., Beatty, J.T., Goffeau, A., Harley, K.T., Heijne, W.H.M., Huang, S-C., Jack,
D.L., Jähn, P.S., Lew, K., Liu, J., Pao, S.S., Paulsen, I.T., Tseng, T-T., and Virk, P.S. (1999)
The Major Facilitator Superfamily. J. Mol. Microbiol. Biotechnol. 1, 257-279.
Saier, M.H. (2003) Tracing pathways of transport protein evolution. Mol. Microbiol. 48,
1145-56.
Schroeder, B., Wrocklage, C., Pan, C., Jäger, R., Kösters, B., Schafer, H., Elsässer, H.P.,
Mann, M., and Hasilik, A. (2007) Integral and associated lysosomal membrane proteins.
Traffic 8, 1676-1686.
Schulze, H., Kolter, T., and Sandhoff, K. (2009) Principles of lysosomal membrane
degradation. Cellular topology and biochemistry of lysosomal lipid degradation. Biochim.
Biophys. Acta 1793, 674–683.
Sevenich, L., Pennacchio, L.A., Peter, D., and Reinheckel, T. (2006) Human cathepsin L
rescues the neurodegeneration and lethality in cathepsin B/L double-deficient mice. Biol.
Chem. 387,885-891.
Siintola, E. (2008) Identification of two novel human neuronal ceroid lipofuscinosis genes.
Helsinki University Biomedical Dissertations No. 107, Finland.
Sleat, D.E., Lackland, H., Wang, Y., Sohar, I., Xiao, G., Li, H., Lobel, P. (2005) The human
brain mannose 6-phosphate glycoproteome: a complex mixture composed of multiple
isoforms of many soluble lysosomal proteins. Proteomics 5, 1520–1532.

Bibliography
96
Storch, S. and Braulke, T. (2005) Transport of lysosomal enzymes. In: Lysosomes (P. Saftig,
ed). Georgetown: Landes Bioscience: Springer Science+Business Media, New York, 17-26.
Tedelind, S., Poliakova, K., Valeta, A., Hunegnaw, R., Yemanaberhan, E-L., Heldin, N-E.,
Kurebayashi, J., Weber, E., Kopitar-Jerala, N., Turk, B., Bogyo, M., and Brix, K. (2010)
Nuclear cysteine cathepsin variants in thyroid carcinoma cells. Biol. Chem. 391, 923-935.
Maley, F., Trimble, R.B., Tarentino, A.L., and Plummer, Jr., T.H. (1989) Characterization of
glycoproteins and their associated oligosaccharides through the use of endoglycosidases.
Anal. Biochem. 180, 195-2004.
Turk, V., Turk, B. and Turk, D. (2001) Lysosomal cysteine proteases: facts and
Opportunities. EMBO J. 20, 4629-4633.
Turk, B., Turk, D. and Turk, V. (2000) Lysosomal cysteine proteases: more than scavengers.
Biochim. Biophys. Acta 1477, 98-111.
Umezawa, H., Aoyagi, T, Morishima, H., Matsuzaki, M. and Hamada, M. (1970) Pepstatin, a
new pepstin inhibotor produced by Actinomycetes. Journal Antibiotics 23, 259-262.
Vardy, E., Arkin, I.T., Gottschalk, K.E., Kaback, H.R., and Schuldiner, S. (2004) Structural
conservation in the major facilitator superfamily as revealed by comparative modeling.
Protein Science 13, 1832–1840.
Vergarajauregui, S. and Puertollano, R. (2007) Two di-leucine motifs regulate trafficking of
mucolipin-1 to lysosomes. Traffic 6, 337-353.
von Figura, K. and Hasilik, A. (1986) Lysosomal enzymes and their receptors. Annu. Rev.
Biochem. 55, 167-193.
Waheed, A., Pohlmann, R., Hasilik, A., von Figura, K., van Elsen, A., and Leroy, J.G. (1982)
Deficiency of UDP-N-acetylglucosamine: lysosomal enzyme N-acetylglucosamine-1-
phosphotransferase in organs of I-cell patients. Biochem. Biophys. Res. Commun. 105, 1052–
1058.
Weinert, S., Jabs, S., Supanchart, C., Schweizer, M., Gimber, N., Richter, M., Rademann, J.,
Stauber, T., Kornak, U., and Jentsch, T. J. (2010) Lysosomal Pathology and Osteopetrosis
upon Loss of H+-Driven Lysosomal Cl
– Accumulation. Science 328, 1401-1403.
Weinglass, A.B. and Kaback, H.R. (2000) The central cytoplasmic loop of the major
facilitator superfamily of transport proteins governs efficient membrane insertion. Proc. Natl.
Acad. Sci. USA 97, 8938-8943.
Williams, M.A. and Fukuda, M. (1990) Accumulation of membrane glycoproteins in
lysosomes requires a tyrosine residue at a particular position in the cytoplasmic tail. J. Cell
Biol. 111, 955-966.

Bibliography
97
Wreden, C.C., Wlizla, M. and Reimer, R.J. (2005) Varied mechanisms underlie the free sialic
acid storage disorders. J. Biol. Chem. 280, 1408 -1416.
Yin, Y., He, X., Szewczyk, P., Nguyen, T., and Chang, G. (2006) Structure of the multidrug
transporter EmrD from Escherichia coli. Science 312, 741-744.
Zhang, Y. (2008) I-TASSER server for protein 3D structure prediction. BMC Bioinformatics
9, 1-8.
Curriculum Vitae
98
CURRICULUM VITAE
Personal data:
Name : Lalu Rudyat Telly Savalas, B.Sc., M.Sc
Place and date of birth: Lombok, Indonesia, June 26th 1975
Nationality: Indonesian
Education:
1. Master degree with thesis, with grade of ‘Excellent’, Department of Chemistry, Faculty of
Mathematics and Natural Sciences, ITB, with major in Biochemistry, 2002.
2. Bachelor degree with thesis, with grade of ‘very good’, Department of Chemistry, Faculty
of Mathematics and Natural Sciences, ITB, 1999.
Award: Awardee of the Germany Academic Exchange Service (DAAD) scholarship and Overseas
PhD Scholarship from the Department of Education and Cultural, Republic of Indonesia to
undertake PhD study in Germany.
Working Experiences:
1. Lecturer in biochemistry, University of Mataram, Indonesia, since 2004.
2. Research Assistant, Protein and Enzyme Research Group and Genetic Engineering
Laboratory, Biotechnology Research and Development Center, ITB, 2000-2003.
3. Teaching Assistant, Biochemistry Laboratory, Department of Chemistry, ITB, 1997-2002.
Attended Courses/Seminars:
1. International Summer School on Pathogen-Host-Interplay, Center of Infection Biology
and Immunity, July 20-24, 2009, Charite´, Berlin.
2. Attending the Summer School in Graduate Frontier of Biosciences, Osaka University,
Japan (July - Aug 2004), and assigned in Prof. Hiroshi Nojima’s lab (Research Institute of
Microbial diseases)
3. The 3rd Sanbe Teaching and Laboratory Course on Diagnostic with DNA Probes and
Monoclonal Antibodies (Genetic Cardiology), Bandung, Indonesia, 17-18 February 2003.
4. The 5th ITB-UKM Joint Seminar, Malacca, Malaysia, 16-17 July 2002.
5. National Seminar on Chemistry, Institut Teknologi Sebelas November Surabaya,
Indonesia, August 24 1999.