BIOASSAY OF AROCLOR® 1254 FOR POSSIBLE …A bioassay of Aroclor® 1254 for possible carcinogenicity...
76
National Cancer Institute CARCINOGENESIS Technical Report Series No. 38 1978 BIOASSAY OF AROCLOR ® 1254 FOR POSSIBLE CARCINOGENICITY CAS No. 27323-18-8 NCI-CG-TR-38 U.S. DEPARTMENT OF HEALTH, EDUCATION, AND WELFARE Public Health Service National Institutes of Health
Transcript of BIOASSAY OF AROCLOR® 1254 FOR POSSIBLE …A bioassay of Aroclor® 1254 for possible carcinogenicity...
National Cancer Institute CARCINOGENESIS Technical Report Series No. 38 1978
BIOASSAY OF AROCLOR® 1254 FOR POSSIBLE CARCINOGENICITY
CAS No. 27323-18-8
NCI-CG-TR-38
U.S. DEPARTMENT OF HEALTH, EDUCATION, AND WELFARE Public Health Service National Institutes of Health
baldwind2
Text Box
The Chemical Abstracts Service (CAS) Registry number used to track this bioassay is 11097-69-1, which is determined to best define the material used in the conduct of this bioassay.

BIOASSAY OF
AROCLOR® 1254
FOR POSSIBLE CARCINOGENICITY
Carcinogenesis Testing Program Division of Cancer Cause and Prevention
National Cancer Institute National Institutes of Health
Bethesda, Maryland 20014
U.S. DEPARTMENT OF HEALTH, EDUCATION, AND WELFARE Public Health Service
National Institutes of Health
DHEW Publication No. (NIH) 78-838

BIOASSAY OF AROCLOR® 1254 FOR POSSIBLE
CARCINOGENICITY
Carcinogenesis Testing Program Division of Cancer Cause and
Prevention National Cancer Institute National Institutes of
Health
CONTRIBUTORS: This report presents the results of the bioassay of Aroclor® 1254 for possible carcinogenicity, conducted for the Carcinogenesis Testing Program, Division of Cancer Cause and Prevention, National Cancer Institute (NCI), Bethesda, Maryland. The bioassay was conducted by Stanford Research Institute, Menlo Park, California, initially under direct contract to NCI and currently under a subcontract to Tracor Jitco, Inc., prime contractor for the NCI Carcinogenesis Testing Program.
The experimental design and doses were determined by Drs. R. R.Bates1'2, D. C. L. Jones3, D. P. Sasmore3, G. W. Newell3, and R. M. Elashoff4, and Mr. W. E. Davis3. The principal investigatorwas Dr. D. C. L. Jones; the technical supervisor of animaltreatment, observation, and data handling was Mr. W. E. Davis; necropsy and tissue fixation were supervised by Dr. D. P. Sasmore.
Histopathologic examinations were performed by Dr. H. Elster5 and the diagnoses included in this report represent his interpretation. Neoplasms and compound-related hyperplastic lesions were reviewed by Drs. W. M. Busey6 and J. F. Hardisty6, who also prepared the interpretive pathology summary included inthis report.
Animal pathology tables and survival tables were compiled at EG&G Mason Research Institute7. The statistical analyses were performed by Dr. J. R. Joiner8, using methods selected for the bioassay program by Dr. J. J. Gart9. Chemicals used in this
iii
bioassay were analyzed at Stanford Research Institute, and the analytical results were reviewed by Dr. C. W. Jameson8.
This report was prepared at Tracer Jitco8 under the direction ofNCI. Those responsible for the report at Tracer Jitco were Dr. Marshall Steinberg, Director of the Bioassay Program; Drs. J. F. Robens and R. W. Fogleman, toxicologists; Dr. R. L. Schueler,pathologist; Ms. L. A. Waitz and Mr. W. D. Reichardt, bioscience writers; and Dr. E. W. Gunberg, technical editor, assisted by Ms. Y. E. Presley.
The statistical analysis was reviewed by members of the Mathematical Statistics and Applied Mathematics Section of NCI9: Dr. John J. Gart, Mr. Jun-mo Nam, Dr. Hugh M. Pettigrew, and Dr. Robert E. Tarone.
The following other scientists at the National Cancer Institute were responsible for evaluating the bioassay experiment, interpreting the results, and reporting the findings:
Dr. Kenneth C. Chu Dr. Cipriano Cueto, Jr. Dr. J. Fielding Douglas Dr. Dawn G. Goodman Dr. Richard A. Griesemer Mr. Harry A. Milman Dr. Thomas W. Orme Dr. Robert A. Squire10
Dr. Jerrold M. Ward
1 Carcinogenesis Testing Program, Division of Cancer Cause and Prevention, National Cancer Institute, National Institutes of Health, Bethesda, Maryland.
2 Now with the Office of the Commissioner, Food and Drug Administration, Rockville, Maryland.
3 Stanford Research Institute, Menlo Park, California.
iv
4 Department of Biomathematics, Center for the Health Sciences, University of California, Los Angeles, California.
5 Department of Pathology, David M. Brotman Memorial Hospital, 3828 Hughes Avenue, Culver City, California.
6 Experimental Pathology Laboratories, Inc., P.O. Box 474, Herndon, Virginia.
7 EG&G Mason Research Institute, 1530 East Jefferson Street, Rockville, Maryland.
8 Tracor Jitco, Inc., 1776 East Jefferson Street, Rockville, Maryland.
9 Mathematical Statistics and Applied Mathematics Section, Biometry Branch, Field Studies and Statistics, Division of Cancer Cause and Prevention, National Cancer Institute, National Institutes of Health, Bethesda, Maryland.
10 Now with the Division of Comparative Medicine, Johns Hopkins University, School of Medicine, Traylor Building, Baltimore, Maryland.
v

SUMMARY
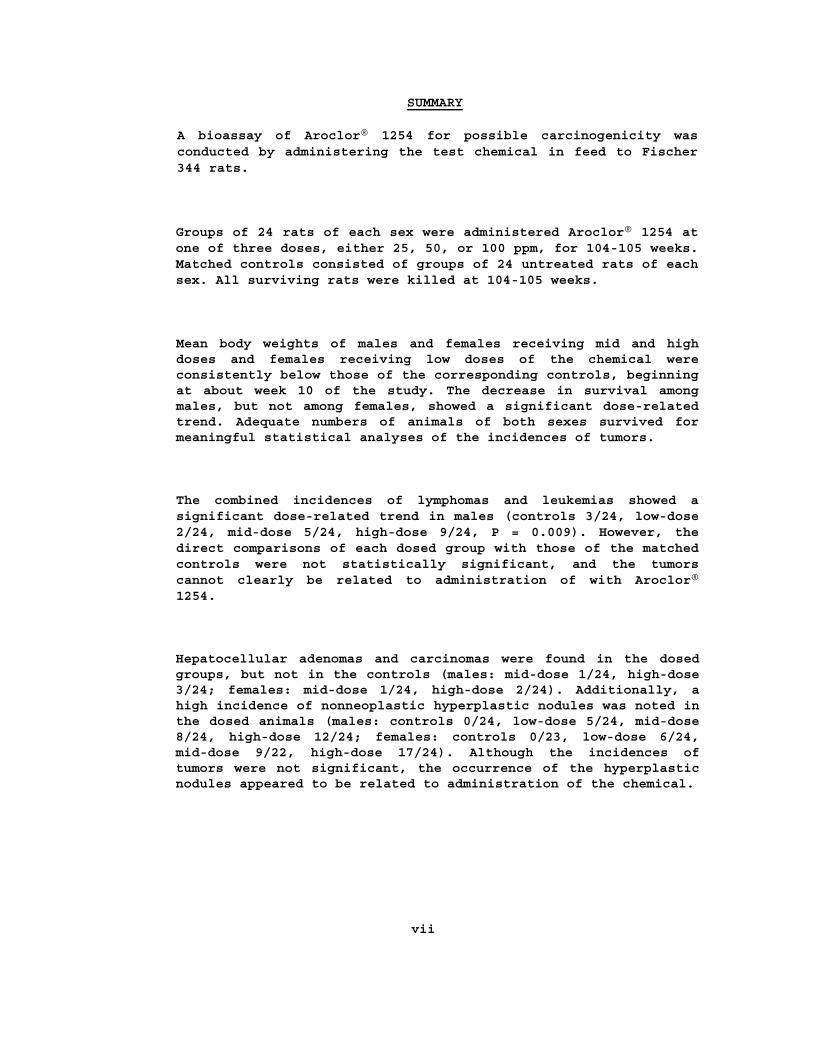
A bioassay of Aroclor® 1254 for possible carcinogenicity wasconducted by administering the test chemical in feed to Fischer 344 rats.
Groups of 24 rats of each sex were administered Aroclor® 1254 at one of three doses, either 25, 50, or 100 ppm, for 104-105 weeks. Matched controls consisted of groups of 24 untreated rats of each sex. All surviving rats were killed at 104-105 weeks.
Mean body weights of males and females receiving mid and highdoses and females receiving low doses of the chemical were consistently below those of the corresponding controls, beginning at about week 10 of the study. The decrease in survival among males, but not among females, showed a significant dose-related trend. Adequate numbers of animals of both sexes survived formeaningful statistical analyses of the incidences of tumors.
The combined incidences of lymphomas and leukemias showed asignificant dose-related trend in males (controls 3/24, low-dose 2/24, mid-dose 5/24, high-dose 9/24, P = 0.009). However, thedirect comparisons of each dosed group with those of the matchedcontrols were not statistically significant, and the tumors cannot clearly be related to administration of with Aroclor®1254.
Hepatocellular adenomas and carcinomas were found in the dosed groups, but not in the controls (males: mid-dose 1/24, high-dose3/24; females: mid-dose 1/24, high-dose 2/24). Additionally, ahigh incidence of nonneoplastic hyperplastic nodules was noted inthe dosed animals (males: controls 0/24, low-dose 5/24, mid-dose 8/24, high-dose 12/24; females: controls 0/23, low-dose 6/24,mid-dose 9/22, high-dose 17/24). Although the incidences of tumors were not significant, the occurrence of the hyperplasticnodules appeared to be related to administration of the chemical.
vii
In the stomach, jejunum, or cecum, adenocarcinomas were observed in two dosed males and in two dosed females as well as a carcinoma in one dosed male. None of these lesions was found in control animals in this study. Historical incidences of these tumors at this laboratory (6/600 males [1%], 2/600 females [0.3%] suggest that the lesions — although not statistically significant — may be related to the administration of Aroclor® 1254.
It is concluded that under the conditions of this bioassay, Aroclor® 1254 was not carcinogenic in Fischer 344 rats; however, a high incidence of hepatocellular proliferative lesions in both male and female rats was related to administration of the chemical. In addition, the carcinomas of the gastrointestinal tract may be associated with administration of Aroclor® 1254 in both males and females.
viii
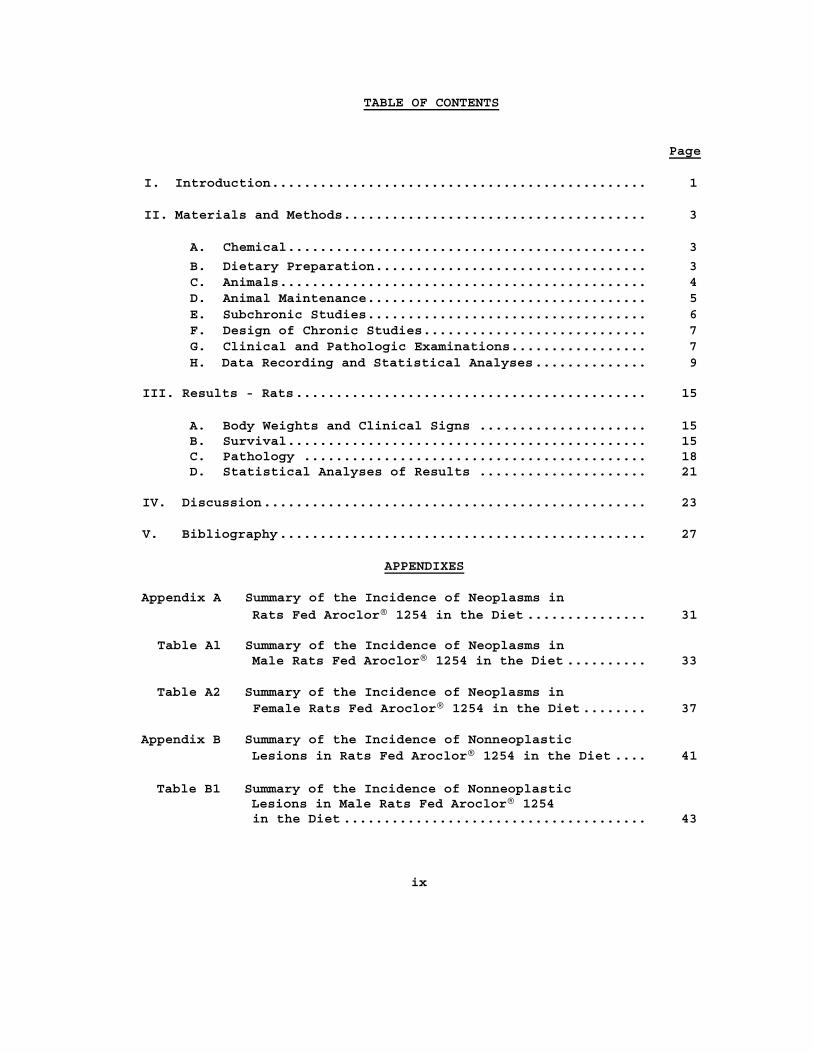
TABLE OF CONTENTS
Page
I. Introduction............................................... 1
II. Materials and Methods...................................... 3
A. Chemical............................................. 3
B. Dietary Preparation.................................. 3 C. Animals.............................................. 4 D. Animal Maintenance................................... 5 E. Subchronic Studies................................... 6 F. Design of Chronic Studies............................ 7 G. Clinical and Pathologic Examinations................. 7 H. Data Recording and Statistical Analyses.............. 9
III. Results - Rats............................................ 15
A. Body Weights and Clinical Signs ..................... 15 B. Survival............................................. 15 C. Pathology ........................................... 18 D. Statistical Analyses of Results ..................... 21
IV. Discussion................................................ 23
V. Bibliography.............................................. 27
APPENDIXES
Appendix A Summary of the Incidence of Neoplasms in Rats Fed Aroclor® 1254 in the Diet ............... 31
Table Al Summary of the Incidence of Neoplasms in Male Rats Fed Aroclor® 1254 in the Diet .......... 33
Table A2 Summary of the Incidence of Neoplasms in Female Rats Fed Aroclor® 1254 in the Diet ........ 37
Appendix B Summary of the Incidence of Nonneoplastic Lesions in Rats Fed Aroclor® 1254 in the Diet .... 41
Table B1 Summary of the Incidence of Nonneoplastic Lesions in Male Rats Fed Aroclor® 1254 in the Diet ...................................... 43
ix
Page
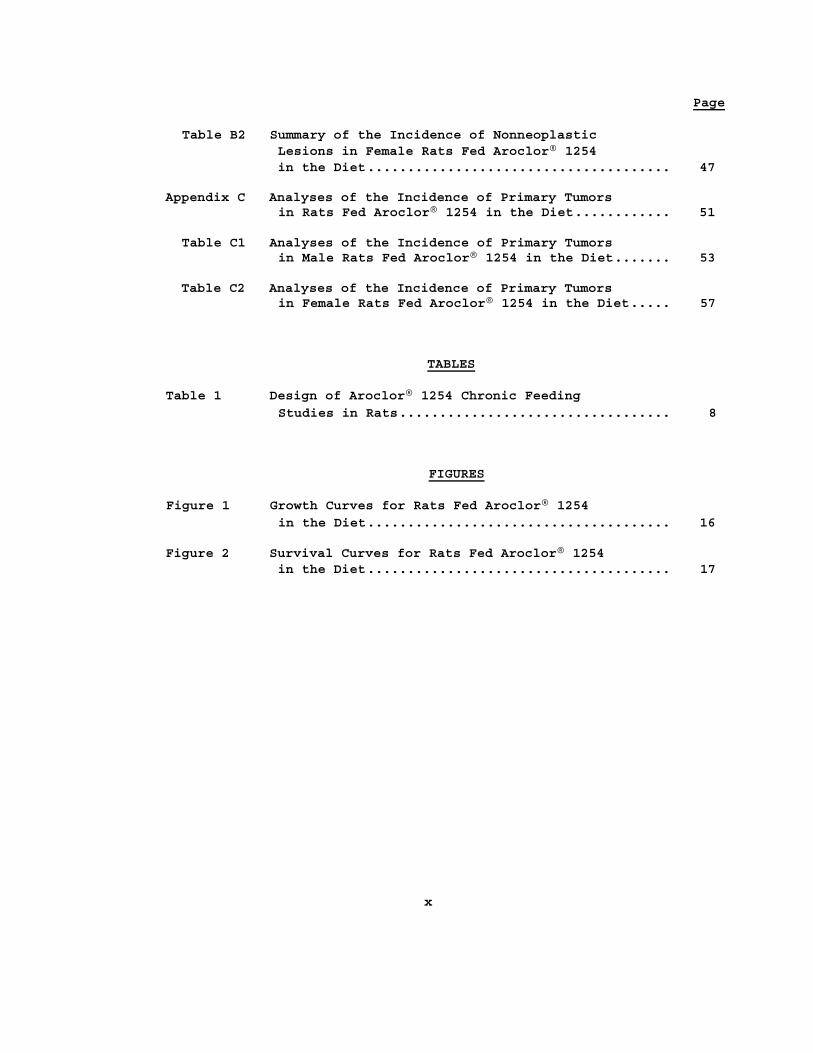
Table B2 Summary of the Incidence of Nonneoplastic Lesions in Female Rats Fed Aroclor® 1254 in the Diet...................................... 47
Appendix C Analyses of the Incidence of Primary Tumors in Rats Fed Aroclor® 1254 in the Diet............ 51
Table C1 Analyses of the Incidence of Primary Tumors in Male Rats Fed Aroclor® 1254 in the Diet....... 53
Table C2 Analyses of the Incidence of Primary Tumors in Female Rats Fed Aroclor® 1254 in the Diet..... 57
TABLES
Table 1 Design of Aroclor® 1254 Chronic Feeding Studies in Rats.................................. 8
FIGURES
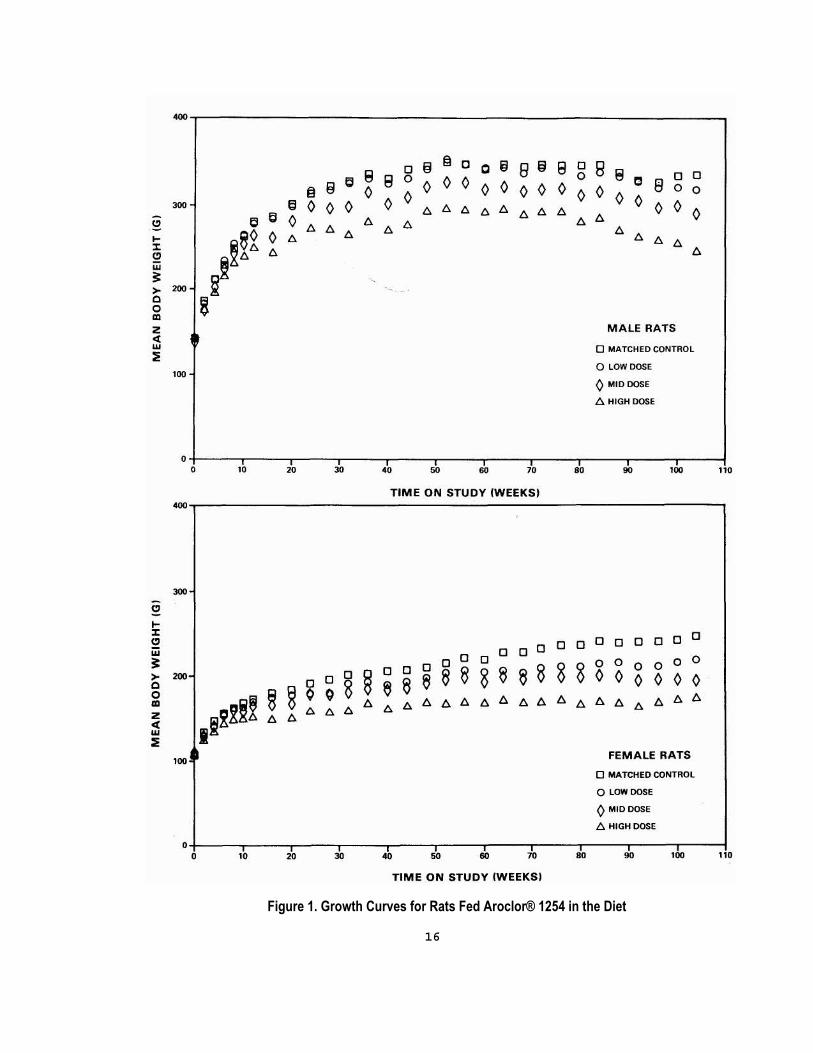
Figure 1 Growth Curves for Rats Fed Aroclor® 1254 in the Diet...................................... 16
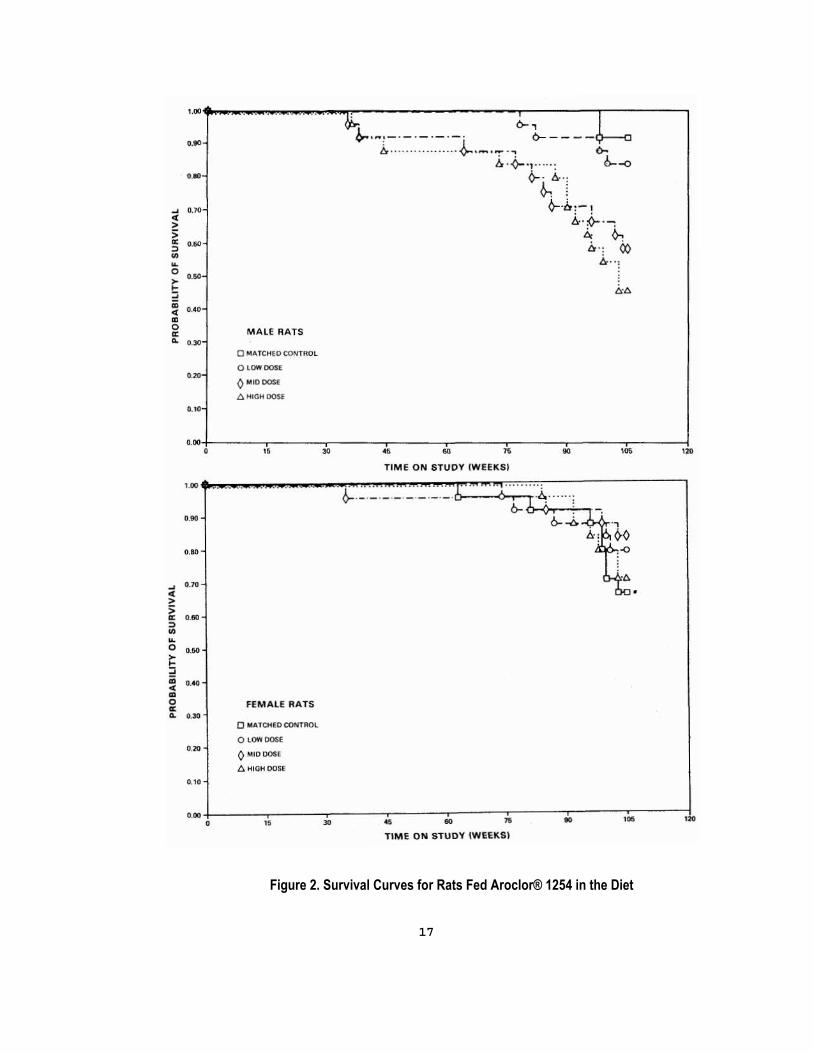
Figure 2 Survival Curves for Rats Fed Aroclor® 1254 in the Diet...................................... 17
x
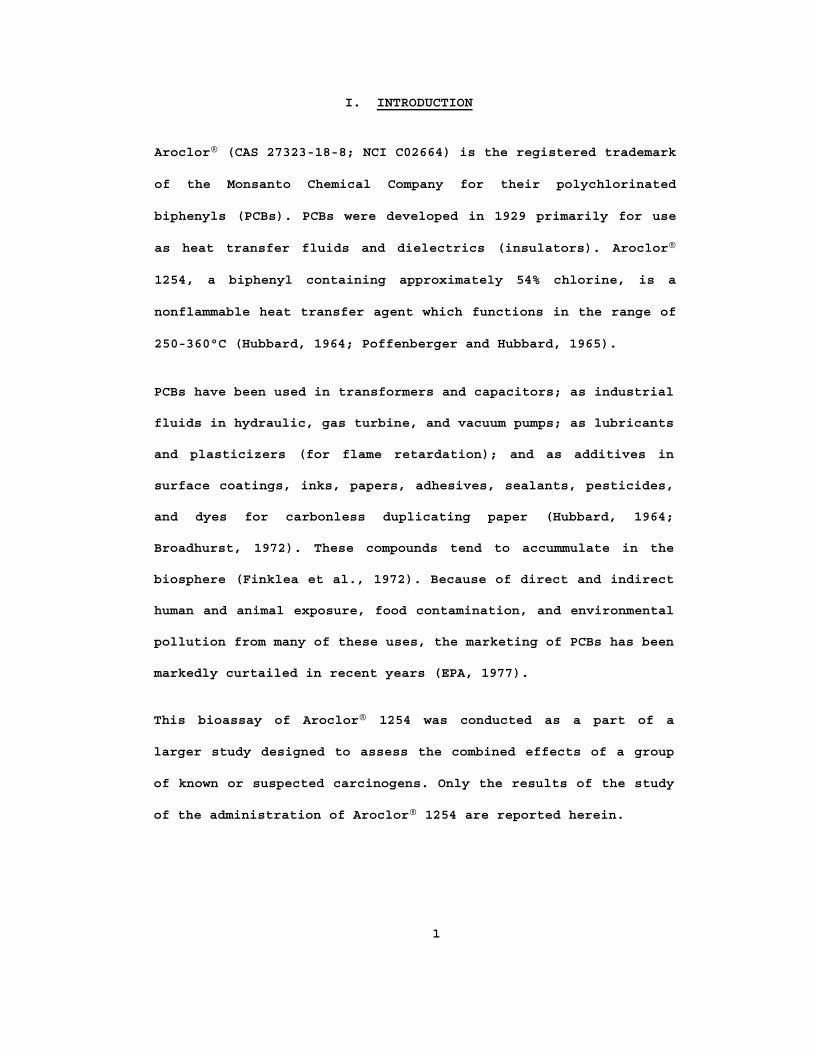
I. INTRODUCTION
Aroclor® (CAS 27323-18-8; NCI C02664) is the registered trademark
of the Monsanto Chemical Company for their polychlorinated
biphenyls (PCBs). PCBs were developed in 1929 primarily for use
as heat transfer fluids and dielectrics (insulators). Aroclor®
1254, a biphenyl containing approximately 54% chlorine, is a
nonflammable heat transfer agent which functions in the range of
250-360°C (Hubbard, 1964; Poffenberger and Hubbard, 1965).
PCBs have been used in transformers and capacitors; as industrial
fluids in hydraulic, gas turbine, and vacuum pumps; as lubricants
and plasticizers (for flame retardation); and as additives in
surface coatings, inks, papers, adhesives, sealants, pesticides,
and dyes for carbonless duplicating paper (Hubbard, 1964;
Broadhurst, 1972). These compounds tend to accummulate in the
biosphere (Finklea et al., 1972). Because of direct and indirect
human and animal exposure, food contamination, and environmental
pollution from many of these uses, the marketing of PCBs has been
markedly curtailed in recent years (EPA, 1977).
This bioassay of Aroclor® 1254 was conducted as a part of a
larger study designed to assess the combined effects of a group
of known or suspected carcinogens. Only the results of the study
of the administration of Aroclor® 1254 are reported herein.
1

II. MATERIALS AND METHODS
A. Chemical
Aroclor® 1254 was obtained in a single batch (Lot No. KB01-604)
from the Monsanto Chemical Company, St. Louis, Missouri. The
identity and relative purity of the test chemical were confirmed
at Stanford Research Institute. Elemental analyses (C, H, Cl)
indicated 54.67% chlorine. Gas-liquid chromatography and mass
spectroscopy showed that the Aroclor® 1254 contained at least 18
isomers of polychlorinated biphenyls ranging from 4 to 7 chlorine
atoms per molecule. Identity was confirmed by nuclear magnetic
resonance, infrared, and ultraviolet spectra, which were in
agreement with the structure. No attempt was made to identify or
quantitate impurities.
The chemical was stored at room temperature in 1-gallon amber
glass jars.
B. Dietary Preparation
All diets were formulated every 2 weeks using Low Fat Lab Chow®
(Ralston Purina Co., St. Louis, Mo.). A stock diet was first pre
pared by hand mixing a weighed amount of the Aroclor® 1254 with
corn oil (Staley Manufacturing Co., Orange, Calif.) and adding
this mixture to a small amount of feed which was also mixed by
3
hand. More corn oil and feed were then added to give a final
concentration of 3,000 ppm Aroclor® 1254 and 3% corn oil and then
machine mixed in a Hobart blender for 30 minutes. Each stock diet
was analyzed for content of Aroclor® 1254 by a method involving
extraction, Florisil® chromatography, and quantitation by gas-
liquid chromatography. Concentrations of 3,000 ppm ± 10% were
considered acceptable for use in preparing the test diets.
Aroclor® 1254 at 3,000 ppm in the stock diet was found to be
stable when held in rat feeders at room temperature for a 2-week
period.
To obtain test diets having appropriate concentrations of
Aroclor® 1254, the stock diet was diluted, as required, with
control diet containing 3% corn oil and mixed in a Hobart
blender. The stock and test diets were stored at room temperature
in covered plastic containers.
C. Animals
Male and female Fischer 344 rats, obtained through contracts of
the Division of Cancer Treatment, National Cancer Institute, were
used in these bioassays. The rats were obtained from Simonsen
Laboratory, Gilroy, California. On arrival at the laboratory, all
animals were quarantined for 2 weeks as an acclimation period.
Following this period, all males gaining less than 25
4
grams, all females gaining less than 15 grams, and all unhealthy
animals were culled. The remaining animals were assigned to
cages, one per cage, until each cage contained three animals.
Cages were then numbered and assigned to control and treated
groups using a computer-generated randomization table. Rats were
ear-clipped for individual identification.
D. Animal Maintenance
All animals were housed in temperature- and humidity-controlled
rooms. The temperature was maintained at 22°C with a range of 21
24°C, and the relative humidity was maintained at approximately
45%. The room air was changed 10 times per hour and was
maintained under positive pressure to the access halls.
Fluorescent lighting provided illumination 12 hours per day. Food
and water were available ad libitum. Drinking water was softened,
filtered, sterilized with ultraviolet light, and supplied by
means of an automatic watering system.
The rats were housed three per cage in polycarbonate cages
equipped with disposable polyester woven filter tops. Autoclaved
hardwood chips (Iso-Dri® , Becton, Dickinson, and Carworth,
Warrensburg, N.Y.) were used as bedding. The cages were changed,
washed, and provided with fresh bedding twice per week. Filter
tops were replaced once per month.
5
Rats fed Aroclor® 1254 were housed in the same room as rats
treated with aflatoxin B1 (CAS 1162-65-8), lead (II) acetate (CAS
301-04-2), hexachlorophene (CAS 70-30-4), or dieldrin (CAS
60-57-1) in the feed.
E. Subchronic Studies
Subchronic feeding studies were conducted with male and female
Fischer 344 rats to estimate the maximum tolerated dose of
Aroclor® 1254, on the basis of which low, mid, and high
concentrations (hereinafter referred to as "low doses", "mid
doses", and "high doses") were determined for administration in
the chronic studies. In the subchronic studies, Aroclor® 1254 was
added to feed in concentrations of 25, 50, 100, 200, or 400 ppm.
Treated and control groups each consisted of 15 male and 15
female rats. The chemical was provided in feed to the treated
groups for 8 weeks.
The animals receiving 400 ppm were inactive, had occasional
diarrhea and tremors, and failed to gain weight. At this dose
4/15 males and 1/15 females died. Enlarged livers were observed
on gross examination, and histologically atypical hyperplasia was
observed. At 200 ppm, body weights for both males and females
were approximately 70% of those of the controls, and mild hepato
cellular pleomorphism was seen histologically in the livers.
6
Rats treated with 25 ppm Aroclor® 1254 had enlarged livers, but
no evidence of histologic abnormalities. Weight gain in all
animals treated at doses lower than 200 ppm was comparable to
that in controls, and there was no mortality below 400 ppm. The
low, mid, and high doses for the chronic studies were set at 25,
50, and 100 ppm.
F. Design of Chronic Studies
The design of the chronic studies is shown in table 1.
G. Clinical and Pathologic Examinations
All animals were observed daily for signs of toxicity and
palpated for masses at each weighing. Animals were weighed
individually every other week for 12 weeks, and once every fourth
week for the remainder of the study. Animals that were moribund
at the time of clinical examination were killed and necropsied.
The pathologic evaluation consisted of gross examination of major
organs and tissues from killed animals and from animals found
dead. The following tissues were routinely examined micro
scopically from both treated and control animals: lungs and
bronchi, spleen, liver, testes, pituitary, kidney, and brain. In
addition, sections of stomach, urinary bladder, thyroid, uterus,
and ovary were examined in a majority of the controls; these
7
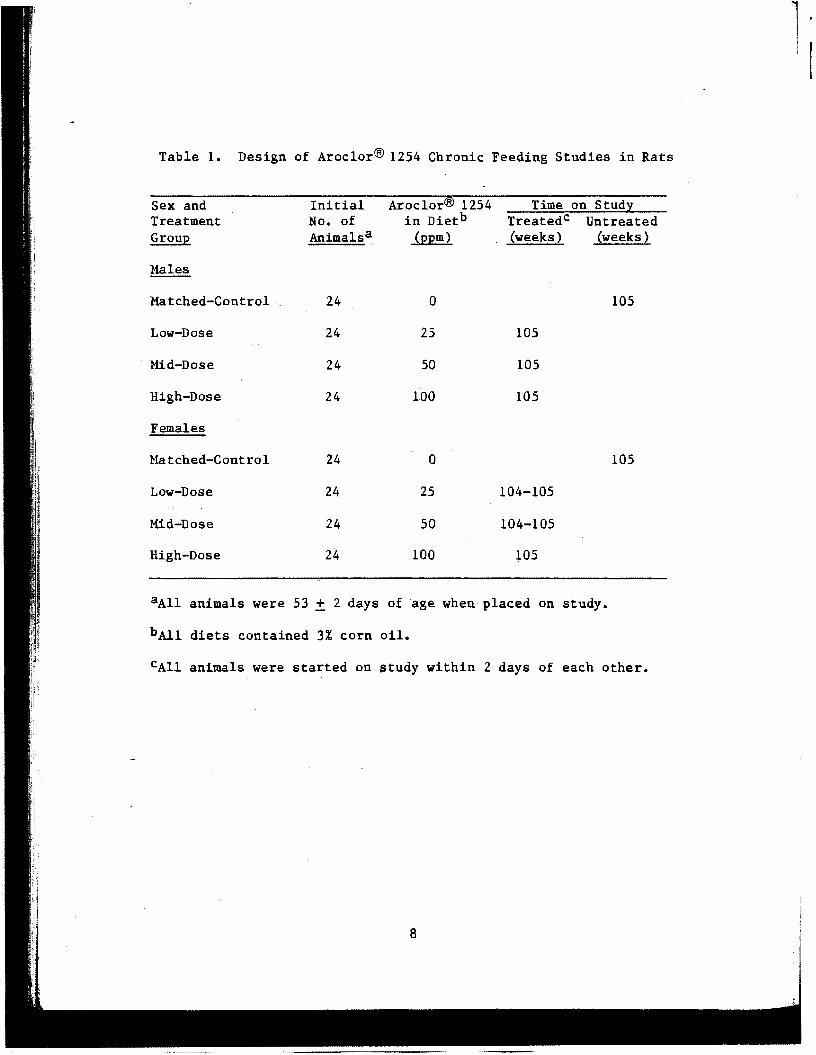
Table 1. Design of Aroclor® 1254 Chronic Feeding Studies in Rats
Sex and Initial Aroclor® 1254 Time on Stud:t: Treatment No. of in Dietb Treatedc Untreated Group Animals a (ppm) (weeks) (weeks)
l-lales
Matched-Control 24 0 105
Low-Dose 24 25 105
Mid-Dose 24 so lOS
High-Dose 24 100 lOS
Females
Matched-Control 24 0 105
Low-Dose 24 25 104-105
Mid-Dose 24 so 104-105
High-Dose 24 100 lOS
aAll animals were 53 ± 2 days of age when placed on study.
bAll diets contained 3% corn oil.
cAll animals were started on study within 2 days of each other.
8
l
tissues were taken from treated rats only if a lesion was found
at necropsy. Occasionally, additional tissues were examined
microscopically. Gross lesions from all animals were also
examined microscopically. The different tissues were preserved in
10% buffered formalin, embedded in paraffin, sectioned, and
stained with hematoxylin and eosin. Special staining techniques
were utilized when indicated for more definitive diagnosis.
A few of the tissues selected by design from some animals were
not examined, particularly from those animals that died early.
Thus, the number of animals from which particular organs or
tissues were microscopically examined varies, and does not
necessarily represent the number of animals that were placed on
study in each group.
H. Data Recording and Statistical Analyses
Pertinent data on this experiment have been recorded in an auto
matic data processing system, the Carcinogenesis Bioassay Data
System (Linhart et al., 1974). The data elements include descrip
tive information on the chemicals, animals, experimental design,
clinical observations, survival, body weight, and individual
pathologic results, as recommended by the International Union
Against Cancer (Berenblum, 1969). Data tables were generated for
verification of data transcription and for statistical review.
9
These data were analyzed using the statistical techniques
described in this section. Those analyses of the experimental
results that bear on the possibility of carcinogenicity are
discussed in the statistical narrative sections.
Probabilities of survival were estimated by the product-limit
procedure of Kaplan and Meier (1958) and are presented in this
report in the form of graphs. Animals were statistically censored
as of the time that they died of other than natural causes or
were found to be missing; animals dying from natural causes were
not statistically censored. Statistical analyses for a possible
dose-related effect on survival used the method of Cox (1972) for
testing two groups for equality and Tarone's (1975) extensions of
Cox's methods for testing for a dose-related trend. One-tailed P
values have been reported for all tests except the departure from
linearity test, which is only reported when its two-tailed P
value is less than 0.05.
The incidence of neoplastic or nonneoplastic lesions has been
given as the ratio of the number of animals bearing such lesions
at a specific anatomic site (numerator) to the number of animals
necropsied (denominator).
The purpose of the statistical analyses of tumor incidence is to
determine whether animals receiving the test chemical developed a
10
significantly higher proportion of tumors than did the control
animals. As a part of these analyses, the one-tailed Fisher exact
test (Cox, 1970) was used to compare the tumor incidence of a
control group with that of a group of treated animals at each
dose level. When results for a number of treated groups (k) are
compared simultaneously with those for a control group, a
correction to ensure an overall significance level of 0.05 may be
made. The Bonferroni inequality (Miller, 1966) requires that the
P value for any comparison be less than or equal to 0.05/k. In
cases where this correction was used, it is discussed in the
narrative section. It is not, however, presented in the tables,
where the Fisher exact P values are shown.
The Cochran-Armitage test for linear trend in proportions, with
continuity correction (Armitage, 1971), was also used. Under the
assumption of a linear trend, this test determines if the slope
of the dose-response curve is different from zero at the one-
tailed 0.05 level of significance. Unless otherwise noted, the
direction of the significant trend is a positive dose relation
ship. This method also provides a two-tailed test of departure
from linear trend.
A time-adjusted analysis was applied when numerous early deaths
resulted from causes that were not associated with the formation
of tumors. In this analysis, deaths that occurred before the
11
first tumor was observed were excluded by basing the statistical
tests on animals that survived at least 52 weeks, unless a tumor
was found at the anatomic site of interest before week 52. When
such an early tumor was found, comparisons were based exclusively
on animals that survived at least as long as the animal in which
the first tumor was found. Once this reduced set of data was
obtained, the standard procedures for analyses of the incidence
of tumors (Fisher exact tests, Cochran-Armitage tests, etc.) were
followed.
When appropriate, life-table methods were used to analyze the
incidence of tumors. Curves of the proportions surviving without
an observed tumor were computed as in Saffiotti et al. (1972).
The week during which an animal died naturally or was sacrificed
was entered as the time point of tumor observation. Cox's methods
of comparing these curves were used for two groups; Tarone's
extension to testing for linear trend was used for three groups.
The statistical tests for the incidence of tumors which used
life-table methods were one-tailed and, unless otherwise noted,
in the direction of a positive dose relationship. Significant
departures from linearity (P < 0.05, two-tailed test) were also
noted.
The approximate 95 percent confidence interval for the relative
risk of each treated group compared to its control was calculated
12
from the exact interval on the odds ratio (Gart, 1971). The
relative risk is defined as pt/pc where pt is the true binomial
probability of the incidence of a specific type of tumor in a
treated group of animals and pc is the true probability of the
spontaneous incidence of the same type of tumor in a control
group. The hypothesis of equality between the true proportion of
a specific tumor in a treated group and the proportion in a
control group corresponds to a relative risk of unity. Values in
excess of unity represent the condition of a larger proportion in
the treated group than in the control.
The lower and upper limits of the confidence interval of the
relative risk have been included in the tables of statistical
analyses. The interpretation of the limits is that in
approximately 95% of a large number of identical experiments, the
true ratio of the risk in a treated group of animals to that in a
control group would be within the interval calculated from the
experiment. When the lower limit of the confidence interval is
greater than one, it can be inferred that a statistically
significant result (P < 0.025 one-tailed test when the control
incidence is not zero, P < 0.050 when the control incidence is
zero) has occurred. When the lower limit is less than unity, but
the upper limit is greater than unity, the lower limit indicates
the absence of a significant result while the upper limit
13
indicates that there is a theoretical possibility of the
induction of tumors by the test chemical, which could not be
detected under the conditions of this test.
14
III. RESULTS
A. Body Weights and Clinical Signs
Beginning at about week 10 for the high-dose groups and about
week 20 for the mid-dose groups, mean body weights of both male
and female rats fed Aroclor® 1254 at the doses used in this
bioassay were lower than those of the controls (figure 1). Mean
body weights of low-dose males appeared comparable to those of
controls throughout the study, while mean body weights of low-
dose females were lower during the second year of the study. At
week 30, an intercurrent respiratory infection in the colony
caused weight loss, but no deaths; animals recovered within 30
days without treatment for the infection.
Clinical signs associated with administration of Aroclor® 1254
included alopecia, amber-colored urine, facial edema, exoph
thalmos, and cyanosis. These signs were apparent among the high-
dose groups beginning at week 72 and among the mid-dose groups at
week 104 of the study.
B. Survival
The Kaplan and Meier curves estimating the probabilities of
survival for male and female rats fed Aroclor® 1254 in the diet
15
~.---------------------------------------------------------~
0 ij~Co@8§80 0 8 8 0 0 0
~ 8 8 ft ij 0 0 0 8 0 0
300- e 0 ° 0 0 0 0 0 0 ~ 0 0 0
0 0 0 6. 6. 6. 6. 6. 6. 6. 6. 0 0 0 0 0 0 6. 6. 6. . ~ 6. 6. 6. 6. ~ 6. 6. 6. 6. 6. 6. X
0 ~
~e~ w ~
6. 6. 6.
~ > 200 ~ '
+
0 0 CD 8
..... .
z MALE RATS ct w 0 MATCHED CONTROL ~
0 LOW DOSE 100
0 MID DOSE
6. HIGH DOSE
0+-----~----r----,r----.-----.----~----------~----,-----~--~ 0 10 20 :W 40 50 60 70 80 90 100 110
TIME ON STUDY IWEEKSI
~~------------------------------------------------------------~
300
~ ~ X
w ~ 0 0 0 0 0 0 0
0 0 0 ° ~ 0 0 0 0 0 0 0 0 0 > 200 0 e 8 g o o o o o o 0
s g 8 8 8 g CD 6. 6. 6. 6. 6. 6. 6. 6. 6. 6. 6. 6. 6. 6. 6. z ct w ~
FEMALE RATS
0MATCHEDCONTROL
0 LOW DOSE
0 MID DOSE
6. HIGH DOSE
0+-----~----r----,r----.-----.----~-----.-----r----~----,---~ 0 ~ ~ ~ k ~ ~ k ~ ~ 100 110
TIME ON STUDY (WEEKS)
Figure 1. Growth Curves for Rats Fed Aroclor® 1254 in the Diet
16
1.00 .. .. .. . .. . ~ ~,
0.90 ¢.. ·-~- · - · -·- · - · ~-- --6, ........ ........ . -6-..-·-:- '"'! (>..
b ·-¢-·t" ... : 6.- -o 0.110 <>-· h_ .. ;
~ ~ ... 0.70 /:r·b:-1 ~ b_ .. :(r ._ > > ~ &.. a: 0.60 ~ -: 00 :::l VI }:, .. , ... 0
0.50 >-... l::.t:> ::; iii 0.40 ~ m 0 MALE RATS a: Q. 0.30
0 MATCHED CONTROL
OLOW OOSE 0.20 0 MIDOOSE
/:>HIGH OOSE
0.10
0.00 0 15 30 45 60 15 90 \05 1~0
TIME ON STUDY IWEEKSI
1.00 .... .. . . ~-~.·:.. .· ___ . :..·.·:_ :::.-:.. .
0,90
0.80
... 0.70 ~ > > a: 0.80 :::l VI ... 0 0.50 >-.... ::; iii 0.40 ~ m 0 FEMALE RATS a: Q. 0.30
0 MATCHED CONTROL
0 LOWDDSE 0.20 0 MIDDDSE
/:> HIGH DOSE
0.10
0.00 90 105 120
0 15 30 45 60 7S
TIME ON STUDY IWEEKSI
Figure 2. Survival Curves for Rats Fed Aroclor® 1254 in the Diet
17
at the doses used in this study, together with those of the
controls, are shown in figure 2.
For males, the result of the Tarone test for positive dose-
related trend in mortality over the period is significant (P <
0.001); 92% of the control, 83% of the low-dose, 58% of the mid-
dose, and 46% of the high-dose rats survived to the end of the
study. Among females, the Tarone test showed a probability level
greater than 0.05. In females, 67% of the control, 79% of the
low-dose, 83% of the mid-dose, and 71% of the high-dose rats
survived to termination of the study. Sufficient numbers of rats
of both sexes were available for meaningful statistical analyses
of the incidences of late-developing tumors.
C. Pathology
Histopathologic findings on neoplasms in rats are summarized in
Appendix A, tables Al and A2; findings on nonneoplastic lesions
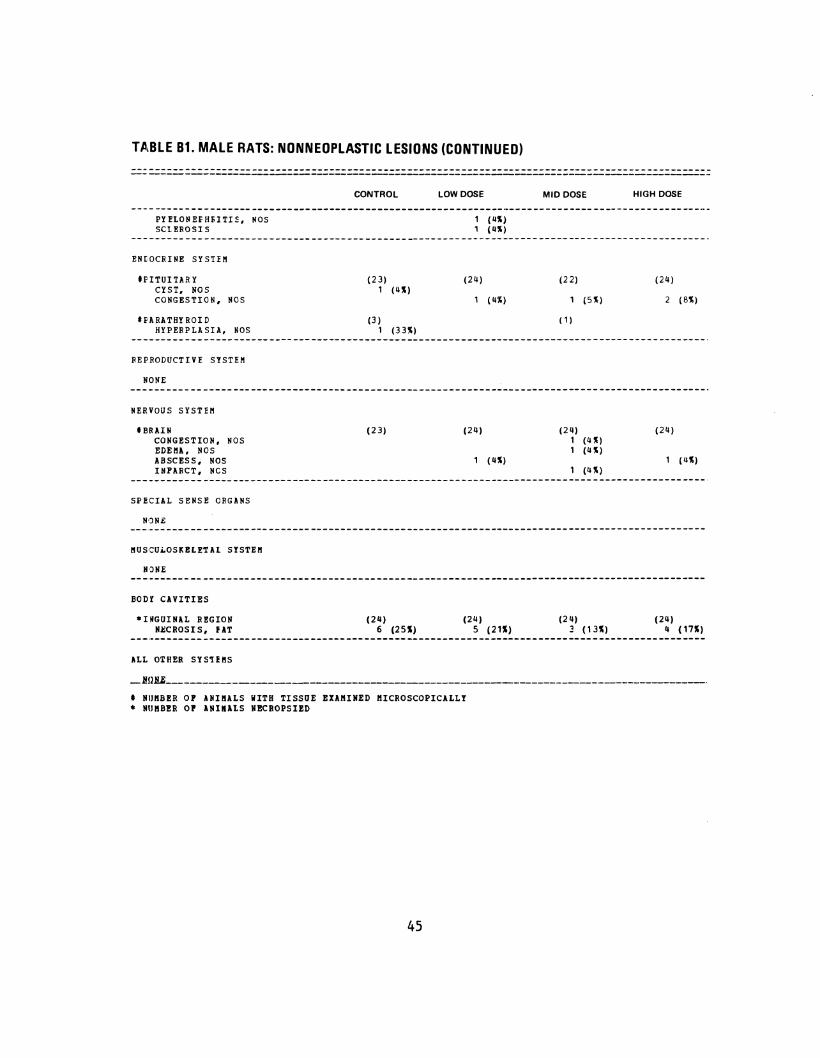
are summarized in Appendix B, tables B1 and B2.
A variety of neoplastic processes were observed in both the
control and treated rats, and, with the exception of the liver,
the incidences of these neoplasms were comparable in the control
and treated groups. Interstitial-cell tumors of the testes were
present in the majority of control and treated males. The next
most frequently observed neoplasm was leukemia of either the
18
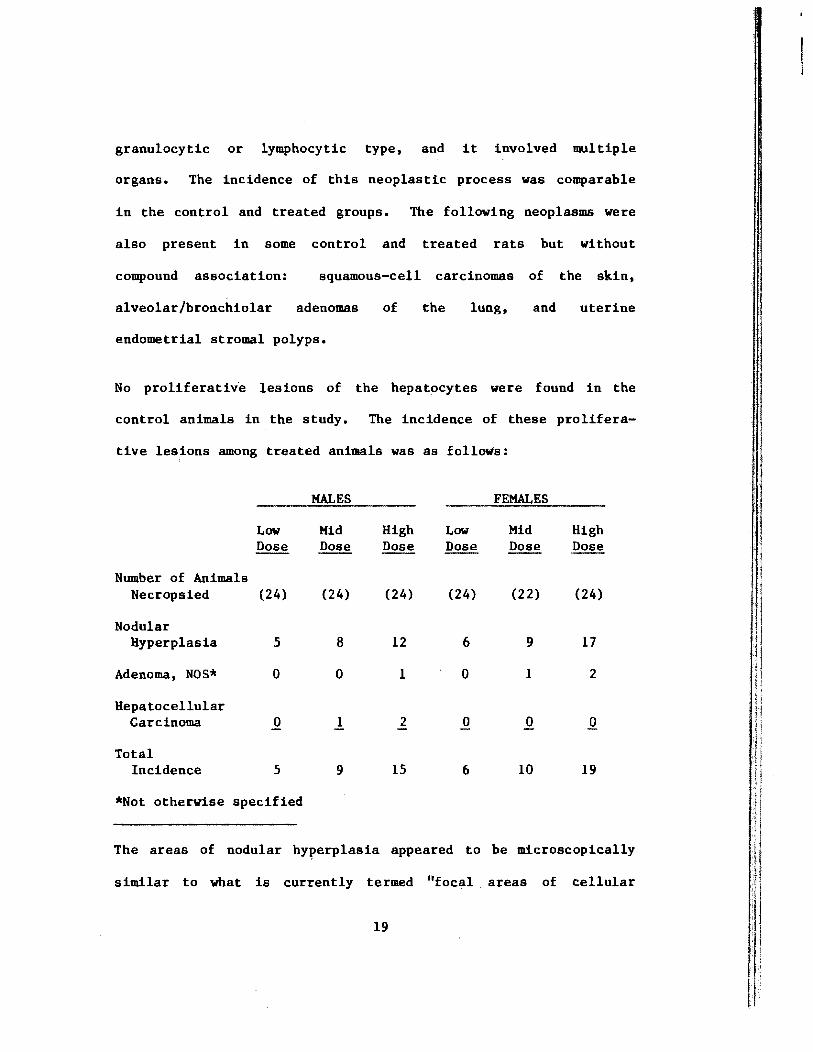
granulocytic or lymphocytic type, and it involved multiple
organs. The incidence of this neoplastic process was comparable
in the control and treated groups. The following neoplasms were
also present in some control and treated rats but without
compound association: squamous-cell carcinomas of the skin,
alveolar/bronchiolar adenomas of the lung, and uterine
endometrial stromal polyps.
No proliferative lesions of the hepatocytes were found in the
control animals in the study. The incidence of these prolifera-
tive lesions among treated animals was as follows:
Number of Animals Necropsied
Nodular Hyperplasia
Adenoma, NOS*
Hepatocellular Carcinoma
Total Incidence
Low Dose
(24)
5
0
.Q
5
*Not otherwise specified
MALES
Kid Dose
(24)
8
0
l
9
High Dose
(24)
12
1
2
15
Low Dose
(24)
6
0
0
6
FEMALES
Kid Dose
(22)
9
1
.Q
10
High Dose
(24)
17
2
.Q
19
The areas of nodular hy~erplasia appeared to be microscopically
similar to what is currently termed "focal areas of cellular
19
alteration" (Squire and Levitt, 1975). Neither this lesion nor
any hepatocellular adenomas or carcinomas were diagnosed in the
controls. The hepatocellular carcinomas were characterized
microscopically by large foci of proliferating hepatocytes
involving several lobules. These hepatocytes were bizarre in
appearance, sometimes containing two or more nuclei. The
sinusoidal architecture was lost, and frequently mitotic figures
were present. These neoplasms compressed the surrounding normal
liver tissue, and the cell plates usually were three to five
cells in thickness. The hepatocellular adenomas were character
ized by large foci involving several lobules of swollen, severely
vacuolated hepatocytes still maintaining the general sinusoidal
architecture of the liver. In general, the foci of nodular
hyperplasia involved two or more hepatic lobules and contained
hepatocytes whose tinctorial properties were distinctly different
from those of the surrounding liver tissue. Occasionally, these
foci would contain severely vacuolated hepatocytes, and in some
instances, there were small foci of basophilic hepatocytes.
The results of the histopathologic examination indicate that the
administration of Aroclor® 1254 at the three doses used in this
study had an effect with respect to proliferative lesions of the
liver and gastrointestinal tract. There were three hepatocellular
carcinomas in male rats and a dose-related increase in
20
nodular hyperplasia in both the male and female animals. There
was one carcinoma and four adenocarcinomas in the gastrointes
tinal tract of treated rats. These neoplastic lesions are seen
only sporadically and at a low incidence in the Fischer 344 rat;
in this study no lesions of these types were diagnosed in either
the male or female controls.
D. Statistical Analyses of Results
Tables C1 and C2 in Appendix C contain the statistical analyses
of the incidences of those primary tumors that occurred in at
least two animals in one group and with an incidence of at least
5% of one or more treated groups.
In male rats, the results of the Cochran-Armitage test for
positive dose-related trend in the incidences of leukemia and of
combined leukemia and lymphoma are significant (P = 0.022 and P =
0.009, respectively). The corresponding results of the Fisher
exact test, however, are not significant in any treated group
when compared with the controls. There is no other incidence of
tumors at any specific site in either sex which is statistically
significant. A significant Cochran-Armitage trend in the negative
direction is observed in the incidence of interstitial-cell tumor
of the testis, where the incidence in the controls exceeds those
in the mid- and high-dose groups.
21
In each of the 95% confidence intervals of relative risk, shown
in the tables, the value of one is included; this indicates the
absence of significant positive results. It should also be noted
that each of the intervals has an upper limit greater than one,
indicating the theoretical possibility of the induction of tumors
by Aroclor® 1254, which could not be detected under the
conditions of this test.
22
IV. DISCUSSION
At the doses used in this bioassay, Aroclor® 1254 was toxic to
both male and female Fischer 344 rats, as shown by the dose-
related depression of mean body weights and the clinical signs
which occurred during the second year. Mean body weights of mid-
and high-dose males and of all treated females were consistently
lower than those of the corresponding controls after the initial
growth phase. An intercurrent respiratory infection at week 30
resulted in temporary weight loss, but no deaths, in all groups
including the controls; the animals later recovered without
treatment. Clinical signs including alopecia, amber-colored
urine, facial edema, exophthalmos, and cyanosis occurred in the
high-dose groups beginning at week 72 and in the mid-dose groups
at week 104. Survival among males, but not among females, showed
a significant dose-related trend. Adequate numbers of animals of
both sexes survived for meaningful statistical analyses of the
incidences of tumors.
The combined incidences of lymphoma and leukemia in males were
significant (controls 3/24, low-dose 2/24, mid-dose 5/24, high-
dose 9/24, P = 0.009), using the Cochran-Armitage test for
positive dose-related trend, but not in females (controls 4/24,
low-dose 6/24, mid-dose 6/24, high-dose 6/24). Since the results
of the Fisher exact test for increased incidence were not
23
significant for any of these groups, the occurrence of these
lesions cannot clearly be related to the administration of
Aroclor® 1254.
Hepatocellular changes including hyperplastic nodules, adenomas,
and carcinomas were found in treated animals, but none of these
lesions were found in control animals in this study. Hepato
cellular carcinomas were observed in one mid-dose and two high-
dose males, and hepatocellular adenomas were observed in one
high-dose male, one mid-dose female, and two high-dose females.
Nodular hyperplasia was diagnosed with a dose-related frequency
in the low-, mid-, and high-dose male and female rats. Although
the incidences of the tumors were not significant, the occurrence
of these proliferative lesions appeared to be related to
treatment.
In the stomach, jejunum, or cecum, adenocarcinomas were observed
in two treated males and in two treated females as well as a
carcinoma in one treated male. None of these lesions was found in
control animals in this study, suggesting that the lesions —
although not statistically significant — may be related to the
administration of Aroclor® 1254.
The toxicity of polychlorinated biphenyls (PCBs) has been
reviewed by several groups, including the Environmental
24
Protection Agency (1976), National Research Council (1976), Panel
on Hazardous Trace Substances (1972), and International Agency
for Research on Cancer (1974). Kimbrough et al. (1972)
demonstrated hepatic adenofibrosis in male and female Sherman
rats fed Aroclor® 1254 at up to 500 ppm for 8 months. A similar
PCB, Kanechlor® 500, fed for 12 months to male Wistar rats,
induced nodular hyperplasia at doses of 100-1,000 ppm; at 1,000
ppm, cholangiofibrosis also was induced (Ito et al., 1974).
Keplinger et al. (1971; see also EPA Criteria Document PCBs,
1976) fed Charles River rats up to 100 ppm Aroclor® 1254 for 24
months and reported originally that there was no significant
increase in hepatic tumors in this study; re-evaluation of the
liver slides, however, indicated a significant incidence of
nodular hyperplasia in treated rats, compared with controls. Ito
et al. (1973) observed nodular hyperplasia and well-
differentiated hepatocellular carcinoma in male strain dd mice
fed 500 ppm Kanechlor® 500 for 8 months, and Kimbrough and Linder
(1974) observed adenofibrosis and hepatomas in BALB/cJ mice fed
300 ppm ® Aroclor 1254 for 11 months.
In a study of a closely related PCB, Kimbrough et al. (1975)
observed hepatocellular carcinomas in female Sherman rats fed 100
ppm Aroclor® 1260 for 21 months.
It is concluded that under the conditions of this bioassay,
25
Aroclor® 1254 was not carcinogenic in Fischer 344 rats; however,
a high incidence of hepatocellular proliferative lesions in both
male and female rats was related to treatment. In addition, the
carcinomas of the gastrointestinal tract may be associated with
treatment in both males and females.
26
V. BIBLIOGRAPHY
Armitage, P., Statistical Methods in Medical Research, John Wiley & Sons, Inc., New York, 1971, pp. 362-365.
Berenblum, I. , ed. , Carcinogenicity Testing: A Report of the Panel on Carcinogenicity of the Cancer Research Commission of the UICC, Vol. 2.. International Union Against Cancer, Geneva, 1969.
Broadhurst, M. G. , Use and replaceability of polychlorinated biphenyls. Environ. Health Perspect. 2;81-102, 1972.
Cox, D. R. , Regression models and life tables, J. R. Statist. Soc. B34(2):187-220. 1972.
Cox, D. R., Analysis of Binary Data, Methuen & Co., Ltd., London, 1970, pp. 48-52.
Environmental Protection Agency, Polychlorinated Biphenyls (PCBs). Toxic Substances Control. Federal Register 42(100), 26564-26577, 1977.
Environmental Protection Agency, Criteria Document PCBs, U. S. Government Printing Office, Washington, D. C., 440/9-76-021.
Finklea, J., Priester, L. E., Creason, J. P., Hauser, T., Hinners, T., and Hammer, D. I., Polychlorinated biphenyl Residues in human plasma expose a major urban pollution problem. AJPH 62(5);645-651. 1972.
Gart, J. J., The comparison of proportions: a review of significance tests, confidence limits and adjustments for stratification. Rev. Int. Stat. Inst. 39(2);148-169. 1971.
Hubbard, H. L., Chlorinated biphenyl and related compounds. Kirk-Othmer Encyclopedia of Chemical Technology. Vol. _5, Interscience Publishers, New York, 1964, pp. 289-297.
International Agency for Research on Cancer, Some anti-thyroid and related substances, nitrofurans and industrial chemicals. IARC Monographs on the Evaluation of theCarcinogenic Risk of Chemicals to Man; Vol. _7, World Health Organization, Geneva, 1974, pp. 261-289.
27
Ito, N. , Nagasaki, H., Makiura, S., and Aral, M., Histopathological studies on liver tumorigenesis in rats treated with polychlorinated biphenyls. Gann 65 (6):545-549, 1974.
Ito, N. , Nagasaki, H. , Arai, M., Makiura, S., Sugihara, S., and Hirao, R. , Histopathologic studies on liver tumorigenesis induced in mice by technical polychlorinated biphenyls and its promoting effect on liver tumors induced by benzene hexachloride. J. Natl. Cancer Inst. 51(5); 1637-1642, 1973.
Kaplan, E. L. and Meier, P. , Nonparametric estimation from incomplete observations. J. Amer. Statist. Assoc. 53:457481, 1958.
Keplinger, M. L. , Fancher, 0. E. , and Calandra, J. C.,Toxicologic studies with polychlorinated biphenyls. Toxicol. Appl. Pharmacol. 19(2);402-403, 1971.
Kimbrough, R. D., Squire, R. A., Linder, R. E., Strandberg, J. D. , Montali, R. J. , and Burse, V. W., Induction of liver tumors in Sherman strain female rats by polychlorinated biphenyl Aroclor 1260. J. National Canc. Inst. 55(6); 14531456, 1975.
Kimbrough, R. D. and Linder, R. E., Induction of adenofibrosisand hepatomas of the liver in BALB/cJ mice by polychlorinated biphenyls (Aroclor 1254). J. Natl. Cancer Inst. 53(2);547-552. 1974.
Kimbrough, R. D. , Linder, R. E. , and Gaines, T. B., Morphological changes in livers of rats fed polychlorinated biphenyls. Arch. Environ. Health 25;354-364. 1972.
Linhart, M. S., Cooper, J. A., Martin, R. L., Page, N. P., and Peters, J. A., Carcinogenesis bioassay data system. Comp.and Biomed. Res. 7;230-248, 1974.
Miller, R. G. , Jr., Simultaneous Statistical Inference, McGraw-Hill Book Co., New York, 1966, pp. 6-10.
National Research Council, Report of Organic Contaminants (unpublished), National Research Council, Assembly of Life Sciences, Washington, D.C., 1976.
28
Panel on Hazardous Trace Substances, Polychlorinated biophenylsenvironmental impact. Environ. Res. _5:249-362, 1972.
Poffenberger, N. and Hubbard, H. L. , Diphenyl and terphenyls. Kirk-Othmer Encyclopedia of Chemical Technology, Vol. 1Interscience Publishers, New York, 1965, p. 193.
Saffiotti, U., Montesano, R., Sellakumar, A. R. , Cefis, F. , andKaufman, D. G., Respiratory tract carcinogenesis in hamsters induced by different numbers of administrations of benzo(a) pyrene and ferric oxide. Cancer Res 32:1073-1081, 1972.
Squire, R. A. and Levitt, M. H., Report on a workshop onclassification of specific hepatocellular lesions in rats.Cancer Res. 35:3214-3223. 1975.
Tarone, R. E., Tests for trend in life table analysis. Biometrika 62(3):679-682. 1975.
29

APPENDIX A
SUMMARY OF THE INCIDENCE OF NEOPLASMS
IN RATS FED AROCLOR® 1254 IN THE DIET
31

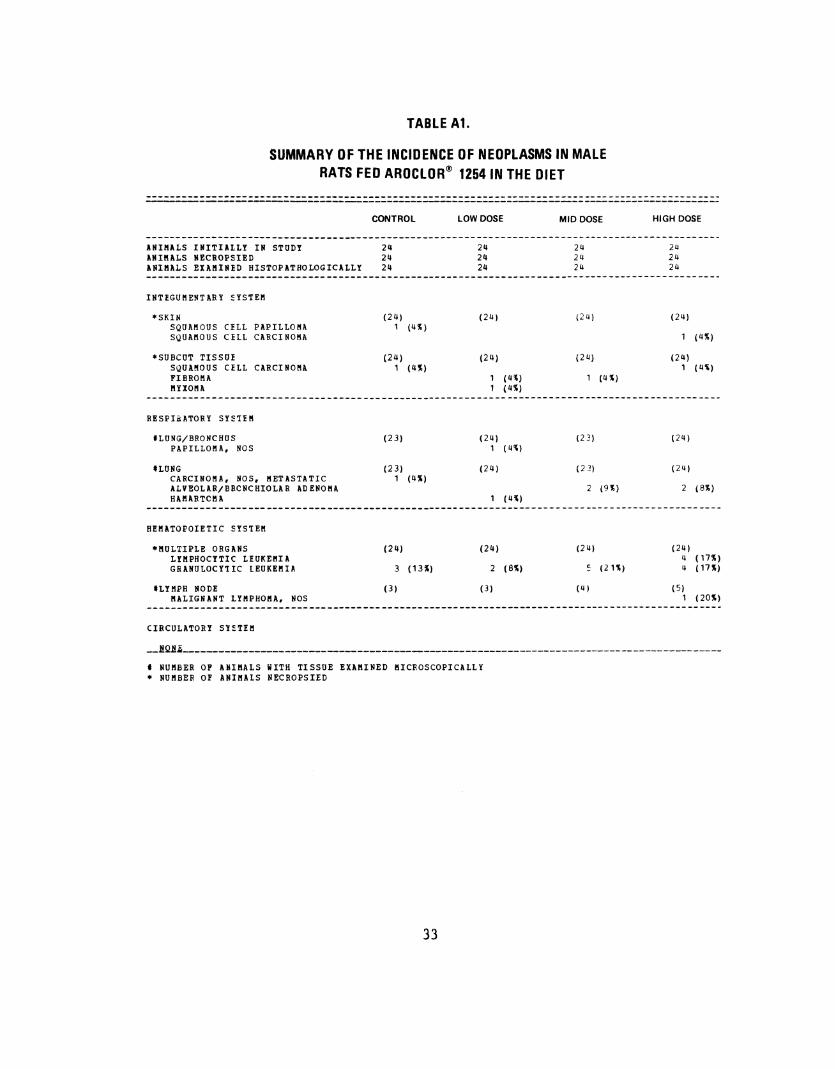
TABLE A1.
SUMMARY OF THE INCIDENCE OF NEOPLASMS IN MALE RATS FED AROCLOR® 12541N THE DIET
--------------------------------------------------------------------------------------------------------------------------------------------------~------------------------------
ANIMALS INITIAlLY IN STUDY ANIMALS NECROPSIED ANIMALS EXAMINED HISTOPATHOLOGICALLY
INTEGUMENTARY ~YS~EM
*SKIN SQUAMOUS CELL PAPILLOMA SQUAIIOU S C HL CARCINOMA
*SUBCOT TISSUE SQUA!IOUS CELL CARCINOMA FIBROMA MYXOMA
RESPiaATORY SY~!EM
HUNG/BRONCHUS PAPILLOMA, NOS
HUNG CARCINOMA, NOS, METASTATIC ALVEOLAR/BRCNCHIOLAR ADENOMA HAI'lARTCMA
HEMATOPOIETIC SYS!EM
*MULTIPLE ORGANS LYMPHOCYTIC LEUKEMIA GRANULOCY!IC LEUKEMIA
tLYMl?H NODE MALIGNANT lYMPHOMA, NOS
CIRCULATORY SY~TEII
CONTROL
24 24 24
(2l!) 1
(24) 1
(23)
(23)
(l!%)
(4%)
1 (4%)
(24)
3 (13%)
(3)
LOW DOSE
24 24 24
(24)
(24)
1 1
(24)
(4\) (4%)
1 (4~)
(24)
1 (4")
(24)
2 (8%)
(3)
MID DOSE
24 24 24
(2 4)
(2 4)
1
(2 3)
(2 3)
(24)
~
(4)
(4%)
(9%)
(2U)
HIGH DOSE
24 24 24
(2l!)
1
(24) 1
(24)
(2l!)
(4%)
(4%)
2 (8%)
(24) 4 ( 17%) 4 (17%)
(5) 1 ( 20%)
__ !QB~------------------------------------------------------------------------------------------t NUMBER OF ANIMALS WITH TISSUE EXAMINED MICROSCOPICALLY * NUMBER OF ANIMALS NECROPSIED
33
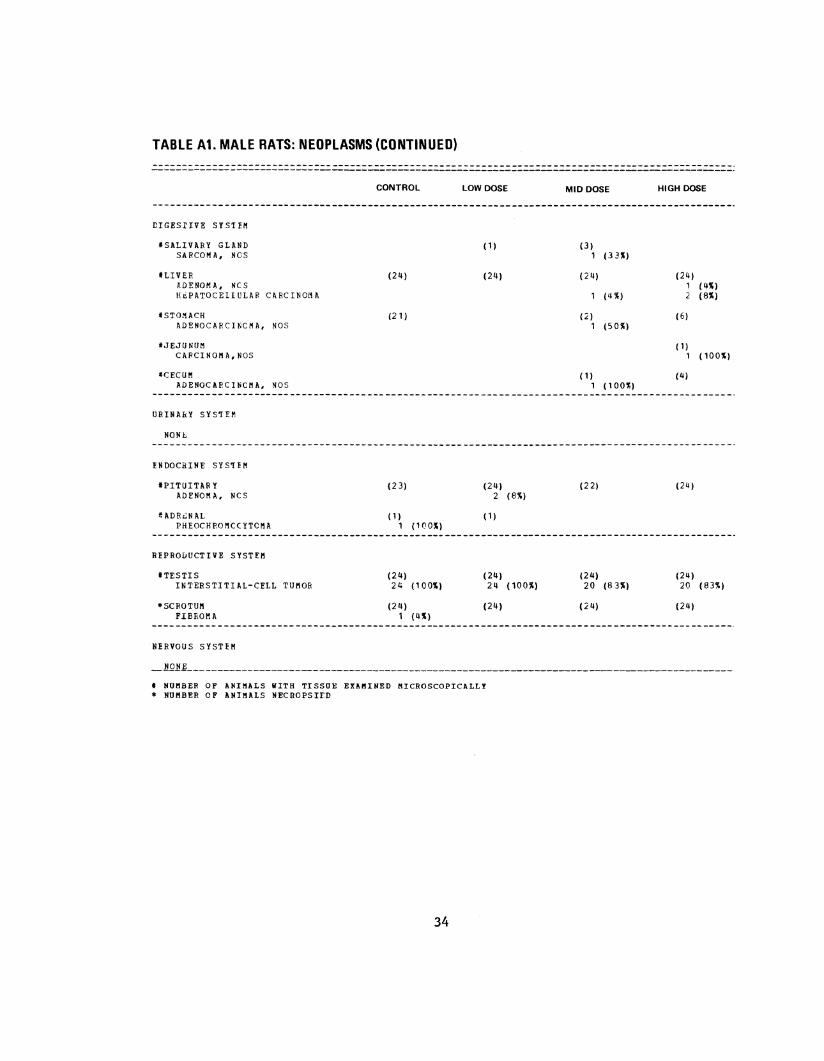
TABLE A1. MALE RATS: NEOPLASMS (CONTINUED)
DIGESriVE SYSTEM
.SALIVARY GLAND SARCOMA, NOS
HIVER P.DENOMA, NCS HePATOCEllULAR CARCINOMA
iSTOIIACH ADENOCARCINOMA, NOS
iJEJU NUM CA!1CINOMA,NOS
ICECU!I ADENOCAPCINCMA, NOS
URINAI<Y SYS'IEM
NONL
ENDOCRINE SYS'IEM
UITUITAR Y ADENOMA, NCS
HDReNAL PHEOCHP.OMCCYTCMA
REPROuUCTIVE SYSTEM
tTESTIS INTERSTITIAL-CELL TUMOR
*SCROTUM FIB!iOM A
NERVOUS SYSTEM
CONTROL
(24)
(21)
(2 3)
( 1) 1 (, (\ 0%)
(24) 24 (1 00%)
(24) 1 ( 4%)
LOW DOSE MID DOSE
( 1) (3) 1 (33:l)
(24) ( 24)
(4%)
(2) 1 (SOli)
( 1) 1 ( 1 00%)
(24) (22) 2 (8%)
( 1)
(24) (24) 24 (100%) 20 (8 3%)
(24) (24)
HIGH DOSE
(24) 1 ( 4") 2 (8")
(6)
( 1) 1 ( 100")
(4)
(24)
(24) 20 (83%)
(24)
_.!!Q.!!Jl __________________________________________________________________________________ _
t NUMB~R OF ANIMALS WITH TISSUE EXAMINED MICROSCOPICALLY * NU!IBER OF ANIMALS NECROPSIED
34
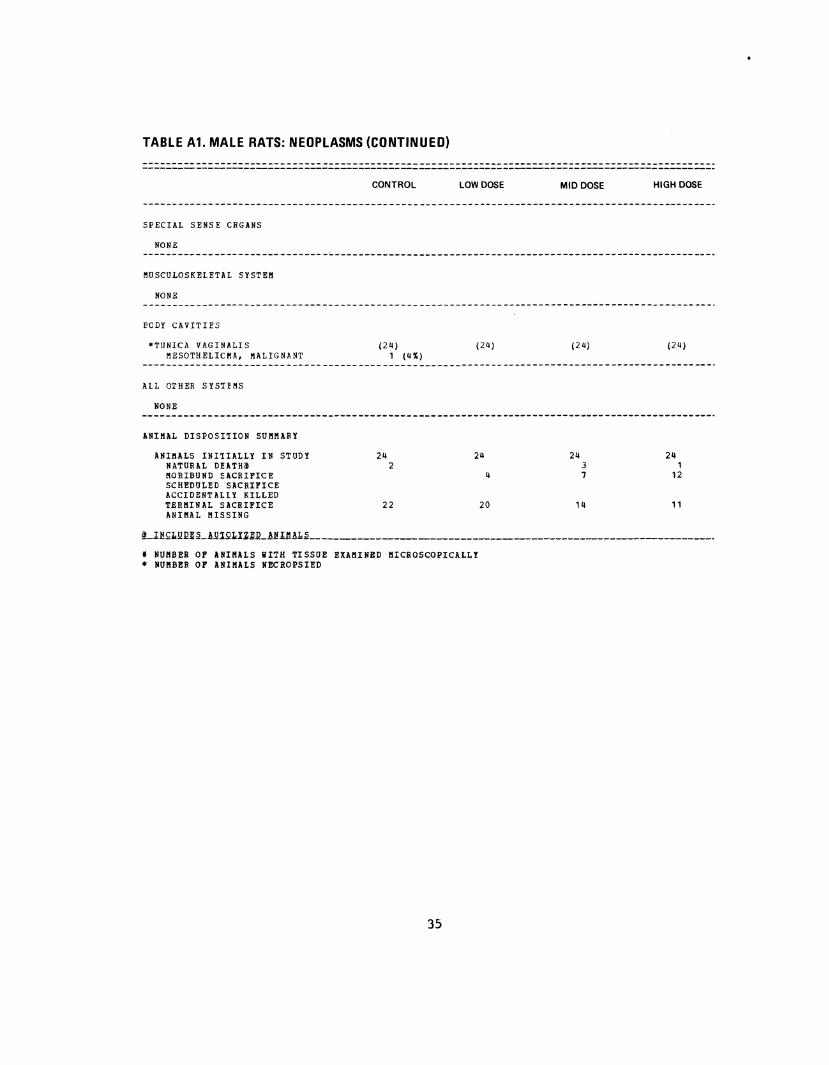
TABLE A1. MALE RATS: NEOPLASMS (CONTINUED)
CONTROL LOW DOSE MID DOSE HIGH DOSE
SPECIAL SENSE CRGANS
NONE ------------------------------------------------------------------------------------------------~USCULOSKELETAL SYSTEft
NONE
ECDY CAVITIES
*TUNICA VAGINALIS ~ESOTHELICMA, ~ALIGNANT
ALL OTHER SYSTE~S
NONE
ANiftAL DISPOSITION SUft~ARY
ANiftALS INITIALLY IN STUDY NATURAL DUTHil ftORIBUMD SACRIFICE SCHEDULED SACRIFICE ACCIDENTALlY KILLED TERMINAL SACRIFICE ANIMAL MISSING
(24) 1 (4")
24 2
22
(24) (24) (24)
24 24 24 3 1
4 7 12
20 14 11
ilJl!£1.!l~l<lLA.!!lilUM.Il.ILAl!I.I!U~---------------------------------------------------·
t NUMBER OF ANIMALS WITH TISSUE EXAftiNBD MICROSCOPICALLY * NUMBER OF ANIMALS NECROPSIED
35
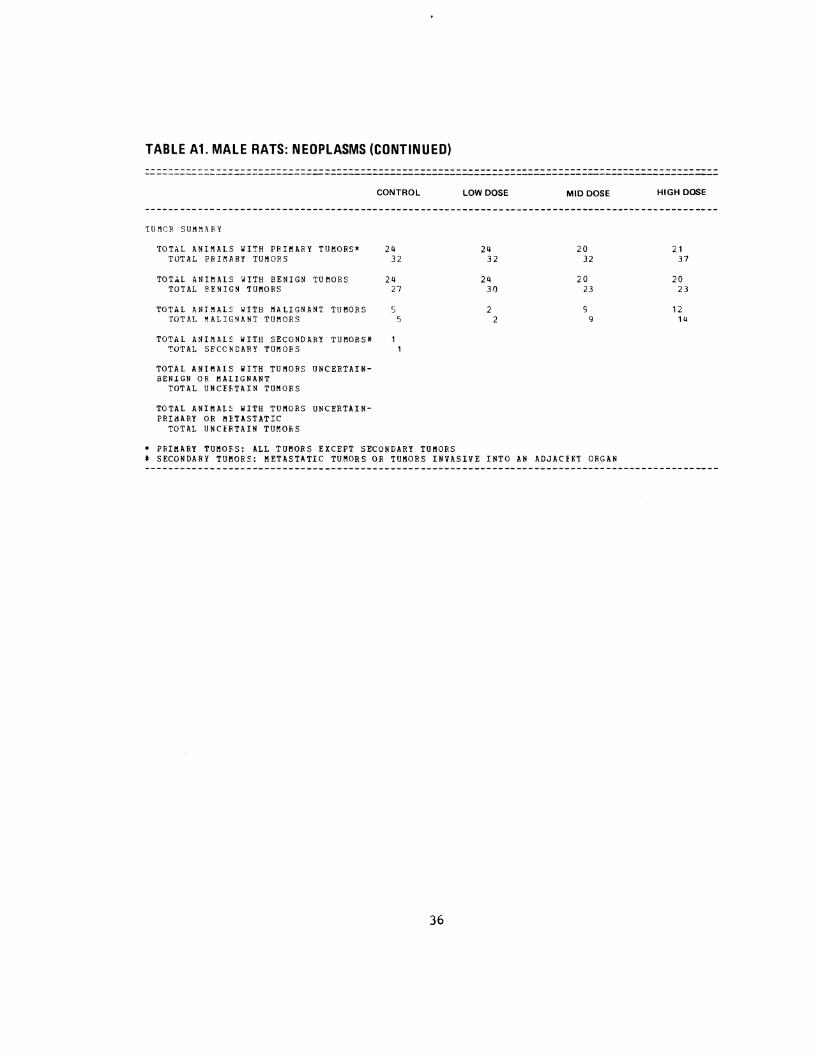
TABLE A1. MALE RATS: NEOPLASMS (CONTINUED)
CONTROL
TUMCR SUIIM.~RY
TOT~L ANIMALS WITH PRIMARY TUMORS* 24 TOTAL PRIMARY TUMORS 32
TOTAL ANIMALS WITH BENIGN TUMORS 24 TOTAL EENIGN TUMORS 27
TOTAL ANIMALc WITH MALIGNANT TUMORS ~
TOTAL MALIGNANT TUMORS 5
TOTAL ANIMAL~ WITH SECONDARY TUMORS# TOTAL SECCNCARY TUMORS
TOTAL ANIMAlS WITH TUMORS UNCERTAINBENIGN OR MALIGNANT
TOTAL UNCE~TAIN TUMORS
TOTAL ANIMAl~ WITH TUMORS UNCERTAINPRidARY OR METASTATIC
TOTAL UNCERTAIN TUMO&S
* PRIMARY TUMO~S: ALL TUMORS EXCEPT SECONDARY TUMORS
LOW DOSE MID DOSE
24 20 32 32
24 20 30 23
2 9 2 9
J SECONDARY TUMORS: METASTATIC TUMORS OR TUMORS INVASIVE INTO AN ADJACE~T ORGAN
36
HIGH DOSE
21 37
20 23
12 14
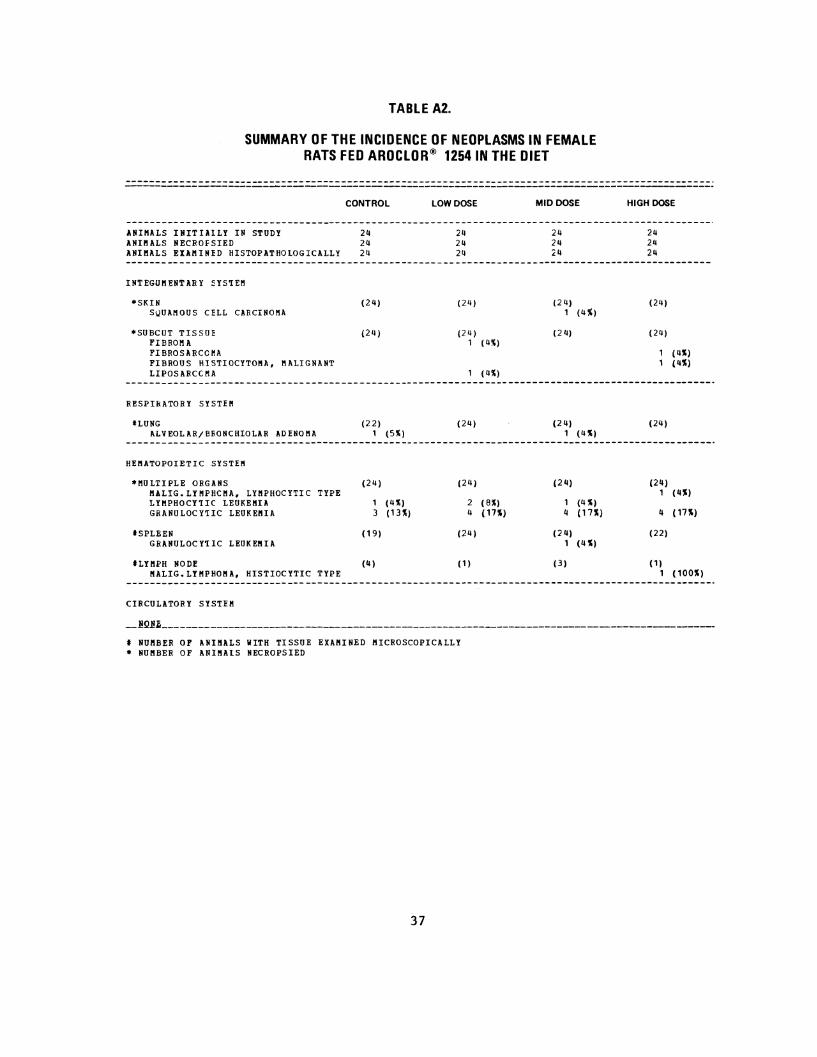
TABLE A2.
SUMMARY OF THE INCIDENCE OF NEOPLASMS IN FEMALE RATS FED AROCLOR® 1254 IN THE DIET
ANIMALS INITIAlLY IN STUDY ANIMALS NEC~OFSIED ANIMALS EXAMINED HISTOPATHOLOGICALLY
INTEGUIIENTA~Y SYS~EII
*SKIN S~UAMOUS CELL CARCINOMA
CONTROL
24 24 24
(24)
*SUBCUT TISSUE (24) FIBROMA FIBROSA~CCMA
FIBROUS HISTIOCYTOMA, MALIGNANT LIPOSA~CCIIA
~ESPIRATORY SYSTEM
HUNG ALVEOLAR/BRONCHIOLAR ADENOMA
HEIIATOPOIETIC SYSTEM
*MULTIPLE ORGANS MALIG.LYMPHCMA, LYMPHOCYTIC TYPE LYIIPHOCY!IC LEUKEMIA GRANULOCYiiC LEUKEMIA
I SPLEEN GRANULOCYiiC LEUKEMIA
ILYMPH NODE MALIG.LYMPHOMA, HISTIOCYTIC TYPE
CI~CULATORY SYSTEM
(22) 1 (5%)
(24)
1 ( 4 %) 3 ( 13 %)
( 19)
(4)
LOW DOSE
24 24 24
(24)
(24) 1
1
(24)
(24)
2 4
(24)
( 1)
(4~)
(4%)
( 8%) ( 1H)
MID DOSE
24 24 24
(24) 1
(24)
(24)
(4%)
1 ( 4 %)
(2 4)
1 (4 %) 4 ( 17%)
(24) 1 (4 %)
(3)
HIGH DOSE
24 24 24
(24)
(24)
1 1
(24)
(24) 1
4
(22)
( 1) 1
(4%) (4%)
(4%)
( 17%)
( 100%)
_l!Q.!!l; ___________________________________________________________________________ _
t NUMBE~ OF ANIMALS WITH TISSUE EXAMINED MICROSCOPICALLY * NUMBER OF ANIMAlS NECROPSIED
37
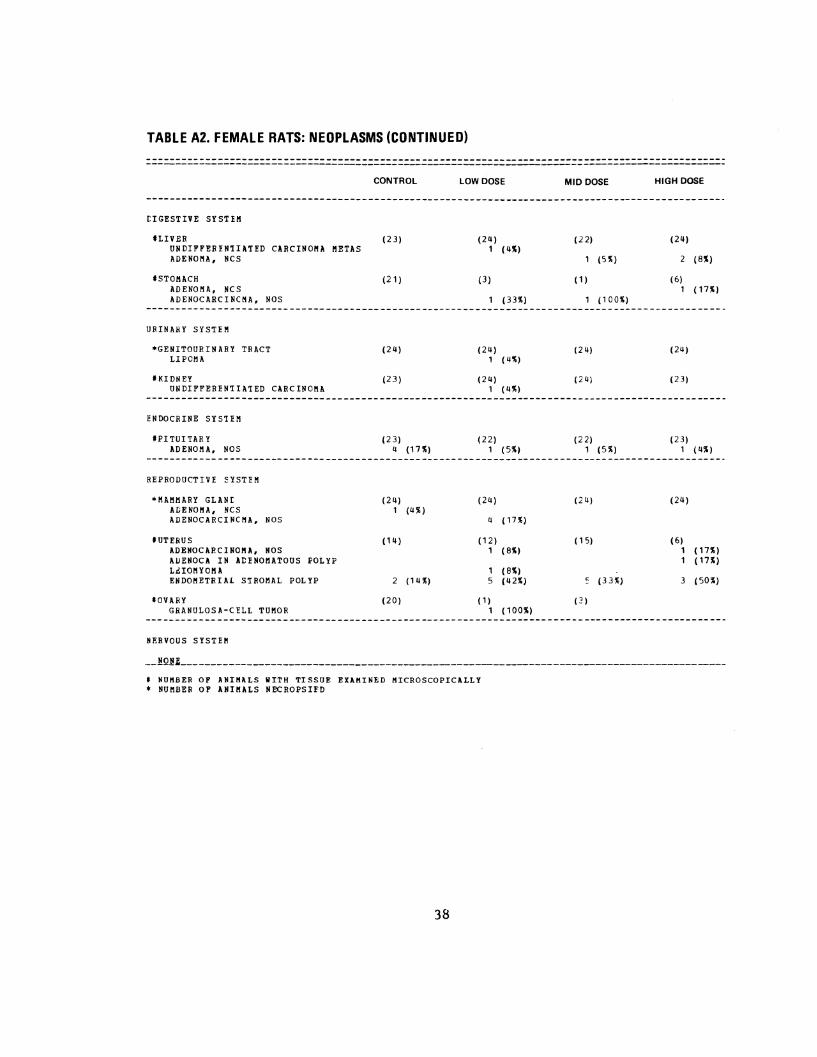
TABLE A2. FEMALE RATS: NEOPLASMS (CONTINUED)
CIGESTIVE SYSTEM
tLIV ER UNDIFFEREN!IATED CARCINOMA META$ ADENOMA, NCS
I STOMACH ADENOMA, NCS ADENOCARCINCIIA, NOS
URINARY SYSTEM
*GENITOURINARY TRACT LIPOMA
IKIDNEY UNDIFFEREN!IATED CARCINOMA
ENDOCRINE SYSTEM
~PITUITARY ADENOIIA, NOS
REPRODUCTIVE ~YSTEII
*IIAIIIIARY GLANt A DE NOll A, NCS ADENOCARCINCIIA,
I UTERUS ADENOC AP. C I NOll A,
NOS
NOS AUENOCA IN AtENOIIATOUS L.;IOI!YOI!A
POLYP
ENDOIIETRIA1 STROMAL POLYP
tOVARY GRANULOSA-CELL TUMOR
NERVOUS SYSTEI!
CONTROL LOW DOSE
(2 3) (24) 1 (4%)
(21) (3)
(33%)
(2 4) (24) 1 ( 4%)
(23) (2 4) 1 ( 4%)
(23) (22) 4 (17%) 1 (5%)
(24) (24) 1 (4%)
4 ( 17%)
( 14) (12) 1 ( 8%)
1 (8%) 2 ( 14 %) 5 { 42%)
(20) ( 1) 1 ( 100%)
MID DOSE HIGH DOSE
(22) (24)
(5%) 2 (8%)
( 1) (6) 1 ( 17%)
(1 00%)
(24) (24)
(2 ~} (2 3)
(2 2) (23) 1 (5%) 1 (4%)
(2 4) (24)
( 1 5) ( 6) 1 ( 17%) 1 ( 17%)
(33%) 3 (50%)
( 3)
__ !Q!~-------------------------------------------------------------------------------------------t NUMBER OF ANIMALS WITH TISSUE EXAMINED MICROSCOPICALLY * NUIIBER OF ANII!ALS NECROPSIED
38
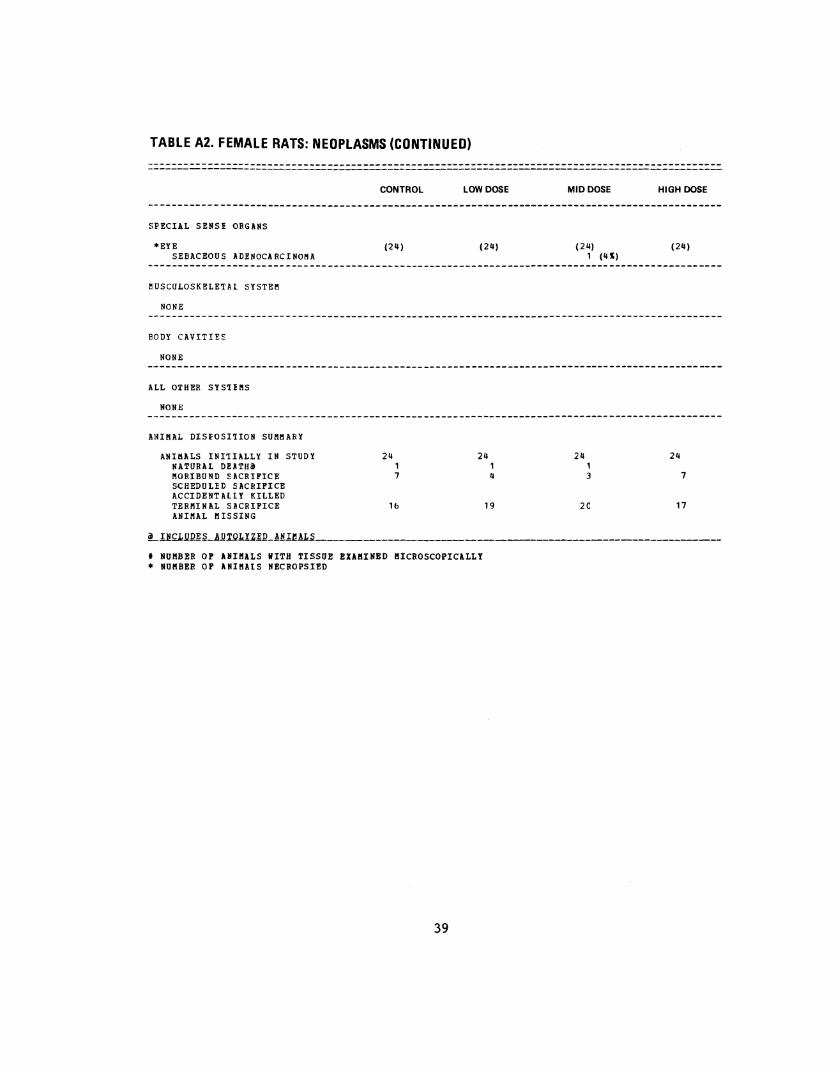
TABLE A2. FEMALE RATS: NEOPLASMS (CONTINUED)
·-----------------------------------------------------------------------------------------------·--------------------------------------------------------------------------· CONTROL LOW DOSE MID DOSE HIGH DOSE
SPECIAL SENSE ORGANS
*EYE (211) (211) (211) (24) SEBACEOUS ADENOCARCINOMA 1 (4 I)
~USCULOSKELETAL SYSTEM
NONE
BODY CAVITIES
NONE
ALL OTHER SYST!MS
NONE
ANIMAL DISFOSiiiON SUMMARY
ANIMALS INITIALLY IN STUDY 211 24 24 24 NATURAL D!ATHil 1 1 1 MORIBUND SACRIFICE 7 4 3 7 SCHEDULED SACRIFICE ACCIDENTALlY KILLED TERMINAL SACRIFICE 1b 19 2C 17 ANIMAL MISSING
Lll£1..l!~.LA.l!I.Q.Ll.U.Il_!llUL.S ______________________________________ _
t NUMBER OF ABIMALS liTH TISSUE EIAMIHBD ftiCROSCOPIClLLY * BOMBER OF ANIMAlS NECROPSIED
39
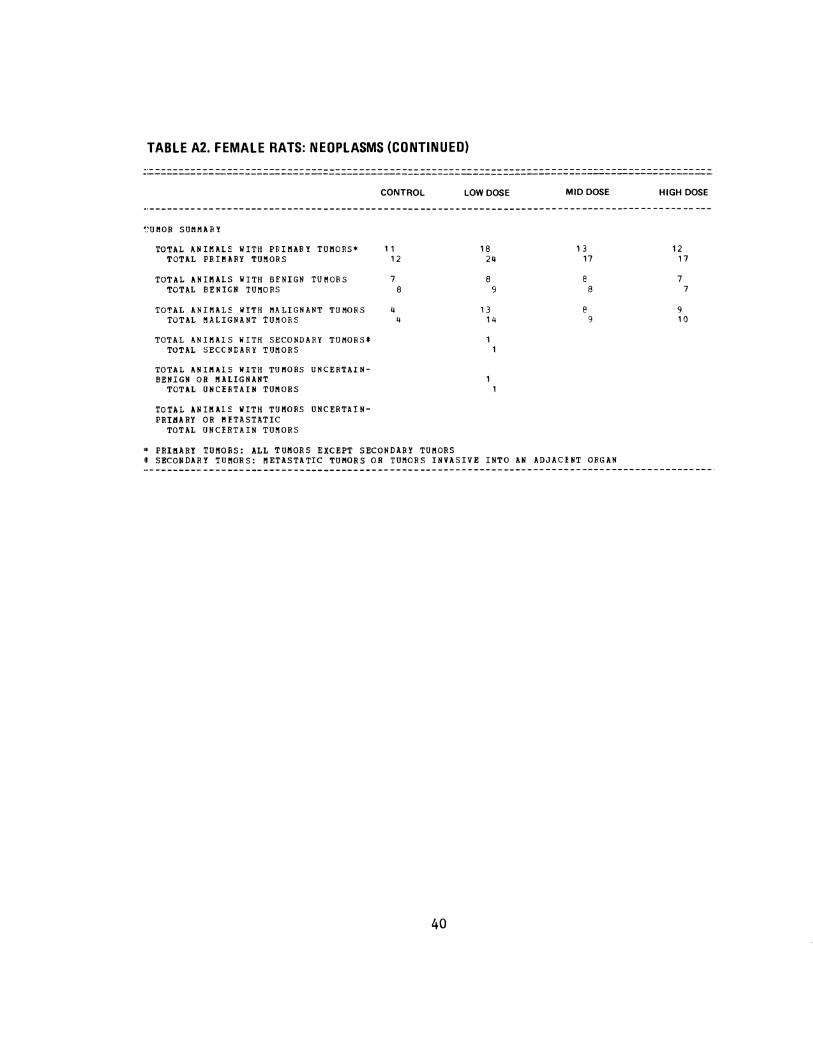
TABLE A2. FEMALE RATS: NEOPLASMS (CONTINUED)
··--------------------------------------------------------------------------------------------------------------------------------------------------------------------------------------------
~:UIIOR SUMMARY
TOTAL ANIMAlS WITH PFIMARY TUMORS* TOTAL PRIMARY TUMORS
TOTAL ANIMAlS WITH BENIGN TUIIORS TOTAL BENIGN TUMORS
TOTAL ANIMALS WITH MALIGNANT TUMORS TOTAL IIALIGNANT TUMORS
TOTAL ANIMAlS WITH SECONDARY TUMORS# TOTAL SECCNDARY TUMORS
TOTAL ANIMAlS WITH TUIIORS UNCERTAINBENIGN OR MALIGNANT
TOTAL UNCE~TAIN TUMORS
TOTAL ANIMAlS WITH TUMORS UNCERTAINPRIIIARY OR METASTATIC
TOTAL UNCERTAIN TUMORS
CONTROL
11 12
7 8
4 4
$ PRIIIARY TUMOES: ALL TUIIORS EXCEPT SECONDARY TUIIORS
LOW DOSE
18 24
8 9
13 14
1 1
1 1
MID DOSE
13 17
e 8
e 9
I SECONDARY TUIIORS: IIETASTATIC TUIIORS OR TUMORS INVASIVE INTO AN ADJACENT ORGAN
40
HIGH DOSE
12 17
7 7
9 10
APPENDIX B
SUMMARY OF THE INCIDENCE OF NONNEOPLASTIC LESIONS
IN RATS FED AROCLORQD1254 IN THE DIET
41

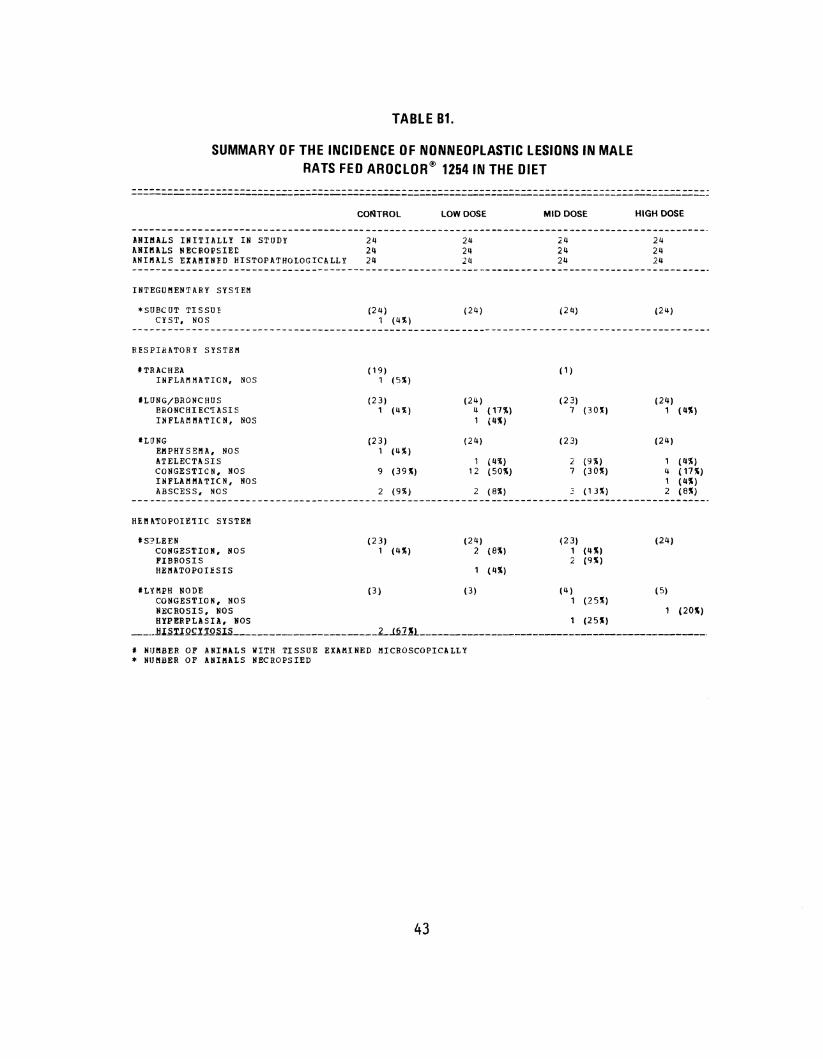
TABLE 81.
SUMMARY OF THE INCIDENCE OF NONNEOPLASTIC LESIONS IN MALE RATS FED ARDCLOR® 12541N THE DIET
ANIMALS INITIALLY IN STUDY ANIMALS NECBOPSIEC ANIMALS EXAMINED HISTOPATHOLOGICALLY
INTEGUMENTARY SYS1EM
*SUBCUT TISSUE CYST, NOS
RESPIRATORY SYSTEM
fTRACHEA INFLAMMATICN,
#LUNG/BRONCHUS BRONCHIEC'IASIS INFLAMMATICN,
HONG EIIPHYSEIIA, NOS ATELECTASIS
NOS
NOS
CONGESTION, NOS INPLAIIIIATICN, NOS ABSCESS, NOS
HEIIATOPOIE!IC SYSTEM
ts:?LEEN CONGESTION, NOS FIBROSIS HEIIATOPOHSIS
CONTROL
24 24 24
(24) 1 (4%)
(19) 1 (5%)
(23) 1 (4%)
(23) 1 (4%)
9 (39%)
2 (9%)
(23) 1 (4%)
LOW DOSE
24 24 24
(24)
(24) 4 1
(24)
1 12
2
(24)
( 17%) (4%)
(4'11.) (50%)
(8%)
2 ( 8%)
1 ( 4'11.)
MID DOSE
24 24 24
(2 4)
( 1)
(2 3) 7
(23)
2 7
(23)
(301{)
(9%) (3 0%)
( 1 311)
1 (4%) 2 (9'11.)
HIGH DOSE
24 24 24
(24)
(24) 1
(24)
1 4 1 2
(24)
(4'11.)
(4%) (1H) (4'11.) (811)
HHIPH NODE (3) (3) (4) (5) CONGESTION, NOS 1 (25'11.) NECROSIS, NOS (20'11.) HYPERPLASIA, NOS 1 (25'11.) _____ BL2IlQ£IlQ2l] ________________________ l_J&lll ________________________________________________ .
t NUMBER OF ANIMALS WITH TISSUE EXAMINED MICROSCOPICALLY * NIJIIBER OF ANIMALS NECROPSIED
43
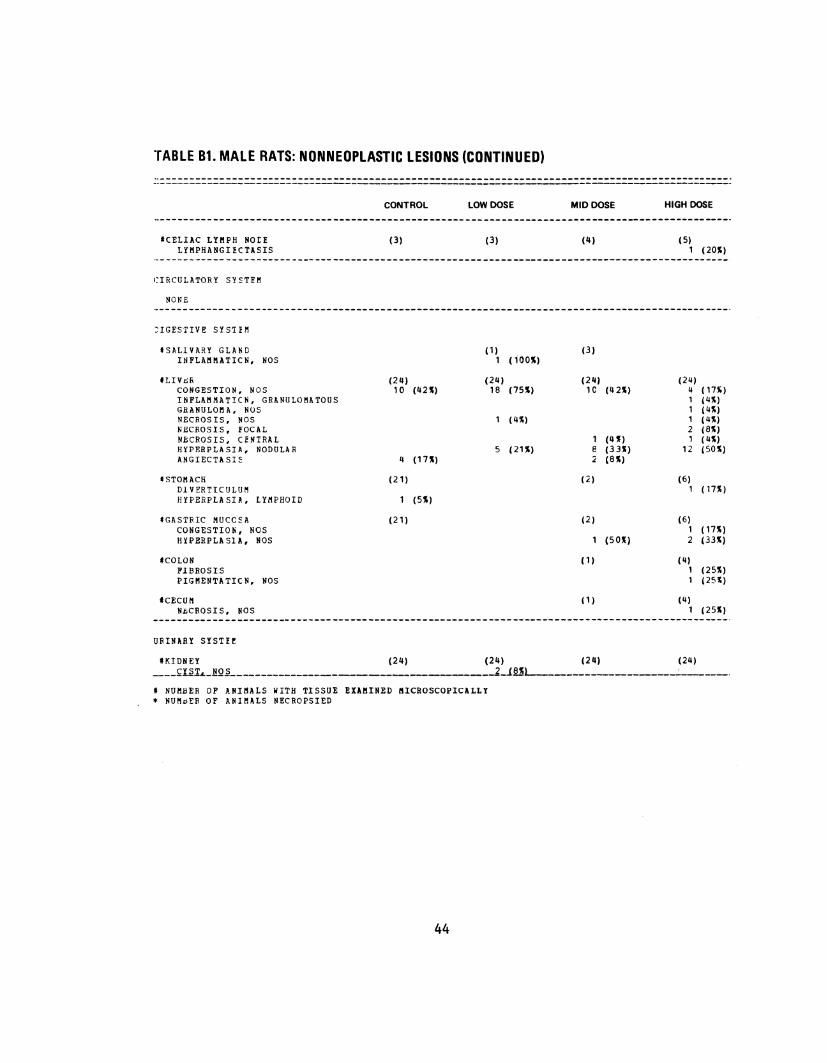
TABLE 81. MALE RATS: NONNEOPLASTIC LESIONS (CONTINUED)
··-----------------------------------------------------------------------------------------------4
tCELIAC LYftPH NOt! LYBPHANGI!CTASIS
CIRCULATORY S!~TFM
NONE
:IGESTIVE SYSTEM
tSALlVARY GLAND INFLAMMATICN, NOS
tLIV.r;& CONGESTION, NOS INFLAMMATICN, GRANULOMATOUS GRANULOMA, NOS NECROSIS, NOS NECROSIS, FOCAL N~CROSIS, CfNTRAL HYPERPLASIA, NODULAR ANGIECTASI~
I STOMACH Dl VERTICULUM HYPERPLASIA, LYftPHOID
tGASTRIC MUCC~A
CONGESTIOii, NOS HYPERPLASIA, NOS
tCOLON FIBROSIS PIGftENTATICN, NOS
tCECUft IUoCROSIS, NOS
URINARY SYSTH
CONTROL
(3)
(241 10 (42"1
II (1 7")
(2 11
1 (5"1
(2 1)
LOW DOSE
(3)
(11 1 ( 100"1
(241 18 (75"1
( 11"1
5 12a1
MID DOSE HIGH DOSE
(41 (51 1 (20"1
(31
(241 (2111 1C (112"1 " pn1
1 '""I 1 (I!"J 1 ( 11"1 2 (8")
1 (IIlii 1 I ""I e (33") 12 (SO"J 2 (8")
(21 (61 1 ( 17")
(2) (61 1 pnJ
(50!1) 2 (33"1
(11 (4) 1 (25"1 1 (2511)
Ill (4) 1 (25"1
tKIDIIEY (241 (241 (241 (24) ___ !;l.§.L._.!!.Q.§_ ______________________________ __l_jm!L.._ ______________ . ----·
t NUftBER OF ANIMALS WITH TISSUE EXAMINED MICROSCOPICALLY * NUM~ER OF ANIMALS NECROPSIED
44
TA.BLE 81. MALE RATS: NONNEOPLASTIC LESIONS (CONTINUED)
PYFLONEfHEITI~, NOS SClEROSIS
ENWCRINE SYSTEI!
IPITUITAR Y CYST, NOS CONGESTION, NOS
fFARATHYROID HYPERPLASIA, NOS
REPRODUCTIVE SYSTEI!
NONE
NERVOUS SYSTEI!
t BRAIN CONGESTION, NOS EDEI!A, NOS ABSCESS, NOS INFARCT, NCS
SPECIAL SENSE ORGANS
NONE
I!USCU~OSKEL!TAL SYSTEI!
BOOr CAVITIES
*IMGUINAL REGION N.t;CROSIS, HT
CONTROL LOW DOSE
, ( 4'11) , ( 4'11)
(23) (24) 1 (4%)
, (4'11)
(3) 1 (33%)
(23) (24)
1 (4%)
(24) (24) 6 (25%) 5 (21%)
MID DOSE
(22)
, (5:11)
(1)
(24) 1 (4ll) , (4'11)
1 (4:11)
(24) 3 (13%)
HIGH DOSE
(24)
2 (8%)
(24)
1 (4%)
(24) 4 ( 171)
_J!lll!l; ________________________________________________________________________ _
t NUMBER OF ANIMALS WITH TISSUE EXAI!INED I!ICROSCOPICALLY * NUMBER OP ANiltALS NECROPSIED
45
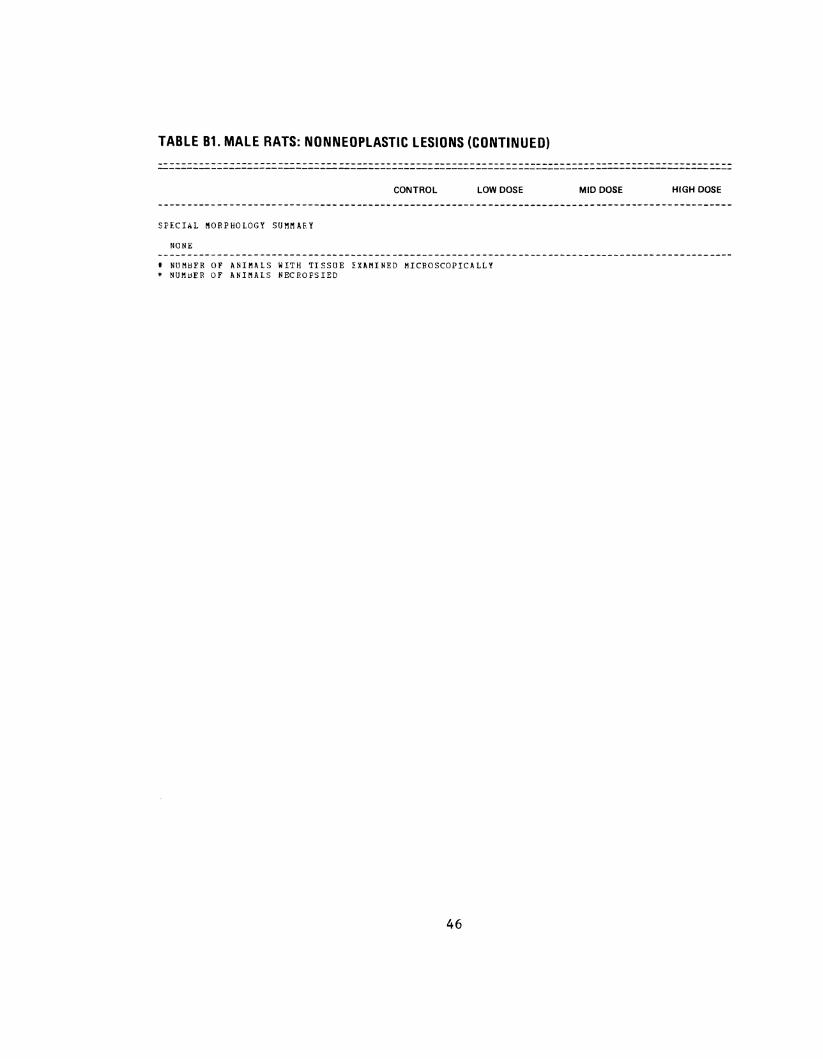
TABLE 81. MALE RATS: NONNEOPLASTIC LESIONS (CONTINUED)
=============~==============~==================================================================
CONTROL LOW DOSE
SPECIAL MORPHOLOGY SUMMARY
NONE
t NUMBER OF ANIMALS WITH TISSUE EXAMINED MICROSCOPICALLY * NUMbER OF ANIMALS NECROPSIED
46
MID DOSE HIGH DOSE
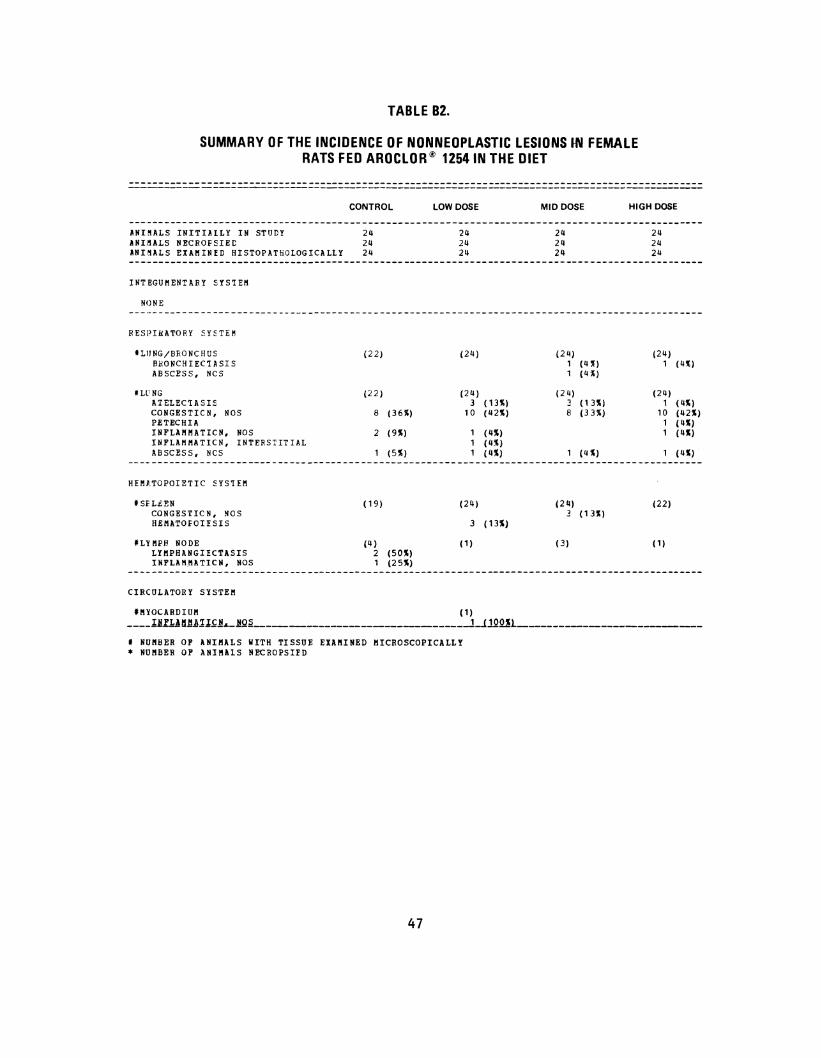
TABLE 82.
SUMMARY OF THE INCIDENCE OF NONNEOPLASTIC LESIONS 1-N FEMALE RATS FED AROCLOR® 12541N THE DIET
CONTROL LOW DOSE MID DOSE HIGH DOSE
ANI~ALS INITIAlLY IN STUPY 24 ANIIULS Nl!CROFSIEP 24 ANI~ALS EXAMINED HISTOPATHOLOGICALLY 24
INTgGUMENTARY SYS!EM
NONE
RESPIJtATORY SYSTEM
HUNG/BRONCHUS (22) BHONCH IECHSI S ABSCESS, NCS
* Ll' NG (22) ATELECTASIS CONGESTICN, NOS 8 PETECHIA INFLAMMATICN, NOS 2 INFLAMMATICN, INTERSTITIAL ABSCESS, NCS 1
HEMlTOPOIETIC SYS!EM
tsFL-"EN ( 19) CONGESTICN, NOS HEMATOFOHSIS
HYMPH NODE (4) LYMPHANGIECTASIS 2 INFLA!I!IATICN, NOS 1
CIRCULATORY SYSTEM
(36")
(9%)
(5%)
(SO'l) (25%)
24 24 24
(24)
(24) 3
10
(24)
3
(1)
fMYOCARDIUM (1)
( 13%) (42%)
(4%) (4%) (4%)
(13!1)
24 24 24
(24) 1 1
(24) 3 8
1
(24) 3
(3)
(41!) (4'l)
(13%) (33%)
(4'l)
(13%)
24 24 24
(24) 1
(24) 1
10 1 1
1
(22)
(1)
(4~)
(4%) (42%) (4%) (4%)
(4")
____ ,lU1j!1.!!Jll£JlL_JlQ~---------------------------j_j10Q_!l_ _____________________ _
t NUMBER OF ANIMALS WITH TISSUE EXAMINED MICROSCOPICALLY * NUMBER OF ANIMAlS NECROPSIED
47
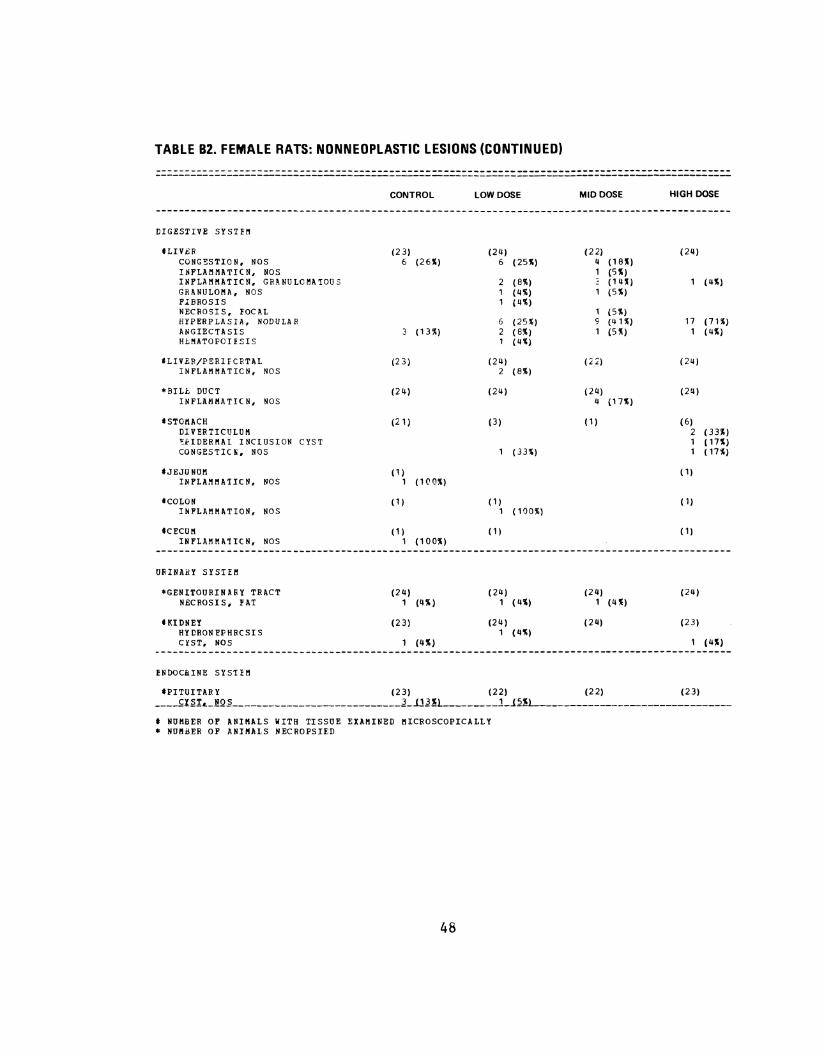
TABLE 82. FEMALE RATS: NONNEOPLASTIC LESIONS (CONTINUED)
DIGESTIVE SYSTEM
HIVER CONGESTION, NOS I~FLAMMATICN, NOS INFLAMMATICN, GRANULCMA!OUS GRANULOMA, NOS FIBROSIS NECROSIS, FOCAL HYPERPLASIA, NODULAR ANGIECTASIS H1MATOPOIESIS
ILIVER/PERlfCRTAL INFLAMMATICN, NOS
*BILL DUCT INFLAMMATICN, NOS
I STOMACH DIVERTICULUM oFIDERMAl INClUSION CYST CONGESTIC~, NOS
IJEJUNUM INFLAMMA!ICN, NOS
I COLON INFLAMMATION, NOS
ICECUM INFLAMMA!ICN, NOS
URINARY SYSTEM
*GENITOURINARY TRACT NECROSIS, FAT
IKIDNEY HYDRONEPHRCSIS CYST, NOS
ENDOCliiNE SYS!EM
CONTROL
(23) 6 (26")
3 ( 13 %)
(2 3)
(24)
(21)
( 1) 1 (1CO%)
( 1)
( 1) 1 (1 00%)
(24) 1 (4% l
(2 3)
1 (4%)
LOW DOSE
(24) 6 (25")
2 (8") 1 ( 4%) 1 ( 4%)
6 (25%) 2 ( 8%) 1 ( 4'1.)
(24) 2 (8%)
(24)
(3)
1 ( 33'1.)
( 1) 1 ( 100%)
( 1)
(24) 1 ( 4%)
(24) 1 ( 4")
MID DOSE HIGH DOSE
(22) (24) 4 ( 18ll) 1 (Sll)
( 1 4 ~) 1 ( 4%) 1 (5%)
(5%) (4 1 %) 17 c7a) (5 :l) 1 (4%)
(2 2) (24)
(24) (24) 4 ( 17%)
( 1) (6) 2 (33%) 1 ( 17%) 1 (1H)
( 1)
(1)
( 1)
(24) (24) 1 (4ll)
(2 4) (23)
1 ( 4ll)
IPITUITARY (23) (22) (22) (23) ____ fl~IL_!Q2 ____________________________ J_J1J!l _________ j_J2!L_ _______________________________ _
I NUMBER OF ANIMALS WITH TISSUE EXAMINED MICROSCOPICALLY * NUMBER OF ANIMAlS NECROPSIED
48
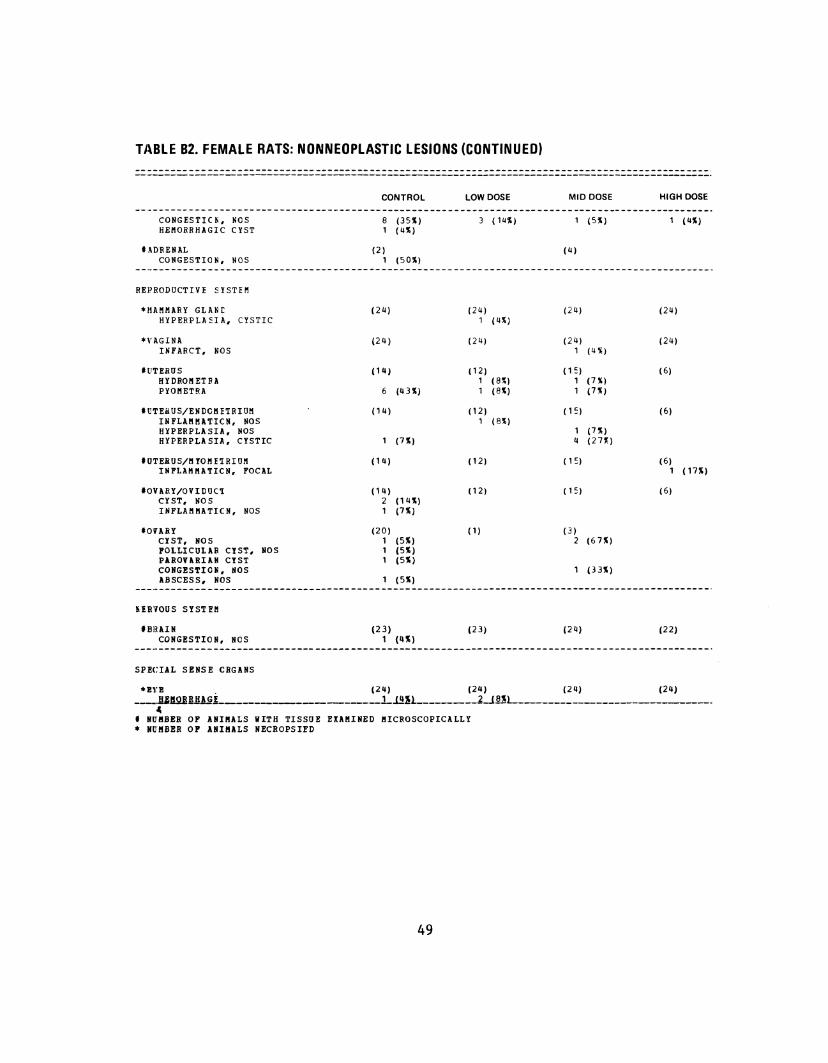
TJ\BLE 82. FEMALE RATS: NONNEOPLASTIC LESIONS (CONTINUED)
--·----------------------------------------------------------------------------------------------· --·----------------------------------------------------------------------------------------------·
CONGESTIO, NOS HEIIORRHAGIC CYST
UDRENAL CONGESTION, NOS
REPRODUCTIVE SYSTEII
*IIAIIIIARY GLAN t HYPERPLASIA, CYSTIC
*\' AGINA INFARCT, NOS
t[ITERUS HYDROIIETBA PYOIIETRA
tUTERUS/ENDCIIETRIUII INFLAIIIIATICH, NOS HYPERPLASIA, NOS HYPERPLASIA, CYSTIC
tOTEBUS/IIYOIIETRIUII INPLAIIIIATICN, POCAL
tOVARY/OVIDUCT CYST, NOS INPLAIIIIATICN, NOS
tO VARY CIST, NOS FOLLICULAR CYST, IIOS PlROYARIAII CYST CONGESTION, NOS ABSCESS, IIOS
nnous sYSTI!I!
tBIUIII COIIGESTIOR, NOS
SPECIAL SENSE CRGANS
CONTROL
8 (351) 1 ( 41)
(2) 1 (501)
(24)
(24)
(111)
6 (431)
(14)
1 (71)
(14)
(111, 2 (1 Ill) 1 (71)
(20) 1 (51) 1 (51) 1 (51)
1 (51)
(23) 1 (41)
LOW DOSE MID DOSE HIGH DOSE
3 ( 141) 1 (51) 1 (Ill)
(4)
(24) (24) (211) 1 (41)
(24) (24) (24) 1 (Ill!)
(12) ( 1 ~) (6) 1 (81) 1 (7%) 1 (81) 1 (H)
(12) (1~) (6) 1 (81)
1 (71) 4 (21'1!)
(12) ( 1 ~~ (6) 1 ( 171)
(12) ( 1 ~) (6)
( 1) (3) 2 (6 7%)
1 (331)
(23) (24) (22)
*UB , (211) (211) (211) (211) _JUill2l!IU!!§! ________________ LillL _____ l_jML ________________________ _
" t IIUIIIBER OP liiii!lLS IIITH TISSUE I!XAIIIIIED IIICROSCOPICALLY * IIU'I!BER OP AIIIIIALS NECROPSIED
49
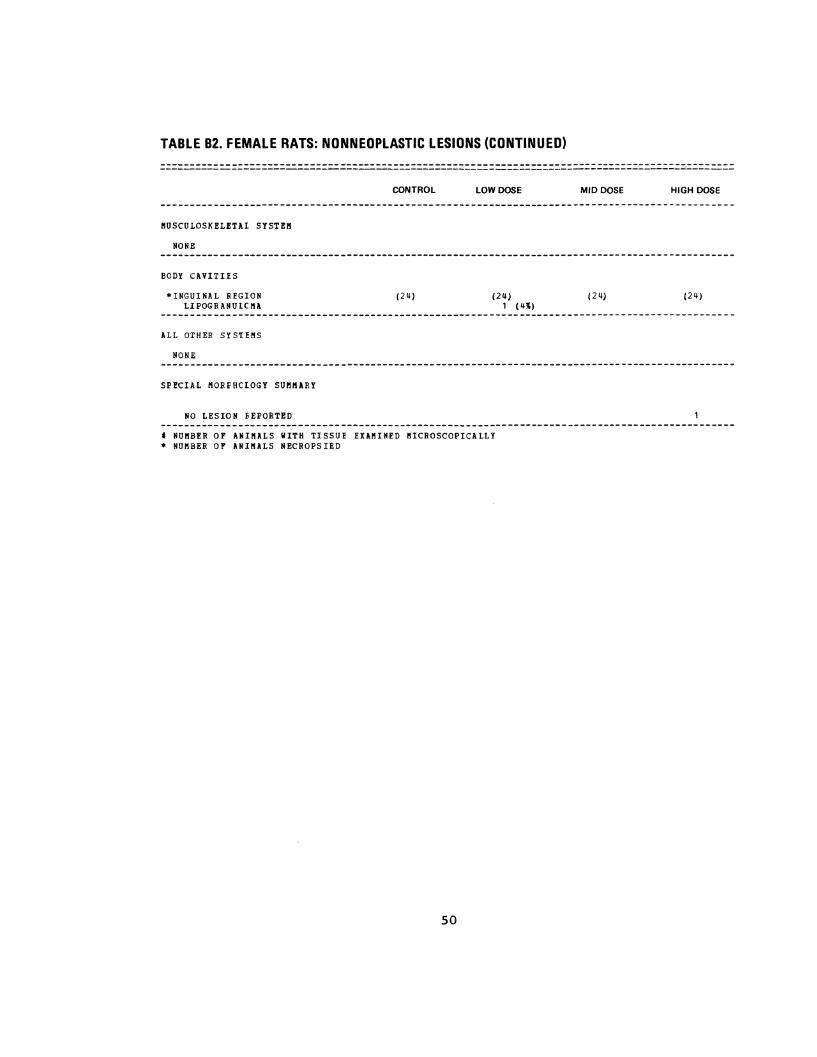
TABLE B2. FEMALE RATS: NONNEOPLASTIC LESIONS (CONTINUED)
=======~===========~=~==========~~================================================~========
eUSCU10SKELETAl SYSTEe
HONE
BODY CAVITI'ES
*INGUINAL REGION LIPOGRANUlCIIA
ALL OTHER SYSiEIIS
NONE
SPECIAL eoRFHClOGY sueeARY
NO LESION FEPORTED
CONTROL LOW DOSE
(24) (24) 1 ( 4~)
I NUIIBER OF ANIIIALS WITH TISSUE EXAIIINED IIICROSCOPICALLY * NUIIBER OF ANIIIALS NECROPSIED
50
MID DOSE HIGH DOSE
(24) (24)
APPENDIX C
ANALYSES OF THE INCIDENCE OF PRIMARY TUMORS IN
RATS FED AROCLOR® 1254 IN THE DIET
51

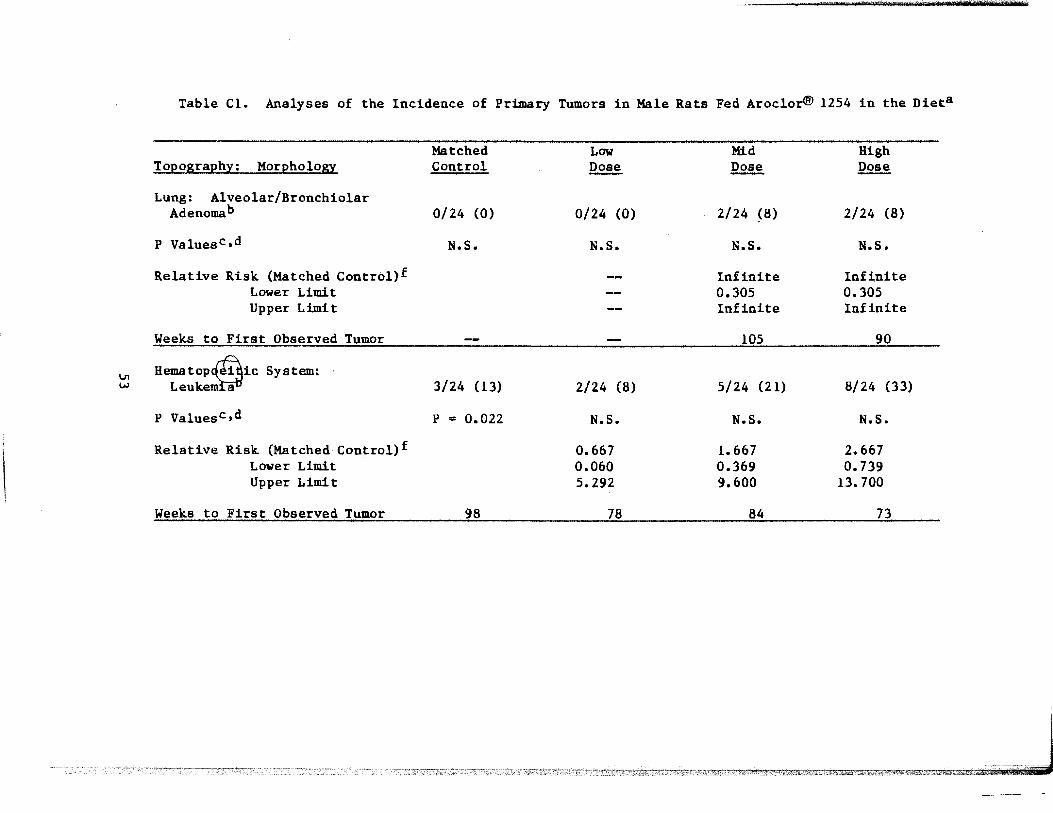
Table C1. Analyses of the Incidence of Primary Tumors in Male Rats Fed Aroclor® 1254 in the Dieta
Matched Low Mid High To:eosra:eh~: Mor:eholo~ Control Dose ~ ~
Lung: Alveolar/Bronchiolar Adenomab 0/24 (0) 0/24 (0) 2/24 ~8) 2/24 (8)
P Valuesc,d N.S. N.S. N.S. N.S.
Relative Risk (Matched Control)£ Infinite Infinite Lower Limit 0.305 0.305 Upper Limit Infinite Infinite
Weeks to First Observed Tumor 105 90
\.11 Hematop~ic System: w Leuke a 3/24 (13) 2/24 (8) 5/24 (21) 8/24 (33)
P Valuesc,d p - 0.022 N.S. N.S. N.S.
Relative Risk (Matched Control)£ 0.667 1.667 2.667 Lower Limit 0.060 0.369 0.739 Upper Limit 5.292 9.600 13.700
Weeks to First Observed Tumor 98 78 84 73
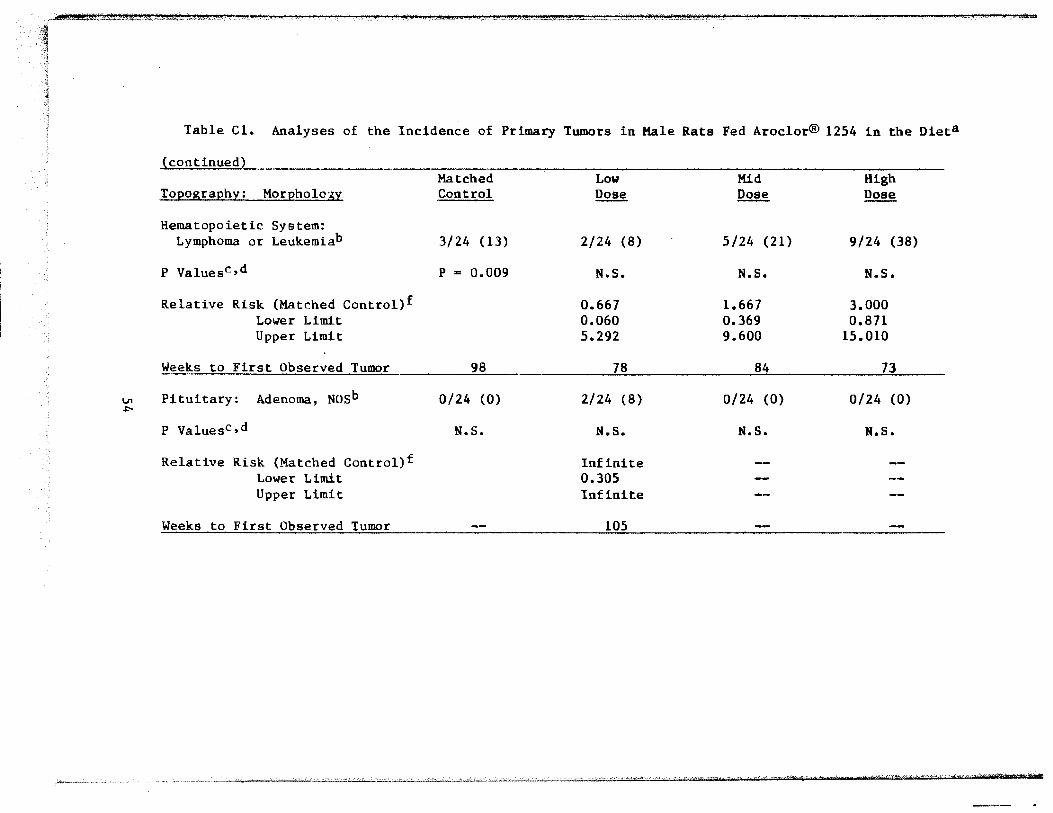
Table C1. Analyses of the Incidence of Primary Tumors in Male Rats Fed Aroclor® 1254 in the Diets
(continued} Matched Low Mid High
Topography: Morphology Control Dose Dose Dose
Hematopoietic System: Lymphoma or Leukemiab 3/24 (13) 2/24 (8) 5/24 (21) 9/24 (38)
P Valuesc,d p = 0.009 N.s. N.S. N.S.
Relative Risk (Matched Control)£ 0.667 1.667 3.000 Lower Limit 0.060 0.369 0.871 Upper Limit 5.292 9.600 15.010
Wee~s to First Observed Tumor 98 78 84 73
V1 .f:!'-
Pituitary: Adenoma, Nosh 0/24 (O) 2/24 (8) 0/24 (0) 0/24 (0)
P ValuesCtd N.S. N.S. N.S. N.S.
Relative Risk (Matched Control)f Infinite Lower Limit 0.305 Upper Limit Infinite
Weeks to First Observed Tumor 105
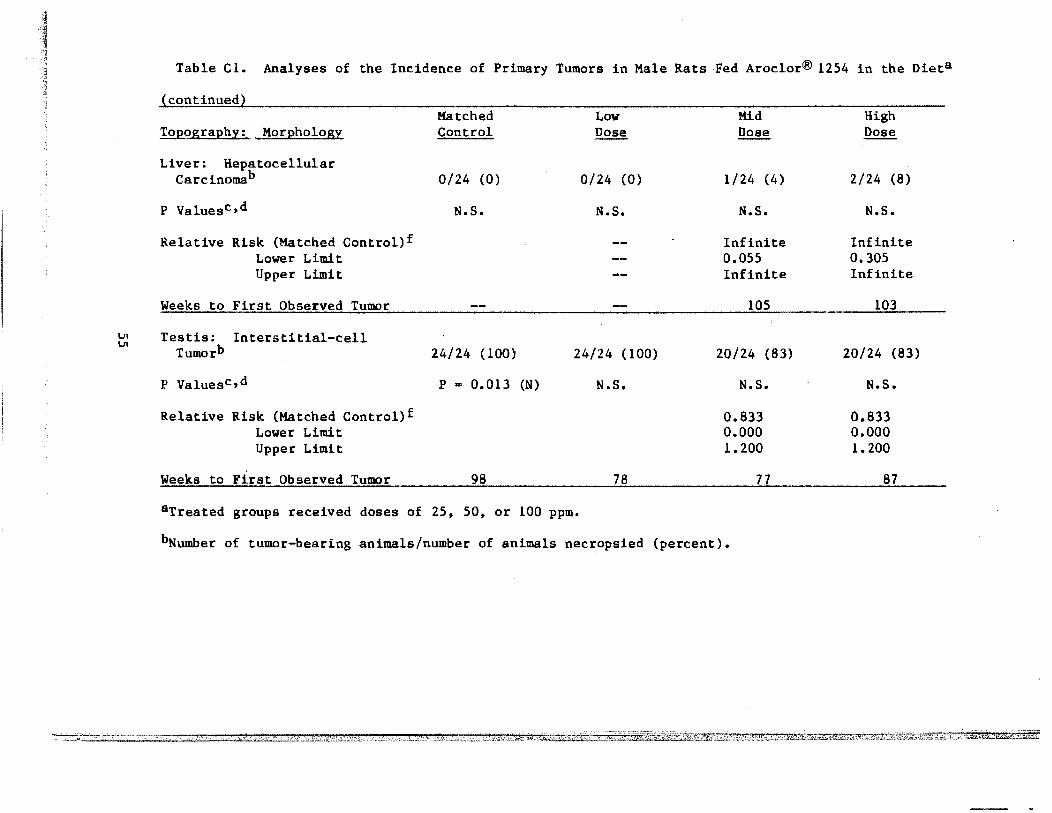
Table C1. Analyses of the Incidence of Primary Tumors in Male Rats Fed Aroclor® 1254 in the Diet8
~continued~ Matched Low Mid High
Topography: . Morphology Control Dose Dose Dose
Liver: Hepatocellular Carcinomab 0/24 (0) 0/24 (0) 1/24 (4) 2/24 (8)
P Valuesc•d N.S. N.S. N.S. N.S.
Relative Risk (Matched Control)£ Infinite Infinite Lower Limit 0.055 0.305 Upper Limit Infinite Infinite
Weeks to First Observed Tumor 105 103
V! Testis: Interstitial-cell \JI
Tumorb 24/24 24/24 (100) 20/24 (83) 20/24 (83) (100)
p Valuesc,d P • 0.013 (N) N.S. N. S. N.S.
Relative Risk (Matched Control)£ 0.833 0.833 Lower Limit 0.000 0.000 Upper Limit 1.200 1.200
Weeks to First Observed Tumor 98 78 77 87
aTreated groups received doses of 25, 50, or 100 ppm.
bNumber of tumor-bearing animals/number of animals necropsied (percent).
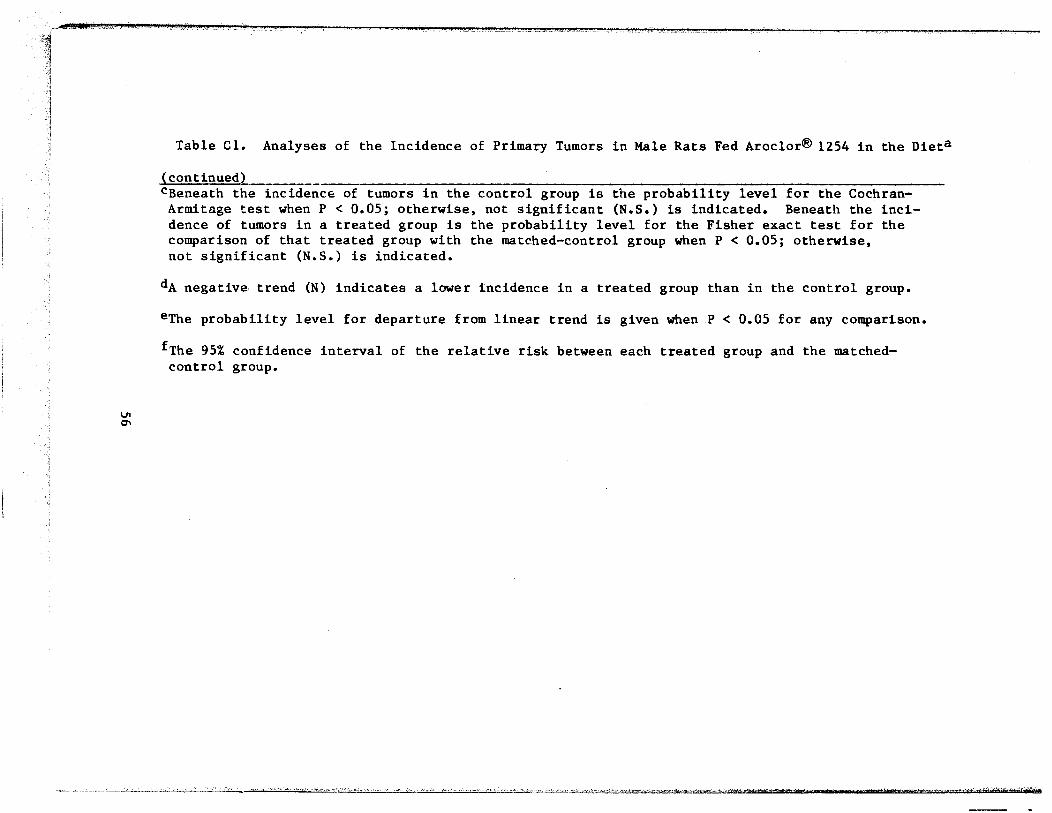
Table Cl. Analyses of the Incidence of Primary Tumors in Male Rats Fed Aroclor® 1254 in the Dieta
(continued) CBeneath the incidence of tumors in the control group is the probability level for the CochranArmitage test when P < 0.05; otherwise, not significant (N.S.) is indicated. Beneath the incidence of tumors in a treated group is the probability level for the Fisher exact test for the comparison of that treated group with the matched-control group when P < 0.05; otherwise, not significant (N.S.) is indicated.
dA negative- trend (N) indicates a lower incidence in a treated group than in the control group.
eThe probability level for departure from linear trend is given when P < 0.05 for any comparison.
fThe 95% confidence interval of the relative risk between each treated group and the matchedcontrol group.
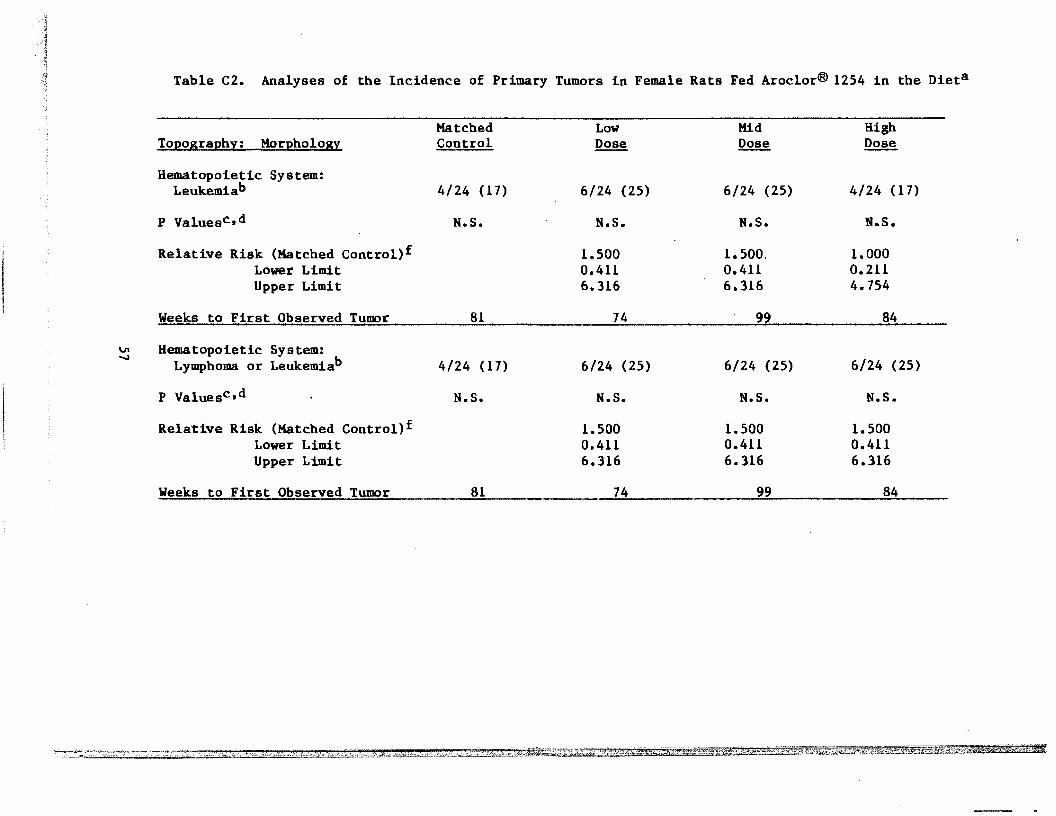
Table C2. Analyses of the Incidence of Primary Tumors in Female Rats Fed Aroclor® 1254 in the Dieta
Matched Low Mid High Topography: Morphology Control Dose ~ Dose
Hematopoietic System: Leuk.emiab 4/24 (11) 6/24 {25) 6/24 {25) 4/24 {11)
P Valuesc,d N.S. N.S. N.S. N.S.
Relative Risk (Matched Control)f 1.500 1. 500. 1.000 Lower Limit 0.411 0.411 0.211 Upper Limit 6.316 6.316 4.754
Weeks to First Observed Tumor 81 74 99 84
l.n Hematopoietic System: """ Lymphoma or Leukemiab 4/24 {11) 6/24 {25) 6/24 (25) 6/24 (25)
P Valuesc,d N.S. N.S. N.S. N.S.
Relative Risk (Matched Control)f 1.500 1.500 1.500 Lower Limit 0.411 0.411 0.411 Upper Limit 6.316 6.316 6.316
Weeks to First Observed Tumor 81 74 99 84
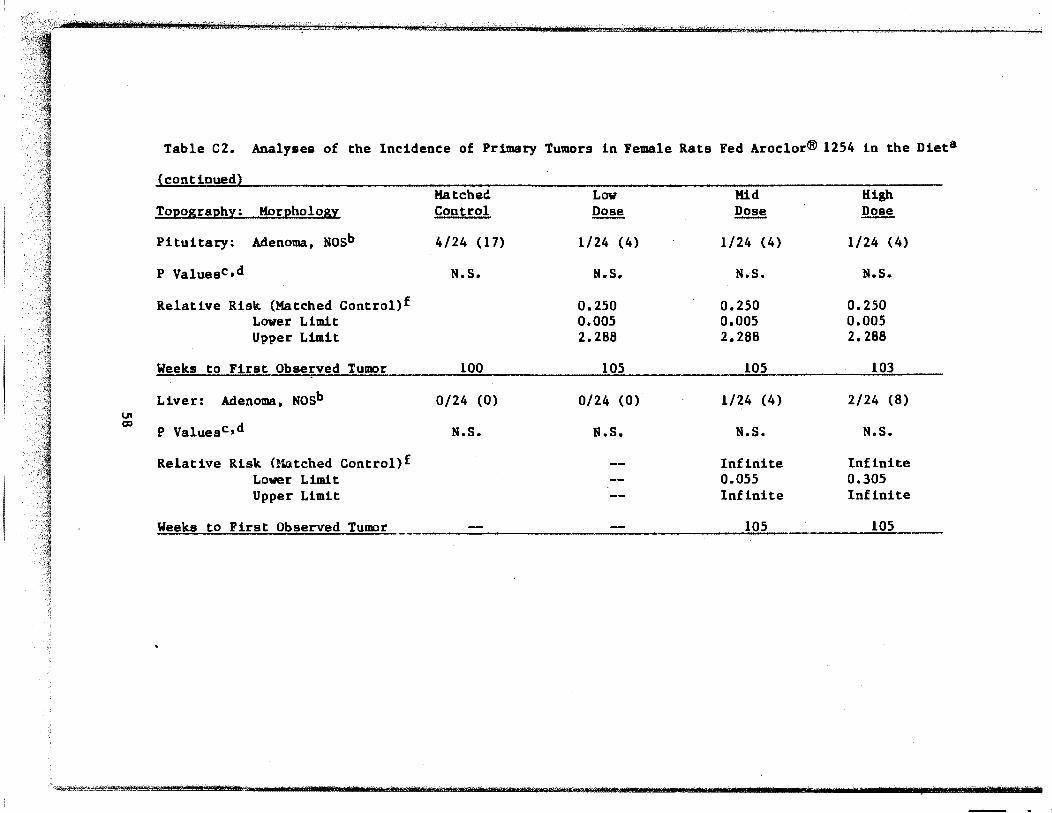
Table C2. Analyses of the Incidence of Primary Tumors in Female Rats Fed Aroclor® 1254 in the Diet&
~continued} Matched Low Mid High
Toeogra2h!: Mor);!hOlO&! Control ~ ~ ~
Pituitary: Adenoma, Nosb 4/24 (17) 1/24 (4) 1/24 (4) 1/24 (4)
P Valuesc,d N. S. N.s. N.S. N.S.
Relative Risk (Matched Control)£ 0.250 0.250 0.250 Lower Limit 0.005 0.005 0.005 Upper Limit 2.288 2.288 2.288
Weeks to First Observed Tumor 100 105 105 103
Liver: Adenoma, Nosb 0/24 (0) 0/24 (0) 1/24 (4) 2/24 (8) 1.1'1 co P Valuesc,d N.s. N.S. N.S. N.S.
Relative Risk Oiotched Control) f Infinite Infinite Lower Limit 0.055 0.305 Upper Limit Infinite Infinite
Weeks to First Observed Tumor 105 105
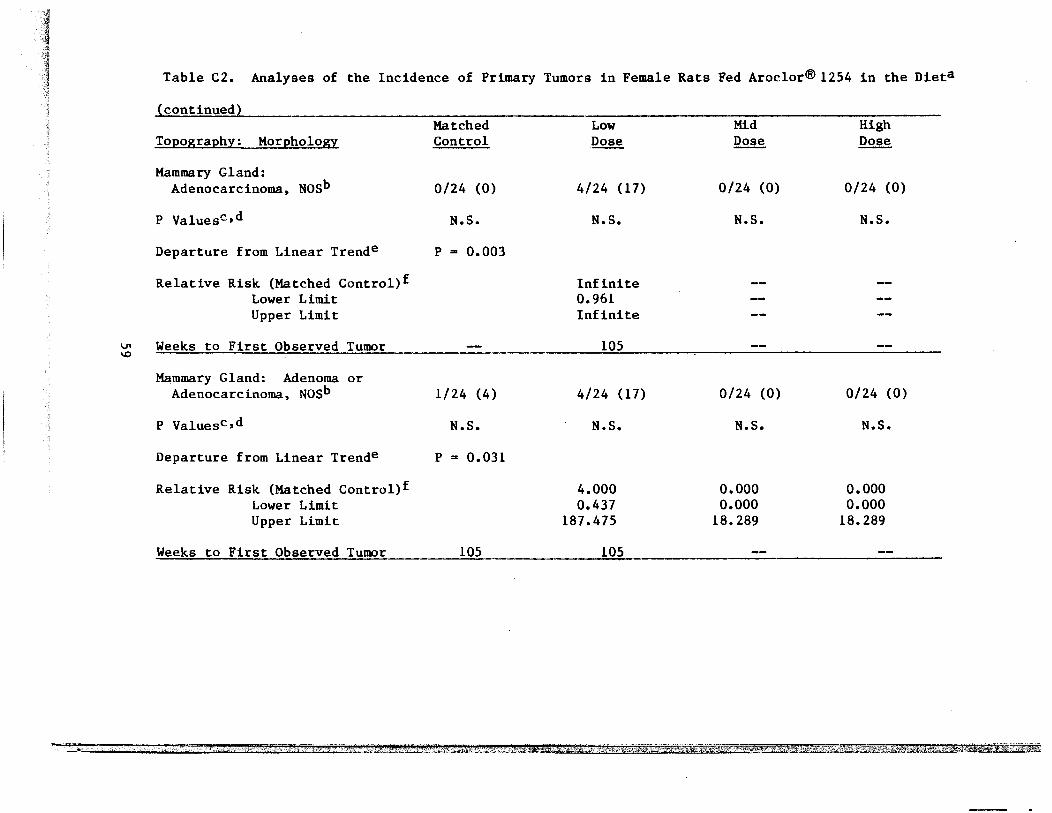
Table C2. Analyses of the Incidence of Primary Tumors in Female Rats Fed Aroclor® 1254 in the Dieta
(continued)
Topography: Morphology
Mammary Gland: Adenocarcinoma, Nosb
P Valuesc,d
Departure from Linear Trende
Relative Risk (Matched Control)f Lower Limit Upper Limit
~ Weeks to First Observed Tumor \0
Mammary Gland: Adenoma or Adenocarcinoma, Nosb
P Valuesc,d
Departure from Linear Trende
Relative Risk (Matched Control)f Lower Limit Upper Limit
Weeks to First Observed Tumor
Matched Control
0/24 (0)
N.S.
p = 0.003
1/24 (4)
N. S.
p = 0.031
105
Low Dose
4/24 (17)
N. S.
Infinite 0.961 Infinite
105
4/24 (17)
N. S.
4.000 0.437
187.475
105
Mid Dose
0/24 (0)
N.S.
0/24 (0)
N.S.
o.ooo o.ooo
18.289
High Dose
0/24 (0)
N.S.
0/24 (0)
N.S.
o.ooo o.ooo
18.289
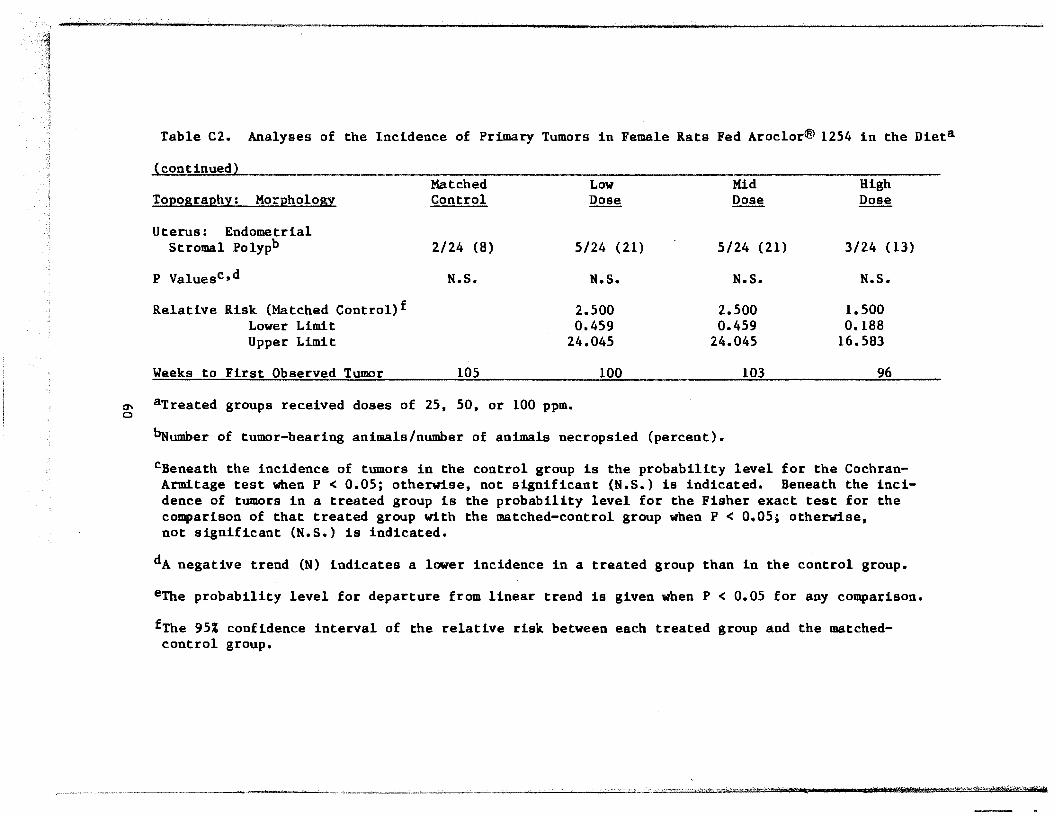
Table C2. Analyses of the Incidence of Primary Tumors in Female Rats Fed Aroclor® 1254 in the Dieta
(continued)
Topography: Morphology
Uterus: Endometrial Stromal Polypb
P Valuesc,d
Relative Risk (Matched Control)£ Lower Limit
Matched Control
2/24 (8)
N.S.
Low Dose
5/24 (21)
N.S.
2.500 0.459
Upper Limit 24.045
Weeks to First Observed Tumor 105
~ aTreated groups received doses of 25, 50, or 100 ppm. 0
100
Mid Dose
5/24 (21)
N.S.
2.500 0.459
24.045
103
~umber of tumor-bearing animals/number of animals necropsied (percent).
High Dose
3/24 (13)
N.S.
1.500 0.188
16.583
96
cBeneath the incidence of tumors in the control group is the probability level for the CochranArmitage test when P < 0.05; otherwise, not significant (N.S.) is indicated. Beneath the incidence of tumors in a treated group is the probability level for the Fisher exact test for the comparison of that treated group with the matched-control group when P < 0.05; otherwise, not significant (N.S.) is indicated.
dA negative trend (N) indicates a lower incidence in a treated group than in the control group.
eThe probability level for departure from linear trend is given when P < 0.05 for any comparison.
fThe 95% confidence interval of the relative risk between each treated group and the matchedcontrol group.
Review of the Bioassay of Aroclor 1254® for Carcinogenicity by the Data Evaluation/Risk Assessment Subgroup of the
Clearinghouse on Environmental Carcinogens
November 28, 1977
The Clearinghouse on Environmental Carcinogens was established inMay, 1976 under the authority of the National Cancer Act of 1971 (P.L. 92218). The purpose of the Clearinghouse is to advise on the National Cancer Institute's bioassay program to identify and evaluate chemical carcinogens in the environment to which humans may be exposed. The members of the Clearinghouse have been drawn from academia, industry, organized labor, public interest groups, State health officials, and quasi-public health and research organizations. Members have been selected on the basis of their experience in carcinogenesis or related fields and, collectively, provide expertise in organic chemistry, biochemistry, biostatistics, toxicology, pathology, and epidemiology. Representatives of various Governmental agenciesparticipate as ad hoc members. The Data Evaluation/Risk Assessment Subgroup of the Clearinghouse is charged with the responsibility of providing a peer review of NCI bioassay reports on chemicals studied for carcinogenicity. In this context, below is the edited excerpt from the minutes of the Subgroup's meeting at which Aroclor 1254 was reviewed.
(Aroclor 1254 was tested in rats as part of another study designed to investigate the combined effects of chemicals.) The primary reviewerbriefly outlined the experimental design and findings. Although statistically significant increases in the incidence of tumors were not found in the treated rats, a high incidence of liver hyperplastic nodules was observed in both sexes.
The primary reviewer said that in published rat and mouse studies, Aroclor was reported to induce liver neoplasms, although in one rat study only hyperplastic nodules of the liver were found. In regard to the rat pathology, he said that after the proliferative stimulus is removed, the hyperplastic nodules regress and disappear. Stimuli of such liver nodules act more like tumor promoters than complete carcinogens. Based on reports in the literature, he concluded that Aroclor 1254 could pose a risk to the human population as a tumor promoter. A lengthy discussion followed as to whether the evidence was adequate to assess Aroclor's tumor promoting potential.
An NCI staff pathologist pointed out that a number of tumors also were found in the gastrointestinal tract of the treated rats. Although they did not occur in statistically -significant numbers, none was observed among the control
61
animals. A discussion ensued as to the appropriateness of combining tumors when they occur at different sites along the GI tract.
One Subgroup member opined that the study was deficient because of an inadequate number of animals per group. He suggested that the tumors of questionable significance may have been more meaningful had more animals been used.
A motion was made that the conclusion stated in the report summary be accepted with an addition that Aroclor 1254 may act as a tumorpromoter. The motion thus read: It is concluded that, under the conditions of the bioassay, Aroclor 1254 was not carcinogenic in Fischer 344 rats; however, a high incidence of hepatocellular proliferative lesions in both male and female rats was related to treatment in addition, the carcinomas of the gastrointestinal tract may be associated with treatment in both males and females. Based on the liver proliferative lesions in the treated rats and published reports, it is suggested that Aroclor 1254 may be a tumor promoter. The motion was seconded and accepted by Drs. Wogan, Pitot, Roush, Shimkin, Strong, and Weisburger. Mr. Garfinkel opposed the motion and Dr. Rowe abstained.
* Subsequent to this review, changes may have been made in the bioassay report either as a result of the review or other reasons. Thus,certain comments and criticisms reflected in the review may no longer be appropriate.
62U.S. GOVERNMENT PRINTING OFFICE: 1978 260-899/3021 1-3


DHEW Publication No. (NIH) 78438