
Bioassay Investigations with Daphnia - University of ... Investigations with Daphnia Developed by...
28
My Environment, My Health, My Choices 1 © 2006, University of Rochester May be copied for classroom use Bioassay Investigations with Daphnia Developed by Kathy Cahill Wantagh High School Wantagh, New York For the My Environment, My Health, My Choices project University of Rochester Rochester, NY Abstract: A bioassay is used to study the effects of environmental changes on simple organisms. Students will investigate the response of Daphnia to exposure to various concentrations of toxicants. Data is graphed to create a “dose-response curve” and to determine the LD50 for the toxicant. Discussion questions encourage students to consider the implications of this research for potential short-term and long-term effects of toxicants on human health.
Transcript of Bioassay Investigations with Daphnia - University of ... Investigations with Daphnia Developed by...
My Environment, My Health, My Choices 1 © 2006, University of Rochester May be copied for classroom use
Bioassay Investigations with Daphnia
Developed by Kathy Cahill Wantagh High School Wantagh, New York
For the My Environment, My Health, My Choices project
University of Rochester
Rochester, NY
Abstract: A bioassay is used to study the effects of environmental changes on simple organisms. Students will investigate the response of Daphnia to exposure to various concentrations of toxicants. Data is graphed to create a “dose-response curve” and to determine the LD50 for the toxicant. Discussion questions encourage students to consider the implications of this research for potential short-term and long-term effects of toxicants on human health.
My Environment, My Health, My Choices 2 © 2006, University of Rochester May be copied for classroom use
Table of Contents
Pre/Post Test 3-4
Pre/Post Test Answer Key 5-6
Learning Context 7
Teacher Background Information 7-11
Student: Introduction to Bioassays 12-15
Student: Investigating the Effects of Toxicants on Daphnia 16-18
Student: Inquiry—Investigating the Effects of a Toxicant on Daphnia 19-21
Teacher Resources 22
New York State Learning Standards 23
Appendix A: Alternatives to using Daphnia 24-25
Appendix B: Class Data Table 26
Appendix C: How to Use an Experimental Design Planner 27
Teachers, we would appreciate your feedback. Please complete our brief, online Environmental Health Science Activity Evaluation Survey after you implement these lessons in your classroom. The survey is available online at: www.surveymonkey.com/s.asp?u=502132677711

My Environment, My Health, My Choices 3 © 2006, University of Rochester May be copied for classroom use
Pre/Post Test
Name ___________________________________ Class ______
Base your answers to these questions on the student lab report below.
Our group used a Daphnia bioassay to investigate what effect Toxicant X has on living organisms. We filled 6 test tubes with solutions that had different concentrations of Toxicant X. Next we added 10 Daphnia to each test tube. After 10 minutes, we counted the number of Daphnia that died and calculated the percent of Daphnia mortality in each tube. This graph shows the results of our experiment.
Daphnia Mortality
After 10 Minutes
(Percent)
0 0.5 1.0 1.5 2.0
Toxicant X Solution Concentration (Percent)
1. The bioassay was used to determine
1. What kind of Daphnia can survive exposure to Toxicant X.
2. What concentrations of Toxicant X are harmful to Daphnia.
3. What kind of Toxicant X is harmful to Daphnia.
4. What effect the Daphnia have on the Toxicant X concentration.
2. What is the best title for this graph?
1. The Effect of Daphnia Mortality on Toxicant X Concentration
2. The Effect of Toxicant X Concentration on Daphnia Mortality
3. Toxicant Mortality X versus. Daphnia Concentration
4. Daphnia Percent vsersus Toxicant X Percent
20
40
60
80
100
50
My Environment, My Health, My Choices 4 © 2006, University of Rochester May be copied for classroom use
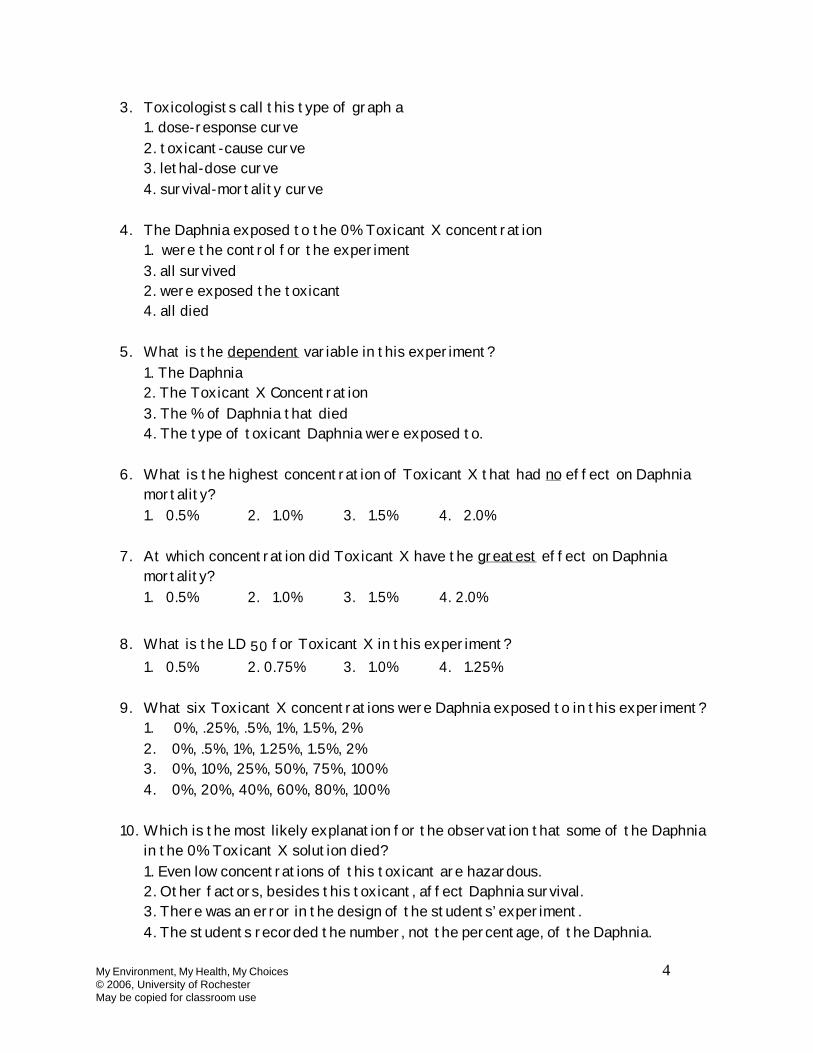
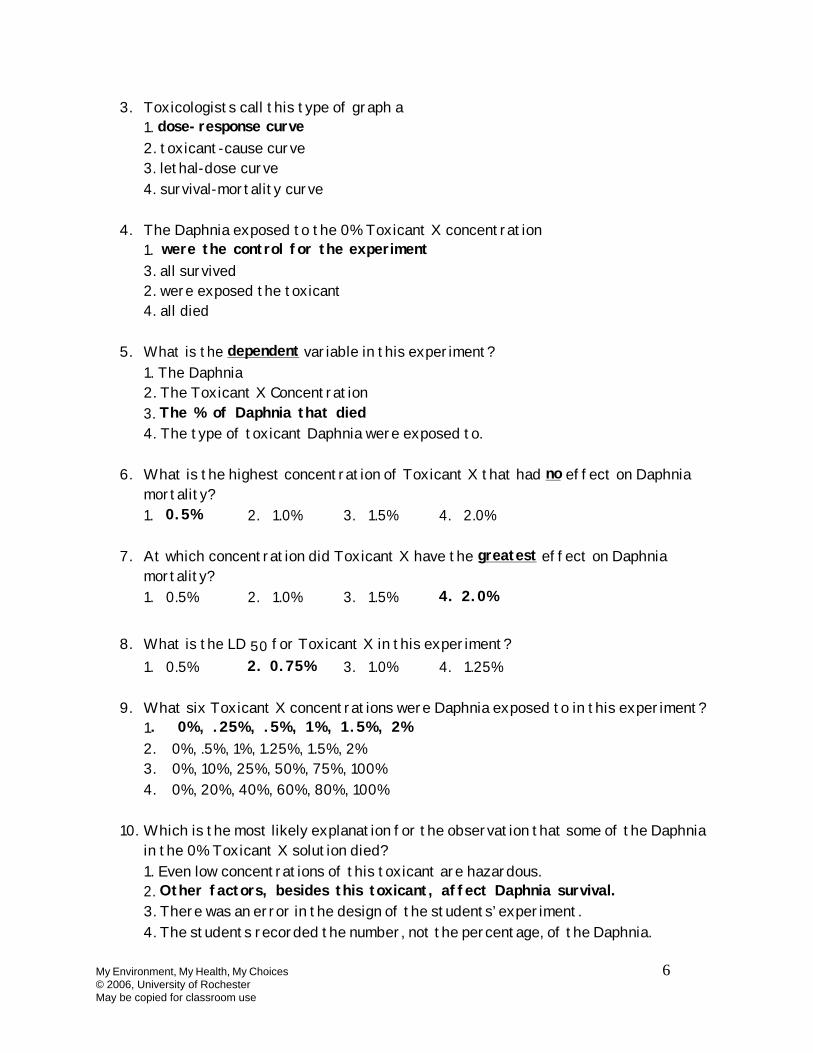
3. Toxicologists call this type of graph a
1. dose-response curve
2. toxicant-cause curve
3. lethal-dose curve
4. survival-mortality curve
4. The Daphnia exposed to the 0% Toxicant X concentration
1. were the control for the experiment
3. all survived
2. were exposed the toxicant
4. all died
5. What is the dependent variable in this experiment?
1. The Daphnia
2. The Toxicant X Concentration
3. The % of Daphnia that died
4. The type of toxicant Daphnia were exposed to.
6. What is the highest concentration of Toxicant X that had no effect on Daphnia
mortality?
1. 0.5% 2. 1.0% 3. 1.5% 4. 2.0%
7. At which concentration did Toxicant X have the greatest effect on Daphnia
mortality?
1. 0.5% 2. 1.0% 3. 1.5% 4. 2.0%
8. What is the LD 50 for Toxicant X in this experiment?
1. 0.5% 2. 0.75% 3. 1.0% 4. 1.25%
9. What six Toxicant X concentrations were Daphnia exposed to in this experiment?
1. 0%, .25%, .5%, 1%, 1.5%, 2%
2. 0%, .5%, 1%, 1.25%, 1.5%, 2%
3. 0%, 10%, 25%, 50%, 75%, 100%
4. 0%, 20%, 40%, 60%, 80%, 100%
10. Which is the most likely explanation for the observation that some of the Daphnia
in the 0% Toxicant X solution died?
1. Even low concentrations of this toxicant are hazardous.
2. Other factors, besides this toxicant, affect Daphnia survival.
3. There was an error in the design of the students’ experiment.
4. The students recorded the number, not the percentage, of the Daphnia.

My Environment, My Health, My Choices 5 © 2006, University of Rochester May be copied for classroom use
Teacher Answer Key - Pre/Post Test Name ___________________________________ Class ______
Base your answers to these questions on the student lab report below.
Our group used a Daphnia bioassay to investigate what effect Toxicant X has on living organisms. We filled 6 test tubes with solutions that had different concentrations of Toxicant X. Next we added 10 Daphnia to each test tube. After 10 minutes, we counted the number of Daphnia that died and calculated the percent of Daphnia mortality in each tube. This graph shows the results of our experiment.
Daphnia Mortality
After 10 Minutes
(Percent)
0 0.5 1.0 1.5 2.0
Toxicant X Solution Concentration (Percent)
1. The bioassay was used to determine 1. What kind of Daphnia can survive exposure to Toxicant X.
2. What concentrations of Toxicant X are harmful to Daphnia.
3. What kind of Toxicant X is harmful to Daphnia.
4. What effect the Daphnia have on the Toxicant X concentration.
2. What is the best title for this graph?
1. The Effect of Daphnia Mortality on Toxicant X Concentration
2. The Effect of Toxicant X Concentration on Daphnia Mortality
3. Toxicant Mortality X versus Daphnia Concentration
4. Daphnia Percent versus Toxicant X Percent
20
40
60
80
100
50
My Environment, My Health, My Choices 6 © 2006, University of Rochester May be copied for classroom use
3. Toxicologists call this type of graph a
1. dose-response curve
2. toxicant-cause curve
3. lethal-dose curve
4. survival-mortality curve
4. The Daphnia exposed to the 0% Toxicant X concentration
1. were the control for the experiment
3. all survived
2. were exposed the toxicant
4. all died
5. What is the dependent variable in this experiment?
1. The Daphnia
2. The Toxicant X Concentration
3. The % of Daphnia that died
4. The type of toxicant Daphnia were exposed to.
6. What is the highest concentration of Toxicant X that had no effect on Daphnia
mortality?
1. 0.5% 2. 1.0% 3. 1.5% 4. 2.0%
7. At which concentration did Toxicant X have the greatest effect on Daphnia
mortality?
1. 0.5% 2. 1.0% 3. 1.5% 4. 2.0%
8. What is the LD 50 for Toxicant X in this experiment?
1. 0.5% 2. 0.75% 3. 1.0% 4. 1.25%
9. What six Toxicant X concentrations were Daphnia exposed to in this experiment?
1. 0%, .25%, .5%, 1%, 1.5%, 2%
2. 0%, .5%, 1%, 1.25%, 1.5%, 2%
3. 0%, 10%, 25%, 50%, 75%, 100%
4. 0%, 20%, 40%, 60%, 80%, 100%
10. Which is the most likely explanation for the observation that some of the Daphnia
in the 0% Toxicant X solution died?
1. Even low concentrations of this toxicant are hazardous.
2. Other factors, besides this toxicant, affect Daphnia survival.
3. There was an error in the design of the students’ experiment.
4. The students recorded the number, not the percentage, of the Daphnia.
My Environment, My Health, My Choices 7 © 2006, University of Rochester May be copied for classroom use
Learning Context Subject Areas: Biology and Environmental Science
Overall Purpose:
· To use bioassay investigations to develop students’ understanding of the effects of chemical concentration on survival of living organisms
· Make the connection between the survival of simple organisms and human survival · To understand the role that model organisms play in informing humans about the effects
of toxicants
Learning Objectives: Students will… · Develop a hypothesis about the relationship between toxicant concentration and effect
on living organisms · Create toxicant solutions of various concentrations · Perform bioassay experiments using toxicant solutions · Record experimental data in a data table · Graph experimental data · Draw conclusions based on experimental data and their hypothesis · Determine the LD50 for toxicants · Consider the implications of their research on human health Prerequisite knowledge and skills: · Measure volume in mL · Record data in a data table · Graph data · Design a controlled experiment
Teacher Background Information A bioassay is a procedure that uses living organisms to determine the toxicity of a chemical. In a bioassay living organisms are exposed to different concentrations of a chemical that might be a toxicant (harmful chemical). Observations of the effects on the organisms’ behavior and survival allow researchers to determine if, or at what concentration, a chemical has harmful effects. The bioassay protocol introduced in this learning experience is a useful method for allowing students to observe the effects of slight environmental changes in simple organisms. Daphnia are commonly used in bioassays but other aquatic organisms such as duckweed, elodea, blackworms, and planaria may be substituted. This learning experience includes two parts. In Part 1, students are introduced to the bioassay protocol by testing the effect of various salt concentrations on Daphnia. In Part 2, students apply what they learned to conduct a bioassay to investigate the effects of another toxicant on Daphnia. There are two versions of Part 2: a guided version and an inquiry version. Teachers
may select the version most appropriate for their students.
My Environment, My Health, My Choices 8 © 2006, University of Rochester May be copied for classroom use
In some cases the Daphnia will die due to the concentrations of salt or other toxicants. If you and or your students prefer not to utilize Daphnia but still wish to conduct bioassays, other simple aquatic organisms such as duckweed, elodea, blackworms, and planaria could be substituted. You may also wish to have your students compare the effect of the same toxicant on different model organisms. Appendix A provides sample instructions for setting up bioassays with other model organisms. Students will be asked to graph their data to produce what toxicologists call a “dose-response curve.” They use their graph to determine the LD50 for the toxicant. LD50 is the abbreviation for Lethal Dose, 50%. This is the concentration of a toxicant that will kill 50% of the population exposed to the toxicant. In conducting a bioassay using a variety of concentrations of one particular toxicant, students will be able to determine directly, or through extrapolation, which concentration will result in the death of 50 % of the tested population Part 1: Introduction to Bioassays Laboratory Activity Part 1 introduces students to a bioassay technique in which they observe the effects of different salt (NaCl) solutions on Daphnia, a fresh-water Crustacean. Students follow instructions to set up an experiment, make observations over a set period of time, complete a data table, graph the data, and answer questions based on their data. By having a control set of Daphnia in spring water they can compare the various behavioral changes and at some concentrations will observe the Daphnia death. The amount of time required to complete this introductory lab varies. The lab experiment and data collection could be completed in 40 minutes. The graphing and data analysis questions may be completed during class or as homework. Part 2: Investigating the Effects of a Toxicant on Daphnia Laboratory Activity In Part 2 students perform a bioassay to test the effects of various toxicants. There are two different versions of Part 2 designed to allow you to select the one most appropriate for the laboratory skill level of your students. One version titled Investigating the Effects of a Toxicant on Daphnia guides students through conducting a bioassay investigation. The second version titled Inquiry - Investigating the Effects of a Toxicant on Daphnia, is an inquiry lab in which students design their own experiment. Appendix C provides information on how to complete an experiment design planner. The toxicant list provided with these labs have all been tested using the Daphnia and will show the students a variety of results. It is up to the teacher to either assign a particular toxicant to each group of students or to allow students to select the toxicant they want to test. In the inquiry activity students are encouraged to choose their own toxicant. It is critical that teachers review (and possibly limit) the toxicants that students will be using for potential safety hazards and carefully plan measures for ensuring laboratory safety. The amount of time required to complete Part 2 varies. The guided version of the toxicant lab activity and data collection could be completed in 40 minutes if data analysis is done for homework. The inquiry version will require at least 70 minutes in order to allow time for the students to plan their experiments.
My Environment, My Health, My Choices 9 © 2006, University of Rochester May be copied for classroom use
Possible Timeline:
Class Time Activity
15 minutes Administer the pre-test and introduce Part 1
40 minutes Students perform experiment and data collection portions of Part 1
25 minutes Students complete graph and data analysis questions for Part 1
15 minutes Pre-lab for students to select the toxicants for Part 2
30 minutes (Inquiry version only)
Students work in teams to design and gather materials for their experiment (Note: Time needed varies depending on students’ prior experience with experimental design.)
40 minutes Students perform experiment and data collection portions of Part 2
30 minutes Students complete graph and data analysis questions of Part 2 and complete the post-test.
Equipment and Materials: For Each Team of Students:
· One Daphnia culture per team (or alternative living organisms). See ordering information under Tips for Lab Preparation.
· One Molded Exposure Chamber (or 6 test tubes, condiment cups, medicine cups). See ordering information under Tips for Setting Up Lab
· Two plastic transfer pipettes, one with end cut off · Two small plastic graduated transfer pipettes · Containers (10 mL at least) for preparing solutions—small beakers, condiment cups,
medicine cups · Small labels or tape for labeling exposure chambers and solution containers · 1 graduated cylinder (10 mL) · stopwatch or timer · Access to spring water · For Part 1: 2% Salt (NaCl) Solution (approx. 60 mL per group) · For Part 2: Other Toxicant Solutions (see Preparation Instructions)
For the class:
· Class Data Table (See Appendix B) For Teacher Preparation of Toxicant Solutions
· 1000 mL beaker, graduated cylinder, or volumetric flask · 2 Liters of Spring Water · Stirring rod/spoon · Bottles for Solutions · Sodium Chloride (NaCl) · Other toxicants (see discussion below) · Funnel and filter Paper for preparation of some toxicants like tobacco.
My Environment, My Health, My Choices 10 © 2006, University of Rochester May be copied for classroom use
Tips for Lab Preparation:
1. Order Molded Exposure Chambers from Edvotek ( www.edvotek.com/954.html or contact 800-338-6835). The cost is $25.00 for 5 exposure chambers. You may substitute the following for the exposure chambers. · Small test tubes (at least 15 mL volume) and test tube racks · Plastic medicine cups · Plastic condiment cups
2. Order living Daphnia from a biological supply company. Ideally you should order one culture jar for each group of students. For example, if you have five classes, each with 10 student groups, you should order ten Daphnia cultures. If you only have one class, it would be appropriate to order one or two cultures and divide the Daphnia into separate containers just before class. The author suggests Carolina Biological Supply company as a source of Daphnia ( https://www2.carolina.com or 800.334-5555). The cost for Daphnia magna cultures is approximately $7.00 per culture. You can also order a Daphnia magna Culture Kit for approximately $32.50 if you wish to raise your own large supply of Daphnia.
3. Do not use detergent to clean the exposure chambers or test tubes. Detergent residues may be toxic to Daphnia.
4. Cut the tips off of the plastic transfer pipettes that the students will use to transfer the daphnia. This will make the opening of the pipettes larger so the students can capture daphnia without damaging them.
5. Use spring water for the control group rather than distilled water or tap water!
6. Make sure the students use removable labels or masking tape when they label their solution containers and exposure columns. Students should NOT use permanent markers or wax pencils because these are too difficult to clean. As an alternative, the teacher may wish to label the exposure chambers (1 through 6) with a permanent marker before they are used.
7. Place a black piece of paper behind the exposure chamber to make the Daphnia easier to count.
8. If the teacher prepares the different concentrations of salt and toxicant solutions in advance (instead of having the students prepare their own) students will have more opportunity for observations in the lab. But, this advance preparation involves additional teacher preparation time and additional stock containers of toxicants.
9. Instructions for optional maintenance of Daphnia cultures in your classroom are provided online at: http://www.carolina.com/manuals/manuals2/Culturing%20Daphnia%20magna.pdf#search=%22carolina%20biological%20supply%20culturing%20daphnia%22
Preparation of 2% Salt (NaCl) Solution for Part 1:
· Weigh 20g of sodium chloride (NaCl) · Pour it into a graduated cylinder or volumetric flask containing about 800ml of water
· Once the sodium chloride has dissolved completely (swirl the flask gently if necessary), add water to bring the volume up to the final 1000 ml.
My Environment, My Health, My Choices 11 © 2006, University of Rochester May be copied for classroom use
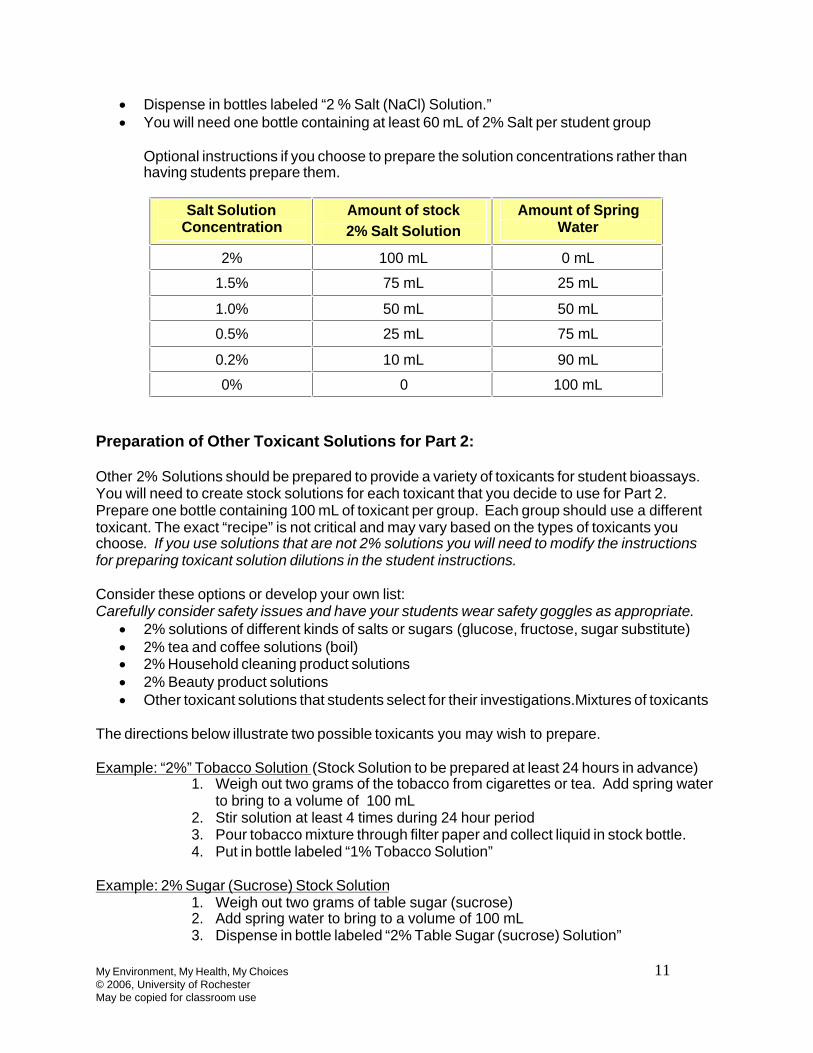
· Dispense in bottles labeled “2 % Salt (NaCl) Solution.” · You will need one bottle containing at least 60 mL of 2% Salt per student group
Optional instructions if you choose to prepare the solution concentrations rather than having students prepare them.
Salt Solution Concentration
Amount of stock
2% Salt Solution
Amount of Spring Water
2% 100 mL 0 mL
1.5% 75 mL 25 mL
1.0% 50 mL 50 mL
0.5% 25 mL 75 mL
0.2% 10 mL 90 mL
0% 0 100 mL
Preparation of Other Toxicant Solutions for Part 2: Other 2% Solutions should be prepared to provide a variety of toxicants for student bioassays. You will need to create stock solutions for each toxicant that you decide to use for Part 2. Prepare one bottle containing 100 mL of toxicant per group. Each group should use a different toxicant. The exact “recipe” is not critical and may vary based on the types of toxicants you choose. If you use solutions that are not 2% solutions you will need to modify the instructions for preparing toxicant solution dilutions in the student instructions. Consider these options or develop your own list: Carefully consider safety issues and have your students wear safety goggles as appropriate.
· 2% solutions of different kinds of salts or sugars (glucose, fructose, sugar substitute) · 2% tea and coffee solutions (boil) · 2% Household cleaning product solutions · 2% Beauty product solutions · Other toxicant solutions that students select for their investigations.Mixtures of toxicants
The directions below illustrate two possible toxicants you may wish to prepare. Example: “2%” Tobacco Solution (Stock Solution to be prepared at least 24 hours in advance)
1. Weigh out two grams of the tobacco from cigarettes or tea. Add spring water to bring to a volume of 100 mL
2. Stir solution at least 4 times during 24 hour period 3. Pour tobacco mixture through filter paper and collect liquid in stock bottle. 4. Put in bottle labeled “1% Tobacco Solution”
Example: 2% Sugar (Sucrose) Stock Solution
1. Weigh out two grams of table sugar (sucrose) 2. Add spring water to bring to a volume of 100 mL 3. Dispense in bottle labeled “2% Table Sugar (sucrose) Solution”

My Environment, My Health, My Choices 12 © 2006, University of Rochester May be copied for classroom use
My Environment, My Health, My Choices 13 © 2006, University of Rochester May be copied for classroom use
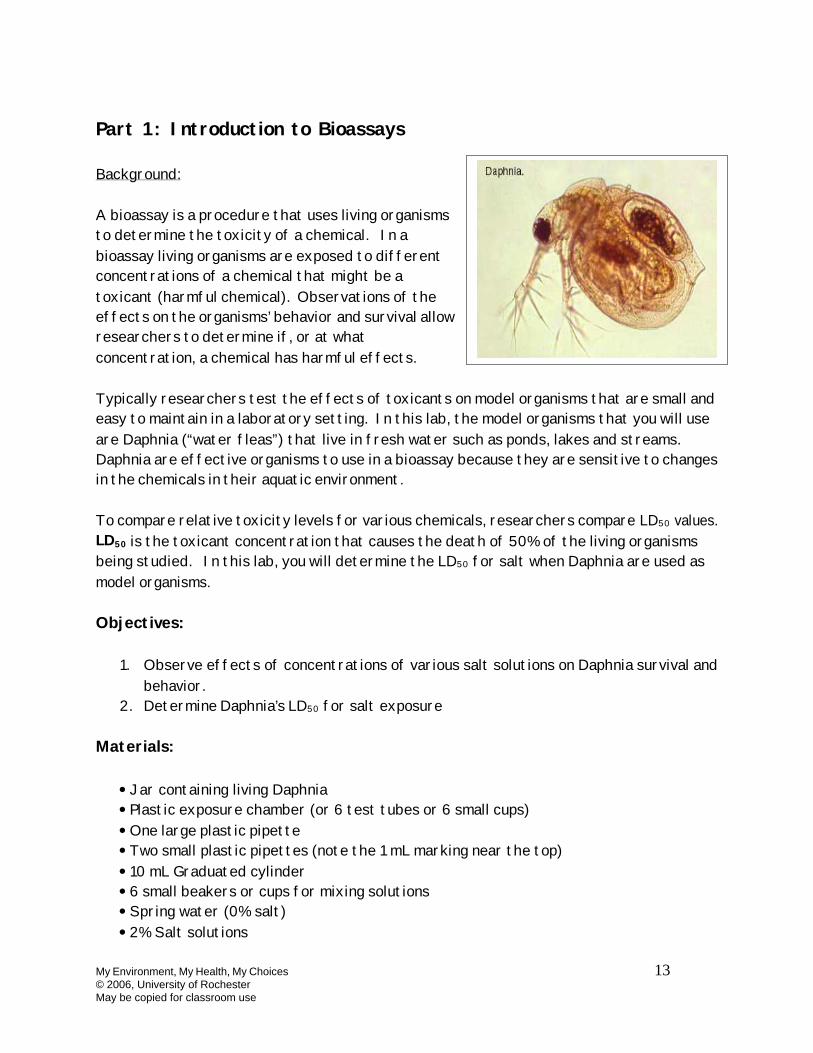
Part 1: Introduction to Bioassays
Background:
A bioassay is a procedure that uses living organisms
to determine the toxicity of a chemical. In a
bioassay living organisms are exposed to different
concentrations of a chemical that might be a
toxicant (harmful chemical). Observations of the
effects on the organisms’ behavior and survival allow
researchers to determine if, or at what
concentration, a chemical has harmful effects.
Typically researchers test the effects of toxicants on model organisms that are small and
easy to maintain in a laboratory setting. In this lab, the model organisms that you will use
are Daphnia (“water fleas”) that live in fresh water such as ponds, lakes and streams.
Daphnia are effective organisms to use in a bioassay because they are sensitive to changes
in the chemicals in their aquatic environment.
To compare relative toxicity levels for various chemicals, researchers compare LD50 values.
LD50 is the toxicant concentration that causes the death of 50% of the living organisms
being studied. In this lab, you will determine the LD50 for salt when Daphnia are used as
model organisms.
Objectives:
1. Observe effects of concentrations of various salt solutions on Daphnia survival and
behavior.
2. Determine Daphnia’s LD50 for salt exposure
Materials:
· Jar containing living Daphnia
· Plastic exposure chamber (or 6 test tubes or 6 small cups)
· One large plastic pipette
· Two small plastic pipettes (note the 1 mL marking near the top)
· 10 mL Graduated cylinder
· 6 small beakers or cups for mixing solutions
· Spring water (0% salt)
· 2% Salt solutions
My Environment, My Health, My Choices 14 © 2006, University of Rochester May be copied for classroom use
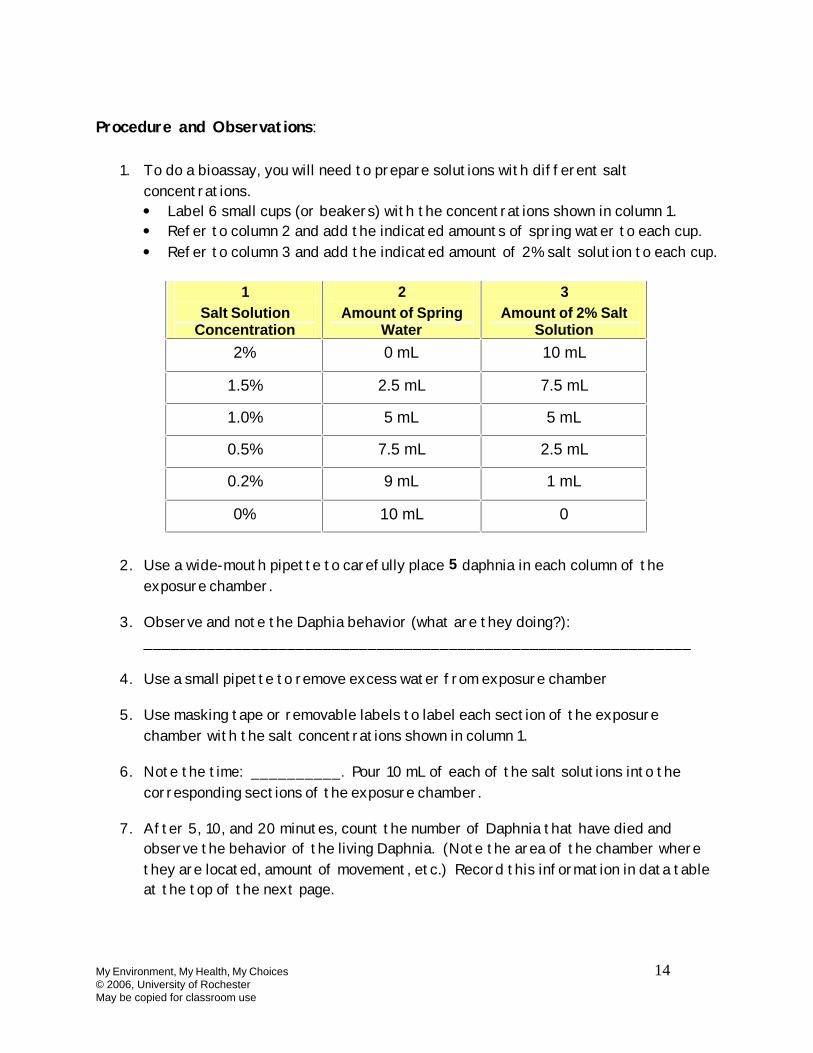
Procedure and Observations:
1. To do a bioassay, you will need to prepare solutions with different salt
concentrations.
· Label 6 small cups (or beakers) with the concentrations shown in column 1.
· Refer to column 2 and add the indicated amounts of spring water to each cup.
· Refer to column 3 and add the indicated amount of 2% salt solution to each cup.
1
Salt Solution Concentration
2
Amount of Spring Water
3
Amount of 2% Salt Solution
2% 0 mL 10 mL
1.5% 2.5 mL 7.5 mL
1.0% 5 mL 5 mL
0.5% 7.5 mL 2.5 mL
0.2% 9 mL 1 mL
0% 10 mL 0
2. Use a wide-mouth pipette to carefully place 5 daphnia in each column of the
exposure chamber.
3. Observe and note the Daphia behavior (what are they doing?):
_____________________________________________________________
4. Use a small pipette to remove excess water from exposure chamber
5. Use masking tape or removable labels to label each section of the exposure
chamber with the salt concentrations shown in column 1.
6. Note the time: __________. Pour 10 mL of each of the salt solutions into the
corresponding sections of the exposure chamber.
7. After 5, 10, and 20 minutes, count the number of Daphnia that have died and
observe the behavior of the living Daphnia. (Note the area of the chamber where
they are located, amount of movement, etc.) Record this information in data table
at the top of the next page.
My Environment, My Health, My Choices 15 © 2006, University of Rochester May be copied for classroom use
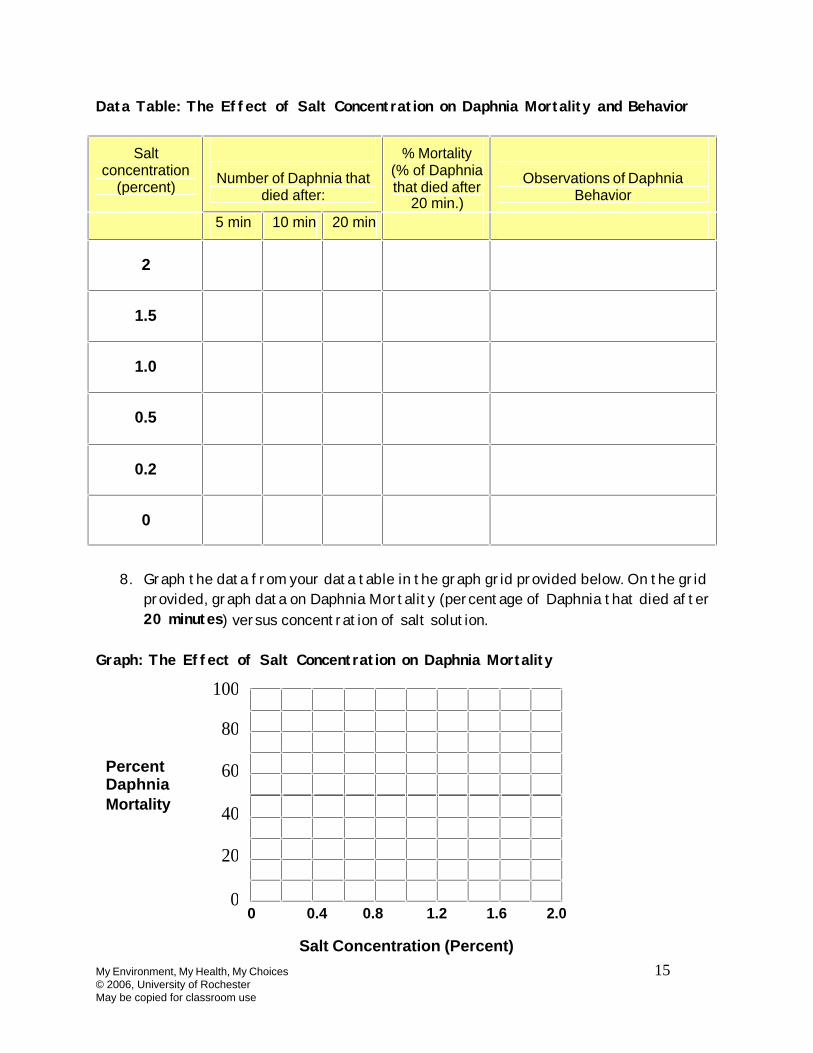
Data Table: The Effect of Salt Concentration on Daphnia Mortality and Behavior
Salt concentration
(percent)
Number of Daphnia that died after:
% Mortality (% of Daphnia that died after
20 min.)
Observations of Daphnia Behavior
5 min 10 min 20 min
2
1.5
1.0
0.5
0.2
0
8. Graph the data from your data table in the graph grid provided below. On the grid
provided, graph data on Daphnia Mortality (percentage of Daphnia that died after
20 minutes) versus concentration of salt solution.
Graph: The Effect of Salt Concentration on Daphnia Mortality
0 0.4 0.8 1.2 1.6 2.0
Salt Concentration (Percent)
Percent Daphnia Mortality
100
80
60
40
20
0
My Environment, My Health, My Choices 16 © 2006, University of Rochester May be copied for classroom use
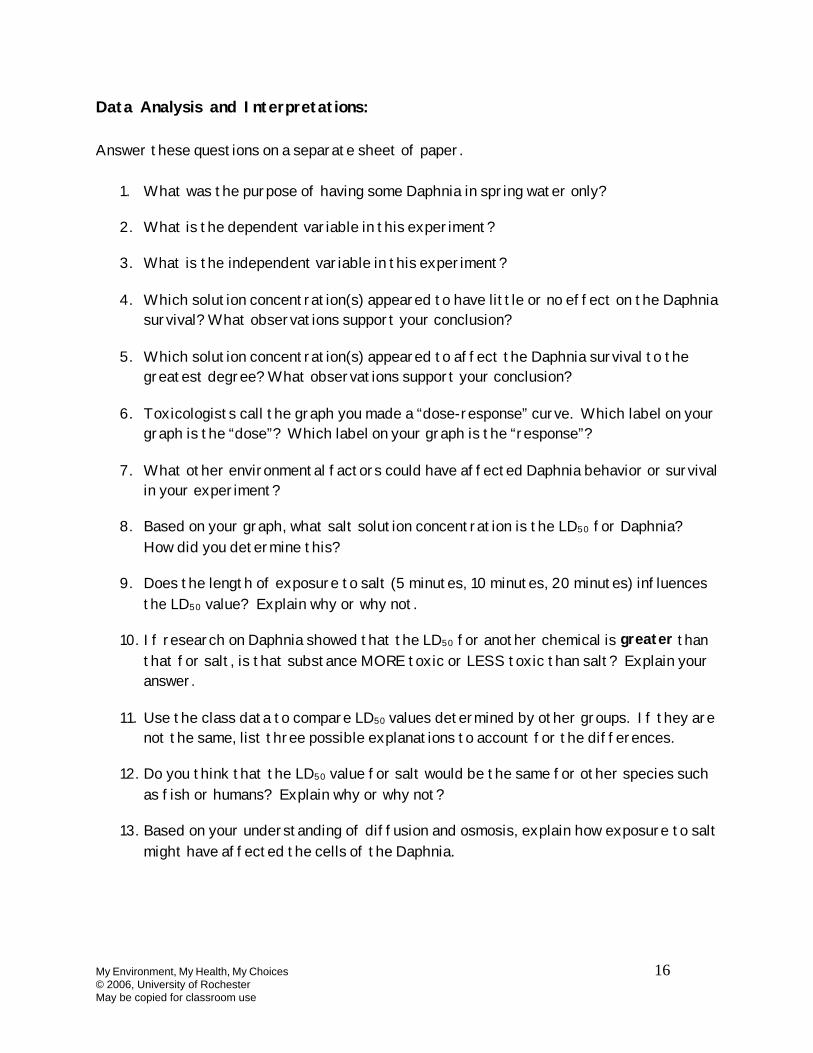
Data Analysis and Interpretations:
Answer these questions on a separate sheet of paper.
1. What was the purpose of having some Daphnia in spring water only?
2. What is the dependent variable in this experiment?
3. What is the independent variable in this experiment?
4. Which solution concentration(s) appeared to have little or no effect on the Daphnia
survival? What observations support your conclusion?
5. Which solution concentration(s) appeared to affect the Daphnia survival to the
greatest degree? What observations support your conclusion?
6. Toxicologists call the graph you made a “dose-response” curve. Which label on your
graph is the “dose”? Which label on your graph is the “response”?
7. What other environmental factors could have affected Daphnia behavior or survival
in your experiment?
8. Based on your graph, what salt solution concentration is the LD50 for Daphnia?
How did you determine this?
9. Does the length of exposure to salt (5 minutes, 10 minutes, 20 minutes) influences
the LD50 value? Explain why or why not.
10. If research on Daphnia showed that the LD50 for another chemical is greater than
that for salt, is that substance MORE toxic or LESS toxic than salt? Explain your
answer.
11. Use the class data to compare LD50 values determined by other groups. If they are
not the same, list three possible explanations to account for the differences.
12. Do you think that the LD50 value for salt would be the same for other species such
as fish or humans? Explain why or why not?
13. Based on your understanding of diffusion and osmosis, explain how exposure to salt
might have affected the cells of the Daphnia.
My Environment, My Health, My Choices 17 © 2006, University of Rochester May be copied for classroom use
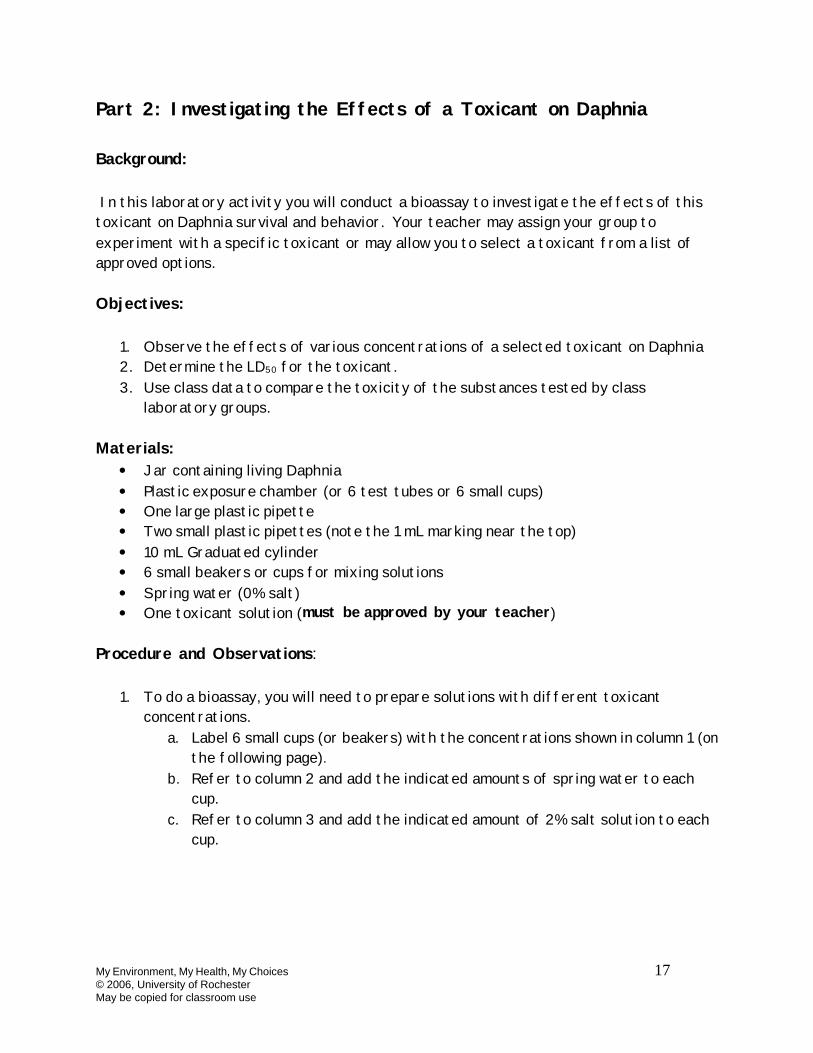
Part 2: Investigating the Effects of a Toxicant on Daphnia
Background:
In this laboratory activity you will conduct a bioassay to investigate the effects of this
toxicant on Daphnia survival and behavior. Your teacher may assign your group to
experiment with a specific toxicant or may allow you to select a toxicant from a list of
approved options.
Objectives:
1. Observe the effects of various concentrations of a selected toxicant on Daphnia
2. Determine the LD50 for the toxicant.
3. Use class data to compare the toxicity of the substances tested by class
laboratory groups.
Materials:
· Jar containing living Daphnia
· Plastic exposure chamber (or 6 test tubes or 6 small cups)
· One large plastic pipette
· Two small plastic pipettes (note the 1 mL marking near the top)
· 10 mL Graduated cylinder
· 6 small beakers or cups for mixing solutions
· Spring water (0% salt)
· One toxicant solution (must be approved by your teacher)
Procedure and Observations:
1. To do a bioassay, you will need to prepare solutions with different toxicant
concentrations.
a. Label 6 small cups (or beakers) with the concentrations shown in column 1 (on
the following page).
b. Refer to column 2 and add the indicated amounts of spring water to each
cup.
c. Refer to column 3 and add the indicated amount of 2% salt solution to each
cup.
My Environment, My Health, My Choices 18 © 2006, University of Rochester May be copied for classroom use
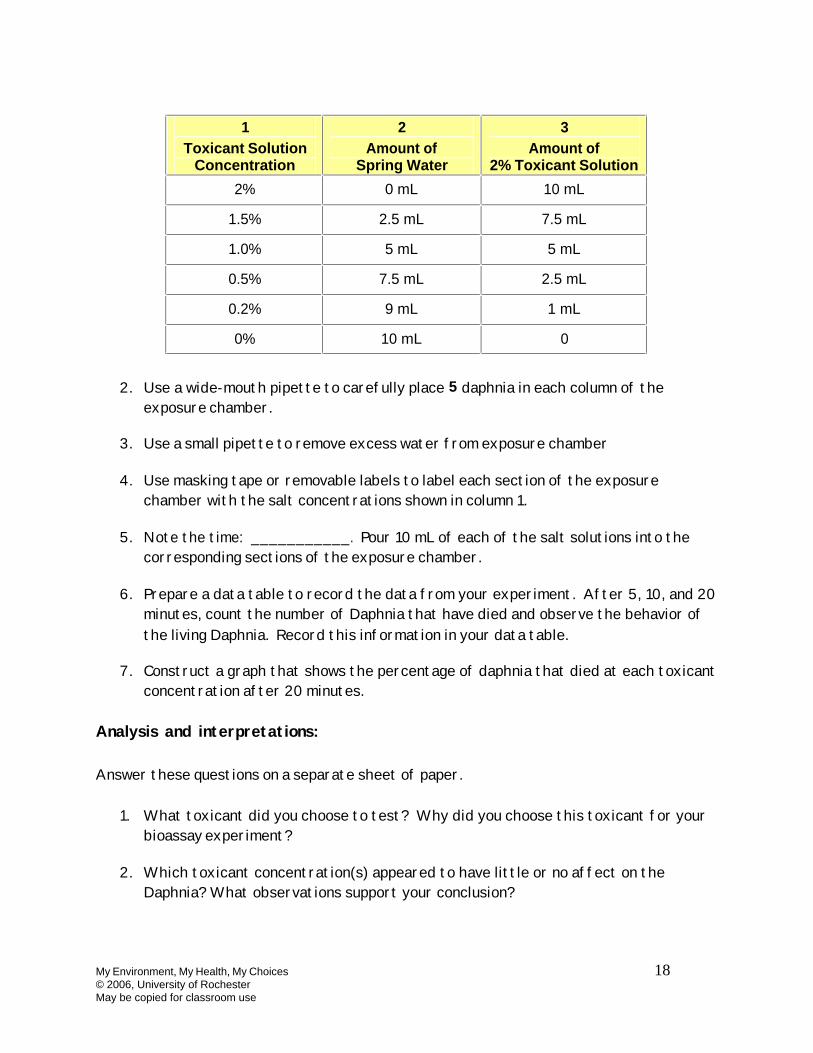
1
Toxicant Solution Concentration
2
Amount of Spring Water
3
Amount of 2% Toxicant Solution
2% 0 mL 10 mL
1.5% 2.5 mL 7.5 mL
1.0% 5 mL 5 mL
0.5% 7.5 mL 2.5 mL
0.2% 9 mL 1 mL
0% 10 mL 0
2. Use a wide-mouth pipette to carefully place 5 daphnia in each column of the
exposure chamber.
3. Use a small pipette to remove excess water from exposure chamber
4. Use masking tape or removable labels to label each section of the exposure
chamber with the salt concentrations shown in column 1.
5. Note the time: ___________. Pour 10 mL of each of the salt solutions into the
corresponding sections of the exposure chamber.
6. Prepare a data table to record the data from your experiment. After 5, 10, and 20
minutes, count the number of Daphnia that have died and observe the behavior of
the living Daphnia. Record this information in your data table.
7. Construct a graph that shows the percentage of daphnia that died at each toxicant
concentration after 20 minutes.
Analysis and interpretations:
Answer these questions on a separate sheet of paper.
1. What toxicant did you choose to test? Why did you choose this toxicant for your
bioassay experiment?
2. Which toxicant concentration(s) appeared to have little or no affect on the
Daphnia? What observations support your conclusion?

My Environment, My Health, My Choices 19 © 2006, University of Rochester May be copied for classroom use
3. Which toxicant concentration appeared have the greatest effect on Daphnia
survival after 5 minutes? What observations support your conclusion?
4. Which toxicant concentration appeared have the greatest effect on Daphnia
survival after 20 minutes? What observations support your conclusion?
5. What other factors/things could have affected Daphnia behavior/survival in your
experiment?
6. The LD50 for Daphnia in salt solution is the % of salt that caused 50% of the
Daphnia to die. Use your dose-response graph to determine the LD50 for this
toxicant?
7. Do you think that the LD50 value for this toxicant would be the same for other
species such as fish or humans? Explain why or why not?
8. Use the class data to compare LD50 values determined for other toxicants tested
by other groups. Which toxicant tested in your class is most toxic?
9. Do you think you can use the results from the daphnia bioassay to make
predications about the effect of this toxicant on humans? Explain your answer.
10. How might humans be exposed to this toxicant?
11. Use the Internet to research and identify possible health effects of short-term
exposure to this toxicant on humans?
12. Use the Internet to research and identify possible health effects of long-term
exposure to this toxicant on humans?
My Environment, My Health, My Choices 20 © 2006, University of Rochester May be copied for classroom use
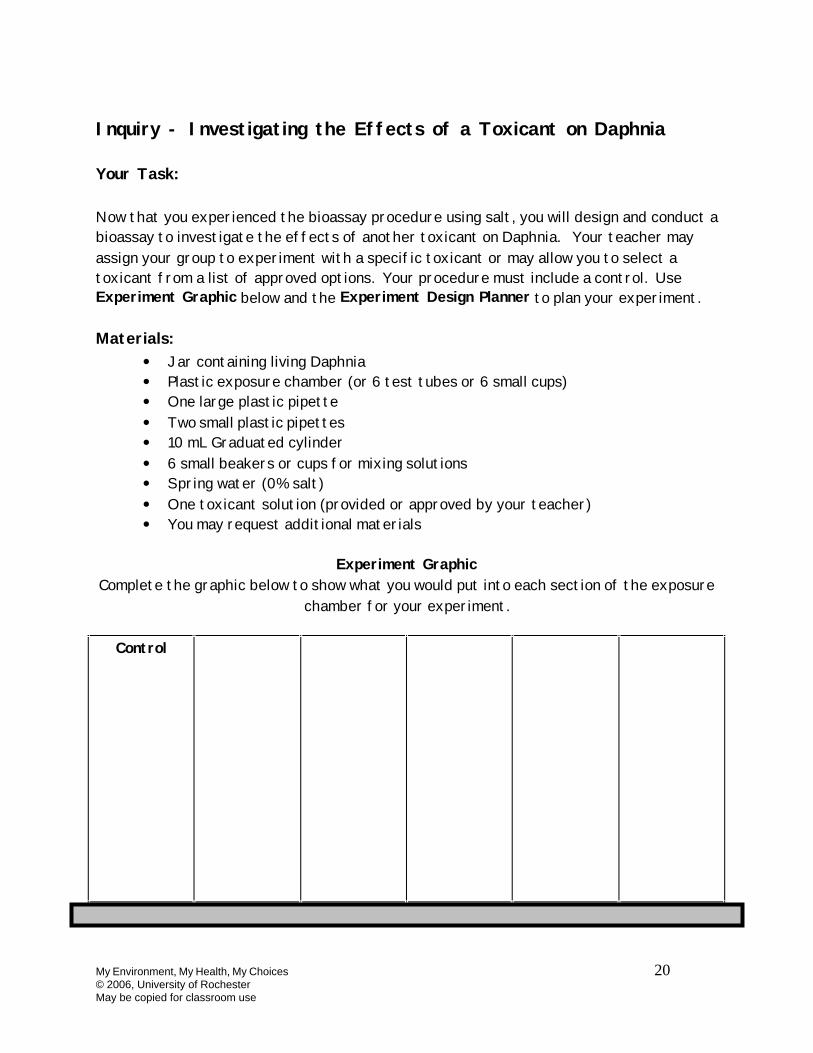
Inquiry - Investigating the Effects of a Toxicant on Daphnia
Your Task:
Now that you experienced the bioassay procedure using salt, you will design and conduct a
bioassay to investigate the effects of another toxicant on Daphnia. Your teacher may
assign your group to experiment with a specific toxicant or may allow you to select a
toxicant from a list of approved options. Your procedure must include a control. Use
Experiment Graphic below and the Experiment Design Planner to plan your experiment.
Materials:
· Jar containing living Daphnia
· Plastic exposure chamber (or 6 test tubes or 6 small cups)
· One large plastic pipette
· Two small plastic pipettes
· 10 mL Graduated cylinder
· 6 small beakers or cups for mixing solutions
· Spring water (0% salt)
· One toxicant solution (provided or approved by your teacher)
· You may request additional materials
Experiment Graphic
Complete the graphic below to show what you would put into each section of the exposure
chamber for your experiment.
Control
My Environment, My Health, My Choices 21 © 2006, University of Rochester May be copied for classroom use
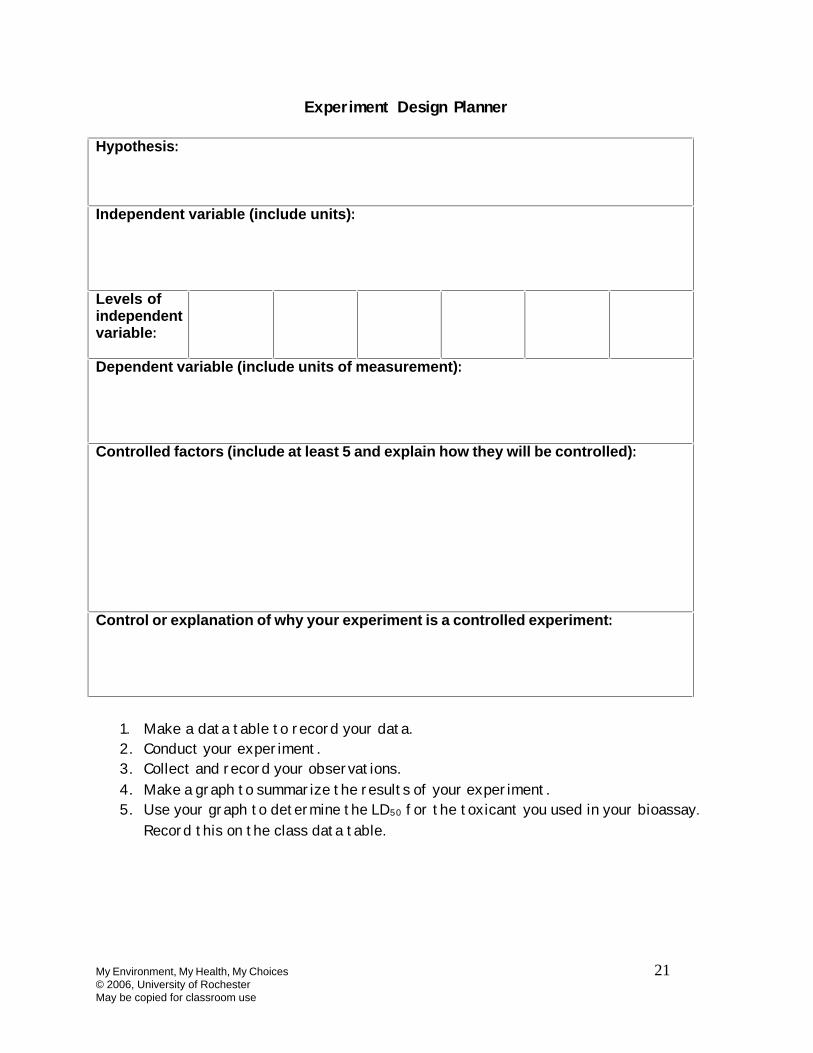
Experiment Design Planner
Hypothesis: Independent variable (include units): Levels of independent variable:
Dependent variable (include units of measurement): Controlled factors (include at least 5 and explain how they will be controlled): Control or explanation of why your experiment is a controlled experiment:
1. Make a data table to record your data.
2. Conduct your experiment.
3. Collect and record your observations.
4. Make a graph to summarize the results of your experiment.
5. Use your graph to determine the LD50 for the toxicant you used in your bioassay.
Record this on the class data table.
My Environment, My Health, My Choices 22 © 2006, University of Rochester May be copied for classroom use
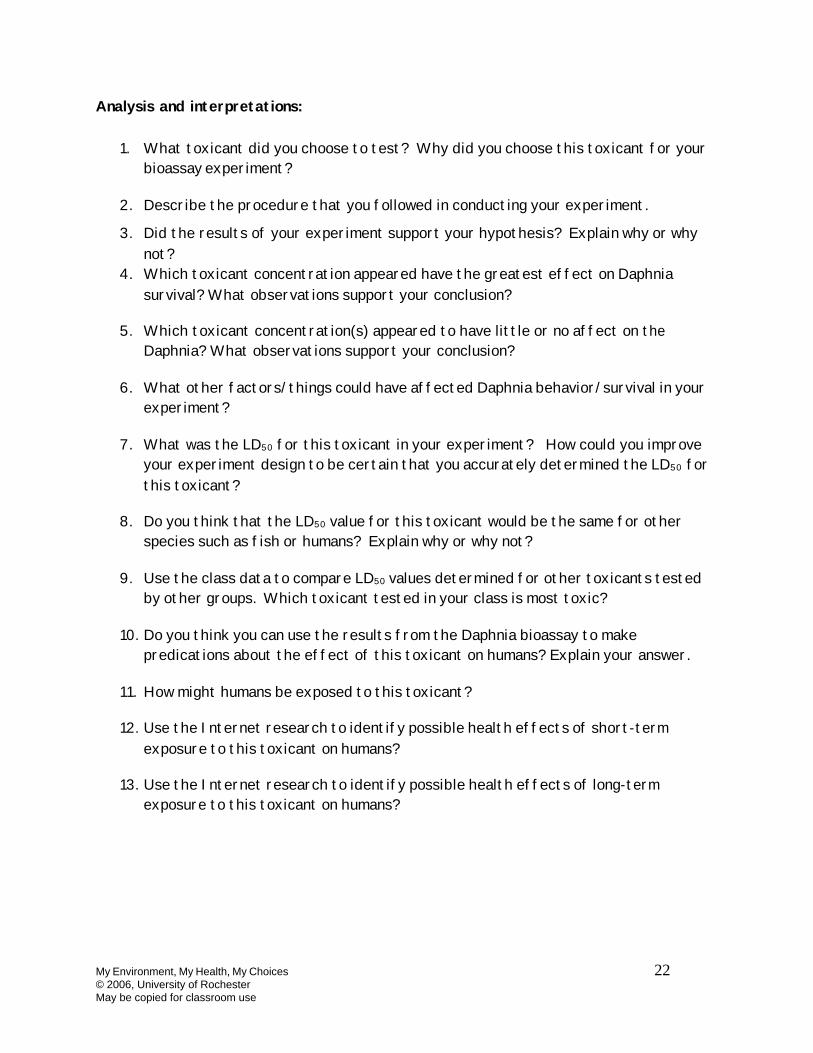
Analysis and interpretations:
1. What toxicant did you choose to test? Why did you choose this toxicant for your
bioassay experiment?
2. Describe the procedure that you followed in conducting your experiment.
3. Did the results of your experiment support your hypothesis? Explain why or why
not?
4. Which toxicant concentration appeared have the greatest effect on Daphnia
survival? What observations support your conclusion?
5. Which toxicant concentration(s) appeared to have little or no affect on the
Daphnia? What observations support your conclusion?
6. What other factors/things could have affected Daphnia behavior/survival in your
experiment?
7. What was the LD50 for this toxicant in your experiment? How could you improve
your experiment design to be certain that you accurately determined the LD50 for
this toxicant?
8. Do you think that the LD50 value for this toxicant would be the same for other
species such as fish or humans? Explain why or why not?
9. Use the class data to compare LD50 values determined for other toxicants tested
by other groups. Which toxicant tested in your class is most toxic?
10. Do you think you can use the results from the Daphnia bioassay to make
predications about the effect of this toxicant on humans? Explain your answer.
11. How might humans be exposed to this toxicant?
12. Use the Internet research to identify possible health effects of short-term
exposure to this toxicant on humans?
13. Use the Internet research to identify possible health effects of long-term
exposure to this toxicant on humans?

My Environment, My Health, My Choices 23 © 2006, University of Rochester May be copied for classroom use
Teacher Resources http://ei.cornell.edu/ and http://ei.cornell.edu/toxicology/bioassays/ Environmental Inquiry: Authentic Science Research for High School Students. Excellent sites which provide information on different toxicology and bioassay concepts. The Assessing Toxic Risks book is highly recommended if you wish to use Toxicology as an inquiry focus in your classroom. Explore other publications at this site http://www.edvotek.com/954.html Edvotek Toxicity Testing for Pollutants in Fresh Water. This experiment is adapted from the IQ Toxicity Test, an actual water quality test which uses Daphnia magna to determine toxicity levels of freshwater and to observe the effects of Toxicity Reduction and Evaluation (TRE). Digestion and hydrolysis of a fluorescent substrate by Daphnia is observed by using long wave ultraviolet light. Calculations for lethal concentration are determined. http://www.aquatox.net/docs/en/experiment/contents.cfm Additional bioassay techniques for assessing water quality. Teacher’s guide and student handouts. http://lifesciences.envmed.rochester.edu/pdfs/whats_in_our_water_full.pdf What’s In Our Water? Over 2 dozen water testing activities designed for high school students.

My Environment, My Health, My Choices 24 © 2006, University of Rochester May be copied for classroom use
New York State Learning Standards and Performance Indicators Standard 1: Students will use mathematical analysis, scientific inquiry, and engineering design, as appropriate, to pose questions, seek answers, and develop solutions.
· Key Idea 2: Beyond the use of reasoning and consensus, scientific inquiry involves the testing of proposed explanations involving the use of conventional techniques and procedures and usually requiring considerable ingenuity.
o Performance Indicator 2.1: Devise ways of making observations to test proposed explanations
o Performance Indicator 2.3: Develop and present proposals including formal hypotheses to test explanations
o Performance Indicator 2.4: Carry out a research plan for testing explanations, including selecting and developing techniques, acquiring and building apparatus, and recording observations as necessary
· Key Idea 3: The observations made while testing proposed explanations, when analyzed using conventional and invented methods, provide new insights into natural phenomena
o Performance Indicator 3.1: Use various methods of representing and organizing observations and insightfully interpret the organized data
Standard 7: Students will apply the knowledge and thinking skills of mathematics, science, and technology to address real-life problems and make informed decisions.
· 1. Connections: the knowledge and skills of mathematics, science, and technology are used together to make informed decisions and solve problems, especially those related to issues of science/technology/society, consumer decision making, design, and inquiry into phenomena
· 2. Strategies: Solving interdisciplinary problems involves a variety of skills and strategies, including effective work habits; gathering and processing information; generating and analyzing ideas; realizing ideas; making connections among the common themes of mathematics, science and technology; and presenting results.

My Environment, My Health, My Choices 25 © 2006, University of Rochester May be copied for classroom use
Appendix A: Alternatives to using Daphnia California Blackworms or Planaria Use the same bioassay instructions but substitute California blackworms (Lumbriculus) or Planaria for Daphnia. Duckweed If you utilize duckweed please note that the results will need to be collected over a period of days as their growth, or lack of growth, takes time (this might be a good long term project for your students). Modify the instructions as follows:
Materials: · 20 mL of 10% potentially toxic chemical · Dish with duckweed plants · Bottled spring water · Bottles of different salt solutions · 5 plastic cups · Petri dish lid for covering cups · Loop for moving duckweed · 1 permanent marker · 1 graduated cylinder (100 mL) · 1 forceps (tweezers for handling duckweed) · Magnifying glass (for observing duckweed)
Instead of planting your duckweed plants in a pond, you will plant them in a plastic cup.
Procedure: · Write your initials, the chemical tested, and concentration on the cup · Put 150 mL of the solution you are testing in to the cup. · Place 10 duckweed plants (10 lobes) into the cup—use a magnifying glass to count the
duckweed plants and a loop to move them into the cup. · Cover the cup with the plastic Petri dish lid · Place the cup in a well-lit section of the room. · Collect data (count the number of lobes/plants) each day for five days.
Note: This diagram shows 9 duckweed plants - you count each lobe as a plant
My Environment, My Health, My Choices 26 © 2006, University of Rochester May be copied for classroom use
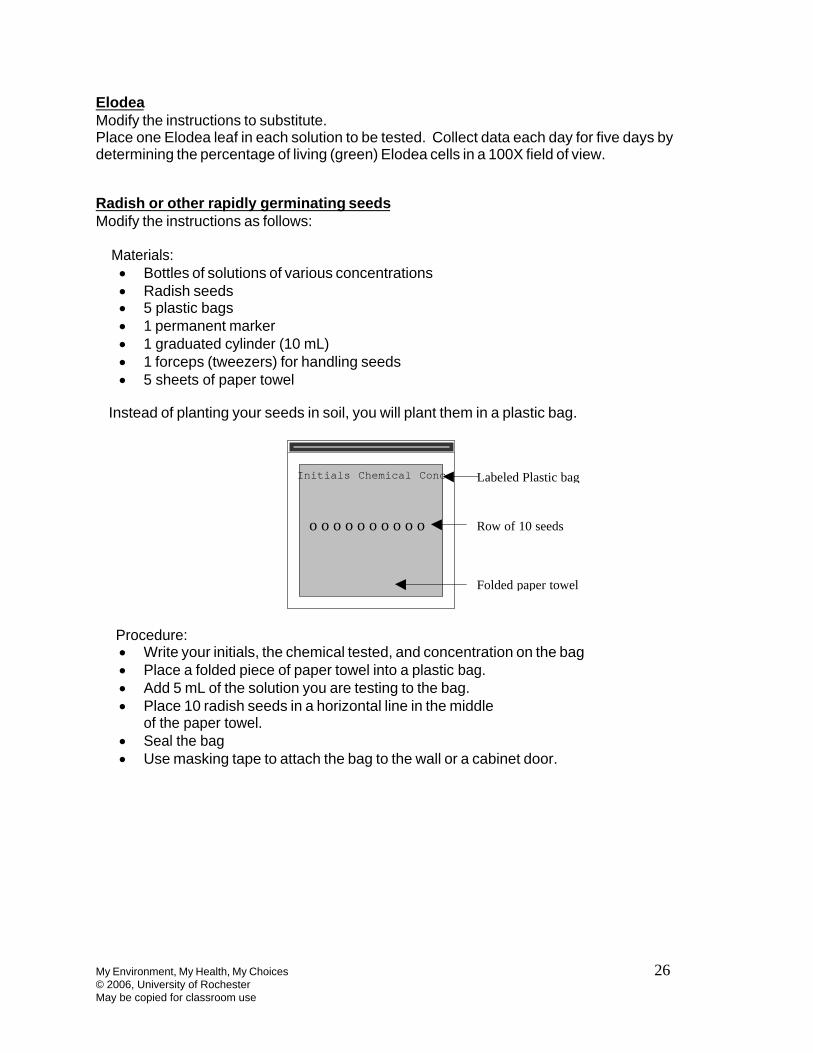
Elodea Modify the instructions to substitute. Place one Elodea leaf in each solution to be tested. Collect data each day for five days by determining the percentage of living (green) Elodea cells in a 100X field of view. Radish or other rapidly germinating seeds Modify the instructions as follows: Materials:
· Bottles of solutions of various concentrations · Radish seeds · 5 plastic bags · 1 permanent marker · 1 graduated cylinder (10 mL) · 1 forceps (tweezers) for handling seeds · 5 sheets of paper towel
Instead of planting your seeds in soil, you will plant them in a plastic bag.
Procedure: · Write your initials, the chemical tested, and concentration on the bag · Place a folded piece of paper towel into a plastic bag. · Add 5 mL of the solution you are testing to the bag. · Place 10 radish seeds in a horizontal line in the middle
of the paper towel. · Seal the bag · Use masking tape to attach the bag to the wall or a cabinet door.
Initials Chemical Conc Labeled Plastic bag
Folded paper towel
Row of 10 seeds o o o o o o o o o o
My Environment, My Health, My Choices 27 © 2006, University of Rochester May be copied for classroom use
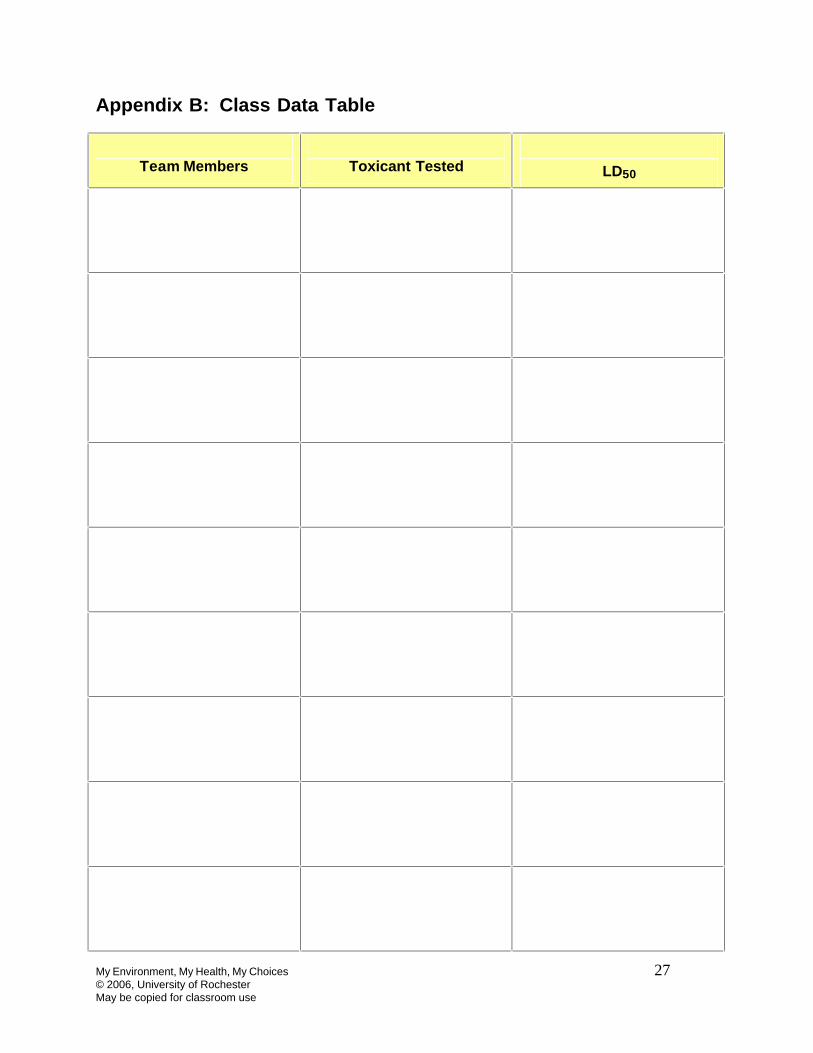
Appendix B: Class Data Table
Team Members
Toxicant Tested
LD50
My Environment, My Health, My Choices 28 © 2006, University of Rochester May be copied for classroom use
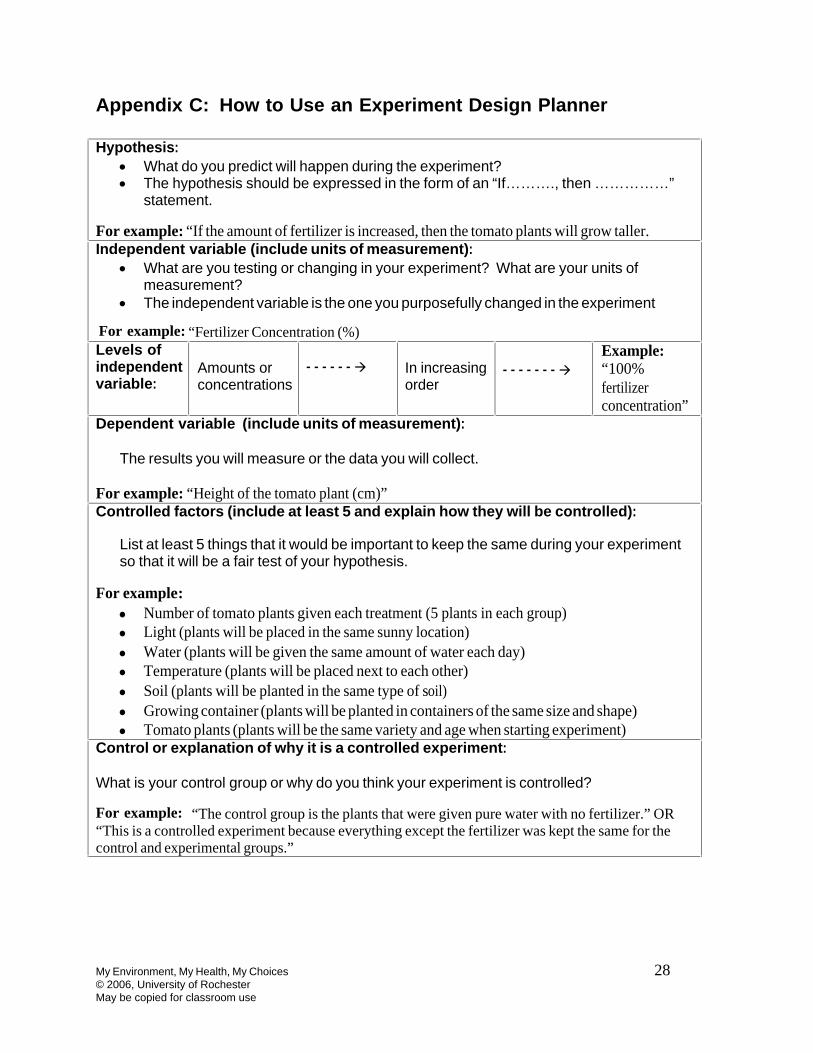
Appendix C: How to Use an Experiment Design Planner
Hypothesis:
· What do you predict will happen during the experiment? · The hypothesis should be expressed in the form of an “If………., then ……………”
statement.
For example: “If the amount of fertilizer is increased, then the tomato plants will grow taller. Independent variable (include units of measurement):
· What are you testing or changing in your experiment? What are your units of measurement?
· The independent variable is the one you purposefully changed in the experiment For example: “Fertilizer Concentration (%) Levels of independent variable:
Amounts or concentrations
------à In increasing order
-------à
Example: “100% fertilizer concentration”
Dependent variable (include units of measurement): The results you will measure or the data you will collect.
For example: “Height of the tomato plant (cm)” Controlled factors (include at least 5 and explain how they will be controlled):
List at least 5 things that it would be important to keep the same during your experiment so that it will be a fair test of your hypothesis.
For example:
· Number of tomato plants given each treatment (5 plants in each group) · Light (plants will be placed in the same sunny location)
· Water (plants will be given the same amount of water each day) · Temperature (plants will be placed next to each other)
· Soil (plants will be planted in the same type of soil)
· Growing container (plants will be planted in containers of the same size and shape) · Tomato plants (plants will be the same variety and age when starting experiment)
Control or explanation of why it is a controlled experiment: What is your control group or why do you think your experiment is controlled? For example: “The control group is the plants that were given pure water with no fertilizer.” OR “This is a controlled experiment because everything except the fertilizer was kept the same for the control and experimental groups.”


![Centennial clonal stability of asexual Daphnia in ... · 7/22/2020 · 88 Daphnia, in particular the large-bodied Daphnia pulex-complex [7]. Arctic Daphnia 89 populations are generally](https://static.fdocuments.in/doc/165x107/5fb33315ffe483517d15d37c/centennial-clonal-stability-of-asexual-daphnia-in-7222020-88-daphnia-in.jpg)


