
bio-glass surface for accelerating wound healing … · 5 Hierarchically micro-patterned...
12
1 Supporting Information 2 3 4 5 Hierarchically micro-patterned nanofibrous scaffolds with nanosized 6 bio-glass surface for accelerating wound healing 7 He Xu, a † Fang Lv, b † Yali Zhang, c † Zhengfang Yi, b * Qinfei Ke, a * Chengtie Wu, c * 8 Mingyao Liu, b Jiang Chang c 9 10 Experimental Section 11 Preparation of patterned electrospun scaffolds with nano-sized bioglass: The blend of 12 PDLLA (Mn=45 kDa, D/L=50/50, Jinan Daigang Biomaterial Co, Ltd, China) and 13 PCL (Mn=80 kDa, Sigma-Aldrich) (1/1, w/w) were dissolved in a mixture of DMF 14 and THF (4:1, v/v), and then stirred for six hours to obtain a homogeneous and stable 15 solution (4.8%, w/v). The solution was fed at a constant rate (0.2 mL h −1 ) by a syringe 16 pump (LSP01-1A, Baoding Longer Precision Pump, China) through a 21 gauge blunt 17 tip needle. A high-voltage power supply (HV30, NanoNC) was used to apply a high 18 voltage (8 kV) between the metal needle and the collector. The needle-to-collector 19 distance was set to 12 cm. The electrospun nanofibrous scaffolds with different 20 micro/nano patterns were fabricated using the same method introduced in our 21 previous work. 1 In addition, electrospun scaffolds with non-woven structures were 22 also prepared using a plane collector as controls. These patterned and non-woven 23 electrospun scaffolds were named as PT and NW, respectively. 24 An akermanite (AKT; Ca 2 MgSi 2 O 7 ) ceramic disk (Ø20 × 3 mm) was prepared by 25 sintering the AKT green compacts at 1350 o C according to a previous study. 2 The Electronic Supplementary Material (ESI) for Nanoscale. This journal is © The Royal Society of Chemistry 2015
Transcript of bio-glass surface for accelerating wound healing … · 5 Hierarchically micro-patterned...
1 Supporting Information2345 Hierarchically micro-patterned nanofibrous scaffolds with nanosized 6 bio-glass surface for accelerating wound healing7 He Xu,a† Fang Lv,b† Yali Zhang,c† Zhengfang Yi,b* Qinfei Ke,a* Chengtie Wu,c* 8 Mingyao Liu,b Jiang Changc
9
10 Experimental Section
11 Preparation of patterned electrospun scaffolds with nano-sized bioglass: The blend of
12 PDLLA (Mn=45 kDa, D/L=50/50, Jinan Daigang Biomaterial Co, Ltd, China) and
13 PCL (Mn=80 kDa, Sigma-Aldrich) (1/1, w/w) were dissolved in a mixture of DMF
14 and THF (4:1, v/v), and then stirred for six hours to obtain a homogeneous and stable
15 solution (4.8%, w/v). The solution was fed at a constant rate (0.2 mL h−1) by a syringe
16 pump (LSP01-1A, Baoding Longer Precision Pump, China) through a 21 gauge blunt
17 tip needle. A high-voltage power supply (HV30, NanoNC) was used to apply a high
18 voltage (8 kV) between the metal needle and the collector. The needle-to-collector
19 distance was set to 12 cm. The electrospun nanofibrous scaffolds with different
20 micro/nano patterns were fabricated using the same method introduced in our
21 previous work.1 In addition, electrospun scaffolds with non-woven structures were
22 also prepared using a plane collector as controls. These patterned and non-woven
23 electrospun scaffolds were named as PT and NW, respectively.
24 An akermanite (AKT; Ca2MgSi2O7) ceramic disk (Ø20 × 3 mm) was prepared by
25 sintering the AKT green compacts at 1350 o C according to a previous study.2 The
Electronic Supplementary Material (ESI) for Nanoscale.This journal is © The Royal Society of Chemistry 2015
1 AKT disk was used for the targets to coat samples. The prepared electrospun scaffolds
2 were fixed on the sample stage in the chamber of the PLD instrument using double-
3 sided adhesive. Then, the sintered AKT disk was ablated using focused laser fluence
4 of 180 MJ with a pulsed repetition rate of 5 Hz at room temperature. The O2 ambient
5 was set with a pressure of 20 MPa. The treating time was set at 30 min to obtain AKT
6 coatings with a uniform thickness. The prepared patterned and non-woven electrospun
7 scaffolds with nano-sized bioglass coatings were named as PT-NBG and NW-NBG,
8 respectively.
9 Microstructure, composition and surface wettability of the electrospun scaffolds: The
10 morphology and microstructure of the prepared composite scaffolds were observed by
11 scanning electron microscopy (SEM; FEI Magellan 400). The chemical composition
12 and phase structure of the prepared films was characterized by energy dispersive
13 spectrum (EDS) and X-ray diffraction (XRD, D8 ADVANCE). The hydrophilicity of
14 the prepared films was investigated by testing the water contact angle (Kruss GmbH
15 DSA 100 Mk 2).
16 ICP-AES analysis for ionic release: To measure the ionic release of Si, Ca and Mg
17 from scaffolds, five scaffolds (25×25 mm) were soaked in 10mL of phosphate
18 buffered saline (PBS) (pH 7.4) at 37°C for 1, 3 and 7 days. The solution was refreshed
19 at each time point. The concentrations of released Si, Ca and Mg ions in the PBS were
20 determined by inductive coupled plasma atomic emission spectrometry (ICP-AES)
21 (Varian 715ES).
1 Cell culture: Human umbilical vein endothelial cells (HUVECs) were isolated from
2 the human umbilical cord vein according to the descriptions of Bordenave et al. and
3 Jaffe.3,4 The procedure was approved by the Ethics Committee of Chinese Academy
4 of Sciences. The obtained cell pellets were re-dispersed in endothelial cell medium
5 (ECM) (Sciencell, USA) containing 5% (vol./vol.) FBS and 1% (vol./vol.) endothelial
6 cell growth supplement/heparin kit (ECGS/H, Promocell). In this study, cells between
7 passages 3 and 5 were employed.
8 HUVECs proliferation assay: Scaffolds were first sectioned into 10 × 10 mm2 squares,
9 and then and soaked in 75 vol.% medical alcohol solution for 2 h for sterilization prior
10 to seeding cells on the samples. HUVECs were seeded on the surfaces of those
11 scaffolds at a density of 1.5 × 10⁴ cells per well in a 24-well culture plate, and then
12 cultured in a humidified 37 oC/5%, CO2 incubator for 6, 24 and 72 hours. Cells
13 cultured on the culture plates were regarded as controls. The medium was replaced
14 every 1 days. A CCK-8 assay (Cell counting kit-8, Dojindo, Kumamoto, Japan) was
15 performed according to the manufacturer’s instructions. The absorbance of the
16 samples was measured at 450 nm using an enzyme-linked immunosorbent assay plate
17 reader (Synergy 2, Bio-TEK).
18 Immunofluorescence staining: For further investigating the cytoskeletal and nuclear
19 organizations of HUVECs cultured on different scaffolds, the actin filaments and
20 nuclear of HUVECs were stained utilizing rodamine phalloidin R415 (Invitrogen) and
21 4-6-diamidino-2-phenylindole (DAPI) (Invitrogen) according to the supplier’s
1 procedure, respectively. A confocal microscope (Leica TCS SP5) was used to image
2 the morphologies of the seeded cells on different scaffolds.
3 Animal model of full thickness wound: All animals were obtained from the National
4 Rodent Laboratory Animal Resources, Shanghai Branch of China. The mice were
5 bred and maintained in the animal center in East China Normal University and all of
6 the experimental protocols were approved by the Animal Investigation Committee of
7 the Institute of Biomedical Sciences and School of Life Sciences, East China Normal
8 University.
9 A total of 55 Male, BALB/c mice weighing approximately 18 g and five mice for
10 each group were applied to evaluate the wound healing efficiency. After mice were
11 anesthetized with anesthetic ventilator and the dorsal hair was shaved. Then, we made
12 a circular trace using a punch (diameter of 8 mm) and cut out a circular full-thickness
13 wound along the trace. The created wounds were covered with four the prepared
14 scaffolds. Four kinds of groups were (a) no treatment, (b) NW, (c) NW-NBG, (d) PT
15 and (e) PT-NBG, respectively. All the scaffolds were firstly cut into round samples
16 with diameter of 8 mm by using a punch, and then the samples were sterilized by 75%
17 ethanol solution for 30 min and washed thrice with sterilized PBS before applied to
18 cover the wound area. After that the wound area was treated with medical grade
19 adhesive bandage for the conventional wound care. After surgery, each mouse was
20 caged individually with free access to water and food under SPF environmental
21 conditions so as to avoid antibacterial interference caused by external conditions.Once

1 wounded, digital pictures at a fixed distance and angle of the wound area were
2 captured to measurement of wound size change. At 3 and 7days after the surgery,
3 mice were sacrificed by inhalation of carbon dioxide. Moreover, the tissue
4 surrounding the wounds (2 mm farther) was removed.
5 The method to calculate the wound sizes percent reduction in wound size:
6 Wound size reduction (%) =[ A0-At]/A0 ×100%
7 Where A0 and At are the initial wound area and wound area at a time interval “t”,
8 respectively.
9 Histomorphometric analysis and Immunohistofluorescence of wound tissue sections:
10 On day 3 and 7, the wounds were excised. After fixation with 4% paraformaldehyde
11 for at least 12 h, the samples were dehydrated in graded alcohols, dimethylbenzene
12 and then the specimens were embedded in paraffin.
13 Finally the tissue sections were sectioned into samples with thickness of 5 μm.
14 Histological evaluation and immunohistofluorescence assay was performed according
15 to the method previously described.5 Histological evaluation, the samples were
16 deparaffinized, rehydrated and stained with haematoxylin and eosin for routine
17 histology processing. Masson’s trichrome stain was performed for observation of the
18 collagen framework and collagen expression. All images were taken at ×20
19 magnification and Image Pro Plus version 6.0 (Media Cybernetics, Rockville, MD,
20 USA) was used to quantify the re-epithelization and the collagen per area, the
21 intensity RGB threshold wasset for the blue–green positive colour of collagen and the

1 number of positive pixelswas counted. For every counting, images with ×20
2 magnification were used and five random positions were chose for each image.5 For
3 immunohistofluorescence staining, the tissue sections (5μm thick) were
4 deparaffinized and boiled for 20 min in sodium citrate buffer. After that the sections
5 were cooled down to room temperature for at least 1 h and incubated with primary
6 antibodies overnight in 4oC environment, including rabbit polyclonal to CD31
7 antibody (Abcam, product number ab28364). Then sections were washed in PBS
8 solution, incubated with a secondary antibody for 2 hours at room temperature.
9 Then, 4’,6-diamidino-2-phenylindole (DAPI) was added to samples for 5min,
10 avoiding light. Slides were evaluated using an optical microscope (Leica Confocal
11 microscope).
12 Real-Time Polymerase Chain Reaction: The mRNA transcript level of VEGF was
13 assessed by real-time PCR. The primer sequences were designed using the primer 5.0
14 software. The wound tissue total RNA was isolated with Trizol reagent (Invintrogen).
15 1 µg of total RNA was reverse transcribed into cDNA with reverse transcriptase and
16 oligo dT primers (Promega, Madison, USA). In this study, the expression levels of
17 genes were relative to expression of the housekeeping gene β-actin. The expression of
18 genes for different biological materials treated wounds were compared with those
19 without treatments. The following primer sequences were used:
20 VEGF sense: 5’-CTGCTCTCTTGGGTGCACTGT-3’,
21 antisense: 5’-AGATGTCCACCAGGGTCTCA-3’.
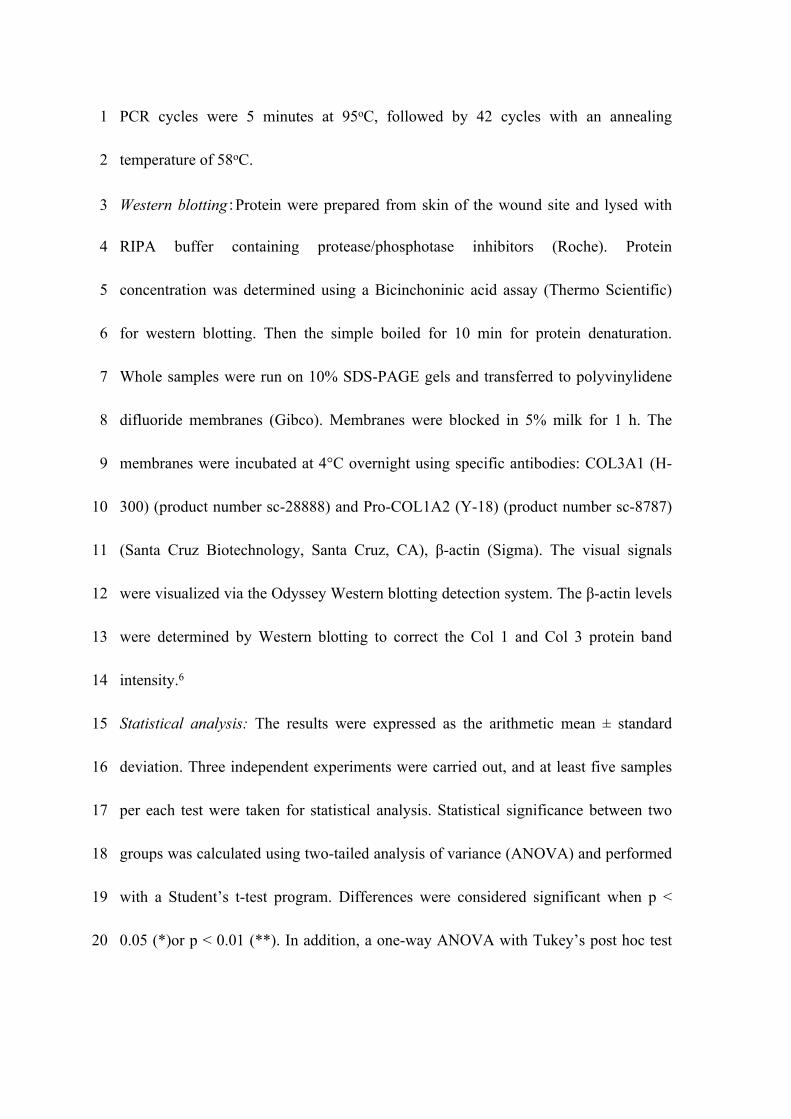
1 PCR cycles were 5 minutes at 95oC, followed by 42 cycles with an annealing
2 temperature of 58oC.
3 Western blotting:Protein were prepared from skin of the wound site and lysed with
4 RIPA buffer containing protease/phosphotase inhibitors (Roche). Protein
5 concentration was determined using a Bicinchoninic acid assay (Thermo Scientific)
6 for western blotting. Then the simple boiled for 10 min for protein denaturation.
7 Whole samples were run on 10% SDS-PAGE gels and transferred to polyvinylidene
8 difluoride membranes (Gibco). Membranes were blocked in 5% milk for 1 h. The
9 membranes were incubated at 4°C overnight using specific antibodies: COL3A1 (H-
10 300) (product number sc-28888) and Pro-COL1A2 (Y-18) (product number sc-8787)
11 (Santa Cruz Biotechnology, Santa Cruz, CA), β-actin (Sigma). The visual signals
12 were visualized via the Odyssey Western blotting detection system. The β-actin levels
13 were determined by Western blotting to correct the Col 1 and Col 3 protein band
14 intensity.6
15 Statistical analysis: The results were expressed as the arithmetic mean ± standard
16 deviation. Three independent experiments were carried out, and at least five samples
17 per each test were taken for statistical analysis. Statistical significance between two
18 groups was calculated using two-tailed analysis of variance (ANOVA) and performed
19 with a Student’s t-test program. Differences were considered significant when p <
20 0.05 (*)or p < 0.01 (**). In addition, a one-way ANOVA with Tukey’s post hoc test
1 was used for statistical analysis of multiple comparisons. Significant difference was
2 considered when p < 0.05 (*) or p < 0.01 (**).
3
4
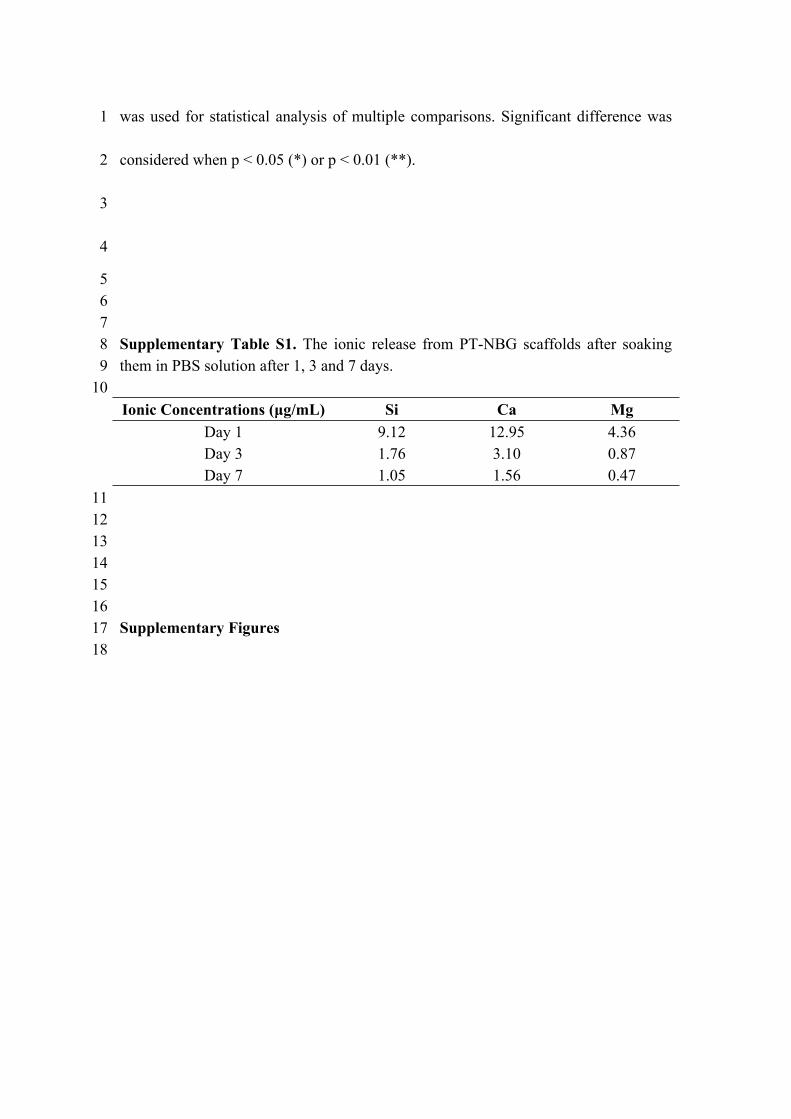
5678 Supplementary Table S1. The ionic release from PT-NBG scaffolds after soaking 9 them in PBS solution after 1, 3 and 7 days.
10Ionic Concentrations (μg/mL) Si Ca Mg
Day 1 9.12 12.95 4.36Day 3 1.76 3.10 0.87Day 7 1.05 1.56 0.47
11121314151617 Supplementary Figures18
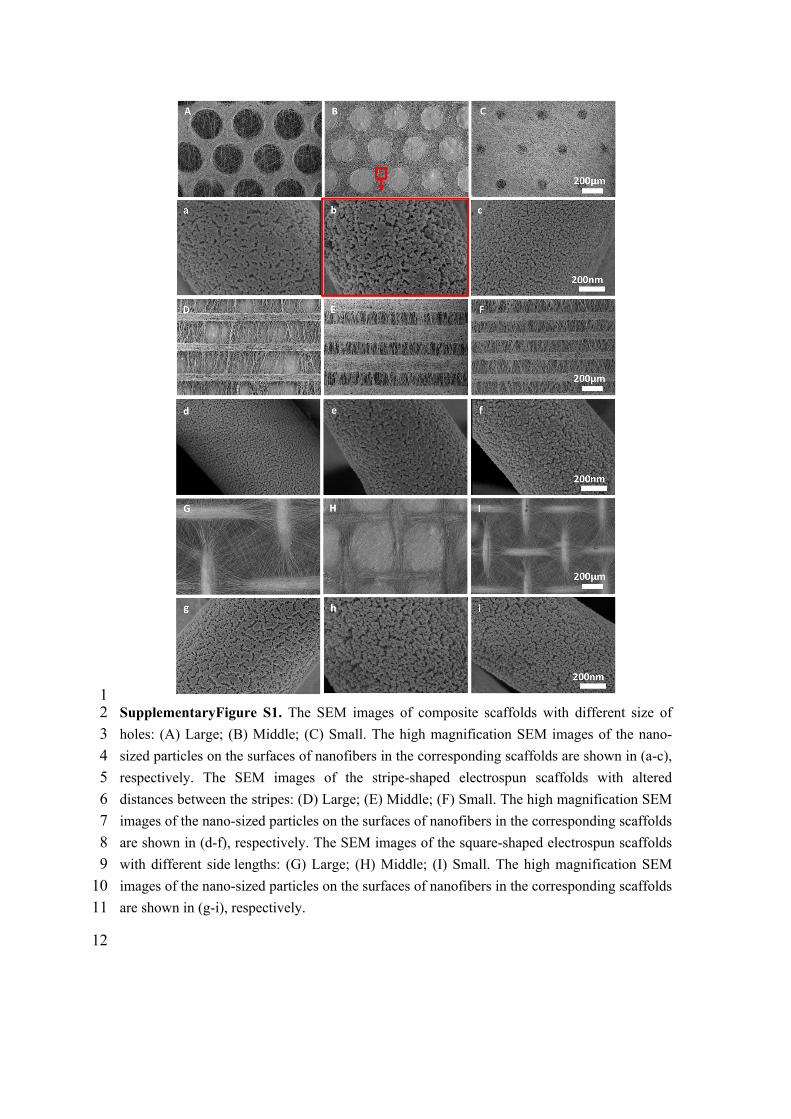
12 SupplementaryFigure S1. The SEM images of composite scaffolds with different size of 3 holes: (A) Large; (B) Middle; (C) Small. The high magnification SEM images of the nano-4 sized particles on the surfaces of nanofibers in the corresponding scaffolds are shown in (a-c), 5 respectively. The SEM images of the stripe-shaped electrospun scaffolds with altered 6 distances between the stripes: (D) Large; (E) Middle; (F) Small. The high magnification SEM 7 images of the nano-sized particles on the surfaces of nanofibers in the corresponding scaffolds 8 are shown in (d-f), respectively. The SEM images of the square-shaped electrospun scaffolds 9 with different side lengths: (G) Large; (H) Middle; (I) Small. The high magnification SEM
10 images of the nano-sized particles on the surfaces of nanofibers in the corresponding scaffolds 11 are shown in (g-i), respectively.
12
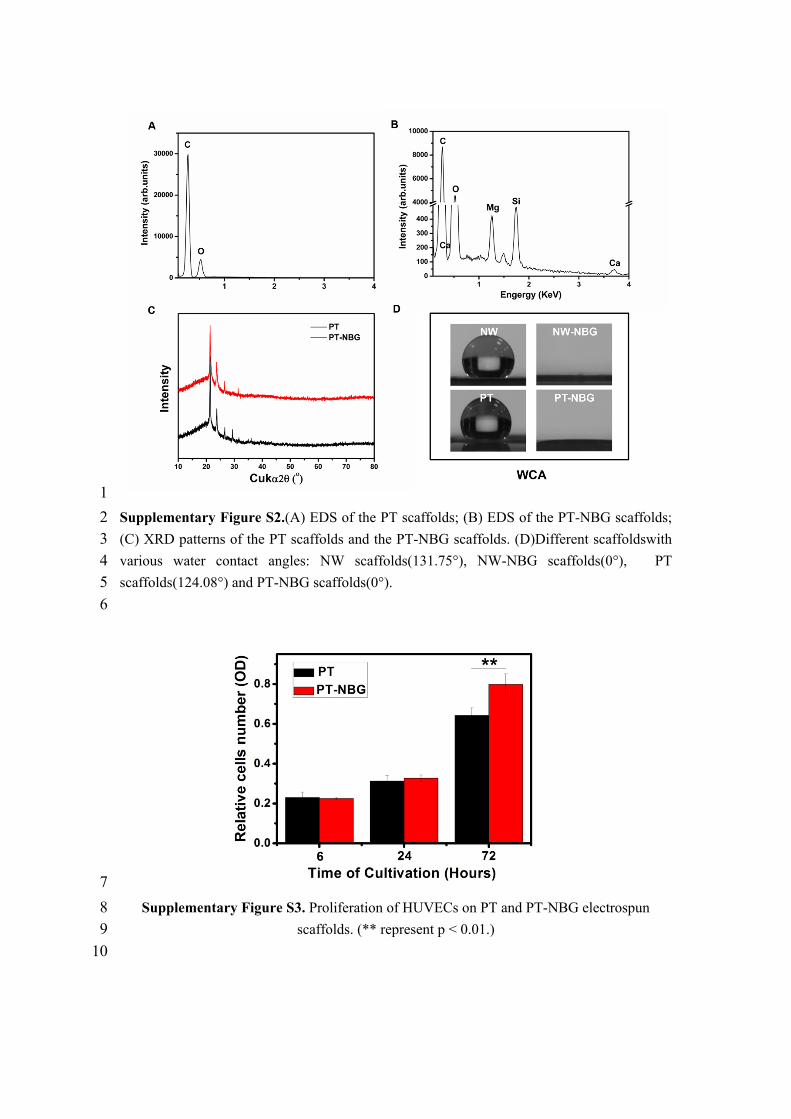
12 Supplementary Figure S2.(A) EDS of the PT scaffolds; (B) EDS of the PT-NBG scaffolds; 3 (C) XRD patterns of the PT scaffolds and the PT-NBG scaffolds. (D)Different scaffoldswith 4 various water contact angles: NW scaffolds(131.75°), NW-NBG scaffolds(0°), PT 5 scaffolds(124.08°) and PT-NBG scaffolds(0°).6
78 Supplementary Figure S3. Proliferation of HUVECs on PT and PT-NBG electrospun 9 scaffolds. (** represent p < 0.01.)
10
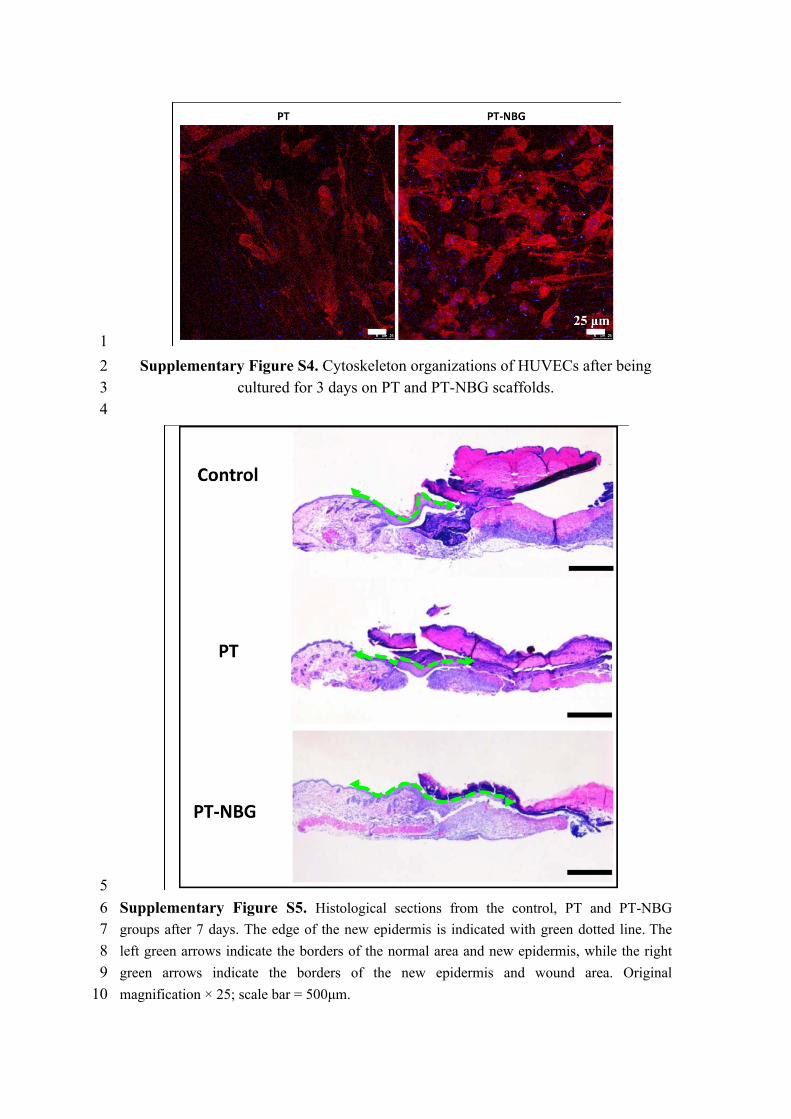
12 Supplementary Figure S4. Cytoskeleton organizations of HUVECs after being 3 cultured for 3 days on PT and PT-NBG scaffolds. 4
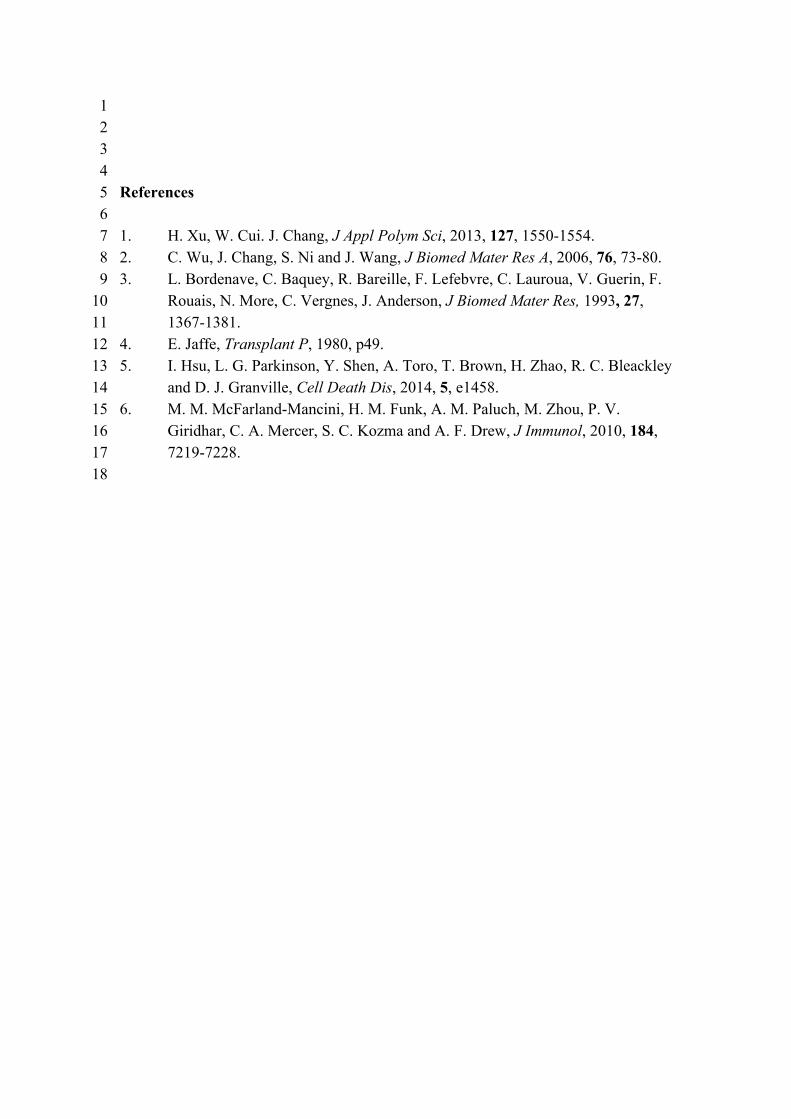
56 Supplementary Figure S5. Histological sections from the control, PT and PT-NBG 7 groups after 7 days. The edge of the new epidermis is indicated with green dotted line. The 8 left green arrows indicate the borders of the normal area and new epidermis, while the right 9 green arrows indicate the borders of the new epidermis and wound area. Original
10 magnification × 25; scale bar = 500μm.
12345 References 67 1. H. Xu, W. Cui. J. Chang, J Appl Polym Sci, 2013, 127, 1550-1554.8 2. C. Wu, J. Chang, S. Ni and J. Wang, J Biomed Mater Res A, 2006, 76, 73-80.9 3. L. Bordenave, C. Baquey, R. Bareille, F. Lefebvre, C. Lauroua, V. Guerin, F.
10 Rouais, N. More, C. Vergnes, J. Anderson, J Biomed Mater Res, 1993, 27, 11 1367-1381.12 4. E. Jaffe, Transplant P, 1980, p49.13 5. I. Hsu, L. G. Parkinson, Y. Shen, A. Toro, T. Brown, H. Zhao, R. C. Bleackley 14 and D. J. Granville, Cell Death Dis, 2014, 5, e1458.15 6. M. M. McFarland-Mancini, H. M. Funk, A. M. Paluch, M. Zhou, P. V. 16 Giridhar, C. A. Mercer, S. C. Kozma and A. F. Drew, J Immunol, 2010, 184, 17 7219-7228.18