BIO-FUELS
49
BIO-FUELS Guilherme Leite da Silva Dias Joaquim José Martins Guilhoto Department of Economics, FEA University of São Paulo
description
BIO-FUELS. Guilherme Leite da Silva Dias Joaquim José Martins Guilhoto Department of Economics, FEA University of São Paulo. Unsustainable growth cycle?. Unsustainable growth cycle?. Unsustainable growth cycle?. Unsustainable growth cycle?. Unsustainable growth cycle?. Biofuels & Food. - PowerPoint PPT Presentation
Transcript of BIO-FUELS

BIO-FUELS
Guilherme Leite da Silva Dias
Joaquim José Martins Guilhoto
Department of Economics, FEAUniversity of São Paulo

Unsustainable growth cycle?

Unsustainable growth cycle?

Unsustainable growth cycle?

Unsustainable growth cycle?

Unsustainable growth cycle?

A oferta de energia cresceu vinte vezes entre 1850 e 2000.Combustíveis fósseis representavam 80 por cento do total em 2000 (Holdren,2007)
GásPetróleoCarvãoNuclearHídricaBiomassa
Biofuels & Food

Biofuels & Food

Biofuels & Food

Biofuels & Food

Biofuels & Food

Is there a common ground for biofuels ?
Global Warming
Rising Food Costs
Energy Crisis
…different answers from different countries …..

Precos de Diesel e Gasolina-2004
POL
BEL
VEN SAU
CHN
DEU
BRAUSA
IRN
NLD
GBR
IDN
ZAF
IND
JPNAUS
-0,20
0,00
0,20
0,40
0,60
0,80
1,00
1,20
1,40
1,60
1,80
0,00 0,20 0,40 0,60 0,80 1,00 1,20 1,40 1,60 1,80
gasolina
diesel
How much should be paid for the raw material of a bio-fuel?
Answer depends on the country`s liquid fuel price policy
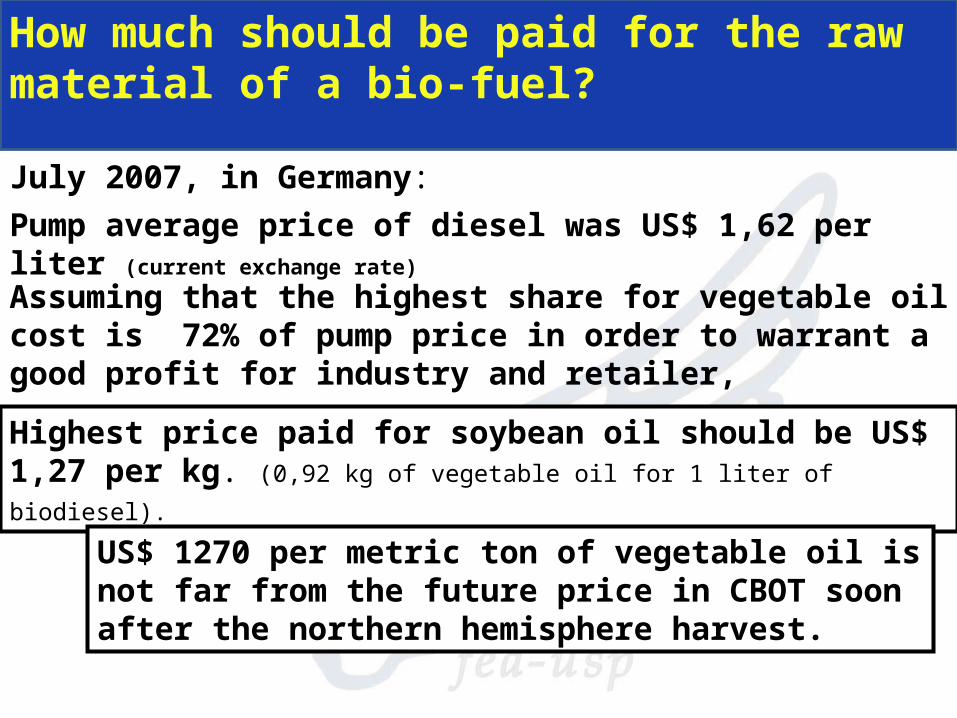
July 2007, in Germany:
Pump average price of diesel was US$ 1,62 per liter (current exchange rate)
Assuming that the highest share for vegetable oil cost is 72% of pump price in order to warrant a good profit for industry and retailer,
Highest price paid for soybean oil should be US$ 1,27 per kg. (0,92 kg
of vegetable oil for 1 liter of biodiesel).
US$ 1270 per metric ton of vegetable oil is not far from the future price in CBOT soon after the northern hemisphere harvest.
How much should be paid for the raw material of a bio-fuel?

Source of Data
• OECD Input-Output Matrices

Countries & Years
• Argentina - 1997• Brazil - 2000• China - 2000• India – 1998/99• USA - 2000• France - 2000• Germany - 2000• Japan - 2000

Sectors
Description1 Agriculture, hunting, forestry and fishing2 Mining and quarrying (energy)3 Mining and quarrying (non-energy)4 Food products, beverages and tobacco5 Textiles, textile products, leather and footwear6 Wood and products of wood and cork7 Pulp, paper, paper products, printing and publishing8 Coke, refined petroleum products and nuclear fuel9 Chemicals exluding pharmaceuticals
10 Pharmaceuticals11 Rubber & plastics products12 Other non-metallic mineral products13 Iron & steel 14 Non-ferrous metals15 Fabricated metal products, except machinery & equipment16 Machinery & equipment, nec 17 Office, accounting & computing machinery18 Electrical machinery & apparatus, nec19 Radio, television & communication equipment20 Medical, precision & optical instruments21 Motor vehicles, trailers & semi-trailers22 Building & repairing of ships & boats23 Aircraft & spacecraft24 Railroad equipment & transport equip n.e.c.

Sectors
Description25 Manufacturing nec; recycling (include Furniture)26 Production, collection and distribution of electricity27 Manufacture of gas; distribution of gaseous fuels through mains28 Steam and hot water supply 29 Collection, purification and distribution of water30 Construction31 Wholesale & retail trade; repairs32 Hotels & restaurants33 Land transport; transport via pipelines34 Water transport35 Air transport36 Supporting and auxiliary transport activities; activities of travel agencies37 Post & telecommunications38 Finance & insurance39 Real estate activities40 Renting of machinery & equipment41 Computer & related activities42 Research & development43 Other Business Activities44 Public admin. & defence; compulsory social security45 Education46 Health & social work47 Other community, social & personal services48 Private households with employed persons & extra-territorrial organisations &

Imports X Domestic Output
0.08 0.07 0.07 0.08 0.07
0.15 0.17
0.06
Total Value of Imports / Total Value of Domestic Output

Value Added
Agriculture + Food Min Energy + Ind Energy Transport
Argentina 10.0% 4.2% 5.6%
Brazil 11.1% 6.5% 2.5%
China 21.4% 9.2% 3.7%
India 29.9% 4.7% 5.5%
USA 2.6% 3.0% 2.6%
France 5.1% 2.4% 4.2%
Germany 3.2% 2.0% 3.6%
Japan 4.6% 3.2% 4.5%
0.0%
5.0%
10.0%
15.0%
20.0%
25.0%
30.0%
35.0%%
Share of Selected Sectors in the Value Added

Total Output
Agriculture + Food Min Energy + Ind Energy Transport
Argentina 14.9% 5.1% 5.4%
Brazil 14.8% 7.4% 3.5%
China 15.8% 8.2% 2.6%
India 25.1% 6.7% 7.2%
USA 4.4% 3.9% 3.2%
France 7.4% 3.5% 4.5%
Germany 5.0% 3.0% 4.4%
Japan 5.7% 3.6% 4.1%
0.0%
5.0%
10.0%
15.0%
20.0%
25.0%
30.0%
35.0%%
Share of Selected Sectors in Total Output

Value Added & Total Output
20.0%22.2% 24.1%
31.8%
8.3%10.9%
7.9% 9.3%
Share of (Food+Energy) in Total Output
14.2%17.6%
30.6%34.5%
5.6%7.6%
5.3%7.8%
Share of (Food + Energy) in the Value Added

Output Multipliers
0.00
0.50
1.00
1.50
2.00
2.50
3.00
3.50
4.00
1 2 3 4 5 6 7 8 9 10
11
12
13
14
15
16
17
18
19
20
21
22
23
24
25
26
27
28
29
30
31
32
33
34
35
36
37
38
39
40
41
42
43
44
45
46
47
48
Domestic Output Multipliers - Argentina
0.00
0.50
1.00
1.50
2.00
2.50
3.00
3.50
4.00
1 2 3 4 5 6 7 8 9 10 11 12 13 14 15 16 17 18 19 20 21 22 23 24 25 26 27 28 29 30 31 32 33 34 35 36 37 38 39 40 41 42 43 44 45 46 47 48
Spillover of Output Multipliers - Argentina
0.00
0.50
1.00
1.50
2.00
2.50
3.00
3.50
4.00
1 2 3 4 5 6 7 8 9 10 11 12 13 14 15 16 17 18 19 20 21 22 23 24 25 26 27 28 29 30 31 32 33 34 35 36 37 38 39 40 41 42 43 44 45 46 47 48
Total Output Multipliers - Argentina

Output Multipliers
0.00
0.50
1.00
1.50
2.00
2.50
3.00
3.50
4.00
1 2 3 4 5 6 7 8 9 10 11 12 13 14 15 16 17 18 19 20 21 22 23 24 25 26 27 28 29 30 31 32 33 34 35 36 37 38 39 40 41 42 43 44 45 46 47 48
Spillover of Output Multipliers - Brazil
0.00
0.50
1.00
1.50
2.00
2.50
3.00
3.50
4.00
1 2 3 4 5 6 7 8 9 10 11 12 13 14 15 16 17 18 19 20 21 22 23 24 25 26 27 28 29 30 31 32 33 34 35 36 37 38 39 40 41 42 43 44 45 46 47 48Domestic Output Multipliers - Brazil
0.00
0.50
1.00
1.50
2.00
2.50
3.00
3.50
4.00
1 2 3 4 5 6 7 8 9 10 11 12 13 14 15 16 17 18 19 20 21 22 23 24 25 26 27 28 29 30 31 32 33 34 35 36 37 38 39 40 41 42 43 44 45 46 47 48
Total Output Multipliers - Brazil

Output Multipliers
0.00
0.50
1.00
1.50
2.00
2.50
3.00
3.50
4.00
1 2 3 4 5 6 7 8 9 10 11 12 13 14 15 16 17 18 19 20 21 22 23 24 25 26 27 28 29 30 31 32 33 34 35 36 37 38 39 40 41 42 43 44 45 46 47 48Domestic Output Multiplier - China
0.00
0.50
1.00
1.50
2.00
2.50
3.00
3.50
4.00
1 2 3 4 5 6 7 8 9 10 11 12 13 14 15 16 17 18 19 20 21 22 23 24 25 26 27 28 29 30 31 32 33 34 35 36 37 38 39 40 41 42 43 44 45 46 47 48
Spillover of Output Multipliers - China
0.00
0.50
1.00
1.50
2.00
2.50
3.00
3.50
4.00
1 2 3 4 5 6 7 8 9 10 11 12 13 14 15 16 17 18 19 20 21 22 23 24 25 26 27 28 29 30 31 32 33 34 35 36 37 38 39 40 41 42 43 44 45 46 47 48
Total Output Multipliers - China

Output Multipliers
0.00
0.50
1.00
1.50
2.00
2.50
3.00
3.50
4.00
1 2 3 4 5 6 7 8 9 10 11 12 13 14 15 16 17 18 19 20 21 22 23 24 25 26 27 28 29 30 31 32 33 34 35 36 37 38 39 40 41 42 43 44 45 46 47 48
Spillover of Output Multipliers - India
0.00
0.50
1.00
1.50
2.00
2.50
3.00
3.50
4.00
1 2 3 4 5 6 7 8 9 10 11 12 13 14 15 16 17 18 19 20 21 22 23 24 25 26 27 28 29 30 31 32 33 34 35 36 37 38 39 40 41 42 43 44 45 46 47 48Domestic Output Multiplier - India
0.00
0.50
1.00
1.50
2.00
2.50
3.00
3.50
4.00
1 2 3 4 5 6 7 8 9 10 11 12 13 14 15 16 17 18 19 20 21 22 23 24 25 26 27 28 29 30 31 32 33 34 35 36 37 38 39 40 41 42 43 44 45 46 47 48
Total Output Multipliers - India

Output Multipliers
0.00
0.50
1.00
1.50
2.00
2.50
3.00
3.50
4.00
1 2 3 4 5 6 7 8 9 10 11 12 13 14 15 16 17 18 19 20 21 22 23 24 25 26 27 28 29 30 31 32 33 34 35 36 37 38 39 40 41 42 43 44 45 46 47 48Domestic Output Multipliers - USA
0.00
0.50
1.00
1.50
2.00
2.50
3.00
3.50
4.00
1 2 3 4 5 6 7 8 9 10 11 12 13 14 15 16 17 18 19 20 21 22 23 24 25 26 27 28 29 30 31 32 33 34 35 36 37 38 39 40 41 42 43 44 45 46 47 48
Spillover of Output Multipliers - USA
0.00
0.50
1.00
1.50
2.00
2.50
3.00
3.50
4.00
1 2 3 4 5 6 7 8 9 10 11 12 13 14 15 16 17 18 19 20 21 22 23 24 25 26 27 28 29 30 31 32 33 34 35 36 37 38 39 40 41 42 43 44 45 46 47 48
Total Output Multipliers - USA

Output Multipliers
0.00
0.50
1.00
1.50
2.00
2.50
3.00
3.50
4.00
1 2 3 4 5 6 7 8 9 10 11 12 13 14 15 16 17 18 19 20 21 22 23 24 25 26 27 28 29 30 31 32 33 34 35 36 37 38 39 40 41 42 43 44 45 46 47 48
Total Output Multipliers - France
0.00
0.50
1.00
1.50
2.00
2.50
3.00
3.50
4.00
1 2 3 4 5 6 7 8 9 10 11 12 13 14 15 16 17 18 19 20 21 22 23 24 25 26 27 28 29 30 31 32 33 34 35 36 37 38 39 40 41 42 43 44 45 46 47 48
Spillover of Output Multipliers - France
0.00
0.50
1.00
1.50
2.00
2.50
3.00
3.50
4.00
1 2 3 4 5 6 7 8 9 10 11 12 13 14 15 16 17 18 19 20 21 22 23 24 25 26 27 28 29 30 31 32 33 34 35 36 37 38 39 40 41 42 43 44 45 46 47 48Domestic Output Multipliers - France

Output Multipliers
0.00
0.50
1.00
1.50
2.00
2.50
3.00
3.50
4.00
1 2 3 4 5 6 7 8 9 10 11 12 13 14 15 16 17 18 19 20 21 22 23 24 25 26 27 28 29 30 31 32 33 34 35 36 37 38 39 40 41 42 43 44 45 46 47 48Domestic Output Multipliers - Germany
0.00
0.50
1.00
1.50
2.00
2.50
3.00
3.50
4.00
1 2 3 4 5 6 7 8 9 10 11 12 13 14 15 16 17 18 19 20 21 22 23 24 25 26 27 28 29 30 31 32 33 34 35 36 37 38 39 40 41 42 43 44 45 46 47 48
Spillover of Output Multipliers - Germany
0.00
0.50
1.00
1.50
2.00
2.50
3.00
3.50
4.00
1 2 3 4 5 6 7 8 9 10 11 12 13 14 15 16 17 18 19 20 21 22 23 24 25 26 27 28 29 30 31 32 33 34 35 36 37 38 39 40 41 42 43 44 45 46 47 48
Total Output Multipliers - Germany

Output Multipliers
0.00
0.50
1.00
1.50
2.00
2.50
3.00
3.50
4.00
1 2 3 4 5 6 7 8 9 10 11 12 13 14 15 16 17 18 19 20 21 22 23 24 25 26 27 28 29 30 31 32 33 34 35 36 37 38 39 40 41 42 43 44 45 46 47 48
Spillover of Output Multipliers - Japan
0.00
0.50
1.00
1.50
2.00
2.50
3.00
3.50
4.00
1 2 3 4 5 6 7 8 9 10 11 12 13 14 15 16 17 18 19 20 21 22 23 24 25 26 27 28 29 30 31 32 33 34 35 36 37 38 39 40 41 42 43 44 45 46 47 48Domestic Output Multipliers - Japan
0.00
0.50
1.00
1.50
2.00
2.50
3.00
3.50
4.00
1 2 3 4 5 6 7 8 9 10 11 12 13 14 15 16 17 18 19 20 21 22 23 24 25 26 27 28 29 30 31 32 33 34 35 36 37 38 39 40 41 42 43 44 45 46 47 48
Total Output Multipliers - Japan

Output Multipliers
0.00
0.50
1.00
1.50
2.00
2.50
3.00
3.50
4.00
Maximum Average
Spillover Effect - Output Multipliers
Argentina
Brazil
China
India
USA
France
Germany
Japan0.00
0.50
1.00
1.50
2.00
2.50
3.00
3.50
4.00
Maximum Average
Domestic Output Multipliers
Argentina
Brazil
China
India
USA
France
Germany
Japan
0.00
0.50
1.00
1.50
2.00
2.50
3.00
3.50
4.00
Maximum Average
Total Output Multiplier
Argentina
Brazil
China
India
USA
France
Germany
Japan

Output Multipliers
0.00
0.50
1.00
1.50
2.00
2.50
3.00
3.50
4.00
1 4
Domestic Output Multipliers
Argentina
Brazil
China
India
USA
France
Germany
Japan 0.00
0.50
1.00
1.50
2.00
2.50
3.00
3.50
4.00
1 4
Spillover Effect - Output Multipliers
Argentina
Brazil
China
India
USA
France
Germany
Japan
0.00
0.50
1.00
1.50
2.00
2.50
3.00
3.50
4.00
1 4
Total Output Multipliers
Argentina
Brazil
China
India
USA
France
Germany
Japan

Output Multipliers
0.00
0.50
1.00
1.50
2.00
2.50
3.00
3.50
4.00
2 8 26 27 28
Spillover Effect - Output Multipliers
Argentina
Brazil
China
India
USA
France
Germany
Japan0.00
0.50
1.00
1.50
2.00
2.50
3.00
3.50
4.00
2 8 26 27 28
Domestic Output Multipliers
Argentina
Brazil
China
India
USA
France
Germany
Japan
0.00
0.50
1.00
1.50
2.00
2.50
3.00
3.50
4.00
2 8 26 27 28
Total Output Multipliers
Argentina
Brazil
China
India
USA
France
Germany
Japan

Pure Linkages
0.00
1.00
2.00
3.00
4.00
5.00
6.00
7.00
2 8 26 27 28
Domestic Pure Total Linkage
Argentina
Brazil
China
India
USA
France
Germany
Japan
0.00
1.00
2.00
3.00
4.00
5.00
6.00
7.00
1 4
Domestic Pure Total Linkage
Argentina
Brazil
China
India
USA
France
Germany
Japan

Coke, Ref. Petroleum & Nuclear Fuel
7.7%19.2%
30.6%
55.4% 50.9%
97.6% 98.5% 99.5%
Share of Imported Inputs in the Total Value o Mining and Querying (energy) used in the Sector of Coke,
Refined Petroleum Products and Nuclear Fuel
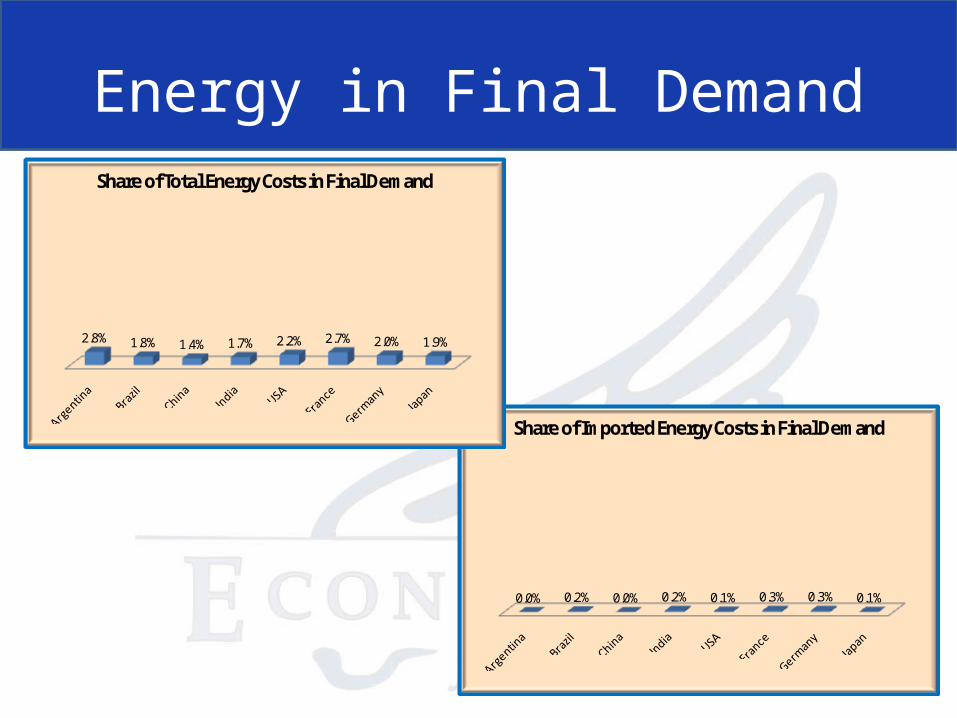
Energy in Final Demand
0.0% 0.2% 0.0% 0.2% 0.1% 0.3% 0.3% 0.1%
Share of Imported Energy Costs in Final Demand
2.8% 1.8% 1.4% 1.7% 2.2% 2.7% 2.0% 1.9%
Share of Total Energy Costs in Final Demand

Energy in Intermediate Consumption
0.5% 1.9% 1.0% 2.6% 1.5% 2.4% 2.2% 2.2%
Share of Imported Energy Costs inIntermediate Consumption
8.3%
15.3%13.1%
15.6%
7.2% 6.3% 5.8% 7.6%
Share of Total Energy Costs inIntermediate Consumption

Energy in Total Output
0.2% 0.9% 0.7% 1.1% 0.7% 1.1% 1.1% 1.0%
Share of Imported Energy Costs in Total Output
3.5%7.3% 8.4% 7.0%
3.3% 3.0% 2.8% 3.5%
Share of Total Energy Costs in Total Output

Food in Final Demand
0.3% 0.3% 0.4% 0.6% 0.3% 1.1% 1.0% 0.5%
Share of Imported Agriculture and Food Products Costs in Final Demand
13.1% 12.8%
19.3%
28.4%
4.1%7.7%
5.5% 6.1%
Share of Total Agriculture and Food Products Costs in Final Demand

Food in Intermediate Consumption
0.4% 0.5% 0.4% 0.3% 0.3% 0.9% 1.2% 1.0%
Share of Imported Agriculture and Food Products Costs in Intermediate Consumption
15.7% 15.1%11.7%
16.8%
4.8%7.0%
5.0% 5.8%
Share of Total Agriculture and Food Products Costs in Intermediate Consumption

Food in Total Output
0.2% 0.2% 0.3% 0.1% 0.1% 0.4% 0.6% 0.4%
Share of Imported Agriculture and Food Products Costs in Total Output
6.6% 7.2% 7.5% 7.5%
2.2% 3.3% 2.4% 2.6%
Share of Total Agriculture andFood Products Costs in Total Output

Transport in Final Demand
0.3% 0.0% 0.0% 0.5% 0.1% 0.2% 0.2% 0.2%
Share of Imported Transport Costs in Final Demand
4.5% 2.9% 1.4%
6.6%
2.1% 2.9% 3.3% 3.6%
Share of Total Transport Costs in Final Demand

Transport in Intermediate Consumption
0.2% 0.0% 0.1% 0.3% 0.1% 0.2% 0.8% 0.4%
Share of Imported Transport Costs in Intermediate Consumption
6.4%3.9% 3.3%
7.5%4.2% 5.9% 5.3% 4.8%
Share of Total Transport Costs inIntermediate Consumption

Transport in Total Output
0.1% 0.0% 0.0% 0.1% 0.0% 0.1% 0.4% 0.2%
Share of Imported Transport Costs in Total Output
2.7% 1.9% 2.1% 3.4% 2.0% 2.8% 2.6% 2.2%
Share of Total Transport Costs in Total Output

Disposable Domestic Value Added
0.0%
5.0%
10.0%
15.0%
20.0%
25.0%
30.0%
Agriculture Food Mining Energy Industry EnergyArgentina 5.1% 3.6% 1.6% 2.0%
Brazil 7.7% 3.1% 2.8% 4.6%
China 16.4% 5.0% 4.0% 6.0%
India 27.3% 2.1% 2.8% 3.0%
USA 1.1% 1.5% 1.3% 2.2%
France 2.7% 2.4% 1.1% 2.3%
Germany 1.5% 2.1% 0.7% 1.9%
Japan 1.8% 3.4% 0.9% 3.3%
%Share of Disposable Domestic Value Added in the GDP

Value Added Relations
1.02
0.52 0.56 0.45 0.51
1.00 1.00 0.97
Value Added Relation:Food Ind. / (Min. Energy + Energy Ind.)
2.11
0.78 0.86 0.73 0.69 1.02 1.07 0.98
Value Added Relation:Food Ind. / Energy Ind.

Value Added Relations
0.98
0.42 0.50 0.37 0.43 0.71 0.80 0.83
(VA + VAM - VAE) Relation:Food Ind. / (Min. Energy + Energy Ind.)
1.76
0.67 0.84 0.71 0.69 1.05 1.10 1.06
(VA + VAM - VAE) Relation:Food Ind. / Energy Ind.

International Trade
Bilateral Trade Agreements,
seems to be more adequate than a multilateral approach.

Final Comments