Bio-chemical and Technological Investigations on Tea
305
Bio-chemical and Technological Investigations on Tea THESIS SUBMITTED TO THE UNIVERSITY OF MYSORE FOR THE AWARD OF THE DEGREE DOCTOR OF PHILOSOPHY (FOOD SCIENCE) By BORSE BABASAHEB BHASKARRAO M.Tech. (Food Science) Plantation Products Spices & Flavour Technology Department Central Food Technological Research Institute Mysore – 570020, India November 2008 O OH OH R 1 OR 2 OH OH C O OH OH OH O O OH OR 1 O OH OR OH OH OH OH OH
Transcript of Bio-chemical and Technological Investigations on Tea
Bio-chemical and Technological
Investigations on Tea
THESIS
SUBMITTED TO THE UNIVERSITY OF MYSORE
FOR THE AWARD OF THE DEGREE
DOCTOR OF PHILOSOPHY (FOOD SCIENCE)
By
BORSE BABASAHEB BHASKARRAO M.Tech. (Food Science)
Plantation Products Spices & Flavour Technology Department
Central Food Technological Research Institute Mysore – 570020, India
November 2008
O
OH
OH
R1
OR2
OH
OH C
O
OH
OH
OH
O
O
OHOR 1
O
OHOROH
OH
OH
OH
OH


O
O
OHOR1
O
OHOROH
OH
OH
OH
OH
O
OH
OH
OH R1
OR2
OHOH
OHC
OOH

O
OH
OH
R1
OR2
OH
OH
O
OHOR 1
OHOH

Dr. L. Jagan Mohan Rao Sr. Scientist, Plantation Products, Spices & Flavour Technology Dept. Central Food Technological Research Institute Mysore – 570 020
CERTIFICATE
I certify that this thesis entitled, ‘Bio-chemical and Technological
investigations on tea’ submitted by Mr. Borse Babasaheb Bhaskarrao for the
award of the Degree of Doctor of Philosophy in Food Science of the University of
Mysore, is an outcome of the work carried out by him under my guidance in the
Department of Plantation Products, Spices & Flavour Technology, Central Food
Technological Research Institute, Mysore.
Dated: (Dr. L. Jagan Mohan Rao)
ii
Dr. L. Jagan Mohan Rao Sr. Scientist, Plantation Products, Spices & Flavour Technology Dept. Central Food Technological Research Institute Mysore – 570 020
ATTENDANCE CERTIFICATE
I certify that this thesis entitled, ‘Bio-chemical and Technological investigations on tea’ submitted by Mr. Borse Babasaheb Bhaskarrao for the
award of the Degree of Doctor of Philosophy in Food Science of the University of
Mysore, is an outcome of the work carried out by him under my guidance with full attendance, in the Department of Plantation Products, Spices & Flavour
Technology, Central Food Technological Research Institute, Mysore.
Dated: (Dr. L. Jagan Mohan Rao)
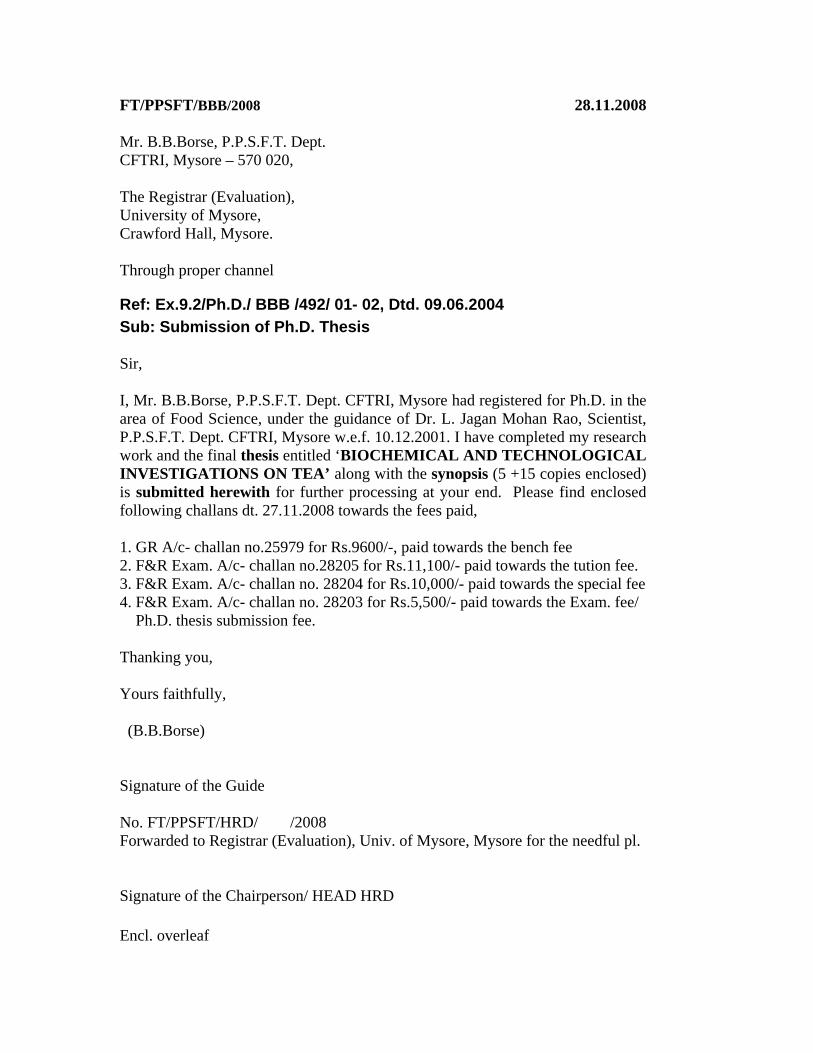
FT/PPSFT/BBB/2008 28.11.2008 Mr. B.B.Borse, P.P.S.F.T. Dept. CFTRI, Mysore – 570 020, The Registrar (Evaluation), University of Mysore, Crawford Hall, Mysore. Through proper channel
Ref: Ex.9.2/Ph.D./ BBB /492/ 01- 02, Dtd. 09.06.2004 Sub: Submission of Ph.D. Thesis Sir, I, Mr. B.B.Borse, P.P.S.F.T. Dept. CFTRI, Mysore had registered for Ph.D. in the area of Food Science, under the guidance of Dr. L. Jagan Mohan Rao, Scientist, P.P.S.F.T. Dept. CFTRI, Mysore w.e.f. 10.12.2001. I have completed my research work and the final thesis entitled ‘BIOCHEMICAL AND TECHNOLOGICAL INVESTIGATIONS ON TEA’ along with the synopsis (5 +15 copies enclosed) is submitted herewith for further processing at your end. Please find enclosed following challans dt. 27.11.2008 towards the fees paid, 1. GR A/c- challan no.25979 for Rs.9600/-, paid towards the bench fee 2. F&R Exam. A/c- challan no.28205 for Rs.11,100/- paid towards the tution fee. 3. F&R Exam. A/c- challan no. 28204 for Rs.10,000/- paid towards the special fee 4. F&R Exam. A/c- challan no. 28203 for Rs.5,500/- paid towards the Exam. fee/ Ph.D. thesis submission fee. Thanking you, Yours faithfully, (B.B.Borse) Signature of the Guide No. FT/PPSFT/HRD/ /2008 Forwarded to Registrar (Evaluation), Univ. of Mysore, Mysore for the needful pl. Signature of the Chairperson/ HEAD HRD
Encl. overleaf

1. Completed application 2. Guides certificate 3. Copy of Ph.D. registration 4. Copy of Masters degree certificate 5. Xerox copies of all fees paid challan 6. CD of the Thesis – 2Nos.

06.12.2006 From B.B.Borse, P.P.S.F.T. Dept. CFTRI, Mysore, Mysore – 570 013 To The Registrar (Evaluation), University of Mysore, Mysore. Through proper channel
Ref: Ex.9.2/Ph.D./492/BBB/2001- 02, Dtd. 11.06.2003 Sub: Request for extension Sir, I have registered for Ph.D. in the area of Food Science, under the guidance of Dr. L. Jagan Mohan Rao, Scientist, P.P.S.F.T. Dept. CFTRI, Mysore w.e.f. 10.12.2001 and completing five years on 10.12.2006 (copy enclosed). In this regard, I hereby request an extension for enabling me to submit the thesis. Please find enclosed a challan (F&R) for Rs.11000/- paid towards the extension fee (challan no. , dated .12.2006). Thanking you, Yours faithfully, (B.B.Borse) Signature of the Guide No. FT/PPSFT/HRD/ /2006 Forwarded to Registrar (Evaluation), Univ. of Mysore, Mysore for the needful. Signature of the Chairperson/ HEAD HRD


DECLARATION
I, Mr. Borse Babasaheb Bhaskarrao, hereby declare that this thesis entitled,
‘Bio-chemical and Technological investigations on tea’ submitted to the
University of Mysore for the award of the degree of Doctor of Philosophy in
Food Science of the University of Mysore, is an embodiment of the results of the
research work carried out by me under the guidance of Dr. L. Jagan Mohan
Rao, Sr. Scientist, Department of Plantation Products, Spices & Flavour
Technology, Central Food Technological Research Institute, Mysore during the
period 2001-2008. I further declare that the results of the work or part thereof
have not been submitted for any fellowship or degree/diploma.
Dated: (Borse Babasaheb Bhaskarrao)
iii

Dedicated to the sup reme, the sup reme c rea to r , d i rec to r , p r i nc ipa l ac to r and the sup reme fa the r o f a l l sou l s , t he B rahm ( i nco rpo rea l s i x th e lemen t ) n i vas i - T r imur t i Sh i va ( the rach i ya ta o f t he t r imur t i - B rahma, V ishnu , Shankara and the pa rad ise - t he new De i t y wor ld o rde r / swarga / heaven) , t he a lm igh ty au tho r i t y , t he GOD ( the t rue sp i r i t ua l - f a the r , t eacher , sadguru o f a l l t he human sou ls ) , t he i n te l l ec t o f t he i n te l l ec tua l s , t he ocean o f d i v ine v i r t ues (Know ledge , peace , b l i ss , happ iness , l ove , power and pu r i t y ) , t he remover o f so r row and bes tower o f happ iness , t he i nco rpo rea l - sen t ien t po in t o f se l f l um inous d i v ine l i gh t , t he sup reme gu ide , t he l i be ra to r , f o r h i s un l im i ted men to r ing , gu idance and the empowermen t a l l t h rough . His Dictum – ‘‘Always be soul conscious and remember only me”- Ancient Raja Yoga.

ACKNOWLEDGEMENT
My heartfelt thanks to my guide Dr. L. Jagan Mohan Rao, Sr. Scientist, PPSFT dept. for his constant encouragement, valuable guidance and unstinted support throughout this study. My sincere thanks to Padmashree Dr. V. Prakash, Director, CFTRI for his kind support, encouragement and keen interest in this study. My sincere thanks to the former head(s) and Present head Dr. P. Srinivas, scientists, technical staff and colleagues from PPSFT, CIFS, FED, S.S., FSAQCL, B&N, HRD, TTBD, GST and all other departments for their support. My heartfelt thanks to my seniors and colleagues (former and present) from team CFTRI/CSIR for kind support and help in this endeavour. My sincere thanks to the one and all who have helped, encouraged, nurtured me directly/indirectly to realize the goal. My sincere thanks to the CSIR, New Delhi and M/s HLL (now HUL), Bangalore for funding the research project and also to the Director, CFTRI, nodal scientists, P. Is., members, and regular/temporary staff of the projects for kind support. Last but not the least my wholehearted thanks to the all who have helped, supervised, assisted (directly/indirectly) in data acquisition, analysis, typesetting, design-layout, proof reading, printing, binding and submission of this thesis. My heartfelt thanks to my better half, Mrs. Surekha & son, Aniket for their unstinted support, time, sacrifice and strength throughout this study and career. My special thanks to the laukik, alaukik and parlaukik parents, sisters, brothers and families for their unlimited support to achieve the goal. My sincere thanks to the Supreme, the almighty authority, the intellect of all the intellectuals, the ocean of knowledge, divine attributes, power and purity - the GOD (the true - father, teacher, satguru of all the souls) for his unlimited mentoring and empowerment all through to achieve the goals successfully and for guiding me to the higher heights of learning. Finally, I place on record my thanks to one and all by their name and capacity, for having helped me directly or indirectly in researching, realizing this wonderful dream and the S&T contribution. In return I sincerely wish the best of luck, health, wealth and happiness to the one and all and hope that this work would be of help to the society at large. iv (Borse, B. B.)
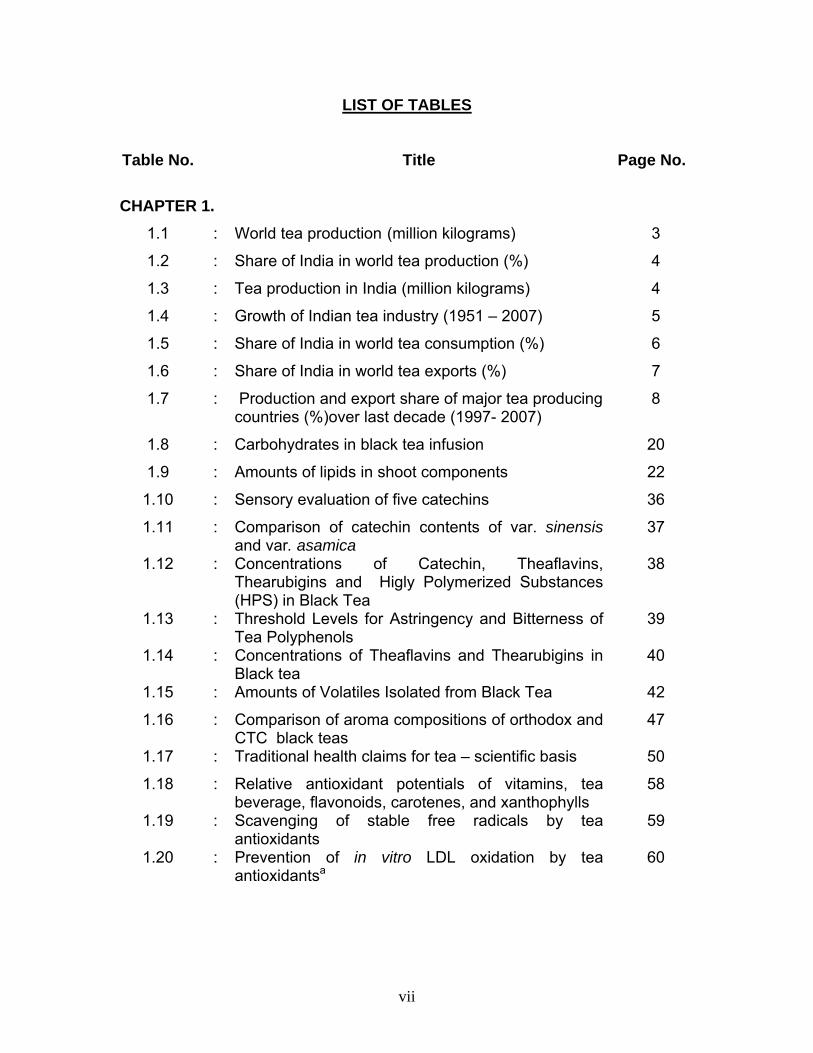
LIST OF TABLES
Table No. Title Page No. CHAPTER 1.
1.1 : World tea production (million kilograms) 3
1.2 : Share of India in world tea production (%) 4
1.3 : Tea production in India (million kilograms) 4
1.4 : Growth of Indian tea industry (1951 – 2007) 5
1.5 : Share of India in world tea consumption (%) 6
1.6 : Share of India in world tea exports (%) 7
1.7 : Production and export share of major tea producing countries (%)over last decade (1997- 2007)
8
1.8 : Carbohydrates in black tea infusion 20
1.9 : Amounts of lipids in shoot components 22
1.10 : Sensory evaluation of five catechins 36
1.11 : Comparison of catechin contents of var. sinensis and var. asamica
37
1.12 : Concentrations of Catechin, Theaflavins, Thearubigins and Higly Polymerized Substances (HPS) in Black Tea
38
1.13 : Threshold Levels for Astringency and Bitterness of Tea Polyphenols
39
1.14 : Concentrations of Theaflavins and Thearubigins in Black tea
40
1.15 : Amounts of Volatiles Isolated from Black Tea 42
1.16 : Comparison of aroma compositions of orthodox and CTC black teas
47
1.17 : Traditional health claims for tea – scientific basis 50
1.18 : Relative antioxidant potentials of vitamins, tea beverage, flavonoids, carotenes, and xanthophylls
58
1.19 : Scavenging of stable free radicals by tea antioxidants
59
1.20 : Prevention of in vitro LDL oxidation by tea antioxidantsa
60
vii

CHAPTER 2.
2.1 : Season 1 (April- June) – Physico-chemical analysis of black tea samples
111
2.2 : Identification of major volatile flavour compounds from black tea
116
2.3 : Season 1(April- June) - Black tea samples-volatile flavour compounds (VFC) µg / 100 g
118
2.4 : Season 2 (July-September) – Physico-chemical analysis of black tea
134
2.5 : Season 2 (July-September) - Black tea samples-volatile flavour compounds (VFC) μ g / 100 g
139
2.6 : Season 3 (October-December) – Physico-chemical analysis of black tea
141
2.7 : Season 3 (October- December)- Black tea samples-volatile flavour compounds (VFC) μ g / 100 g
146
2.8 : Season 4 (January-March) – Physico-chemical analysis of black tea
148
2.9 : Season 4 (January - March) - Black tea samples-volatile flavour compounds (VFC) μ g / 100 g
153
2.10 : Codes for Region / Grade / Garden 154
2.11 : Season code for part of the year 154
CHAPTER 3.
3.1 : Polyphenol and caffeine contents of green tea from coarse / pruned (low grade)/ unused tea leaves
178
3.2 : Sensory evaluation of the Green teas from Coarse/pruned (low grade) / unused tea leaves
178
3.3 : Chemical composition of volatiles from Green tea (μg/100g)
181
3.4 : The yields and RSA (radical scavenging activity) of normal green tea extractives using different solvents
206
3.5 : The yields, polyphenol contents and RSA of normal / coarse green tea extractives prepared under optimized conditions
207
3.6 : Fractionation of Green tea extracts - Yields, polyphenol contents and RSA of solvent and aqeous extracts
209
3.7 : Catechin composition of radical scavenging (solvent) conserve
214
3.8 : R S A of gallic acid, alkaloids and catechins 215
viii

LIST OF FIGURES / SCHEMES
Figure / Scheme No. Title Page
no.
CHAPTER 1.
1.1 : Structures of phenolic moieties from tea – catechins 13
1.2 : Structures of phenolic moieties in tea 14
1.3 : Structures of Theaflavins from black tea 16
1.4 : Structures of Alkaloids from tea 18
1.5 : Structures of carbohydrates from tea 21
1.6 : Structure of Linoleic and linolenic acid 22
1.7 : Organic acids identified from tea leaves and fermented tea
23
1.8 : Structure of chlorophyll a and b 24
1.9 : Ionone-related compounds in made tea 27-28
1.10 : Structures of amino acids present in tea 30-32
Scheme 1.1. : Modified Goodwin’s scheme for biosynthesis of terpenoids, showing additional proposed pathways in the tea leaf (Wickremasinghe, 1974)
34
CHAPTER 2.
2.1 : HPLC chromatogram of tea 114
2.2 : Total ion chromatogram of black tea volatiles (VFC) 119
2.3 : Mass spectrum of n-Hexanal 120
2.4 : Mass spectrum of Leaf aldehyde (E-2-Hexenal) 120
2.5 : Mass spectrum of Leaf alcohol (Z-3-Hexenol) 121
2.6 : Mass spectrum of trans-2- hexenol 121
2.7 : Mass spectrum of cis-2- hexenol 122
2.8 : Mass spectrum of n-Hexanol 122
2.9 : Mass spectrum of n-Heptanal 123
2.10 : Mass spectrum of Benzaldehyde 123
2.11 : Mass spectrum of (E,Z)-2,4-Heptadienal 124
2.12 : Mass spectrum of (E,E)-2,4-Heptadienal 124
ix

2.13 : Mass spectrum of Nonanal 125
2.14 : Mass spectrum of of Phenyl acetaldehyde 125
2.15 : Mass spectrum of of Benzyl alcohol 126
2.16 : Mass spectrum of cis-Linalool oxide 126
2.17 : Mass spectrum of trans-Linalool oxide 127
2.18 : Mass spectrum of Linalool 127
2.19 : Mass spectrum of phenyl ethyl alcohol 128
2.20 : Mass spectrum of α-terpineol 128
2.21 : Mass spectrum of Methyl Salicylate 129
2.22 : Mass spectrum of cis-Geraniol 129
2.23 : Mass spectrum of Indole 130
2.24 : Mass spectrum of Geranyl acetate 130
2.25 : Mass spectrum of β- Ionone 131
2.26 : Mass spectrum of Dihydroactinidiolide 131
2.27 : Mass spectrum of Nerolidol 132
2.28 : Mass spectrum of Phytol 132
2.29 : Seasonal variation of TF/TR ratio over tea producing region/grade
157
2.30 : Seasonal variation of sum of Yamanishi-Botheju and Mahantha ratio over tea producing region/grade
157
2.31 : Seasonal variation of Borse-Rao quality index over tea producing region/grade
158
CHAPTER 3.
3.1 : Cross Flow Dryer 177
3.2 : Infra Red Dryer 177
3.3 : Total ion chromatogram of coarse IRD green tea volatiles
182
3.4 : Total ion chromatogram of normal CFD green tea volatiles
182
3.5 : Total ion chromatogram of coarse CFD green tea volatiles
183
3.6 : Total ion chromatogram of commercial sample from Nilgiris (Market) green tea volatiles
183
3.7 : Mass spectrum of Sec-hexyl alcohol 184
3.8 : Mass spectrum of cis-2-pentenol 184
x

3.9 : Mass spectrum of Hexanal 185
3.10 : Mass spectrum of trans-2-hexenal 185
3.11 : Mass spectrum of trans-3-Hexenol 186
3.12 : Mass spectrum of trans-2-hexenol 186
3.13 : Mass spectrum of 6-methyl-5-heptene-2-one 187
3.14 : Mass spectrum of (E,E)2,4-heptadienal 187
3.15 : Mass spectrum of (E,Z) 2,4-heptadienal 188
3.16 : Mass spectrum of Phenyl acetaldehyde 188
3.17 : Mass spectrum of Benzyl alcohol 189
3.18 : Mass spectrum of Limonene 189
3.19 : Mass spectrum of Ethyl hex-2-enoate 190
3.20 : Mass spectrum of cis- linalool oxide 190
3.21 : Mass spectrum of trans - linalool oxide 191
3.22 : Mass spectrum of Linalool 191
3.23 : Mass spectrum of cis- Linalyl oxide (pyranoid) 192
3.24 : Mass spectrum of Methyl salicylate 192
3.25 : Mass spectrum of α-Terpineol 193
3.26 : Mass spectrum of Octanoic acid 193
3.27 : Mass spectrum of cis-Geraniol 194
3.28 : Mass spectrum of (E,Z)2,4-decadienal 194
3.29 : Mass spectrum of Nonanoic acid 195
3.30 : Mass spectrum of (E,E)2,4-decadienal 195
3.31 : Mass spectrum of cis-3-Hexenyl-n-hexanoate 196
3.32 : Mass spectrum of α-ionone 196
3.33 : Mass spectrum of cis-geranylacetone 197
3.34 : Mass spectrum of β-ionone-5, 6-epoxide 197
3.35 : Mass spectrum of β-ionone 198
3.36 : Mass spectrum of Dihydroactinidiolide 198
3.37 : Mass spectrum of Di-tert-butyl phenol 199
3.38 : Mass spectrum of Pentadecane 199
3.39 : Mass spectrum of Vanillin acetate 200
xi
xii
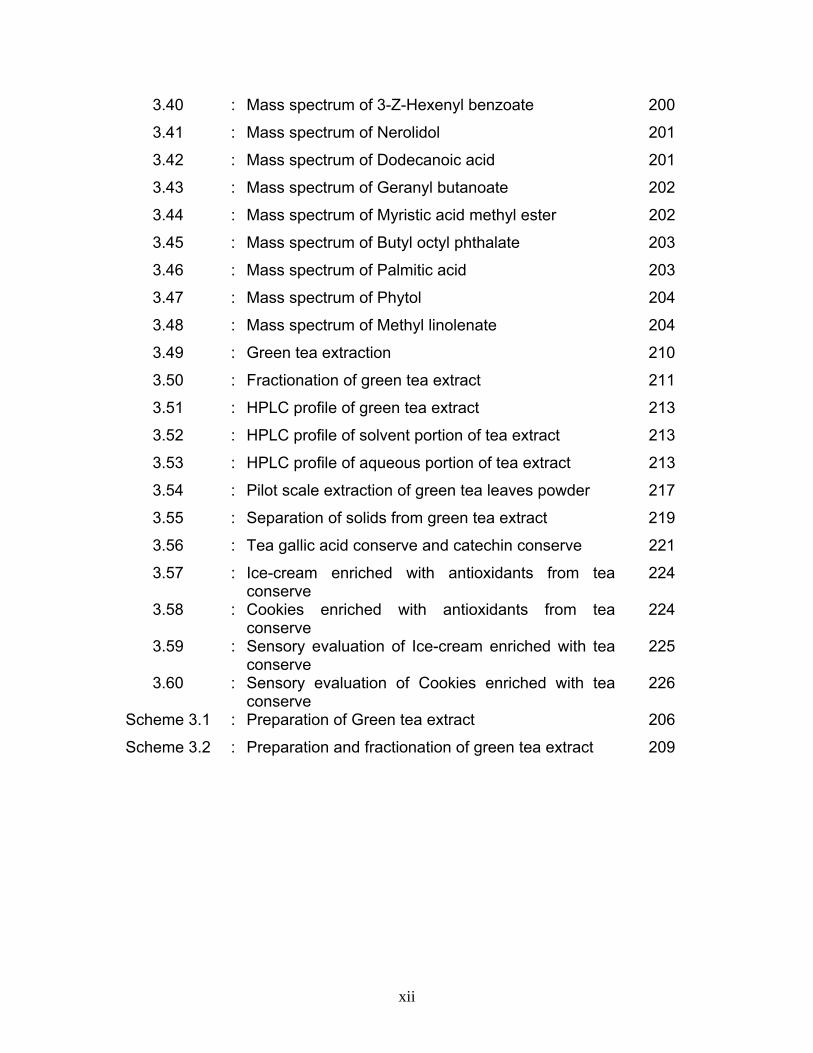
3.40 : Mass spectrum of 3-Z-Hexenyl benzoate 200
3.41 : Mass spectrum of Nerolidol 201
3.42 : Mass spectrum of Dodecanoic acid 201
3.43 : Mass spectrum of Geranyl butanoate 202
3.44 : Mass spectrum of Myristic acid methyl ester 202
3.45 : Mass spectrum of Butyl octyl phthalate 203
3.46 : Mass spectrum of Palmitic acid 203
3.47 : Mass spectrum of Phytol 204
3.48 : Mass spectrum of Methyl linolenate 204
3.49 : Green tea extraction 210
3.50 : Fractionation of green tea extract 211
3.51 : HPLC profile of green tea extract 213
3.52 : HPLC profile of solvent portion of tea extract 213
3.53 : HPLC profile of aqueous portion of tea extract 213
3.54 : Pilot scale extraction of green tea leaves powder 217
3.55 : Separation of solids from green tea extract 219
3.56 : Tea gallic acid conserve and catechin conserve 221
3.57 : Ice-cream enriched with antioxidants from tea conserve
224
3.58 : Cookies enriched with antioxidants from tea conserve
224
3.59 : Sensory evaluation of Ice-cream enriched with tea conserve
225
3.60 : Sensory evaluation of Cookies enriched with tea conserve
226
Scheme 3.1 : Preparation of Green tea extract 206
Scheme 3.2 : Preparation and fractionation of green tea extract 209

ABBREVIATIONS AAPH 2,2-azobis (2-amidino propane) hydrochloride ABTS 2,2-azinobis-(3-ethylbenzthiazoline-6-sulfonic acid radical cation) AOAC Association of official Analytical chemists ASTM American Society for Testing and Materials BD Bulk density BHA Butilated hydroxy Anisole BOP Broken orange peko C Catechin CFD Cross flow dryer/dried CG Catechingallate CIS Commonwealth of Independent states CTC Cursh-Tear-Curl DB Dry basis DM Dislike Moderately DMPO 5,5-dimethyl-1-pyroline-1-oxide DNA Deoxyribonucleic Acid DPPH 1,1-diphenyl-2-picrylhydrazyl radical DS Dislike Slightly DVM Dislike Very Much EC Epicatechin ECG Epicatechin gallate EGC Epigallocatechin EGCG Epigallocatechin gallate ESR Electron Spin Resonance FI Flavour Index GA Gallic acid GC Gallocatechin GCG Gallocatechingallate GC-MS Gas Chromatograph - Mass Spectrometer GMS Glycerol mono stearate HDG Hydroxydeoxyguanosine HG High grown HPLC High Performance Liquid Chromatography HPS Higly Polymerized Substances iNOS Inducible nitric oxide synthase IRD Infra red dryer/dried ISO International standards organisation
xiii

xiv
KI Kovat’s Index LDL Low density lipoprotein LM Like Moderately LPS Lipopoly-saccharide LS Like Slightly LVM Like Very Much m Pa mlli Pascal MDA Malondialdyhyde MMC Mitomycin C MNNG N-methyl-N’-nitro-N-nitrosoguanidine NIST National Institute of standards and Technology NLND Neither Like Nor Dislike NO Nitric oxide NVFC Non volatile flavour compounds OD Optical density OD Outer diameter ODC Ornithine decarboxylase ORAC Oxygen Radical Absorbing Capacity Q Quercetin QP Quadrupole ROS Reactive Oxygen Species RPM Rotation per minute RSA Radical scavenging activity RT Retention Time SCE Sister chromatid exchange SD Standard deviation SDE Simultaneous distillation and solvent extraction TBARS Thiobarbutyric acid reactive substances TEAC Trolox equivalent antioxidant capacity TF Theaflavin TFDG Theaflavin digallate TFMG Theaflavin monogalate TFs Theaflavins TI Terpene Index TIC Total ion chromatogram TR Thearubigin TRs Thearubigins TSS Total soluble solids VFC Volatile Flavour Compounds

CONTENTS
Chapter No. Title Page
No.
CHAPTER 1. INTRODUCTION AND REVIEW OF LITERATURE
1.1. INTRODUCTION 1
1.2. CULTIVATION 2 1.3. PRODUCTION 3 1.4. CONSUMPTION 5 1.5. EXPORTS 7 1.6. BOTANY OF TEA 8 1.7. PROCESSING 9 1.8. BIO-CHEMICAL MOIETIES IN TEA 12 1.9. BIO-CHEMICAL MOIETIES AND CORRELATION TO
QUALITY 34
1.10. ROLE OF TEA IN HEALTH 48 1.11. PRESENT STUDIES - Objectives, Scope 67-69 1.12. Bibliography 70
CHAPTER 2. PROFILING OF INDIAN BLACK TEAS
2.1. BACKGROUND 93 2.2. SCOPE 96 2.3. MATERIALS AND METHODS 97 2.4. RESULTS AND DISCUSSION 110
2.4.1. Profiling of the tea samples from first season (April- June)
110
2.4.2. Profiling of the tea samples from second season (July-September)
133
2.4.3. Profiling of the tea samples from third season (October-December)
140
2.4.4. Profiling of the tea samples from fourth season (January-March)
147
2.4.5. Novel approach for overall quality based on Seasonal, regional variations and bio-chemical quality fingerprint
154
2.5. Bibliography 159
v

vi
Chapter No.
Title Page No.
CHAPTER 3. FUNCTIONAL INGREDIENTS FROM UNUSED
GREEN TEA LEAVES: ACTIVITY AND APPLICATIONS
3.1.
INTRODUCTION
164
3.2. MATERIALS AND METHODS 167 3.3 RESULTS AND DISCUSSION
Value addition to unused green tea leaves (coarse / pruned tea leaves)
176
3.3.1. Preparation of Green tea and quality evaluation 176 3.3.2. Green tea extract 205 3.3.3. Fractionation of the green tea extract 207 3.3.4. HPLC profiling of green tea extractives, chemical
composition and quantification 212
3.3.5. Extraction of Green tea from Pruned tea leaves on pilot scale
216
3.3.6. Improved method for the active conserve 218 3.3.7 Economics of the process 220 3.3.8 Applications of green tea catechin conserve 222 3.4. Bibliography 227
CHAPTER.4. SUMMARY AND CONCLUSION
230

SYNOPSIS OF THE THESIS
BIO-CHEMICAL AND TECHNOLOGICAL INVESTIGATIONS ON TEA
Submitted to the
UNIVERSITY OF MYSORE
For the award of the Degree of
Doctor of Philosophy In
FOOD SCIENCE
By
Borse B. B., M.Tech.(Food Science),
Plantation Products Spices and Flavour Technology Department CENTRAL FOOD TECHNOLOGICAL RESEARCH INSTITUTE,
Mysore – 570 020, India. November 2008

SYNOPSIS BIOCHEMICAL AND TECHNOLOGICAL INVESTIGATIONS ON
TEA The synopsis of the completed Doctoral research work entitled ‘BIOCHEMICAL AND TECHNOLOGICAL INVESTIGATIONS ON TEA’ is presented in the
following paragraphs:
Ch. 1. INTRODUCTION AND REVIEW OF LITERATURE
In this Chapter a brief introduction is presented followed by the status of
Indian tea industry, processing, tea quality, determination, isolation and
identification of quality indicators and health benefits. The review of literature
covers aspects relating to the chemical composition, quality co-relation and
bioactivities in health benefits of teas as well as objectives and scope of the
research work. Besides, the general pathway of biogenesis leading to the volatile
aromatic compounds present in the tea have also been discussed. The brief
account is given below.
Sheng Nung the chinese emperor (2737 B.C.) was the first to recognize
the stimulant effect of tea. Tea is one of the important agro-industrial plantation
crops of India. Tea is the beverage with which most of the Indians start their day.
The recent research findings indicative of several health benefits have further
popularized tea as a beverage. During the year 2007, India produced 945 million
kg of tea from 38,705 gardens spread over an area of 4, 35, 057 ha. Out of this,
domestic consumption accounts for 76 per cent and exports accounts for 24 per
cent.
Tea plant belongs to the Camellia species of Theaceae family. The two
basic varieties are recognised namely chinese variety Sinensis and Assamese
variety - Assamica. The commercially grown tea plant is highly heterogenous.
Tea flush contains polyphenols, amino acids, organic acids, polysaccharides,
lipids, carotenoids, caffeine, chlorophylls, minerals and volatiles. The
polyphenols which includes catechins constitute 25-30% of the fresh flush on dry
2

weight basis. These are converted to theaflavins, thearubigins, theaflavic acids
and bisflavanols during the manufacture of black teas and these are responsible
for colour, briskness, brightness and astringency. Theaflavins are determined
qualitatively and quantitatively whereas quantitative determination of thearubigins
has been possible tentatively but their structures are yet to be explored
exhaustively. Caffeine is the major alkaloid present in tea and it is responsible for
stimulating action. Highly efficient HPLC method to determine soluble caffeine is
reported from this laboratory. Carbohydrates play an important role in the
formation of tea aroma. Lipid concentration increases with the maturity of the
leaves and is responsible for the formation of C6 volatiles during the manufacture
of black tea.
Three types of organic acids are present in tea viz., dicarboxylic acids, fatty
acids and monocyclic acids. Monocyclic acids (eg. Quinic and Shikimic) are the
precurors of polyphenols. Chlorophyll a and b are reported to be present in the
tea and are converted to phaeophytins which are responsible for black colour of
commercial tea. ß-carotene is the major compound among the carotenoids and
degrades to character impact volaitle compounds such as theaspirone, ß-ionone
and related compounds. Although K (Potassium) is the major mineral found the
Cu (Copper) and Al (Aluminium), are important for the colour and taste of brewed
teas.
Theanine is the most abundant amino acid and accounts for 50% of the
total amino acids and 1% of the dry weight of tea. Theanine is a constituent of
the "thearabigin" fraction while glutamic acid and ethylamine are its precursors.
Amino acids and glucose interact with tea polyphenols during thermal processing
and yield coloured moieties and Amadori products, which improve the flavour of
tea.
Catechins, theaflavins and thearubigins contribute to the bitterness,
astringency, brightness and total colour of black tea infusion. Further
thearubigins are responsible for body and richness of the tea brew. Theaflavin
digallate is having lowest threshold value for the astringency. Caffeine
contributes towards the bitter taste in tea. Characteristic umami or brothy taste of
3

black teas is due to the presence of amino acids. The ionone related aroma
compounds such as theaspiranes are formed from carotenoids and they are
found to have different odour properties. The aroma quality of tea with respect to
theaspiranes is yet to be exploited.
Volatile flavour compounds (VFC) play a major role in detemining the
unique flavor of tea. Although >600 compounds are reported but the unique
composition for character impact aroma of black tea is not yet established. The
aroma quality of black teas with respect to the VFCs is measured by different
ratios/indices viz., Terpene index, Wickremasinghe-Yamanishi ratio, Mahanta
ratio, Yamanishi-Botheju ratio. Wickremasinghe-Yamanishi ratio is the ratio of
sum of the peak areas of compounds eluting before linalool to the sum of the
peak areas linalool plus all compound that elute after linalool. Smaller the ratio
better is the quality. Mahanta ratio is the sum of the peak areas of terpenoids to
non-terpenoids. Yamanishi-Botheju ratio is the ratio of peak area of linalool to E-
2-hexenal. All the three ratios mentioned above have limitations for their
applicability.
Another aroma quality indicator called flavour index (F.I.), the ratio of VFC II
to VFC I is reported for kenyan clonal black teas and F.I. is positively correlated
to tasters evaluations. This confirms that F.I. is a good aroma quality indicator for
Kenyan black teas. However, it should only be used qualitatively since the
olfactory perception limits of individual VFC are different. A suitable ratio for
Indian black teas with reference to aroma and quality is yet to be explored and
the limitation is vide variation in weather. A new approach in terms of novel
quality index for tea through the present work has been innovated (chapter 2).
Tea is a good source of flavanoid antioxidants which has a role in
prevention of cancer and coronary heart diseases. Tea is known to improve
blood flow, eliminate alcoholic toxins, relieve joint pains and acts as a diuretic
and improves resistance to diseases.
Flavonoids present in tea can effectively stabilize free electrons through
several mechanisms viz., delocalisation of electrons, formation of intramolecular
hydrogen bonds and rearrangement of their molecular structure. This may be
4

the reason for their antioxidant property. The catechins ranked depending on
their antioxidant potential as ECG > EGCG > EC > GC > EGC > C. Theaflavins
and thearubigens inhibited the formation of TBARS and these are more effective
than vitamin E, glutathione, vitamin C and synthetic phenolic antioxidants.
Catechins were also found to be the scavengers of peroxynitrites which are
capable of oxidising LDL.
Theaflavins and catechin gallates are more effective scavengers of
aqueous and lypophilic stable radicals than many other flavonoids and many
antioxidant vitamins. The inhibition mechanism of tea flavonoids is independent
of metal ion chelation properties.
Tea flavonoids were found to reduce oxidative damage in animals from
radiation, chemical oxidants, diet stress. Drinking of tea beverage was shown to
reduce oxidative biomarkers in chronic smokers. Tea was found to reduce the
metabolism of compounds to known carcinogens and enhance their
detoxification. Thus it is claimed to inhibit variety of cancers such as oesophagal,
gastrointestinal, lung and skin cancers.
A cup of black tea is reported to be three times and two times more
effective than one serving of common vegetables and one serving of common
fruits respectively.
Ch. 2. PROFILING OF INDIAN BLACK TEAS
This chapter describes analytical determination of volatiles and non-
volatiles by different methods for profiling Indian black teas. Chromatographic
techniques for separation and their determination using spectroscopic techniques
besides flavour indices have also been discussed and the quality co-relation on
the scientific basis is discussed.
Indian teas especially Darjeeling, Assam and Nilgiris are valued world
over for their superior aroma and taste.
In order to improve our scientific understanding on objective tea quality
and thereby to help retain supremacy in the world tea trade, it was proposed to
5

make an in depth study to generate fingerprint profile of teas grown in different
regions of India which ultimately may result in a database with respect to volatile
flavour compounds (VFC) as well as non volatile flavour compounds (NVFC)
which are responsible for aroma, taste and quality of tea.
Novel approach for overall quality based on Seasonal, regional variations and bio-chemical quality fingerprint A study was carried on tea samples collected from nine regions spread over
four seasons. Profiling of the black tea samples from four seasons (S1=April-
June), (S2=July-Sept.), (S3=Oct.-Dec.) and (S4=Jan.-March) based on bio-
chemical fingerprint was accomplished.
The brief of the research findings is given below: Codes for Region / Grade / Garden
Region / Grade / Garden Code Tamilnadu, Parajulie A Tamilnadu, Pandiar B Darjeeling Medium C Darjeeling Premium D Assam AFTL E Assam Magor F Nilgiris HG G Dooars, Aibheel H Dooars, Chinchula I Palampur G1 J Nilgiris HG-CTC K Dibrugarh, Rose kandy L Palampu G2 M Assam, Cachar best N Assam, Cacher Med. O Darjeeling, Kurti P Assam BOP Q Nilgiris Waynad R Annamalai S Assam OP T
6
Seasonal variation of TF/TR ratio over tea producing region/grade and quality The TF content of a tea or the ratio TF/TR is considered to be a good
quality indicator of tea. Accordingly seasonal variations of TF/TR ratios over the
coded tea producing regions / grades in all the four seasons (s1, s2, s3, s4) were
studied. The teas having TF/TR ratios up to 0.04, >0.04-0.08 and >0.08 can be
considered to be a good, better and best quality indicator of tea quality
respectively. Teas from the region/grade A-I are the better (TF/TR ratios >0.04-
0.08) to best (TF/TR ratios >0.08) quality teas over all the four seasons except
for the teas from region A, C, D (s1), which fall under good quality category
considering their TF/TR ratios (upto 0.04).
Also the teas from region/grade K-L (s2), N,O (s1), PQ (s3) and RS (s4) are
the better (TF/TR ratios >0.04-0.08) quality teas except for the teas from region J
(s2), M(s3) and T(s4) teas, which fall under good quality category considering
their TF/TR ratios (upto 0.04).
The teas from region/grade JKL (s1, s3), M –T (s2), ORST (s3), MP (s1), Q
(s4) are also falling under good quality category teas, considering their TF/TR
ratios (upto 0.04).
Seasonal variation of sum of Yamanishi-Botheju and Mahantha ratio over tea producing region/grade and tea quality The VFC (Volatile Flavour Compounds) content of a tea or the sum of the
VFC ratios (Yamanishi-Botheju ratio and Mahanta ratio) is considered to be a
good quality indicator of tea. Accordingly seasonal variations of or the sum of the
VFC ratios (Yamanishi-Botheju ratio and Mahanta ratio) over the coded tea
producing regions / grades in all the four seasons (s1, s2, s3, s4) were studied.
Accordngly based on the sum of the VFC ratios (i.e.Yamanishi-Botheju ratio and
Mahanta ratio) the teas can be categorized as a good (upto 1), better (>1-4) and
best (>4) quality indicator of tea respectively.
The teas from regions/grade A-J (all seasons) have better (>1-4) to best
(>4) quality as indicated by sum of the VFC ratios (i.e.Yamanishi-Botheju ratio
and Mahanta ratio) except for teas from regions/grade AEFHIJ(s2),K-T (s2),
7
BDFHIJ(s1), BIJ(s3) which are good (upto 1) quality teas, as indicated by sum of
the two VFC ratios. Also the teas from regions/grade M (s3), O (s1), P (s3), RST
(s4) are good (upto 1) quality teas as indicated by sum of the two VFC ratios.
Seasonal variation of Borse-Rao quality index over tea producing region/grade and tea quality A new approach in terms of novel quality index for tea has been innovated
through present work and the results are presented. The sum of TF/TR ratios of
tea and the sum of the VFC ratios (Yamanishi-Botheju ratio and Mahanta ratio)
added together is proposed for the first time as a new and novel quality index,
hence forth referred to as Borse-Rao quality index, considered to be an overall
quality indicator of tea as both the non-volatiles/volatiles are given due
consideration in this quality index. Accordingly seasonal variations of the Borse-
Rao quality index over the coded tea producing regions / grades in all the four
seasons (s1, s2, s3, s4) were studied. Based on the the Borse-Rao quality index
teas can be categorized as a good (upto 1), better (>1-4) and best (>4) quality
tea respectively.
The teas from regions/grade having Borse-Rao quality index more than
four are C (s2, s4), D (s3, s4), G (s1, s2, s3), H (s3) and I (s4) are the best (>4) quality
teas.
The teas from regions/grade having Borse-Rao quality index ranging from
one to four are A (s1, s2, s3, s4), B (s2, s3, s4), C (s1, s3), E( s3, s4), F( s3, s4), H (s2,
s4), I (s3, s4), J(s2), M (s3) and RS (s4) and indicate that these are better (>1-4)
quality teas.
The rest of the teas from regions/grade having Borse-Rao quality index upto
one are good quality teas which are BDFH (s1), EF (s2), I (s1, s2), JKL (s3), K-T
(s2) and P-T (s3).
The profile of Indian black teas in terms of a bio-chemical fingerprint is
carried out in present study which will not only help in understanding the intrinsic
8

quality objectively but also help in tracing the origin of the teas based on the
markers identified.
For the first time a novel approach has been evolved to mark teas on the
basis of TF/TR ratio, VFC ratios and a novel tea quality index (Borse-Rao quality
index) is proposed which takes both volatiles and non-volatiles into account.
Ch. 3. FUNCTIONAL INGREDIENTS FROM UNUSED GREEN TEA LEAVES:
ACTIVITY AND APPLICATIONS
Despite several reports on the radical scavenging activity of green tea
from two leaves and a bud, the radical scavenging activity of green tea from
coarse and pruned leaves in particular is not studied. The pruned and coarse tea
leaves are tea plantation waste, India is one of the largest producers of tea.
Therefore, testing of its radical scavenging properties is of interest primarily in
order to find new promising sources for natural antioxidants. In this chapter
novel approach for preparation of the green teas from the pruned or coarse tea
leaves and optimization of extraction conditions to obtain catechin rich radical
scavenging conserve and its application with the following two objectives is
presented.
1. To isolate active conserves from coarse and pruned green tea leaves.
2. To use the active conserves for food applications
Processes for utilization of pruned/coarse green tea leaves (a plantation
waste) have been worked out. A novel process for green tea preparation has
been standardized and patented.
Processes for isolation, fractionation and enrichment (50-70 % catechin)
and separation of radical scavenging conserve (90-94% RSA @ 10-15 ppm) from
pruned/coarse green tea leaves have been standardized and patented.
Application of this catechin-rich radical scavenging conserve in
nutraceutical ice-cream and cookies was worked out and patented.
The details of the study are presented in the following paragraphs:
9

Normal, coarse and pruned fresh tea leaves (low grade) were procured
and subjected to enzyme inactivation using cross flow dryer (80-120oC, 4 –
8h), and continuous infra red dryer (70-120oC, 0.5-1.5h) at different
temperature and time intervals. The chemical parameters are found to be
in the following range, Caffeine (1.30-3.20%); Total polyphenols (11.5-
15.5%). Sensory characteristics were found to be similar to that of the
commercial green tea samples. Forty four compounds have been identified from the volatiles of green teas
by comparing the mass spectra as well as retention indices reported in literature,
followed by retention times of the GC peaks with those of reference compounds
run under identical conditions where ever possible. The broad classification of
the compounds identified includes ten terpenoids, three aromatic compounds,
eight alcohols, seven aldehydes, four acids, eight esters and four compounds
derived from carotenoids. Ethyl hex-(2E)-enoate and dihydroactinidiolide are
exclusively present in the green teas derived from coarse leaves.
In general, coarse green teas irrespective of the method of processing
contained more number of the volatile constituents, whereas the normal green
teas irrespective of the method of processing contained less number of volatile
constituents eluting before linalool. This can be attributed to the normal leaf
quality, which contributes less volatiles from the group of constituents (Gr. I)
which are undesirable, which is the prevalent practice in the industry as well. It is
also evident from the results that normal as well as a commercial sample of
green tea contained almost half the number of identified volatile constituents in
the present investigation as compared to the coarse green teas contained.
Dihydroactinidolide and ethyl hexenoate were found to be important markers and
both were present in coarse green teas, whereas both were not found in the
normal green teas including the commercial one. It can be concluded that the
commercial green tea (Nilgiris green tea) is also prepared from the normal tea
leaves. This can be very well used in spotting the normal / coarse green tea or
the admixture of the coarse green tea leaves with the normal green tea leaves.
Other important marker volatiles found were the both heptadienals [(E,Z)-2, 4 /
10
(E,E)-2,4]. Coarse green tea contained both the heptadienals, whereas normal
green teas did not contain any of the identified heptadienals in the present
investigation. cis-3-hexenyl-n-hexanoate, ∝-ionone, cis-geranylacetone and β-
ionone-5,6-epoxide were not found in a normal green tea. This can be attributed
to the method of processing (CFD) and higher temperature (110°C) used.
Green tea extract The extraction of green tea samples at lab scale, using different solvents
(viz., Ethyl acetate, acetone, ethyl alcohol, methyl alcohol and their aqueous
mixtures) was carried out.
The radical scavenging activity (RSA) of these extractives at 50 and 100 ppm
concentrations were evaluated using the DPPH model system. The order of
activity and extractability are as follows: Methanol > Ethanol> Acetone > Ethyl
acetate The aqueous alcoholic mixtures showed higher activity and polyphenol
extractability than the respective single solvents.
It was found that the yields of the extractives from green teas of coarse leaves
are relatively low on the expected lines and the radical scavenging activities of
the extractives of green teas from coarse leaves are marginally low at different
concentrations. This observation indicated that the green teas from coarse
leaves could be used for the preparation of radical scavenging conserves, by
separating / enriching the active components using suitable technique.
Fractionation of the green tea extract
The extractives were subjected to liquid-liquid extraction using water and
low molecular weight ester to fractionate the catechins into the solvent fraction.
These extracts were analyzed for total polyphenol content and evaluated for
radical scavenging activity. The polyphenol content of the solvent extracts found
to be 30±2.3% as gallic acid equivalents for coarse leaves, while, polyphenol
content of the solvent extract of normal leaves is found to be 31±2.4% as gallic
acid equivalents. The total polyphenol content in the aqueous portion of these
extracts is 23±2.1% as gallic acid equivalents for normal leaves, while that for
coarse leaves extracts is found to be 18±3.0% as gallic acid equivalents. The
11
yields of the solvent extracts are found to be 15±0.8% for coarse leaves and for
normal leaves the yield of solvent extract is found to be 17±0.8%. The yield of
the aqueous extract is 17±0.9 % for coarse leaves and for normal leaves the
yield of solvent extract is found to be 19 ±1.0 %. However, the radical
scavenging activity of the solvent extracts from both normal and coarse leaves is
found to be same (92±1% at 15 ppm). The RSA of the aqueous extracts is found
to be lower. Hence, it may be concluded that the solvent used separated the
compounds responsible for the radical scavenging activity.
The data obtained reveal that the green tea extracts / conserve is free radical
inhibitor and primary antioxidant that react with DPPH radical, which may be
attributed to its hydrogen donating ability.
HPLC profiling of green tea extractives, chemical composition and quantification
The total catechin content in the green tea extract based on the
comparison of peak areas of each peak with that of authentic samples and from
calibration curves was found to be in the range of 20–30 %. After fractionation
the solvent extract is enriched with catechin and the total catechin content is
found to be in the range of 55-85 %, while the HPLC profile of aqueous extracts
showed only the presence of gallic acid and caffeine.
Extracts from unused fresh green tea leaves have the potential for large-
scale application as natural antioxidants. Extracts of the green tea are becoming
increasingly important as functional ingredients in the diet and are being added to
a range of foods and beverages.
Improved method for the active conserve
To minimize the processing cost and to control the epimerisation of
catechins during processing, alternate methods were explored. Green tea
sample from fresh batch was subjected to aqueous alcoholic extraction. The
extract was concentrated to remove the alcohol to the extent possible. The
12

obtained miscella was cooled to 10oC and kept over night at that temperature.
The separated solids were filtered and dissolved in low molecular weight ester
and the filtrate was also treated with the same ester. Solvent was removed from
the combined portion and the yield was found to be 12±2%. Both aqueous and
ester portions were subjected to HPLC analyses. Ester soluble portion was
found to contain most of the catechins. The aqueous portion (filtrate) was freeze
dried and the solid yield was ~12±2%. Total polyphenol content and Radical
scavenging activity (RSA) of the aqueous portion and ester portions were
evaluated. RSA of the aqueous portion was found to be in the range of 70-85%
at 40-50 ppm concentration, while that of ester portion was in the range of 85-
90% at 10-15 ppm concentrations. The total polyphenol content in the aqueous
portion was found to be 23-25%, while that of in the ester portion are in the range
of 27-32%. The project economics of the process for catechin conserve is also
presented.
Catechin-rich nutraceutical ice-cream
Ice-cream was prepared using the food ingredients along with the
polyphenol conserve. The concentration of tea catechin conserve was tried in
the range of 5-200 ppm. The optimum range of tea catechin concentration was
found to be in the range of 20-30 ppm.
The results of the sensory analysis for ice-cream with tea antioxidant extract
show that , 15% of the respondents rated under like very much (LVM), 45% of
the respondents under like moderately (LM) and another 40% under Like Slightly
(LS). However the ice-cream samples are acceptable as the scores are falling on
‘Like’ category.
Catechin-rich nutraceutical cookies The cookies were prepared using the required food ingredients along with
green tea catechin conserve. The concentration of green tea catechin conserve
was tried in the range of 10-400 ppm. The optimum concentration was found to
be in the range of 20-50 ppm by sensory evaluation.
13
14
The results of the sensory analysis indicated that 53% of the respondents
rated cookies as LVM, 32% of the respondents rated it as LM and 15% of the
respondents rated it as LS indicating the product is acceptable. As the results are
falling on the ‘Like’ category, the product is acceptable.
Ch. 4. SUMMARY AND CONCLUSION
The significant findings of the complete study have been presented in a
comprehensive way under Summary and Conclusions.
[Borse, B.B.] Student [Dr. L. Jagan Mohan Rao] Guide


CHAPTER 1
INTRODUCTION AND REVIEW OF LITERATURE
1.1. INTRODUCTION
Tea is one of the most popular commonly consumed non-alcoholic
beverages on this planet and enjoyed by larger section of population due to its
refreshing properties (Weisburger, 1999; Liao et al, 2001). Three major varieties
of teas (viz., green tea, oolong tea, black tea) are produced, with various degrees
of fermentation. The principal tea produced and consumed in the world is black
tea. Tea industry is one the chief foreign exchange earners in India. The role
played by Indian tea industry in employment generation is very significant. It has
not only provided employment but also created a sense of entrepreneurship
among certain sections of population. There are nearly one million workers
employed directly and another ten million who are indirectly dependent on the
Indian tea industry. The tea trade not only plays important role in Indian economy
but also in world economy. With the recent research findings on the biological
activities of different varieties of teas, the health savvy consumer is switching
over to tea and it is gaining more importance as a beverage due to its antioxidant
potential / health attributes.
The origin of tea dates back to the year 2737 BC discovered by Chinese
emperor Sheng Nung while boiling water under a tree. Use of tea was increased
by the spread of Buddhism in China and by the edict of the imperial court that tea
should replace the use of wine. Tea in China became so popular after Ming
1

Dynasty (1368 – 1644 AD) that it became the national drink and even today it
holds the status quo.
China enjoyed flourishing barter trade and communication with Rome,
Iran, India, Afghanistan, Korea and Japan in middle of sixth century. Opening of
sea-lanes led further expansion of tea trade. Tea became very popular in the
West. The Tea Act 1773 gave British East India Company (BEIC) monopoly in
tea trading to America and caused the “Boston Tea Party” and sparked the
American War of Independence.
1.2. CULTIVATION
In 805 AD, tea seeds and cultivation techniques were imported to Japan
from China. Tea seeds brought from China were planted in Korea (828 AD).
Cultivation of tea was introduced to several countries like Indonesia (1684), India
(1780), USSR (1833), Sri Lanka (1839), Malawi (1875), Iran (1900), Kenya
(1903) and Turkey and Argentina (1924). Now tea is grown in very wide range of
latitudes from 45ºN (Russia) to 30ºS (South Africa) and from 150ºE (New
Guinea) to 60ºW (Argentina).
Of late due to advancements in agricultural science, horticultural practices,
engineering and technological innovations, elite varieties and clones have been
developed. Recently tissue culture, biotechnology and computer technology have
added value to the cultivation techniques. But the other areas of concern are
unscientific use of chemical fertilizers and pesticides that have caused damage
2
to the soil, productivity and most importantly to the environment. These concerns
have given rise to organic farming and to some extent, it is now practiced in tea
plantations. Pruning and harvesting is mechanized to cope up with manpower
problems.
1.3. PRODUCTION
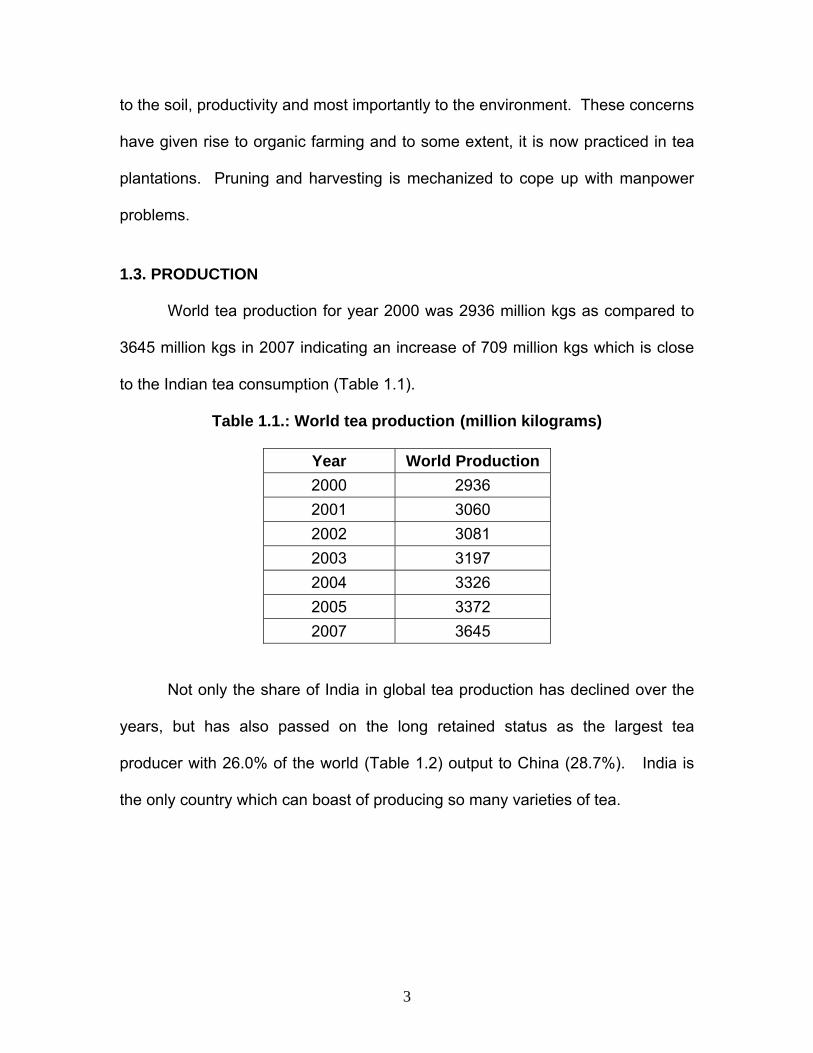
World tea production for year 2000 was 2936 million kgs as compared to
3645 million kgs in 2007 indicating an increase of 709 million kgs which is close
to the Indian tea consumption (Table 1.1).
Table 1.1.: World tea production (million kilograms)
Year World Production 2000 2936 2001 3060 2002 3081 2003 3197 2004 3326 2005 3372 2007 3645
Not only the share of India in global tea production has declined over the
years, but has also passed on the long retained status as the largest tea
producer with 26.0% of the world (Table 1.2) output to China (28.7%). India is
the only country which can boast of producing so many varieties of tea.
3

Table 1.2.: Share of India in world tea production (%)
Year Production 1953 41.0 1963 39.0 1973 38.0 1983 28.0 1993 29.0 1998 30.0 2005 27.5 2007 26.0
Teas from Darjeeling, Assam and the Nilgiris are world famous for their
taste and flavour. Of the total tea produced in India in 2007, 90.0% was CTC,
8.0% was orthodox and 1.0% each of Darjeeling and green tea. And for south
India (Table 1.3) in 2007 it was, 83.0% CTC, 16% orthodox and 1.0% of green
tea.
Table 1.3.: Tea production in India (million kilograms)
Region / year 2004 2005 2006 2007
India 893 945 981 945
South India 231 227 228 220
North India 662 718 753 725
Being located in backward and rural areas, the tea plantations supplement
the economy of the different regions and provide a higher standard of living at the
grass root level.
4

There has been a significant increase in production and productivity in the
last five decades (Table 1.4). The number of gardens has gone up manifold
registering an increase of ~500 percent over 1951. Bulk of this increase had
taken place in the Ninties, particularly in the small growers segment in Assam
and North Bengal. When compared to 1951, the production in 2006-07 has
trebled from 285 to 981 and 945 million kg. Much of the increase could be
attributed to improvement in productivity as the land under cultivation had shown
a meagre, increase of 38%. The production and productivity have shown a
significant increase of ~325 % and ~210 % respectively.
Table 1.4.: Growth of Indian tea industry (1951 – 2007)
No. of gardens
Production (m. kg)
Yield Year Area (ha) (kg/ha) 1951 06214 3,16,870 285 901 2007 38705 5,40,050 945 1900 Increase over 1951 32491 2,23,180 660 999
1.4. CONSUMPTION
India is not only the largest producer of tea but also the largest consumer
in the world. Nearly 24% of the global production and 75% of India’s total
production is consumed in the country (Table 1.5). The most significant growth is
in domestic consumption. From a mere 73 million kg in 1951, domestic
consumption has gone up to as much as 760 million kg.
5

Table 1.5.: Share of India in world tea consumption (%)
Year Consumption 1953 12 1963 16 1973 21 1983 19 1993 22 1998 23 2005 25 2007 21
More interestingly even with the consumption of nearly 75% of the total
production, the per capita consumption in India is one of the lowest in the world
with 660 gram per head. With the increasing awareness about health attributes
of tea and improved living standards, demand for domestic consumption
continues to grow steadily. It is this demand which is expanding forward the
industry and compelling it to grow as fast as possible. More importantly the rise
in domestic consumption is the industry’s greatest strength. From 1951 to 1958,
the domestic consumption on an average registered a compound growth rate of
4.74% per annum, whereas the production growth rate was only 2.4%. This gap
needs to be bridged in order to retain India’s pre-eminent position as the largest
producer of tea.
It was estimated that India will require about 1000 million kg of tea by the
end of the Ninth Plan in 2001-02, to meet the growing internal consumption plus
the demand for export calculated on the basis of retaining India’s share of the
world tea market. It has been achieved on her own production (981 million
kilograms in 2005-06) by the end of the tenth plan.
6

1.5. EXPORTS
The one area of Indian tea industry which has shown steady decline since
1950 is the export front (Table 1.6). In 1951, exports were around 206 million kg
and in 1988, it remained at the same level. It will be of interest to note that tea
export exceeded 97 % of the total production in 1900. This pattern of tea export
had continued for next five decades. It was only after 1950s, that internal
consumption of tea began to rise rapidly and the share of export from India
started declining. In 2007, India accounted for 14% of the world exports in
comparison to 45 % in the late forties.
Table 1.6.: Share of India in world tea exports (%)
Year Production 1953 48
1963 39
1973 27
1983 24
1993 15
1998 17
2005 13
2007 14
The information on production and export share of major tea producing
countries is presented in table 1.7. The overall scenario in India is quite different
from that of other major producing countries such as Kenya and Sri Lanka. While
these countries export as much as 95% of their produce, it is the reverse in the
case of India.
7

Table 1.7.: Production and export share of major tea producing countries (%) over last decade (1997- 2007)
Country Production Export
India 30 13
China 22 18
Sri Lanka 10 22
Kenya 10 17
Indonesia 05 06
Total 77 76
In 2004, the value of Indian tea exports was Rs.1841 Crores, and in 2005,
it was Rs.1738 Crores. However, in terms of volume, the exports of tea have
come down to 192 million Kg. (2005) from 198 million Kg (2004) and later
increased to 219 million Kg during 2007. Our markets also need to be
diversified. There are several global markets like Syria, Tunisia and Pakistan,
which are yet to be explored by India.
1.6. BOTANY OF TEA Botanical Name :Camellia sinensis (L) O.Kuntze
Family :Theaceae
Genus :Camellia
Species :Sinensis
Varieties: 1. Camellia sinensis var. sinensis (Chinese jat) and
2. Camellia sinensis var. assamica (Assam jat).
According to binomial system of Linnaeus, the tea plant was classified as
Theasinensis in 1753. Many synonyms were given, but in general it is now
accepted that the tea plant be classified in the family Theaceae and in the
8

camellia genus. There are many varieties evolved from different cultivation
practises and number of other variables.
Camellia sinensis, (L) O.Kuntze, is grown in a very wide range almost
world over from CIS (Formerly USSR) to South Africa, and from New Gueinea to
Argentina, i.e. from 45°N to 30°S and from 150° E to 60°W of latitudes.
Sealy, (1958) reported, Camellia sinensis variety sinensis (Chinese jat)
and Camellia sinensis variety assamica (Assam jat), are two main varieties or
jats of tea. Since propagation of tea plants was originally by seed, it added to the
heterogeneity. It was necessary to adopt vegetative propagation to evolve true to
type plants. Hence vegetative propagation methods have been introduced
(Visser and Kehl, 1958) and are practiced for new plantations and for filling in
vacancies in existing plantations of tea and also for replanting. But the
commercially grown tea plant is generally a highly heterogeneous mixture with
contributions from other varieties of Camellia such as C. irawadiensis and C.
cambodiensis (Wight and Barua, 1954). Barua (1989) and Banerjee (1992) have
discussed comprehensive accounts of botany, botanical classification and
physiology of tea.
1.7. PROCESSING
Tea can be processed in a number of ways, but usually it is made into
green or black tea.
9

1.7.1. Green tea
Greeen tea is the unfermented form of tea or the unoxidised form of tea
prepared by keeping the polyphenols in native state. The processing of green tea
involves withering, rolling, steaming / pan firing / radiation fixing, drying, sorting,
grading and packing. The major producers and consumers are China, Japan and
Sri Lanka.
1.7.2. Black tea
Black tea processing as a whole consists of a number of mechanical
operations combined with or alternated by chemical and enzymatic reactions
followed by drying. The fundamental process in making black tea, incorrectly
called fermentation, consists of a series of oxidations and condensations of
certain substances in the withered leaf initiated by the rolling process. One may
feel that tea manufacture is a simple process, but it is not so and numerous
important factors affect the final product. The five steps involved in the black tea
processing are:
1. Withering
2. Rolling / leaf distortion
3. Fermentation
4. Drying
5. Sorting and grading
The freshly plucked young shoots of the tea bush, which is the basic
material for tea processing, are withered by moisture evaporation during initial
16 to 20 h to prepare the leaf for further processing. Withering continues to a
10
stage in which the material physically can be rolled without breaking up
excessively and has undergone certain chemical changes, in which the
concentrated juice can be wrung out by a twisting action. During the rolling of the
withered leaf, the cell contents of the bruised material are mixed and aerated.
The polyphenolic bodies in the leaf belonging to the catechin group are more or
less oxidised by an enzyme taking up atmospheric oxygen, initially to yellow
theaflavins and subsequently to red and brown thearubigins. After rolling, the
material is subjected to further fermentation by spreading it under adequate
conditions of temperature and humidity for such a period that the best possible
quality of made tea is obtained from the given basic material. After fermentation
many other changes take place including the development of the characteristic
aroma of tea. At a specified time fermentation is arrested almost completely by
removing the moisture from the fermenting material by drying. Drying not only
arrests or stops the fermentation but also provides a dry finished tea. Dried tea
can be easily handled and can withstand prolonged storage without deterioration.
Sorting and grading is done to achieve clean grades and uniform size which is
useful to the users. Grading is an important operation for marketing of tea,
ensuring the correct particle size, shape, and cleanliness required by the buyer.
Major grades of black tea incase of orthodox tea are whole leaf, broken, fannings
and dust and incase of CTC tea are broken, fannings and dust, which are
separated from each other by sifting the made tea through standard wire
meshes. The blending is an operation wherein a blend of teas from different
growing regions and grades of tea is prepared in order to keep the quality of tea
11

uniform as per the market requirement. The professional tea taster is an integral
part of blending operation and plays a vital role in blend formulation.
1.8. BIO-CHEMICAL MOIETIES IN TEA
The tea contains different classes of chemical moieties. These classes of
compounds in tea have been studied (Vuataz et al, 1959; Millin and Rustidge,
1967). These include polyphenols, amino acids, caffeine, nucleotides,
carbohydrates, lipids, organic acids, chlorophyll, carotenoids, unsaponifiable
compounds, saponins, minerals and the very important volatile compounds.
1.8.1. Polyphenols
The total content of polyphenols in tea flush is 25-30%, on a dry weight
basis. These compounds are mainly flavanols, together with flavonols and
flavonol glycosides, flavones, acids and depsides. During processing of black tea
about 90-95% of the flavanols undergo enzymatic oxidation to products which
are directly responsible for the characteristic colour of tea brews, their
astringency and unique taste. Roberts named these oxidation products as
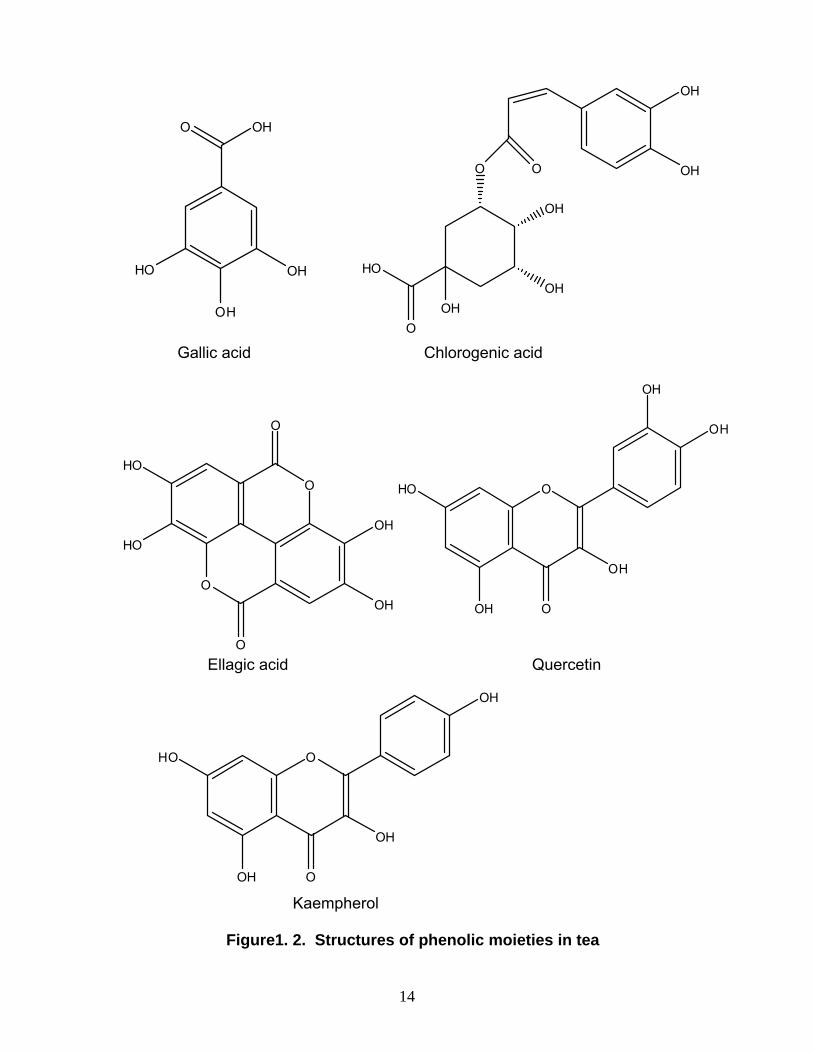
theaflavins and thearubigins. The structures of important polyphenolic moieties
from tea are presented in Fig. 1.1 and 1.2 (Sanderson, 1972a).
12

O
OH
OH
OH
OR
HOR1
epi-CATECHIN R = R1= H
epi-GALLOCATECHIN R = H R1= OH
epi-CATECHIN GALLATE R = GALLOYL R1= H
epi-GALLOCATECHIN GALLATE R = GALLOYL R1= OH
GALLOCATECHIN GALLATE R = GALLOYL R1= OH
CATECHIN GALLATE R = GALLOYL R1= H
GALLOCATECHIN R = H R1= OH
CATECHIN R = R1= H
R1
HO
OR
OH
OH
OH
O
Figure 1.1. Structures of phenolic moieties from tea – catechins
13
OH
HO
O
OH
OH
O O
OH
OH
OH
OH
HO
O OH
Gallic acid Chlorogenic acid
OH
OOH
HO O
OH
OH
O
O
OH
OHO
O
HO
HO
Ellagic acid Quercetin
OH
OOH
HO O
OH
Kaempherol Figure1. 2. Structures of phenolic moieties in tea
14

The reaction of prime importance in black tea processing is the oxidation of
pairs of catechins by polyphenol oxidase, leading to the formation of the black
tea pigments theaflavins and then compounds undergo further condensation
giving rise to thearubigins. Theaflavins consists of four major components;
theaflavin, theaflavin monogallates A&B, and theaflavin digallate which are
formed by the paired oxidation of catechins as follows:
Epicatechin + Epigallocatechin + 3/2O2 Theaflavin +CO2+ 2H2O
Epicatechin + Epigallocatechingallate + 3/2O2 Theaflavin-3-gallate +
CO2 + 2H2O
Epicatechin gallate + Epigallocatechin + 3/2O2 Theaflavin-3’-gallate +
CO2 + 2H2O
Epicatechin gallate + Epigallocatechin gallate + 3/2O2 Theaflavin-3,3’-
digallate + CO2 + 2H2O
Model tea fermentation systems were used to establish these reactions
(Co and Sanderson 1970 and Sanderson et al 1972b). The chemical structure
and configuration of theaflavin as a benzotropolone derivative was established
(Roberts, 1962; Takino et al, 1965; Brown et al 1966) as shown in Fig. 1.3. Also
isolation and characterization of the theaflavin gallates have been accomplished
(Bryce et al, 1970 and Coxon et al 1970).
Photometric methods have been developed for quantitative determination
of total theaflavin content (Roberts and Smith, 1961; Roberts and Smith, 1963;
Hilton, 1974) included. The approximate relative proportions were reported
(Coxon et al, 1970) as theaflavin-3-gallate (8%), theaflavin-3′-gallate (20%),
theaflavin-3-3′-digallate (40%), isotheaflavin (4%), and epitheaflavic acids (Coxon
15

et al, 1970). Near-infrared (NIR) spectroscopy (Ikegaya et al, 1989), ref. included
Gel filtration (Lea and Crispin, 1971), gas-liquid chromatography of trimethylsilyl
esters (Collier and Mallows, 1971) and high-performance liquid chromatography
(Robertson and Bendall, 1983) were used for estimation of theaflavin
andindividual gallate esters.
R1 R2 Theaflavin OH OH Theaflavin-3-gallate Gallate OH Theaflavin-3’-gallate OH Gallate Theafavin-3-3’-digallate Gallate Gallate
Figure1.3. Structures of Theaflavins from black tea
16

Studies on the chemistry of thearubigins (Brown et al, 1969 and Brown et
al, 1969a) showed the presence of five fractions, which were degraded to flavan-
3-ols, flavan-3-ol gallates, anthocyanin, delphinidin and gallic acid. It was
suggested that the thearubigin fractions investigated were mixtures of polymeric
proanthocyanidins and flavanoid residues. Thearubigins constitute as much as
10-20% of the dry weight of black tea (Sanderson, 1972a), which is 10-20 times
greater than the dry weight of the theaflavins (1-2%). These are the major
oxidation products of catechins during fermentation and make a highly significant
contribution to the depth of colour and strength of tea brews. One of the moieties
of thearubigins is the theaflavins, and it is known that during fermentation the
theaflavins reach peak (Roberts, 1958 and Owuor et al, 1986), after which they
are believed to undergo further oxidation to produce thearubigins (Cloughley and
Ellis, 1980; Cloughley 1980). The chemistry underlying the changes which occur
during tea leaf fermentation is reviewed and used as a basis for proposals for the
structure of thearubigins, the major pigments of black teas (Haslam, 2003).
Black tea beverage typically contains approximately 31% (w/w) flavonoids
as 9% catechins, 4% theaflavins, 3% flavonols and 15% undefined catechin
condensation products. A typical cup of tea (prepared from 1-2 g of black tea
powder) contains approximately 600 mg of total solids and 200 mg of flavonoids.
1.8.2. Alkaloids
The alkaloid caffeine and to a lesser extent, theobromine and theophylline
(Fig. 1. 4) are well known components of tea.
17

N
NN
CH3
O
HN
O CH3
O N
CH3
N
N
NH3C
OCH3
Caffeine Theobromine
Theophylline
N
NN
CH3
O
NH3C
O H
Figure1.4. Structures of Alkaloids from tea
Caffeine makes a significant contribution to the briskness and creaming
properties of tea. Briskness is a taste sensation, which makes an important
contribution to the evaluation of tea whereas the creaming property of tea brews,
the turbidity that developed when a tea brew is cooled, is an indication of tea
quality. A cream, which is bright and golden, is preferred to one which is dull and
muddy. A study of cream revealed that it is an insoluble complex of caffeine,
theaflavin gallates, polysaccharides, protein, and other compounds
(Wickremasinghe and Perera, 1966).
Several methods have been described for the quantitative estimation of
caffeine. These include spectrophotometry (Newton, 1969), gas chromatography
(Weerasinghe et al, 1982), high performance liquid chromatography (Herath and
18
Roberts, 1981; Ikegaya, 1985; Pura Naik and Nagalakshmi, 1997), and infrared
spectroscopy (Ikegaya et al, 1987).
The stimulant effect of tea is due to caffeine. It activates the central
nervous system and gives a feeling of freshness and alertness, which is a
positive effect of tea drinking if consumed in reasonable quantity.
1.8.3. Carbohydrates
It has been postulated that simple sugars play a part in the formation of
tea aroma. Starch is a major polysaccharide and the enzymatic breakdown
products of pectin have been implicated in the development of tea quality during
processing (Lamb and Ramaswamy, 1958).
Investigation on the polysaccharide fraction of the ethanol insoluble
material of tea flush (Selvendran and Perera, 1971) showed the presence of hot
water soluble polysaccharides, proteins, ammonium oxalate soluble pectin acids,
sodium hypochlorite soluble compounds, hemicelluloses A and B, and ∝-
cellulose. More recently (Sakata et al, 1989), a new tea constituent 2-O-(β-L-
arabinopyranosyl)-myoinositol has been characterised as a major (ca.0.8%)
constituent of black teas. The data on carbohydrates of black tea infusion is
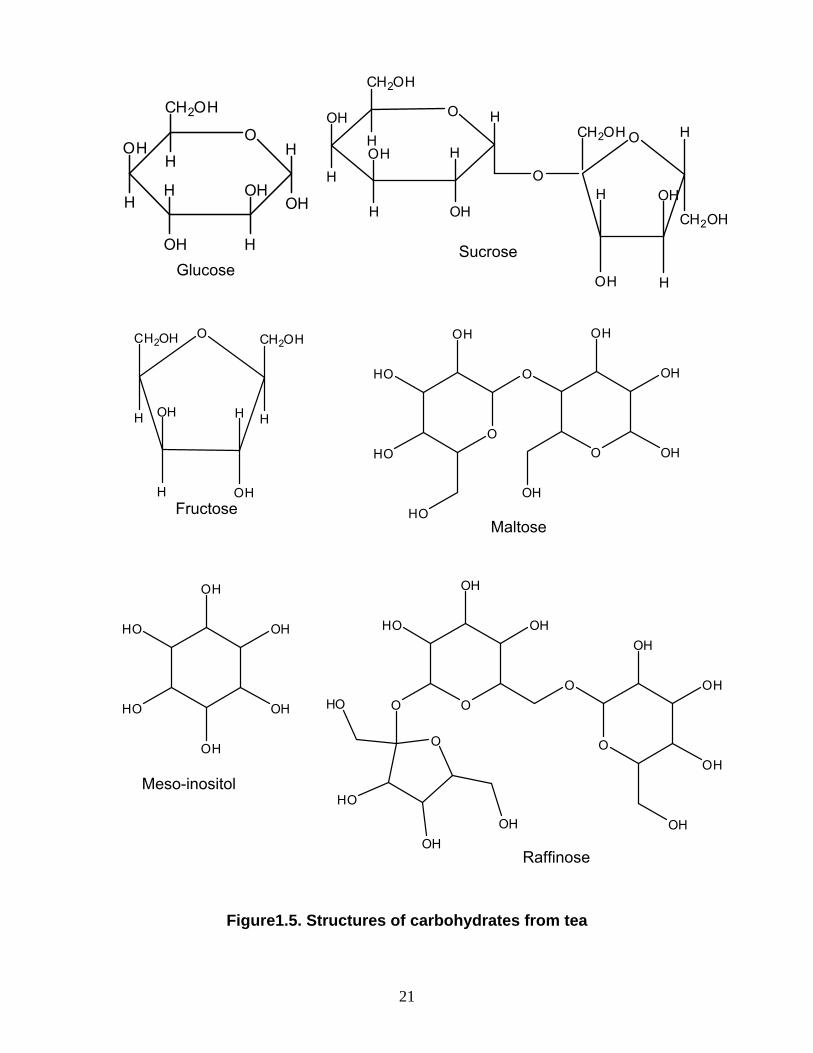
presented in Table 1.8., (Fig. 1.5)
19
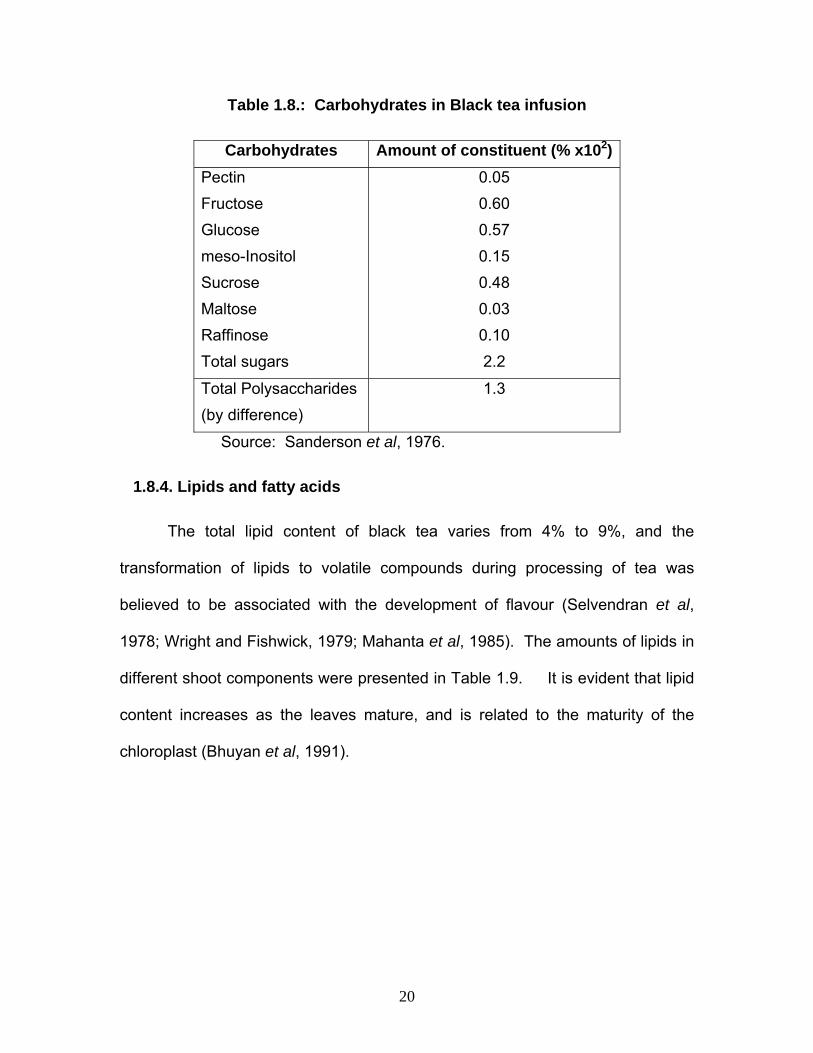
Table 1.8.: Carbohydrates in Black tea infusion
Amount of constituent (% x102) Carbohydrates Pectin 0.05 Fructose 0.60
0.57 Glucose meso-Inositol 0.15 Sucrose Maltose Raffinose Total sugars
0.48 0.03 0.10 2.2
Total Polysaccharides (by difference)
1.3
Source: Sanderson et al, 1976.
1.8.4. Lipids and fatty acids
The total lipid content of black tea varies from 4% to 9%, and the
transformation of lipids to volatile compounds during processing of tea was
believed to be associated with the development of flavour (Selvendran et al,
1978; Wright and Fishwick, 1979; Mahanta et al, 1985). The amounts of lipids in
different shoot components were presented in Table 1.9. It is evident that lipid
content increases as the leaves mature, and is related to the maturity of the
chloroplast (Bhuyan et al, 1991).
20
Sucrose Glucose
Fructose Maltose
Meso-inositol
Raffinose
Figure1.5. Structures of carbohydrates from tea
OH
OH
OH
OH
HO
HO
O
OH
HO
HO
O
O
OH
OH
OH
HOOH
OH
O
OOOHO
HO
OHOH
O
HO
OH
OHOH
OH
OH
O
H
CH2OH
H
OHOH
H
H
OH
OH
H
O
H
CH OH2
H
H
OH
OH
H
OH
H O
CH2OH O H
CH2OH
OH
H
H
OH
O CH2OH
HH
OH
OH
H
CH2OH
H
21

The lipid content and fatty acid composition of tea shoot and
manufactured tea were studied by Bhuyan et al, 1991. Glycolipids accounted for
about 60% of the total lipids and contained a high level of linolenic acid (Fig. 1.6).
Figure 1.6. Structure of Linoleic and linolenic acid
Palmitic acid occurred in higher concentration in phospholipids, but
myristic and lauric acids were abundant in neutral lipids.
Table 1.9.: Amounts of lipids in shoot components
Amounts of lipid (mg/g, dry weight) Components
Bud 36
First leaf 40
Second leaf 60
67 Third leaf
Fourth leaf 72
Stem
Whole shoot
30
52
Source: Bhuyan et al, 1991.
22

Identification of the fatty acids of tea leaves (Zaprometov, 1961; Saijo,
1973; Owuor, 1990) showed that linolenic acid was the most abundant, followed
by linoleic, palmitic, stearic, oleic, and palmitoleic. The relatively high levels
linolenic and linoleic acids are of interest in view of their oxidative degradation to
C6 aldehydes, alcohols and esters. These C6 compounds play a significant role in
tea flavour (Wickremasinghe et al, 1973).
1.8.5. Organic Acids
Malic acid was identified (Bokuchava, 1936 and; Sakato et al, 1955) in
fresh tea and fermented tea leaves, and this was followed by detection of oxalic,
citric, and succinic acids (Fig 1.7).
HO
O
OH
O OH
O
HO OH
O
HO
O
OH
Malic acid Citric acid Oxalic acid Succinic acid
O
OH
O
HO
O
OHO
HO
Figure1.7. Organic acids identified from tea leaves and fermented tea
23

Later investigations (Sanderson and Selvendran, 1965) showed ten
organic acids in extracts of tea flush, of which five were identified as oxalic,
malic, citric, isocitric and succinic acids. Oxalic acid, present as crystals in the
vacuoles of tea leaf cells (Green, 1971), is the predominant organic acid. The
occurrence of quinic and shikimic acids in tea flush was also demonstrated, in
keeping up their role as precursors of polyphenols (Neish, 1966).
1.8.6. Chlorophylls
Chlorophylls a and b (Fig. 8) were reported to be present in tea flush
(Wickremasinghe and Perera, 1966; Co and Sanderson, 1970; Kawamura et al,
1985;), which contains 1.4 mg of chlorophylls per gram on dry weight basis. A
relationship between chlorophyll content of various tea samples and grassy taste
was evaluated (Lelyveld and Smith, 1989), and concluded that high chlorophyll
content was associated with grassy taste.
Figure1.8. Structure of chlorophyll a and b
24
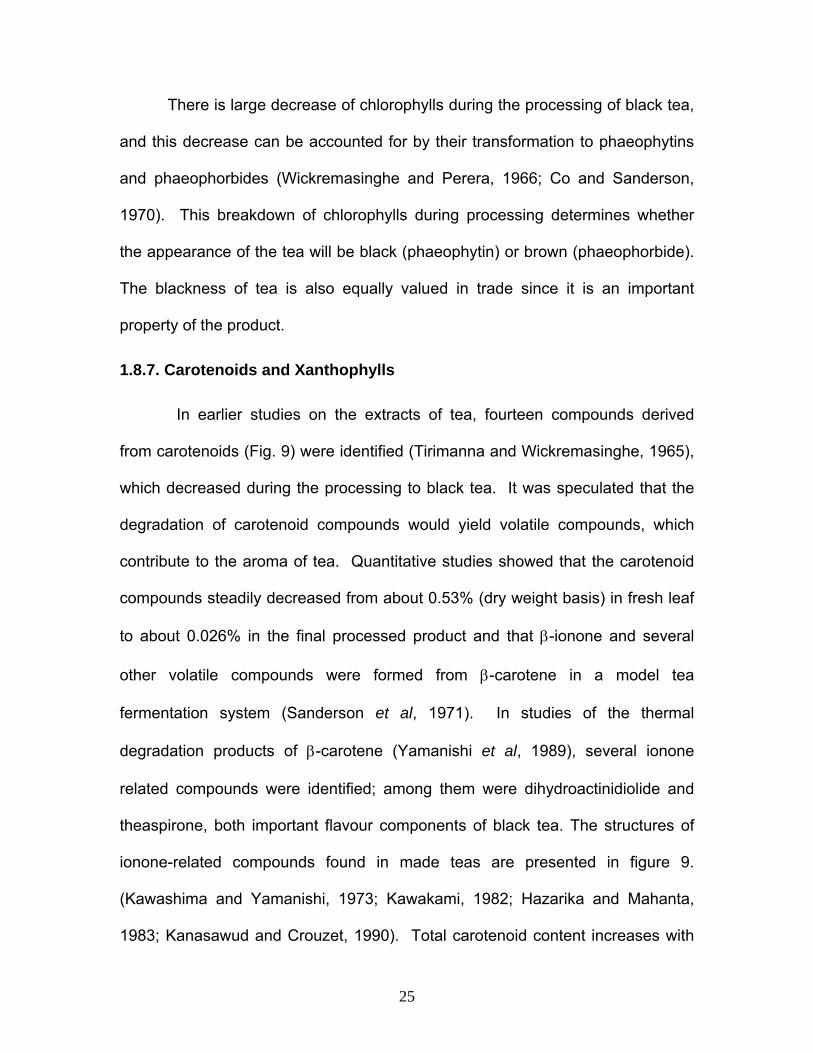
There is large decrease of chlorophylls during the processing of black tea,
and this decrease can be accounted for by their transformation to phaeophytins
and phaeophorbides (Wickremasinghe and Perera, 1966; Co and Sanderson,
1970). This breakdown of chlorophylls during processing determines whether
the appearance of the tea will be black (phaeophytin) or brown (phaeophorbide).
The blackness of tea is also equally valued in trade since it is an important
property of the product.
1.8.7. Carotenoids and Xanthophylls
In earlier studies on the extracts of tea, fourteen compounds derived
from carotenoids (Fig. 9) were identified (Tirimanna and Wickremasinghe, 1965),
which decreased during the processing to black tea. It was speculated that the
degradation of carotenoid compounds would yield volatile compounds, which
contribute to the aroma of tea. Quantitative studies showed that the carotenoid
compounds steadily decreased from about 0.53% (dry weight basis) in fresh leaf
to about 0.026% in the final processed product and that β-ionone and several
other volatile compounds were formed from β-carotene in a model tea
fermentation system (Sanderson et al, 1971). In studies of the thermal
degradation products of β-carotene (Yamanishi et al, 1989), several ionone
related compounds were identified; among them were dihydroactinidiolide and
theaspirone, both important flavour components of black tea. The structures of
ionone-related compounds found in made teas are presented in figure 9.
(Kawashima and Yamanishi, 1973; Kawakami, 1982; Hazarika and Mahanta,
1983; Kanasawud and Crouzet, 1990). Total carotenoid content increases with
25

increasing leaf maturity as do the carotenoid and xanthophyll contents. About
sixteen carotenoids were identified, and it was found that β-carotene constitutes
about 90% of the total carotenes. Lutein constitutes the bulk of the xanthophylls,
about 82% of the total xanthophylls in the first leaf (Venkatakrishna et al, 1977).
A simple, rapid and reproducible method using reverse-phase high
performance liquid chromatography for the separation and classification of
carotenoids and chlorophylls present in fresh tea leaves revealed the presence of
twenty eight pigments (Taylor and McDowell, 1991).
1.8.8. Minerals
In the initial reports, there is a wide variation in the aluminium content in
tea leaves, ranging from 1000 to 10,000 ppm (Winton and Winton, 1935). Chang
and Gudnason (1982) reported that the amount of K in the infusion (100 ml) was
more than 5 mg per gm of brewed tea, whereas the amount of the last group of
minerals was only about 0.01 μg per gram. Cu and Al are important because Cu
is a component of polyphenol oxidase, and Al is a factor that improves the colour
and taste of brewed tea. In another investigation on brewed infusion, the
element in highest concentration was found to be K, followed by P, Mg, Ca, Al,
Mn, Cu, Na, Si, Zn, B, Ba, Fe, Ni, Pb, Sr, Co and Cd (Natesan and Ranganathan,
1990).
Tea also contains an unusually high level of fluoride, ∼150 ppm in black teas
(Singer et al, 1967). This amount of fluoride in tea may be one of the reasons as
to why drinking tea lowers the incidence of dental caries.
26

O
C
OH
O
C
OHCis-6-Hydroxydihydro theaspirane trans-6-Hydroxydihydro theaspirane Cis-Theaspirane Trans-Theaspirane
O O
O
7,8 –Dihydro-α-ionone Cis-6,7-Epoxytheaspirane
O
O
H
trans -6,7-Epoxytheaspirane α-Ionone
O
O
H O
O
*β -Ionone 5,5,9-Tetramethylbicyclo[4,3,0]-non-8-en-7-one
O
O O
α- Damascone *β - Damascone
27
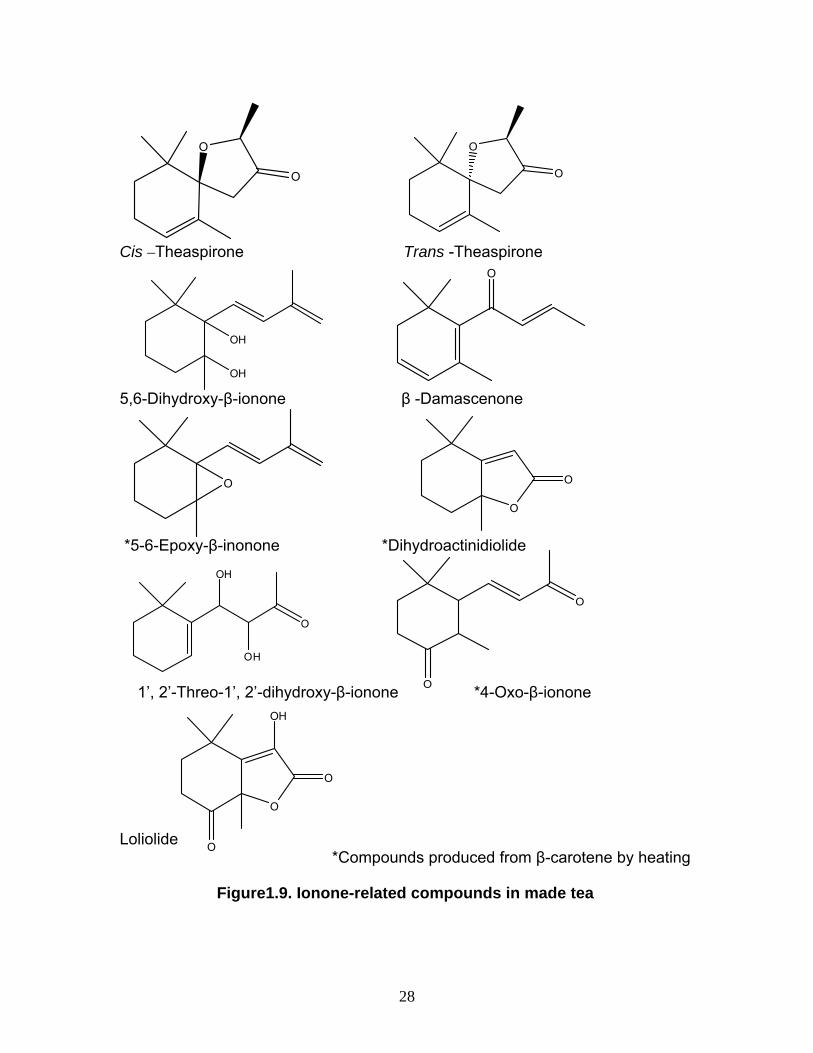
O
O
O
O
Cis –Theaspirone Trans -Theaspirone O
OH
OH
5,6-Dihydroxy-β-ionone β -Damascenone
O
O
O
*5-6-Epoxy-β-inonone *Dihydroactinidiolide 1’, 2’-Threo-1’, 2’-dihydroxy-β-ionone *4-Oxo-β-ionone
O
O
OH
O
OH
Loliolide
*Compounds produced from β-carotene by heating O
O
O
OH
Figure1.9. Ionone-related compounds in made tea
28

1.8.9. Amino Acids
Theanine was reported in tea for first time by Sakato (1950) and identified
as N-ethyl glutamine in the same year (Sakato et al, 1950). Theanine, which is
particularly abundant in high-quality green teas, has been reported as the prime
factor in the taste of green tea (Sakato, 1957). The presence of theanine, an
Angiosperm, is unique to tea, although its occurrence was reported later in the
mushroom Xerocomus badius (Casimir et al, 1960). Studies of the biosynthesis
of theanine, in tea indicate that the site of biosynthesis is the root (Sasaoka and
Kito, 1964; Konishi,1969; Wickremasinghe and Perera, 1952) and that the
precursors are glutamic acid and ethylamine. The occurrence of L-glutamic acid-
N-methylamide in tea, biosynthesized from L-glutamic acid and methylamine was
reported (Konishi and Takahashi, 1966). Theanine is the most abundant and
accounts for 50% of the total amino acids and 1% of the dry weight of tea. It is
particularly abundant in the roots of the tea plant and occurs in all parts of the tea
plant with the exception of the seed, where pipecolic acid is present in the early
stages of seed development (Ozawa et al, 1969). The exact role of theanine in
the tea plant is not firmly established, but it was suggested (Wickremasinghe et
al, 1973) that theanine may function as an hydrogen bond breaker, in keeping
with the properties of N-ethylamindes. Theanine is a constituent of the
thearubigin fraction, which is responsible for much of the colour of tea brews. It
has been proposed that ethylamine is formed from alanine by alanine
decarboxylase, and that this amine reacts with glutamic acid in the presence of
L-glutamate ethylamine ligase to produce theanine (Takeo, 1974). Studies of
29
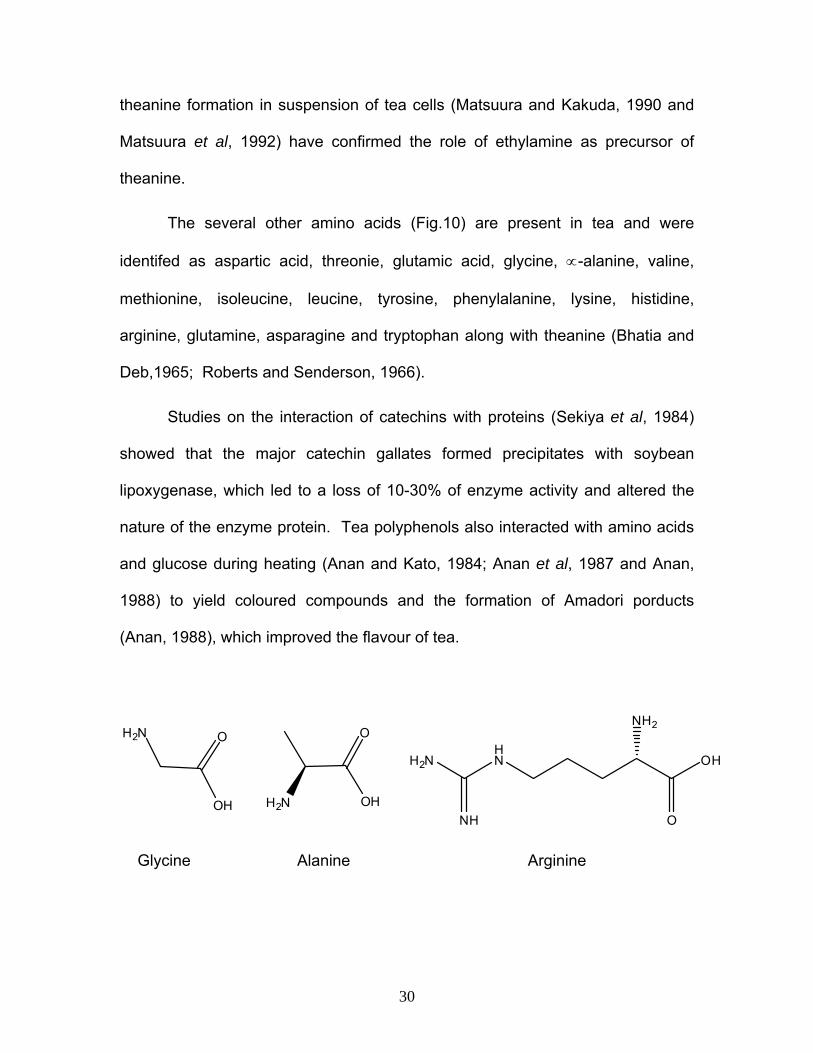
theanine formation in suspension of tea cells (Matsuura and Kakuda, 1990 and
Matsuura et al, 1992) have confirmed the role of ethylamine as precursor of
theanine.
The several other amino acids (Fig.10) are present in tea and were
identifed as aspartic acid, threonie, glutamic acid, glycine, ∝-alanine, valine,
methionine, isoleucine, leucine, tyrosine, phenylalanine, lysine, histidine,
arginine, glutamine, asparagine and tryptophan along with theanine (Bhatia and
Deb,1965; Roberts and Senderson, 1966).
Studies on the interaction of catechins with proteins (Sekiya et al, 1984)
showed that the major catechin gallates formed precipitates with soybean
lipoxygenase, which led to a loss of 10-30% of enzyme activity and altered the
nature of the enzyme protein. Tea polyphenols also interacted with amino acids
and glucose during heating (Anan and Kato, 1984; Anan et al, 1987 and Anan,
1988) to yield coloured compounds and the formation of Amadori porducts
(Anan, 1988), which improved the flavour of tea.
NH2
HN
NH
H2N
O
OH
H2N O
OH H2N
O
OH
Glycine Alanine Arginine
30
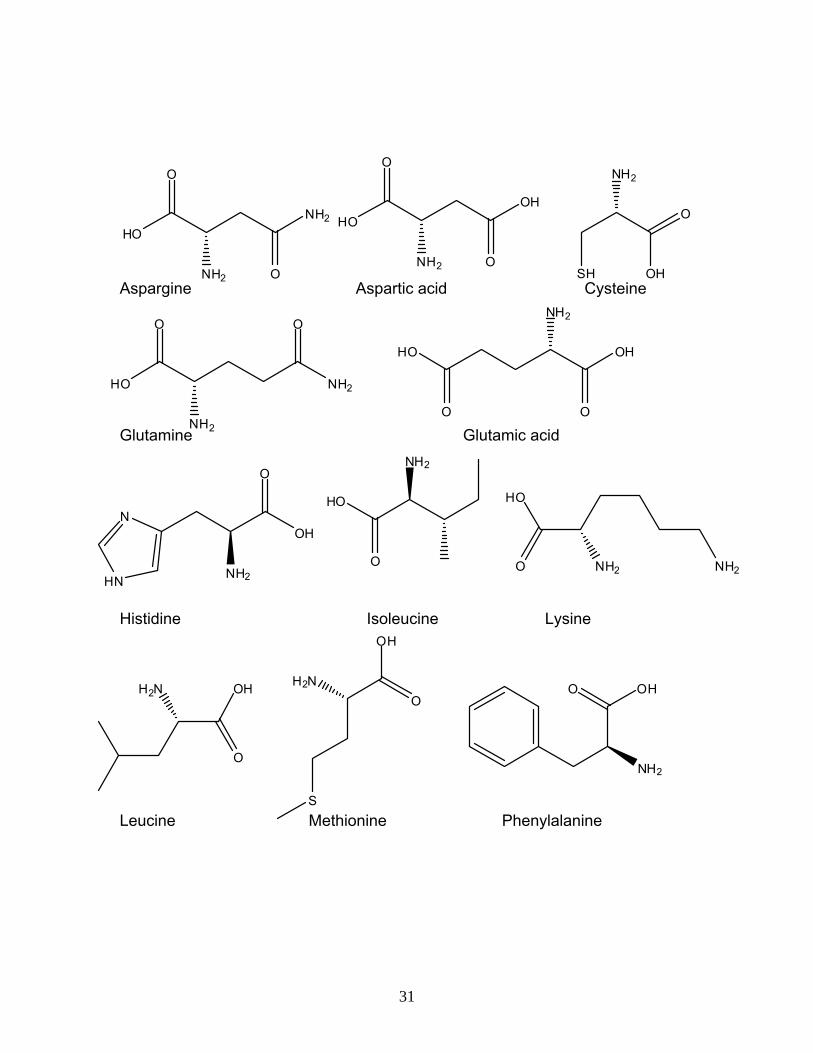
NH2 O
OH
O
HO
Aspargine Aspartic acid Cysteine
NH2
SH
O
OHNH2 O
NH2
O
HO
NH2
O
HO
O
OH
Glutamine Glutamic acid
NH2
O
NH2
O
HO
NH2
O
HO
NH2HN
N
O
OH
NH2 NH2O
HO
Histidine Isoleucine Lysine
Leucine Methionine Phenylalanine
H2N
S
O
OH
H2N
O
OH
NH2
O OH
31

NH2
HO O
HO
NH2
OH
O
OH
NH
O
HO
Proline Serine Threonine H2N
OHOHO
NH2HN
O
OH
Tryptophan Tyrosine Valine Theanine
NH2
O
HN
O
OH
NH2
O
HO
Figure1.10. Structures of amino acids present in tea
32
1.8.10. Volatile compounds (Aroma substances)
The volatile compounds accounts for 0.01% to 0.02% in tea, they play a
major role in determining the unique character of tea. More than 600 compounds
have been detected in the complex mixture of volatile compounds from tea.
These include hydrocarbons, sulfides, carbonyls, acids alcohols, esters,
lactones, pyridines, pyrazines, furans, thiazoles, quinolines, amines, amides, etc.
It is the combination of these numerous compounds that determines the aroma of
any given sample of tea, which provides almost infinite blends of tea aromas.
Concentrations of volatiles vary as per climatic conditions and geographical
locations.
Besides the world-famous seasonal Dimbula and Uva teas from Sri-
Lanka, the second flush teas from Darjeeling in India and Keemun tea from
China have outstanding flavour. It was proposed (Wickremasinghe, 1974) that
the mechanism in the biogenesis of tea flavour is the desiccation and
degradation of the chloroplast structure by the dry and cold conditions, when
normal intrachloroplastic bioysnthesis of flavour using acetate as precursor is
replaced with extrachloroplastic biosynthesis using leucine as precursor. These
two pathways are shown in Scheme 1.1. Evidence supporting these pathways
was the production of labelled mevalonic acid (a key intermediate in the
biosynthesis of terpenes) from either labelled acetate or labelled leucine during
the early stages of processing of black tea (Wickremasinghe, 1978). Scheme 1.1
also shows that hexenal, which detracts from tea flavour, is probably formed
during the production of terpenes from acetate but not from leucine. After winter
33

dormancy, growth resumes, and it is the second harvest (second flush) of the tea
in Darjeeling, which has unique flavour. Here, too, it has been proposed that the
extra chloroplastic reactions result in good tea flavour.
Normal Pathway Pathway in Flavour Season Leucine CO2 Acetate Acetoacetyl Co A ∝-ketoisocaproic acid Linolenic acid Hydroxymethyl β-methylcrotonyl Co A Glutaryl Co A
Trans-2-Hexenal Mevalonic acid Caretenoids Geranyl pyrophosphate
β-ionone etc.
Geraniol Linalool Nerolidol
Scheme1.1. Modified Goodwin’s scheme for biosynthesis of terpenoids, showing additional proposed pathways in the tea leaf (Wickremasinghe, 1974)
1.9. BIO-CHEMICAL MOIETIES AND CORRELATION TO QUALITY OF TEA
The standards prescribed for tea by different standards organizations such as
ISO, BIS and PFA are the purity standards. These standards do not provide
34
information about the intrinsic quality. The intrinsic quality of tea depends on
number of variable and non-variable factors. Some of the factors can be
controlled. With the result the intrinsic qualities of tea vary considerably.
Roberts and Smith (1963) have described a method for determination of
polyphenolic oxidation products in black tea liquors for the assessment of quality
in tea. Biswas et al (1973) reported about the briskness of liquor and intrinsic
quality evaluation. Further, Biswas et al (1973) had also reported that theaflavin
is associated with all the liquor characters, i.e., colour, brightness, strength,
briskness and quality. Ullah (1985) had critically discussed some of the intrinsic
quality parameters and liquor characters of black tea. The thearubigins mostly
contribute to the body of the liquor. Mahanta (1988) had reviewed the chemical
basis of liquor characteristics based on the influence of pigments and processing
conditions of black tea manufacture. Owuor and Obanda (1998) discussed
critically on changes in quality of the South African black teas.
In India, tea is being grown in 38,705 gardens spread over Southern,
Northern and North-Eastern States comprising of several regions of variable
climate, soil, rainfall, altitude and latitude. This obviously has an effect on the
intrinsic quality of tea. The manufacturing practises and methods further add up
to the variations in the quality of tea.
Though, the literature on intrinsic qualities of tea is available, the
information is scattered and is unorganized. Besides, there are no systematic
investigations on fingerprinting of Indian teas. Bio-chemical moieties in tea and
their role in quality and health are discussed in the following paragraphs.
35

The economic value of tea is based on its quality, which is based on taste
(non-volatile compounds) and aroma (volatile compounds). The taste
characteristic compounds are polyphenolic compounds, amino acids, caffeine,
and mixture of volatile compounds such as terpenoids, alcohols and carbonyl
compounds. The balanced mixture of astringency, bitterness, brothy taste and
sweetness are found in tea infusion.
1.9.1. Catechins
Tsujimura (1929; 1930; 1931; 1934; 1935; 1952; 1955.) added reported
tannin I and tannin II respectively, the two gallates having strong bitterness with
astringency and the free catechins as having bitterness with a sweet aftertaste.
Nakagawa and Torii (1964) reported the threshold values of galloylated
catechins and simple catechins to be approximately 4.1 to 4.4 x 10⁻⁴ M and 11.5
to 17.2 x 10⁻⁴ M respectively. Nakagawa (1970), in his studies of the
relationships of catechins to the quality of black and green teas, examined the
taste characteristics and threshold values of the individual catechins. The results
are shown in Table 1.10.
Table 1.10.: Sensory evaluation of five catechins (Nakagawa and Torii,1964)
Catechin Taste Threshold values a
(+) –Catechin Bitterness with sweet aftertaste 51.0
(-) – Epicatechin Bitterness with sweet aftertaste 45.5
(-)- Epigallocatechin Bitterness with sweet aftertaste 35.2
(-)- Epicatechin gallate Bitterness and astringency 18.1
(-)-Epigallocatechin gallate Bitterness and astringency 20.2
a Milligrams (mg)/100 milliliters (ml) water.
36

Millin et al (1969) described the contributions of non volatile components
of Black tea to the taste characteristics of brewed tea. Five pure flavanols (-) –
epicatechin (ECG), (-) epigallocatechin gallate (EGCG), Epigallocatechin (EGC),
(-)- epicatechin (EC) and (+)–gallocatechin (GC), which were isolated from dried
green leaves of var. assamica were tasted and reported that the tastes of these
components in water at concentrations found in black tea were slightly astringent
and metallic, and that EGC had a very persistent aftertaste of sweetness.
The catechin content in the tea leaves of var. sinensis and var. assamica
varies considerably (Nakagawa and Torii, 1964; Nakagawa, 1970; Millin et al.,
1969; Thanaraj and Seshadri, 1990). In Var. assamica the catechin content is
approximately twice that of var.sinensis, as shown in table 1.11. In general, var.
assamica is used for black tea and var. sinensis is used for green tea.
Table1.11.: Comparison of catechin contents of var. sinensis and var. asamica
Variety Clone EGCG
(%) EGC ECG EC Total (%) (%) (%) (%)
Assamica 1 15.1 6.8 3.4 1.7 27.0
Assamica 2 13.1 7.4 3.1 1.5 25.1
Sinensis 3 6.8 3.7 2.0 1.7 14.2
Sinensis 4 6.3 2.6 2.4 1.0 12.3
Thanaraj and Seshadri (1990) developed a factor called ‘theaflavin
digallate equivalent’ and related it to the black tea quality.
The concentrations of catechins, TFS, TRS and high polymerized
substances are given in Table 1.12. The concentration of catechins is lower and
37

that of TF, TR and HPS is much higher in black tea when compared to green and
Oolong teas, which is responsible for unique taste of black tea.
Table 1.12.: Concentrations of Catechin, Theaflavins, Thearubigins and
Higly Polymerized Substances (HPS) in Black Tea
Compounda Black tea (%) Reference (-)-ECG 0.29-0.42 Chamber of Tea Association,
Shizuoka prefecture,Shin Chagyo Zensho,1988.
(-)-EC -- (-)-EGCG 0.39-0.60 (-)-EGC -- Theaflavins 0.98-2.12 Thanaraj and Seshadri, 1990. Thearubigins 7.63-8.03 HPS 7.27-7.66
1.9.2. Theaflavins and thearubigins
Roberts (1950) considered that the thearubigins are as important to the
flavour and quality of black tea as are the theaflavins, and that they are
responsible for body richness and fullness of tea brew.
Roberts and Smith (1961) also stated that theaflavins impart the mouth
sensation of briskness, freshness and aliveness. Millin et al (1969) stated that
theaflavin had a distinct black tea like character and was difficult to describe.
Sanderson et al (1976) estimated that the amount of polyphenolic
compounds was approximately 48.5% of the total solids in a cup of tea and
determined the taste of the individual polyphenolic compounds in black tea brew.
These results are shown in Table 1.13, along with taste threshold values as to
astringency and bitterness for each compound. It was not possible to prepare
samples of thearubigins of sufficient sensorial purity for evaluation.
38
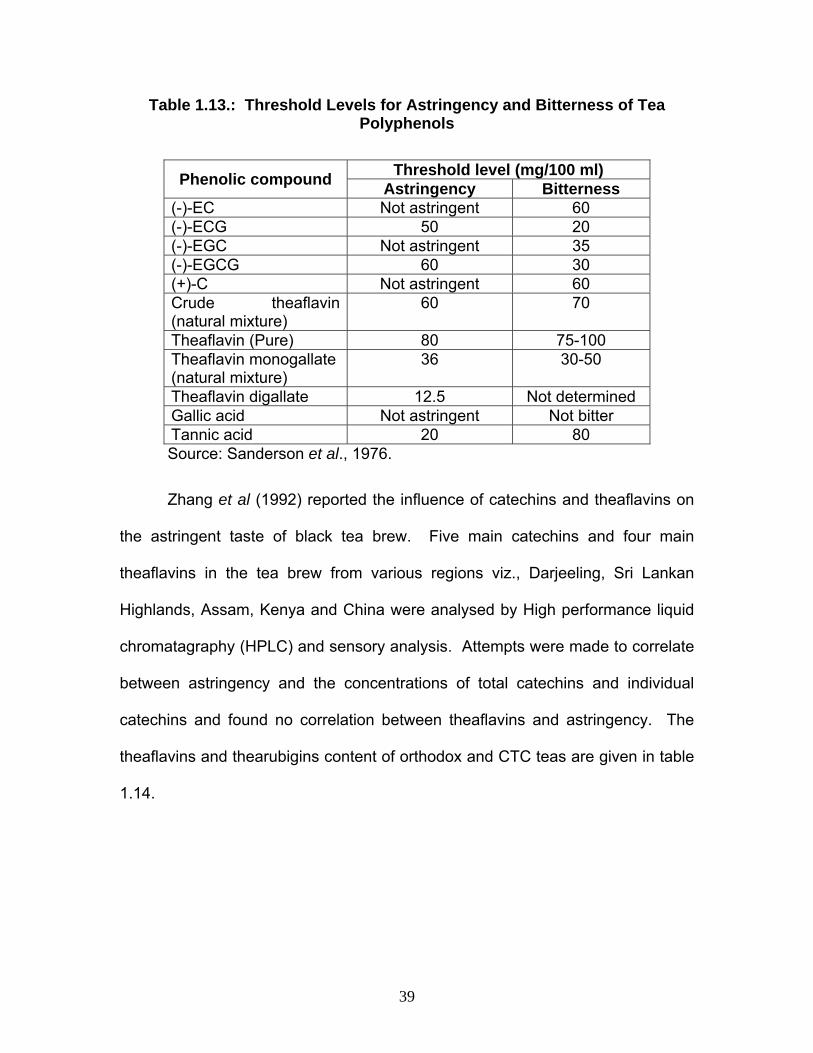
Table 1.13.: Threshold Levels for Astringency and Bitterness of Tea Polyphenols
Threshold level (mg/100 ml) Phenolic compound Astringency Bitterness (-)-EC Not astringent 60 (-)-ECG 50 20 (-)-EGC Not astringent 35 (-)-EGCG 60 30 (+)-C Not astringent 60 Crude theaflavin (natural mixture)
60 70
Theaflavin (Pure) 80 75-100 Theaflavin monogallate (natural mixture)
36 30-50
Theaflavin digallate 12.5 Not determined Gallic acid Not astringent Not bitter Tannic acid 20 80
Source: Sanderson et al., 1976.
Zhang et al (1992) reported the influence of catechins and theaflavins on
the astringent taste of black tea brew. Five main catechins and four main
theaflavins in the tea brew from various regions viz., Darjeeling, Sri Lankan
Highlands, Assam, Kenya and China were analysed by High performance liquid
chromatagraphy (HPLC) and sensory analysis. Attempts were made to correlate
between astringency and the concentrations of total catechins and individual
catechins and found no correlation between theaflavins and astringency. The
theaflavins and thearubigins content of orthodox and CTC teas are given in table
1.14.
39

Table 1.14.: Concentrations of Theaflavins and Thearubigins in Black tea
Method of Manufacture
Theaflavins (%)
Thearubigins (%) Reference
CTC 1.95 13.50 Ullah, (1985) Orthodox 0.59 5.54 CTC 1.13 -2.14 15.82 - 20.29 Owuor,(1987) Orthodox 0.59 - 1.03 9.34 - 11.88
This clearly indicates that CTC tea may have 2-4 times theaflavins and
1.5-4 times thearubigins as that of orthodox tea.
It was found that theaflavins and total colour are associated with
brightness of black tea brew (Lelyveld et al, 1990). Mahanta (1988) found that
black tea from Assam clones contain high levels of TF and lower levels of TR,
whereas China hybird clone had high TF and TR along with positive
characteristics of tea.
1.9.3. Caffeine
The caffeine concentration ranges between 2.5 to 5.5 % (dry weight basis)
in freshly harvested tea shoots. The tea shoots from assamica are richer in
caffeine than those from sinensis variety. Pure caffeine is bitter and the detection
threshold is approximately 3 ppm in water (ASTM, 1978). In tea brew, part of the
caffeine complexes with flavanols (theaflavins and thearubigins) and play an
important role in the tea taste, contributing to briskness, mouthfeel and strength.
Interaction between these compounds modifies the taste. It is known that
caffeine contributes to one fourth of the bitterness of the brews (Nakagawa,
1975). Removal of caffeine from tea infusion brings a significant effect on the
40

taste and changes the nature of the astringency from a tangy type to a non-tangy
type (Sanderson et al, 1976). In Kenyan teas, it was observed (Owuor, 1992),
that Group-I VFC levels are inversely related to the caffeine levels; ultimately as
caffeine levels increase sensory quality declines.
1.9.4. Amino acids
The major amino acids found in tea are theanin, glutamic acid, aspartic
acid, arginine, and serine. These contribute to the characteristic umami or brothy
taste (Sanderson, et al, 1976). Carbonyl compounds are formed by a non
enzymatic route when some amino acids are incubated with flavanols in hot
aqueous solutions, during the fermentation process (Nakabayashi, 1958; Saijo
and Takeo, 1970; Sanderson, 1972a). Amino acids and sugars are known to
react to produce furans, pyrroles and pyrazines (Yamanishi et al, 1989) when
heated together.
1.9.5. Carotenoids
The role of carotenes in black tea aroma formation by enzymatic reactions
has been reported (Sanderson et al, 1971). Carotenoids namely α- and β-
carotene, zeaxanthine and lutein are found in fresh tea leaves at a concentration
of 100 mg percent on dry weight basis (Sanderson and Graham, 1973;
Venkatakrishna et al, 1976). The ionone related aroma compounds are formed
from carotenoids during processing step of black tea manufacture.The formation
of isomeric theaspiranes and their different odour properties were reported
41

(Schmidt et al, 1992). More research on chiral compounds found in the tea
volatiles could be exploited to find the aroma quality differences in various teas.
1.9.6. Fatty acids:
Linoleic, linolenic and palmitic acids are the principal fatty acids found in
tea leaves (Liyanage, et al, 1988, Bhuyan and Mahanta, 1989). The linolenic
and linoleic acids get degraded to hexanol and (E)-2-hexenal during the tea
fermentation (Saijo and Takeo, 1972). Seasonal variations of C6 volatile
compounds viz., [Z]-3-hexenol, (E)-2-hexenal and n-hexanol and their precursors
in homogenates of tea leaves of var. sinensis were reported (Hatanaka et al,
1976a, 1976b).
1.9.7. Volatile Flavour Compounds The earliest studies on the volatiles of black tea were carried out by
Yamamoto and his co-workers (Yamamoto and Kato, 1934, 1935, 1935a,
Yamamoto and Itoh, 1937, Yamamoto et al, 1940, 1940a, 1940b). The summary
on the quantities of aroma volatiles calculated on the basis of compounds with
different functional groups in black tea is presented (Table 1.15).
Table 1.15.: Amounts of Volatiles Isolated from Black Tea
Essential oil (%)Fraction Amount (g) Black tea (ppm) Acids 32.0 12.8 24.6 Phenols 8.3 3.3 6.3 Bases 0.5 0.2 0.4 Aldehydes 36.4 14.5 28.1 Alcohols 173.2 69.2 133.2
Note:1300 kg black tea yielded 250.4 g (0.02%) crude essential oil
42

Later, the volatile flavour compounds were analysed by GC-MS and the
quantities of the compounds were expressed as the ratio of area of peak to that
of internal standard (Baruah et al., 1986; Owuor et al., 1986a).
Out of the total estimated six hundred compounds contributing to the
aroma of black tea, some are recognised to contribute negatively and others
positively towards the black tea flavour.
Several quantitative methods have been examined. Yamanishi et al.,
(1989a) used the ratio of the sum of the gas chromatographic peak areas of
compounds eluting before linalool to the sum of areas of linalool plus all
compounds with gas chromatographic retention time longer than linalool. Since
then this ratio was referred to as the Wickremasinghe-Yamanishi ratio. It was
assumed that compounds with retention times shorter than linalool were
deleterious to aroma whereas linalool and the VFCs, with longer retention times
than linalool, were desirable for black tea aroma. Thus, smaller the ratios better
the aroma and quality.
A ratio based on the sum of gas chromatographic peak areas of
terpenoids to non-terpenoids (Baruah et al., 1986 and Mahanta et al., 1988),
called Mahanta ratio was developed. The terpenoids were assumed to be
desirable while the non-terpenoids were classified as undesirable to tea aroma
and quality. However, some non-terpenoids in black tea, e.g., benzaldehyde
(Yamanishi et al., 1968), phenylacetaldehyde (Matoda, 1979), methyl salicylate
(Aisaka et al., 1978; Howard, 1978) and benzyl alcohol (Aisaka et al., 1978) were
demonstrated to possess desired aroma.
43

Yamanishi et al., (1989) developed another ratio based on gas
chromatographic peak areas of linalool and E-2-hexenal, which ignored all other
VFC. This ratio is known as Yamanishi-Botheju ratio. The rationale for the use
of Yamanishi-Botheju ratio requires that linalool and E-2-hexenal occur in large
amounts in all teas and therefore may have a dominant effect.
Although these ratios (or indices) may seem to work reasonably well, the
data must be used with caution. The indices should at best be treated as
qualitative since the olfactory perception limits of different VFC are variable.
Some VFC may exist at low levels and affect aroma more than those occurring at
high levels (Howard, 1978; Kobayashi et al., 1988).
Again the contribution of each VFC to flavour is not proportional to gas
chromatographic area. It is known that the relationship between stimulant
concentration (represented in GC peak area) and neural response (perceived
flavour intensity) is not linear.
Changes in black tea quality chemical parameters due to storage were
reported for South African teas. Increase in the contents of theaflavins and
thearubigins in two to six months of storage was observed and volatile flavour
compounds (VFC) were constant except trans-2-hexenal (decline) and phenyl
acetaldehyde increased, brought decline in sensory evaluation. This was
independent of grade and packaging material (Obanda and Owuor, 1995 ).
Seasonal variations in quality of kangra teas were also studied, six VFCs
indentified were more in backend flush compared to main flush (Gulati and
Ravindranath, 1996). The sensory attributes of tea aromas such as fresh, floral,
44

sweet floral, citrus, sweet fruity, fresh green, resinous and roasted had been
statistically co-related to the GC profiles of volatile flavour components by
multivariate calibration methods (Togari et al, 1995 ).
A parameter for aroma quality of Kenyan black teas was reported called
as flavour index (FI). FI is the ratio of the sum of peaks of tea volatile
compounds imparting superior flavour (Group II VFC) to those contributing to
inferior flavour (Group I VFC) (Yamanishi et al, 1968a, and Wickremasinghe et
al, 1973). This is one of important quality parameter for Kenyan teas. Group I
VFCs impart inferior green, grassy flavour to black tea. These include hexanol,
1-penten-3-ol, (E)-2-hexenal, 1-pentanol, 2-pentenol, 1-hexanol, (Z)-3-hexenol,
(E)-2-hexenol and 2,4-heptadienal and are necessary for characteristic flavour
but their high concentration impart an inferior flavour. Group II VFC impart a
sweet flowery aroma to black tea and include benzaldehyde, linalool and its
oxides, phenylacetaldehyde, methyl salicylate, geraniol, geranic acid, 2-phenyl-
ethanol, and β-ionone.
There were negative correlations between Group-I VFC and tasters
evaluations and positive correlations in most cases with those in Group II VFC.
The FI in all cases positively correlated with tasters’ evaluations (Owuor et al.,
1987a, 1987b). This confirms that FI is the best measure of aroma quality for
Kenyan clonal black teas. However, the FI should only be used qualitatively
since the olfactory perception limits of individual VFC are different.
The FI for Indian black teas is yet to be explored and limitation is the vide
variation in weather conditions compared to countries near equator.
45

(i) Orthodox black tea Keemum tea from China, Darjeeling tea from India and Uva tea from Sri
Lanka are the three most famous orthodox black teas in the world because of
their superior flavours. The variety used in making Keemum tea is predominantly
of var. sinensis, uva tea of var. sinensis, and Darjeeling tea is a hybrid of var.
sinensis and var. assamica. The aroma characteristics can be explained by gas
chromatographic analysis of aroma concentrates from these teas. The major
differences in aroma patterns are in the concentration of linalool, linalool oxides
and geraniol (Takeo, 1983).
The basic aroma characteristics are probably due to different varieties of
tea plants as well as the influence of specific growing conditions. To identify the
varietal origin of individual teas, Takeo and Mahanta (1983a) proposed a terpene
index (TI), which is defined as:
Linalool + linalool derivatives TI = -----------------------------------------------------
Linalool + Linalool derivatives + geraniol
The terpene index of pure variety sinensis approaches zero whereas the
TI of pure var. assamica approaches unity.
(ii) Crush-tear-curl tea (CTC)
The production of CTC tea is rapidly increasing with the increased use of
tea bags throughout the world. The flavour of CTC tea is inferior to that of
orthodox black tea because of high level of carbonyl compounds and the low
concentration of hexenyl esters, linalool, linalool oxides and other desirable
compounds. Compounds like leaf alcohol and aldehyde, which impart tea, an
46
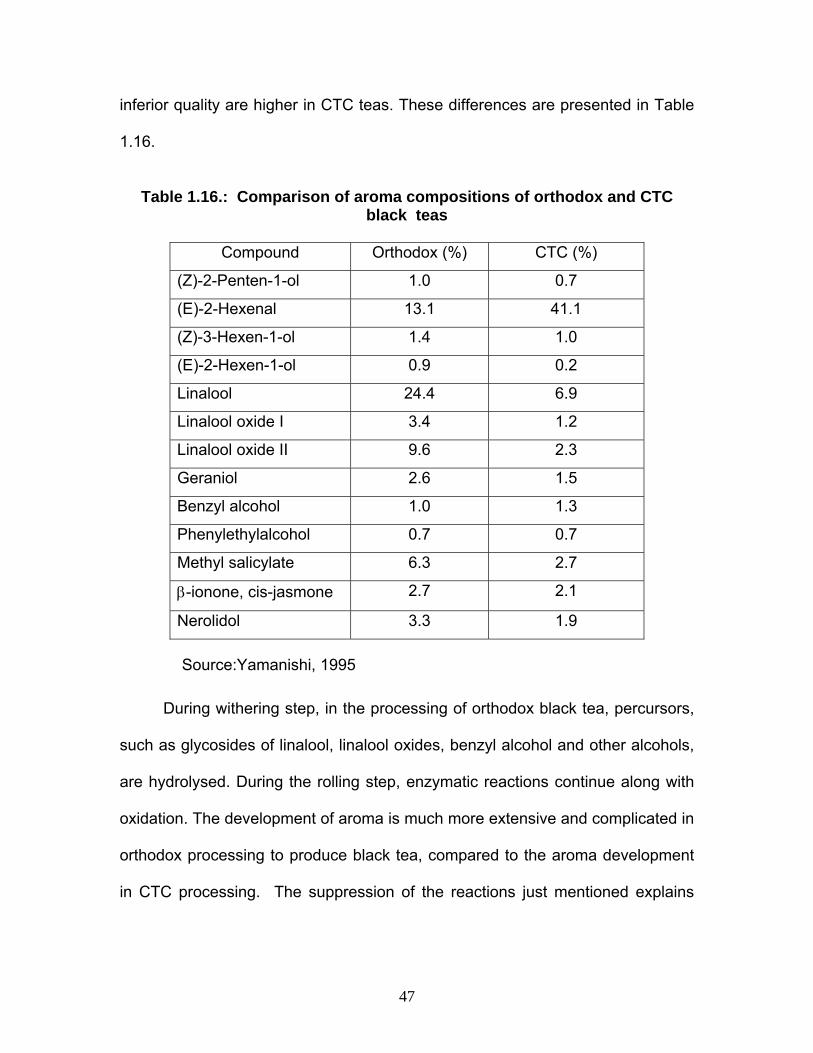
inferior quality are higher in CTC teas. These differences are presented in Table
1.16.
Table 1.16.: Comparison of aroma compositions of orthodox and CTC
black teas
Compound Orthodox (%) CTC (%)
(Z)-2-Penten-1-ol 1.0 0.7
(E)-2-Hexenal 13.1 41.1
(Z)-3-Hexen-1-ol 1.4 1.0
(E)-2-Hexen-1-ol 0.9 0.2
Linalool 24.4 6.9
Linalool oxide I 3.4 1.2
Linalool oxide II 9.6 2.3
Geraniol 2.6 1.5
Benzyl alcohol 1.0 1.3
Phenylethylalcohol 0.7 0.7
Methyl salicylate 6.3 2.7
β-ionone, cis-jasmone 2.7 2.1
Nerolidol 3.3 1.9
Source:Yamanishi, 1995
During withering step, in the processing of orthodox black tea, percursors,
such as glycosides of linalool, linalool oxides, benzyl alcohol and other alcohols,
are hydrolysed. During the rolling step, enzymatic reactions continue along with
oxidation. The development of aroma is much more extensive and complicated in
orthodox processing to produce black tea, compared to the aroma development
in CTC processing. The suppression of the reactions just mentioned explains
47

why black tea made by the CTC process results in a poorer quality tea with less
aroma compared to black tea made by orthodox process (Yamanishi, 1995).
1.10. ROLE OF TEA IN HEALTH
The medicinal use of tea was known long before it was being used as a
beverage (Dufresne and Farnworth, 2001). Right from its legendary discovery
(2737 BC) by the emperor Sheng Nung to the universally most enjoyed beverage
it is today, tea has had a significant role in human heath. The Chinese scholars
first reported the medicinal uses of tea in a text written by Pen T’Sao Circa during
24 to 221 AD, and since then effects of tea and its chemical moieties on human
health has become a challenge for scientists.
a) Preventive and curative ability
Tea and other plant foods are dietary sources of nutrients as carotenoids,
tocopherols, ascorbic acid, and non-nutrient phytochemicals generally classified
as flavonoids. According to reports (Steinmetz and potter, 1991; Steinmetz and
potter, 1996) increased intake of plant foods reduces the risk of cancers and
coronary heart disease (Stensvold et al, 1992; Hertog et al, 1993; and Knekt et al
1996), the main causes of human mortality. Tea is a significant source of
flavonoid antioxidants-physiologically active compounds in vitro and in vivo with a
suggested role in prevention of cancer (Dreosti, 1996, Katiyar et al, 1994; Yang
and Wang, 1993; Weisburger, 1996; shim et al, 1995; Xue et al, 1992) and
coronary heart disease (Salah et al, 1995 and Ishikawa et al, 1997).
48

The Chinese value tea for its pleasant flavour and medicinal benefits
some of which have possible scientific basis today are given in Table 1.17
(Blofeld, 1985; and Segal 1996).
b) Bioactivity of flavonoids
The flavonoids and methyl xanthines present in tea are unique bioactive
compounds contributing to the organoleptic profile of the tea beverage and are
being studied to determine their potential role in prevention of chronic diseases
such as cancer and cardiovascular diseases. The physiological activity of tea
flavonoids is in part due to antioxidant function characterized by redox chemistry
and the ability to scavenge reactive oxygen species (ROS). The bioactivity of
flavonoids also appears to be mediated by non-antioxidant mechanisms such as
modulation of signal transduction pathways (Dong et al 1997), proliferation at G1
phase of the cell cycle (khafif et al, 1998) and the immune response (Katiyar and
Mukhtar, 1996). However the mechanisms of tea bioactivity and its role in
human health needs further clarity.
Tea flavonoids are competitive inhibitors of microsomal glucuronidase
(Zhu et al 1998), slow cell proliferation through modulation of AP 1 activation
(Dong et al, 1997) and decrease growth of tumors cell lines at the G1 phase of
the cell cycle (Khafif et al, 1998). These properties of tea flavonoids suggest that
the physiological effects of tea on processes involved with chronic diseases such
as cancer and coronary heart disease involve more than simple antioxidant
mechanisms, which require further research to resolve it.
49

Table 1.17.: Traditional health claims of tea – scientific basis
S.No Traditional Claims Possible scientific basis
1 Improved blood flow Vasodilatation and decrease
platelet activity
2 Elimination of alcohol and toxins Increased activity of phase I and
phase II enzymes
3 Clear urine and improve flow Diuretic effects
4 Relieves joint pain Anti- inflammatory activity
5 Improved resistance to diseases Prevention of cancer and coronary
heart disease.
1.10.1. Antioxidant activity To be regarded as effective in a biological sense, an antioxidant is a
substance that when present at low concentrations relative to an oxidizable
substrate (e.g. Lipid, protein or DNA molecule), can supress, delay or prevent
oxidation of the biological substrate (Halliwell, 1990). Antioxidant potential is
determined by chemical reactivity as an electron or hydrogen donar; the ability to
delocalize and thus stabilize the unpaired electron; the reactivity with other
antioxidants; and the reactivity with molecular oxygen (Rice-Evans et al, 1997).
Black tea has been identified to act as a powerful chemopreventor of reactive
oxygen and nitrogen species (Sarkar and Bhaduri, 2001). Treatment of EGCG to
human skin inhibited ultraviolet radiation induced oxidative stress (Katiyar et al.,
2001).
a) Reactive oxygen species and interaction of biomolecules
Constant oxidative stress / excess production of reactive oxygen species
(ROS) has been linked to the development of chronic diseases such as cancer,
50

cardiovascular diseases, cataracts (Buring and Hennekens, 1997; Block and
Langseth, 1994 and; Marx, 1987) and dementia (Lethem and Orrell, 1997).
Where as fiber, vitamins and minerals have been hypothesized as being
important, but antioxidants are likely candidates. Derived from plant material and
containing numerous biologically active components, tea beverage may also be
proposed as a component of a healthy diet (Segal, 1996; Dreosti, 1996; Katiyar
et al, 1994; Yang and Wang, 1993; Weisburger, 1996). Human cells are
constantly exposed to ROS such as superoxide, hydroxyl and peroxyl radicals
and hydrogen peroxide. These ROS are mostly produced from endogenous
sources, such as electron transport chains, peroxisomes and the cytochrome p-
450 system. Other ROS and free radicals are generated by the immune
response, for example, macrophages or as a result of smoking, air pollution, or
the influence of UV light. Chronic exposure to ROS can damage DNA,
membrane lipids, lipoproteins, and functional and structural proteins (Halliwell,
1997 and; Sohal and Weindruch 1996).
b) Defence mechanism
The human body has evolved antioxidant defence mechanisms to
minimise the potential for radical damage (Halliwell et al, 1995). The extremely
reactive hydroxy radical is particularly harmful with a near diffusion controlled
rate constant of 109 to 1010 M-1 S-1 enabling it to combine with virtually all
molecules in living system (Anbar and Neta 1967). Intracellular antioxidant
enzymes function as a first line of defense to neutralize ROS. The primary
reaction is disputation of superoxide radicals to hydrogen peroxide that is
51

catalysed by catalase and glutathione peroxidase (Sies, 1993). The endogenous
enzymatic defenses against oxidative damage are not completely efficient (Sohal
and Weindruch, 1996 and Jacob and Burri, 1996) and a range of endogenous
and exogenous free radical scavenging antioxidants act as a second line of
defense. Vitamin E, Vitamin C, and the carotenoids are well-recognised
antioxidant nutrients (Sies and Stahl, 1995; Olson, 1993; Frei, 1994), but fruits
and vegetables also contain flavonoids and other phytochemicals that are potent
antioxidants (Namiki, 1990; Okuda, 1993; Namiki et al, 1993; Pratt 1992), and
may contribute to defenses against oxidative damage.
c) Antioxidant moieties of tea
All tea beverages are rich in flavonoids and their derived compounds
particularly catechins, flavonols, theaflavins and thearubigins, which can
scavange ROS and free radicals (Graham, 1992; Salah et al, 1995; Jovanovic et
al, 1995). Flavonoids effectively stabilize free electrons through several
proposed mechanisms, including delocalisation of electrons, formation of
intramolecular hydrogen bonds (Van Acker et al, 1996a) and rearrangement of
their molecular structure (Jovanonic et al, 1995 and Van Acker et al, 1996b).
Free copper and iron, which may catalyze formation of ROS in vivo (Halliwell,
1997) and are used to generate free radicals in some test systems, are chelated
by flavonoids (Miller et al 1996; Morel et al, 1993).
The antioxidant activity of flavonoids may be an important attribute of their
proposed beneficial health properties. Tea beverages are major contributes to
52

the total daily flavonoid intake and elucidation of their antioxidant potential is
therefore of interest. The iron-chelating ability of catechins has been ranked as
epigallocatechin (EGC) > epicatechin gallate (ECG) = epigallocatechin gallate
(EGCG) > epicatechin (EC) (Guo et al, 1996).
1.10.1.1. R.O.S. Scavenging
Tea, in particular its flavonoids consistently demonstrate strong in vitro
scavenging ability against numerous physiologically significant ROS. Black and
green teas demonstrate strong antioxidant capacity against both peroxyl and
hydroxyl radicals in the oxygen radical absorbing capacity (ORAC) assay. This
assay determines the ability of an antioxidant to prevent oxidation of β-
phycoerythrin by ROS relative to Trolox, the water soluble form of vitamin-E. A
cup of black or green tea was over three times more effective than a serving of
most common vegetables (Cao et al, 1996) and teas were over two times more
effective than a serving of most other common fruits (Wang et al, 1986).
a) Scavenging of superoxide radical
Extracts of green and black teas were efficient scavengers of superoxide
and hydrogen peroxide. Epicatechin 3-O-gallate (ECG) and epigallotechin 3-O-
gallate (EGCG), the main catechins in teas, were good scavengers of the
superoxide radical generated by the hypoxanthine -xanthine oxidase system
using electron spin resonance (ESR) spectrometry with 5,5-dimethyl -1-pyrroline
-1-oxide (DMPO) as a spin-trapping agent (Uchida et al, 1987). These data were
53

confirmed by another study showing that EGCG is a highly efficient scavenger of
superoxide radical generated by pulse radiolysis, reacting with a rate constant of
7.2 X IO5 M-1 S-1 (Jovanovic et al, 1995). The reactivity of EGCG was found to
be twice that of either EGC or ECG, possibly due to the presence of two
antioxidant gallate moities in the EGCG molecule. However, EGC and EGCG
were found to have comparable superoxide scavenging reactivities in a
hypoxanthine-xanthine oxidase system (Hatano et al, 1989). EGCG was the
most potent radical scavenging catechin, and the catechins as a group were
more potent than vitamin C and vitamin E (Zhao et al, 1989).
Theaflavins were shown to be even better scavengers of the superoxide
radical than the gallocatechins. In the case of the theaflavins, gallate substitution
appeared to lower the rate of reactivity (Jovanovic et al, 1997).
b) Scavenging of singlet oxygen
Catechin was the most efficient quencher of singlet oxygen when a range
of flavonoids were compared (Tournaire et al, 1993). The rate of quenching by
catechin was almost 4 times greater than that of the flavonol quercetin, which
generally displays a higher free radical scavenging potency (Paganga et al,
1996).
c) Scavenging of hydroxyl radical
The catechins were ranked depending on their ability to protect
mitochondrial membranes from oxidation induced by hydroxyl radicals as ECG >
EGCG > EC > gallic acid (GA) > gallocatechin (GC) > EGC > C (Hong et al,
54

1994). Generation of the DMPO- OH (5, 5-dimethyl-1-pyrroline-1-oxide-hydroxyl)
spin adduct by photolysis of H2O2 was inhibited by catechins with hydroxyl radical
scavenging activity ranked as ECG > EC > EGCG >> EGC (Guo et al, 1996).
d) Scavenging of peroxyl radical
Catechins and quercetin were 5 to 20 times more effective than tocopherol
in protecting phosphatidylcholine liposomes from oxidation by peroxyl radicals
induced in the aqueous phase by 2, 2-azobis (2-amidinopropane) hydrochloride
(AAPH) (Terao et al, 1994).
Theaflavins were more effective than vitamin E in protecting erythrocyte
membrane lipids from oxidation (TBARS -Thiobarbutyric acid reactive
substances, formation) induced by tert-butylhydroxyperoxide (Shiraki et al, 1994).
The theaflavin inhibited lipid peroxidaion by up to 80%, while an equimolar
concentration of vitamin E inhibited formation of TBARS by only 30%. Theaflavin
digallate exhibited the strongest antioxidative activity in this system. In a similar
system using tert-butyl-hydroperoxide induced oxidation of rat liver
homogenates, both theaflavin and thearubigin fractions purified from black tea
infusions inhibited the formation of TBARS more effectively than glutathione,
ascorbic acid (vitamin C), α-tocopherol, and synthetic phenolic antioxidants
(Yoshino et al, 1994), although ECG, EGC and EGCG were more active. The
activity of lyophilized black and green tea was similar.
Catechins are able to effectively inhibit in vitro peroxynitrite-induced
tyrosine nitration (Pannala et al, 1997). Peroxynitrite is a reactive species
55

generated invivo (eg. during inflammatory responses) and has been shown
capable of oxidising LDL to more athrogenic forms (Graham et al, 1993). EGCG,
ECG and GA were the most efficient scavengers of peroxynitrite (Pannala et al,
1997). In a murine macrophage system mimicking inflammation, EGCG reduced
lipopolysaccharide and interferon-γ-induced nitrite production (Chan et al, 1995).
EGCG also effectively scavenged hypochlorite, a product of the enzyme
mycloperoxidase that is formed in response to bacterial infection (Sakagami et al.
1995).
e) Scavenging of stable free radical
Tea flavonoids are effective scavengers of the stable free radical of ABTS
(2, 2' azino bis-[3-ethylbenzthiazoline-6-sulfonic acid] radical cation) in the
aqueous phase (Salah et al, 1995; Miller et al 1996; Rice-Evans et al 1996).
Black tea and green tea beverages both have a potent antioxidant capacity
relative to Trolox (Rice-Evans et al 1996). Antioxidants from the tea are
significantly more potent radical scavengers in this system than the well
recognised antioxidants vitamin E and vitamin C, the carotenes and xanthophylls,
presented in Table 1.18. The epicatechins displayed 2.4 to 4.9 times the
antioxidant activity of Trolox (Miller et al 1996).
In the lypophilic phase, tea flavonoids scavenge the DPPH (1,1-diphenyl-2-
picrylhydrazyl radical) radical more effectively than vitamin E (Table 1.19)
(Hatano et al, 1989; Hong et al 1994; Yoshida et al 1989; Nanjo et al, 1996;
Fourneau et al, 1996). EGCG is the most effective scavenger of the DPPH
radical among other tea flavonoids.
56
In conclusion, theaflavins and catechin gallates are more effective in vitro
scavengers of aqueous and lipophilic stable radicals than many other flavonoids
and the antoxidant vitamins.
f) Protection of low density lipoprotein from oxidation
Results from in vitro studies, using copper, metmyoglobin, or cells as
prooxidants show that tea flavonoids (catechins and theaflavins) effectively
scavange aqueous and lipophilic radicals and protect LDL from oxidation more
effectively than established antioxidants. The gallocatechins were consistently
the most protective flavonoids. Gallate substitution of theaflavin enhanced LDL
protective activity. The inhibition mechanism of the tea flavonoids did not appear
to be dependent on metal ion chelation properties. High LDL in vitro plasma
concentrations of tea are necessary to recover small amounts of bound tea
flavonoids from isolated LDL. The details of prevention of in vitro LDL oxidation
by tea antioxidants are presented in Table 1.20.
1.10.1.2. In vivo antioxidant capacity and protection
Biomarkers of oxidative damage such as oxidized deoxynucleosides [8-
hydroxydeoxyguanosine (8-HDG)], plasma and urinary thiobarbutaric acid
reactive substances (TBARS) or malondialdehyde (MDA) values, micro-nuclei
formation, sister chromatid exchange, F2-iso-prostanes, and LDL oxidation ex
vivo are often employed as surrogates for in vivo antioxidant activity. In
biomarker studies, oxidative stress is often induced by radiation, chemical
oxidants, tobacco smoke, or diet.
57

Table 1.18.: Relative antioxidant potentials of vitamins, tea beverage, flavonoids, carotenes, and xanthophylls (Miller et al., 1996a.)
Trolox equivalent antioxidant Antioxidant Capacity (TEAC, mM)a
Vitamins Vitamin C Vitamin E Tea beverage Green tea (1000 ppm ) Black tea (1000 ppm ) Flavan 3-ols Epocatechin Epigallocatechin Epogallpcatechin gallaateEpicatechin gallate Theaflavins Theaflavin Theaflavin 3-monogallateTheaflavin 3’-monogallate Theaflavin 3-3’-digallate Flavonols Quercetin Kaempferol Rutin Flavones Apigenin Luteolin
1.0 + 0.02 1.0 + 0.03
3.8 ± 0.03 3.5 ± 0.05
2.5 ± 0.02 3.8 ± 0.06
4.8 ± 0.06 4.9 ± 0.02
2.9 ± 0.08 4.7 ± 0.16 4.8 ± 0.19 6.2 ± 0.43
4.7 ± 0.10 1.3 ± 0.08 2.4 ± 0.06
1.5 ± 0.08 2.1 ± 0.05
a TEAC is the millimolar concentration of a Trolox solution having the antioxidant capacity equivalent to a 1.0 mM solution of the substance under investigation.
58

Table 1.19.: Scavenging of stable free radicals by tea antioxidants Stable radical
Ploar/ apolar
Detection Mode Relative scavenging Capacity Reference
Fermy’s Polar salt
ESR EGCG>ECG>EC>EGC>C>GA Gardner et al.1998
Fermy’s salt
Polar ESR Green tea > black tea
Galvinoxy Apolar ESR EGCG>ECG>GA>EC=C>EGC Galvinoxy Apolar ESR Green tea > black tea ABTS •+ Polar abs 734 nm TF-dg > TF-mg > TF Miller et al. 1996 ABTS •+ Polar abs 734 nm ECG>EGCG(Q>EGC>GA>EC(C Salah et al. 1995 DPPH• Apolar ESR
EGCG=ECG>EGC>EC(C>>vitC>vitE) Nanjo et al. 1996
DPPH• Apolar abs 521 nm EGCG≈ECG(GA>EC≈C≈rutin>vit E
Fourneau et al. 1996
DPPH• Apolar abs 517 nm Pouchong tea>green tea>oolong tea>black tea
Yen and Chen 1995
DPPH• Apolar abs 517 nm EGCG>ECG>GC>EC>GA>EGC>vitC>Trolox
Hong et al. 1994
DPPH• Apolar abs 520 nm ECG>EGCG>EGC>GA>EC>C> vitC ≈ vitE Yoshida et al. 1989
DPPH•
Apolar ESR ECG(tet)>ECG(tri)>ECG(di)≈ EGCG>
EGC>EC> vit. C > vit. E
Hatano et al. 1989
DPPH• Apolar ESR ECG>EGCG Uchida et al., 1987
Note: ABTS •+, 2,2′ azinobis-(3-ethylbenzthiazoline-6-sulfonic acid) radical cation; DPPH•, 1,1-diphenyl-2-picrylhydrazyl radical; TF-dg, theaflavin digallate; TF-mg, theaflavin monogalate; TF-theaflavin; EGCG,epigallocatechin gallate; EGC, epigallocatechin; ECG, epicatechin gallate; EC, epicatechin; C, catechin; GA, gallic acid; Q, quercetin.
59

Table 1.20.: Prevention of in vitro LDL oxidation by tea antioxidantsa
Pro-oxidant Detected parameters Relative scavenging capacity Reference
Cu2+ Conjugated dienes TF-dg>EGCG>TF-mg>ECG>TF> Ishikawa et al. 1997 EGC>EC a (lag phase)
Cu2+ Conjugated dienes (lag phase)
EGCG> vit E a Ishikawa et al. 1997
Cu2+ Conjugated dienes (lag phase)
GT(50mg/ml)>BT(50mg/ml)a Van het Hof et al.1997
Cu2+ TBARS EGC and EC inhibitory in initiation phase, accelerative in propagation phase
Yamanaka et al. 1997
Cu2+ Conjugated dienes (lag phase)
GT(vit E > vit C) Luo et al. 1997
Cu2+ TBARS TF-dg >TF-mg >TF Miller et al. 1996 Cu2+ Conjugated dienes
(lag phase) EGCG> ECG >quercetin >chloro-genic acid > resveratrol > rutin> vitE > hesperetin > genistein
Vinson et al. 1995
Cu2+ Conjugated dienes (lag phase)
Sesaminol >Q >EGCG>TF>> BHT >α-tocopherol
Miura et al. 1995
Cu2+ apo B fragmentation EGCG>BHT >α-tocopherol Miura et al. 1995 Cu2+ Conjugated dienes
(lag phase) EGCG>ECG>EC>C>EGC Miura et al. 1994
Cu2+ TBARS ECG>EGCG>EC>C>EGC>BHT Miura et al. 1994 Cu2+ apo B fragmentation EGCG>CG Miura et al. 1994 Cu2+ TBARS Flavanols most effective flavanoids Vinson et al. 1995 Cu2+ TBARS EGCG>EGC>EC>C>BHT>
Vit.C>Vit.E>β-carotene Vinson et al. 1995
Cu2+ TBARS (+)-C complete inhibition at 20μg/ml Mangiapane et al. 1992Peroxynitrile REM ECG>GA>EC≈EGC≈EGCG Pannala et al. 1997 Metmyoglobin
TBARS/REM EGCG=ECG≈EC=C>EGC>GA Salah et al. 1995
Macrophages TBARS GT polyphenols inhibited TBARs formation
Zenhua et al.1991
Macrophages LDL uptake by scavenger receptor
GT polyphenols inhibited LDL uptake by scavenger receptors
Zenhua et al.1991
Macrophages apo B fluorescence/REM
GT polyphenols inhibited apo B fragmentation
Zenhua et al.1991
J774 macrophages*
TBARS Inhibition by (+)-C at 50mg/ml Mangiapane et al. 1992
Source : Ishikawa et al., 1997, and Miller et al., 1996. Note:TF-dg, theaflavin digallate; TF-mg, theaflavin monogallate; TF-theaflavin; EGCG, epigallocatechin gallate; EGC, epigallocatechin; ECG, epicatechin gallate; EC, epicatechin; C, catechin; GA, gallic acid; GT/BT, green/ black tea; Q, quercetin; BHT, butylated hydroxytoluene; TBARS, thiobarbituric acid reactive substances; REM, relative electrophoretic mobility. a Antioxidants preincubated with plasma prior to LDL isolation.
macrophages*: vascular endothelial cells, human monocyte-macrophages
60
(i) Studies on animal models
Tea flavonoids consistently reduced oxidative damage in animals exposed
to radiation, chemical oxidants, or dietary stress. Mice fed with several different
flavonoids were gamma-irradiated to create hydroxyl radical-induced DNA
damage in vivo. Treatment with hydroxylated flavan-3-ols and flavonols
significantly reduced the formation of micronucleated reticulocyctes, a marker of
DNA damage (Shimoi et al, 1994). EGCG provided to mice in drinking water for
one month duration, significantly blocked radiation-induced oxidative damage to
hepatic lipids and improved thirty days survival time after irraditon by 33%
(Uchida et al, 1992). Ex vivo lipid peroxidation determined in rat liver was
reduced following feeding of diets containing 3% (w/w) black or green tea for 50
days (Sano et al, 1995).
(ii) Studies on human
In a four week intervention trial in non-smokers, consumption of green or
black tea (six cups per day) had no effect on plasma levels of malondialdehyde,
LDL (Low Density Lipoprotein) lipid hydroperoxide levels, or plasma levels of
antioxidant vitamins (ascorbic acid, α-tocopherol, or carotenoids), (Van het Hof et
al, 1997). However, green tea consumption did result in a small but significant
increase in the total antioxidant activity of plasma.
Tobacco smoke contains many ROS that can cause oxidative tissue
damage in smokers (Lykkesfeldt, et al, 1997). Tea drinking has been shown to
reduce oxidative biomarkers in chronic smokers, such as increased sister
61

chromatid exchange (SCE) and micronucleation in lymphocytes (Shim et al, 1995
and Xue et al, 1992).
In a case-controlled population study, tea drinking among smokers was
associated with a significantly lower level of smoking- induced micronuclei in
peripheral-blood lymphocytes (Shim et al, 1995). It is evident from the studies
that tea beverage is potentially a good dietary source of non-nutrient
antioxidants, but needs more studies.
Proteins in the diet may theoretically affect the absorption of tea
flavonoids, but the addition of milk to black or green tea does not affect the
concentration of quercetin or catechins in plasma. The ability of flavonoids to
form insoluble complexes with iron reduces the bioavailability of non-heme iron
when tea is combined with a meal.
1.10.2. Tea and cancer
Inhibitory effects have been shown for variety of cancers, including
esophagal, gastrointestinal, lung, skin, and other tumors, with blocking of the
effects of number of chemical and physical carcinogens. The mechanisms of
inhibition are not known, but tea may reduce the metabolism of compounds to
known carcinogens and or enhance their detoxification once formed (Dreosti et
al, 1997). Consumption of tea on a regular basis has been associated with a
reduced risk of cancer in human populations, in parts of Asia. How tea prevents
cancer by studies in animal carcinogenesis models have been reviewed in detail
(Dreosti et al, 1997). Evidences suggested that tea may function in multiple
ways: as a modulator of carcinogen metabolism, as an antioxidant protecting
62

DNA from oxidative damage, and as an antiproliferative agent. Animal studies
pioneer the development of biomarkers, and that the tea has pronounced effect
on these markers, encourages their utility in human studies.
1.10.3. Tea and other bioactivities
a. Modulation of immune function
Tea drinking has been associated with increased cell-mediated immune
function (Zvetkova et al, 2001). Black tea catechin suppresses the expression of
high affinity IgE receptor FC-E RI in human basophillic KU 812 cells (Fujimura et
al, 2001). Increase in both number and activity of Iymphocytes including NK cells
has been reported (Lin et al, 1999). Tea also possesses the property to stimulate
the formation of interleukin 2, which has important immuno-regulatory roles
(Zvetkova et al, 2001).
b. Anti-inflammatory effect
Application of black tea polyphenols resulted in significant inhibition of TPA (12-
O-tetradecanoylphorbol-13-acetate) caused inflammatory responses and
suppression of epidermal ornithine decarboxylase (ODC) and of cyclooxygenase
(COX) enzyme activities (Katiyar and Mukhtar, 1997). Nitric oxide (NO) radical
has a wide biological role in modulating physiological and patho-physiological
processes (Moncada et al, 1992). During infection and inflammation, the
formation of NO is increased, which might promote neoplastic conversion. Tea
polyphenols regulate cyclooxygenase and lipoxygenase dependent metabolism
of arachidonic acid in human colon mucosa and colon tumor tissues (Hong et al,
63

2001). Both EGCG and TF-3 inhibited the induction of NO in thioglycollate-
elicited and lipopoly-saccharide (LPS)-activated peritoneal or RAW2647
macrophages (Lin and Lin, 1997; Chan et al, 1997; Lin et al, 1999b). EGCG
decreased the activity and protein levels of inducible nitric oxide synthase (iNOS)
by reducing the expression of iNOS m RNA and that the reduction could occur as
a result of prevention of binding of the nuclear factor-kB to the iNOS promoter,
thereby inhibiting the induction of iNOS transcription (Lin and Lin, 1997). The
phenolic components EGCG and EGC of tea have also been found to regulate
the production of pro- and anti-inflammatory cytokines by human leucocytes in
vitro (Crouvezier et al, 2001).
c. Germicidal and antiviral activity
Investigation had proved that tea exhibits germicidal and antiviral activity
(Toda et al, 1989). Crude catechins, gallated catechins and TF’s, TFDG, TF
monogallate A and B inhibited the growth of both spore and vegetative cells of C.
botulinum. ECG and EGCG possessed the inhibitory activity against hemolysin
excreted by Vibro cholera, the toxin excreted by Staphylococcus aureus bacteria
and damage to CHO cells included by Cholera toxin (Toda et al, 1990). Tea
polyphenols have been found to retard the infectivity of influenza virus
(Nakayama et al, 1993). Besides this EGCG has been found to exhibit inhibitory
effects on the life cycle of human immunodeficiency virus type1 [HIV-1]
(Yamaguchi et al, 2002). Black tea extract, thearubigin fraction, counteracts and
protects against the adverse effect of tetanus toxin in mice (Satoh et al, 2001).
64
Recent studies indicate that epicatechin gallate in tea may be a valuable
therapeutic agent against H. pylori infection (Yanagawa et al, 2003).
d. Regulation of intestinal microflora
Extracts of black tea, Japanese green tea and Chinese tea are known to
inhibit the growth of various bacteria causing diarrhoeal diseases (Shetty et al,
1994). Tea polyphenols exhibits protection against intestinal disorders as shown
by the influence of tea on propagation of Bifidobacterium and Clostridium (Okubo
et al, 1991). All tea samples tested showed protective activity against diarrohoea
causing bacteria including Staphylococcus aureus, S.epidermidis, Vibrio cholerae
01, V. cholerae non 01, V. Parahaemolyticus, V. mimicus, Campylobacter jejuni
and Plesiomonas shigelloides (Toda et al, 1990).
e. Prevention of dental caries
Tea drinking has been associated with decreased incidence of dental caries
(Rasheed and Haider, 1998; Hamilton-Miller, 2001). Experimental studies on
rats revealed that black tea administration could prevent and reduce caries,
lesions by inhibition of adherence of the pathogenic bacteria on teeth surface and
thus exhibiting antiplaque activity (Touyz and Amsel, 2001). Investigations had
showed that TF, theaflavin digallate, ECG, GCG and EGCG strongly inhibited
water-soluble and insoluble glucan synthesis by glucotransferase enzyme
excreted by plaque causing bacteria (Hattori et al, 1990).
65

f. Antimutagenic activity
(i). Microbial system
Antimutagenic activity of tea polyphenols in microbial systems has been
extensively investigated. EGCG and ECG showed inhibitory effects against the
mutagenicity of MNNG (N-methyl-N’-nitro-N-nitrosoguanidine) in Salmonella
typhimurium TA 98 and TA 100 with and without rat liver S9 mix (Okuda et al,
1984 ). EGCG also had a strong inhibitory effect against the mutagenicity of BaP
diol expoxide in TA 100 strain without S9 mix. Theaflavins, gallate esters and
catechins inhibited mutagenicity of PhIP in Salmonella typhimurium TA 98
(Apostolides et al, 1997). The gallate esters of the catechins EC, ECG and
EGCG, theaflavonoids TF, TFMG and TFDG and glucose (tannic acid) had low
IC50 in the 80-250 µM range against mutagenicity of 10 µM PhIP. Non-
polyphenolic fraction of green tea suppressed 3-amino-1,4-dimethyl-5H-
pyrido[4,3-b]indole (Trp-P-1) or mitomycin C (MMC) induced umu C gene
expression in Salmonella typhimurium TA 1535 / psk 1002 in the presence or
absence of S9 metabolizing enzyme mixture (Okai and Higashi-Okai,1997).
Antimutagenic activity of green and black tea extracts was also observed towards
food mutagen MeIQx in the direct plate assay with Salmonella typhimurium in an
in vitro gastrointestinal model (Krul et al, 2001).
(ii). Mammalian cell systems
Crude tea extracts decreased the mutagenic activity of N-methyl-N’-nitro-N-
nitrosoguanidine in vitro and in intragastric tract of rats (Jain et al, 1989). Black
and green tea imparted protection against 2-amino-3-methylimidazo[4,5-f]
66
quinoline-induced DNA adducts and colonic aberrant crypts in the F344 rat (Xu et
al, 1996). Anticlastogenic effect of black tea and its two active polyphenols
theaflavins and thearubigins was identified towards cyclophosphamide (CP) and
dimethylbenz(a)anthracene (DMBA) in sister chromatid exchanges (SCE) and
chromosomal aberration assay in vivo in Swiss albino mice (Gupta et al, 2001).
Protective effect of green tea has been observed against BaP induced mutations
in the liver of big Blue mice (Jiang et al, 2001). Tea and its polyphenols inhibited
mitomycin induced micronuclei induction in V79 cells (Liu et al, 1998). Green or
black variety of tea, EGCG, and TFG sharply reduced that mutagenicity of 2-
amino-3-methylimidazol [4-5-f] quinoline (IQ) and PhIP, and induced DNA repair
in rat hepatocytes (Weisburger et al, 1996). ECG and EGCG had inhibitory
effects against 6TG-resistant mutations induced by 4NQO in cultured Chinese
hamster V79 cells (Kuroda, 1996).
1.11. PRESENT STUDIES
Tea is one of the most important plantation crops and it is very vital to know
the physico-chemical and biochemical characteristics of tea which will serve as a
quality fingerprint. Tea is grown in a wide range of climate, altitude and soil
conditions. Considering the number of variables, it is very vital to have authentic
scientific information on the tea which may be called as holistic quality fingerprint
of tea. The data on the chemical, physical and biochemical constituents and
variations in them will greatly help in getting a wealth of information (knowledge
base) that can be termed as holistic quality finger print of tea. It was envisaged
67

to have such a fingerprint on Indian teas. The importance of fingerprint of Indian
teas has been realized by both the industry and researchers for quite sometime.
This work reports the results of investigations carried out under this programme.
In this report data on fingerprinting of Indian Teas from different regions
of India are presented which includes important physico-chemical and
biochemical features of teas from different regions of India. Besides the novel
processing approach for utilization, bioactivity evaluation and application of the
active conserve derived from otherwise wasted green tea leaf resource (either as
coarse or pruned tea leaves) is also presented.
68

Objectives
1. To study the bio-chemical moieties in tea and their role in quality and activity.
2. Physico-chemical analysis (fingerprint) and processes for green tea and
separation of catechin enriched radical scavenging conserve from unused green
tea leaves.
3. Analysis for phenolic constituents and volatile flavour compounds (VFC) of tea.
4. Application of the catechin enriched radical scavenging conserve (functional
ingredients) in foods.
Scope
• The changes in climate, altitude, the location, the processing and several other
factors will have significant influences on the quality of tea.
• Use of sophisticated techniques for chemical and biochemical analysis to
determine the changes in flavour profile at molecular levels in order to get data in
defining the intrinsic quality of tea to serve as its fingerprint.
• The composition of bio-chemical constituents responsible for strength, taste,
colour and flavour will be elucidated so as to generate a fingerprint of Indian teas.
• The novel process for green tea, catechin rich conserve and application for
health promotion by incorporating in foods.
69

1.12. Bibliography Ahenhua D., Yuan C., Mei Z., and Yunzhong F., Med. Sci. Res. 19, 767-768 (1991) Aisaka H, Kosuga M, and Yamanishi T, Comparison of the flavors of Chinese. "Keemun" black tea and Ceylon black tea. Agric. Biol. Chem., 42, 2157-2159 (1978) Anan, T., Kato, H., Interaction between polyphenols of tea and amino acids during heating. Nippon Shokuhin Kogyo Gakkaishi, 31, 321-326 (1984). Anan, T., Sakata, K., Yagi, A., and Kato, H., Structure of the precursor of brown compound produced by heating (-)-epicatechin with L-Alanine. Agric. Biol. Chem., 51 (112), 3395-3397 (1987). Anan, T., Changes of chemical compounds during green tea manufacturing. J.A.R.Q., 22, 195 (1988). Anbar, M. and Neta, P. A compilation of specific bimolecular rate constants for the reactions of hydrated electrons, hydrogen atoms and hydroxyl radicals with inorganic and organic compounds in aqueous solution Int. J. Appl. Rad. Isotopes 18: 495-523. (1967) Apostolides, Z., Balentine, D. A., Harbowy, M. E., Hara, Y. and Weisburger, J. H. Inhibition of PhIP mutagenicity by catechins and by theaflavins and gallate esters. Mutat. Res., 389, 167-172 (1997). ASTM. Compilation of Odor and Taste Threshold Value Data, American Society for Testing and Materials, (1978). Bamber. M.K., The Chemistry and Agriculture of Tea, Calcutta , (1893). Banerjee.B. Botanical classification of tea, in, Tea: Cultivation to Consumption (Wilson. K.C. and Clifford. M.N. eds.), Chapman and Hall, London, pp.25-51 (1992). Barua.D.N. Science and Practice of Tea Culture, Tea: Research Association, Jorhat, Calcutta, 509 pp (1989). Baruah S, Hazarika M, Mahanta P.K , Horita H and Murali T, Effect of plucking intervals on the chemical constituents of CTC black teas. Agric. Biol. Chem., 50 (4); 1039-1041 (1986). Baruah S, Hazarika M, Mahanta P.K , Horita H. and Murai T., J.Sci. Food Agric. 45: 317-324 (1988).
70

Bhatia I.S and Deb S.B., Nitrogen metabolism of detached tea shoots. I. Changes in amino acids and amides of tea shoots during withering. J. Sci. Food Agri., 16, 759 (1965). Bhuyan L.P and Mahanta P.K, Studies on fatty acid composition in tea Camellia sinensis. J. Sci. Food Agric.,46, 325-330 (1989). Bhuyan. L.P., Tamuly. P., and Mahanta. P.K. Lipid content and fatty acid composition of tea shoot and manufactured tea. J. Agric. Food Chem., 39(6), 1159-1162 (1991). Bircout. J., Viani. R., Mueggler-Chavan. F., Marion J. P., Reymond. D., and Egli. R.H., Helv. Chim. Acta, 50, 1517, (1967) Biswas A. K.., Sarkar A.R., and Biswas A. K.., Biological and chemical fgactors affecting the valuationof North East Indian plains teas. J.Sci. Food Agric., 24, 1457-1477 (1973). Block, G. and Langseth,L. Antioxidant vitamins and disease prevention Food Technol. 48(7), 80-84 (1994) Blofeld, J. In: Tea and health. The Chinese Art of tea. George Alle and Unwin, London. Pp.154-163 (1985) Blot, W.J., Chow, W.H., and McLaughlin, J.K Tea and cancer: a review of epidemiologic evidence Eur J Cancer Prevention 5, 425-438. (1996) Bockuchava . M.A. and Skobeleva. N.I., Ber. Akad. Wiss. USSR, 112, 896 (1957). Bockuchava. M.A. and Skobeleva. N.I., Role and significance of aldehydes in tannic conversion products in high temperature. Biokhmiia, 22 (6), 1004-1007 (1957). Bokuchava, M.A. and Skobeleva. N.I., in "Food Flavours, part B. The flavour of beverages" (I.D. Morton and A.J. Macleod, eds.), Elsevier Science Publishers, p.49 (1986). Bokuchava. M.A., Biokhim. Chain. Proizv. Akad. Nauk SSSR sb., 2, 23 (1936). Bondarovich.H.A., Gialmarino. A.S., Renner. J.A., Shephard. F.W.,Shingler. A.J., and Gianturco. M.A., Volatiles in tea some aspects of the chemistry of tea. A contribution to the knowledge of the volatile constituents. J. Agric. Food Chem., 15(1), 36-47 (1967).
71

Brandenberger. H. and Mueller. S., J. Chromatograph., 7, 137 (1962). Brown.A.G, Falshaw.C.P, Haslam.E and Ollis.W.D, The constitution of theaflavin. Tetrahedron Lett.,7 (11), 1193-1204 (1966). Brown. A.G., Eyton. W.B., Holmes. A. and Ollis. W.D., The identification of thearuibigins as polymeric proanthocyanidins, Phytochemistry, 8, 2333-2340 (1969). Brown. A.G., Eyton. W.B., Holmes. A., and Ollis. W.D., Nature (London), 221, 242 (1969a). Bryce. T, Collier. P.D, Fowlis. I, Thomas. P.E, Frost. D, and Wilkins. C.K, The structures of the theaflavins of black tea. Tetrahedron Lett., 11 (32) 2789-2792 (1970).
Buring, J.E,. and Hennekens, C.H. Antioxidant vitamins and cardiovascular
disease Nutrit Rev. 55 (1): S53-S60 (1997). Cao G, Sofic E, and Prior R, Antioxidant capacity of tea and common vegetables. J. Agric. Food Chem. 44: 3426-3431 (1996). Casimir, J., Jadot, J. and Renard, M., Seperation and characterization of N-ethyl-gamma- glutamine from Xerocomus badius. Biochem, Biophys. Acta, 39., 462-468 (1960) Cazenave. P., Horman. I., Helv. Chim. Acta, 57, 209 (1974). Cazenave. P., Horman. I., Mueggler-Chvan. F., and Viani. R., Helv. Chim. Acta, 57, 206 (1974). Chamber of Tea association of Shizuoka Prefecture, “Shin Chagyo Zensho,” edited and published by the Chamber of Tea association of Shizuoka Prefecture, p. 501(1988). Chan M, Ho C, and Huang H. Effects of three dietary photochemicals from tea, rose mary, and turmeric on inflammation-induced nitrite production. Cancer Lett. 96 (1): 23-29 (1995). Chan M.M., Fong, D., Ho, C.T. and Huang, H. I. Inhibition of inducible nitric oxide synthetase gene expression and enzyme expression by epigallocatechin gallate a natural product from green tea. Biochem. Pharmacol., 54 (12), 1281-1286, (1997). Chang. S.S. and Gudnason. G.V., Effect of addition of aluminium salts on the quality of black tea. J. Agric. Food Chem., 30 (5), 940-943 (1982).
72
Cloughley. J.B. and Ellis. R.T., The effect of pH modification during fermentation on the quality parameters of certain African black teas J. Sci. Food Agric., 31 (9), 924-934 (1980). Cloughley. J.B., The effect of fermentation temperature on the quality parameters and price evaluation of certain African black tea. J. Sci. Food Agric., 31 (9), 911-919 (1980). Co. H and Sanderson G.W, Biochemistry of tea fermentation: conversion of amino acids to black tea aroma constituents J. Food Sci., 35, 160 -164 (1970). Collier. P.D. and Mallows R., Estimation of theaflavins in tea by gas-liquid chromatography. of their trimethysilyl ethers. J. Chromatogr., 57, 19 (1971). Coxon. D.T, Homles. A, and Ollis. W.D, Theaflavic and epitheaflavic acid. Tetrahedron Lett., 11 (60).5247-5240 (1970). Coxon. D.T, Homles. A, Ollis. W.D. and Vora. V.C, Nutrit Rev. 55(1):S53-S60 p.5239 (1970). Crouvezier, S., Powell, B., Keir, D. and Yaqoob, P., The effects of phenolic components of tea on the production of pro-and anti-inflammatory cytokines by human leukocytes in vitro. Cytokine 13 (5), 280-286 (2001).
Dong, Z., Ma, W., Huang, C., and Yang C.S. Inhibition of tumour promoter-induced AP-1 activation and cell transformation by tea polyphenols, (-)-epigalocatechin gallate and theaflavins. Cancer Research, 1997, 57, 4414-4419 (1997). Dreosti,I.E. Bioactive ingredients: Antioxidants and polyphenols in tea. Nutrition Reviews 54 (11): S51-S58 (1996). Dreosti, I.E., Michael, J. W. and Yang C.S. Inhibition of carcinogenesis by tea : The evidence from experimental studies. Crit. Rev. Food Sci. Nutr., 37(8): 761-770 (1997). Duess. J.J.B., C., 11, 589; Chem. Zent.,37. II, 588 (1916). Dufresne, C.J. and Farnworth , E.R., A review of latest research findings on the health promotion properties of tea. J. Nutr. Biochem., 12 (7), 404-421 (2001). Dzhemukhadze. K.M., Kharebava. L.G., and Starodubtsev. V.P., Prikladnaya Biokhmiya Mikrobiologiya, 9, 113 (1973)
73
Etoh. H, Ina. K, and Iguchi. M, “3S-(+)-3,7-Dimethyl-1,5-octadi-. ene-3,7-diol and Ionone Derivatives from Tea”. Agric.Biol. Chem., 44, 2999-3000 (1980). Fourneau. C. Laurens. A., Hocquemiller. R. and Cave A. Radical scavenging effects of green tea extracts. Phytother.Res.10, 529-530 (1996). Frei, B. Reactive oxygen species and antioxidant vitamins: mechanisms of action Am. J. Med. 97, 5S-13S (1994). Fujimura, Y., Tachibana, H and Yamada, K. A tea catechin suppressess the expression of high affinity IgE receptor FC-εRI in human basophillic KU 812 cells. J. Agri. Food. Chem. 49, 2257-2531, (2001). Gardner. P.T., McPhail. D.B., and Duthie.G.C. Electron spin resonance spectroscopic assessment of the antioxidant potential of teas in aqueous and organic media. J. Sci. Food Agric. 76, 257-262 (1998) Gogiya. V.T and Tkeshelashvili. Ch.F, Prikladnaya Biokhimiyai Mikrobiologiya, 8, 600 (1972). Graham, H.N. The polyphenols of tea: Biochemistry and significance- a review Bulletin de Liason-Groupe Polyphenols 16(2), 32-43 (1992). Graham A, Hogg N, Kalyanaraman B, O’Leary V, Darley-Usmar V And Moncada S. Peroxy nitrite modification of low-density lipo protein leads to recognition by the macrophage scavenger receptor FEBS Lett. 330, 181-185 (1993). Green. M.J., An evaluation of some criteria used in selecting large yielding tea clones J. Sci. Food Agric., 76, 143 (1971). Gulati , A . and Ravindranath ,S. D ., Seasonal variations in quality of Kangra tea (Camellia sinensis (L) O Kuntze) in Himachal Pradesh J. Sci . Fd . Agric. 71 ,2 , 231-236 (1996) Guo Q, Zaho B, Li M, Shen S and Xin W, Studies on protective mechanisms of four components of green tea polyphenols against lipid peroxidation in synaptosomes. Biochim. Biophy. Acta 1304: 210-222 (1996). Gupta, S., Chaudhuri, T., Ganguly, D. K and Giri, A. K. Anticlastogenic effects of black tea (World blend) and its two active polyphenols theaflavins and thearubigins in vivo in Swiss albino mice. Life Sci., 69 (23), 2735-2744 (2001). Guth. H and Grosch. W, Compilation of Odor Thresholds, Odor Qualities. Flavor Fragrance. J., 8, 173-178 (1993).
74

Halliwell B, How to characterize a biological antioxidant Free radical Res. 9, 1-32 (1990). Halliwell.B. and Antonia Murcia, M., Chirico, S., and Aruoma,I. Free radicals and anioxidants in food and in vivo: what they do and how they work Crit. Rev. Food Sci. Nutr. 35, 7-20 (1995).
Halliwell, B. Antioxidants and human disease: a general introduction. Nutrit. Rev.
55 (1) - S44-S52 (1997). Hamilton-Miller, J. M. Anti-carsinogenic properties of tea (Camellia sinensis). J.
Med. Microbiol. 50 (4), 299-302. (2001). Haslam, E., Thoughts on thearubigins. Phytochemistry, 64, 61-73 (2003) Hatanaka A, Kajiwara T, and Sekiya J,Biosynthesis of trans-2-hexanal in chloroplast from thea sinensis. Phytochemistry, 15 (7), 1125-1126 (1976a). Hatanaka A, Kajiwara T, and Sekiya J, Seasonal variations in trans-2-hexenal and linolenic acid in homogenate of thea sinensis leaves. Phytochemistry, 15 (12), 1889-1891 (1976b). Hatanaka. A. and Harada. T., Formation of cis-3-hexanal, trans-2-hexanal and cis-3-hexanol in macerated thea sinensis leaves Phytochemistry, 12 (10), 2341-2346 (1973). Hatano T, Edamatsu R, Hiramatsu M, Mori A, Fujita Y, Yasuhara T, Yoshida T, and Okuda T. Effects of the interaction of tannins with coexisting substances. VI. Effects of tannins and related polyphenols on superoxide anion radical and on 1,1-diphenyl -2- picrylhydrazyl radical. Chem.Pharm. Bull. 37, 2016-2021 (1989). Hattori M., Kusumoto I. T., Namba T., Ishigami T. and Hara Y. Studies on dental caries prevention by traditional medicines. Part XIII. Effect of tea polyphenols on gluco synthesis by glucosyltransferase from Streptococcus mutans. Chem. Pharm. Bull. 38 (3), 717-720 (1990). Hazarika , M . and Mahanta , P.K. Some studies on carotenoids and their degradation in black tea manufacture. J. Sci . Food Agric. ,34, 1391-1396, (1983) Heins. J.T., Maarse. H., M.C.ten Noever de Brauw. and C. Wurman, J. Gas Chromatogr., 4, 395 (1966).
Hagerman, A. E. and Butler, L.G. Choosing appropriate methods and standards
for assaying tannin. J. Chem. Ecol. 15, 1795-1810 (1989).
75

Herath. N.L. and Roberts. G.R., Proc. Sri Lanka Assoc. Advemt. Sci., p 60. (1981). Hertog, M.G.L., Reskens, E.J.M., Hollman, P.C.H., Katan, M.B., and Krombout,D. Dietary antioxidant flavanoids and the risk of coronary heart disease: the Zutphen elderly study The Lancet 342, 1007-1011 (1993). Hilton. P.J., Tea , in “ Encyclopedia of Industrial Chemical Analysis,” Vol.18 ( F.D. Snel and I. S. Ettre, eds.), Wiley, New York, p.455, (1974). Hong, C.Y., Wang, C.P., Lo, Y. C., and Hsu, F.L. Effect of flavon-3-ol tannins purified from Camellia sinensis on lipid peroxidation of rat heart mitochondria. Am. J. Chinese Med. 22,285-292. (1994) Hong, J., Smith, T. J., Ho, C. T., August, D. A. and Yang, C. S. Effects of purified green and black tea polyphenols on cylooxygenase and lipoxygenase dependent metabolism of arachidonic acid in human colon mucosa and colon tumor tissue. Biochem Pharmacol., 62, 1175-1183 (2001) Horita. H. and Owuor. P.O., Bull. NIVOT, I (B), 55 (1987). Howard G.E,. The Volatile Constituents of Tea. Food Chemistry, 4, 79-106 (1978). Ikegaya. K., Nippon Shokuhin Kogyo Gakkaishi, 32, 61 (1985). Ikegaya. K., Iwamoto. M., Uozimi. J., and Nishinari. K., Nippon Shokuhin Kogyo Gakkaishi, 34, 254 (1987). Ikegaya, K. Kawano, S. and Cho. P.K., “Proc.2nd International NIRS Conference,” Japan, Tsukuba, p.358 (1989). Ina. K, Sakato. Y, Isolation and structure elucidation of theaspirone, a component of tea essential oil. Tetrahedron Lett., 9 (23), 2777-2780 (1968).
Ina, K and Eto, H., Agric. Biol. Chem. 35, 962 (1971). Ina, K and Eto,H., Agric. Biol. Chem. 36, 1027 (1972). Ishikawa,T., Suzukawa, M., Ito, T., Yoshid, H., Ayaori, M.,Nishiwaki, M., Yonemura, A., Hara, Y., and Nakamura, H. Effect of tea flavanoid suppplimentation on the susceptibility of low-density lipo-protein to oxidative modification. Am. J. Clin Nutr. 66, 261-266 (1997).
76

Jacob, R.A. and Burri, B. J. Oxidative damage and defense Am. J. clin. Nutr. 63, 985S-990S (1996). Jain, A. K., Shimoi, K., Nakamura, Y., Kada, T., Hara, Y and Tomita, I. Crude tea extracts decrease the mutagenic activity of N-methyl-N’-nitro-N-nitrosoguanidine in vitro and in intragastric tract of rats. Mutat. Res. 210 (1), 1-8. (1989) Jiang, T., Glickman, B. W. and deBoer, J. G. Protective effect of green tea against benzo (a) pyrene-induced mutations in the lever of Big Blue mice. Mutat. Res., 480-481, 147-151. (2001). Jovanovic S.V, Hara Y, Steenken S, and Simic M.G. Antioxidant potential of theoflavins: a pulse radiolysis study. J. Am. Chem. Soc. 119, 5337- 5343(1997). Jovanovic, S., Hara, Y., Steenken, S., and Simic, M., Antioxidant potential of gallocatechins. A pulse radiolysis and laser photolysis study. J. Am. Chem . Soc. 117, 9881-9888 (1995). Jovanovic, S., Steenken, S., Tosic, M., Marjanovic, B., and Simic, M.G. Flavanoids as antioxidants. J. Am. Chem. Soc. 116, 4846-4851(1994).
Katiyar, S.K., Agarwal, R., and Mukhtar, H., Inhibition of spontaneous and photo-enhanced lipid peroxidation in mouse epidermal microsomes by epicatechin derivatives from green tea. Cancer Lett. 79, 61-66 (1994).
Katiyar, S. K. and Mukhtar, H. Tea in chemoprevention of cancer: epidemiological and experimental studies (reviews) Int. J. Oncology 8, 221-238 (1996). Katiyar, S.K and Mukhtar,H. Inhibition of phorbol ester tumor promotes in 12-o-tetradeconyl phorbol-13-acetate – caused inflammatory responses in SENCAR mouse skin by black tea polyphenols. Carcinogenesis, 18, 1911-1916, (1997). Kanasawud , P . and Crouzet , J. C .Mechanism of formation of volatile compounds by thermal degradation of carotenoids in acqueous medium.1..beta.-carotene degradation. J. Agric. Food Chem., 38(1), 237-243 (1990) Katiyar, S. K., Afaq, F., Perez, A. and Mukhtar, H.Green tea polyphenol (-)-epigallocatechin-3-gallate treatmentof human skin inhibits ultraviolet radiation-induced oxidative stress. Carcinogenesis, 22 (2), 287-294 (2001). Kawakami, M. Nippon Nogeikagaku Kaishi, 56, 917 (1982) Kawakami. M., Yamanishi. T., Flavor constituents of longjing tea. Agric. Biol. Chem., 47 (9), 2077-2083 (1983).
77
Kawamura. S., Nogao. A., and Yamazaki. M., Nippon Shokuhin Kogyo Gakkaishi, 23, 870 (1985). Kawashima, K. and Yamanishi, T., Nippon Nogeikagaku Kaishi, 47, 79 (1973) Khafif, A., Chou, T., Schantz, S. P., and Sacks, P.G., Quantitation of chemopreventive synergism between (-)-epigallocatechin-3-gallate and curcumin and in vitro multistage carcinogensis model for oral cancer. Carcinogenesis,19 (3), 419-424 (1998) Knekt,P., Jarvinen, R., Reuanen, A., and Maatela, J. Flavanoid intake and coronary mortality in Finland: a cohort study Br Med J. 312, 478-481(1996). Kobayashi. A, Sato. H, and Yamanishi. T, Agric. Biol. Chem., 29, 488 (1965). Kobayashi.A, Sato.H, Arikawa. R, and Yamanishi. T, Agric. Biol.Chem.,29, 902 (1965) Kobayashi. A., Sato. H., Nakamura. H., Ohsawa. K., and Yamanishi. T., Agric. Biol. Chem., 30, 779 (1966). Kobayashi. A., Kawamura. M., Yamamoto. Y., Shimizu. K., Kubota. K. and Yamanishi, T., Methyl epijasmonate in the essential oil of tea. Agric. Biol.Chem., 52 (9), 2299-2303 (1988). Konishi, S., and Takahashi, E., Plant Cell Physiol., 7, 171 (1966). Konishi, S., in Proceedings of Conference on Isotopes, Japan, p.423 (1969). Kozhin. S.A., Volatile substances from black tea, J. Food Sci.Techno., 4, 175 (1967). Krul, C., Luiten-Schuite, A., Tenfelde, B., Vanommen, B., Verhagen, H and Havenaar, R. Antimutagenic activity of green and black tea extracts studied in a dynamic in vitro gastrointestinal model. Mutat. Res., 474, 71-85. (2001).
Kuhr, S. and Engelhardt, U.H. Determination of flavanols, theogallin, gallic acid
and ceffein in tea using HPLC Z. Lebensm Unters Forsch. 192, 526-529 (1991). Kuroda, Y. Bio-antimutagenic effect activity of green tea catechins in cultured
Chinese hamster V79 cells. Mutat . Res., 361 (2-3), 179-186 (1996). Lamb. J. and Ramaswamy. M.S., J. Sci. Food Agric., 9, 51 (1958). Lea. A.G.H. and Crispin D., J. Chromatogr., 54,133 (1971).
78

Lelyveld, L.J. Van; Smith, B.L; Fraser, C., Visser, G., South African Journal of Plant and Soil, 7, 4, 226-229 (1990) Lelyveld. L.J. Van , and Smith. B.L., S.Afr. J. Plant and Soil, 6, 230 (1989). Lethem, R. and Orrell, M. Antioxidants and dementia Lancet 349: 1189-1190 (1997). Liao, S., Kao, Y.H.., Hippakka, R.A.,Green tea: biochemical and biological benefits for health benefits. Vitam. Horm., 62, 1-94 (2001)
Lin, Y. L., Tsai, S. H., Lin-Shiau, S. Y. Ho, C.T. and Lin, J.K. Theaflavin-3,3’-digallate from black tea blocks the nitric oxide synthase by down-regulating the activation of NF-kappa B in macrophages. Eur. J. Pharmacol.367 (2-3), 379-388, (1999). Lin, Y. L. and Lin, J. K. (-)- epigallocatechin-3-gallate blocks induction of nitric oxide synthase by down-regulating lipopolysaccharide-induced activity of transcription factor nuclear factor-kappa B. Mol. Pharmocol., 52 (3), 465-472. (1997). Lin, W.W., Chang, s. H. and Wang, S.M. Roles of a typical protein kinase in lyso phospatidic acid-induced type II adenyiyl cyclase activation in Raw. Br. J. Pharmacol. 128, 1189-1198 (1999b). Liu, L., Han, C. and Chen, J.. Yan. Jiu., Short term screening of anticarcinogenic ingradeients of tea in cell biology assays. Wei. Sheng 27, 53-56 (1998). Liyanage A.C, de Silva M.J, and Ekanayake A, S.L.J. Tea Sci., 57(2), 46 (1988). Luo M., Kannar K., Wahlqvist M. L., and Brien R.C.O, Free Rad. Res. 25, 285-311(1997). Lykkesfeldt J., Loft S., Melsen J.B.. and Poulsen H.E. Ascorbic acid and dehydroascorbic acid as biomarkers of oxidative stress caused by smoking. Am.J.Clin.Nutr. 65, 959-963 (1997). Mahanta, P.K., Two and a Bud, 35 (1/2), 66-70 (1988). Mahanta, P.K.; Baruah, S. Owuor P.O, and Murai T. Flavour volatiles of Assam CTC black teas manufactured from different plucking standard and orthodox teas manufactured from different altitudes of Darjeeling. J. Sci. Food Agric., 45, 317-324 (1988). Mahanta. P.K., Hazarika. M., and Takeo. T., J. Sci. Food. Agric., 36, 1130 (1985).
79
Mangiapane H., Thomson, A.Salter, Brown S., Bell G.D.and White D., The inhibition of the oxidation of low density lipoprotein by (+)-catechin, a naturally occurring flavanoid. Biochem. Pharmacol. 43 (3) 445-450 (1992). Marx, J.L. Oxygen free radicals link to many disease Res. News January: 529-531 (1987). Matoda S. J. Ferment Technology, 57, 395-399 (1979).
Matsuura, T., and Kakuda, T.,Effects of precursor, Temperature and Illumination on theanine accumulation in tea callus. Agric. Biol. Chem., 54 (9), 2283-2286 (1990). Matsuura, T., Kakuda, T., Kinoshita, T., Takeuchi, N., and Sasakai, K., Biosci. Biotech. Biochem., 56, 1179 (1992). Mick. W, Goetz. E.M, and Schreier. P, Lebensm. Wiss. Technol., 17, 104 (1984). Mick. W. and Schreier. P.,Additional volatiles of black tea aroma J. Agric. Food Chem., 32 (4), 924-929 (1984). Miller N.J, Sampson J, Candeis L.P, Bramley P.M. and Rice-Evans, C.A.Antioxidant activities of carotenoids and xanthophylls. FEBS Lett. 384, 240-242 (1996). Miller, N.J., Castelluccio, C., Tijburg, L and Rice- Evans, C.The antioxidant properties of theaflavins and their gallate ester- radical scavengers or metal chelators? FEBS Lett. 392, 40-44 (1996a). Millin. D.J and Rustidge D.W, Process Biochem., 2, 9 (1967). Millin. D.J, Cripin. D.J, and Swaine, Amadori compounds as nonvolatile flavor precursors in processed foods. J. Agric. Food. Chem., 17 (4), 723-727 (1969). Moncada, S.R., Palmer, M.J. and Higgs, D. A. Nitric oxide: pathophysilogy and pharmacology. Pharmacol., Rev., 43,109-142 (1992). Miura S., Watanabe J., Tomita T.. Sano M., and Tomita I.The inhibitory effects of tea polyphenols (Flavan-3-ol derivatives) on Cu2+ mediated oxidative modification of low density lipoprotein. Biol. Pharm. Bull. 17 (12) 1567-1572 (1994). Miura S.,.Watanabe J, Sano M., Tomita T., Osawa T., Hara Y., and Tomita I.,Effects of various natural antioxidants on the Cu (2+)-mediated oxidative modification of low density lipoprotein. Biol. Pharm. Bull. 18 (1) 1-4 (1995).
80

Morel, I., Lescoat, G., Cogrel., P, Sergent O., pasdeloup, N., Brissot, P., Cilard, P., and Ciliard, J. Antioxidant and iron-chelating activities of the flavanoids catechin, quercetin and diosmetin on iron loaded rat hepetocyte cultures. Biochem. Pharmacol 45, 13-19 (1993). Mueggler-Chavan. F., and Viani. R., Bricout. J., Marion. J.P., Mechtler. H., Reymond. D., and Egli. R.H., Helv. Chim. Acta, 52, 549 (1969). Muggler-Chavan. F, Viani. R, Bricout. J, Marion J.P, and Egli. R.H, Helv. Chim. Acta, 49, 1763 (1966). Nakagawa. M., Torii, H. Tea Res. J., 22, 101 (1964). Nakagawa. M, Bull. Tea Res. Stat. Ministry Agric. Forest., 6, 165 (1970). Nakagawa M, Study of Tea, 48, 77 (1975). Nakabayashi T, Nipon Nogeikagaku Kaishi, 32, 941 Chem. Abstr., 55, 15772 (1958). Nakabayashi. T., Nippon Nogeikagaku Kaishi. J.Agric.Chem.Soc, Jpn., 32, 110 (1958). Nakatani. Y, Sato. S and Yamanishi. T, Agric.Biol.Chem., 33, 967 (1969). Nakayama, M., Suzuki, K., Toda, M., Okubo, S., Hara, Y. and Shimamura, T. Inhibition of the intectivity of influenza virus by tea polyphenols. Antiviral Res. 21, 289-299. (1993). Namiki, M. Antioxidants-antimutagens in food Crit. Rev. Food. Sci. Nutr. 29, 273-300 (1990). Namiki, M., Yamashita, K. and Osawa, T. Food related antioxidants and their activities in vivo. In: active oxygens, Lipid Peroxides and Antioxidants .Boca Raton: CRC Press. 319-332 (1993). Nanjo F, Goto K, Seto R, Suzuki M, Sakai M, and Hara Y. Scavenging effect of tea catechins and their derivatives on 1,1-diphenyl-2-picrylhydrazyl radical. Free Rad. Biol. Med. 21, 895-902 (1996). Natesan. S. and Rangananthan. V., J. Sci. Food Agric., 51, 125 (1990). Neish. A.C., Ann. Rev. Plant Physiol.,11, 55 (1966). Neumann. K and Montag. A, Dtsch. Lebensm. Rundsch., 79, 160 (1983). Newton. J.M., J. Assoc. Official Agric. Chem., 52, 1133 (1969).
81

Nose. M.,Nakatani. Y. and Yamanishi. T., Agric. Biol. Chem., 35, 261(1971). Obanda , M . and Owuor , P .O . Tea, 16 (1),34-40 (1995) Okai, Y and Higashi-Okai, k. Potent suppressing activity of the non-polyphenolic fraction of green tea (Camellia sinensis) against genotoxin-induced umu C gene expression in Salmonella typhimurium (TA 1535/P SK 1002) association with pheophytins a and b. Cancer Lett., 120 (1), 17-123 (1997). Okubo, T., Tode, Y., Hara, T., and Shimanure, T. Antifungal and antimicrobial activities of tea extract and catechins. Jpn. J. Bacteriol., 46, 509-514 (1991). Okuda, T. Natural polyphenols as antioxidants and their potential use in cancer prevention In: Polyphenolic Phenomena. A Scalbert, Ed. Paris: INRA Editions, 221-235 (1993). Okuda, T., Mori, K. and Hayatsu, H. Inhibitory effect of tannins on direct-acting mutagens.Chem. Pharma. Bull., 32 (9), 3755-3758 (1984). Olson, J.A. Vitamin A and carotenoids as antioxidants in a physiological context J. Nutr. Sci. Vitaminol.39, S57-S65 (1993). Owuor P.O. and Obanda M. Changes in black tea quality due to variations of plucking standard and fermentation time, Food Chem. 61(4) 435-441 (1998). Owuor. P.O, A comparison of gas chromatographic volatile profiling methods for assessing the flavour quality of Kenyan black teas, J. Sci. Food Agric., 59, 189-197 (1992). Owuor P.O , Tsushida T, Horita H, and Murai T,. Tea, 7, 71-78 (1986).
Owuor. P.O, Reeves. S.G., and Wanyoko. J.K., Correlation of theaflavins content and valuation of Kenyan black teas.J.Sci. Food Agric., 37, 507-513 (1986a). Owuor , P. O ., Obanda, A.M., Tsushida, T., Horita, H. and Murai, T. Geographical variation of theaflavins, thearubigins and caffeine in Kenyan clonal black teas. Food Chem ., 26, 223-230 (1987). Owuor P.O., Takeo, T. and Horita, H., Differentiation of clonal tea by terpene index. J. Sci. Food Agric. 40, 341-345 (1987a). Owuor P.O., Othieno C.O., Horita, H., Tsushida, T., Murai, T.,Effects of nitrogenous fertilizers on the chemical composition of CTC black tea. Agric. Biol. Chem. 51 (10), 2665-2670 (1987b).
82
Owuor. P.O., Plucking standard effects and the distribution of fatty acids in tea (Camillia sinensis (L.)) leaves. Food Chem., 37 (1), 27-35 (1990). Ozawa, M., Sato, S. Inatani, H., Suyama, Y, and Inuki, F. Neiji Daigaku Nogakubu Kenkyu Hokoku, 24, 31 (1969). Paganga G, Al-Hashim H, Khodr H, scott B.C, Aruoma O. I, Hider R.C, Halliwell B, and Rice-Evans C.A, Mechanism of antioxidant activities of quercetin and catechin. Redox Report. 2, 359-364 (1996). Pannala A, Rice-Evans C.A, Halliwell B, and Surinder S, Inhibition of peroxy nitrite mediated tyrosine nitration by catechin polyphenols. Biochem. Biophys. Res. Commun. 232,164-168 (1997). Potter. J.D. and Steinmetz. K.A. Stewart. B.W., McGregor,D., and Kleinhaus, P., Vegitables, fruit, and cancer prevention: a review In: Principles of Chemoprevention., Eds., IARC Lyon, pp. 61-90 (1996). Pratt, D. E. Phenolic Compouns in Food and Their Effects on Health II : Antioxidants and Cancer Prevention.Washington,D.C.: American Chemical Society, 54-71 (1992) Pura Naik. J. and Nagalakshmi. S., Determination of caffeine in tea products by an improved HPLC method. J. Agric. Food Chem., 45 (10), 3973-3975 (1997). Rasheed, A. and Haider M. Antibacterial activity of Camellia sinensis extracts against dental caries. Arch. Pharm. Res., 21 (3), 348-352 (1998). Reynold. W., Naef-Muller. R.S., Keller. U., Willhalm. B., and Ohloff. G., Helv. Chim. Acta, 57, 1301 (1974). Rice-Evans C.A, Sampson J, Bramley P.M and Holloway D.E, Why do we expect carotenoids to be antioxidants in in vivo? Free Radical Res.26, 381-391 (1997). Rice-Evans, C. A., Miller, N.J.,and Paganga, G. Structure - antioxidant activity relationships of flavanoids and phenolic acids. Free Rad.Biol. Med. 20, 933-956 (1996). Roberts E.A.H, The phenolic substances of manufactured tea. J. Sci. Food Agric., 9, 212-216 (1950). Roberts. E.A.H., The chemistry of tea manufacture. J. Food Sci. Agric. 9, 381-390 (1958).
Roberts. E.A.H. and Smith R.F, Analyst, 86, 94 (1961).
83
Roberts. E.A.H, in The Chemistry of Flavanoid Substances (T.A.Geissman,ed.), Pergamon, Oxford, p.468 (1962). Roberts. E.A.H and Smith. R.F, The phenolics of manufactured teas – spectrophotometric evaluation of tea liquors. J.Food Sci. Agric. 14, 687-700 (1963). Roberts G.R., and Sanderson G.W., J. Sci. Food Agric., 17, 182 (1966) Robertson. A. and.Bendall. D.S, Phytochemistry, 22, 883 (1983). Saijo. R. and Kuwavara. Y., Agric.Biol.Chem., 31, 389 (1967). Saijo R and Takeo T, Agric. Biol. Chem., 34, 227 (1970). Saijo R and Takeo T, Plant Cell Physiol., 13, 991 (1972). Saijo. R., Bull. Natl. Res.Inst. Tea, 48, 171 (1973). Sakagami H, Sakagami T, Yoshida H, Omata T, Shiota F, Takahashi H, Takedda Y.M. Hypochlotite scavenging activity of polyphenols. Anticancer Res. 15, 917-921 (1995). Sakata. K., Yamauchi. H., Yagi.A., Ina.K., Prakanyi. L, and Clardy. J., Agric.Biol. Chem.53, 2975 (1989). Sakato, Y. Nippon Nogei Kagaku Kaishi, 23, 262 (1950).
Sakato, Y., Hashizume, T and Kishimoto, Y. Nippon Nogei Kagaku Kaishi, 23, 269 (1950). Sakato. Y., Igar. I., and Matsumura. T., Nippon Nogei Kagaku Nogei Kaishi, 29, 769; Chem. Abstr., 52, 9475 (1955). Sakato, Y. in “Proceedings of Symposium on Phytochemistry,” Kuala Lampur, p. 168 (1957). Salah,N., Miller, N., Paganga, G., Tijburg, L., Bolwell, G.P., and Rice-Evans, C. Polyphenolic flavanoids as scavengers of aqueous phase radicals and as chain breaking antioxidants. Arch Biochem Biophy. 322, 339-346 (1995). Sanderson. G.W. and Selvendran. R.R., J. Sci. Food Agric., 16, 251 (1965). Sanderson G.W, Co H and Gonzelez J.G, J.Food Sci., 36, 231 (1971).
84

Sanderson G.W, in “Structural and Functional Aspects of Phytochemistry” (V.C. Runeckles, ed.), Academic press, New York, P. 247(1972a). Sanderson. G.W, Berkowitz. J.E and Co. H, J.Food Sci., 371, 399 (1972b). Sanderson G.W and Graham H.N, Formation of black tea aroma. J.Agric. Food Chem., 21 (4), 576-585 (1973). Sanderson G.W, Ranadive A. S, Eisenburg L.S, Farrell F.J, Simons R, Manley C.H, and Coggon P, “ Phenolic Compounds in Taste of Tea,” American Chemical Society, Washington, DC, p.14 (1976). Sano, M., Takahashi, Y., Yoshino, K., Shimoi, K., Nakamura Y., Tomita I., Oguni I., and Konomoto. H. Effect of tea (Camellia sinensis L.) on lipid peroxidation in rat liver and kidney: a comparison of green and black tea feeding. Biol. Pharm. Bull. 18, 1006-1008 (1995). Sarkar, A. and Bhaduri, A., Black tea is a powerful chemopreventor of reactive oxygen and nitrogen species: comparison with its individual catechin constituents and green tea Biochem. Biophys. Res. Commun., 284 (1), 173-178 (2001). Sasaoka, K. and Kito, M., Agric. Biol. Chem., 28, 213, (1964). Sato. S., Sasakura. S., Kobayashi. A., Nakatani. Y. and Yamanishi. T., Agric.Biol.Chem., 34,1355 (1970). Satoh, E., Ishi, T., Shimizu, Y., Sawamura, S and Nishimura, M. Black tea extract, thearubigin fraction, counteracts the effect of tetanus toxin in mice. Exp.Biol.Med. ( May wood)., 226, 577-580 (2001). Schmidt G, Full G, Winterhalter P, and Schreier P, Synthesis and enantiodifferentiation of isomeric theaspiranes. J. Agric. Food Chem., 40 (7), 1188-1191 (1992). Sealy.J.R A Revision of the Genus Camellia, Royal Horticultural Society, London, 1958. Segal. M. Tea: a Story of Serendipity. FDA Consumer. 30 (2), 22-26 (1996). Sekiya, J., Kajiwara, T., Monma, T., and Hatanaka, T., Interaction of tea catechins with proteins: formation of protein precipitate. Agric. Chem., 48 (8), 1963-1967 (1984). Self. R, Casey. J.C., and Swain. T, Chem. Ind. (London), 863 (1963). Selvendran. R.R., Reynolds. J., and Galliard. T., Phytochemistry, 17, 233 (1978).
85
Selvendran. R.R. and Perera. B.P.M., Chem. Ind. (London), p.577(1971). Shetty, M., Subbannaya, K. and Shivananda, P.G. Antibacterial activity of tea (Camellia sinensis) and coffee (Coffee arabica) with special reference to Salmonella typhimurium. J. Commun. Dis., 26, 147-150. (1994). Shim J.S., Kang M.H, Kin Y. H., Roh. J. K., Roberts. C. and Lee I.P., Chemoprevetive effect of green tea (Camellia sinensis) among cigarette smokers. Cancer Epidem.Biomarkers Prev. 4, 387-391 (1995). Shimoi, K., Masuda S., Furugori M., Esaki S. and Kinae N. Radio protective effect of antioxidant flavanoids in γ-ray-irradiated mice , Carcinogenesis 15, 2669-2672 (1994). Shiraki M, Hara Y. Osawa T, Kumon H, Nakayama T, and Kawakishi S. Antioxidative and antimutagenic effects of theaflavins from black tea. Mutant. Res. 323, 29-34 (1994). Sies, H. Strategies of antioxidant defense Eur. J. Biochem.215, 213-219 (1993). Sies, H. and Stahl, W. Vitamins E and C, beta-carotene and other carotenoids as antioxidants Am. J. clin. Nutr. 62 (6), 1315S-21S (1995). Singer. R., Armstrong. W.D., and Vatassery. G.T., Econ. Bot., 21, 285 (1967). Skobeleva N.I., Bezzubov. A.A., Petrova. T.A., and Bockuchava. M.A., Appl. Biochem. Microbiol., 15, 682 (1979).
Sohal, R.S., and Weindruch, R. Oxidative stress, caloric restriction, and aging.
Science 273 (5271), 59-63 (1996). Steinhaus, B. and Engelhardt, U.H., Theaflavins in black tea: comparition of the
flavognost and HPLC analysis-preliminary results. Z. Lensm. Unters Forsch. 188: 509-511. Steinmetz. K. and Potter. J.D. A review of vegetables, fruit and cancer I.Epidemiology. Cancer Causes Control 2, 325-357(1991). Steinmetz. K. and Potter. J.D. Vegetables, fruits, and cancer prevention: a review J. Am Diet Assoc. 96, 1027-1039 (1996). Stensvold,I., Tverdal, A., Solvoll, K., and Foss, O.P. Tea consumption. Relationship to cholesterol, blood pressure, and coronary and total mortality. Prev Med. 21: 546-553 (1992).
86

Takei. S., Sakato. Y., and Ohno. M., Bull. Inst. Phys. Chem. Res. (Riken Iho), 13, 116 (1934). Takei. S., Sakato. Y., and Ohno. M., Bull.Inst. Phys. Chem. Res. (Riken Iho), 14, 1262 (1935). Takei. S., Sakato. Y., and Ohno. M., Bull.Inst. Phys. Chem. Res. (Riken Iho), 15, 626 (1936). Takei. S., Sakato. Y., and Ohno. M., Bull.Inst. Phys. Chem. Res. (Riken Iho), 16, 773 (1937). Takei. S., Sakato. Y., and Ohno. M., Bull.Inst. Phys. Chem. Res. (Riken Iho), 17, 781 (1938). Takeo, T., L-Alanine as a precursor of ethylamine in Camellia sinensis. Phytochemistry, 13, 1401-1406 (1974). Takeo. T., Characteristics of the aroma constitution found in native china black tea. Agric. Biol. Chem., 47 (6), 1377-1379 (1983). Takeo, T. and Mahanta , P.K., Comparison of Black Tea Aromas J. Sci. Food Agric., 34, 307-310 (1983a). Takino, V., Ferrti. A, Flanagam. B, Gianturco. M, and Vogel. M, The structure of theaflavin, A polyphenol of black tea. Tetrahedron Lett., 6(45) 4019-4025 (1965). Taylor. J.J. and McDowell. I. J., Rapid classification by HPLC of plant pigments in fresh tea (Camellia sinensis L) leaf. J. Sci. Food Agric.57, 287-291 (1991). Terao J, Piskula M, and Yao Q. Protective effect of epicatechin, epicatechin gallate and quercetin on lipid peroxidation in phospholipid bilayers. Arch. Biochem. Biophys. 308, 278-284 (1994). Thanaraj S.N.S. and Sheshadri R., Influence of polyphenol oxidase activity and polyphenol content of tea shoot on quality of black tea J. Sci. Fd. Agric., 51 (1) 57- 69 (1990). Theshelashvili. C. K. and Gogiya. V.T, Prikl. Biochim Microbiol., 8, 965 (1972). Tirimanna. A.S.L., and Wikremasighe. R.L., Tea Q., 36, 115 (1965). Toda, M., Okubo, S., Ohnishi, R. And Shimamura, T. Antibacterial and bactericidal activities of Japanese green tea. Nippon Saikingaku Zasshi,. 44 (4), 669-672. (1989).
87

Toda, M., Okubo, S., Ikigai, H and Shimamura, T. Antibacterial and antihemolysin activities o tea catechins and their structural relatives Nippon Saikingaku Zasshi,.45 (2), 561-566.( 1990). Togari , N . Koyabashi , A ., Ashima , T. , Food Res . Intl . 28 (5) 485-493 (1995). Tournaire C, Croux, S., Maurette, M., Beck, I., Hocquaux, M., Braun, A.M., and Oliveros E. Antioxidant activity of flavonoids: efficiency of singlet oxygen (1∆g) quenching. J. Photochem. Photobiol. B: Biol.19: 205-215 (1993). Touyz, L.Z. and Amsel, R. Anticarsiogenic effects of black tea ( Camellia sinensis) in caries prone-rats. Quintessence Int., 32 (8), 647-650 (2001). Tsujimura. M, Sci. Pep. I.P.C.R., 10, 253 (1929); 14, 63, (1930); 15,155, (1931); 24,149, (1934); 26, 186 (1935). Tsujimura.M, Nipon Nogeikagaku Kaishi, 10, 140(1934a); 29, 407 (1955). Tsujimura. M, Sci. Pep. I.P.C.R., 46, 31 (1952). Uchida S, Edamastu R, Hiramatsu M, Mori A, Nonaka G, Nishioka I, Niwa M., and Ozaki M. Condensed tannins scavenge active oxygen free radicals. Med. Sci. Res. 15: 831-832 (1987). Uchida S., Ozaki M., Suzuki K., and Shikita M. Radio protective effects of (-)-epigallocatechin 3-o-gallate (green-tea tannin) in mice. Life Sci. 50: 147-152 (1992). Ullah, M. R., Lowering of enzyme activity of tea leaf on storage and its effects on quality of made teas. Two and a bud, 32, 53-56 (1985) Van Acker, S.A. B. E., van den Berg, D.J., Tromp, M.N.M. J. L., Griffioen, D. H. J., van Bennekom, W. P., vander Jijgh, W.J. F., and Bast, A. Structural aspects of antioxidant activity of flavonoids. Free Rad. Biol. Med. 20, 331-342 (1996a). Van Acker , S.A. B. E., de Groot. M. J., van den Berg, D-J., Tromp, M. N. J. L., Donne-Op de Kelder, G., van der Vijgh, W.J. F., and Bast, A. A quantum chemical explaination of the antioxidant activity of flavonoids. Chem. Res. Toxicol. 9, 1305-1312 (1996 b). Van het. Hof, K., de Boer. H.S.M., Wiseman. S.A., Lien. N., Westrate. J.A., and Tijburg. L.B.M. Consumption of green or black tea does not increase the resistance of low density lipoprotein to oxidation in humans. Am. J. Clin. Nutr. 66, 1125-1132 (1997)
88
Van Romburgh. P., C., I, 83 (1920); Proc. Acad. Sci. Amsterdam, 22, 758 (1920). Venkatakrishna S, Premachandra B.R, and Cama H.R, Agric. Biol. Chem.,40, 2367 (1976) Venkatakrishna S, Premachandra B.R, and Cama H.R, Tea Q., 47, 28 (1977). Vinson J.A., Jang J., Dabbagh Y.A., Serry M.M. and Cai S.Plant polyphenols exhibit lipoprotein-bound antioxidant activity using an in vitro oxidation model for heart disease. J.Agric.Food Chem. 43 (11) 2798-2799 (1995). Vinson J.A., Jang J.,Dabbagh Y.A, Serry M.M., Jang J.,Plant flavanoids, especially tea flavanols. Are power ful antioxidants using an in vitro oxidation model for heart diseases. J.Agric.Food Chem. 43 (11), 2800-2802 (1995). Visser.T and Kehl.F.H. Tea Q., 29, 76 (1958). Vitzthum. O.G., Werkhoff. P., and Hubert. P., New volatile constituents of black tea aroma. J. Agric. Food Chem., 23 (5), 999-1003 (1975). Vuataz. L., Brandenberger. H., and Egli. R.H., J.Chromatogra.,2, 173 (1959). Wang H, Cao G, and Prior R.L. Total antioxidant capacity of fruits. J.Agric.Food Chem.44:701-705 (1986). Weerasinghe. D.K., Fernando. R.S.S, and Chandradasa. P.B., Tea Q., 51, 175 (1982). Weisburger, J.H. Tea and health: The underlying mechanisms. Proc. Soc. Exp. Biol. Med., 220 (4), 271-275 (1999). Weisburger, J.H. Tea antioxidants and health, Handbook of Antioxidants 15, 469-485(1996). Weisburger, J.H., Hara, Y., Dolan, L., Luo, F. Q., Pittman, B and Zang, E. Tea polyphenols as inhibitors of mutagenicity of major classes of carcinogens. Mutat. Res., 371, 57-63. (1996).
Wickremasinghe, R.L., and Perera, K.P.W.C., Tea Q., 43, 175 (1952).
Wickremasinghe. R.L. and Perera. K.P.W.C, Tea Q., 37, 131 (1966). Wickremasinghe. R.L and Swain. T, J.Sci. Food Agric., 16, 57 (1965). Wickremasinghe. R.L., “Facets of Tea research in practice”, Tea Research Institute of Sri Lanka, Talawakelle, (1978).
89

Wickremasinghe. R.L., Wick. E.L., and Yamanishi. T., Gas chromatographic-mass spectrometric analyses of “flavory” and “non-flavory” Ceylon black tea aroma concentrates prepared by two different methods. J. Chromatogr., 79, 75-80 (1973). Wickremasinghe. R.L., The mechanism of operation of climatic factors in the bio-. genesis of tea flavours. Phytochemistry, 13, 2057-2063 (1974). Wight. N and Barua. P.K. Nature (London), 173, 630 (1954). Winton. A. L and Winton. K. B., in “The structure and Composition of Foods,” Vol.2, Wiley, New York, (1935). Wright. J.A. and Fishwick. M., Lipid degradation during manufacture of black tea. Phytochemistry, 18, 1511-1513 (1979). Xue K., Wang S., Ma G., Zhou P., Wu P., Xu Z., Chen W.and Wang Y. Micronucleus formation in peripheral-blood lymphosited from smokers and the influence of alcohol-and tea-drinking habits Int. J. Cancer 50, 702-705(1992). Xu, M., Bailey, A. C., Hernaez, J.F., Taoka, C.R., Schut, H.A. and Dashwood, R. H. Protection by green tea, black tea, and indole-3-carbinol against 2-amino-3-methylimidazol[4,5-f]quinoline-induced DNA adducts and colonic aberrant crypts in the F344 rat. Carcinogenesis, 17 (7), 1429-1434. (1996). Yamaguchi. K. and Shibamoto. T.,Volatile constituents of green tea Gyokuro (camellia sinensis L. var yabukita) J. Agric. Food Chem., 29 (2), 366-370 (1981). Yamaguchi. K., Honda, M., Ikigai, H., Hara, Y and Shimamura, T. Inhibitory effects of (-)- epigallocatechin gallate on the life cycle of human immunodeficiency virus type 1 (HIV-1). Antiviral Res., 53, 19-34 (2002). Yamamoto. R. and Itoh. K., Nippon Nogeikagaku Kaishi, 13, 736 (1937). Yamamoto. R., Itoh. K. and Chin. H., Nippon Nogeikagaku Kaishi, 16,781 (1940). Yamamoto. R., Itoh. K. and Chin. H., Nippon Nogeikagaku Kaishi, 16, 791 (1940a). Yamamoto. R., Itoh. K. and Chin. H., Nippon Nogeikagaku Kaishi, 16, 800 (1940b). Yamamoto. R. and Kato. Y., Nippon Nogeikagaku Kaishi, 10, 661 (1934).
90

Yamamoto. R. and Kato. Y., Nippon Nogeikagaku Kaishi, 11, 639 (1935). Yamamoto. R. and Kato. Y., Sci. Pap. Inst. Phys. Chem. Res. (Tokyo), 21, 122 (1935a). Yamanaka N., Oda O., and Nagao S. Green tea catechins such as (-)-epicathechin and (-)-epigallocathechin accelerate Cu2+ induced low density lipoprotein oxidation in propagation phase. FEBS Lett. 401 (2-3), 230- 234 (1997). Yamanishi. T, Takagaki. T, Kiribuchi. H. and Tsujimura. M, Agric.Biol. Chem., 21, 261 (1957).
Yamanishi.T, Kiribuchi. T, Sakai. M, Fujita. N, Ikeda. Y and Sasa. K, Agric.Biol. Chem., 27, 193 (1963). Yamanishi. T, Sato. H, and Ohmura. A, Agric. Biol. Chem., 28, 653 (1964). Yamanishi. T, Kobayashi. A, Sato H, Ohmura. A, and Nakamura. H, Agric. Biol. Chem., 29, 1016 (1965). Yamanishi. T, Kobayashi. A, Sato. H, Nakamura. H, Osawa. K, Uchida. A, Mori. S, and Saijo. R, Agric. Biol. Chem., 30, 784 (1966). Yamanishi T, Kobayashi A, Nakamura H, Uchida A, Mori S, Ohsama K and Sasakura S,. Agric.Biol. Chem., 32, 379-386 (1968). Yamanishi. T, Wickremasinghe. R.L and Perera. K.P.W.C, Tea Q., 39, 81 (1968a). Yamanishi. T, Nose. M, and Nakatani.Y, Agric.Biol. Chem., 34, 599 (1970). Yamanishi. T., Kita. Y., Watanabe. K. and Nakatani. Y., Agric.Biol.Chem., 36, 1153 (1972). Yamanishi. T., Shimojo. S., Ukita. M., Kawashima. K., and Nakatani. Y., Agric. Biol. Chem., 37, 2147 (1973) Yamanishi. T, Kawwatsu. M, Tokoyoma. T and Nakatani Y., Agric.Biol. Chem., 37, 1075 (1973). Yamanishi T, Botheju W.S, De Silva J.M, J. Tea. Sci., 58, 40-49 (1989). Yamanishi T, Kawakami M, Kobayashi A, Hamada T and Musalam Y, in “Thermal Generation of Aromas ” American Chemical Society, Washington, DC, p.310 (1989a).
91

Yamanishi, T., Special issue on tea, Food Rev. Int. 11(3), 477-525 (1995). Yanagawa, Y., Yamomoto, Y., Hara, Y., and Shimamura, T. A combination effect of epigallocatechin gallate, a major compound of green tea catechins, with antibiotics on Helicobacter pylori growth in vitro. Curr. Microbiol., 47 (3), 244-249. (2003). Yang, C.S. and Wang, Z.Y. Tea and cancer J Natl Cancer Inst. 85, 1038-1049 (1993).
Yen G and Chen H, Antioxidant activity of various tea extracts in relation to their
antimutagencity. J. Agric. Food Chem. 43, 27-32 (1995). Yoshida T, Mori K, Hatano T, Okomura T, Uchara I, Komagoe K, Fujita Y, and Okuda T. Studies on inhibition mechanism of autooxidation by tannins and flavanoids.V. Radical scavenging effects of tannins and related polyphenols on 1,1-diphenyl-2-picrylhydrazyl radical Chem. Pharm.Bull. 37, 1919-1921(1989). Yoshino K, Hara, Y., Sano, M, and Tomita, I., Antioxidative effects of black tea theaflavins and thearubingins on lipid peroxidation of rat liver homogenates induced by tert-butyl hydroperoxide. Biol. Pharm. Bull. 17, 146 – 149 (1994). Zhao B, Li X, He R, Cheng S and Wenjuan X, Scavenging effect of extracts of green tea and natural antioxidants on active oxygen radicals. Cell Biophys. 14, 175-185 (1989). Zaprometov. M.N., Isolation of quinic and shikimic acids from the shoots of the tea plant. Biokhimiia, 26, 331- 340 (1961). Zenhua, D., Yuan, C., Mei, Z. and Yunzhong, F. Inhibitory effect of China green tea polyphenol on the oxidative modification of low density lipo-protein by macrophages. Med. Sci. Res. 19, 767-68 (1991). Zhang. D., Susane. K., and Engelhardt. U.H., Lebensm. Z, Unters. Forsch.., 195, 108 (1992).
Zhu, B.T., Taneja, N., Loder, D.P., Balentine, D.A., and Conney, A.H. Effects of tea polyphenol and flavonoids on liver microsomal glucuronidation of estradiol and estrone. J. Steroid. Biochem. Mol. Biol. 64, 207-215(1998). Zvetkova, E., Wirleitner, B., Tram, N.T., Schennachm, H. and Fuchs, D. Aqueous extracts of crinum latifolium (L) and Camellia sinenesis show immunomodulatory properties in human peripheral blood mononuclear cells. Int. Immunopharmocol., 1 (12), 2143-2150, (2001).
92

CHAPTER 2
PROFILING OF INDIAN BLACK TEAS
2.1. BACKGROUND
Tea is one of the most important plantation crops and it is very vital to
know the physico-chemical and biochemical characteristics of tea which will
serve as a fingerprint. Tea is grown in a wide range of climate, altitude and
soil conditions. Considering the number of variables, it is very vital to have
authentic scientific information on the tea aptly called as fingerprinting of tea.
The data on the chemical, physical and biochemical constituents and
variations in them will greatly help in getting a wealth of information
(knowledge) that can be termed as finger print of tea. It was proposed to have
such a fingerprinting on Indian black teas. The importance of fingerprinting of
Indian black teas was realized and work was carried out in this direction. This
chapter describes the results of investigations carried out under this area.
India is a leading tea producer, consumer and exporter with 928 million
Kgs production during 2005. The world productin of Crush - Tear - Curl (CTC)
tea was 1194 million Kgs, and orthodox tea production was 839 million Kgs
during 1999 (Ramadurai, 2000). Black tea, manufactured from young tender
shoots of Camellia sinensis (L.) O. Kuntze is the most widely enjoyed non-
alcoholic drink and its flavour quality and taste has been shown to change
with variations in geographical (Yamanishi et al., 1968; Takeo and Mahanta,
1983) and climatic (Cloughley et al 1982; Howard 1978) conditions.
Yamanishi et al. (1968) compared flavour of teas from different parts of the
world, while Cloughley et al (1982) compared flavour of teas in different
season in Malawi, Africa. Indian teas, especially from Darjeeling, Assam and
93
Nilgiris (Trinitea) are valued for their characteristic aroma and taste. These
teas are much sought after and are relished by the beverage consumers
throughout the world (Bala Subramaniam, 1995). Number of reports are
available about antioxidant, anticancer properties and health benefits of tea
(Wiseman, et al, 1997; Dreosti, et al, 1997; Yang and Wang, 1993; Tijburg, et
al, 1997; Yang, et al, 1998).
The important chemical constituents which influence the taste and
flavour in tea brew are polyphenols, caffeine, sugars, organic acids, volatile
flavour compounds and amino acids. Phenolic compounds of tea such as
theaflavins and thearubigins are very important from intrinsic quality point of
view. These are responsible for the colour, flavour and brightness of tea.
Caffeine is responsible for the briskness. The physico-chemical parameters
such as TSS and viscosity of the brew and bulk density (packed/loose) of the
tea are important quality indicators. The volatile flavour compounds of tea
and their variation in composition due to geographical and other process
variables is of paramount importance from the quality point of view. Though
considerable work has been done (Gulati, et al, 1999; Gulati and
Ravindranath, 1996 and Ullah, 1985) on the quality aspects of tea a
comparative study covering Indian regions has not been done so far. Keeping
in view the complexity of the intrinsic tea quality a study has been carried out
to fingerprint the Indian black teas obtained from different regions. The data
generated based on the studies will help to trace back the origin of the teas.
The standards prescribed for tea by different standards organizations
such as ISO, BIS and PFA are the purity standards. These standards do not
94
provide information about the intrinsic quality. The intrinsic quality of tea
depends on number of variable and non-variable factors. Some of the factors
can be controlled. With the result the intrinsic qualities of tea vary
considerably.
India grows her tea from the 38700 gardens approximately spread in
South, North and North-East States comprising of several regions of variable
climate, soil, rainfall, altitude and latitude. This obviously has an effect on the
intrinsic quality of tea. The manufacturing practices and methods further add
up to the variations in the quality of tea. Though, the literature on intrinsic
qualities of tea is available the information is scattered and is unorganized.
Besides, there are no systematic investigations reported on fingerprinting of
Indian black teas.
This chapter reports the data on fingerprinting of Indian Black Teas
from various regions of India in different seasons, which includes the analyses
of physico-chemical parameters as well as biochemical components viz.,
Physico-chemical characteristics such as moisture, viscosity, total soluble
solids, bulk density, caffeine, phenolic constituents (i.e., theaflavins and
thearubigins) and volatile flavour compounds (VFC) of tea.
Roberts and Smith (1963) have described a method for determination
of polyphenolic oxidation products in black tea liquors for the assessment of
quality in tea. Biswas and Biswas (1971) has also reported about the
briskness of liquor and intrinsic quality evaluation. Further, Biswas et al
(1973) reported that theaflavin is associated with all the liquor characters, i.e.,
95

colour, brightness, strength, briskness and quality. The thearubigins mostly
contribute to the body of the liquor. Ullah (1984) has critically discussed some
of the intrinsic quality parameters and liquor characters of black tea. Mahanta
(1988) had reviewed the chemical basis of liquor characteristics based on the
influence of pigments and processing conditions of black tea manufacture.
Owuor and Obanda (1998) have critically discussed the changes in quality of
the South African black teas.
2.2. SCOPE • The changes in climate, altitude, the location, the processing, packaging
and several other factors will have significant influences on the quality of
tea.
• Use of sophisticated techniques for chemical and biochemical analysis to
determine the changes in flavour profile at molecular levels in order to get
data in defining the intrinsic quality of tea to serve as its fingerprint.
• The composite of biochemical constituents responsible for strength, taste,
colour and flavour will be elucidated so as to generate a fingerprint of
Indian black teas.
96

2.3. MATERIALS AND METHODS
2.3.1. Materials
In India, tea cultivation is spread over the hilly and plain areas of North,
South and North-East. Tea is also grown in Kangra valley, Kumaon Hills and
Ranchi. In South India, tea is cultivated in Western Ghats of Kerala, Nilgiris of
Tamilnadu and Karnataka. The important tea growing regions of South India
are:
1. Nilgiris
2. Nilgiris-Waynad-Mysore
3. Anamallais
4. High range
5. Central Travancore
6. South Travancore
The Main three tea growing regions in North and North-East India are:
1. Darjeeling and Dooars (Darjeeling)
2. Brahmaputra valley (Assam)
3. Surma valley (Palampur)
Collection of Samples
Samples were selected cutting across all indian tea producing
regions and parts of the season. The regions, parts of season and gardens
were so selected as to represent a range of climatic, topographical,
agronomical, processing and management factors. Samples of tea from the
following Regions (gardens) spread over four seasons (1.April-June; 2.July-
97

September; 3.October-December; 4.January-March) of the year were
collected.
1. Parajulie (Tamilnadu)
2. Pandiar (Tamilnadu)
3. AFTL (Assam - A AFTL)
4. Magor (Assam - A Mag)
5. Darjeeling premium (DP)
6. Darjeeling medium (DM)
7. Chinchula (Dooars)
8. Aibheel (Dooars)
9. Nilgiris (Tamilnadu)
10. Cachar best (Assam)
11. Cachar medium ( Assam)
12. Palampur G1 (PG1) – (Surma valley)
13. Palampur G2 (PG2) – (Surma valley)
14. Assam BOP
15. Assam OP
16. Nilgiris high grown (Nil Hg) - (Tamilnadu)
17. Nilgiris high grown CTC-BOP (Nil Hg CTC) - (Tamilnadu)
18. Nilgiris Waynad - (Tamilnadu)
19. Annamalai - (Tamilnadu)
20. Rosekandy (Dibrugarh - Assam)
21. Kurti (Darjeeling)
98

2.3.2. Methods
a. Analysis for physico-chemical characteristics such as :
i) Moisture
ii) Viscosity of liquor
iii) Total soluble solids
iv) Bulk density
v) Colour of liquor
vi) Brightness
b. Quantitative estimation of samples for caffeine, theaflavins, thearubigins,
colour and theaflavin digallate
c. Quantitative determination for major volatile flavour compounds such as :
i) n-Hexanal
ii) Leaf aldehyde
iii) Leaf alcohol
iv) trans/cis-2 Hexenol
v) n-Hexanol
vi) n-Heptanal
vii) Benzaldehyde
viii) Nonanal
ix) Linalool
x) Methyl salicylate
xi) β-ionone, etc.
99

2.3.2.1. Determination of Moisture
It is the measurement of the quantity of moisture present in the tea
sample apart from dry matter present (AOAC, 2000a). The tea sample was
ground in a suitable grinder (Maharaja, India) to pass through 30-mesh sieve
and mixed thoroughly to get a homogenous sample. A clean aluminium dish
dried at 110°C in hot air oven for one hour, cooled and stored in a desiccator.
Prepared tea sample weighed using Mettler balance into a suitable (dried and
cooled) aluminium dish. Dried to constant weight at 100-106°C (Approximately
6 hrs) in a hot air oven (Lynx, Lawrence and Mayo, India) having accurate
temperature control. The loss in weight of sample is noted as moisture and
percentage of moisture content calculated on dry weight basis (DB).
2.3.2.2. Determination of Viscosity of Tea Liquor
Measurement of viscosity of tea liquor may provide some basis for the
body of the liquor. Viscosity is defined as the measurement of the resistance
offered by the test material to the rotating spindle of the viscometer (or) it is
defined as resistance to flow. Viscosity measurement is based on
measurement of resistance offered to rotation of a spindle immersed in the
test material. This instrument can also be classed as a torsion viscometer,
since the results are obtained by measuring torque on the rotary part of
instrument. The measurement of torque, by a calibrated spring on a spindle
with constant speed of rotation in the material is the basis of operation of the
above viscometer. The viscosity in milli Pascals can be read directly (AOAC,
2000b).
Tea sample (2 g) was added to a beaker containing boiling distilled
water (140 ml). The boiling was continued for 4 mins. Brew filtered using
100

Whatman No.5 filter paper placed in a Buchner funnel under vacuum. Brew
(30 ml) was taken in a beaker and placed under the spindle of the viscometer
(Rheology international Ltd., Shennon, Ireland) and by trial and error selected
a suitable spindle keeping the RPM constant. Readings were noted in
triplicate and average of the readings was taken as final viscosity of the tea
brew.
2.3.2.3. Determination of Total Soluble Solids (Hanan et al, 2001)
The total soluble solids content which contributes to the characteristic
taste and body of a cup of tea apart from other constituents was determined.
It is the measure of the soluble solids that dissolve in water upon brewing of
the tea (AOAC, 2000c).
Tea sample (2 g) was added to a beaker containing boiling distilled
water (140 ml) and the boiling was continued for 4 mins. Brew filtered using
Whatman No.5 filter paper in a Buchner funnel under vacuum. Brew was
mixed well and a drop of cooled brew was placed on the prism of a pre-
calibrated refractometer (Atago,Japan). Illumination and colour compensation
were adjusted. Temperature was maintained at 20oC (by circulating water
through the provided channel next to the prism). The value for total soluble
solids was noted while adjusting the measurement knob. The average value
of three readings was taken as TSS (%).
101

2.3.2.4. Determination of Bulk Density (Ramaswamy, 1995)
Bulk density indicates the weight of substance held in a unit volume.
The bulk density of tea varies with grade and method of manufacture. Also
this gives idea on cuppage and packaging of tea.
a. Loose Bulk Density
The tea sample was filled upto 500 ml level in a glass cylinder using a
hopper suspended 3 cm away from it. Weight of the tea sample noted using a
balance. The weight of tea per unit volume (g/ml) is loose bulk density.
b. Compacted or Packed Bulk Density
The tea sample was filled upto 500 ml level in a glass cylinder using a
hopper suspended 3 cm away from it. Filled cylinder was tapped five times
the cylinder using soft rubber tubing. The weight and volume of tea is noted.
Weight of tea per unit volume is the compacted or packed bulk density (g/ml).
2.3.2.5. Estimation of Soluble Caffeine in Tea by HPLC Method (Pura
Naik and Nagalakshmi, 1997)
Caffeine is an alkaloid present in tea to the extent of 1-5%. Chemically
it is trimethyl xanthine. The amount of water-soluble caffeine in tea brew is
less than the total caffeine content of tea.
Reagents: Methanol, Chloroform, (both GR Grade), Acetronitrile (HPLC
grade) and double distilled water (glass), standard caffeine. All solvents
distilled and filtered through a 0.5 μ filter and de-gassed under vacuum prior to
use.
102
a. Calibration Curve for Standard Caffeine
Standard stock solution was prepared by dissolving 80 mg caffeine
(Sigma-Aldrich chemie GMBH, Steinheim, Germany) in 100 ml water.
Working standard was prepared by diluting 10 ml of stock solution to 100 ml
to give a concentration of 0.08 μg / μl. Working standard solution was
analysed on HPLC (Shimadzu LC-6A and system controller SCL-6A,)
equipped with the μ - Bondapak C18 column (3.9 mm x 15 cm, Waters,
Milford,USA), using the mobile phase (Acetonitrile: water = 20:80 v/v) at a flow
rate of 1 ml / min. Detection was by a UV-visible spectrophotometric detector
(SPD-6AV) set at a sensitivity of 0.08 AUFS and wavelength of 276 nm.
Working standard solution (5-25 μl) was injected on the HPLC after
initial equilibrium time (10 min), and peak area responses were obtained. A
standard graph for caffeine was prepared by plotting concentration versus
area.
b. Sample Preparation:
Black tea (2 g) weighed into a 250 ml beaker and 177 ml of boiling water
was added, brewed for 6 min on boiling water bath (80°C) filtered the brew
through Whatman No.44 filter paper and 2 ml filtrate was subjected to
analysis for caffeine content. A SEP-PAK C18 cartridge (Millipore, Waters
Associates, Maple Street / Milford, MA, USA) was activated by first passing
methanol (2 ml), followed by double distilled water (2 ml) by means of a glass
syringe. Tea extract (brew, 2 ml) was then passed through the cartridge and
elute was rejected. Air was passed to expel any remaining water. Caffeine
103
was eluted from the cartridge with 6 ml of chloroform (drop by drop), into an
evaporating flask. The chloroform was removed on a water bath under
vacuum. The residue in the flask was dissolved in the water and made upto 4
ml. An aliquot (5-10 μl) of this solution was analysed on the HPLC under the
earlier conditions (described for standard caffeine solution). The percent
caffeine is calculated by comparing the peak area responses with standard
caffeine curve (Calibration curve).
C. Clean Up of sep-pak C18 Cartridge for Re-use
The used cartridge is cleaned up with 35% (v/v) methanol in water (5 ml)
followed by 80% (v/v) methanol in water (4 ml) and finally with 2 ml of
methanol for re-use. Cartridge could be re-used 25 times.
2.3.2.6. Spectrophotometric analysis for theaflavins (TFs) and thearubigins (TRs), Total colour and Brightness
Biochemical assessment of black tea quality was done from estimation
of TFs and TRs of tea brew. In the present studies, a rapid procedure for
estimating theaflavins and thearubigins of black tea was adopted (Ullah,
1986). The absorbances were measured on a UV-visible spectrometer, Cintra
10 (Australia). The tea sample (9 g) added to 375 ml of boiling water in a
conical flask and the boiling continued for 10 min using an air condenser on a
water bath. The tea infusion was filtered through cotton cloth and cooled to
room temperature. The infusion (6 ml) was mixed with 6 ml of 1% (w/v)
aqueous solution of anhydrous disodium hydrogen phosphate and the mixture
extracted with 10 ml of ethyl acetate by quick repeated inversion for 1 min.
The separated bottom layer drained, remaining was the ethyl acetate layer
104
(the TF fraction) and diluted with 5 ml ethyl acetate. Optical densities, E1, E2,
E3; were obtained on extracts prepared as follows:
E1 - TF extract (10 ml) were diluted to 25 ml with methanol;
E2 - Infusion (1 ml) diluted to 10 ml with water and made up to 25 ml with
methanol;
E3 - Infusion (1 ml) was mixed with aqueous oxalic acid (10% w/v, 1 ml), and
water (8 ml) and made up to 25 ml with methanol;
Optical densities of E1, E2, and E3 were measured at 380 and 460 nm.
At 380 nm
% TF = 2.25 XE1
% TR = 7.06 (4 E3 -E1)
At 460 nm
Total colour = 6.25X 4E2
% Brightness = E1 / 4E2 X 100
2.3.2.7. HPLC Profile of Theaflavins (Bailey et al, 1991)
Theaflavins (TFs) and Thearubigins (TRs) are the enzymatic oxidation
products of tea flavanols which are formed during manufacture of tea.
Sample Preparation and analysis
Black tea (4 g) was taken in boiling water (100 ml) and infused for 10
min on water bath at 80oC. Brew was filtered through whatman No.5 filter
paper using Buchner funnel by applying vacuum and volume was made up to
100 ml with double distilled water and used for HPLC analysis. The sample
solution was analysed on HPLC (Shimadzu LC-6A) equipped with the µ-
105

Bondapak C18 column (3.9 mm x 15 cm, Waters, Milford, USA) using the
mobile phase [A -1% citric acid solution (pH adjusted to 2.8 using NaOH); B -
Acetonitrile; Gradient, linear 8% to 31% B (organic) in A over 50 min] at a flow
rate of 1.5 ml / min. Detection was by a photodiode array detector, SPD-M10
AVP at wavelengths 280, 380, 460 nm, software-class 10 (Shimadzu, Kyoto,
Japan) communication bus module-CBM-10A.
By comparing the retention time responses with literature values the
Theaflavins (TFs) were evaluated and classified according to Retention times
(Bailey et al, 1991).
2.3.2.8. Analysis for Volatile Flavour Compounds from Black Tea by GC-MS. Flavour Compounds (VFCs) are the volatiles from black tea which are
responsible for characteristic aroma of the black tea (Group-I and II, VFCs).
a. Sample Preparation
Simultaneous distillation and solvent extraction (SDE), using a Likens–
Nickerson apparatus (1964) for isolation of volatiles, was carried out. Black
tea sample (50 g) was added to a 2 Liter round-bottom flask containing 1 Liter
distilled water, along with 0.2 ml of internal standard (15 μl of cumene in 10 ml
of petroleum ether). Into another flask (200 ml), 25 ml of petroleum ether (40–
50oC fraction), 0.25 ml of ethanol and 25 ml of diethyl ether with magnetic bit
were placed. These two R.B. flasks were attached to two arms of the Likens–
Nickerson apparatus and extracted for 2.5 h. After extraction the solvent
containing VFCs was evaporated on a water bath to 0.5 ml volume, which
was then transferred to a test tube and stored at 4oC for GC–MS analysis.
106

b. GC-MS analysis for VFCs
A Shimadzu GC-17A equipped with QP-5000 (Quadrupole) mass
spectrometer was used. A fused silica capillary column SPB TM-1, coated
with polydimethylsiloxane of 30 m length and 0.32 mm internal diameter and
film thickness 0.25 μm, was used. Helium was the carrier gas with a flow rate
of 1 ml/min. Split ratio was 1:50 and ionisation voltage was 70 eV. The
injection port temperature and detector port temperature were maintained at
220oC. Oven temperature programme was: 40oC (3)-2oC/min, 100oC-4oC/
min, 220oC (7); a sample of 1 μl was injected for each analysis. Total ion
chromatogram (TIC) for the samples and mass spectrum of each peak are
obtained. Identification of compounds was achieved by comparison mass
spectra (NIST library and Adams, 2001) and Kovats indices (Davies, 1990;
Jennings and Shibamoto, 1980).
[Log tR(A) – Log tR (N)]
Kovat’s Index = 100 N +100 n -----------------------------------------
[Log tR(N + n) – Log tR(N)]
Where:
tR(A) = Retention Time (RT) of unknown compound peak.
tR (N) = RT of smaller hydrocarbon eluted before the compound
peak.
tR(N + n) = RT of larger hydrocarbon eluted after the compound peak.
N = Carbon number of smaller standard hydrocarbon.
(N+n) = Carbon number of larger standard hydrocarbon.
Area Response of Unknown
Amount of Unknown = -------------------------------------- X Weight of Standard
Area Response of Standard
107

2.3.2.8.1. Calculation of terpene index, Mahanta ratio, Yamanishi Botheju- ratio and Borse-Rao quality index The basic aroma characteristics are probably due to different varieties
of tea plants as well as the influence of specific growing conditions. To identify
the varietal origin of individual teas, Takeo et al (1983a) proposed a terpene
index (TI), which is defined as:
Linalool + Linalool derivatives Terpene Index = --------------------------------------------- Linalool + Linalool derivatives + geraniol The terpene index of pure variety sinensis approaches zero whereas
the TI of pure var. assamica approaches unity.
A ratio based on the sum of gas chromatographic peak areas of
terpenoids to non-terpenoids (Baruah et al, 1986 and Mahanta et al, 1988),
called Mahanta ratio was developed. The terpenoids were assumed to be
desirable while the non-terpenoids were classified as undesirable to tea
aroma and quality.
Terpenes (desirable) Mahanta ratio = ---------------------------------------------- Non-terpenes (Undesirable) Yamanishi et al., (1989) developed another ratio based on gas
chromatographic peak areas of linalool and E-2-hexenal, which ignored all
other VFC. This ratio is known as Yamanishi-Botheju ratio. The rationale for
the use of Yamanishi-Botheju ratio requires that linalool and E-2-hexenal
occur in large amounts in all teas and therefore may have a dominant effect.
108

Linalool Yamanishi-Boteju ratio = -------------------- E-2-Hexenal A new approach in terms of novel quality index for tea has been
innovated and proposed through this work. The sum of TF/TR ratios of tea
and the sum of the VFC ratios (Yamanishi-Botheju ratio and Mahanta ratio)
added together is proposed for the first time as a new and novel quality index,
hence forth referred to as Borse-Rao quality index (unpublished data),
considered to be an overall quality indicator of tea as both the non-
volatiles/volatiles are given due consideration in this quality index.
109

2.4. RESULTS AND DISCUSSION
Samples were selected cutting across all Indian tea producing
regions and four seasons. The regions, seasons and gardens were so
selected as to represent a range of climatic, topographical, agronomical,
processing and management factors. Samples of tea from the given regions /
gardens spread over four seasons of the year (April-June, July- Sept., Oct.-
Dec., Jan.- March) were procured, studies were carried out for fingerprinting.
The results are presented below in terms of regional and seasonal fingerprint.
2.4.1. Profiling of the tea samples from first season (April- June)
2.4.1.1. Physico-Chemical Constituents
The results of the analyses of the physico-chemical parameters for the
black tea samples from Season-1 (April-June) are presented in Table 2.1.
110

111
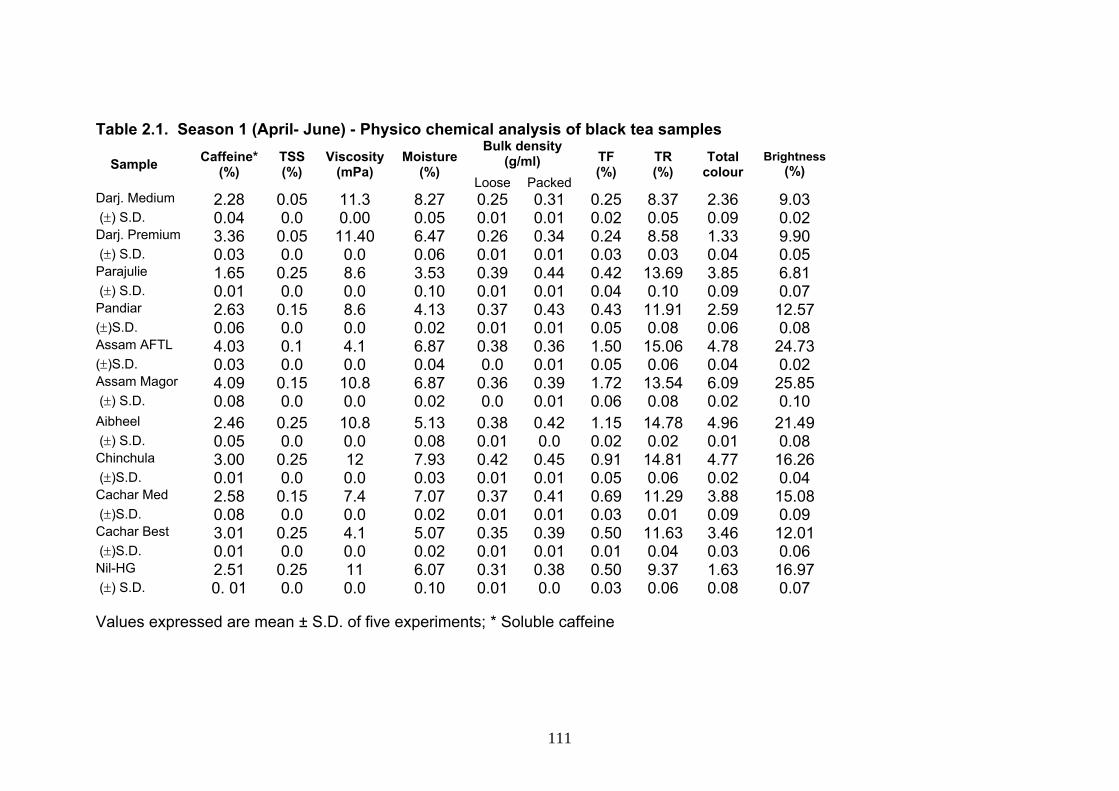
Table 2.1. Season 1 (April- June) - Physico chemical analysis of black tea samples
Sample Caffeine* (%)
TSS (%)
Viscosity (mPa)
Moisture (%)
Bulk density (g/ml) TF
(%) TR (%)
Total colour
Brightness (%)
Loose Packed Darj. Medium 2.28 0.05 11.3 8.27 0.25 0.31 0.25 8.37 2.36 9.03 (±) S.D. 0.04 0.0 0.00 0.05 0.01 0.01 0.02 0.05 0.09 0.02 Darj. Premium 3.36 0.05 11.40 6.47 0.26 0.34 0.24 8.58 1.33 9.90 (±) S.D. 0.03 0.0 0.0 0.06 0.01 0.01 0.03 0.03 0.04 0.05 Parajulie 1.65 0.25 8.6 3.53 0.39 0.44 0.42 13.69 3.85 6.81 (±) S.D. 0.01 0.0 0.0 0.10 0.01 0.01 0.04 0.10 0.09 0.07 Pandiar 2.63 0.15 8.6 4.13 0.37 0.43 0.43 11.91 2.59 12.57 (±)S.D. 0.06 0.0 0.0 0.02 0.01 0.01 0.05 0.08 0.06 0.08 Assam AFTL 4.03 0.1 4.1 6.87 0.38 0.36 1.50 15.06 4.78 24.73 (±)S.D. 0.03 0.0 0.0 0.04 0.0 0.01 0.05 0.06 0.04 0.02 Assam Magor 4.09 0.15 10.8 6.87 0.36 0.39 1.72 13.54 6.09 25.85 (±) S.D. 0.08 0.0 0.0 0.02 0.0 0.01 0.06 0.08 0.02 0.10 Aibheel 2.46 0.25 10.8 5.13 0.38 0.42 1.15 14.78 4.96 21.49 (±) S.D. 0.05 0.0 0.0 0.08 0.01 0.0 0.02 0.02 0.01 0.08 Chinchula 3.00 0.25 12 7.93 0.42 0.45 0.91 14.81 4.77 16.26 (±)S.D. 0.01 0.0 0.0 0.03 0.01 0.01 0.05 0.06 0.02 0.04 Cachar Med 2.58 0.15 7.4 7.07 0.37 0.41 0.69 11.29 3.88 15.08 (±)S.D. 0.08 0.0 0.0 0.02 0.01 0.01 0.03 0.01 0.09 0.09 Cachar Best 3.01 0.25 4.1 5.07 0.35 0.39 0.50 11.63 3.46 12.01 (±)S.D. 0.01 0.0 0.0 0.02 0.01 0.01 0.01 0.04 0.03 0.06 Nil-HG 2.51 0.25 11 6.07 0.31 0.38 0.50 9.37 1.63 16.97 (±) S.D. 0. 01 0.0 0.0 0.10 0.01 0.0 0.03 0.06 0.08 0.07 Values expressed are mean ± S.D. of five experiments; * Soluble caffeine
111

112

Moisture content in teas varied from 3.5% to 8.2%. The total soluble
solids were determined using Atago refractometer (Method 2.3.2.3). The total
soluble solids varied from 0.05 to 0.25%. Teas from Parajulie, Niligiri high
grown, Aibheel, Chinchula and Cachar best had highest total soluble solids of
0.25% each. Teas from Pandiar, Assam Magor and Cachar medium had
moderate total soluble solids of 0.15% each. Tea from Assam AFTL alone
had lower TSS of 0.1%. Teas from Darjeeling (Premium and Medium) had
lowest TSS of 0.05% each. It is clear from these results that some of the teas
from North and South have good TSS content 0.25% and few have moderate
of 0.15%, whereas the Darjeeling teas can be characterized by their lowest
TSS of 0.05%.
The soluble caffeine content (Method 2.3.2.5) in the samples varied from
1.65 to 4.09%. Assam AFTL and Assam Magor samples contained highest
soluble caffeine 4.03 and 4.09 percent. Darjeeling premium, Chinchula and
Cachar best teas also contained high soluble caffeine 3.35, 3.21 and 3.01
percent respectively. Pandiar, Darjeeling medium, Nilgiris high grown,
Aibheel and Cachar medium teas had moderate quantities of soluble caffeine
2.63, 2.28, 2.51, 2.46 and 2.58 % respectively. Only teas from Parajulie had
the lowest soluble caffeine content of 1.65%. It can be seen that Assam teas
have the highest caffeine content and so the briskness. Also the best teas or
quality teas had 2 to 3 % of soluble caffeine content.
Viscosity of the brew (Method 2.3.2.2) varied from 4.1 to 12 milli
Pascals. Tea brew from Chinchula alone had highest viscosity 12 mPa and
Darjeeling (Medium and Premium), Nilgiri high grown, Assam Magor and
112

Aibheel had medium viscosity 11.3, 11.4, 11.0, 10.8 and 10.8 mPa
respectively. Tea brews from Parajulie and Pandiar had viscosity 8.6 mPa
each and Cachar medium tea brew had viscosity of 7.4 mPa. The brew from
Assam AFTL and Cachar best had lowest viscosity 4.1 mPa. Darjeeling teas’
brews showed very good amount of viscosity even though they looked thin.
Bulk density (BD-method 2.3.2.4) varied from 0.25 to 0.42 g/ml (Loose
B.D.) and 0.31 to 0.45 g/ml (Packed BD). Darjeeling (Premium and Medium)
and Nilgiri high grown teas have lowest loose bulk densities (0.25, 0.26 and
0.31 g/ml) as well as compacted bulk densities (0.31, 0.34 and 0.38 gm/ml).
Chinchula tea had the highest loose and packed BD (0.42 and 0.45 g/ml).
2.4.1.2. Theaflavins and Thearubigins
The results of analysis for theaflavins, thearubigins, total colour and
brightness for black tea samples from season-1(April-June) are presented in
Table 2.1 and figure 2.1 (HPLC profile). It is evident from the results (Method
3.8) that theaflavin (TF) content varied from 0.24 to 1.72 %. Darjeeling teas
can be characterized by lowest TF of 0.24 and 0.25% whereas Assam AFTL
and Assam Magor can be characterized by highest TF of 1.5 and 1.72 %
respectively. But Nilgiris high grown possesses almost double the TF content
compared to Darjeeling. Other south Indian teas (Parajulie, Pandiar – 0.42%
and 0.43%) had lower TF content as compared to North Indian teas (Aibheel
(1.15%), Chinchula (0.91%), Cachar medium (0.69) and Cachar best (0.50%).
113

Peaks: 1 = theaflavin 2 = theaflavin-3-gallate 3 = theaflavin-3`-gallate 4 = theaflavin-3.3`-digallate
Fig.2.1. HPLC chromatogram of tea
The results indicate that thearubigin (TR) content ranged from 8.37% to
15.06%. Assam AFTL (15.06%), Aibheel (14.78%) and Chinchula (14.81%)
had highest TR content. Parajulie and Assam Magor had TR content 13.69%
and 13.54% respectively. Cachar teas (Medium and Best) and pandiar teas
had moderate TR content of 11.29%, 11.63% and 11.91% respectively.
Darjeeling (Medium and Premium) teas can be marked with lowest TR
content of 8.37% and 8.56% and Niligiri high grown by slightly higher content
of TR (9.37%) than Darjeeling.
The results indicate that Assam Magor have highest total colur (6.09)
and brightness (25.85%). Assam AFTL (4.78, 24.73%), Aibheel (4.96,
21.49%), Chinchula (4.77, 16.26%) had the high total colour and brightness
114
values, when compaed to Cachar teas, which have moderate total colour
(3.88 and 3.46) and brightness (15.08% and 12.01%). Parjulie and Pandiar
have total colour 3.85 and 2.59 respectively. Parajulie has the lowest
brightness (6.81%) and Pandiar has almost double the brightness as to
Parajulie (12.57%). Darjeeling premium can be marked with lowest total
colour (1.33) and brightness (9.90%). But Darjeeling medium has total colour
slightly highest (2.36) and brightness lower (9.03) than premium. Nilgiri high
grown tea can be marked by lower total colour (1.63) and moderate
brightness (16.97%).
2.4.1.3. Volatile flavour compounds (VFC)
Volatile flavour compounds were isolated and analysed as per 2.3.2.8
Identification of compounds was achieved by comparison mass spectra (NIST
library and Adams, 2001) and Kovats indices (Davies, 1990; Jennings &
Shibamoto, 1980) Twenty-five volatile flavour compounds (VFCs) are
identified and taken as markers and presented Table 2.2. Their quantities
were calculated with reference to internal standard in different tea samples.
The teas from different origins can be marked by the composition of VFCs
identified. Gulati and Ravindranath (1996) explained seasonal variation of the
VFCs in Kangra teas. Gulati et al (1999) studied the aroma profiles with
respect to clonal variations in Kangra teas. Ullah (1985) studied aroma
constituents, of Assam and China hybrid teas and their manifestation during
tea processing. He identified eight aroma constituents, concluding that aroma
constituents of tea are mainly inherent in the leaf and their manifestation is
largely governed by black tea processing methods.
115

Table 2.2. Identification of major volatile flavour compounds from black tea
S.No Compound KI cal M+ m/z
1 n-Hexanal 772 100 41,55,42,69,57 2 E- 2- hexenal 825 98 41,42,55,69,57 3 Z-3- Hexenol 842 100 41,67,82,55,69 4 2-hexenol 848 100 57,82,41,43,44 5 n-hexanol 853 102 56,43,41,55,42 6 n-heptanal 875 114 43,41,70,44,55 7 Cumene 911 120 105,120,77,51,79 8 Benzaldehyde 939 106 77,106,105,51,50 9 (E,Z)-2,4-Heptadienal 975 110 81,41,53,67,110
10 (E,E)-2,4-Heptadienal 984 110 81,41,53,67,110 11 Nonanal 1006 142 41,57,43,55,56 12 Phenyl acetaldehyde 1017 120 91,65,92,120,51 13 Benzyl alcohol 1022 108 79,108,77,107,1 14 cis-Linalooloxide 1058 170 59,43,55,94,68 15 trans- Linalooloxide 1073 170 59,43,55,94,68 16 Linalool 1085 154 71,41,93,55,43 17 Phenyl ethyl alcohol 1097 122 91,92,65,122,51 18 α-terpineol 1173 154 59,43,93,81,121 19 Methyl salicylate 1180 152 120,92,152,121,65 20 cis-Geraniol 1232 154 41,69,93,67,53 21 Indole 1291 117 117,89,90,63,118 22 Geranyl acetate 1358 196 41,43,69,68,67 23 β-Ionone 1455 192 177,43,41,44,178 24 Dihydroactinidiolide 1471 180 111,43,109,137,67 25 Nerolidol 1518 222 41,69,43,93,71 26 Phytol 2010 296 71,43,57,69,123
The results of the fingerprinting with regard to VFC for season-1 (April-
June) are presented in Table 2.3 and figure 2.2 – 2.28. It is clear from the
results that:
1. Darjeeling premium quality tea possesses highest quantity (13.49 mg %)
of total volatiles, where as Cacher best has lowest (3.18 mg %). Darjeeling
medium quality, parajulie and Pandiar contained higher amounts of total
volatiles.
2. Darjeeling teas contained highest n-hexanal (1241-3702 μg / 100g) and
leaf alcohol (967 -1018 μg / 100g).
116
3. Darjeeling premium quality tea can be marked by the presence of nonanol
(60 - 70 μg / 100g).
4. Nilgiris high grown can be marked by absence of phenyl ethanol and
highest content of linalool (2345 μg / 100g) and methyl salicylate (721 μg /
100g).
5. Parajulie can be marked by highest content of Nerolidol (160 - 200 μg /
100g) and β - ionone (260 – 300 μg / 100g) and absence of trans/cis-2-
hexanol.
6. Pandiar can be characterized with highest content of benzyl alcohol (560 -
590 μg / 100g) and trace of benzaldehyde, and higher content of leaf
aldehyde (5900 – 5930 μg / 100g).
7. Assam AFTL and Assam Magor can be characterized by lowest β - ionone
content (20 μg / 100g)
8. Assam AFTL has only trace of Trans/cis -2-hexanol and Assam Magor has
highest content of leaf aldehyde (6070 – 6100 μg / 100g).
9. Chinchula tea can be marked by the absence of geranyl acetate and
Aibheel by lowest content of geranyl acetate (19 μg / 100g).
10. Chinchula and Aibheel can be marked by trace and lower (54 μg / 100g)
content of linalool
11. Cachar Best and medium can be characterized by trace of both
heptadienals and traces of nerol and cis-geraniol.
12. Cachar Best has lowest content of n-hexanal (50 μg / 100g), while it is
absent in Nilagiri high grown.
117

118

Table 2.3. Season 1(April- June)- Black tea samples-volatile flavour compounds (VFC) μ g / 100 g Sl. No.
Compound name DarjeelPremi.
DarjeelMedim.
Parajulie Pandiar AssamAFTL
AssamMagor
Aibheel Chinchula Cacharbest
Cacharmed.
Nilgiris HG
1 n-hexanal 3702 1241 562 448 257 203 293 89 50 149 A 2 Leaf aldehyde (E-2-hexenal) 3436 1692 3136 5912 2478 6088 799 1677 2133 4312 958 3 Leaf alcohol (Z-3-hexenol) 1018 967 560 740 34 223 154 236 158 151 662 4 trans / cis-2-hexenol 168 531 A 183 T 86 40 62 50 63 115 5 n-hexenol 151 459 25 320 T 49 44 158 138 T 91 6 n-heptanal 58 320 185 169 100 133 55 64 38 95 63 7 Benzaldehyde 254 216 204 T 122 57 62 57 49 92 73 8 (E,Z)-2,4-Heptadienal 27 T 185 T T 14 18 T T T 12 9 (E,E)-2,4-Heptadienal 37 T 185 T T 63 62 T T T 19
10 Nonanal 66 A A A T T T T A T A 11 Phenyl acetaldehyde 310 928 951 355 836 716 898 682 330 2061 322 12 Benzyl alcohol 310 77 31 577 252 111 157 150 0 147 68 13 cis-linalool oxide 516 805 142 T 44 55 128 29 T 65 268 14 trans-linalool oxide 890 1611 574 128 29 95 427 90 27 206 1136 15 Linalool 1166 2052 1642 128 103 48 54 T T 206 2345 16 Phynyl ethyl alcohol 25 137 166 35 602 112 28 286 A 17 4-terpineol A 579 199 173 0 112 78 540 A 18 α-terpineol 165 270 154 T 131 51 157 48 19 92 80 19 Methyl salicylate 314 475 130 180 96 76 145 50 40 212 721 20 Nerol 44 18 26 36 A 21 cis-Geraniol 723 987 43 369 19 17 44 T T 14 22 Geranyl acetate 46 110 37 T 20 26 19 A T 32 35 23 β-lonone 57 54 278 76 20 20 70 34 26 103 42 24 Nerolidol 76 87 179 T 52 17 26 31 12 55 101 Total 13490 12926 9228 10301 4976 8356 4280 3717 3176 8867 7125 Terpene Index 0.78 0.81 0.98 0.41 0.90 0.92 0.93 1.0 1.0 1.0 0.99 Yamanishi Botheju ratio 0.34 1.21 0.52 0.02 0.04 0.007 0.07 - - 0.05 2.44 Mahanta ratio 0.41 1.10 0.60 0.16 0.20 0.07 0.60 0.15 0.06 0.27 2.01
Values expressed are mean of three experiments, Where A=Absent, T= Trace
118

34

Fig.2.2. Total ion chromatogram of black tea volatiles (VFC)
119

Fig.2.3. Mass spectrum of n-Hexanal
Fig.2.4. Mass spectrum of Leaf aldehyde (E-2-Hexenal)
120

Fig.2.5. Mass spectrum of Leaf alcohol (Z-3-Hexenol)
2-Hexen-1-ol, (E)-
Fig.2.6. Mass spectrum of trans-2- hexenol
121

2-Hexen-1-ol, (Z)-
Fig.2.7. Mass spectrum of cis-2- hexenol
Fig.2.8. Mass spectrum of n-Hexanol
122

Fig.2.9. Mass spectrum of n-Heptanal
Fig.2.10. Mass spectrum of Benzaldehyde
123

Fig.2.11. Mass spectrum of (E,Z)-2,4-Heptadienal
Fig.2.12. Mass spectrum of (E,E)-2,4-Heptadienal
124

O
Fig.2.13. Mass spectrum of Nonanal
Fig.2.14. Mass spectrum of Phenyl acetaldehyde
125
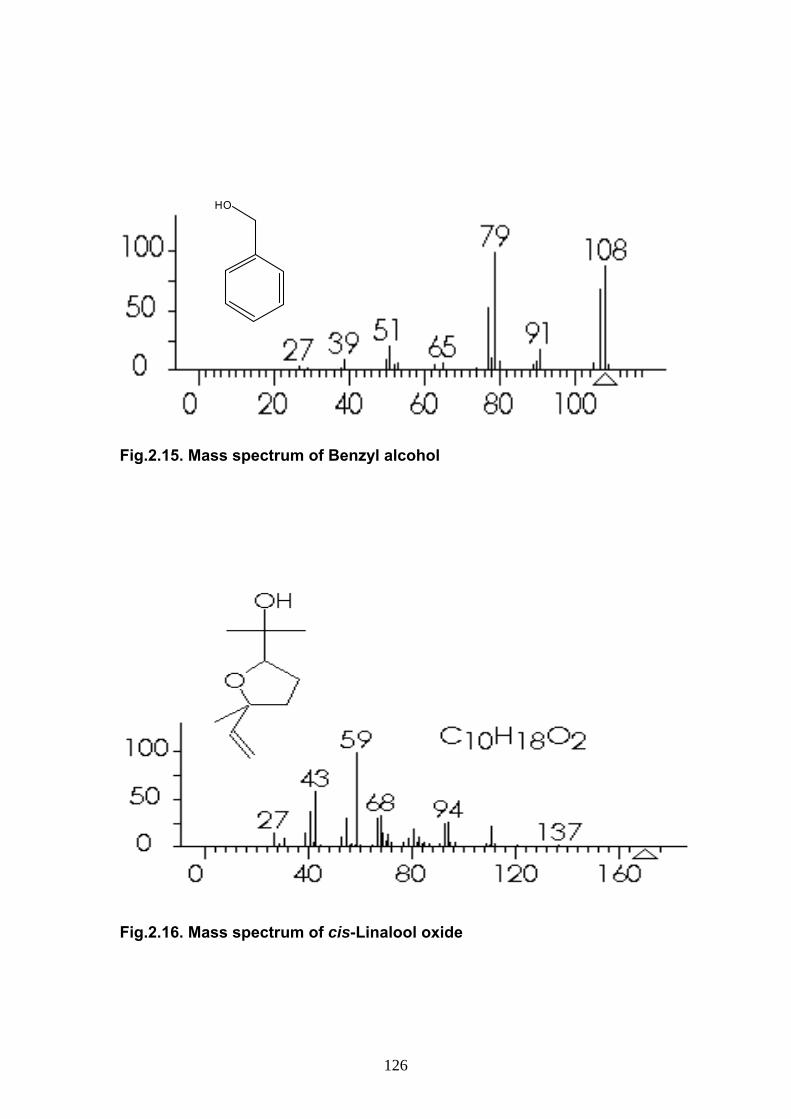
HO
Fig.2.15. Mass spectrum of Benzyl alcohol
ig.2.16. Mass spectrum of cis-Linalool oxide
F
126
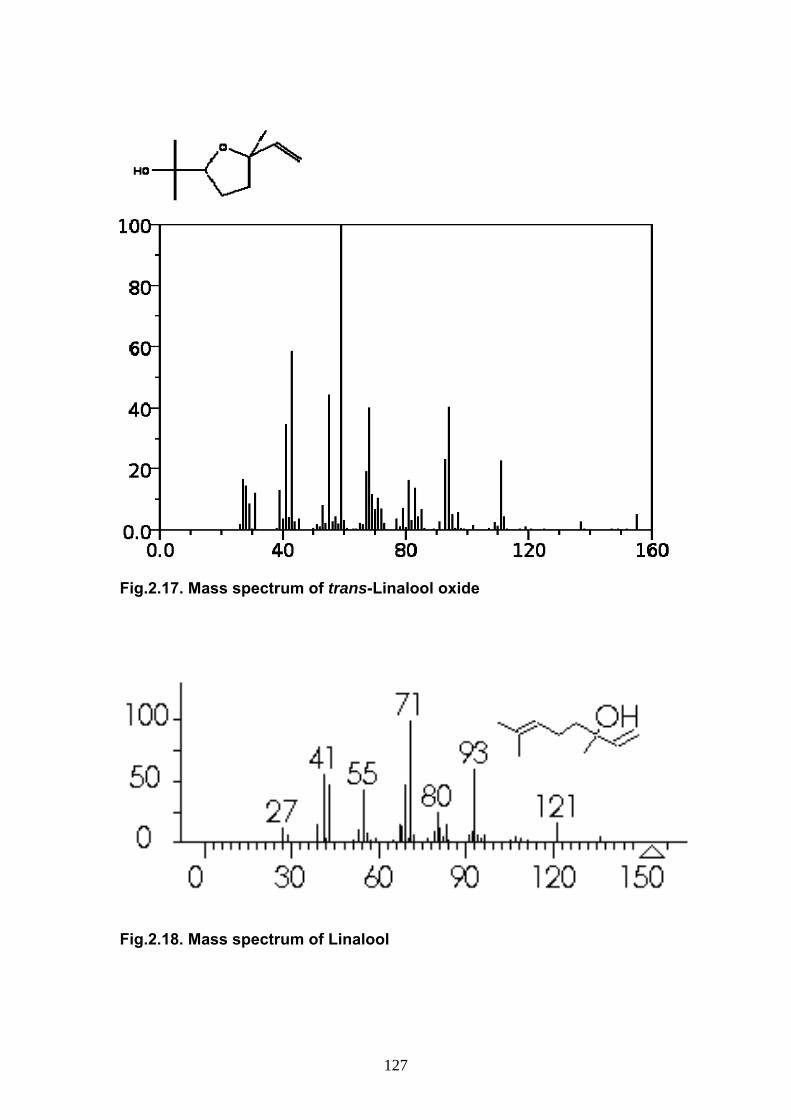
Fig.2.17. Mass spectrum of trans-Linalool oxide
Fig.2.18. Mass spectrum of Linalool
127
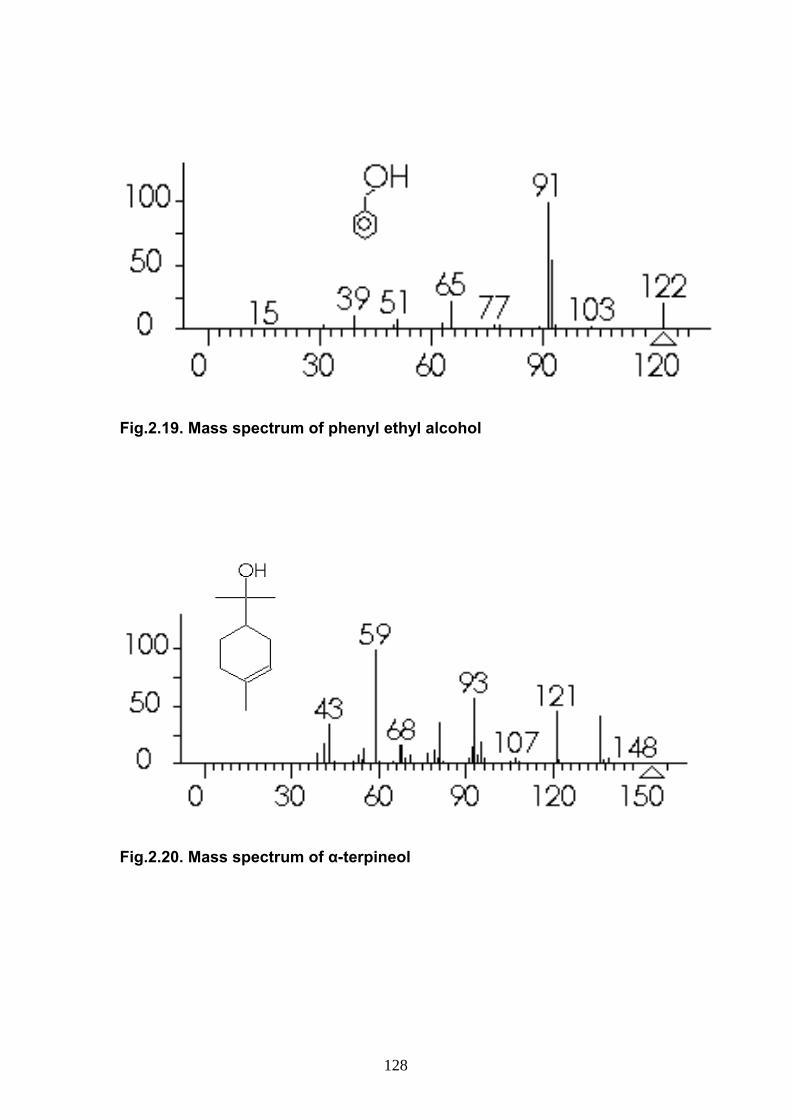
Fig.2.19. Mass spectrum of phenyl ethyl alcohol
Fig.2.20. Mass spectrum of α-terpineol
128

Fig.2.21. Mass spectrum of Methyl Salicylate
Fig.2.22. Mass spectrum of cis-Geraniol
129

Fig.2.23. Mass spectrum of Indole
Fig.2.24. Mass spectrum of Geranyl acetate
130

Fig.2.25. Mass spectrum of β- Ionone
Fig.2.26. Mass spectrum of Dihydroactinidiolide
131
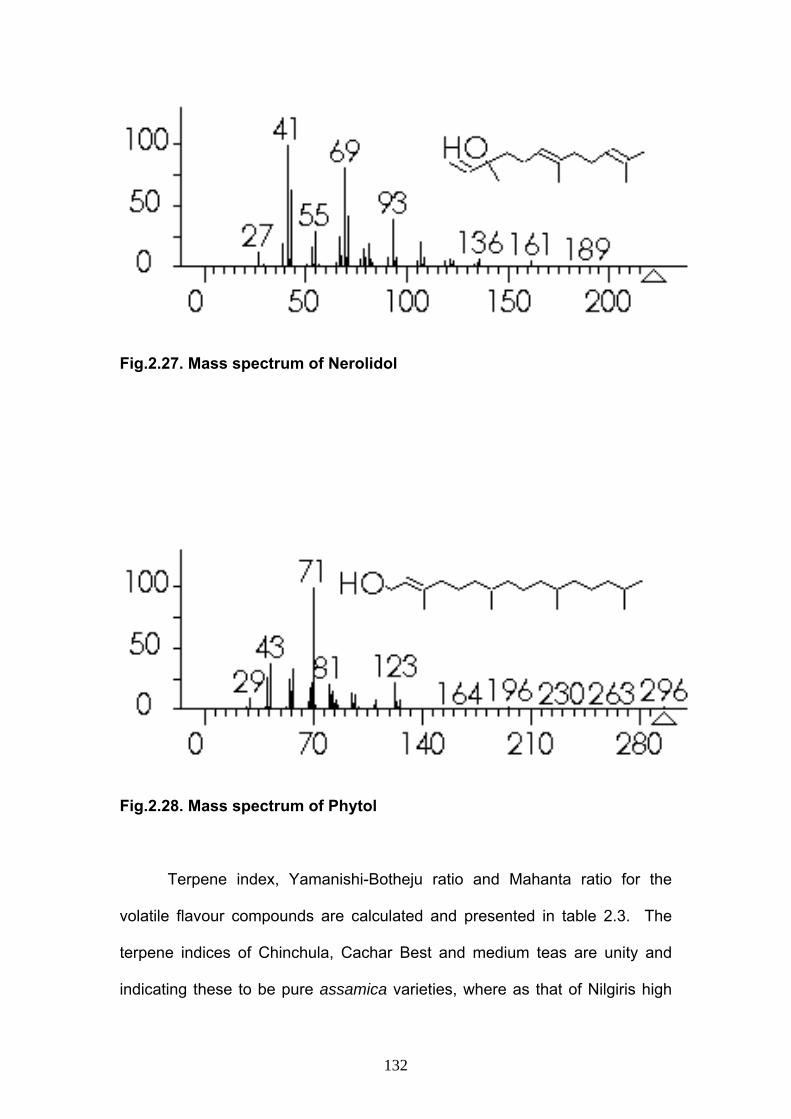
Fig.2.27. Mass spectrum of Nerolidol
Fig.2.28. Mass spectrum of Phytol Terpene index, Yamanishi-Botheju ratio and Mahanta ratio for the
volatile flavour compounds are calculated and presented in table 2.3. The
terpene indices of Chinchula, Cachar Best and medium teas are unity and
indicating these to be pure assamica varieties, where as that of Nilgiris high
132

grown, parajulie, Aibheel, Assam AFTL and Assam Magor are approaching
unity (0.90 – 0.99) and indicating these to be hybrids dominated by assamica.
Darjeeling premium and medium quality, pandiar teas are found to be hybrids
of assamica and sinensis, from their terpene indices (0.78, 0.81 and 0.41
respectively).
Nilgiris high grown tea showed highest Mahanta ratio for VFCs indicating
the presence of more quantities of desirable VFC, which indicate better quality
of flavour. Darjeeling premium and medium, parajulie and Aibheel teas are of
moderate quality with regard to flavour. Teas from Pandiar, Assam AFTL and
Assam Magor, Chinchula, Cachar Best and medium possess lowest Mahanta
ratio and an indication that flavour is low. Yamanishi-Botheju ratios also
support the above findings.
2.4.2. Profiling of the tea samples from second season (July-September)
2.4.2.1. Physico-Chemical Constituents
The results of the physico-chemical analyses for the black tea samples
from season-2 (July-september) are presented in Table 2.4.
It is clear from the results that the moisture content varied from 3.2 to
6.4% and TSS content (Method 2.3.2.3) ranged from 0.05 to 1.0%. Tea brews
from Palampur G1 contained highest TSS (1.0%), followed by Rosekandy
(0.6%) and and Nilgiris high grown CTC BOP (0.4%). Tea brews from
Parajulie, Nilgiris high grown, Aibheel and Chinchula contained moderate TSS
0.25% each. Tea brew from Pandiar contained TSS 0.15%. Tea brew from
Assam AFTL and Assam Magor had lower TSS of 0.10%. Darjeeling
(medium / premium) tea can be marked by lowest TSS of 0.05% in its brew.
133

134
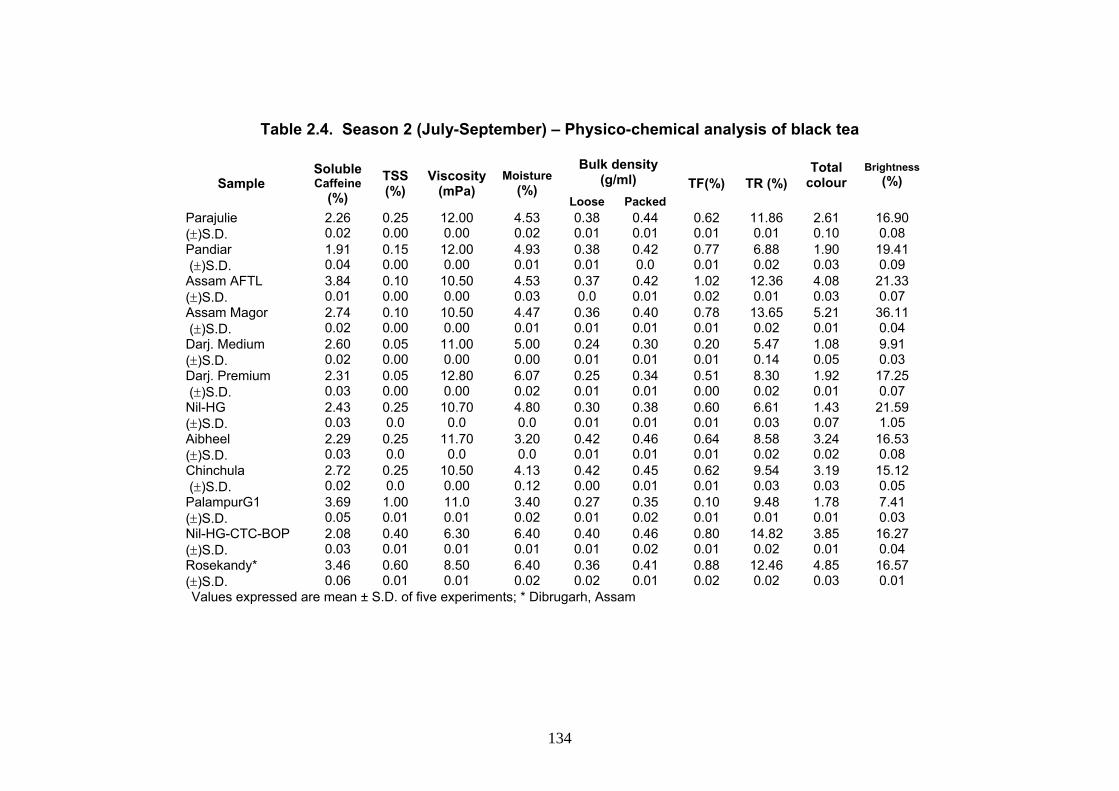
Table 2.4. Season 2 (July-September) – Physico-chemical analysis of black tea
Sample Soluble Caffeine
(%) TSS (%)
Viscosity (mPa)
Moisture (%)
Bulk density (g/ml) TF(%) TR (%)
Total colour
Brightness (%)
Loose Packed Parajulie 2.26 0.25 12.00 4.53 0.38 0.44 0.62 11.86 2.61 16.90 (±)S.D. 0.02 0.00 0.00 0.02 0.01 0.01 0.01 0.01 0.10 0.08 Pandiar 1.91 0.15 12.00 4.93 0.38 0.42 0.77 6.88 1.90 19.41 (±)S.D. 0.04 0.00 0.00 0.01 0.01 0.0 0.01 0.02 0.03 0.09 Assam AFTL 3.84 0.10 10.50 4.53 0.37 0.42 1.02 12.36 4.08 21.33 (±)S.D. 0.01 0.00 0.00 0.03 0.0 0.01 0.02 0.01 0.03 0.07 Assam Magor 2.74 0.10 10.50 4.47 0.36 0.40 0.78 13.65 5.21 36.11 (±)S.D. 0.02 0.00 0.00 0.01 0.01 0.01 0.01 0.02 0.01 0.04 Darj. Medium 2.60 0.05 11.00 5.00 0.24 0.30 0.20 5.47 1.08 9.91 (±)S.D. 0.02 0.00 0.00 0.00 0.01 0.01 0.01 0.14 0.05 0.03 Darj. Premium 2.31 0.05 12.80 6.07 0.25 0.34 0.51 8.30 1.92 17.25 (±)S.D. 0.03 0.00 0.00 0.02 0.01 0.01 0.00 0.02 0.01 0.07 Nil-HG 2.43 0.25 10.70 4.80 0.30 0.38 0.60 6.61 1.43 21.59 (±)S.D. 0.03 0.0 0.0 0.0 0.01 0.01 0.01 0.03 0.07 1.05 Aibheel 2.29 0.25 11.70 3.20 0.42 0.46 0.64 8.58 3.24 16.53 (±)S.D. 0.03 0.0 0.0 0.0 0.01 0.01 0.01 0.02 0.02 0.08 Chinchula 2.72 0.25 10.50 4.13 0.42 0.45 0.62 9.54 3.19 15.12 (±)S.D. 0.02 0.0 0.00 0.12 0.00 0.01 0.01 0.03 0.03 0.05 PalampurG1 3.69 1.00 11.0 3.40 0.27 0.35 0.10 9.48 1.78 7.41 (±)S.D. 0.05 0.01 0.01 0.02 0.01 0.02 0.01 0.01 0.01 0.03 Nil-HG-CTC-BOP 2.08 0.40 6.30 6.40 0.40 0.46 0.80 14.82 3.85 16.27 (±)S.D. 0.03 0.01 0.01 0.01 0.01 0.02 0.01 0.02 0.01 0.04 Rosekandy* 3.46 0.60 8.50 6.40 0.36 0.41 0.88 12.46 4.85 16.57 (±)S.D. 0.06 0.01 0.01 0.02 0.02 0.01 0.02 0.02 0.03 0.01
Values expressed are mean ± S.D. of five experiments; * Dibrugarh, Assam
134

135
The soluble caffeine content varied from 1.91 to 3.84%. Assam AFTL
contained highest soluble caffeine (3.84%) followed by Palampur G1 (3.69%),
Rosekandy (3.46%), Assam Magor (2.74%) and Chinchula (2.72%).
Darjeeling medium (2.6%), Niligiris high grown (2.43%), Darjeeling best
(2.31%), Aibheel (2.29%) and Parajulie (2.26%) teas contained moderate
soluble caffeine. Nilgiris high grown CTC-BOP and Pandiar teas had lowest
soluble caffeine (2.08 % and 1.91%).
Determination of viscosity of the tea liquor (Method 2.3.2.2) was done
with a view that it may provide information about body of the tea liquor. The
viscosity ranged from 6.3 to 12.80 m Pa. It was again noted that Darjeeling
best tea brew had highest viscosity 12.80 m Pa and Nilgiris high grown CTC-
BOP had lowest viscosity 6.3 m Pa.
The bulk densities ranged from 0.24 to 0.46 g/ml. The packed
(compacted) bulk density of Darjeeling teas (Medium and Premium, 0.30 and
0.34 g/ml respectively) as well as loose bulk density (Medium and Premium,
0.24 and 0.25 g/ml respectively) is lowest compared to other teas. Teas from
Aibheel and Nilgiris high grown CTC-BOP have the highest packed (0.46
g/ml) and highest loose (0.42 and 0.40 g/ml) bulk densities.
2.4.2.2. Theaflavins and Thearubigins
The results of the fingerprinting with reference to theaflavins,
thearubigins, total colour and brightness for black tea samples from season-2
(July-Sept.) are presented in Table 2.4. and figure 2.1.
135
It is evident from the results that theaflavin (TF) content varied from
0.10 to 1.02%. Assam AFTL has the highest TF (1.02%), besides Rosekandy
(0.88%), Nilgiris high grown CTC-BOP (0.80%), Assam Magor (0.78%) and
Pandiar (0.77%). Aibheel (0.64%), Parajulie (0.62%), Chinchula (0.62%) and
Niligiri high grown (0.60%) have moderate TF content. Darjeeling premium
(0.51%), Darjeeling medium (0.20%) and Palampur G1 (0.10%), can be
marked with lowest TF conent.
Thearubigins (TR) content varied from 5.47 to 14.82%. Nilgiris high
grown CTC-BOP (14.82%), Assam Magor (13.65%), Rosekandy (12.46%)
and Assam AFTL (12.36%) can be characterized by highest TR contents
besides the highest TF content. Parajulie have slightly lower TR (11.86%)
than Assam teas. But Pandiar (6.72%) and Nilgiris high grown (6.61%) have
much lower TR content. Aibheel (8.58%), Chinchula (9.54%) and Darjeeling
best (8.30%) had moderate TR content. But Darjeeling medium tea can be
marked by lowest TR (5.47%).
The results for total colour varied from 1.08 (Darjeeling medium) to
5.21 (Assam Magor). Interestingly the trend was found similar for brightness
also i.e. 9.91% (Darjeeling medium) to 36.11% (Assam Magor). In sum total
Assam Magor can be marked by highest colour and brightness whereas
Darjeeling medium by lowest colour and brightness. Assam AFTL (4.08 and
21.23%), Rosekandy (4.85, 16.57%), Nilgiris high grown CTC-BOP (3.85 and
16.27%), Aibheel (3.24 and 16.53%) and Chinchula (3.19 and 15.12%), had
highest total colour and brightness followed by Assam Magor. South Indian
teas Parajulie (2.61 and 16.90%) and Pandiar (1.89 and 19.41%) along with
136

Palampur G1 (1.78, 7.41%) had marginally more or less colour and brightness
than Darjeeling teas. But Nilgiri high grown had less total colour (1.43) and
more brightness (21.29%) as compared to Darjeeling best (1.92 and 17.25%).
2.4.2.3. Volatile flavour compounds (VFCs)
The results of fingerprinting with respect to volatile flavour compounds
for season-2 (July-Sept.) are presented in Table 2.5. and figure 2.2. – 2.28. It
is evident from the results that:
1. The total quantity of volatiles are in the range of 2.145 – 18.630 mg / 100 g
of tea sample during this season. Aibheel possesses highest quantity
(18.63 mg%) of total volatiles, where as Nilgiri high grown CTC has lowest
(2.15 mg%). Palampur G1, Parajulie, Nilgiri high grown, Pandiar and
Assam magor contained higher amounts of total volatiles. Content of
phytol is not considered for total volatiles, as it is product derived from
chlorophylls during degradation.
2. Marker for Darjeeling (Medium/Premium) and Nilgiris high grown teas is
absence of β - ionone content and higher content of methyl salicylate (519
- 761 μg / 100g)
3. Darjeeling teas can be marked by lower content of leaf aldehyde (708-736
μg / 100g) and lower to modest content of leaf alcohol (124-522 μg / 100g)
and absence of both heptadienals and traces of nonanal
4. Palampur G1 and Nilgiris HG (non CTC) tea has highest and higher
content of leaf alcohol (2781μg and 728 μg / 100 g) and Nilgiris HG (non
CTC) tea has highest content of linalool (2542 μg / 100g).
137

5. Parajulie and Pandiar can be marked by lowest content of n-hexanal (88 -
95μg / 100g) and either absence or trace of phenyl ethyl alcohol.
6. Assam AFTL and Assam Magor can be marked by lowest content of
hexanal (61-101 μg / 100g) and benzaldehyde (57 - 104 μg / 100g).
7. Assam magor can be marked by highest content of leaf aldehyde
(6024 μg / 100g) and Assam AFTL by lowest content of cis-geraniol (24 μg
/ 100g) and (E,E)-2,4-heptadienal ( 22 μg / 100g), besides above .
8. Aibheel and Chinchula can be marked by highest content of benzaldehyde
(447 and 500 μg / 100g respectively) and highest content of phenyl
acetaldehyde (5609 and 965 μg / 100g) respectively.
9. Aibheel can be marked by highest (27370 μg / 100g) phytol and β - ionone
(902 μg / 100g) content.
10. Aibheel and Chinchula can be characterized by trace of trans-linalool
oxide.
Terpene index, Yamanishi-Botheju ratio and Mahanta ratio for the
volatile flavour compounds are calculated and presented in table 2.5. The
terpene indices of Niligiri high grown, Chinchula, Assam Magor teas are
approaching to unity (0.91 – 0.97) and indicating these to be dominated with
assamica. Remaining teas are found to be hybrids of assamica and sinensis,
from their terpene indices, which is in the range of 0.63- 0.88.
138

139

Table 2.5. Season 2 (July-September)- Black tea samples-volatile flavour compounds (VFC) μ g / 100 g@ Sl. No.
Compound Parajulie Pandiar
Darjeelg.Medium
Darjeel.Premim
AssamAFTL
AssamMagor
Nilgiris HG
Aibheel
Chinch-ula
Palam pur G1
NilgirisHG-CTC
Rose kandy
1 n-hexanal 88 95 232 338 101 61 650 380 182 A 199 128 2 Leaf aldehyde (E2–hexenal) 1307 1150 736 708 406 6024 755 3196 1444 3871 1230 2071 3 Leaf alcohol (Z-3-hexenol) 136 160 522 124 314 118 728 543 140 2781 63 84 4 Trans / cis-2-hexenol A 62 134 A 73 A 192 T T 272 43 48 5 n-hexenol 57 58 A T A 891 272 163 47 565 50 44 6 n-heptanal 85 A 115 120 T T A T 752 147 47 55 7 Benzaldehyde 143 T 315 328 104 57 139 447 500 125 88 31 8 (E,Z)-2,4-Heptadienal T A A A A A A A A 170 A T 9 (E,E)-2,4-Heptadienal 45 A A A 22 A T A A 275 A 11 10 Nonanal 73 A T T A 57 T 250 42 114 A A 11 Phenyl acetaldehyde 600 569 1076 914 783 891 419 5609 965 147 99 797 12 Benzyl alcohol 67 193 229 119 130 A T 1043 131 806 31 T 13 Cis-linalool oxide 77 252 1047 833 192 160 767 359 206 719 20 15 14 Trans-linalool oxide 196 A 1516 1552 0 0 1614 0 0 1745 60 55 15 Linalool 469 869 1510 1838 A 528 2542 1326 500 1313 96 A 16 Phynyl ethyl alcohol T A A 533 556 0 575 2217 0 210 122 17 Alfa-terpineol T T A A A A 617 A A 455 17 10 18 Methyl salicylate 99 314 761 519 146 168 614 1402 292 1495 47 40 19 Cis-Geraniol 170 657 1764 1509 24 66 147 348 40 822 34 20 20 Geranyl acetate T A 302 124 T A T 206 93 181 A A 21 β-lonone 182 A A A T 123 A 902 203 47 6 14 22 Nerolidol T 248 A A A A A A A 453 A 14 23 Phytol* 2164 7245 A A 1768 9009 1386 27370 5572 A 256 589 24 Indole A A A A A A A 239 A T 8 9 25 dihydroactinidiolide A A A A A A A A A A 7 10 Total 3794 4627 10259 9559 2851 9144 10031 18630 5537 16713 2145 3578 Terpene Index 0.81 0.63 0.69 0.73 0.89 0.91 0.97 0.82 0.94 0.82 0.83 0.77 Yamanishi Botheju ratio 0.36 0.75 2.05 2.59 - 0.08 3.36 0.41 0.34 0.33 0.07 - Mahanta ratio 0.56 1.32 2.98 3.61 0.21 0.12 2.07 0.64 0.28 0.68 0.13 0.06 * Phytol is not included in the total volatiles as well as in mahanta ratio (refer results and discussion for details) @Values expressed are mean of three experiments, Where A=Absent, T= Trace
139

140
Darjeeling medium, Darjeeling premium and Nilgiris high grown teas
showed highest Mahanta ratios (2.07–3.61) for VFCs indicating the presence
of more quantities of desirable VFC, which indicate better quality of flavour
during the second season. Pandiar, Parajulie, Palampur G1 and Aibheel teas
showed medium Mahanta ratios (0.56–1.32) indicating moderate quality with
regard to flavour during this season. Chinchula, Assam AFTL, Nilgiris high
grown CTC, Assam Magor and Rosekandy possess lowest mahanta ratio and
indicate flavour is low. Yamanishi-Botheju ratios of these teas also support
the above findings.
2.4.3. Profiling of the tea samples from third season (October-December)
2.4.3.1. Physico Chemical Constituents
The results of the physico-chemical fingerprint for the black tea samples
from season-3 (October-December) are presented in Table 2.6.
The moisture content in teas varied from 2.8 to 7.7% and soluble
caffeine content in tea brews of samples from third season ranged from 1.33
to 4.07%. Aibheel (1.33%) and Chinchula (1.39%) tea brew had lowest and
that of Darjeeling premium (4.07%) had highest soluble caffeine content. Tea
brews from Pandiar (3.94%), Assam BOP (3.92%), Palampur G2 (3.72%),
Kurti (3.54%), Assam AFTL (3.37%) and Parajulie (3.15%), had slightly lower
soluble caffeine contents compared to Darjeeling premium. Tea brews from
Darjeeling Medium (2.96%), Niligiri high grown (2.71%) and Assam Magor
(2.24%) have the moderate soluble caffeine content.
140

141
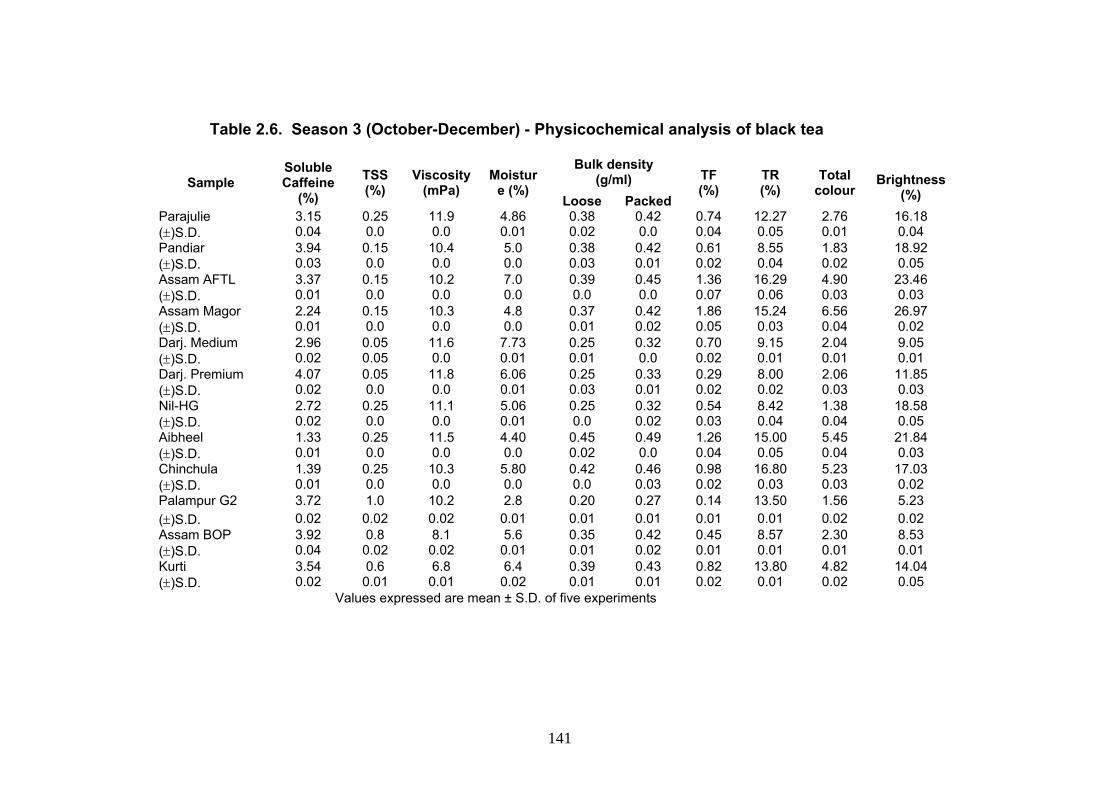
Table 2.6. Season 3 (October-December) - Physicochemical analysis of black tea
Sample Soluble Caffeine
(%) TSS (%)
Viscosity (mPa)
Moisture (%)
Bulk density (g/ml) TF
(%) TR (%)
Total colour
Brightness
(%) Loose Packed Parajulie 3.15 0.25 11.9 4.86 0.38 0.42 0.74 12.27 2.76 16.18 (±)S.D. 0.04 0.0 0.0 0.01 0.02 0.0 0.04 0.05 0.01 0.04 Pandiar 3.94 0.15 10.4 5.0 0.38 0.42 0.61 8.55 1.83 18.92 (±)S.D. 0.03 0.0 0.0 0.0 0.03 0.01 0.02 0.04 0.02 0.05 Assam AFTL 3.37 0.15 10.2 7.0 0.39 0.45 1.36 16.29 4.90 23.46 (±)S.D. 0.01 0.0 0.0 0.0 0.0 0.0 0.07 0.06 0.03 0.03 Assam Magor 2.24 0.15 10.3 4.8 0.37 0.42 1.86 15.24 6.56 26.97 (±)S.D. 0.01 0.0 0.0 0.0 0.01 0.02 0.05 0.03 0.04 0.02 Darj. Medium 2.96 0.05 11.6 7.73 0.25 0.32 0.70 9.15 2.04 9.05 (±)S.D. 0.02 0.05 0.0 0.01 0.01 0.0 0.02 0.01 0.01 0.01 Darj. Premium 4.07 0.05 11.8 6.06 0.25 0.33 0.29 8.00 2.06 11.85 (±)S.D. 0.02 0.0 0.0 0.01 0.03 0.01 0.02 0.02 0.03 0.03 Nil-HG 2.72 0.25 11.1 5.06 0.25 0.32 0.54 8.42 1.38 18.58 (±)S.D. 0.02 0.0 0.0 0.01 0.0 0.02 0.03 0.04 0.04 0.05 Aibheel 1.33 0.25 11.5 4.40 0.45 0.49 1.26 15.00 5.45 21.84 (±)S.D. 0.01 0.0 0.0 0.0 0.02 0.0 0.04 0.05 0.04 0.03 Chinchula 1.39 0.25 10.3 5.80 0.42 0.46 0.98 16.80 5.23 17.03 (±)S.D. 0.01 0.0 0.0 0.0 0.0 0.03 0.02 0.03 0.03 0.02 Palampur G2 3.72 1.0 10.2 2.8 0.20 0.27 0.14 13.50 1.56 5.23 (±)S.D. 0.02 0.02 0.02 0.01 0.01 0.01 0.01 0.01 0.02 0.02Assam BOP 3.92 0.8 8.1 5.6 0.35 0.42 0.45 8.57 2.30 8.53 (±)S.D. 0.04 0.02 0.02 0.01 0.01 0.02 0.01 0.01 0.01 0.01Kurti 3.54 0.6 6.8 6.4 0.39 0.43 0.82 13.80 4.82 14.04 (±)S.D. 0.02 0.01 0.01 0.02 0.01 0.01 0.02 0.01 0.02 0.05
Values expressed are mean ± S.D. of five experiments
141

142

The TSS in the tea brews during third season varied from 0.05 to 1.0%.
Palampur G2 (1.0%), Assam BOP (0.8%) and Kurti (0.6%) had higher TSS in
tea brew. While Parjulie, Nilgiri high grown, Aibheel and Chinchula had
moderate (0.25%) TSS in tea brew; whereas tea brews from Pandiar, Assam
AFTL and Assam Magor had lower TSS of 0.15%. Darjeeling Medium and
premium had lowest TSS (0.05%) in tea brew.
The results for viscosity showed that it had a narrow range of variation
during the third season, ie. 6.80 to 11.90 mPa. Tea brews from Parajulie
(11.9 mPa), Darjeeling premium (11.8 mPa), Darjeeling Medium (11.6 mPa),
Aibheel (11.5 mPa) and Nilgiri high grown (11.1 mPa) had higher viscosities;
whereas tea brews from Pandiar (10.4 mPa), Assam Magor (10.30 mPa),
Chinchula (10.3 mPa), Assam AFTL (10.20 mPa) and Palampur G2 (10.2
mPa) had comparatively lower viscosities. Tea brews from Assam BOP (8.1
mPa) and Kurti (6.8 mPa) had lowest viscosities respectively.
Bulk densities (Loose and compacted or packed) of the tea samples
from third season ranged from 0.20 to 0.45 and 0.27 to 0.49 g/ml respectively.
Aibheel and Chinchula teas can be marked by highest bulk densities (Loose
and compacted) of 0.45 and 0.49 g/ml and 0.42 and 0.46 g/ml respectively,
whereas Darjeeling Medium (0.25 and 0.32), Darjeeling premium (0.25 and
0.33) and Nilgiri high grown (0.25 and 0.33) can be characterized by their
lower bulk densities (g/ml, loose and compacted); Palampur G2 (0.20 and
0.27) can be characterized by the lowest bulk densities (g/ml, loose and
compacted). On the contrary Assam BOP (0.35 and 0.42), Kurti (0.39 and
0.43), Parajulie (0.38 and 0.42), Pandiar (0.38 and 0.42), Assam AFTL (0.39
142
and 0.45) and Assam Magor (0.37 and 0.42) teas had more or less similar
and moderate bulk densities (g/ml, loose and compacted).
2.4.3.2. Theaflavins and Thearubigins
The results of fingerprinting with respect to theaflavins, thearubigins,
total colour and brightness for black tea samples from season-3 (Oct. – Dec.)
are presented in Table 2.6. and figure 2.1.
It is evident from the results that theaflavin (TF) content varied from
0.14% (Palampur G2) to 1.86% (Assam Magor) and thearubigin (TR content)
from 8.0% (Darjeeling premium) to 16.80% (Chinchula). Palampur G2 (0.14%
and 13.50%), Assam BOP (0.45% and 8.57%), Darjeeling premium (0.29%
and 8.00% and Niligiri high grown (0.54% and 8.42%) teas have the lowest
TF and TR contents; whereas Darjeeling Medium (0.70% and 9.15%),
Parajulie (0.74% and 12.27%), Kurti (0.82% and 13.80%) and Pandiar (0.61%
and 8.55%) had the marginally higher TF and TR content. Teas from Aibheel
(1.26% and 15.00%) and Chinchula (0.98% and 16.80%) had further high TF
and TR content; whereas the Assam teas, Assam AFTL (1.36% and 16.29%)
and Assam Magor (1.86% and 15.24%) can be marked by their highest TF
and TR content.
Almost similar trend is observed in the results for total colour and
brightness. Assam Magor (6.56 and 26.97%) and Assam AFTL (4.90 and
23.46%) can be marked by highest colour and brightness followed by Aibheel
(5.45 and 21.84), Chinchula (5.23 and 17.03%) and Kurti (4.82 and 14.04%).
Teas from Palampur G2 (1.56 and 5.23%) had lowest colour and brightness.
Nilgiri high grown (1.38 and 18.58%), Parajulie (2.76 and 16.18%) and
143

Pandiar (1.83 and 18.92%) contained lower colour and moderate brightness.
Assam BOP (2.30 and 8.53%), Darjeeling Medium (2.04 and 9.05%) and
Darjeeling premium (2.06 and 11.85%) have more or less moderate colour
and brightness.
2.4.3.3. Volatile flavour compounds (VFCs)
The results of the fingerprinting with respect to volatile flavour
compounds for season-3 (Oct. – Dec.) are presented in Table 2.7 and figure
2.2 – 2.28. It is clear from the results that
1. The total quantity of volatiles is in the range of 3.30 – 22.61 mg / 100 g
of tea sample during this season. Darjeeling premium and medium
possess highest quantity (22.61 and 18.50 mg% respectively) of total
volatiles, where as Kurti has lowest (3.30 mg %). Palampur G2, Nilgiri
high grown, Assam AFTL, Pandiar and Chinchula contained higher
amounts of total volatiles. Content of phytol is not considered for total
volatiles, as it is product derived from chlorophylls during degradation.
2. Marker for Parajulie is lowest leaf aldehyde content (65 – 85 μg / 100g)
3. Marker for Pandiar is lower leaf alcohol content (150 – 180 μg / 100g)
and lowest (40 – 60 μg / 100 g) benzaldehyde content.
4. Marker for Darjeeling premium is highest linalool content (3201 μg /
100g) and methyl salicylate (2870 – 2900 μg / 100 g) content.
5. Marker for Darjeeling Medium is highest α-terpineol content (2050 –
2090 μg / 100 g) and n-heptanal (620 - 650 μg / 100g) content
6. Marker for Nilgiris high grown is highest n-hexanal (2800-2830 μg /
100g) content.
144

7. Marker for Assam AFTL and Assam magor is the lowest leaf alcohol
(0-20 μg / 100 g) content.
8. Marker for Aibheel is the lower content of geranyl acetate (70 - 90 μg
/100 g).
9. Marker for Chinchula is the lowest (10 -30 μg/100g) content of n -
hexenol.
10. Special marker for Kurti is the presence of Xylene (1375-1425
μg/100g).
11. Markers for Assam BOP are the lowest content of geraniol (0-20 μg /
100 g) and geranyl acetate (0-20 μg / 100 g) content.
Terpene index, Yamanishi-Botheju ratio and Mahanta ratio for the
volatile flavour compounds are calculated and presented in table 2.7. The
terpene index of Aibheel, Assam AFTL, Kurti, Assam BOP and Assam Magor
is approaching unity (0.90 – 0.95) and indicating these to be hybrids
dominated by assamica. Nilgiris high grown, Palampur G2, Chinchula,
Darjeeling premium, Pandiar, Parajulie and Darjeeling Medium teas are found
to be hybrids of assamica and sinensis, from their terpene indices (0.83, 0.80,
0.76, 0.69, 0.69, 0.66 and 0.60 respectively).
145

146

Table 2.7. Season 3 (October - December)- Black tea samples-volatile flavour compounds (VFC) μ g / 100 g@ Sl. No.
Compound Para julie
Pandiar
DarjeelngMedium
DarjeelPremim
AssamAFTL
AssamMagor
NilgirisHG
Aibheel
Chinchula
Palampur G2
Kurti* Assam BOP
1 n-hexanal 362 1133 1227 1175 A 121 2817 A 216 A 31 168 2 Leaf aldehyde (E-2-hexenal) 75 1617 1662 1225 703 1112 413 453 1341 2581 1349 1959 3 Leaf alcohol (Z-3-hexenol) 1978 165 777 300 A 2 1710 90 1084 1890 97 12 4 trans / cis-2-hexenol 233 91 176 110 267 A 382 95 33 244 102 A 5 n-hexenol 68 A 205 830 T T 321 A 22 503 A 43 6 n-heptanal 70 94 633 T 139 92 52 56 T 234 A A 7 Benzaldehyde 66 49 72 145 167 131 78 63 57 165 39 38 8 (E,Z)-2,4-Heptadienal A A A A A A A T 130 323 T A 9 (E,E)-2,4-Heptadienal A A A A A A T 74 178 381 11 T 10 Nonanal A 32 54 T 114 123 A 119 163 129 A A 11 Phenyl acetaldehyde 1285 766 464 715 1106 646 329 696 506 133 1072 378 12 Benzyl alcohol 197 782 158 205 539 379 T 453 367 754 T 24 13 cis-linalool oxide 120 198 4705 5755 1194 821 1565 290 400 503 34 24 14 trans-linalool oxide 360 0 0 0 0 0 0 822 0 1287 105 55 15 Linalool 93 727 906 3201 1106 900 2071 1052 635 851 45 13 16 Phynyl ethyl alcohol A 0 295 1350 A 0 A 0 152 511 200 133 17 α-terpineol A A 2072 T 203 A A A A 285 10 41 18 Methyl salicylate 457 374 658 2885 1241 500 592 1225 295 1257 95 34 19 cis-Geraniol 292 409 3658 3925 128 177 714 138 316 657 15 9 20 Geranyl acetate 118 101 201 A 164 198 A 81 120 201 A 9 21 β-lonone 188 188 176 230 103 77 T 162 A 105 33 18 22 Nerolidol A A 396 560 A A 136 A A 245 26 19 23 Phytol 3009 5075 A A 1361 1102 796 3928 1177 A 1308 493 24 Indole A A A A A A A A A T 10 23 25 dihydroactinidiolide A A A A A A A A A A 24 26 Total 5962 6726 18495 22611 7174 5279 11180 5869 6015 13239 3298 3026 Terpene Index 0.66 0.69 0.60 0.69 0.95 0.90 0.83 0.94 0.76 0.80 0.92 0.91 Yamanishi Botheju ratio 1.24 0.45 0.54 2.61 1.57 0.80 5.01 2.32 0.47 0.33 0.03 0.07 Mahanta ratio 0.41 0.51 2.52 3.61 2.08 1.37 0.78 2.68 0.46 0.64 0.18 0.10 * Phytol is not included in the total volatiles as well as in mahanta ratio (refer results and discussion for details) @ Values expressed are mean of three experiments, Where A = absent, T= trace
* Special marker-Xylene is present upto 1400 µg/100g tea
146

147

79

Darjeeling premium, Aibheel, Darjeeling medium and Assam AFTL teas
showed highest Mahanta ratios (3.61 – 2.09) for VFCs indicating the presence
of more quantities of desirable VFC, which indicate better quality of flavour
during the third season. Assam Magor, Nilgiris high grown, Palampur G2 and
Pandiar teas showed medium Mahanta ratios (1.37 – 0.56) and are moderate
quality with regard to flavour during this season. Chinchula, Parajulie, Kurti
and Assam BOP possess lowest mahanta ratio and indicating flavour is low.
Yamanishi-Botheju ratios of these teas also support the above findings.
2.4.4. Profiling of the tea samples from fourth season (January-March)
2.4.4.1. Physico-chemical Constituents
The results of the physico-chemical analyses for Black Tea Samples
from season-4 (January-March) are presented in Table 2.8.
It is clear from the results that the moisture content of teas varied from
4.6% to 7.1% and soluble caffeine content of the tea samples from fourth
season ranged from 2.03% to 5.28%. Assam Magor (5.28%) had highest
soluble caffeine content followed by Chinchula (5.23%) and Assam AFTL
(4.67%). Darjeeling Premium, Parajulie, Aibheel and Nilgiri high grown have
comparatively moderate quantity (in the range of 3.60-4.50%) of soluble
caffeine content; whereas Pandiar (3.28%) and Darjeeling Medium (3.21%)
have still lower soluble caffeine content. Assam OP, Nilgiris Waynad CTC-
BOP and Annamalai teas had lowest soluble caffeine content (2.03-2.84%).
147

148

Table 2.8. Season 4 (January-March) - Physicochemical analysis of black tea
Sample
Soluble Caffeine
(%)
TSS (%)
Viscosity (mPa)
Moisture (%)
Bulk density (g/ml) TF
(%) TR (%)
Total colour
Brightness(%)
Loose Packed Parajulie 4.16 0.15 12.3 5.13 0.38 0.43 0.83 10.20 2.48 15.43 S.D.(±) 0.02 0.00 0.00 0.02 0.01 0.01 0.02 0.04 0.06 0.05 Pandiar 3.28 0.15 10.60 4.73 0.39 0.43 0.64 7.80 1.91 17.36 S.D.(±) 0.01 0.00 0.00 0.01 0.02 0.02 0.03 0.05 0.05 0.04 Assam AFTL 4.67 0.15 10.3 6.93 0.39 0.43 1.39 16.26 4.55 22.81 S.D.(±) 0.02 0.00 0.06 0.03 0.01 0.01 0.02 0.06 0.04 0.06 Assam Magor 5.28 0.15 10.10 4.67 0.40 0.44 1.77 14.25 6.35 27.94 S.D.(±) 0.02 0.00 0.00 0.02 0.01 0.01 0.04 0.03 0.03 0.03 Darj. Medium 3.21 0.15 11.60 7.07 0.24 0.30 0.61 9.20 2.33 10.11 (±)S.D. 0.01 0.00 0.00 0.02 0.00 0.01 0.03 0.02 0.01 0.01 Darj. Premium 4.50 0.25 12.00 6.40 0.25 0.32 0.39 9.28 2.18 10.87 (±)S.D. 0.02 0.00 0.00 0.00 0.01 0.00 0.02 0.02 0.01 0.02 Nil-HG 3.67 0.15 11.4 4.8 0.33 0.38 0.65 8.94 1.77 15.90 S.D.(±) 0.01 0.00 0.00 0.01 0.01 0.00 0.03 0.03 0.03 0.05 Aibheel 3.88 0.25 11.00 4.80 0.44 0.48 1.50 16.56 6.16 21.78 (±)S.D. 0.01 0.00 0.00 0.00 0.01 0.01 0.04 0.04 0.02 0.01 Chinchula 5.23 0.25 10.60 5.20 0.41 0.45 0.88 15.78 4.10 15.45 (±)S.D. 0.02 0.00 0.00 0.00 0.00 0.01 0.03 0.05 0.02 0.01 Assam OP 2.84 0.6 5.6 5.8 0.24 0.31 0.27 14.56 3.94 2.52 (±)S.D. 0.02 0.01 0.02 0.02 0.03 0.01 0.01 0.03 0.01 0.01 Nil.Wynad CTC-BOP 2.03 0.4 6.2 6.0 0.41 0.47 0.75 12.69 3.60 16.61 (±)S.D. 0.01 0.01 0.01 0.03 0.02 0.01 0.03 0.01 0.01 0.03 Annamalai 2.78 0.4 4.8 4.6 0.43 0.49 0.64 11.83 3.49 10.24 (±)S.D. 0.01 0.01 0.02 0.01 0.01 0.02 0.01 0.01 0.02 0.02
Values expressed are mean ± S.D. of five experiments
148

149
Tea brews of Assam OP, Nilgiris Waynad CTC-BOP and Annamalai
teas had the highest total soluble solids content (0.4-0.6%) compared to
Darjeeling Premium, Aibheel and Chinchula which have the higher total
soluble solids (0.25%) content; whereas tea brews from Parajulie, Pandiar,
Assam AFTL, Assam Magor, Darjeeling Medium and Nilgiri high grown have
the lowest total soluble solids (0.15%) content.
The results for viscosity of tea brews ranged between 4.8 and 12.3
mPa. Parajulie (12.30 mPa) and Darjeeling Premium (12.0 mPa) had highest
viscosities. Darjeeling Medium (11.60 mPa), Nilgiri high grown (11.40 mPa)
and Aibheel (11 mPa), have higher viscosities. Pandiar, Chinchula, Assam
AFTL and Assam Magor had moderate viscosity in the range of 10.60-10.00
mPa. Assam OP, Nilgiris Waynad CTC-BOP and Annamalai teas had the
lowest (4.80 -6.20 mPa) viscosities.
Darjeeling Medium (0.24 and 0.30 g/ml), Darjeeling Premium (0.25 and
0.32 g/ml), Assam OP (0.24 and 0.31 g/ml) and Nilgiri high grown (0.33 and
0.38) have the lowest bulk densities (Loose and packed). Aibheel (0.44 and
0.48 g/ml), Chinchula (0.41 and 0.45 g/ml), Nilgiris Waynad CTC-BOP (0.41
and 0.47 g/ml) and Annamalai teas (0.43 and 0.49 g/ml) had the highest bulk
densities (Loose and compacted). On the contrary Assam AFTL (0.39 and
0.43 g/ml), Assam Magor (0.40 and 0.44 g/ml), Pandiar (0.39 and 0.43 g/ml)
and Parajulie (0.38 and 0.43 g/ml) had more or less same and moderate bulk
densities (loose and packed).
149

2.4.4.2. Theaflavins and Thearubigins
The results of fingerprinting of theaflavins, thearubigins, total colour
and brightness for black tea samples from season-4 (January-March) are
presented in Table 2.8 and figure 2.1.
It is clear from the results that the TF and TR contents of the tea
samples from fourth season (January-March) ranged between 0.27-1.77%
and 7.80-16.56% respectively. Assam Magor (1.77 and 14.25%), Assam
AFTL (1.39 and 16.26%) and Aibheel (1.50 and 16.56%) teas can be marked
by highest TF and TR contents. Nilgiris Waynad CTC-BOP, Parajulie and
Chinchula have comparatively moderate quantities for TF (0.75, 0.83, 0.88%)
and TR (12.69, 10.20, 15.78%) respectively. Darjeeling Premium, Darjeeling
Medium, Annamalai and Nilgiri high grown, can be marked by lower values of
TF (0.39, 0.61, 0.64, 0.65 %) and TR (9.28, 9.20, 11. 83, 8.94, %)
respectively. Assam OP tea had the lowest TF (0.27%) of all teas and
moderate content of TR (14.56%). Pandiar tea had the lowest TR (7.80%) of
all teas and moderate content of TF (0.64%).
Total colour varied in the range of 1.77-6.35 and brightness varied in the
2.52-27.94%. Not only for TF and TR but also for total colour and brightness
the three teas viz., Assam Magor - 6.35 and 27.94%; Assam AFTL - 4.55 and
22.81%; and Aibheel 6.16 and 21.78% showed the presence of higher values.
Assam OP had showed the lowest brightness (2.52%) and moderate colour
(3.94), where as Nilgiri high grown and Pandiar showed lowest colour (1.77
and 1.91 respectively) and moderate brightness (15.90 and 17.36%
respectively). Parajulie, Nilgiris Waynad CTC-BOP and Chinchula have
150

comparatively moderate values for total colour (2.48, 3.60 and 4.10) and
brightness (15.43, 16.61 and 15.45%) respectively. Although, Annamalai teas
has moderate total colour (3.49) the brightness (10.24 %) is lower. Darjeeling
Medium and Darjeeling Premium can be marked by comparatively lower
values of total colour (2.33 and 2.18) and brightness (10.11 and 10.87 %)
respectively.
2.4.4.3. Volatile flavour compounds
The results of the fingerprinting with respect to volatile flavour
compounds for black tea samples from season-4 (January-March) are
presented in Table 2.9 and figure 2.2. – 2.28.
It is clear from the results obtained for fingerprinting of volatile flavour
compounds that
1. The total quantity of volatiles are in the range of 1.8 – 61.49 mg / 100 g of
tea sample during this season. Nilgiri high grown possesses highest
quantity (61.49 mg %) of total volatiles, where as Assam OP has lowest
(1.8 mg%).
Darjeeling Medium and Premium, Parajulie and Pandiar teas contained
higher amounts of total volatiles. Content of phytol is not considered for total
volatiles, as it is product derived from chlorophylls during degradation.
2. Marker for pandiar is highest (1700-1720 μg / 100 g) content of n-hexanal.
3. Marker for Darjeeling medium is highest (3800-3900 μg / 100 g) content of
linalool.
4. Marker for Annamalai is lowest (30 – 50 μg / 100 gm) content of n –
hexanal and leaf alcohol (18 μg / 100 gm).
151

5. Marker for Assam AFTL is lower (200 μg / 100 g) content of leaf alcohol.
6. Marker for Assam magor is the highest (11840 –11880 μg / 100 g) content
of phytol.
7. Marker for Nilgiris highgrown is the highest content of leaf aldehyde (17480
a. 17520 μg / 100 g), phenyl acetaldehyde (2850 –2890 μg / 100 g) and
the phenyl ethyl alcohol (7410 – 7450 μg / 100 g).
8. Markers for Aibheel are the lowest contents of trans/cis –2-hexenol (10 –30
μg / 100 g), n – heptanal (15 – 35 μg / 100 g) and nonanal (25 –65 μg / 100
g)
9. Marker for chinchula is the lowest (245 –285 μg / 100 g) content of leaf
aldehyde.
152

153

Table 2.9. Season 4 (January - March)- Black tea samples-volatile flavour compounds (VFC) μ g / 100 g@
Sl. No. Compound Para
julie Pandiar
DarjeelMedium
DarjeelPremium
AssamAFTL
Assam Magor
NilgiriHG
Aibheel
Chinchula
AssamOP
Anamalai
NilgirisWaynad
1 n-hexanal 1259 1707 A 507 A A 1333 1066 1399 T 35 A 2 Leaf aldehyde (E2–hexenal) 2108 2457 1197 1467 1435 1026 17500 533 265 434 889 1581 3 Leaf alcohol (Z-3-hexenol) 238 344 1094 667 200 90 1893 81 146 94 18 51 4 Transicis-2-hexenol 62 T 175 180 96 A 5190 21 253 A A A 5 n-hexenol A 165 491 A A A 1440 T A A 15 79 6 n-heptanal 96 125 111 153 300 276 2357 25 280 A 55 A 7 Benzaldehyde 117 T 20 300 127 82 440 131 122 104 35 62 8 (E,Z)-2,4-Heptadienal A A A A A A A A A A 5 8 9 (E,E)-2,4-Heptadienal 151 122 149 333 119 A 428 72 A 7 9 14 10 Nonanal 117 T 308 313 211 194 452 45 A A A A 11 Phenyl acetaldehyde 1352 793 1440 1780 1327 750 2869 908 908 382 355 350 12 Benzyl alcohol 605 518 684 167 A A 2107 221 299 37 31 T 13 Cis-linalool oxide 654 558 2624 2827 1108 534 9917 468 582 31 28 22 14 Trans-linalool oxide 5141 5393 79 89 89 15 Linalool 1513 1357 3850 1873 1138 655 A 762 875 19 256 438 16 Phynyl ethyl alcohol A 1513 A A 7429 A A 365 256 408 17 Alfa-terpineol A A A A A A 3702 A A 36 26 36 18 Methyl salicylate 413 457 1739 2273 373 202 1238 216 329 36 25 41 19 Cis-Geraniol 639 698 4158 3120 A A 1667 131 A 18 74 149 20 Geranyl acetate 346 113 145 A 177 A A 21 A 19 8 7 21 β-lonone 417 271 222 380 181 276 1524 138 134 33 52 44 22 Nerolidol A A A A A A A A A 27 19 29 23 Phytol 799 5628 3205 3407 7285 11858 A 3101 8598 A 443 888 24 Indole A A A A A A A A A 23 10 11 25 Dihydroactinidiolide A A A A A A A A A 68 22 43 Total 10087 9685 25061 21733 6792 4085 61486 4839 5592 1805 2312 3462 Terpene Index 0.77 0.73 0.73 0.76 1.0 1.0 0.85 0.90 1.0 0.88 0.83 0.79 Yamanishi Botheju ratio 0.72 0.55 3.22 1.28 0.79 0.64 - 1.43 3.30 0.04 0.29 0.27 Mahanta ratio 0.86 0.61 4.55 3.47 1.05 0.88 0.54 0.77 0.65 0.52 0.54 0.48 * Phytol is not included in the total volatiles as well as in mahanta ratio (refer results and discussion for details) @ Values expressed are mean of three experiments, Where A = absent, T= trace
153

154
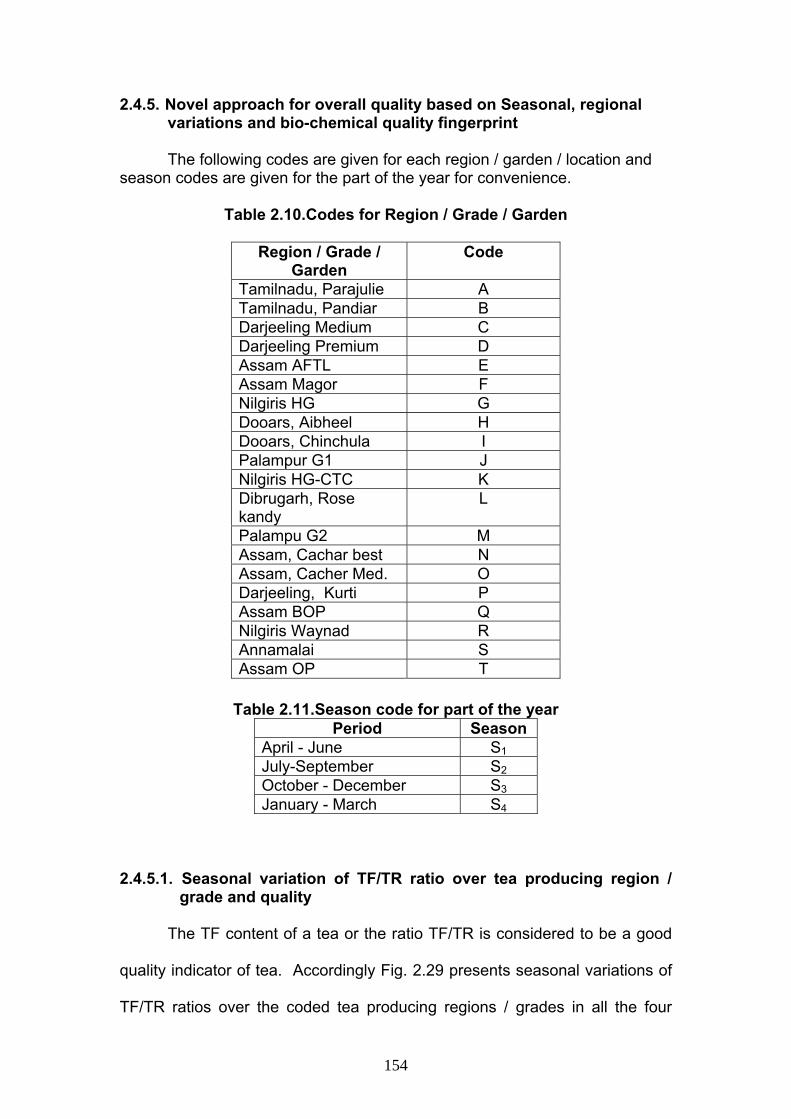
2.4.5. Novel approach for overall quality based on Seasonal, regional variations and bio-chemical quality fingerprint
The following codes are given for each region / garden / location and season codes are given for the part of the year for convenience.
Table 2.10.Codes for Region / Grade / Garden
Region / Grade / Garden
Code
Tamilnadu, Parajulie A Tamilnadu, Pandiar B Darjeeling Medium C Darjeeling Premium D Assam AFTL E Assam Magor F Nilgiris HG G Dooars, Aibheel H Dooars, Chinchula I Palampur G1 J Nilgiris HG-CTC K Dibrugarh, Rose kandy
L
Palampu G2 M Assam, Cachar best N Assam, Cacher Med. O Darjeeling, Kurti P Assam BOP Q Nilgiris Waynad R Annamalai S Assam OP T
Table 2.11.Season code for part of the year
Period Season April - June S1 July-September S2 October - December S3 January - March S4
2.4.5.1. Seasonal variation of TF/TR ratio over tea producing region /
grade and quality The TF content of a tea or the ratio TF/TR is considered to be a good
quality indicator of tea. Accordingly Fig. 2.29 presents seasonal variations of
TF/TR ratios over the coded tea producing regions / grades in all the four
154

seasons (s1, s2, s3, s4). Teas having TF/TR ratios upto 0.04, >0.04-0.08 and
>0.08 can be considered to be good, better and best quality indicator of tea
quality respectively. Teas from the region/grade A-I are the better (TF/TR
ratios >0.04-0.08) to best (TF/TR ratios >0.08) quality teas over all the four
seasons except for the teas from region A, C, D (s1), which fall under good
quality category considering their TF/TR ratios (upto 0.04).
Also the teas from region/grade K-L (s2), region N, O (s1), region PQ
(s3) and region RS (s4) are the better (TF/TR ratios >0.04-0.08) quality teas
except for the teas from region J (s2), M(s3) and T(s4) teas, which fall under
good quality category considering their TF/TR ratios (upto 0.04).
The teas from region/grade JKL (s1, s3), M –T (s2), ORST (s3), MP (s1),
Q (s4) are also falling under good quality category teas, considering their
TF/TR ratios (upto 0.04).
2.4.5.2. Seasonal variation of sum of Yamanishi-Botheju and Mahanta
ratio over tea producing region/grade and tea quality The VFC (Volatile Flavour Compounds) content of a tea or the sum of
the VFC ratios (Yamanishi-Botheju ratio and Mahanta ratio) is considered to
be a good quality indicator of tea. Accordingly Fig. 2.30 presents seasonal
variations of or the sum of the VFC ratios (Yamanishi-Botheju ratio and
Mahanta ratio) over the coded tea producing regions / grades in all the four
seasons (s1, s2, s3, s4). Accordngly based on the sum of the VFC ratios
(i.e.Yamanishi-Botheju ratio and Mahanta ratio) the teas can be categorized
as a good (upto 1), better (>1-4) and best (>4) quality indicator of tea
respectively.
155

The teas from regions/grade A-J (all seasons) have better (>1-4) to
best (>4) quality as indicated by sum of the VFC ratios (i.e.Yamanishi-Botheju
ratio and Mahanta ratio) except for teas from regions/grade AEFHIJ(s2),K-T
(s2), BDFHIJ(s1), BIJ(s3) which are good (upto 1) quality teas, as indicated by
sum of the two VFC ratios. Also the teas from regions/grade M (s3), O (s1), P
(s3), RST (s4) are good (upto 1) quality teas as indicated by sum of the two
VFC ratios.
2.4.5.3 Seasonal variation of Borse-Rao quality index over tea producing
region/grade and tea quality
The sum of TF/TR ratios of tea and the sum of the VFC ratios
(Yamanishi-Botheju ratio and Mahanta ratio) added together is proposed for
the first time as a new and novel quality index, hence forth referred to as
Borse-Rao quality index, considered to be an overall quality indicator of tea as
both the non-volatiles/volatiles are given due consideration in this quality
index. Accordingly Fig. 2.31 presents seasonal variations of the Borse-Rao
quality index over the coded tea producing regions / grades in all the four
seasons (s1, s2, s3, s4). Accordingly based on the the Borse-Rao quality index
teas can be categorized as good (upto 1), better (>1-4) and best (>4) quality
tea respectively.
The teas from regions/grade having Borse-Rao quality index more than
four are C (s2, s4), D (s3, s4), G (s1, s2, s3), H (s3) and I (s4) are the best (>4)
quality teas.
The teas from regions/grade having Borse-Rao quality index ranging
from one to four are A (s1, s2, s3, s4), B (s2, s3, s4), C (s1, s3), E( s3, s4), F( s3, s4),
156

H (s2, s4), I (s3, s4), J(s2), M (s3) and RS (s4) and indicate that these are better
(>1-4) quality teas.
The rest of the teas from regions/grade having Borse-Rao quality index
upto one are good quality teas which are BDFH (s1), EF (s2), I (s1, s2), JKL
(s3), K-T (s2) and P-T (s3).
0
0.02
0.04
0.06
0.08
0.1
0.12
0.14
A B C D E F G H I J K L M N O P Q R S T
Tea producing region/grade
TF/T
R v
alue
s Season 1Season 2Season 3Season 4
Fig. 2.29. Seasonal variation of TF/TR ratio over tea producing region/grade
0
1
2
3
4
5
6
7
8
9
A B C D E F G H I J K L M N O P Q R S T
Tea producing region/grade
Sum
of Y
aman
ishi
-Bot
heju
rat
io &
Mah
anth
a ra
tio
Season 1Season 2Season 3Season 4
Fig. 2.30. Seasonal variation of sum of Yamanishi-Botheju and Mahantha ratio
over tea producing region/grade
157

0
1
2
3
4
5
6
7
8
9
A B C D E F G H I J K L M N O P Q R S T
Tea producing region/grade
Bor
se/R
ao Q
ualit
y In
dex
valu
es
Season 1Season 2Season 3Season 4
Fig. 2.31. Seasonal variation of Borse-Rao quality index over tea producing region/grade
158

2.5. Bibliography
Adams, R.P., Identification of essential oil components by gas chromatography /quadrupole mass spectroscopy, p 41-442, Allured Publishing Corporation, Illinois, USA (2001). Aisaka, H., Kosuge, M. and Yamanishi, T. Comparison of the flavour of Chinese ‘Keemum’ black tea and ceylone black tea. Agriculture and Biological Chemistry 42, 2157-2159 (1978). AOAC International Official Methods of Analysis, Estimation of moisture, 17th edition Dr. William Horwitz,Editior, vol.2, Chapter 30 , p.12 (2000a). AOAC International Official Methods of Analysis, 17th edition Dr. William Horwitz, Editior, vol.2, Chapter 44, p.3. (2000b). AOAC International Official Methods of Analysis, Water extract of tea. 17th edition Dr. William Horwitz, Editior, vol.2, Chapter 30, p.12 (2000c). Bailey, R.G.; Nursten, H.E. and McDowell, I., Comparative study of the reversed-phase high-performance liquid chromatography of black tea liquors with special reference to thearubigins. J. Chromatography, 542, 115-128 (1991). Bala Subramaniam In ‘Tea in India’, Publication and Information Directorate, CSIR, and Wiley Eastern Ltd., New Delhi, India (1995). Baruah, S., Hazarika, M., Mahanta, P.K., Horita, H. and Murai, T. Effect of plucking intervals on the chemical constituents of CTC black teas. Agric. Biol. Chem., 50, 1039-1041 (1986). Balentine, D. A., Wiseman, S. A., and Bouwens, L. C. M. The chemistry of tea flavonoids. CRC Critical Reviews in Food Science and Nutrition, 37, 693 -704 (1997). Berkowitz J.E.; Coggon P. and Sanderson G.W. Formation of epitheaflavic acid and its transformation to thearubigins during tea fermentation. Phytochemistry, 10, 2271-2278 (1971). Biswas, A.K. and Biswas, A.K. Biological and chemical factors affecting the valuations of North-East Indian plains teas: II. Statistical evaluation of the biochemical constituents and their effects on briskness, quality, and cash valuations of black teas. J. Sci. Food. Agric, 22, 196-204 (1971). Biswas, A.K., Sankar A.R. and Biswas, A.K. Biological and chemical factors affecting the valuations of North-East Indian plains teas: III. Statistical evaluation of the biochemical constituents and their effects on colour, brightness and strength of black teas. J. Sci. Food. Agric, 24, 1457-1477 (1973).
159

Bokuchava M.A. and Skobeleva N.I., The biochemistry and technology of tea manufacture. CRC Rev. Food Sci. Nutrition, 12, 303-370 (1980). Brown A.G., Eyton W.B., Holmes A. and Ollis W.D., The identification of thearubigins as polymeric proanthocyanidins. Phytochemistry, 8, 2333 (1969). Cloughley, J.B., Ellis, R.T., Pelnlington, S., and Humphrey, P. Volatile constituentls of some Central Africa Black-tea clones. Journal of Agriculturle and Food Chemistry, 80, 842-84. (1982). Davies, W. Gas chromatographic retention indices of monoterpenes and sesquiterpenes on methyl silicone and carbowax 20 M phases. Journal of Chromatography, 503 (1) (1990). Dreosti, I. E., Wargovich, M. J., and Yang, C. S. Inhibition of carcinogenesis by tea: the evidence from experimental studies . CRC Critical Reviews in Food Science and Nutrition, 37, 761-770 (1997). Fernando, V. and Roberts G.R. The effect of process parameters on seasonal development of flavour in black tea. Journal of the Science of Food and Agriculture 30, 71-76 (1984). Finger, A., Kuhr, S., and Engelhardt, U. H. Chromatography of tea constituents. Journal of Chromatography, 624, 293 - 315 (1992). Gianturco, M.A., Biggers, R.E. and Ridling, B.H. Seasonal constituents of black tea. A numerical approach to the correlation between composition and quality of the aroma. Journal of Agriculture and Food Chemistry 22, 758-764 (1974). Gulati, A., and Ravindranath, S. D. Seasonal variation in quality of Kangra tea [Camellia sinensis (L.) O. Kuntze] in Himachal Pradesh. Journal of the Science of Food and Agriculture, 71, 231-236 (1996). Gulati, A., Tamang, M. B., and Ravindranath, S. D. Clonal variation in quality related biochemicals in Kangra tea [Camellia sinensis (L.) O. Kuntze]. Journal of Plantation Crops, 27, 175-178 (1999). Hanan Y. M. Q., Salmah Y., Azizah O. and Russly A.R. Physico-chemical changes in sugarcane (Saccharum officinarum var. yellow cane) and the extracted juice at different portions of the stem during development and maturation. Food Chemistry, 75, 131-137 (2001). Howard, G.E. The volatile constituents of tea. Food Chemistry, 4, 79-106 (1978). Indian Standards Specifications for tea First revision, IS : 3633-1972. Indian Standards Institution (now BIS) New Delhi (1973)
160
Jennings, W. and Shibamoto, T. Qualitative analysis of flavour and fragrance volatiles by glass capillary gas chromatography, p.29, Academic Press, New York (1980). Likens, S.T., and Nickerson, G.B., In Proceedings of the American Society for Brewery Chemists, 5, 5 -13. (1964). Mahanta, P.K., Baruah, S., Owuor, P.O. and Murai, T. Flavour volatiles of Assam CTC black teas manufactured from different plucking standards and orthodox teas manufactured from different altitudes of Darjeeling. J. Sci. Food Agric., 45, 317-324 (1988). Mahanta, P.K. Color and flavour characteristics of made tea. In Linskens, H.F. et al. (eds.) Modern Methods of plant Analysis. New series volume 8. Springer, Berlin, pp. 220-295. (1988) Motoda, S. Formation of aldehydes from amino acids by polyphenol oxidase.Journal of Fermentation Techonology , 57, 395-399 (1979). Owuor, P.O. and Obanda M. The changes in black tea quality due to variations of plucking standard and fermentation time. Food Chem. 61(4) 435-441 (1998). Owuor, P.O., Horita, H., Tsushida, T. and Murai, T. Comparison of the chemical composition of black teas from main black tea producing countries of the world. Tea, 7(2), 71-78 (1986). Pura Naik, J. and Nagalakshmi, S. Determination of caffeine in tea products by an improved high-performance liquid chromatography method. Journal of Agriculture and Food Chemistry, 45, 3973-3975 (1997). Ramadurai, N. Global trade trends in tea. Planters Chronical. December 2000, 537. (2000). Ramaswamy, V. An instrument for determining the free flow bulk density of black tea. The Planters Chronical, 90, 323-325. (1995). Ranganath, S.R., Marimuthu, S. and Raju, K. Effect of withering processes on biochemical composition and green leaf quality aspects of black tea [Camellia sinensis (L.) O. Kuntze]. Journal of Plantation Crops, 22, 36-43. (1994). Roberts E.A.H., in T.A. Geissman (Editor), Chemistry of flavonoid compounds, Pergamon, Oxford. P. 468 (1962). Roberts E.A.H. and Smith R.F. The phenolics of manufactured teas – spectrophotometric evaluation of tea liquors. J. Sci. Food Agric., 14, 687-700. (1963)
161

Sanderson G.W. The chemistry of tea and tea manufacturing. Recent Adv. Phytochem., 5, 247 (1972). Takeo, T. and Mahanta, P.K. Comparison of black tea aromas of orthodox and CTC tea and of black tea made from different varieties. Journal of the Science of Food and Agriculture, 34, 307-310. (1983). Tijburg, L. B. M., Mattern, T., Folts, J. D., Weisgerber, U. M. and Katan, M. B. Tea flavonoides and cardiovascular diseases: a review. CRC Critical Reviews in Food Science and Nutrition, 37, 771 -785. (1997). Ullah, M.R., Gogoi, N., and Baruah, D. The effect of withering on fermentation of tea leaf and development of liquor characters of black tea. Journal of the Science of Food and Agriculture, 35, 1142-1147. (1984). Ullah, M.R. A reappraisal of withering process in black tea manufacture 1. Physical and Chemical withers and their effects on tea liquors. Two and a Bud, 31, 24-27. (1984). Ullah, M.R. Aroma constituents of Assam and China hybrid teas and their manifestation during tea processing. Two and a Bud, 32, 60-62. (1985). Ullah, M.R. A rapid procedure for estimating theaflavins and thearubigins of black tea. Two and a Bud. 33, 46-48. (1986). Wickremasinghe R. L. Tea. Adv. Food Res., 24, 229(1978), Wickremasinghe R. L., Wick, E. L. and Yamanishi, T. Gas chromatographic-mass spectrometric analysis of flavoury and non- flavoury Ceylon black tea aroma concentrates prepared by different methods. Journal of chromatography 79:75-80. (1973). Wiseman, S. A., Balentine, D. A., and Frei, B. Antioxidants in tea. CRC Critical Reviews in Food Science and Nutrition, 37, 705 -718. (1997). Yamanishi, T., Kobayashi, A.H., Uchida, A., Mori, S. Ohsawa and Sasakura, S. Flavour of black tea V. Comparison of various types of black tea. Agricultural and Biological Chemistry, 32, 379-386. (1968). Yamanishi, T., Wickremasinghe, R.L. and Perera, K.P.W.C. Studies on flavour and quality of tea.3. Gas chromatographic analysis of aroma complex. Tea Quarterly 39, 81-86. (1978). Yamanishi,T. Aroma of various teas. Proceedings of a Conference Sponsored by the Agricultural and Food Chemistry Division of the American Chemical society, Athens, Greece, June 27-29. (1978). Yamanishi,T. Tea, coffee and cocoa. In Flavour Research Recent Advances, Chapter 8 (Eds R. Teranichi, F.A. Flath and H. Sugusawa. New York and Basel : Marcel Dekker. (1981).
162
163
Yamanishi,T., Botheju, W.S. and De Silva, J.M. An index for assessing the quality of Uva seasonal black tea. Sri Lanka J. Tea Sci. 58, 40-49 (1989). Yang, C. S. and Wang, Z. Y. Tea and cancer. Journal of the National Cancer Institute, 85, 1038 -1049. (1993). Yang, G., Liao, J., Kim, K., Yurkow, E. J., and Yang, C. S. Inhibition of growth and induction of apoptosis in human cancer cell lines by tea polyphenols. Carcinogenesis, 19, 611- 616. (1998).
CHAPTER 3
FUNCTIONAL INGREDIENTS FROM UNUSED GREEN TEA LEAVES: ACTIVITY AND APPLICATIONS
3.1. INTRODUCTION
Green tea is one of the most popular and widely consumed beverages
in Japan and China since several centuries. Drinking tea is a culture by itself
and is performed as tea ceremony in these countries. The characteristic
aroma of a green tea is an important attribute which determines its
acceptability coupled with the other attributes such as colour, taste and
appearance. These attributes are governed by the source and quality of tea
leaves used besides the method of processing. The typical process of green
tea manufacture includes pan firing or steaming by which the inactivation of
the enzymes in tea is achieved while retaining the green colour. In general,
Japanese process uses steaming whereas Chinese process uses pan firing
resulting in green teas with characteristic aroma, taste and colour attributed to
the respective processing method. A number of volatile compounds in green
tea have been identified.
Tea is one of the widely used beverages. Green teas and their extracts,
which consist of polyphenols (principally catechins) possess lot of health
benefits (i.e., prevention of hypertension, cardiovascular diseases, dental
caries and some types of cancer; strengthening the walls of blood vessels and
regulating their permeability). Tea is also a foreign exchange earning
commodity for our country. However, in the recent years, the prices for Indian
CTC teas are decreasing due to various reasons such as low quality and
competition from other countries. There is a need for research / study to find
164

out alternate uses and value added products, besides utilizing the tea agro
waste. In this context, attempts are being made to utilize the coarse and
pruned teas leaves for the purpose of preparation of green teas and their
conserves.
Tea obtained from processed shoots of Camellia sinensis is one of the
most popular non-alcoholic beverages in the world. The shoots, consisting of
the tender apical bud and subtending two leaves, are processed to give the
tea beverage. The main constituents, catechins, which constitute up to 30%
on a dry weight basis (Millin, 1987), possess medicinal properties, namely,
antioxidative, anticancerous, and antibacterial (Matsuzaki and Hara, 1995;
Ding et al, 1992, Jankun et al, 1997, Yang, 1997). The main compounds
present in tea leaves are (-)-epigallocatechin gallate (EGCG), (-)-
epigallocatechin (EGC), (-)-epicatechin gallate(ECG), (-)-epicatechin (EC),
(+)-gallocatechin gallate (GCG), (+)-gallocatechin (GC), and (+)-catechin (C).
During the green tea manufacturing process, some of the catechins undergo
isomerization at the C-2 position of flavan-3-ol. For example, (-)-EGCG, (-)-
EGC, (-)-ECG, and EC isomerize to (+)-GCG, (+)-GC, (+)-catechin gallate
(CG), and (+)-C, respectively. These catechins, belonging to the flavanol
group of phenols, remain un-oxidized in the green tea, as the enzymes are
deactivated during the processing.
An antioxidant can be defined as any substance that when present at
low concentration compared to that of substrate significantly delays or inhibits
the oxidation (Precival, 1998). Green tea extracts are powerful antioxidants,
mainly due to the presence of the above flavanols (Salah et al, 1995; Zandi
and Gordon, 1995). These compounds are believed to have physiological
165

effects by acting as free radical scavengers, which are generated by
metabolic pathways within body tissue or introduced by external sources such
as foods, drugs, and environmental pollutants (Salah, et al 1995; Zhao, et al
1989; Quartley et al, 1994). Tea catechins are effective scavengers of free
radicals and catechins having a galloyl moiety at C-3 (Rice-Evans and Miller,
1996) and a tri-hydroxy structure in ring B (Nanjo et al, 1996) are more
effective. Chlorophyll present in organic extract from green tea also affects
the antioxidant activity of the extracts (Gutierrez Rosales et al, 1992).
Besides these, caffeine, theophylline, and theobromine are the main methyl
xanthines constituting the tea alkaloids and are important factors in
determining the quality of green teas. Many epidemiological and preclinical
studies strongly suggest that drinking green tea may lower the risks of cancer
and cardiovascular disease. Moreover, other health beneficial effects
including anti-inflammation and anti-obesity were reported (Dreosti et al,
1997, Tijburg et al, 1997). Despite several reports on the radical scavenging
activity of green tea from two leaves and a bud, the radical scavenging activity
of green tea from coarse and pruned leaves in particular is not studied, and
this material is presently being used as compost. The pruned and coarse tea
leaves are tea plantation waste, after using up the two leaves and bud which
are used for the manufacture of various types of teas. A huge quantity of this
waste is available in India for value addition, because India is one of the
largest producers of tea. Therefore, testing of its radical scavenging properties
is of interest primarily in order to find new promising sources for natural
antioxidants for functional foods and nutraceuticals as well as utilization of
plantation waste. Use of natural antioxidants as food additives for inactivating
166
free radicals has received much attention recently due to the health
consciousness of recent generations, as these consumers are more exposed
to environmental pollutants such as those released from various types of
vehicles and industries. The present chapter describes the preparation of
green teas from the pruned or coarse tea leaves and optimization of
extraction conditions to obtain radical scavenging conserve (Jagan Mohan
Rao et al, 2005). Here, this waste (unused tea leaves) was also utilized to
prepare the catechin rich conserve, and its radical scavenging activity was
evaluated. The radical scavenging activities of these conserves are evaluated
using the DPPH model system, and the results are presented along with the
HPLC profiles of the active conserves for identification and quantification of
composition. The nutraceutical characteristics of the polyphenols of
coarse/pruned (low-grade) tea leaves were carried out with the following
objectives.
To isolate active conserves from coarse and pruned green tea leaves.
To use the active conserves for food applications
3.2. MATERIALS AND METHODS 3.2.1. Chemicals and Reagents
The analytical grade solvents (viz., methanol, ethyl acetate, and formic
acid), Folin-Ciocalteu’s reagent, and sodium carbonate were procured from
Merck (India). Tea catechins [viz., (+)-catechin (Cat, 98%), (+)-epicatechin
(EC, 98%), (-)-epigallocatechin (EGC, 98%), (-)-epicatechin gallate (ECG,
98%, (-)-epigallocatechin gallate (EGCG, 95%), (-)-gallocatechin gallate
(GCG, 98%)], alkaloids [viz., theophylline (TP, 98%), theobromine (TB, 98%),
167

caffeine (C, 99%), gallic acid, and 1,1-di-phenyl-2-picrylhydrazyl radical
(DPPH) were procured from Sigma-Aldrich Chemical Co (St. Louis, MO,
USA).
3.2.2. Plant Material Coarse, pruned (low grade) and normal green tea leaves were
collected from a tea estate in the Nilgiri-waynad region (Tamilnadu, India).
Normal (control) leaves are plucked as one bud and two leaves from the tea
plant, whereas coarse material comprised the remaining leaves of the shoot.
3.2.3. Moisture
The amount of moisture in the tea samples was measured using a
vacuum oven (ISO 1573, 1980) to confirm the drying process to a moisture
content of 4-6%. The samples were dried (70°C, 100 mm Hg, 6-7 hr.) to a
constant weight and loss in weight (moisture) was calculated and reported as
percentage moisture content.
3.2.4. Enzyme Inactivation
Enzymes (including polyphenol oxidase) of the fresh tea leaves were
inactivated immediately by drying using two different kinds of dryers, namely,
crossflow and infrared dryers, having different drying conditions (Borse, et al.
2004, 2005). Pruned, normal and coarse fresh tea leaves were procured and
subjected to enzyme inactivation using cross flow dryer (CFD), Precision
products, Vatva, Ahemadabad, India (CFD; 80-120oC, 4 – 8h; (Fig.3.1) and
continuous infra red dryer (IRD), designed and developed at CFTRI, Mysore,
India (IRD; 70-120oC, 0.5-1.5h; Fig.3.2) at different temperature and time
intervals.
168
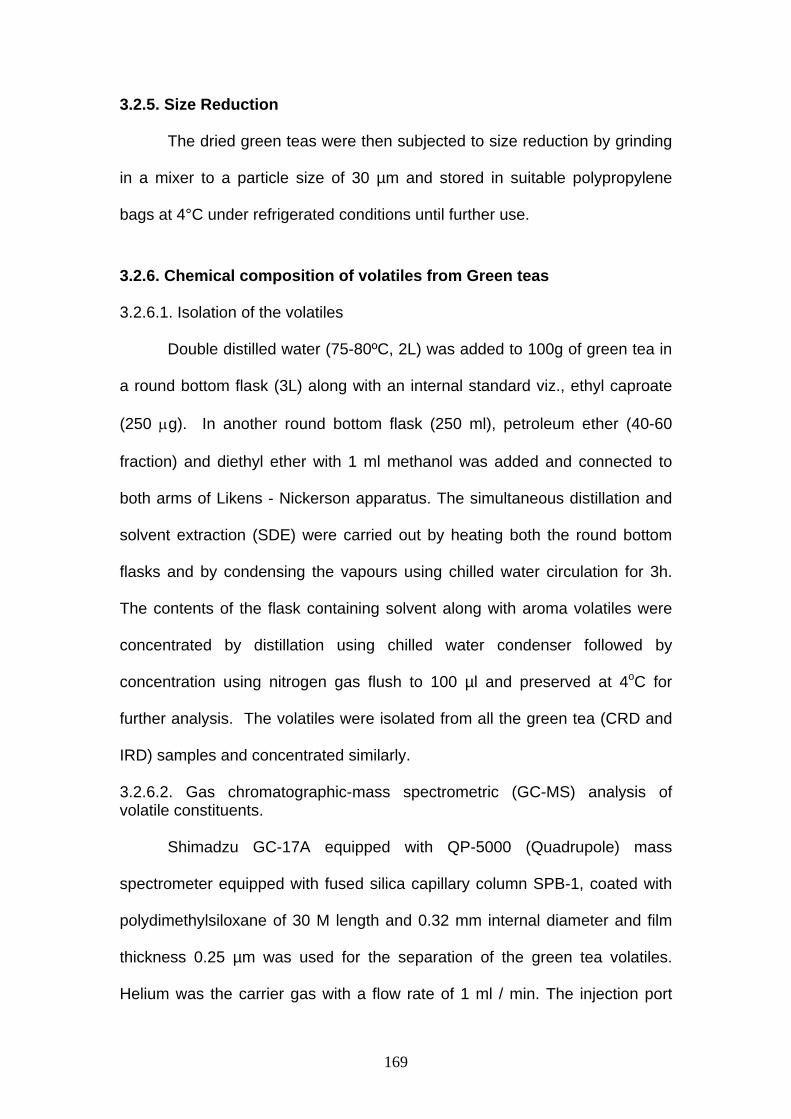
3.2.5. Size Reduction
The dried green teas were then subjected to size reduction by grinding
in a mixer to a particle size of 30 µm and stored in suitable polypropylene
bags at 4°C under refrigerated conditions until further use.
3.2.6. Chemical composition of volatiles from Green teas
3.2.6.1. Isolation of the volatiles
Double distilled water (75-80ºC, 2L) was added to 100g of green tea in
a round bottom flask (3L) along with an internal standard viz., ethyl caproate
(250 μg). In another round bottom flask (250 ml), petroleum ether (40-60
fraction) and diethyl ether with 1 ml methanol was added and connected to
both arms of Likens - Nickerson apparatus. The simultaneous distillation and
solvent extraction (SDE) were carried out by heating both the round bottom
flasks and by condensing the vapours using chilled water circulation for 3h.
The contents of the flask containing solvent along with aroma volatiles were
concentrated by distillation using chilled water condenser followed by
concentration using nitrogen gas flush to 100 µl and preserved at 4oC for
further analysis. The volatiles were isolated from all the green tea (CRD and
IRD) samples and concentrated similarly.
3.2.6.2. Gas chromatographic-mass spectrometric (GC-MS) analysis of volatile constituents.
Shimadzu GC-17A equipped with QP-5000 (Quadrupole) mass
spectrometer equipped with fused silica capillary column SPB-1, coated with
polydimethylsiloxane of 30 M length and 0.32 mm internal diameter and film
thickness 0.25 µm was used for the separation of the green tea volatiles.
Helium was the carrier gas with a flow rate of 1 ml / min. The injection port
169

temperature and detector port temperature were maintained at 220ºC. Oven
temperature programme: 40ºC (3)-2ºC/min-100ºC-4ºC/min-220ºC (7); Split
ratio was 1:50 and ionisation voltage was 70 ev. A sample of 1µl was injected
for each analysis. Identification of compounds was achieved by comparison
of mass spectra and Kovats indices from literature (Adams, 2001; Davies,
1990; Jennings & Shibamoto, 1980), and fragmentation patterns in mass
spectra were matched with those of the NIST62-LIB library and published
mass spectra (Adams, 2001; Ten Noever de Bravw, et al, 1988).
3.2.7. Extraction of green teas
Dried and powdered green tea leaves (200g) were extracted with
various solvents (e.g., acetone, ethyl acetate, methanol, ethanol, and their
aqueous mixtures) for a period of 15 h using the Soxhlet apparatus. The
material to solvent ratio used was 1:12. The extract was desolventized using
a rotavapor at 50°C under reduced pressure. These extracts were evaluated
for their polyphenol content and radical scavenging activity.
3.2.8. Determination of total phenolic content
Samples were analyzed for total phenolics content using the Folin-
Ciocalteu’s phenol reagent (Singleton and Rossi, 1965). Powdered tea
samples and extracts (0.5 g) were introduced in test tubes, and methanol +
de-ionized water (70:30) solution was added, heated on a water bath
maintained at 70 °C for 10 min. The samples were cooled to room
temperature and subjected to centrifugation. The supernatant was mixed with
saturated sodium carbonate and Folin-Ciocalteu’s reagent. The mixture was
diluted to 10 mL with deionized water; tubes were mixed and incubated in the
170

dark for 60 min for colour development. The absorbance of this solution was
measured using a UV-visible spectrophotometer (GBC Cintra 10, Australia) at
765 nm. The total phenol content of each extract in triplicate was estimated by
comparison with a calibration curve generated from the analysis of gallic acid
solutions and expressed as mean (SD) percent of gallic acid equivalents.
3.2.9. Determination of Radical Scavenging Activity
The 1, 1-diphenyl-2-picrylhydrazyl radical (DPPH) method, which has
been widely used to evaluate the free radical scavenging ability of various
samples (Jayaprakasha et al, 2001), was adopted here. Tea extract samples
were dissolved in distilled methanol, and solutions of different concentrations
(25, 50, 100, and 200 ppm) were prepared in different test tubes. Four
milliliters of a 0.1 mM methanol solution of DPPH was added to these test
tubes and shaken vigorously. The tubes were then incubated in the dark at
room temperature for 20 min. A DPPH blank sample was prepared without
any extract, and methanol was used for the baseline correction. Changes (or
decrease) in the absorbance at 517 nm were measured using a UV visible
spectrophotometer. The DPPH solution was freshly prepared daily, stored in a
flask covered with aluminium foil, and kept in the dark at 4°C between
measurements. All experiments were carried out in duplicate and repeated
three times. The percent decrease in the absorbance was recorded for each
concentration, and percent quenching of DPPH was calculated on the basis of
the observed decrease in absorbance of the radical. The radical scavenging
activity was expressed as the inhibition percentage and was calculated using
the following formula:
Radical scavenging activity= [control OD-sample OD/ control OD] x 100
171

The radical scavenging activity of BHA was also measured and
compared with that of the various green tea leaf extracts.
3.2.10. Fractionation of the Extract
The extract was subjected to solvent-solvent extraction using water
and solvent (low molecular weight ester) for 20-25 h using an all glass liquid-
liquid extraction unit. Both aqueous and solvent-partitioned portions were
desolventized in a rotavapor at 50°C under reduced pressure.
3.2.11. Identification of Catechins in the Solvent-Solvent Extract by HPLC
Several studies were reported for determining tea catechins and
alkaloids separately using HPLC following either isocratic or gradient elution
methods (Zhu and Chen, 1999, Wang, et al 2000). To determine the
composition of the active conserves a simple HPLC isocratic elution method
was developed, which efficiently separates various tea bio-chemicals /
functional ingredients, namely, catechins and gallic acid.
Tea extract (10 mg) was dissolved in 10 mL of methanol, from this
aliquot about 0.25 mL was taken and made up to 4 mL by methanol, and from
this, 10µL of the sample was analysed by HPLC under the following
conditions (Terasawa et al, 2001). The column used was a Spherisorb S10
OD52 (4.6 x 250 mm, Waters). The mobile phase was water/methanol/formic
acid (19.5:80.2:0.3 v/v) under isocratic conditions at a flow rate of 1.0 mL/min
using the Waters 515 HPLC pump. Peaks were observed at a wavelength of
280 nm using a UV-2487 dual wavelength absorbance detector (Waters).
172

The chromatograms of green tea extracts / conserves are presented in the
following sections.
3.2.11.1. Preparations of calibration curves
Known concentrations (1-10 μg/μl) of individual catechins were
subjected to HPLC analysis under the above conditions. The calibrations
curves are prepared for individual catechins viz. (+)-C, (-)-EGC, (-)-EGCG,
EC, (+)-GCG, (-)-ECG, (+)-GC and by drawing graph concentration vs peak
area.
3.2.12. Preparation of products using tea polyphenol conserve
3.2.12.1. Tea and conserve:
The polyphenol-rich conserve was isolated from the unused green tea
leaves using the methods described earlier in this chapter. The basic material
such as tea leaves were procured from a tea plantation in Nilgiris, Wynad
area (South India).
3.2.12.2. Preparation of nutraceutical ice-cream
Ingredients
Fresh milk, skim milk powder, liquid glucose, GMS [glycerol mono
stearate] were obtained from the local commercial source.
Procedure
Fresh milk 1L was concentrated by evaporation to 400mL by heating in
stainless steal vessel. Skimmed milk powder (35g), liquid glucose (30g),
emulsifier (GMS-20mg), powdered sugar (100g) and milk cream (100g) were
added to concentrated milk by continuous mixing. This mix was pasteurized
(80-100oC, 10-30min). The tea catechin conserve was suitably solubilised
173

and was added to give homogenous product. After pasteurization it was
homogenized and whipping was carried out using a food processor at an
interval of 2-3hr for 5 times and subjected to freezing during the time (12-
14hr). The ice-cream was poured into plastic cups and subjected to freezing.
The frozen ice-cream subjected to sensory evaluation.
Sensory analysis of nutraceutical ice-cream
Sensory analysis was carried out as per the standard conditions in a
booth room maintained at a temperature of 20±2°C under fluorescent lighting
equivalent to day light. Samples were preserved in porcelain plates with 3-
digit number. As it is a consumer acceptance study samples were presented
to the panelists together. 20 – 25 members participated in the sensory
evaluation (Chambers & Wolf, 1996). Care was taken to avoid interferences
and biases from other sources.
Two ice-cream samples namely, control and ice-cream enriched with
tea antioxidant were evaluated for consumer acceptance. Ice-cream was
served in coded glass plates. The product was evaluated using Hedonic test
which indicates the degree of liking for the sample as judged by the
respondents. The 7-point scale ranged from ‘Like Very Much’ (LVM) to ‘Dislike
Very Much’ (DVM) with ‘Neither Like Nor Dislike’ (NLND) as the mid point.
3.2.12.3. Preparation of nutraceutical cookies
Ingredients
Maida, sugar powder, Ghee were procured from the local commercial
source.
174

Procedure
Tea polyphenol conserve emulsion was prepared using suitable
solvent and emulsifier by mixing thoroughly and disolventized using
rotavapour at < 500C. The tea polyphenol conserve emulsion was dissolved in
water (5 mL) and was used for product preparation.
Tea polyphenol conserve emulsion (5mL) was added to mix of maida
(250g) and powdered sugar (100g) in a cleaned aluminium tray and ghee
(150g) was added. All the ingredients were mixed / kneaded thoroughly so
that dough was prepared. It was divided in to small balls (9-12g) to form
cookies. The ghee was applied on to the surface of the baking tray. Formed
raw cookies were placed in tray and baked at 90-100oC for 90 min. The
prepared cookies were subjected for sensory analysis.
Sensory analysis of nutraceutical cookies
Sensory analysis was carried out as per the standard conditions in a
booth room maintained at a temperature of 20±2°C under fluorescent lighting
equivalent to day light. Samples were preserved in porcelain plates with 3-
digit number. As it is a consumer acceptance study samples were presented
to the panelists together. 20 – 25 members participated in the sensory
evaluation (Chambers & Wolf, 1996). Care was taken to avoid interferences
and biases from other sources.
Cookies were served in coded glass plates. The product was evaluated
using hedonic test which indicates the degree of liking for the sample as
judged by the respondents. The 7-point scale ranged from ‘Like Very Much’
(LVM) to ‘Dislike Very Much’ (DVM) with ‘Neither Like Nor Dislike’ (NLND) as
the mid point.
175

3.3. RESULTS AND DISCUSSION Value addition to unused green tea leaves (coarse / pruned tea leaves) 3.3.1. Preparation of Green tea and quality evaluation
Normal, coarse and pruned fresh tea leaves (low grade) were
procured and subjected to enzyme inactivation using cross flow dryer
(80-120oC, 4 – 8h), (Fig 3.1.) and continuous infra red dryer (70-120oC,
0.5-1.5h) at different temperature and time intervals (Fig 3.2.).
The chemical parameters (viz., caffeine, total polyphenols and moisture)
of the inactivated and powdered tea leaves were analysed and sensory
qualities were examined. The chemical parameters are found to be in
the following range (Table 3.1.)- Caffeine (1.30-3.20%); Total
polyphenols (11.5-15.5%).
Sensory characteristics were found to be similar to that of
the commercial green tea samples (Table 3.2.). Flavour score of the
brews varied from 5.50-8.25 on ten-point scale (commercial samples
6.00-7.00). Taste and mouth feel score of the brews varied from 5.50-
7.00 on ten-point scale (commercial samples 6.00). Colour of the brews
varied from 5.00-8.00 on ten-point scale (commercial samples 7.00-
8.00).
176

Figure 3.1. Cross Flow Dryer
Figure 3.2. Infra Red Dryer
177

Table 3.1. Polyphenol and caffeine contents of green tea from coarse / pruned (low grade)/ unused tea leaves
* Commercial Samples – Nilgiris (Market)
Sample Inactivation conditions
Sensory scores (ten point scale) Remarks
Dryer Temp (oC) Colour Flavour Taste Coarse
CFD 110 7.75 7.5 7.0 Less astringency
CFD 95 7.5 8.25 7.0 Less astringency
IRD 100 8.0 7.0 7.0 --
Low grade
CFD 110 5.0 5.5 5.5 --
IRD 100 6.0 7.0 7.0 --
Green tea* -- -- 8.0 6.0 6.0 Smoky flavour
Green tea* -- -- 8.0 7.0 6.0 Smoky flavour
Table 3.2. Sensory evaluation of the Green teas from Coarse/pruned (low
grade) / unused tea leaves
Sample
Inactivation conditions Polyphenols
(%) Caffeine (%) Dryer# Temp
(oC) Coarse CFD 110 11.95±0.02 1.36±0.01
Coarse CFD 95 11.48±0.01 1.68±0.03
Coarse IRD 100 14.57±0.03 1.33±0.01
Low grade CFD 110 14.26±0.01 3.16±0.04
Low grade IRD 100 15.13±0.03 2.97±0.02
Green tea* -- -- 14.10±0.01 2.51±0.01
Green tea* -- -- 15.20±0.04 2.82±0.02
# CFD – Cross Flow Dryer; IRD – Continuous Infrared Dryer, *Commercial samples Values are mean ± SD (n=3) (--) = no activity
178

3.3.1.1. Chemical composition volatiles from green teas from Coarse/pruned / unused tea leaves
Forty four compounds have been identified from the volatiles of green
teas (Table 3.3, Fig 3.3.- 3.48.) by comparing retention times of the GC peaks
with those of reference compounds run under identical conditions and by
comparison of retention indices with literature data (Adams, 2001; Davies,
1990; Jennings & Shibamoto, 1980), and fragmentation patterns in mass
spectra were matched with those of the NIST62-LIB library and published
mass spectra (Adams, 2001; Ten Noever de Bravw, et al, 1988). The
constituents were quantified using internal standard method. Ethyl caproate
was used as internal standard. The broad classification of the compounds
identified includes ten terpenoids, three aromatic compounds, eight alcohols,
seven aldehydes, four acids, eight esters and four compounds derived from
carotenoids. Ethyl hex-(2E)-enoate and dihydroactinidiolide are exclusively
present in the green teas derived from coarse leaves.
In general, coarse green teas irrespective of the method of processing
contained more number of the volatile constituents, whereas the normal green
teas irrespective of the method of processing contained less number of
volatile constituents eluting before linalool. This can be attributed to the
normal leaf quality, which contributes less volatiles from the group of
constituents (Gr. I) which are undesirable, which is the prevalent practice in
the industry as well. It is also evident from the results that normal as well as a
commercial sample of green tea contained almost half the number of
identified volatile constituents (Table 3.3) in the present investigation as
compared to the coarse green teas contained. Dihydroactinidolide and ethyl
hexenoate were found to be important markers and both were present in
179
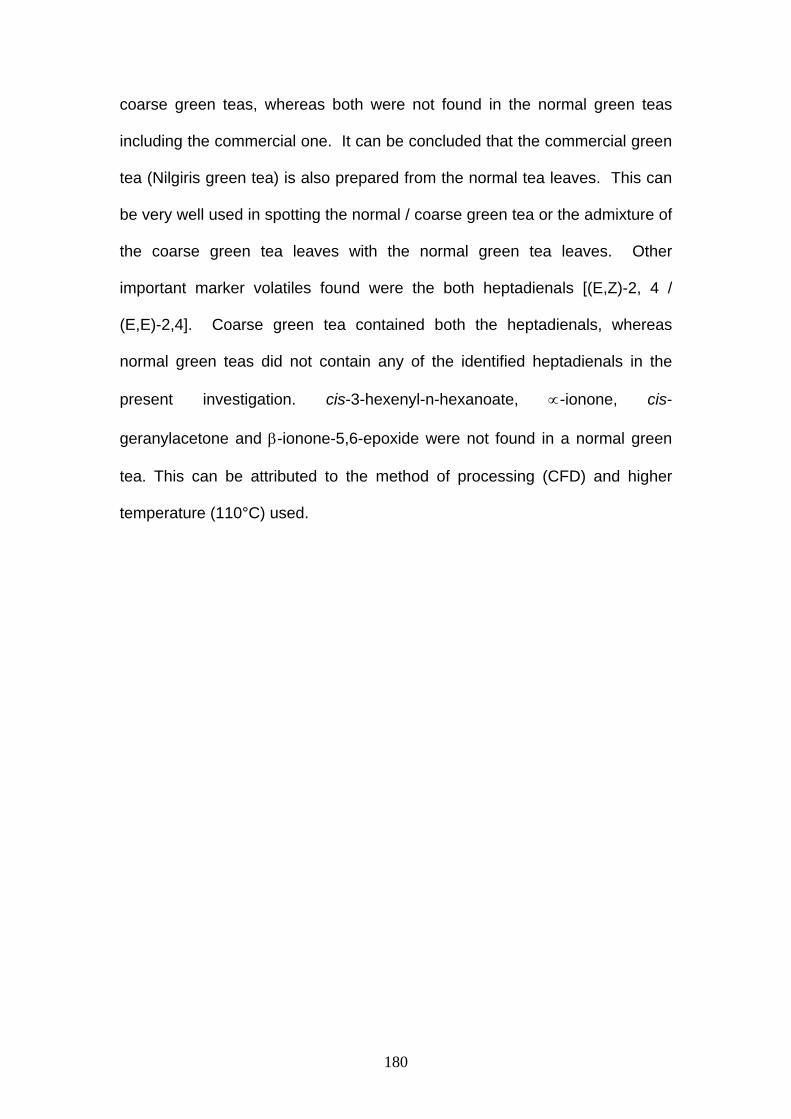
coarse green teas, whereas both were not found in the normal green teas
including the commercial one. It can be concluded that the commercial green
tea (Nilgiris green tea) is also prepared from the normal tea leaves. This can
be very well used in spotting the normal / coarse green tea or the admixture of
the coarse green tea leaves with the normal green tea leaves. Other
important marker volatiles found were the both heptadienals [(E,Z)-2, 4 /
(E,E)-2,4]. Coarse green tea contained both the heptadienals, whereas
normal green teas did not contain any of the identified heptadienals in the
present investigation. cis-3-hexenyl-n-hexanoate, ∝-ionone, cis-
geranylacetone and β-ionone-5,6-epoxide were not found in a normal green
tea. This can be attributed to the method of processing (CFD) and higher
temperature (110°C) used.
180

Table 3.3. Chemical composition of volatiles from Green tea (μg/100g)
* Identified tentatively, Market sample # (Nilgiris-Green Tea)
Sl.No. RT KI Compound
Quantity (μg)
Coarse –CFD (95)
Coarse –CFD (110)
Coarse-IRD
Normal-CFD (110)
Normal-IRD
Nilgiris-GT
Market#
1 4.2 Sec-hexyl alcohol - - 340 - - - 2 4.5 755 cis-2-penten-1-ol 524 634 540 - - - 3 5.0 775 Hexanal 179 353 280 - - - 4 6.8 trans-2-hexenal - 254 - - - - 5 7.4 841 trans-3-Hexenol 1625 214 - - - - 6 7.9 854 trans-2-Hexenol 530 - - 228 - - 7 14.3 6-methyl-5-heptene-2-one - 268 - - - - 8 14.5 967 (E,Z)-2,4-Heptadienal 458 1590 360 - - 250 9 15.2 980 (E,E)-2,4-Heptadienal 815 1951 600 - - 367 10 15.6 985 Ethyl caproate (Int. std.) 250 250 250 250 250 250 11 16.8 1001 Phenyl acetaldehyde 1339 330 470 1110 569 - 12 17.0 1004 Benzyl alcohol 905 692 660 382 - - 13 17.7 1015 Limonene 214 - - - - 267 14 18.5 1027 Ethyl hex-(2E)-enoate 1167 179 250 - - - 15 20.4 1055 cis-Linalool oxide 554 362 420 213 250 300 16 21.4 1069 trans-linalooloxide 815 188 430 375 486 567 17 22.6 1085 Linalool 1875 839 2160 2118 2472 5033 18 27.3 1151 cis-Linalyl oxide (pyranoid) 345 - - 199 250 400 19 27.9 1160 Methyl salicylate 292 - - - - - 20 28.4 1166 α-Terpineol 286 241 600 397 569 967 21 29.4 1179 Octanoic acid 268 268 330 - 250 0 22 33.3 1239 cis-Geraniol 821 326 830 647 833 1700 23 34.4 1257 Unidentified 214 214 320 - - - 24 35.1 1268 (E,Z)2,4-decadienal 411 728 420 199 - - 25 35.5 1274 Nonanoic acid 179 330 - - 194 317 26 36.3 1286 (E,E)2,4-decadienal 1155 2241 1070 206 236 450 27 40.1 1362 cis-3-Hexenyl-n-hexanoate 321 339 - - 0 567 28 41.7 1395 α-ionone 512 522 460 - 194 367 29 42.8 1424 cis-geranylacetone 1208 1411 1010 - 208 733 30 43.8 1451 β-Ionone-5,6-epoxide 381 429 420 - 222 250 31 44.0 1455 β-Ionone 655 625 710 213 361 467 32
44.5 1468 2(4H)-Benzofuranone / Dihydroactinidiolide 488 504 530 0 0 367
33 45.3 1490 Di-tert-butyl phenol 381 183 890 713 292 583 34 45.6 1497 Pentadecane 345 232 310 257 236 483 35 46.2 1513 Vanillin acetate* 393 330 590 338 236 283 36 46.9 1535 3-Z-Hexenyl benzoate 190 0 0 0 0 0 37 47.2 1543 Nerolidol 851 1080 1210 346 319 633 38 47.7 Dodecanoic acid - - 1320 - - - 39 47.9 Geranyl butanoate - - 320 - - - 40 57.9 Myristicacid methylester - - 660 - - 1850 41 58.0 1914 Butyl octyl phthalate 1137 0 440 831 1458 683 42 59.00 1956 Palmitic acid 9190 8357 31510 19551 37208 40700 43 62.6 2100 Phytol * 8869 4830 23450 22397 52806 46250 44 62.9 2114 Methyl linolenate * 4577 3491 15540 10154 25097 33600
Values expressed are means of three replications
181

Figure 3.3.Total ion chromatogram of coarse IRD green tea volatiles
Figure 3.4.Total ion chromatogram of normal CFD green tea volatiles
182

Figure 3.5.Total ion chromatogram of coarse CFD green tea volatiles
Figure 3.6.Total ion chromatogram of commercial sample from Nilgiris
(Market) green tea volatiles
183

2-Hexanol
Fig.3.7. Mass spectrum of Sec-hexyl alcohol
Fig.3.8. Mass spectrum of cis-2-pentenol
184

Fig.3.9. Mass spectrum of Hexanal
Fig.3.10. Mass spectrum of trans-2-hexenal
185

Fig.3.11. Mass spectrum of trans-3-Hexenol
Fig.3.12. Mass spectrum of trans-2-hexenol
186

Fig.3.13. Mass spectrum of 6-methyl-5-heptene-2-one
Fig.3.14. Mass spectrum of (E,E) 2,4-heptadienal
187
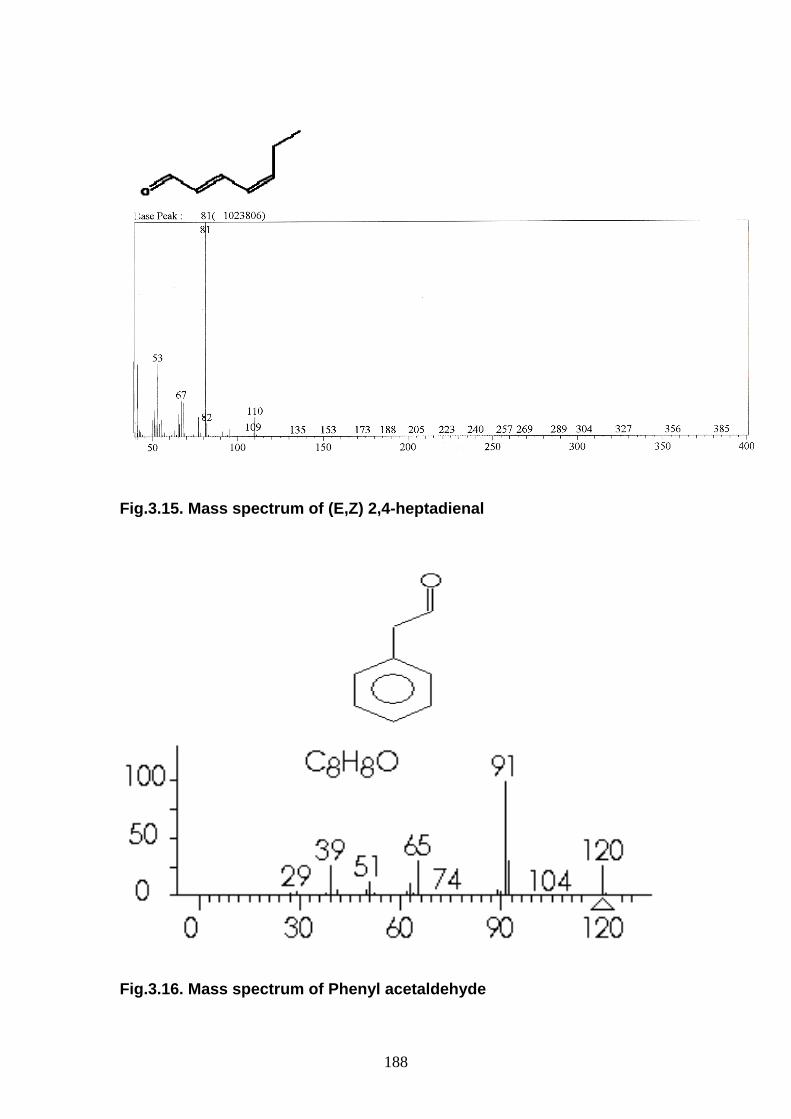
Fig.3.15. Mass spectrum of (E,Z) 2,4-heptadienal
Fig.3.16. Mass spectrum of Phenyl acetaldehyde
188

Fig.3.17. Mass spectrum of Benzyl alcohol
Fig.3.l8. Mass spectrum of Limonene
189

Fig.3.19. Mass spectrum of Ethyl hex-2-enoate
Fig.3.20. Mass spectrum of cis- linalool oxide
190

Fig.3.21. Mass spectrum of trans - linalool oxide
Fig.3.22. Mass spectrum of Linalool
191

O
HO
Fig.3.23. Mass spectrum of cis- Linalyl oxide (pyranoid)
Fig.3.24. Mass spectrum of Methyl salicylate
192

Fig.3.25. Mass spectrum of α-Terpineol
Fig.3.26. Mass spectrum of Octanoic acid
193

Fig.3.27. Mass spectrum of cis-Geraniol
Fig.3.28. Mass spectrum of (E,Z)2,4-decadienal
194
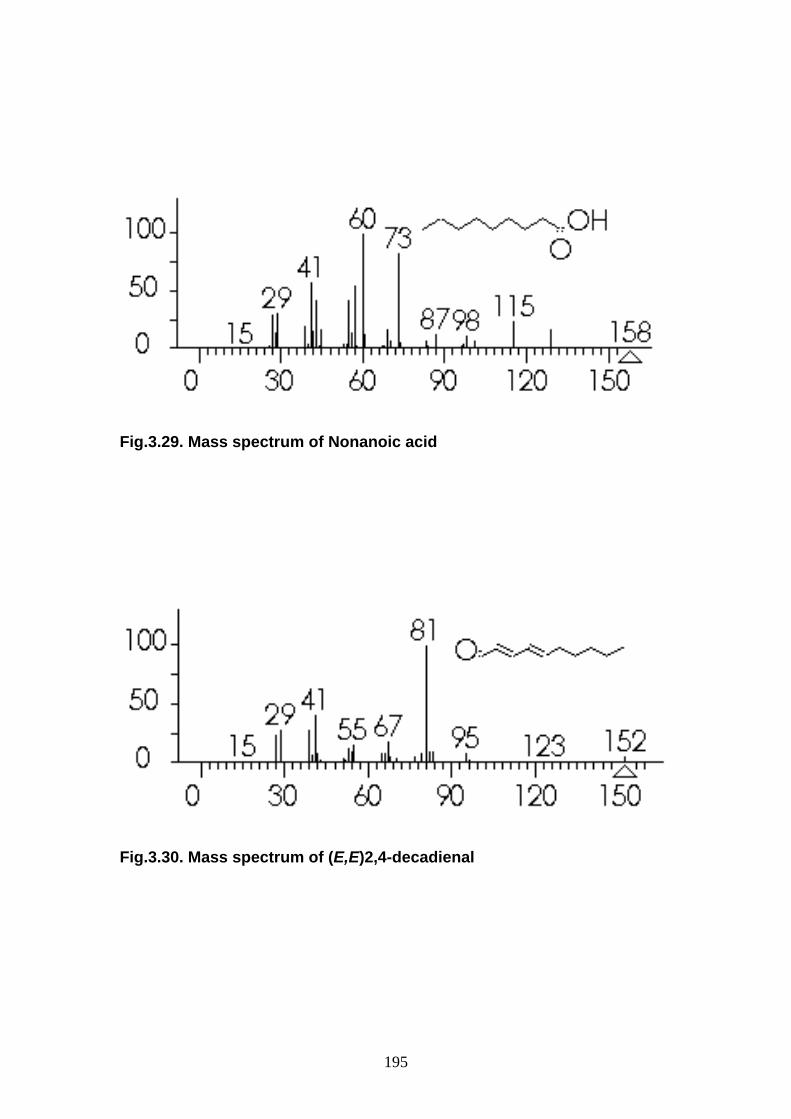
Fig.3.29. Mass spectrum of Nonanoic acid
Fig.3.30. Mass spectrum of (E,E)2,4-decadienal
195

Fig.3.31. Mass spectrum of cis-3-Hexenyl-n-hexanoate
Fig.3.32. Mass spectrum of α-ionone
196
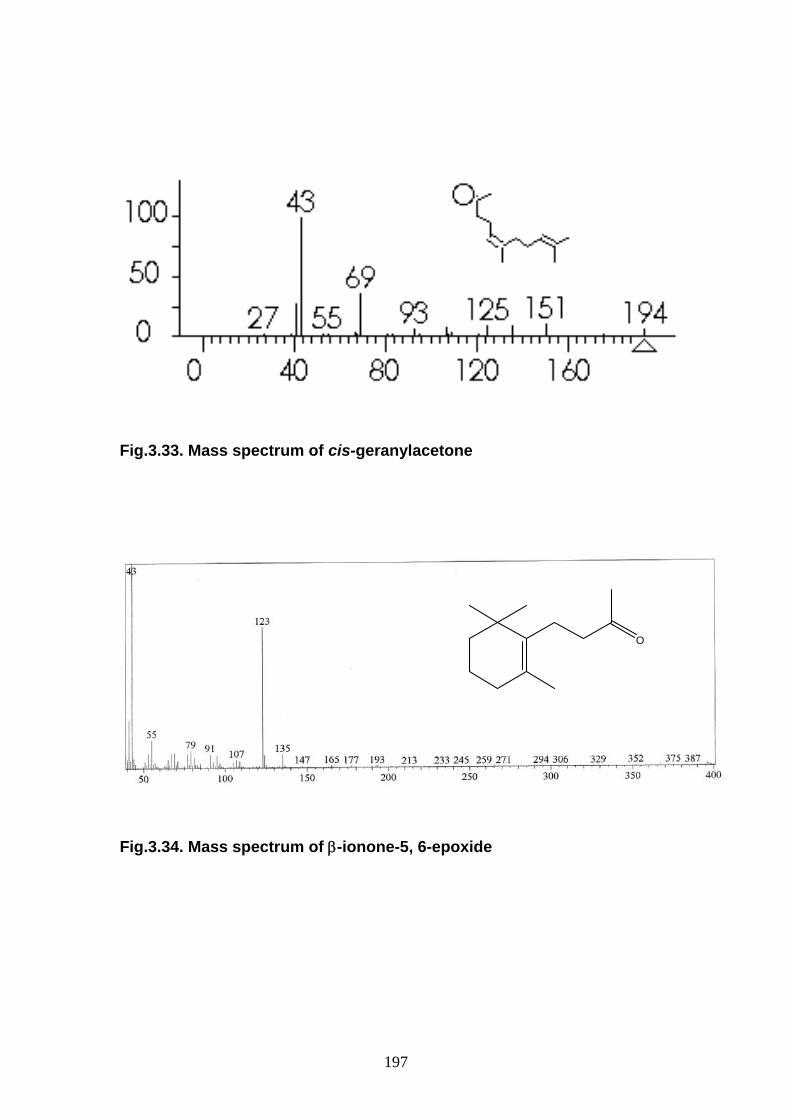
Fig.3.33. Mass spectrum of cis-geranylacetone
O
Fig.3.34. Mass spectrum of β-ionone-5, 6-epoxide
197

Fig.3.35. Mass spectrum of β-ionone
Fig.3.36. Mass spectrum of Dihydroactinidiolide
198
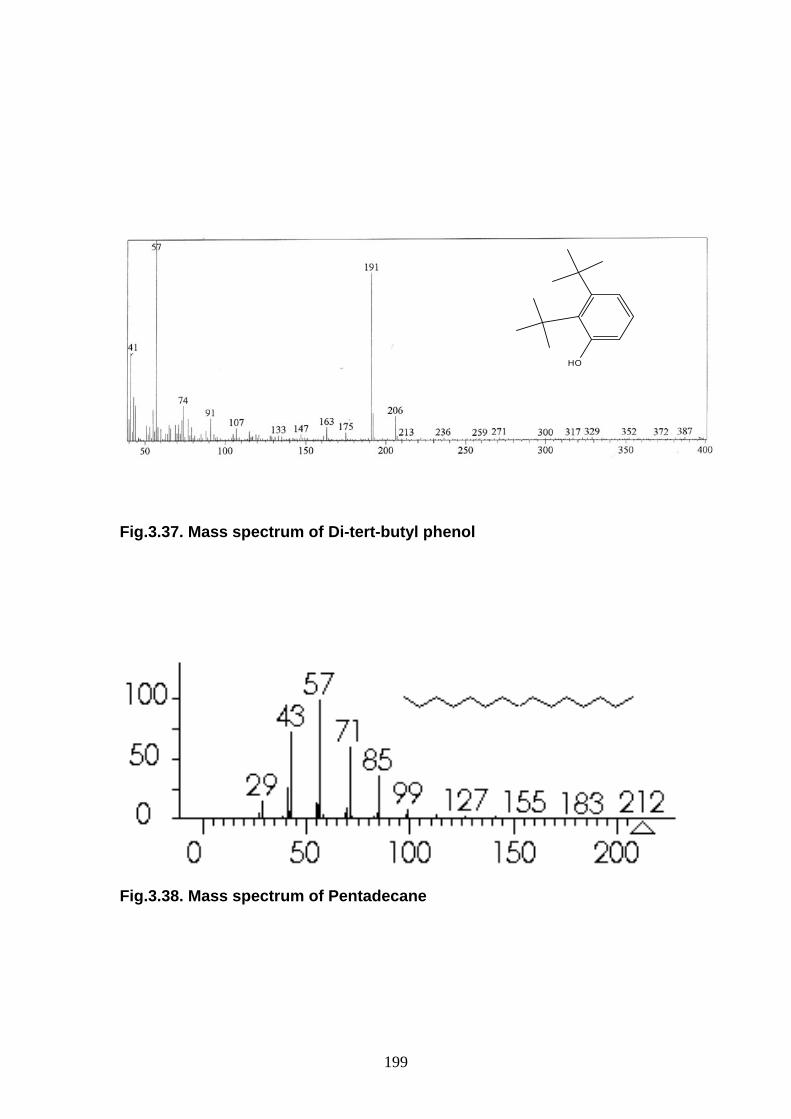
HO
Fig.3.37. Mass spectrum of Di-tert-butyl phenol
Fig.3.38. Mass spectrum of Pentadecane
199

Fig.3.39. Mass spectrum of Vanillin acetate
Fig.3.40. Mass spectrum of 3-Z-Hexenyl benzoate
200

Fig.3.41. Mass spectrum of Nerolidol
Fig.3.42. Mass spectrum of Dodecanoic acid
201

Fig.3.43. Mass spectrum of Geranyl butanoate
Fig.3.44. Mass spectrum of Myristic acid methyl ester
202

Fig.3.45. Mass spectrum of Butyl octyl phthalate
Fig.3.46. Mass spectrum of Palmitic acid
203

Fig.3.47. Mass spectrum of Phytol
Fig.3.48. Mass spectrum of Methyl linolenate
204
3.3.2. Green tea extract
The extraction of green tea samples at lab scale, using different
solvents (viz., Ethyl acetate, acetone, ethyl alcohol, methyl alcohol and their
aqueous mixtures) was carried out. The solvents are removed from these
extracts under vacuum and the yields are calculated on moisture free basis.
These extracts were evaluated for their polyphenol content (Singleton and
Rossi, 1965) and radical scavenging activity (Jayaprakasha et al., 2001). The
radical scavenging activity (RSA) of these extractives at 50 and 100 ppm
concentrations (which are found to be optimal for these extracts in the
preliminary study varying from 10 – 1000 ppm concentrations) were evaluated
using the DPPH model system (Table 3.4). The order of activity and
extractability are as follows: Methanol > Ethanol> Acetone > Ethyl acetate. It
is observed that the extractability as well as activity of the extract increased
with polarity of the solvent used. This may be due to the increase in
extraction of the active components along with the polarity of the solvent.
Hence, alcohols are found to be the best solvents to obtain maximum
extractives with high activity. The aqueous alcoholic mixtures showed higher
activity and extractability than the respective single solvents. Both the
alcohols were found to be better and the aqueous alcohol were used for
further processing (Scheme 3.1).
205

Table 3.4. The yields and RSA of normal green tea extractives using different solvents
Solvents Yield (%)Radical scavenging activity (%)
50 ppm 100 ppm Ethyl acetate 23.9±0.4 64±0.8 91±0.4
Acetone 27.7±0.4 67±0.5 91±0.5 Ethyl alcohol 32.7±0.5 76±0.7 92±0.6 Methyl alcohol 34.8±0.6 82±0.9 92±0.5 Ethyl acetate+ water 24.5±0.4 70±1.1 91±0.5 Acetone + water 29.2±0.5 75±1.0 91±1.2 Ethyl alcohol + water 36.3±0.6 82±0.5 92±0.7 Methyl alcohol + water 36.7±0.7 86±0.9 93±0.6 BHA --- 83±0.5 92±0.6
Values are mean ± SD (n=3), (---) = no activity
Scheme 3.1. Preparation of Green tea extract
Green Tea 1. Size Reduction 2. Extraction (Aqueous alcohol)
Residual tea leaves powder (Polyphenol content < 2%)
Extract (yiled – 30-37%)
(Polyphenol content 24-31%) (RSA:80-94% at 100 ppm)
The extractions for the further work on the normal and coarse
tealeaves were carried out using methanol water mixture (Fig 3.45). The
green teas from normal and coarse leaves were subjected to solvent
extraction, followed by solvent removal. The miscella was subjected to
lyophilization for removal of aqueous portion. The yields are computed on
moisture free basis (Table 3.5). The extractives were evaluated for their
polyphenol content and radical scavenging activities and the results are
presented in Table 3.5. It was found that the yields of the extractives from
green teas of coarse leaves are relatively low on the expected lines.
206

However, the radical scavenging activities of the extractives of green teas
from coarse leaves are marginally low at different concentrations. This
observation indicated that the green teas from coarse leaves could be used
for the preparation of radical scavenging conserves, by separating / enriching
the active components using suitable technique.
Table 3.5. The yields, polyphenol contents and RSA of normal / coarse green tea extractives prepared under optimized conditions
Tea sample
Yield (%)
Polyphenol content
(%)*
Radical scavenging activity (%) at ppm concentrations
25 50 100 200
Normal 36.7±0.7 31.0±0.6 50±0.7 83±0.9 93±0.8 92±0.3
Coarse 32.5±0.5 20.6±0.8 45±1.0 74±0.2 92±0.4 91±0.8
BHA --- ---- 82±0.8 92±0.4 93±0.7 93±0.4
* as gallic acid equivalents, Values are mean ± SD (n=3), (---) = no activity
3.3.3. Fractionation of the green tea extract
The extractives were subjected to liquid-liquid extraction using water
and low molecular weight ester to fractionate the catechins into the solvent
fraction (Fig 3.46). These extracts were analyzed for total polyphenol content
and evaluated for radical scavenging activity (Table 3.6). The polyphenol
content of the solvent extracts was found to be 30±2.3% as gallic acid
equivalents for coarse leaves, while, polyphenol content of the solvent extract
of normal leaves was found to be 31±2.4% as gallic acid equivalents. The
total polyphenol content in the aqueous portion of these extracts was
23±2.1% as gallic acid equivalents for normal leaves, while that for coarse
leaves extracts was found to be 18±3.0% as gallic acid equivalents. The
207

yields of the solvent extracts are found to be 15±0.8% for coarse leaves and
for normal leaves the yield of solvent extract was found to be 17±0.8%. The
yield of the aqueous extract is 17±0.9 % for coarse leaves and for normal
leaves the yield of solvent extract was found to be 19 ±1.0 %. However, the
radical scavenging activity of the solvent extracts from both normal and
coarse leaves was found to be same (92±1% at 15 ppm). The RSA of the
aqueous extracts was found to be low. Hence, it may be concluded that the
solvent used separated the compounds responsible for the radical scavenging
activity.
Antioxidant reacts with DPPH, which is nitrogen centered radical with a
characteristic absorption at 517 nm and convert it to 1, 1-diphenyl-2-picryl
hydrazine, due to its hydrogen donating ability at a very rapid rate (Yamaguchi
et al, 1998). The degree of discoloration indicates the scavenging potentials
of the antioxidant. The activity of the extracts is attributed to their hydrogen
donating ability (Shimada et al, 1992). It is well known that free radicals
cause auto-oxidation of unsaturated lipids in food (Kaur and Perkins, 1991).
On the other hand, antioxidants are believed to intercept the free radical chain
of oxidation and to donate hydrogen from the phenolic hydroxyl groups,
thereby forming stable end product, which does not initiate or propagate
further oxidation of lipid (Sherwin, 1978). The data obtained reveal that the
green tea extracts / conserve is free radical inhibitor and primary antioxidant
that react with DPPH radical, which may be attributed to its hydrogen donating
ability.
208

Table 3.6. Fractionation of Green tea extracts - Yields, polyphenol contents and RSA of solvent and aqeous extracts
Tea sample
Yield (%) Polyphenol content (%)*
Radical scavenging activity (%) at ppm concentrations Conserve (Solvent)
Conserve (Aqueous)
Conserve(Solvent)
Conserve (Aqueous)
Conserve (Solvent)
Conserve (Aqueous) 15 100 15 100
Normal 17 ±0.8 19±1.0 31±2.4 23±2.1 92±1 >94 45±1 92±2
Coarse 15 ±0.8 17 ±0.9 30±2.3 18±3.0 92±1 >94 40±1 85±2
BHA --- --- --- --- 82±1 >94 82±1 >94
* as gallic acid equivalents, Values are mean ± SD (n=3), (---) = no activity
Scheme 3.2. Preparation and fractionation of green tea extract
Green Tea (Waste: Coarse / pruned tea leaves)
Extract (yield-32-38%,) (Polyphenol content – 31%; Catechins –25-30%)
• Size reduction • Extraction (Aqueous alcohol)
Solvent-solvent extraction (EtOAc)
Solvent extract Yield –15-18%
(Polyphenol content – 27-34%) Catechins –50-70%)
(RSA – 92% at 15 ppm)
209

Figure 3.49. Green tea extraction
210
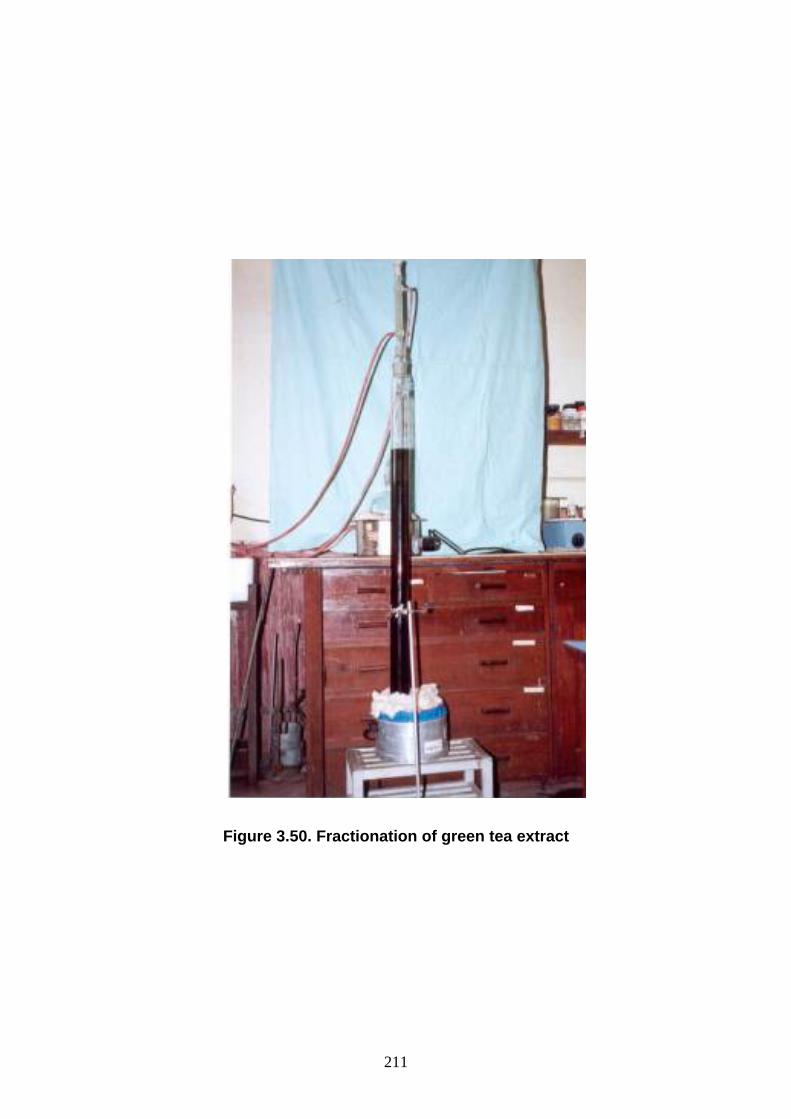
Figure 3.50. Fractionation of green tea extract
211
3.3.4. HPLC profiling of green tea extractives, chemical composition and quantification
To determine the chemical composition of the green tea extracts /
conserves, the calibration curves for each of the catechins were prepared.
The concentrations ranges used for the calibration curves were 5-50μg. The
retention times of each of the catechin were noted. Under optimized
conditions the green tea extracts, fractionated solvent portion and aqueous
portion were subjected to HPLC (Terasawa et al, 2001). The profiles are
presented in the fig.3.51.-3.53. The quantification was carried out using the
external standard method. Solutions of each standard at various
concentration levels were injected in to HPLC system and the peak areas
were recorded. Thus the calibration curves and response factors were
calculated under the same conditions as that of the sample. The total
catechin content in the green tea extract based on the comparison of peak
areas with that of authentic samples and from calibration curves was found to
be in the range of 20–30 %. After fractionation the solvent extract is enriched
with catechin and the total catechin content was found to be in the range of
55-85 % (Table 3.7.), while the HPLC profile of aqueous extracts showed only
the presence of gallic acid and caffeine.
Coarse green tea leaves extract obtained from the solvent-solvent
extraction method was analyzed for individual catechins, methyl xanthines
and gallic acid by employing HPLC method, the content of the above
compounds were calculated as microgram per milligram of dry weight.
212

3.51. HPLC profile of green tea extract
3.52 HPLC profile of solvent portion of tea extract
3.53 HPLC profile of aqueous portion of tea extract
213
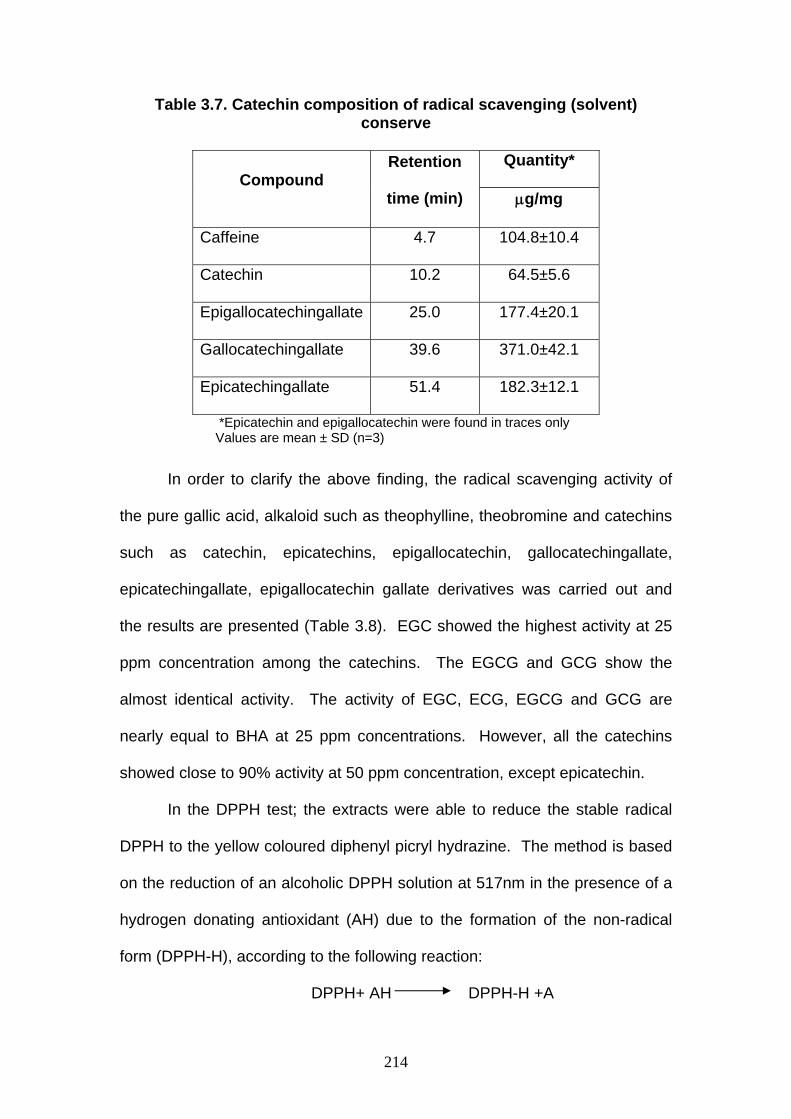
Table 3.7. Catechin composition of radical scavenging (solvent) conserve
Compound Retention
time (min)
Quantity*
μg/mg
Caffeine 4.7 104.8±10.4
Catechin 10.2 64.5±5.6
Epigallocatechingallate 25.0 177.4±20.1
Gallocatechingallate 39.6 371.0±42.1
Epicatechingallate 51.4 182.3±12.1
*Epicatechin and epigallocatechin were found in traces only Values are mean ± SD (n=3)
In order to clarify the above finding, the radical scavenging activity of
the pure gallic acid, alkaloid such as theophylline, theobromine and catechins
such as catechin, epicatechins, epigallocatechin, gallocatechingallate,
epicatechingallate, epigallocatechin gallate derivatives was carried out and
the results are presented (Table 3.8). EGC showed the highest activity at 25
ppm concentration among the catechins. The EGCG and GCG show the
almost identical activity. The activity of EGC, ECG, EGCG and GCG are
nearly equal to BHA at 25 ppm concentrations. However, all the catechins
showed close to 90% activity at 50 ppm concentration, except epicatechin.
In the DPPH test; the extracts were able to reduce the stable radical
DPPH to the yellow coloured diphenyl picryl hydrazine. The method is based
on the reduction of an alcoholic DPPH solution at 517nm in the presence of a
hydrogen donating antioxidant (AH) due to the formation of the non-radical
form (DPPH-H), according to the following reaction:
DPPH+ AH DPPH-H +A
214

Table 3.8: Radical scavenging activity of gallic acid, alkaloids and catechins
Standard 25 ppm 50 ppm
Gallic acid 90±1.0 92 ±0.9
Theophylline - -
Theobromine 9±0.3 1±0.2
Catechin 79±0.7 89 ±0.8
Epicatechin 61 ±0.8 83±0.8
Epicatechingallate 84 ±0.9 90±0.9
Epigallocatechingallate 86±0.8 89±0.7
Gallocatechingallate 85±0.7 89±0.8
Epigallocatechin 86±0.9 90±1.0
BHA 92±1.0 92±0.9
Butylated hydroxyanisole (BHA) was used as positive control.
Values are mean ± SD (n=3), (-) = no activity
The remaining DPPH, measured after a certain time, correspond
inversely to the radical-radical interaction, the radical A can contribute to the
formulation of stable molecules. This method is simple, rapid (20min) and
sensitive. No expensive reagent or sophisticated instruments are required.
In the literature, the radical scavenging activity of the phenolic
compound is described as being largely influenced by the number of hydroxyl
groups on the aromatic ring. The higher the number of hydroxyl groups, the
greater the radical scavenging activity .The results of this study are in perfect
agreement with data. It has already been reported that more than 70% of the
antioxidant activity in green tea extracts can be attributed to tea catechins and
(-)-ECG and (-)-EGCG in the particular strongly contributed to the antioxidant
activity of green tea (Salah et al, 1995).
215

Extracts from unused fresh green tea leaves have the potential for
large-scale application as natural antioxidants. Extracts of the green tea are
becoming increasingly important as functional ingredients in the diet and are
being added to a range of foods and beverages (Zandi and Gordon, 1999).
3.3.5. Extraction of Green tea from Pruned tea leaves on pilot scale
Green tea obtained from drying of pruned tea leaves (30 Kg fresh leaves /
batch) was ground in a hammer mill. The ground green tea was charged into
extraction unit (Figure 3.54) and subjected to extraction using alcohol: water
mixture. The obtained solution of the extract was subjected to concentration
by reducing the volume and the extract was subjected to freeze-drying. The
yield was in the range of 25-26%. The total poly phenol content of this extract
was determined using the Folin-Ciocalteu’s phenol reagent. The polyphenol
content was found to be in the range of 35-37%. Radical scavenging Activity
of the extract was determined using DPPH method. It showed an activity of
90-92% at 15 ppm concentration.
The Spent green tea leaves were subjected to soxhlet extraction using
alcohol and water mixture, and the yield of residual extract was found to be
5.5%.
The solvent-solvent extraction of the green tea extract using ethyl
acetate was carried out. The Green tea extract (original), ethyl acetate
extract, aqueous extract were subjected to HPLC analysis, and were also
evaluated for the polyphenol content and RSA activity. However, the solvent-
solvent extraction on large scale was found to be time consuming and energy
intensive step. In spite of these problems, the yield of the conserve was
found to be less. Hence, the alternate methods were attempted.
216

Figure 3.54. Pilot scale extraction of green tea leaves powder
217

3.3.6. Improved method for the active conserve
One more batch of fresh green tea leaves (Coarse / pruned, 100 kg)
were procured from the Nilgiris, Tamilnadu and processing was started within
the 6-10 h of plucking. The initial moisture content of the leaves was found to
be ~60-65% and the final moisture in prepared green tea was ~6-8%.
To minimize the processing cost and to control the epimerisation of
catechins during processing, alternate methods were explored. Green tea
sample from fresh batch was subjected to aqueous alcoholic extraction. The
extract was concentrated to remove the alcohol to the extent possible. The
obtained miscella was cooled to 10oC and kept over night at that temperature.
The separated solids were filtered (Figure 3.55) and dissolved in low
molecular weight ester and the filtrate was also treated with the same ester.
Solvent was removed from the combined portion and the yield was found to
be 12±2%. Both aqueous and ester portions were subjected to HPLC
analyses. Ester soluble portion was found to contain most of the catechins.
The aqueous portion (filtrate) was freeze dried and the solid yield was
~12±2%. Total polyphenol content and Radical scavenging activity (RSA) of
the aqueous portion and ester portions were evaluated. RSA of the aqueous
portion was found to be in the range of 70-85% at 40-50 ppm concentration,
while that of ester portion was in the range of 85-90% at 10-15 ppm
concentrations. The total polyphenol content in the aqueous portion was
found to be 23-25%, while that of in the ester portion are in the range of 27-
32% (Borse et al, 2007).
218

Figure 3.55. Separation of solids from green tea extract
219

3.3.7. Economics of the process
Cost of production (Basis: 800kg leaves/shift; 3 shifts/day; 300day)
Total cost of production per annum = Rs. 1, 91, 80, 000/-
Tea catechin conserve = Rs.1332/kg
Total sales envisaged = Rs. 2, 53, 44, 000/-
Market Price and returns (Figure 3.56.)
Tea catechin conserve = Rs.1600/kg
Tea gallic acid conserve = Rs.160/kg
Break even capacity = 38%
Basis- 2 shifts / day
Return on investment = 23%
Payback period = 4.35 Y
Basis- 3 shifts / day
Return on investment = 41%
Payback period = 2.43 Y
220

Figure 3.56. Tea gallic acid conserve and catechin conserve
221

3.3.8. Applications of green tea catechin conserve
3.3.8.1. Introduction
This section of the chapter describes the process for the application of
the green tea conserve in the preparation of nutracutical food products
selectively ice-cream and cookies. The significance of the new process lies in
the fact that the catechins isolated from the natural source possessed good
antioxidant and as well as radical scavenging activity resulting in products
having high neutracutical value to the consumers. The bioactive attributes and
health benefits of green tea are discussed in greater detail in previous
chapters.
3.3.8.2 Back ground for the products development
The prepared processed tea consists of two leaves and a bud which
contains mainly polyphenols, alkaloids and being used as a most popular
beverage which is having major health benefits.
India is the largest producer of tea. The tea leaves (except two leaves,
a bud, third and fourth leaf) are not plucked for tea making and are pruned in
a periodic cycle of 2-3 years. These pruned tea leaves have good amount of
polyphenols claimed to have several health benefits. Keeping this in view, a
process was developed as described earlier in this chapter. In this process
these coarse / pruned tea leaves were dried (cross flow dryer / infrared dryer)
and ground. Powdered green tea were subjected to extraction using aqueous
polar solvent. The miscella after removal of the solvent were subjected to
fractionation using different technique to obtain the radical scavenging
conserve (e.g., solvent - solvent extraction (or) chilling and separation of the
precipitate and extraction with solvent). The conserve thus obtained showed
222

very good (90-92% at 10 -15 ppm concentration) radical scavenging potential
in model system. The yield and polyphenol content of radical scavenging
conserve was in the range of 10-15% and 25-30% respectively. Tea catechin
conserve was found to show high radical scavenging activity. Its application
in food products could provide health benefits to the consumer. Two products
(i.e., Ice-cream and cookies) containing the conserve are optimized with
regard to its incorporation in the final product.
In a study by Wang et al (2007) comparison of the effect of green tea
extract (GTE) on the quality of bread by instrumental analysis and sensory
evaluation was carried out. The level of incorporation of green tea extract
(GTE) was at 1.5 and 5.0 g/kg of flour. The threshold level of green tea extract
(GTE) was at 5.0 g/kg of flour for astringency and sweetness, and 1.5 g/kg of
flour for brightness, hardness and stickiness.
The product Ice-cream (i.e. Green tea nutraceutical ice cream),
incorporating the catechin-rich conserve was optimized (Jagan Mohan Rao et
al, 2008).
3.3.8.3 Catechin-rich nutraceutical ice-cream
Tea catechin conserve was found to show high radical scavenging
activity. Its application in food products could provide health benefits to the
consumer. Ice-cream (Figure 3.57) was prepared using the food ingredients
such as milk, cream, sugar, milk powder along with the polyphenol conserve.
The concentration of tea catechin conserve was tried in the range of 5-200
ppm. The tea catechin conserve was suitably solubilised to give homogenous
product. The optimum range of tea catechin concentration was found to be in
the range of 20-30 ppm.
223

Figure 3.57. Ice-cream enriched with antioxidants from tea conserve
Figure 3.58. Cookies enriched with antioxidants from tea conserve
224

3.3.8.4. Sensory evaluation of catechin rich nutraceutical ice-cream
The results of the sensory analysis as shown in following figure (3.59. )
depicts ice-cream with tea antioxidant extract; 15% of the respondents rated
under ‘LVM’, 45% of the respondents under ‘LM’ and another 40% under ‘LS'.
However the ice-cream samples were acceptable as the scores were falling
on ‘Like’ category.
0
10
20
30
40
50
60
70
80
90
100
Res
pons
es (%
)
LVM LM LS NLND DS DM DVMHedonic Ratings
With antioxidant extract
Consumer Acceptance Study of Icecream
Figure 3.59. Sensory evaluation of Ice-cream enriched with tea conserve
LVM – Like Very Much DS – Dislike Slightly
LM – Like Moderately DM – Dislike Moderately
LS – Like Slightly DVM – Dislike Very Much
NLND – Neither Like Nor Dislike
225

3.3.8.5. Catechin-rich nutraceutical cookies
The second product tried in this direction was cookies (Figure 3.58). The
cookies were prepared using the required food ingredients such as maida,
sugar, ghee along with green tea catechin conserve. The concentration of
green tea catechin conserve was tried in the range of 10-400 ppm. The tea
catechin conserve was suitably solubilised to give homogenous product. The
optimum concentration was found to be in the range of 20-50 ppm by sensory
evaluation.
3.3.8.6. Sensory evaluation of catechin rich nutraceutical cookies
The results of the sensory analysis indicated that 53% of the
respondents rated cookies as ‘Like Very Much’, 32% of the respondents rated
it as ‘Like moderately’ and 15% of the respondents rated it as ‘Like Slightly’
indicating the product is acceptable. As the results shown in the following
figure (3.60.) are falling on the ‘Like’ category, the product is acceptable.
0
10
20
30
40
50
60
70
80
90
100
Res
pons
es (%
)
LVM LM LS NLND DS DM DVMHeadonic Ratings
Consumer Acceptance Study of Cookies
Figure 3.60. Sensory evaluation of Cookies enriched with tea conserve
LVM – Like Very Much DS – Dislike Slightly
LM – Like Moderately DM – Dislike Moderately
LS – Like Slightly DVM – Dislike Very Much
NLND – Neither Like Nor Dislike
226
3.4. Bibliography
Adams, R. P. Identification of essential oils by gas chromatography / quadrupole mass spectroscopy, Allured Publishing Corporation: Illinois. (2001) Borse, B. B.; Jagan Mohan Rao, L.; Raghavan, B. A novel process for manufacture of green tea from coarse green tea leaves. Indian Patent 809/DEL/05. (2005). Borse, B. B.; Jagan Mohan Rao, L.; Raghavan, B.; Sulochanamma, G.; Ramesh, M. N. A novel process for manufacture of green tea. Indian Patent 488/DEL/2004. (2004). Borse, B.B., Jagan Mohan Rao, L. Subramanian, R. A novel method for separation of radical scavenging conserve from tea extractives. 40/NF/07. (2007). Chamber E and Wolf M. B., Sensory Testing Methods, 2nd Ed., Manual 26. American Society for Testing and Materials, Philadelphia, PA. (1996) Davies, W. Gas chromatographic retention indices of monoterpenes and sesquiterpenes on methyl silicone and Carbowax 20M phases. Journal of Chromatography, 503, 1–24. (1990) Ding, Z. Y.; Chen, Y.; Zhou, M.; Fang, Y. Z. Inhibitory effect of green tea polyphenol and morin on the oxidative modification of low-density lipoprotein. Chinese J. Pharmacol. Toxicol., 6, 263-266 (1992). Dreosti, I. E.; Wargovich, M. J.; Yang, C. S. Inhibition of carcinogenesis by tea: the evidence from experimental studies. CRC Critical Rev. Food Sci. Nutr., 37, 761-770 (1997). Gutierrez Rosales, F.; Garrido-Fernandez, J.; Gallardo-Guerrero, I.; Gandul-Rojas, B.; Minguez-Mosquera, M. I. Action of chlorophylls on the stability of virgin olive oil. J. Am. Oil Chem. Soc., 69, 866-871 (1992) ISO 573 (BS 6049-2), (1980). Jagan Mohan Rao, L.; Borse, B. B.; Raghavan, B. A process for preparation of radical scavenging conserve from coarse/ pruned tea leaves. Indian Patent 662/DEL/06, (2005). Jagan Mohan Rao, L., Borse, B. B. Maya prakash, Green tea nutraceutical ice cream. Indian Patent 000/DEL/08, (2008). Jankun, J.; Selman, S. H.; Suliercz, R.; Skrzyperzak-jankun, E. Why drinking green tea could prevent cancer. Nature, 387, 561 (1997).
227
Jayaprakasha, G. K.; Singh, R. P.; Sakariah, K. K. Antioxidant activity of grape seed (Vitis Vinifera) extracts on peroxidation models in vitro. Food Chem., 73, 285-290 (2001). Jennings, W., & Shibamoto, T. Qualitative analysis of flavour and fragrance volitiles by glass capillary gas chromatography, Academic Press : New York. (1980) Kaur, H.; Perkins, J. The free radical chemistry of food additives. In Free Radicals and Food AdditiVes; Aruoma, O. I., Halliwell, B., Eds.; Taylor and Francis: London, U.K.,; pp 17-35 (1991). Matsuzaki, T.; Hara, Y. Antioxidative activity of tea leaf catechins. Nippon Nougeikagaku Kaishi, 59, 129-134 (1995). Millin, D. J. Factors affecting quality of tea. In Quality Control in the Food Industry; Herschduerter, S. M., Ed.; Academic Press: London, U.K.,; pp 127-160 (1987). Nanjo, F.; Goto, K.; Seto, R.; Suzuki, M.; Sakai, M.; Hara, Y. Scavenging effects of tea catechins and their derivatives on 1,1- diphenyl-2-picrylhydrazyl radical. Free Radical Biol. Med., 21, 895-902 (1996). Precival, M. Antioxidants. Clin. Nutr. Insight, 31, 1-4 (1998). Quartley, B. J. P.; Clifford, M. N.; Walker, R.; Williams, C. M. Antioxidant activity of green tea in vivo. SCI Lect. Pap. Ser. No. 0029, pp 1-8 (1994,) Rice-Evans, C. A.; Miller, N. J. Antioxidant activities of flavonoids as bioactive components of food. Biochem. Soc. Trans., 24, 790-795 (1996). Salah, N.; Miller, N. J.; Parganga, G.; Tifburg, L.; Bolwell, G. P.; Rice-Evans, C. Polyphenolic flavonols as scavenger of aqueous phase radicals and as chain breaking antioxidants. Arch. Biochem. Biophys., 32, 339-346 (1995). Sherwin, E. R. Oxidation and antioxidants in fat and oil processing. J. Am. Oil Chem. Soc. 55, 809-814 (1978). Shimada, K.; Fujikawa, K.; Yahara, K.; Nakamura, T. Antioxidative properties of xanthan on the autoxidation of soybean oil in cyclodextrin emulsion. J. Agric. Food Chem., 40, 945-948 (1992). Singleton, V. L.; Rossi, J. A. Colorimetry of total polyphenolic with phosphomolybdic-phosphotungstic acid reagents. Am. J. Ecol. Vitic., 16, 144-158 (1965). Ten Noever de Bravw, M. C., Bovwman, J., Gramberg, L. G., & La Vos, G. F. Compilation of mass spectra of volatile compounds in food (Vols. 1–16). AjZeist, The Netherlands: TNO-CIVO Food Analysis Institute (1988).
228
229
Terasawa, N.; Yamazaki, N.; Fukui, Y. Antioxidative activity of water extracts of herbs. Nippon Shokuhin Kogaku Kogaku Kaishi, 48, 99-104 (in Japanese). (2001) Tijburg, L. B. M.; Mattern, T.; Folts, J. D.; Weisgerber, U. M.; Katan, M. B. Tea flavonoids and cardiovascular diseases: a review. CRC Critical Rev. Food Sci. Nutr., 37, 771-785 (1997). Wang, H. F.; Helliwel, K.; You, X. Isocratic elution system for the determination of catechins, caffeine and gallic acid in green tea using HPLC. Food Chem., 68, 115-121. (2000) Wang R., Zhou W. and Isabelle M. Comparison study of the effect of green tea extract (GTE) on the quality of bread by instrumental analysis and sensory evaluation. Food Res. International, 40, 470-479. (2007) Yamaguchi, T.; Takamura, H.; Matoba, T.; Terao, J. HPLC method for evaluation of the free radical-scavenging activity of foods by using 1,1-diphenyl-2-picrylhydrazyl. Biosci., Biotechnol., Biochem., 62, 1201-1204 (1998). Yang, C. S. Inhibition of carcinogenesis by tea. Nature, 389, 134-135 (1997). Zandi, P.; Gordon, M. H. Antioxidant activity of extracts from old tea leaves. Food Chem., 64, 285-288 (1999). Zandi, P.; Gordon, M. H. Stabilisation of rapeseed oil to green tea extracts. Proc. Int. Tea Symp., 216-227 (1995). Zhao, B.; Li, X.; He, R.; Cheng, S.; Wenjuan, X. Scavenging effect of extracts of green tea and natural antioxidants on active oxygen radicals. Cell Biophys., 14, 175-185 (1989). Zhu, Q. H.; Chen, Z. Y. Isolation and analysis of green tea polyphenol by HPLC. Anal. Lab., 18, 70-72 (1999).
CHAPTER 4 SUMMARY AND CONCLUSION
INTRODUCTION AND REVIEW OF LITERATURE
Sheng Nung the Chinese emperor (2737 B.C.) was the first to recognise
the refreshing stimulant effect of tea. Tea is one of the important agro-industrial
plantation crops of India. Tea is the beverage with which most of the Indians start
their day. The recent research findings indicative of several health benefits have
further popularized tea as a beverage. During the year 2007, India produced 945
million kg of tea from 38,705 gardens spread over an area of 4, 35, 057 ha. Out
of this, domestic consumption accounts for 76 per cent and exports accounts for
24 per cent.
Tea plant belongs to the Camellia species of Theaceae family. The two
basic varieties are recognised namely Chinese variety Sinensis and Assamese
variety - Assamica. The commercially grown tea plant is highly heterogeneous.
Tea flush contains polyphenols, amino acids, organic acids, polysaccharides,
lipids, carotenoids, caffeine, chlorophylls, minerals and volatiles. The
polyphenols which includes catechins constitute 25-30% of the fresh flush on dry
weight basis. These are converted to theaflavins, thearubigins, theaflavic acids
and bisflavonols during the manufacture of black teas and are responsible for
colour, briskness, brighness and astrigency. Theaflavins are determined
qualitatively and quantitatively whereas quantitative determination of thearubigins
has been possible tentatively but their structures are yet to be explored
completely. Caffeine is the major alkaloid present in tea and it is responsible for
230

stimulating action. Highly efficient HPLC method to determine soluble caffeine
reported from this laboratory is used. Carbohydrates play an important role in
formation of tea aroma. Lipid concentration increases with the maturity of the
leaves and is responsible for the formation of C6 volatiles during the manufacture
of black tea. Three types of organic acids are present in tea viz., dicarboxylic
acids, fatty acids and monocyclic acids. Monocyclic acids (e.g., Quinic and
Shikimic) are the precursors of polyphenols. Chlorophyll a and b are reported to
be present in the tea and are converted to pheophytins which are responsible for
black colour of commercial tea. ß-carotene is the major compound among the
carotenoids and degrades to character-impact volatile compounds such as
theaspirone, ß-ionone and related compounds. Although K (Potassium) is the
major mineral found the Cu (Copper) and Al (Aluminium), are important for the
colour and taste of brewed teas. Theanine is the most abundant amino acid and
accounts for 50% of the total amino acids and 1% of the dry weight of tea.
Theanine is a constituent of the ‘thearubigin’ fraction while glutamic acid and
ethylamine are its precursors. Amino acids and glucose interact with tea
polyphenols during thermal processing and yield coloured moieties and Amadori
products, which improve the flavour of tea.
Catechins theaflavins and thearubigins contribute to the bitterness,
astringency, brightness and total colour of black tea infusion. Further
thearubigins are responsible for body and richness of the tea brew. Theaflavin
digallate is having lowest threshold value for the astringency. Caffeine
contributes towards the bitter taste in tea. Characteristic umami or brothy taste
231
of black teas is due to the presence of amino acids. The ionone related aroma
compounds such as theaspiranes found to have different odour properties. The
aroma quality of tea with respect to theaspiranes is yet to be revealed
completely.
Volatile compounds play a major role in determining the unique flavor of
tea. Although >600 compounds are reported but the unique composition for
character impact aroma of black tea is not yet established. The aroma quality of
black teas with respect to the VFCs is measured by different ratios / indices viz.,
Mahanta ratio, Yamanishi-Botheju ratio, Terpene index, Wickremasinghe-
Yamanishi ratio. Wickremasinghe-Yamanishi ratio is the ratio of sum of the peak
areas of compounds eluting before linalool to the sum of the peak areas linalool
plus all the compounds that elute after linalool. Smaller the ratio better is the
quality. Mahanta ratio is the sum of the peak areas of terpenoids to non-
terpenoids. Yamanishi-Botheju ratio is the ratio of peak area of linalool to E-2-
hexenal. All the three ratios mentioned above have limitations for their
applicability.
Another aroma quality indicator called flavour index (F.I.), the ratio of VFC II
to VFC I is reported for kenyan clonal black teas and F.I. is positively correlated
to tasters evaluations. This confirms that F.I. is a good aroma quality indicator
for Kenyan black teas. However, it should only be used qualitatively since the
olfactory perception limits of individual VFC are different. The FI for Indian black
teas is yet to be explored and the limitation could be wide due to variation in
weather. A new approach in terms of novel quality index for tea has been
232
innovated through this work. The sum of TF/TR ratios of tea and the sum of the
VFC ratios (Yamanishi-Botheju ratio and Mahanta ratio) added together is
proposed for the first time as a new and novel quality index, hence forth referred
to as Borse-Rao quality index, considered to be an overall quality indicator of tea
as both the non-volatiles and volatiles are given due consideration in this quality
index.
Tea is a good source of flavanoid antioxidants which has a role in
prevention of cancer and coronary heart diseases. Tea is known to improve
blood flow, eliminate alcoholic toxins, relieve joint pains and acts as a diuretic
and improves resistance to diseases.
Flavonoids present in tea can effectively stabilize free electrons through
several mechanisms viz., delocalisation of electrons, formation of intramolecular
hydrogen bonds and rearrangement of their molecular structure. This may be
the reason for their antioxidant property. The catechins ranked depending on
their antioxidant potential as ECG > EGCG > EC > GA > GC > EGC > C.
Theaflavins and thearubigens. These inhibited the formation of TBARS and are
more effective than vitamin E, glutathione, vitamin C and synthetic phenolic
antioxidants. Catechins are also found to be the scavengers of peroxynitrites
which are capable of oxidising LDL.
Theaflavins and catechin gallates are more effective scavengers of
aqueous and lypophilic stable radicals than many other flavonoids and many
antioxidant vitamins. The inhibition mechanism of tea flavonoids is independent
of metal ion chelation properties.
233

Tea flavonoids were found to reduce oxidative damage in animals from
radiation, chemical oxidants, diet stress. Drinking of tea beverage was shown to
reduce oxidative biomarkers in chronic smokers. Tea was found to reduce the
metabolism of compounds to known carcinogens and enhance their
detoxification. Thus, it is claimed to inhibit variety of cancers such as
oesophageal, gastrointestinal, lung and skin cancers.
A cup of black tea was three and two times more effective than one serving
of common vegetables and one serving of common fruits respectively.
PROFILING OF INDIAN BLACK TEAS
Indian teas especially Darjeeling, Assam and Nilgiris are valued world
over for their superior aroma and taste.
In order to improve our scientific understanding on objective tea quality
and thereby to help retain supremacy in the world tea trade, it was proposed to
make an in depth study to generate fingerprint profile of teas grown in different
regions of India which ultimately may result in a database with respect to volatile
flavour compounds (VFC) as well as non volatile flavour compounds (NVFC)
which are responsible for aroma, taste and quality of tea.
A study was carried on tea samples collected from nine regions spread
over four seasons. The outcome of the research findings is given below:
234
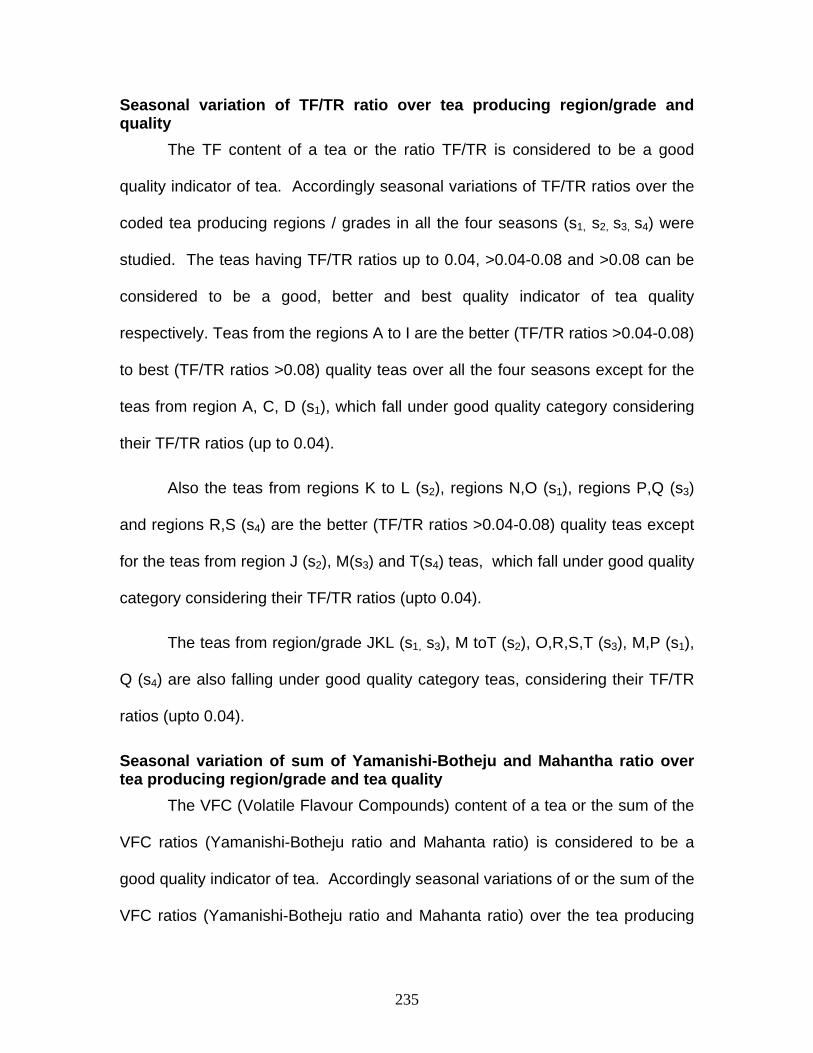
Seasonal variation of TF/TR ratio over tea producing region/grade and quality
The TF content of a tea or the ratio TF/TR is considered to be a good
quality indicator of tea. Accordingly seasonal variations of TF/TR ratios over the
coded tea producing regions / grades in all the four seasons (s1, s2, s3, s4) were
studied. The teas having TF/TR ratios up to 0.04, >0.04-0.08 and >0.08 can be
considered to be a good, better and best quality indicator of tea quality
respectively. Teas from the regions A to I are the better (TF/TR ratios >0.04-0.08)
to best (TF/TR ratios >0.08) quality teas over all the four seasons except for the
teas from region A, C, D (s1), which fall under good quality category considering
their TF/TR ratios (up to 0.04).
Also the teas from regions K to L (s2), regions N,O (s1), regions P,Q (s3)
and regions R,S (s4) are the better (TF/TR ratios >0.04-0.08) quality teas except
for the teas from region J (s2), M(s3) and T(s4) teas, which fall under good quality
category considering their TF/TR ratios (upto 0.04).
The teas from region/grade JKL (s1, s3), M toT (s2), O,R,S,T (s3), M,P (s1),
Q (s4) are also falling under good quality category teas, considering their TF/TR
ratios (upto 0.04).
Seasonal variation of sum of Yamanishi-Botheju and Mahantha ratio over tea producing region/grade and tea quality
The VFC (Volatile Flavour Compounds) content of a tea or the sum of the
VFC ratios (Yamanishi-Botheju ratio and Mahanta ratio) is considered to be a
good quality indicator of tea. Accordingly seasonal variations of or the sum of the
VFC ratios (Yamanishi-Botheju ratio and Mahanta ratio) over the tea producing
235

regions / grades in all the four seasons (s1, s2, s3, s4) were studied. Accordingly,
based on the sum of the VFC ratios (i.e.Yamanishi-Botheju ratio and Mahanta
ratio) the teas can be categorized as a good (upto 1), better (>1-4) and best (>4)
quality indicator of tea respectively.
The teas from regions A to J (all seasons) have better (>1-4) to best (>4)
quality as indicated by sum of the VFC ratios (i.e.Yamanishi-Botheju ratio and
Mahanta ratio) except for teas from regions A,E,F,H,I,J,(s2), K to T (s2),
B,D,F,H,I,J(s1), B,I,J(s3) which are good (up to 1) quality teas, as indicated by
sum of the two VFC ratios. Also, the teas from regions M (s3), O (s1), P (s3),
R,S,T (s4) are good (up to 1) quality teas as indicated by sum of the two VFC
ratios.
Seasonal variation of Borse-Rao quality index over tea producing region/grade and tea quality
The sum of TF/TR ratios of tea and the sum of the VFC ratios (Yamanishi-
Botheju ratio and Mahanta ratio) added together is proposed for the first time as
a new and novel quality index, henceforth referred to as Borse-Rao quality index,
considered to be an overall quality indicator of tea as both the non-volatiles /
volatiles are given due consideration in this quality index. Accordingly seasonal
variations of the Borse-Rao quality index over the coded tea producing regions /
grades in all the four seasons (s1, s2, s3, s4) were studied. Based on the the
Borse-Rao quality index teas can be categorized as a good (up to 1), better (1-4)
and best (>4) quality tea respectively.
236

The teas from regions/grade having Borse-Rao quality index more than
four are C (s2, s4), D (s3, s4), G (s1, s2, s3), H (s3) and I (s4) are the best (>4) quality
teas.
The teas from regions having Borse-Rao quality index ranging from 1 to 4
are A (s1, s2, s3, s4), B (s2, s3, s4), C (s1, s3), E( s3, s4), F( s3, s4), H (s2, s4), I (s3, s4),
J(s2), M (s3) and RS (s4) and indicate that these are better (1-4) quality teas.
The rest of the teas from regions having Borse-Rao quality index upto one are
good quality teas which are B,D,F,H (s1), E,F (s2), I (s1, s2), J,K,L (s3), K-T (s2)
and P-T (s3).
FUNCTIONAL INGREDIENTS FROM UNUSED GREEN TEA LEAVES: BIOACTIVITY AND APPLICATIONS Despite several reports on the radical scavenging activity of green tea
from two leaves and a bud, the radical scavenging activity of green tea from
coarse and pruned leaves in particular is not studied. The pruned and coarse tea
leaves are tea plantation waste, India is one of the largest producers of tea.
Therefore, testing of its radical scavenging properties is of interest primarily in
order to find new promising sources for natural antioxidants. In the present work
preparation of the green teas from the pruned or coarse tea leaves and
optimization of extraction conditions to obtain catechin rich radical scavenging
conserve was carried out with the following two objectives.
1. To isolate active conserves from coarse and pruned green tea leaves.
2. To use the active conserves for food applications
237
Normal, coarse and pruned fresh tea leaves (low grade) were procured
and subjected to enzyme inactivation using cross flow dryer (80-120oC, 4 –
8h), and continuous infra red dryer (70-120oC, 0.5-1.5h) at different
temperature and time intervals. The chemical parameters are found to be
in the following range, Caffeine (1.30-3.20%); Total polyphenols (11.5-
15.5%). Sensory characteristics were found to be similar to that of the
commercial green tea samples.
Forty four compounds have been identified from the volatiles of green teas
by comparison of retention indices as well as mass spectra individual
compounds with that of literature data and also comparing retention times of the
GC peaks with those of reference compounds run under identical conditions,
wherever possible. The broad classification of the compounds identified includes
ten terpenoids, three aromatic compounds, eight alcohols, seven aldehydes, four
acids, eight esters and four compounds derived from carotenoids. Ethyl hex-
(2E)-enoate and dihydroactinidiolide are exclusively present in the green teas
derived from coarse leaves.
In general, coarse green teas irrespective of the method of processing
contained more number of the volatile constituents, whereas the normal green
teas irrespective of the method of processing contained less number of volatile
constituents eluting before linalool. This can be attributed to the normal leaf
quality, which contributes less volatiles from the group of constituents (Gr. I)
which are undesirable and is the prevalent practice in the industry as well. It is
also evident from the results that normal as well as a commercial sample of
238

green tea contained almost half the number of identified volatile constituents in
the present investigation as compared to the coarse green teas contained.
Dihydroactinidolide and ethyl hexenoate were found to be important markers and
both were present in coarse green teas, whereas both were not found in the
normal green teas including the commercial one. It can be concluded that the
commercial green tea (Nilgiris green tea) is also prepared from the normal tea
leaves. This can be very well used in spotting the normal / coarse green tea or
the admixture of the coarse green tea leaves with the normal green tea leaves.
Other important marker volatiles found were the both heptadienals [(E,Z)-2, 4 /
(E,E)-2,4]. Coarse green tea contained both the heptadienals, whereas normal
green teas did not contain any of the identified heptadienals in the present
investigation. cis-3-hexenyl-n-hexanoate, ∝-ionone, cis-geranylacetone and β-
ionone-5,6-epoxide were not found in a normal green tea. This can be attributed
to the method of processing (CFD) and higher temperature (110°C) used.
Green tea extract
The extraction of green tea samples at lab scale, using different solvents
(viz., Ethyl acetate, acetone, ethyl alcohol, methyl alcohol and their aqueous
mixtures) was carried out.
The radical scavenging activity (RSA) of these extractives at 50 and 100
ppm concentrations were evaluated using the DPPH model system. The order of
activity and extractability are as follows: Methanol > Ethanol> Acetone > Ethyl
acetate. The aqueous alcoholic mixtures showed higher activity and polyphenol
extractability than the respective single solvents.
239

It was found that the yields of the extractives from green teas of coarse
leaves are relatively low on the expected lines and also the radical scavenging
activities of the extractives of green teas from coarse leaves are marginally low at
different concentrations. This observation indicated that the green teas from
coarse leaves could be used for the preparation of radical scavenging conserves,
by separating / enriching the active components using suitable technique.
Fractionation of the green tea extract
The extractives were subjected to liquid-liquid extraction using water and
low molecular weight ester to fractionate the catechins into the solvent fraction.
The yields of the solvent extracts are found to be 15±0.8% for coarse leaves and
for normal leaves the yield of solvent extract is found to be 17±0.8%. The yield
of the aqueous extract is 17±0.9 % for coarse leaves and for normal leaves the
yield of solvent extract is found to be 19 ±1.0 %. These extracts were analyzed
for total polyphenol content and evaluated for radical scavenging activity. The
polyphenol content of the solvent extracts found to be 30±2.3% as gallic acid
equivalents for coarse leaves, while, polyphenol content of the solvent extract of
normal leaves is found to be 31±2.4% as gallic acid equivalents. The total
polyphenol content in the aqueous portion of these extracts is 23±2.1% as gallic
acid equivalents for normal leaves, while that for coarse leaves extracts is found
to be 18±3.0% as gallic acid equivalents. However, the radical scavenging
activity of the solvent extracts from both normal and coarse leaves is found to be
same (92±1% at 15 ppm). The RSA of the aqueous extracts is found to be
240

lower. Hence, it may be concluded that the solvent selectively separated the
compounds responsible for the radical scavenging activity.
The data obtained reveal that the green tea extracts / conserve is free
radical inhibitor and primary antioxidant that react with DPPH radical, which may
be attributed to its hydrogen donating ability.
HPLC profiling of green tea extractives, chemical composition and quantification
The total catechin content in the green tea extract based on the
comparison of peak areas of each peak with that of authentic samples and from
calibration curves was found to be in the range of 20–30 %. After fractionation
the solvent extract is enriched with catechins and the total catechin content is
found to be in the range of 55-85 %, while the HPLC profile of aqueous extracts
showed only the presence of gallic acid and caffeine.
Extracts from unused fresh green tea leaves have the potential for large-
scale application as natural antioxidants. Extracts of the green tea are becoming
increasingly important as functional ingredients in the diet and are being added to
a range of foods and beverages.
Improved method for the active conserve
To minimize the processing cost and to control the epimerisation of
catechins during processing, alternate methods were explored. Green tea
sample from fresh batch was subjected to aqueous alcoholic extraction. The
extract was concentrated to remove the alcohol to the extent possible. The
obtained miscella was cooled to 10oC and kept over night at that temperature.
241

The separated solids were filtered and dissolved in low molecular weight ester
and the filtrate was also treated with the same ester. Solvent was removed from
the combined portion and the yield was found to be 12±2%. Both aqueous and
ester portions were subjected to HPLC analyses. Ester soluble portion was
found to contain most of the catechins. The aqueous portion (filtrate) was freeze
dried and the solid yield was ~12±2%. Total polyphenol content and Radical
scavenging activity (RSA) of the aqueous portion and ester portions were
evaluated. RSA of the aqueous portion was found to be in the range of 70-85%
at 40-50 ppm concentration, while that of ester portion was in the range of 85-
90% at 10-15 ppm concentrations. The total polyphenol content in the aqueous
portion was found to be 23-25%, while that of in the ester portion are in the range
of 27-32%.
Economics of the process for catechin conserve
Cost of production (Basis: 800kg leaves/shift; 3 shifts/day; 300day)
Total cost of production per annum = Rs. 1, 91, 80, 000/-
Tea catechin conserve = Rs.1332/kg,Total sales envisaged = Rs. 2, 53, 44, 000/-
Market Price and returns
Tea catechin conserve = Rs.1600/kg, Tea gallic acid conserve = Rs.160/kg
Break even capacity = 38%
Basis- 2 shifts / day
Return on investment = 23%, Payback period = 4.35 Y
Basis- 3 shifts / day
Return on investment = 41%, Payback period = 2.43 Y
242

Catechin-rich nutraceutical ice-cream
Ice-cream was prepared using the other ingredients along with the
tea polyphenol conserve. The concentration of tea catechin conserve was tried
in the range of 5-200 ppm. The optimum range of tea catechin concentration was
found to be in the range of 20-30 ppm.
The results of the sensory analysis for ice-cream with tea antioxidant
extract show that 15% of the respondents rated under ‘Like Very Much (LVM)’,
45% of the respondents under ‘Like moderately (LM)’ and another 40% under
‘Like Slightly (LS)'. However the ice-cream samples are acceptable as the scores
are falling on ‘Like’ category.
Catechin-rich nutraceutical cookies
The cookies were prepared using the required food ingredients along with
green tea catechin conserve. The concentration of green tea catechin conserve
was tried in the range of 10-400 ppm. The optimum concentration was found to
be in the range of 20-50 ppm by sensory evaluation.
The results of the sensory analysis indicated that 53% of the respondents
rated cookies as ‘LVM’, 32% of the respondents rated it as ‘LM’ and 15% of the
respondents rated it as ‘LS’ indicating the product is acceptable. As the results
are falling on the ‘Like’ category, the product is acceptable.
243

CONCLUSIONS
India is a long time leading tea producer except for the recent overtake by
the China. India can boast of world class teas called trinitea - the Darjeeling,
Assam and Nilgiris tea.
Black tea is the most consumed form of tea having health promoting
attributes. But more focused research is needed to the understand the Science
behind it’s health benefits to realize health and wellness.
The profile of Indian black teas in terms of a bio-chemical fingerprint is
carried out in present study which will not only help in understanding the intrinsic
quality objectively but also help in tracing the origin of the teas based on the
markers identified.
For the first time a novel approach has been evolved to mark teas on the
basis of TF/TR ratio, flavour indices and a novel tea quality index (Borse-Rao
quality index) is proposed which takes both volatiles and non-volatiles into
account. However, further more research is needed to simplify the tea quality
evaluation.
Processes for utilization of pruned/coarse green tea leaves (a plantation
waste) have been worked out. A novel process for green tea preparation has
been standardized and patented.
Processes for isolation, fractionation and enrichment (50-70 % catechin)
and separation of radical scavenging conserve (10-15 ppm, 90-94% RSA) from
pruned/coarse green tea leaves have been standardized and patented.
244

245
Application of this catechin-rich radical scavenging conserve in
nutraceutical ice-cream and cookies was worked out and patented.
Tea being India’s strength, further more research work is needed in this
direction to tap the potential of health benefits of tea and its high value products.
Further there is need for developing more economical and efficient
processes.