BILLABONG INTERNATIONAL LIMITED ABN Financial year ended ... · Billabong International Limited...
137
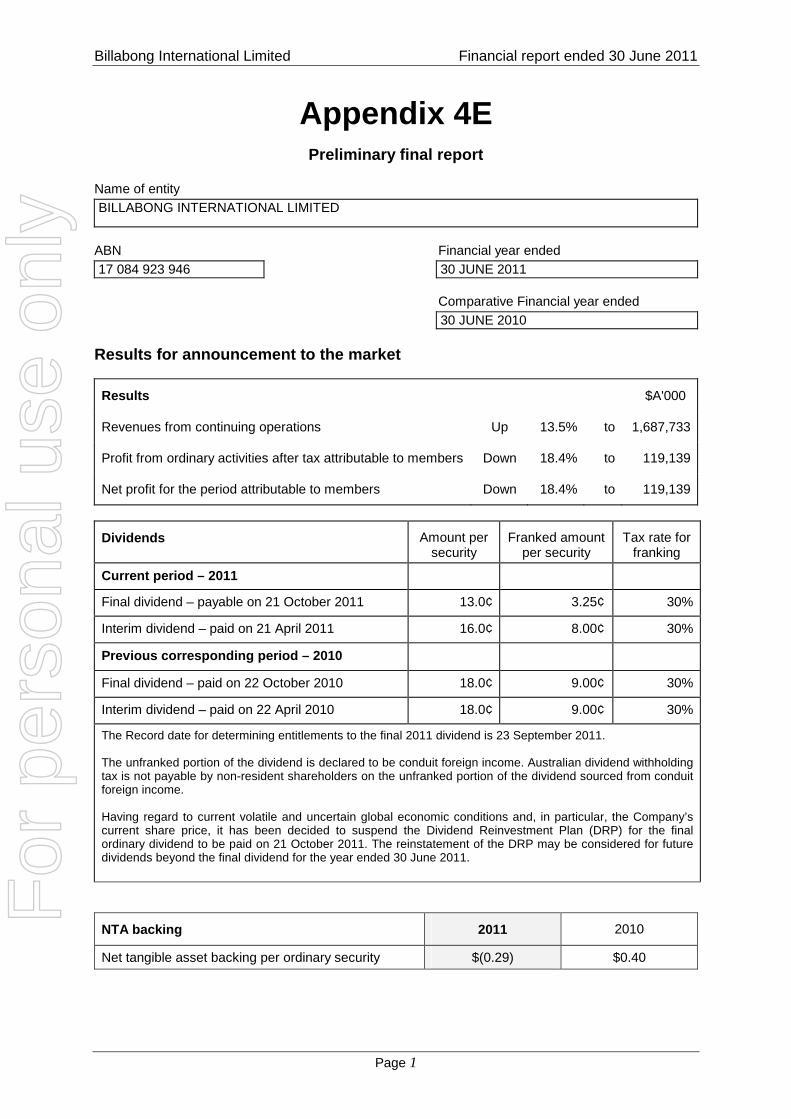
Billabong International Limited Financial report ended 30 June 2011 Page 1 Appendix 4E Preliminary final report Name of entity BILLABONG INTERNATIONAL LIMITED ABN Financial year ended 17 084 923 946 30 JUNE 2011 Comparative Financial year ended 30 JUNE 2010 Results for announcement to the market Results $A'000 Revenues from continuing operations Up 13.5% to 1,687,733 Profit from ordinary activities after tax attributable to members Down 18.4% to 119,139 Net profit for the period attributable to members Down 18.4% to 119,139 Dividends Amount per security Franked amount per security Tax rate for franking Current period – 2011 Final dividend – payable on 21 October 2011 13.0¢ 3.25¢ 30% Interim dividend – paid on 21 April 2011 16.0¢ 8.00¢ 30% Previous corresponding period – 2010 Final dividend – paid on 22 October 2010 18.0¢ 9.00¢ 30% Interim dividend – paid on 22 April 2010 18.0¢ 9.00¢ 30% The Record date for determining entitlements to the final 2011 dividend is 23 September 2011. The unfranked portion of the dividend is declared to be conduit foreign income. Australian dividend withholding tax is not payable by non-resident shareholders on the unfranked portion of the dividend sourced from conduit foreign income. Having regard to current volatile and uncertain global economic conditions and, in particular, the Company’s current share price, it has been decided to suspend the Dividend Reinvestment Plan (DRP) for the final ordinary dividend to be paid on 21 October 2011. The reinstatement of the DRP may be considered for future dividends beyond the final dividend for the year ended 30 June 2011. NTA backing 2011 2010 Net tangible asset backing per ordinary security $(0.29) $0.40 For personal use only
Transcript of BILLABONG INTERNATIONAL LIMITED ABN Financial year ended ... · Billabong International Limited...
Billabong International Limited Financial report ended 30 June 2011
Page 1
Appendix 4E
Preliminary final report Name of entity BILLABONG INTERNATIONAL LIMITED
ABN Financial year ended 17 084 923 946 30 JUNE 2011 Comparative Financial year ended 30 JUNE 2010 Results for announcement to the market
Results $A'000
Revenues from continuing operations Up 13.5% to 1,687,733
Profit from ordinary activities after tax attributable to members Down 18.4% to 119,139
Net profit for the period attributable to members Down 18.4% to 119,139
Dividends Amount per security
Franked amount per security
Tax rate for franking
Current period – 2011
Final dividend – payable on 21 October 2011 13.0¢ 3.25¢ 30%
Interim dividend – paid on 21 April 2011 16.0¢ 8.00¢ 30%
Previous corresponding period – 2010
Final dividend – paid on 22 October 2010 18.0¢ 9.00¢ 30%
Interim dividend – paid on 22 April 2010 18.0¢ 9.00¢ 30%
The Record date for determining entitlements to the final 2011 dividend is 23 September 2011. The unfranked portion of the dividend is declared to be conduit foreign income. Australian dividend withholding tax is not payable by non-resident shareholders on the unfranked portion of the dividend sourced from conduit foreign income. Having regard to current volatile and uncertain global economic conditions and, in particular, the Company’s current share price, it has been decided to suspend the Dividend Reinvestment Plan (DRP) for the final ordinary dividend to be paid on 21 October 2011. The reinstatement of the DRP may be considered for future dividends beyond the final dividend for the year ended 30 June 2011.
NTA backing 2011 2010
Net tangible asset backing per ordinary security $(0.29) $0.40
For
per
sona
l use
onl
y

Billabong International Limited Financial report ended 30 June 2011
Page 2
Compliance statement This report is based on the consolidated financial report which has been audited. Refer to the attached full financial report for all other disclosures in respect of the Appendix 4E.
Signed: ............................................................ Date: 19 August 2011 Derek O'Neill Chief Executive Officer
For
per
sona
l use
onl
y

Billabong International
Limited ABN 17 084 923 946
Contents Page
Directors’ report 2
Auditor’s independence declaration 42
Corporate governance statement 43
Financial report 51
Directors’ declaration 130
Independent auditor’s report to the members 131
Shareholder information 133
: : FULL FINANCIAL REPORT 2010 - 11
For
per
sona
l use
onl
y

Directors’ report : :
Billabong International Limited 2010-11 Full Financial Report Page 2
Your Directors present their report on the consolidated entity (referred to hereafter as the Group) consisting of Billabong International Limited (the Company) and the entities it controlled at the end of, or during, the year ended 30 June 2011. Directors The following persons were Directors of Billabong International Limited during the whole of the financial year and up to the date of this report: E.T. Kunkel D. O’Neill A.G. Froggatt M.A. Jackson F.A. McDonald G.S. Merchant P. Naude C. Paull Principal activities During the year the principal continuing activities of the Group consisted of the wholesaling and retailing of surf, skate, snow and sports apparel, accessories and hardware, and the licensing of the Group trademarks to specified regions of the world. Dividends – Billabong International Limited Dividends paid to members during the financial year were as follows:
$’000
• Final ordinary dividend partially franked to 50% for the year ended 30 June 2010 of 18.0 cents per fully paid share paid on 22 October 2010
45,562
• Interim ordinary dividend partially franked to 50% for the half-year ended 31 December 2010 of 16.0 cents per fully paid share paid on 21 April 2011
40,578
86,140 In addition to the above dividends, since the end of the financial year the Directors have resolved to pay a final ordinary dividend partially franked to 25% of $33.0 million (13.0 cents per fully paid share) to be paid on 21 October 2011 out of retained profits at 30 June 2011. The unfranked portion of the dividend is declared to be conduit foreign income. Australian dividend withholding tax is not payable by non-resident shareholders on the unfranked portion of the dividend sourced from conduit foreign income. Having regard to current volatile and uncertain global economic conditions and, in particular, the Company’s current share price, it has been decided to suspend the Dividend Reinvestment Plan (DRP) for the final ordinary dividend to be paid on 21 October 2011. The reinstatement of the DRP may be considered for future dividends beyond the final dividend for the year ended 30 June 2011.
For
per
sona
l use
onl
y
Directors’ report : :
Billabong International Limited 2010-11 Full Financial Report Page 3
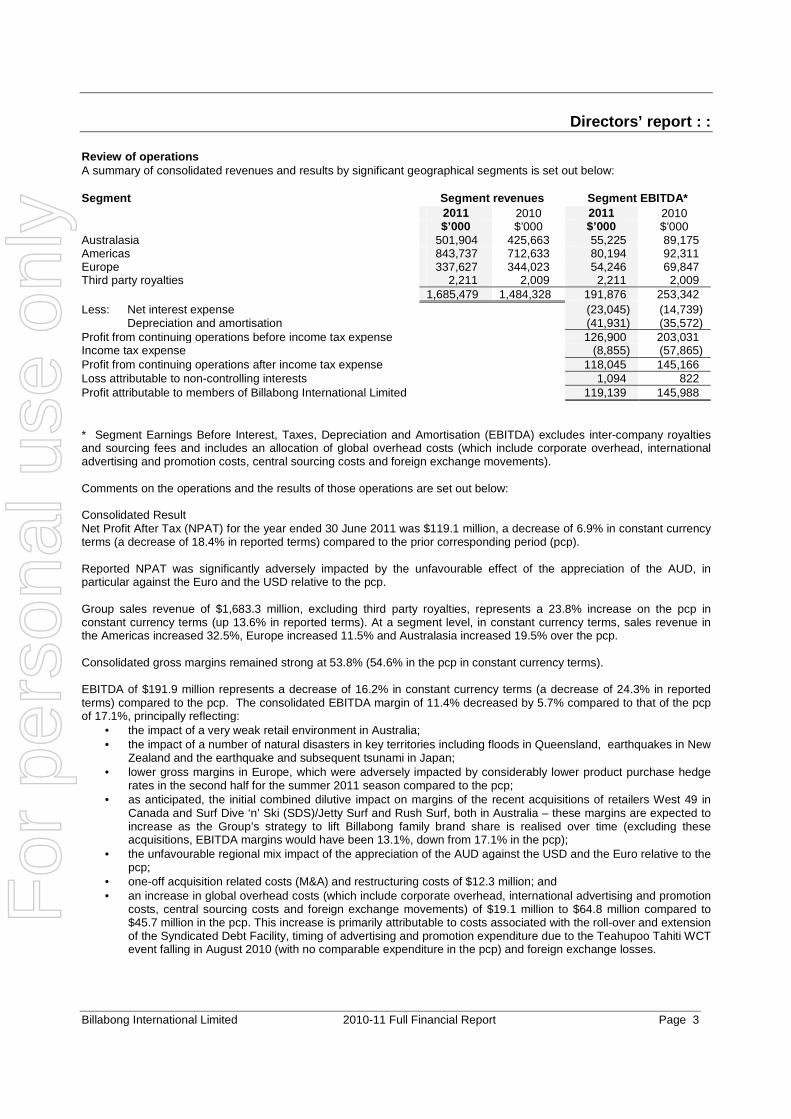
Review of operations A summary of consolidated revenues and results by significant geographical segments is set out below: Segment Segment revenues Segment EBITDA*
2011 2010 2011 2010 $’000 $’000 $’000 $’000
Australasia 501,904 425,663 55,225 89,175 Americas 843,737 712,633 80,194 92,311 Europe 337,627 344,023 54,246 69,847 Third party royalties 2,211 2,009 2,211 2,009 1,685,479 1,484,328 191,876 253,342 Less: Net interest expense (23,045) (14,739) Depreciation and amortisation (41,931) (35,572) Profit from continuing operations before income tax expense 126,900 203,031 Income tax expense (8,855) (57,865) Profit from continuing operations after income tax expense 118,045 145,166 Loss attributable to non-controlling interests 1,094 822 Profit attributable to members of Billabong International Limited 119,139 145,988 * Segment Earnings Before Interest, Taxes, Depreciation and Amortisation (EBITDA) excludes inter-company royalties and sourcing fees and includes an allocation of global overhead costs (which include corporate overhead, international advertising and promotion costs, central sourcing costs and foreign exchange movements). Comments on the operations and the results of those operations are set out below: Consolidated Result Net Profit After Tax (NPAT) for the year ended 30 June 2011 was $119.1 million, a decrease of 6.9% in constant currency terms (a decrease of 18.4% in reported terms) compared to the prior corresponding period (pcp). Reported NPAT was significantly adversely impacted by the unfavourable effect of the appreciation of the AUD, in particular against the Euro and the USD relative to the pcp. Group sales revenue of $1,683.3 million, excluding third party royalties, represents a 23.8% increase on the pcp in constant currency terms (up 13.6% in reported terms). At a segment level, in constant currency terms, sales revenue in the Americas increased 32.5%, Europe increased 11.5% and Australasia increased 19.5% over the pcp. Consolidated gross margins remained strong at 53.8% (54.6% in the pcp in constant currency terms). EBITDA of $191.9 million represents a decrease of 16.2% in constant currency terms (a decrease of 24.3% in reported terms) compared to the pcp. The consolidated EBITDA margin of 11.4% decreased by 5.7% compared to that of the pcp of 17.1%, principally reflecting:
• the impact of a very weak retail environment in Australia; • the impact of a number of natural disasters in key territories including floods in Queensland, earthquakes in New
Zealand and the earthquake and subsequent tsunami in Japan; • lower gross margins in Europe, which were adversely impacted by considerably lower product purchase hedge
rates in the second half for the summer 2011 season compared to the pcp; • as anticipated, the initial combined dilutive impact on margins of the recent acquisitions of retailers West 49 in
Canada and Surf Dive ‘n’ Ski (SDS)/Jetty Surf and Rush Surf, both in Australia – these margins are expected to increase as the Group’s strategy to lift Billabong family brand share is realised over time (excluding these acquisitions, EBITDA margins would have been 13.1%, down from 17.1% in the pcp);
• the unfavourable regional mix impact of the appreciation of the AUD against the USD and the Euro relative to the pcp;
• one-off acquisition related costs (M&A) and restructuring costs of $12.3 million; and • an increase in global overhead costs (which include corporate overhead, international advertising and promotion
costs, central sourcing costs and foreign exchange movements) of $19.1 million to $64.8 million compared to $45.7 million in the pcp. This increase is primarily attributable to costs associated with the roll-over and extension of the Syndicated Debt Facility, timing of advertising and promotion expenditure due to the Teahupoo Tahiti WCT event falling in August 2010 (with no comparable expenditure in the pcp) and foreign exchange losses.
For
per
sona
l use
onl
y
Directors’ report : :
Billabong International Limited 2010-11 Full Financial Report Page 4
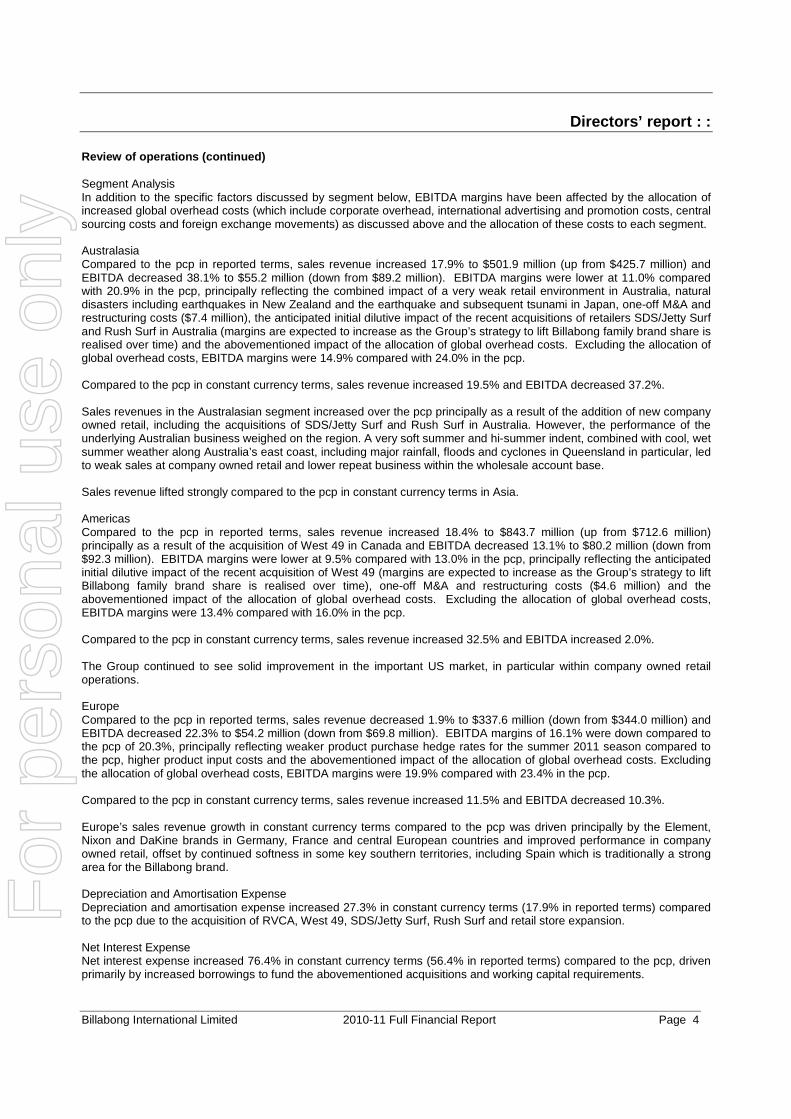
Review of operations (continued) Segment Analysis In addition to the specific factors discussed by segment below, EBITDA margins have been affected by the allocation of increased global overhead costs (which include corporate overhead, international advertising and promotion costs, central sourcing costs and foreign exchange movements) as discussed above and the allocation of these costs to each segment. Australasia Compared to the pcp in reported terms, sales revenue increased 17.9% to $501.9 million (up from $425.7 million) and EBITDA decreased 38.1% to $55.2 million (down from $89.2 million). EBITDA margins were lower at 11.0% compared with 20.9% in the pcp, principally reflecting the combined impact of a very weak retail environment in Australia, natural disasters including earthquakes in New Zealand and the earthquake and subsequent tsunami in Japan, one-off M&A and restructuring costs ($7.4 million), the anticipated initial dilutive impact of the recent acquisitions of retailers SDS/Jetty Surf and Rush Surf in Australia (margins are expected to increase as the Group’s strategy to lift Billabong family brand share is realised over time) and the abovementioned impact of the allocation of global overhead costs. Excluding the allocation of global overhead costs, EBITDA margins were 14.9% compared with 24.0% in the pcp. Compared to the pcp in constant currency terms, sales revenue increased 19.5% and EBITDA decreased 37.2%. Sales revenues in the Australasian segment increased over the pcp principally as a result of the addition of new company owned retail, including the acquisitions of SDS/Jetty Surf and Rush Surf in Australia. However, the performance of the underlying Australian business weighed on the region. A very soft summer and hi-summer indent, combined with cool, wet summer weather along Australia’s east coast, including major rainfall, floods and cyclones in Queensland in particular, led to weak sales at company owned retail and lower repeat business within the wholesale account base. Sales revenue lifted strongly compared to the pcp in constant currency terms in Asia. Americas Compared to the pcp in reported terms, sales revenue increased 18.4% to $843.7 million (up from $712.6 million) principally as a result of the acquisition of West 49 in Canada and EBITDA decreased 13.1% to $80.2 million (down from $92.3 million). EBITDA margins were lower at 9.5% compared with 13.0% in the pcp, principally reflecting the anticipated initial dilutive impact of the recent acquisition of West 49 (margins are expected to increase as the Group’s strategy to lift Billabong family brand share is realised over time), one-off M&A and restructuring costs ($4.6 million) and the abovementioned impact of the allocation of global overhead costs. Excluding the allocation of global overhead costs, EBITDA margins were 13.4% compared with 16.0% in the pcp. Compared to the pcp in constant currency terms, sales revenue increased 32.5% and EBITDA increased 2.0%. The Group continued to see solid improvement in the important US market, in particular within company owned retail operations. Europe Compared to the pcp in reported terms, sales revenue decreased 1.9% to $337.6 million (down from $344.0 million) and EBITDA decreased 22.3% to $54.2 million (down from $69.8 million). EBITDA margins of 16.1% were down compared to the pcp of 20.3%, principally reflecting weaker product purchase hedge rates for the summer 2011 season compared to the pcp, higher product input costs and the abovementioned impact of the allocation of global overhead costs. Excluding the allocation of global overhead costs, EBITDA margins were 19.9% compared with 23.4% in the pcp. Compared to the pcp in constant currency terms, sales revenue increased 11.5% and EBITDA decreased 10.3%. Europe’s sales revenue growth in constant currency terms compared to the pcp was driven principally by the Element, Nixon and DaKine brands in Germany, France and central European countries and improved performance in company owned retail, offset by continued softness in some key southern territories, including Spain which is traditionally a strong area for the Billabong brand. Depreciation and Amortisation Expense Depreciation and amortisation expense increased 27.3% in constant currency terms (17.9% in reported terms) compared to the pcp due to the acquisition of RVCA, West 49, SDS/Jetty Surf, Rush Surf and retail store expansion. Net Interest Expense Net interest expense increased 76.4% in constant currency terms (56.4% in reported terms) compared to the pcp, driven primarily by increased borrowings to fund the abovementioned acquisitions and working capital requirements.
For
per
sona
l use
onl
y
Directors’ report : :
Billabong International Limited 2010-11 Full Financial Report Page 5
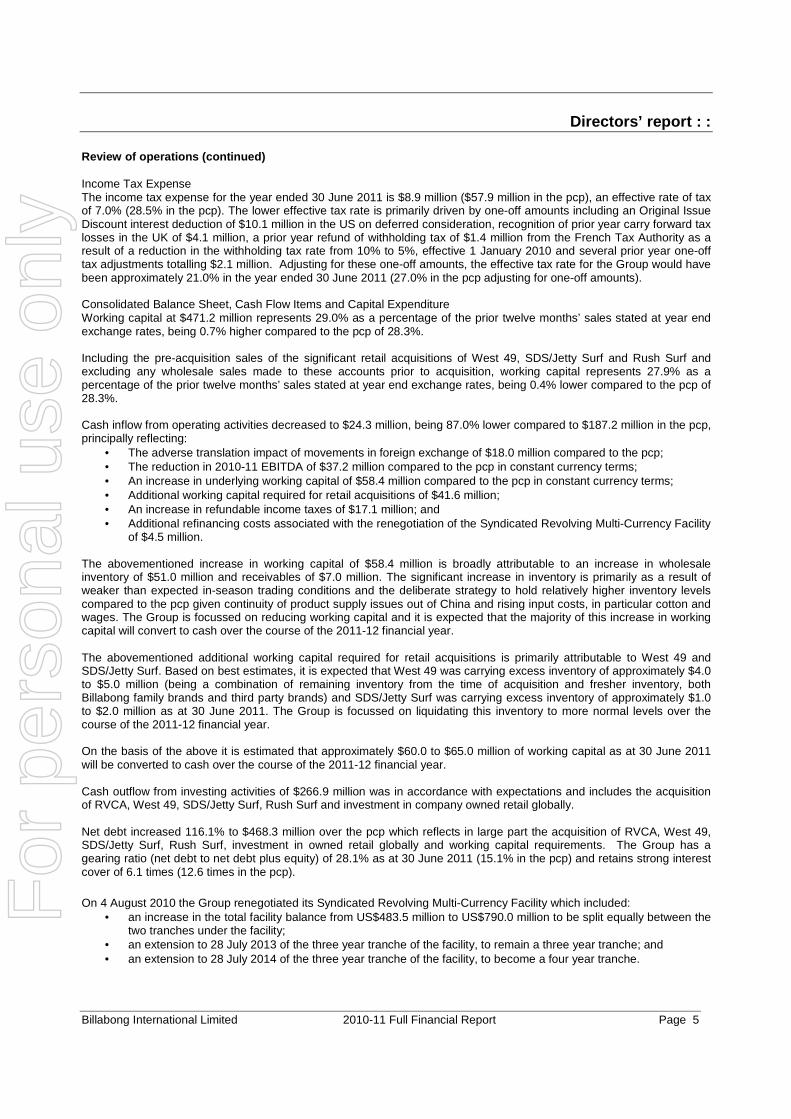
Review of operations (continued) Income Tax Expense The income tax expense for the year ended 30 June 2011 is $8.9 million ($57.9 million in the pcp), an effective rate of tax of 7.0% (28.5% in the pcp). The lower effective tax rate is primarily driven by one-off amounts including an Original Issue Discount interest deduction of $10.1 million in the US on deferred consideration, recognition of prior year carry forward tax losses in the UK of $4.1 million, a prior year refund of withholding tax of $1.4 million from the French Tax Authority as a result of a reduction in the withholding tax rate from 10% to 5%, effective 1 January 2010 and several prior year one-off tax adjustments totalling $2.1 million. Adjusting for these one-off amounts, the effective tax rate for the Group would have been approximately 21.0% in the year ended 30 June 2011 (27.0% in the pcp adjusting for one-off amounts). Consolidated Balance Sheet, Cash Flow Items and Capital Expenditure Working capital at $471.2 million represents 29.0% as a percentage of the prior twelve months’ sales stated at year end exchange rates, being 0.7% higher compared to the pcp of 28.3%. Including the pre-acquisition sales of the significant retail acquisitions of West 49, SDS/Jetty Surf and Rush Surf and excluding any wholesale sales made to these accounts prior to acquisition, working capital represents 27.9% as a percentage of the prior twelve months’ sales stated at year end exchange rates, being 0.4% lower compared to the pcp of 28.3%. Cash inflow from operating activities decreased to $24.3 million, being 87.0% lower compared to $187.2 million in the pcp, principally reflecting:
• The adverse translation impact of movements in foreign exchange of $18.0 million compared to the pcp; • The reduction in 2010-11 EBITDA of $37.2 million compared to the pcp in constant currency terms; • An increase in underlying working capital of $58.4 million compared to the pcp in constant currency terms; • Additional working capital required for retail acquisitions of $41.6 million; • An increase in refundable income taxes of $17.1 million; and • Additional refinancing costs associated with the renegotiation of the Syndicated Revolving Multi-Currency Facility
of $4.5 million.
The abovementioned increase in working capital of $58.4 million is broadly attributable to an increase in wholesale inventory of $51.0 million and receivables of $7.0 million. The significant increase in inventory is primarily as a result of weaker than expected in-season trading conditions and the deliberate strategy to hold relatively higher inventory levels compared to the pcp given continuity of product supply issues out of China and rising input costs, in particular cotton and wages. The Group is focussed on reducing working capital and it is expected that the majority of this increase in working capital will convert to cash over the course of the 2011-12 financial year. The abovementioned additional working capital required for retail acquisitions is primarily attributable to West 49 and SDS/Jetty Surf. Based on best estimates, it is expected that West 49 was carrying excess inventory of approximately $4.0 to $5.0 million (being a combination of remaining inventory from the time of acquisition and fresher inventory, both Billabong family brands and third party brands) and SDS/Jetty Surf was carrying excess inventory of approximately $1.0 to $2.0 million as at 30 June 2011. The Group is focussed on liquidating this inventory to more normal levels over the course of the 2011-12 financial year. On the basis of the above it is estimated that approximately $60.0 to $65.0 million of working capital as at 30 June 2011 will be converted to cash over the course of the 2011-12 financial year. Cash outflow from investing activities of $266.9 million was in accordance with expectations and includes the acquisition of RVCA, West 49, SDS/Jetty Surf, Rush Surf and investment in company owned retail globally. Net debt increased 116.1% to $468.3 million over the pcp which reflects in large part the acquisition of RVCA, West 49, SDS/Jetty Surf, Rush Surf, investment in owned retail globally and working capital requirements. The Group has a gearing ratio (net debt to net debt plus equity) of 28.1% as at 30 June 2011 (15.1% in the pcp) and retains strong interest cover of 6.1 times (12.6 times in the pcp). On 4 August 2010 the Group renegotiated its Syndicated Revolving Multi-Currency Facility which included:
• an increase in the total facility balance from US$483.5 million to US$790.0 million to be split equally between the two tranches under the facility;
• an extension to 28 July 2013 of the three year tranche of the facility, to remain a three year tranche; and • an extension to 28 July 2014 of the three year tranche of the facility, to become a four year tranche.
For
per
sona
l use
onl
y
Directors’ report : :
Billabong International Limited 2010-11 Full Financial Report Page 6
Review of operations (continued) The renegotiation of this facility provides the Group with improved tenor and lower borrowing margins compared to those available when the Group rolled over a portion of the facility on 11 August 2009. On 30 June 2011, the Group renegotiated its US$100.0 million unsecured multi-currency drawdown facility which included an extension to 28 July 2013 of the facility which was previously due for roll-over on or before 1 July 2012. The renegotiation of this facility provides the Group with improved tenor and lower borrowing margins compared to those available when the Group rolled over the facility on 7 September 2009. Significant changes in the state of affairs During the year the Group acquired several retail banners in North America and Australia. These acquisitions reflect the execution of various strategic moves to enhance the route to market for the Group’s compelling brand portfolio. As a result of these acquisitions, segment revenue from retail represents 38% of the Group’s total turnover for the year ended 30 June 2011 (2010: 24%). For details of these acquisitions see note 35 to the full financial statements. As a result of these retail acquisitions the Group’s financial results are heavily skewed towards the month of December given the Christmas trading period, with the month of June also remaining an important trading month for the wholesale side of the business. Other than the above there were no significant changes in the state of affairs of the Group during the financial year. Matters subsequent to the end of the financial year On 3 August 2011 the majority of the deferred consideration payment in relation to Nixon was paid with the remaining amount outstanding subject to the finalisation of a review of the taxation treatment of the payment in the hands of the recipients. The remaining amount outstanding is expected to be paid within the next year and other than this amount no further amounts are due in relation to this acquisition. Other than the item mentioned above, there has not arisen in the interval between the end of the financial year and the date of this report any item, transaction or event of a material and unusual nature likely, in the opinion of the Directors of the Group, to affect significantly the operations of the Group, the results of those operations, or the state of affairs of the Group, in future financial years. Likely developments and expected results of operati ons The Group anticipates strong underlying growth in earnings before interest, tax, depreciation and amortisation (EBITDA) in the 2011-12 financial year as the benefits of vertical margins, cost rationalisation and synergies from acquired assets flow through the business. At the NPAT line, this strong underlying growth in EBITDA will be significantly reduced by a higher effective tax rate as the Group cycles the one-off tax benefits included in the 2010-11 financial year. Twelve months ago the Group communicated the likely financial benefits from its evolving business strategy. At the time, the Group indicated that it was anticipating Earnings Per Share (EPS) growth rates in excess of 10% in constant currency terms to return from 2011-12. This guidance was predicated upon a global recovery gradually taking hold. With the exception of the USA and some Asian territories, global trading conditions have generally deteriorated significantly. This has been exacerbated by the recent global economic uncertainties and extreme volatility in currencies, especially the AUD/USD. Until there is more visibility of these matters, and more particularly their effect on consumer spending patterns and hence the quantum of underlying growth in EBITDA, the Group will not offer EPS guidance. Further information on likely developments in the operations of the Group and the expected results of operations have not been included in this report because the Directors believe it would be likely to result in unreasonable prejudice to the Group. Environmental regulation The Group, while not subject to any significant environmental regulation or mandatory emissions reporting, voluntarily measures its carbon emissions using the National Greenhouse and Energy Reporting Act 2007.
For
per
sona
l use
onl
y

Directors’ report : :
Billabong International Limited 2010-11 Full Financial Report Page 7
Information on Directors TED KUNKEL (Non-Executive Chairman)
Experience and expertise Previously the President and Chief Executive Officer of Foster’s Group Limited and associated companies. Mr Kunkel has extensive international business experience. Appointed Non-Executive Director on 19 February 2001. Other current directorships None. Former directorships in last 3 years None. Special responsibilities Chairman of the Board and Nominations Committee and member of Human Resource and Remuneration and Audit Committees. Interests in shares and options 116,435 ordinary shares in Billabong International Limited. DEREK O’NEILL (Executive Director)
Experience and expertise Derek O'Neill was appointed as Chief Executive Officer effective 1 January 2003. He has previously held senior management positions with Billabong, including General Manager of Billabong’s European operations from 1992 to 2003. In 2002, Mr O’Neill was awarded a Chevalier d'Ordre de Merite Nationale for services to business in France. Appointed Executive Director on 5 March 2002. Other current directorships None. Former directorships in last 3 years None. Special responsibilities Chief Executive Officer. Interests in shares and options 1,362,016 ordinary shares in Billabong International Limited. 278,609 share rights in Billabong International Limited. 629,007 options in Billabong International Limited. F
or p
erso
nal u
se o
nly
Directors’ report : :
Billabong International Limited 2010-11 Full Financial Report Page 8
Information on Directors (continued) TONY FROGGATT (Non-Executive Director) Experience and expertise Tony Froggatt was the Chief Executive Officer of Scottish and Newcastle PLC brewing company based in Edinburgh, UK until he retired on 31 October 2007 to return to Australia. He has extensive marketing and distribution knowledge in Australia, Western and Central Europe and Asia particularly in the international food and beverages sectors. Appointed Non-Executive Director on 21 February 2008. Other current directorships Brambles Limited, since 21 August 2006. Coca-Cola Amatil Limited, since 1 December 2010. Former directorships in last 3 years AXA Asia Pacific Holdings Limited from 16 April 2008 to 30 March 2011. National Mutual Life Association of Australasia Ltd from 16 April 2008 to 30 March 2011. Special responsibilities Member of Nominations, Human Resource and Remuneration and Audit Committees. Interests in shares and options 7,505 ordinary shares in Billabong International Limited. MARGARET JACKSON AC (Non-Executive Director)
Experience and expertise Margaret Jackson was a Partner of KPMG Peat Marwick’s Management Consulting Division and National Chairman of the KPMG Micro Economic Reform Group until 30 June 1992, when she resigned to pursue a full-time career as a company director. Ms Jackson previously served as a Director of Australia and New Zealand Banking Group Limited, The Broken Hill Proprietary Company Limited, Pacific Dunlop Limited, John Fairfax Holdings Limited, Southcorp Limited and Chairman of Qantas Airways Limited. Margaret is also President of Australian Volunteers International and the Advisory Board Chairman for the Salvation Army Southern Territory. Margaret was awarded a Companion of the Order of Australia in the General Division (AC) in June 2003 for service to business in diverse and leading Australian corporations and to the community in the area of support for medical research, the arts and education. Appointed Non-Executive Director on 4 July 2000. Other current directorships FlexiGroup Limited, director and Chairman since 20 November 2006. Former directorships in last 3 years Australia and New Zealand Banking Group Limited, director from 22 March 1994 to 21 March 2009. Special responsibilities Chairman of Human Resource and Remuneration Committee and member of Nominations and Audit Committees. Interests in shares and options 280,175 ordinary shares in Billabong International Limited.
For
per
sona
l use
onl
y

Directors’ report : :
Billabong International Limited 2010-11 Full Financial Report Page 9
Information on Directors (continued) ALLAN MCDONALD (Non-Executive Director)
Experience and expertise Allan McDonald has extensive experience in the investment and commercial banking fields and is presently associated with a number of companies as a consultant and company director. Appointed Non-Executive Director on 4 July 2000. Other current directorships Multiplex SITES Trust (director of responsible entity, Brookfield Funds Management Limited), director since 22 October 2003 and chairman from May 2005. Astro Japan Property Group, stapled securities of Astro Japan Property Group Limited (director) and Astro Japan Property Trust (director of responsible entity, Astro Japan Property Management Limited), director and chairman since 19 February 2005. Brookfield Australian Opportunities Fund, Multiplex European Property Fund and Brookfield Prime Property Fund (director of responsible entity, Brookfield Capital Management Limited) director and chairman since 1 January 2010. Brookfield Office Properties Inc. (dual listed on NYSE and TSX), director since 4 May 2011. Former directorships in last 3 years Ross Human Directions Limited, director and chairman from 3 April 2000 to 14 February 2011. Special responsibilities Chairman of Audit Committee and member of Nominations and Human Resource and Remuneration Committees. Interests in shares and options 153,046 ordinary shares in Billabong International Limited. GORDON MERCHANT AM (Non-Executive Director)
Experience and expertise Gordon Merchant founded Billabong’s business in 1973 and has been a major stakeholder in the business since its inception. Mr Merchant has extensive experience in promotion, advertising, sponsorship and design within the surfwear apparel industry. Mr Merchant was awarded a Member of the Order of Australia in the 2010 Australia Day Honours List for service to business, particularly the manufacturing sector, as a supporter of medical, youth and marine conservation organisations, and to surf lifesaving. Appointed Non-Executive Director on 4 July 2000. Other current directorships Plantic Technologies Limited, since 12 April 2005. Former directorships in last 3 years None. Special responsibilities Member of Nominations and Human Resource and Remuneration Committees. Interests in shares and options 37,770,098 ordinary shares in Billabong International Limited.
For
per
sona
l use
onl
y

Directors’ report : :
Billabong International Limited 2010-11 Full Financial Report Page 10
Information on Directors (continued) PAUL NAUDE (Executive Director)
Experience and expertise Paul Naude was appointed President of Billabong's American operations in 1998 and established Billabong USA as a wholly-owned activity in North America. He has been involved in the surfing industry since 1973 with extensive experience in apparel brand management. Appointed Executive Director on 14 November 2002. Other current directorships None. Former directorships in last 3 years None. Special responsibilities General Manager, Billabong Group North America. Interests in shares and options 1,045,988 ordinary shares in Billabong International Limited. 241,450 share rights in Billabong International Limited. 524,170 options in Billabong International Limited. COLETTE PAULL (Non-Executive Director)
Experience and expertise Colette Paull was one of the earliest employees of the Billabong business in 1973. Since that time, Ms Paull has been broadly involved in the development of Billabong’s business from its initial growth within Australia to its expansion as a global brand. Ms Paull previously held the position of Company Secretary until 1 October 1999. Appointed Non-Executive Director on 4 July 2000. Other current directorships Plantic Technologies Limited, since 7 December 2010. Former directorships in last 3 years None. Special responsibilities Member of Nominations and Human Resource and Remuneration Committees. Interests in shares and options 2,973,289 ordinary shares in Billabong International Limited.
For
per
sona
l use
onl
y

Directors’ report : :
Billabong International Limited 2010-11 Full Financial Report Page 11
Company Secretary The Company Secretary is Ms Maria Manning B.Bus (Acc), CPA and FCIS. Ms Manning was appointed to the position of Company Secretary in April 2006. She has over 20 years experience as a Company Secretary of publicly listed companies in Australia. Meetings of Directors The numbers of meetings of the Company’s Board of Directors and of each Board Committee held during the year ended 30 June 2011, and the numbers of meetings attended by each Director were:
Billabong International Limited Board
Audit Committee
Nominations Committee
Human
Resource and Remuneration
Committee
Scheduled Meetings
Unscheduled Meetings
Held Attended Held Attended Held Attended Held Attended Held Attended E.T. Kunkel 9 9 3 3 3 3 5 5 7 7 D. O'Neill 9 9 3 3 * * * * * * A.G. Froggatt 9 9 3 3 3 3 5 5 7 7 M.A. Jackson 9 9 3 3 3 3 5 5 7 7 F.A. McDonald 9 9 3 3 3 3 5 5 7 7 G.S. Merchant 9 9 3 3 2 ** 2 ** 5 5 7 6 P. Naude 9 9 3 2 * * * * * * C. Paull 9 9 3 3 2 ** 2 ** 5 5 7 7
* Not a member of the relevant Committee. ** Not a member of the relevant Committee from December 2010 (refer Corporate Governance Statement).
For
per
sona
l use
onl
y

Directors’ report : :
Billabong International Limited 2010-11 Full Financial Report Page 12
Remuneration Report MESSAGE FROM THE BOARD Dear Shareholders,
During 2010-11 the Board undertook a comprehensive review of Billabong’s approach to executive remuneration. This review was initiated in June 2010 with a view to ensuring strong ongoing alignment between executive remuneration, company performance and shareholder returns.
The Board took seriously the shareholder concerns raised at the October 2010 Annual General Meeting regarding Billabong’s remuneration policies and approach. Subsequently, consultation with shareholders took place to ensure the Board fully understood your concerns so they could be considered and addressed as part of the review process.
The Board values shareholder feedback and your views have helped shape our decisions with regard to future executive remuneration. Specifically, in 2010-11 the Board has responded to shareholder concerns by making the following changes: • the adoption of a second performance measure for Billabong’s Long Term Incentive (LTI), the Executive Performance
Share Plan (EPSP); and • that dividends on unvested EPSP shares be held in trust, payable only if performance targets are met and shares
vest. The Board’s decision in 2010 to require a portion of Short Term Incentive (STI) be paid as deferred equity further strengthens the alignment between executive and shareholder interests, by giving executives an increased direct stake in the Company as shareholders themselves. It will also help ensure a long-term focus on performance and assist with the retention of key talent.
The Board is committed to a strong, transparent linkage between performance and reward so that executive reward outcomes are dependent on delivering results to shareholders. This year, in the current tough business environment, we have seen the Total Remuneration received by the Chief Executive Officer drop by approximately 44%, and for most senior executives by approximately 11% as a consequence of the pressures on business performance.
At the same time the approach to executive remuneration needs to take into account the unique environment in which Billabong operates as a business. More than 80% of Billabong’s sales revenue is generated offshore and more than 85% of employees are located offshore, including around 80% of senior management. As a result, Billabong competes for executive talent with other organisations globally.
Billabong shareholders have considerable experience of how currency fluctuations can have a major impact on reported profitability. These currency movements also impact some, but not all, aspects of individual executive performance and reward. • For 2011-12, 50% of LTI will be based on Earnings Per Share (EPS) with the remaining 50% on Total Shareholder
Return (TSR). • Hence movements in the Australian dollar against other currencies directly affect an Executive’s LTI, both positively
and negatively and links any incentive with shareholder returns.
In contrast, results for judging STI at a regional level are assessed in constant currency where currency swings have no effect. Subsequently executives who achieve their relevant Key Performance Indicators (KPIs) have earned their STI even if results, when translated to Australian dollars, are below target. In this way the remuneration structure strives to achieve a balance between retaining, motivating and rewarding individual performance and ensuring a robust linkage to overall company performance and shareholder returns.
The Board believes they have achieved that balance and invite you to read the 2010-11 Remuneration Report.
I look forward to answering any questions you may have at our Annual General Meeting.
Yours faithfully,
Margaret Jackson Chair of the Human Resource and Remuneration Committee
For
per
sona
l use
onl
y

Directors’ report : :
Billabong International Limited 2010-11 Full Financial Report Page 13
Remuneration Report (continued) CONTENTS The information provided in this report has been prepared based on the requirements of the Corporations Act 2001 and the applicable accounting standards. The report has been audited.
The Remuneration Report is set out under the following main headings: Billabong Group Executives 2010-11 Remuneration in brief 1. Introduction 2. Remuneration governance 3. CEO and senior executive remuneration
• Remuneration principles • Remuneration strategy • Executive remuneration structure • Remuneration outcomes for 2010-11 • Summary of executive contracts • Statutory remuneration disclosures
4. Non-executive Director remuneration 5. Additional statutory disclosures
For
per
sona
l use
onl
y

Directors’ report : :
Billabong International Limited 2010-11 Full Financial Report Page 14
Remuneration Report (continued) BILLABONG GROUP EXECUTIVES The Billabong Group executives, including the Executive Directors, other Key Management Personnel (KMP), the Non-Executive Directors, and the five highest remunerated Group executives in 2010-11 referenced throughout this report are listed below.
Executive Directors
Derek O’Neill Chief Executive Officer (CEO)
Paul Naude General Manager, Billabong Group North America (GM North America)
Other Key Management Personnel (KMP)
Franco Fogliato General Manager, Billabong Group Europe (GM Europe)
Shannan North General Manager, Billabong Group Australasia (GM Australasia)
Craig White Chief Financial Officer (CFO)
Johnny Schillereff President, Element Skateboards, Billabong USA
Other Group Executives
Ed Leasure President, Quiet Flight, Billabong USA
Non-Executive Directors (NEDs)
Ted Kunkel Chairman
Tony Froggatt Director
Margaret Jackson AC Director
Allan McDonald Director
Gordon Merchant AM Director
Colette Paull Director
For
per
sona
l use
onl
y

Directors’ report : :
Billabong International Limited 2010-11 Full Financial Report Page 15
Remuneration Report (continued) 2010-11 REMUNERATION IN BRIEF A number of key changes to executive remuneration were made this year that have had a significant impact on the nature of the Group’s remuneration and on remuneration outcomes in 2010-11 and beyond. Together these changes further strengthen the linkage between performance and reward. Key changes at a glance Long Term Incentive (LTI) The following changes to the design of the Group’s LTI, the EPSP, significantly strengthen the linkage between performance and reward for those executives who receive hurdled awards under the EPSP; CEO Derek O’Neill, GM North America Paul Naude, GM Europe Franco Fogliato, GM Australasia Shannan North and CFO Craig White. Subject to shareholder approval for Executive Director awards, these changes will apply to 2011-12 awards onwards. • Adoption of relative Total Shareholder Return (TSR) as a second performance hurdle, in addition to Ear nings
Per Share (EPS), for EPSP awards. This change will affect all EPSP participants with hurdled awards. 50% of awards will be tested on EPS and 50% on TSR. TSR measures the percentage growth in a company’s share price together with the value of dividends during the period, assuming that all dividends are reinvested as new shares. The Company’s TSR will be measured over a three year period against a comparator group, to assess performance relative to the market. For the Company, the comparator group is constituents of the S&P/ASX 200 at the beginning of the performance period, excluding those companies classified within the Financials and Energy sectors and Metals and Mining Industry Group. This change does not apply to awards granted up to and including the 2010-11 awards, the terms of which were determined before the 2010 Annual General Meeting and were approved by shareholders.
• Dividends on unvested hurdled EPSP shares to be pai d into a trust and released to the participant only if performance targets are met and shares vest. This change affects all KMP who receive hurdled performance share awards. Executives will benefit from the EPSP only if they meet performance targets. EPSP dividends will be held in trust during the performance period and net dividends will be paid to executives only on performance shares that vest. If no shares vest, no dividends are payable. This change does not apply to awards granted up to and including the 2010-11 awards, the terms of which were determined before the 2010 Annual General Meeting and were approved by shareholders.
• EPS calculated on a pooling approach which focuses on EPS performance over three years For the 2011-12 EPSP awards, EPS will be calculated using a pooling approach which requires the Group to achieve an aggregated target pool of EPS over the performance period, based on challenging EPS compound growth targets. Given the current challenging global retail environment and volatility in world markets, in determining the aggregate EPS target pool which must be achieved for the hurdled 2011-12 EPSP awards, the Board will maintain the current challenging EPS growth targets of 6% per annum growth for 50% vesting to 10% per annum growth for 100% vesting.
Further detail on these awards will be set out in the Notice of Annual General Meeting.
For
per
sona
l use
onl
y
Directors’ report : :
Billabong International Limited 2010-11 Full Financial Report Page 16
Remuneration Report (continued) Short Term Incentive (STI) The following change was made to the design of the Group’s STI in 2010 and will apply to GM Europe Franco Fogliato, GM Australasia Shannan North and CFO Craig White’s STI grants from 2010-11 onwards:
• Payment of STI as part cash and part deferred equit y that vest after two years
With STI deferral a portion (25% to 30%) of the incentive earned will be deferred into equity. This will be in the form of either shares or rights depending on the executives’ location (due to tax implications). The deferred equity will vest to participants after a period of two years. The introduction of STI deferral has three main benefits:
1. Payment of part of the STI as equity further aligns executive and shareholder interests. As Billabong shareholders themselves, executives have a direct stake in growing total shareholder return.
2. The two-year vesting period encourages executive retention.
3. Deferral supports a long-term focus on company performance.
STI deferral operates separately from the Group’s LTI, the EPSP. Each rewards for different aspects of performance and is measured and paid out separately.
• Changes to STI potential in 2010-11
In 2009-10 the Board introduced a one-off over-performance bonus program (turbo STI program). This program has not been implemented in 2010-11. As a result, the maximum bonus potential for CEO Derek O’Neill and GM North America Paul Naude decreased by 25% and 36% respectively. For CFO Craig White, cash STI potential decreased by 2%. However, for GM Europe Franco Fogliato and GM Australasia Shannan North the cash STI potential increased by 5% and 11% respectively. This is because of a broadening of their roles (refer to page 22 for more detail) resulting in an increase to their fixed remuneration. Because fixed remuneration increased, cash STI potential also increased to ensure an appropriate mix of fixed and variable remuneration as a percentage of total remuneration.
Fixed (base) salary • Increases to base salaries of Executive Directors a nd three other KMP
For the first time since September 2008 the Group’s five most senior executives received increases in base salary. CEO Derek O’Neill and GM North America Paul Naude received an increase of 10% and 7% respectively. GM Europe Franco Fogliato, GM Australasia Shannan North and CFO Craig White received an increase of 17%, 18% and 8% respectively.
The decision to increase base salary for these key executives was not taken lightly. Three main factors contributed to the Board’s decision to award these increases:
1. Since 2008 these roles have taken on increased responsibilities and accountabilities as a result of the Group’s expansion into new markets and company acquisitions and joint ventures.
2. External benchmarking showed the CEO’s base salary had fallen below market.
3. A review of internal relativities and benchmarking against the ASX 200 company data highlighted the need to adjust base salaries for the senior executive KMP below the CEO (and in particular the GM roles for Europe and Australasia).
Refer to page 22 for more details of how responsibilities and accountabilities have broadened.
For
per
sona
l use
onl
y
Directors’ report : :
Billabong International Limited 2010-11 Full Financial Report Page 17
Remuneration Report (continued) Other entitlements • Change to CEO’s long service leave entitlement
During the 2010-11 year CEO Derek O’Neill’s long service leave provision increased from $67k to $273k. This change is a result of legal advice in recognition of prior overseas service. Although the change relates to service dating from 1 February 1992 to 31 December 2002, accounting standards require that any correction to leave entitlements is made in the year of adjustment. This change is shown in table H on page 34 which displays the accounting charge for long service leave entitlements.
Summary of changes to executive remuneration by ind ividual Table: A
Name Base salary
Total cash STI potential*
STI deferral
Other entitlements
LTI structure
Derek O’Neill + 10% - 25% No STI deferral applies. Long service leave provision increased from $67k to $273k.
Addition of a second performance hurdle, relative TSR, to LTI performance test.
EPS calculated on an aggregated target pooling approach.
No dividends payable on performance shares until they have vested.
Paul Naude ^ + 7% - 36% No STI deferral applies. n/a
Franco Fogliato ^ + 17% + 5% STI is now payable as approximately 70% cash / 30% deferred equity that vest after two years.
n/a
Shannan North + 18% + 11% n/a
Craig White + 8% - 2% n/a
^ remuneration impacted by exchange rate fluctuations * does not include portion of STI which is deferred equity Remuneration outcomes for the CEO and senior execut ives • In total, the amount of executive remuneration paid and/or vested decreased in 2010-11 by around 20%. This reflects
the Group’s business performance in what continues to be a challenging economic environment shown by a decline in Net Profit After Tax (NPAT). The cash and other benefits actually received by the CEO in 2010-11 are 44% lower than those received in 2009-10.
• The amount of Short Term Incentive (STI) payments reduced this year. The CEO received no STI, with GM North America Paul Naude, GM Europe Franco Fogliato, GM Australasia Shannan North and CFO Craig White receiving between 18% and 26% of target STI. The payments that were earned were based on achievement of individual performance objectives, which are disclosed in this Report.
• No hurdled awards vested under the Group’s LTI, the Executive Performance Share Plan (EPSP), because the EPS performance hurdle was not met.
• The Group’s five most senior executives received increases in base salary as detailed above.
For
per
sona
l use
onl
y
Directors’ report : :
Billabong International Limited 2010-11 Full Financial Report Page 18
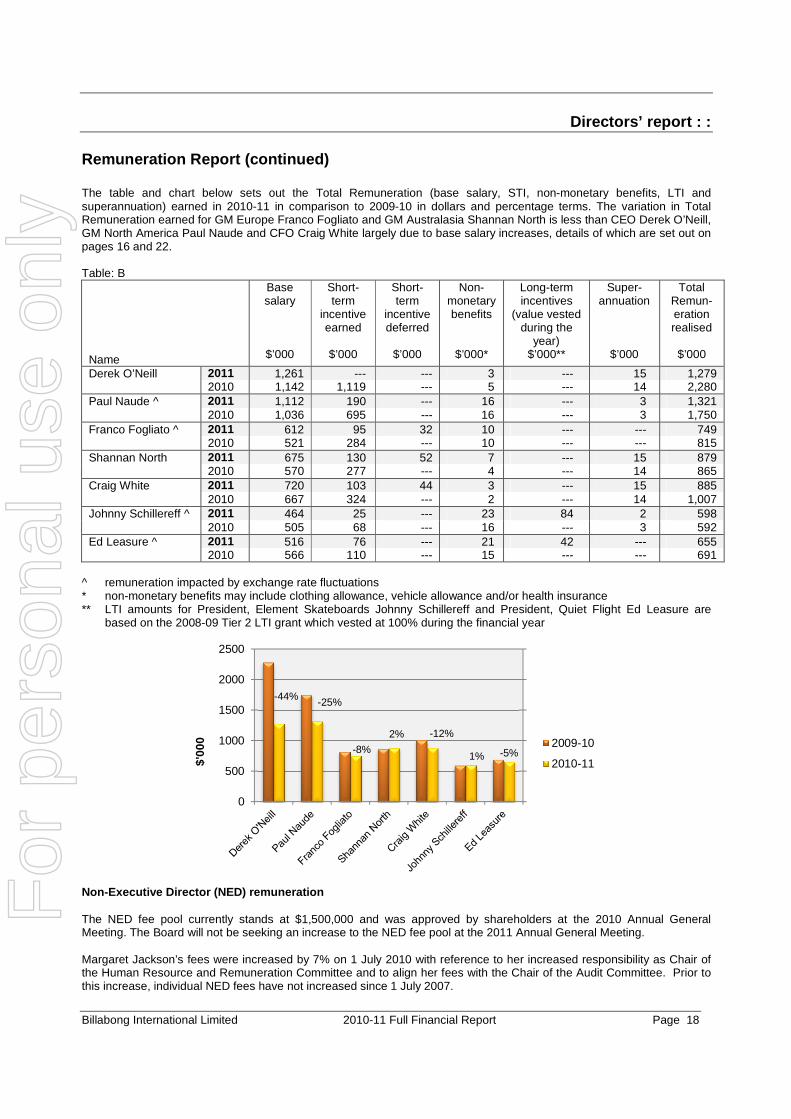
Remuneration Report (continued) The table and chart below sets out the Total Remuneration (base salary, STI, non-monetary benefits, LTI and superannuation) earned in 2010-11 in comparison to 2009-10 in dollars and percentage terms. The variation in Total Remuneration earned for GM Europe Franco Fogliato and GM Australasia Shannan North is less than CEO Derek O’Neill, GM North America Paul Naude and CFO Craig White largely due to base salary increases, details of which are set out on pages 16 and 22. Table: B
Name
Base salary
$’000
Short-term
incentive earned
$’000
Short-term
incentive deferred
$’000
Non- monetary benefits
$’000*
Long-term incentives
(value vested during the
year) $’000**
Super-annuation
$’000
Total Remun-eration realised
$’000
Derek O’Neill 2011 1,261 --- --- 3 --- 15 1,279 2010 1,142 1,119 --- 5 --- 14 2,280 Paul Naude ^ 2011 1,112 190 --- 16 --- 3 1,321 2010 1,036 695 --- 16 --- 3 1,750 Franco Fogliato ^ 2011 612 95 32 10 --- --- 749 2010 521 284 --- 10 --- --- 815 Shannan North 2011 675 130 52 7 --- 15 879 2010 570 277 --- 4 --- 14 865 Craig White 2011 720 103 44 3 --- 15 885 2010 667 324 --- 2 --- 14 1,007 Johnny Schillereff ^ 2011 464 25 --- 23 84 2 598 2010 505 68 --- 16 --- 3 592 Ed Leasure ^ 2011 516 76 --- 21 42 --- 655
2010 566 110 --- 15 --- --- 691 ^ remuneration impacted by exchange rate fluctuations * non-monetary benefits may include clothing allowance, vehicle allowance and/or health insurance ** LTI amounts for President, Element Skateboards Johnny Schillereff and President, Quiet Flight Ed Leasure are
based on the 2008-09 Tier 2 LTI grant which vested at 100% during the financial year
Non-Executive Director (NED) remuneration The NED fee pool currently stands at $1,500,000 and was approved by shareholders at the 2010 Annual General Meeting. The Board will not be seeking an increase to the NED fee pool at the 2011 Annual General Meeting. Margaret Jackson’s fees were increased by 7% on 1 July 2010 with reference to her increased responsibility as Chair of the Human Resource and Remuneration Committee and to align her fees with the Chair of the Audit Committee. Prior to this increase, individual NED fees have not increased since 1 July 2007.
-44% -25%
-8%
2% -12%
1% -5%
0
500
1000
1500
2000
2500
$'00
0 2009-10
2010-11
For
per
sona
l use
onl
y
Directors’ report : :
Billabong International Limited 2010-11 Full Financial Report Page 19
Remuneration Report (continued) 1. INTRODUCTION This Billabong Group Remuneration Report is for the year ended 30 June 2011. It forms part of the Billabong Group Directors’ Report and has been audited in accordance with the Corporations Act 2001. The Remuneration Report details remuneration information as it applies to Billabong Group executives, including the CEO, and Non-Executive Directors. They include the Key Management Personnel (KMP) and five highest remunerated Group executives in 2011. The KMP are the Executive Directors, the Non-Executive Directors and certain executives who either report directly to the CEO or the GM of Billabong North America. The people currently in these positions are listed in the table on page 14. 2. REMUNERATION GOVERNANCE The Board is responsible for ensuring the Group’s remuneration strategy is equitable and aligned with company performance and shareholder interests. To assist with this, the Board has established a Human Resource and Remuneration Committee made up of Non-Executive Directors only. The Committee focuses on the remuneration framework and levels specific to the CEO and his direct reports as well as the general remuneration structure for all employees. To ensure the Committee is fully informed when making remuneration decisions, it draws on the services of independent remuneration advisors. Independent remuneration advisors are engaged by and report directly to the Committee and provide advice and assistance on a range of matters including but not limited to: • updates on remuneration trends, regulatory developments and shareholder views; • the review, design or implementation of the executive remuneration strategy and its underlying components (such as
incentive plans); and • market remuneration analysis.
The overall remuneration strategy is continually reviewed by the Board to ensure it continues to meet the needs of the Company and shareholders. 3. CEO AND SENIOR EXECUTIVE REMUNERATION Remuneration principles A number of principles underpin our remuneration strategy. Alignment with business performance and shareholder return • Ensure executive remuneration strikes a balance between retaining, motivating and rewarding executives whilst
aligning with business performance and shareholder return. • Align executive remuneration with the creation of shareholder value through offering a portion of the reward package
as equity and using performance hurdles linked to shareholder return. • Apply performance targets that take into consideration the Group’s strategic objectives and business performance
expectations and deliver rewards commensurate to achieving these objectives and targets. • Ensure executives are able to have an impact on the achievement of performance targets. Remuneration benchmarking • Consider market practice and shareholder views in relation to executive remuneration, while ensuring executive
remuneration meets the commercial requirements of the Group. Market positioning • Provide a market competitive reward opportunity. • Encourage the retention of executives and senior management who are critical to the future success of the Group.
For
per
sona
l use
onl
y

Directors’ report : :
Billabong International Limited 2010-11 Full Financial Report Page 20
Remuneration Report (continued) Remuneration strategy The Group’s executive remuneration strategy provides a strong link between performance and reward so that executive reward outcomes are dependent on delivering results to shareholders, while at the same time motivating and retaining top talent by providing market competitive fixed remuneration and an incentive framework that rewards for results delivered. The following diagram illustrates how the Group’s remuneration strategy aligns with business objectives and links executive remuneration to company performance and the delivery of shareholder returns.
Business objective
To maintain a global leadership position in the design, marketing, wholesaling and retailing of boardsports inspired apparel and accessories and, in turn, build long-term value for stakeholders.
Remuneration strategy objectives and approach
Align executive remuneration to company performance and deliver results to shareholders
• Remuneration is measured against Group financial and non-financial business objectives as well as Total Shareholder Return (TSR) and Earnings Per Share (EPS).
• Short and long-term components of remuneration are “at risk” based on performance and return to shareholders.
Attract and retain executive talent in a highly competitive global market
• Reward competitively in the global markets in which the Group operates, which include Australasia, North America, Europe and South America.
• Offer remuneration that balances fixed and variable (“at risk’) short and long-term incentives.
Fixed remuneration
Short Term Incentive (STI) Long Term Incentive (LTI )
Consists of…
Base salary plus benefits (which vary by country).
Annual payment opportunity (cash or part cash, part deferred equity for some participants).
An offer to participate in the EPSP. Granted annually at the discretion of the Group.
Rewards for…
Performance, skills and capabilities.
Performance over a 12-month period against agreed Group and regional financial objectives and against personal performance objectives.
Growth in the Company’s EPS over a three-year period.
From 2011-12, a second measure: relative TSR.
Is… Fixed.
Reviewed annually.
At risk.
Wholly dependent on achieving agreed performance objectives. Granted annually.
At risk.
For executives receiving hurdled EPSP awards, awards rely on hurdles being met.
Value to the executive depends wholly on the Group’s performance.
Determined by…
Referencing:
• global and local market movements for the role
• market pay comparisons
• individual performance
• role accountabilities
Performance hurdles focus executive attention on the Group’s critical performance metrics and key business objectives.
If all performance objectives are fully met as set, 100% of the STI is earned. If performance objectives are only partially met, a proportional percentage of STI is earned.
No outperformance STI targets are set.
Alignment to the Group’s business strategy and requirement for key executives to drive company performance in both absolute and relative terms.
Performance is assessed using basic EPS. This takes into account the impact of currency movements, as these movements impact the value created for shareholders.
Performance is also assessed using TSR which demonstrates value returned to shareholders relative to a comparator group.
For
per
sona
l use
onl
y

Directors’ report : :
Billabong International Limited 2010-11 Full Financial Report Page 21
Remuneration Report (continued) Executive remuneration structure Executive remuneration at Billabong is a mix of fixed annual remuneration and variable remuneration through “at risk” short and long-term incentives. Fixed annual remuneration provides a “base” level of remuneration. Short and long term variable (“at risk”) incentives reward executives for meeting and exceeding predetermined performance targets linked to the achievement of the Group’s business objectives. This ensures variable reward is achieved only when value has been created for shareholders. Remuneration mix As executives gain seniority within the Group, the balance of the remuneration mix shifts to a higher proportion of variable reward to ensure senior executive reward is linked to performance. The following table shows the current target remuneration mix, including the portion of STI made up of cash and deferred equity. Table: C
Name Fixed remuneration At risk – Short Term Incentive
At risk – Long Term Incentive **
Executive Directors
Derek O’Neill 38% 34% 28%
Paul Naude 42% 28% 30%
Other Key Management Personnel
Franco Fogliato ^ 38% 37% 25%
Shannan North ^ 38% 39% 23%
Craig White ^ 39% 39% 22%
Johnny Schillereff * 73% 15% 12%
Other Group Executives
Ed Leasure * 73% 21% 6%
* The remuneration mix indicated for President, Element Skateboards Johnny Schillereff and President, Quiet Flight Ed
Leasure are determined by the employment contracts negotiated with these key executives at the time their businesses were acquired by the Group. Their LTI is subject to tenure only and is based on a two year service period.
** LTI include shares and rights. ^ GM Europe Franco Fogliato, GM Australasia Shannan North and CFO Craig White receive between 25% to 30% of
their STI as deferred equity which vests after two years. F
or p
erso
nal u
se o
nly

Directors’ report : :
Billabong International Limited 2010-11 Full Financial Report Page 22
Remuneration Report (continued) Fixed annual remuneration Fixed annual remuneration includes base salary, non-cash benefits (such as vehicle) and superannuation contributions. It rewards executives for effective delivery of the requirements of their roles and behaving in accordance with the Group’s culture and values. Fixed annual remuneration is determined by individual performance and by referencing market movements. Generally, fixed annual remuneration is set at the market median, with a total remuneration opportunity, including the variable short- and long-term (“at risk’) components, at around the 75th percentile of the market. Remuneration levels are reviewed by the Human Resource and Remuneration Committee annually and upon promotion. This ensures executive fixed remuneration reflects the executive’s role requirements and level of accountability and remains competitive in the marketplace. In reviewing remuneration, the Committee references available market data for comparable roles both within industry generally and within the apparel and boardsports sector both domestically and globally. The predominant focus is on market rates of pay in the executive’s country of location. Identifying appropriate matches is challenging and is further complicated by the fact that not all of our competitors are listed and therefore market data is not readily available. In 2010-11 the Committee reviewed the remuneration of CEO Derek O’Neill, GM North America Paul Naude, GM Europe Franco Fogliato, GM Australasia Shannan North and Chief Financial Officer Craig White. They were awarded increases for the first time since September 2008. The main factors that contributed to the Board’s decision were: 1. Broader role responsibilities have led to an increa se in job scope. Since September 2008 the Billabong Group
has undergone significant change. Its route to market has expanded with a focus on the direct-to-consumer market via an increased presence in both bricks and mortar stores and the growing online sales area. The Group has also broadened its portfolio of brands with DaKine and RVCA and is considered a true international leader in boardsports. This has enabled the Group to take a global leadership role in newer categories such as skate longboards and accessories, as well as considerably expand its strength in the existing portfolio of brands.
Considerable focus has also been placed on emerging territories like Asia, Eastern Europe and South America.
All of these changes have resulted in increases to job responsibilities, accountabilities and levels of complexity. This is particularly true for CEO Derek O’Neill, GM North America Paul Naude, GM Europe Franco Fogliato, GM Australasia Shannan North and Chief Financial Officer Craig White.
2. External benchmarking showed the CEO’s base salary had fallen below market. It is important to our long-term
business sustainability that we retain key talent by ensuring all Billabong executives are being remunerated at market rates in a highly competitive market. The Board commissioned external benchmarking undertaken by Ernst & Young for CEO Derek O’Neill, which included data from Australian listed companies with a similar market capitalisation to the Company’s and from a number of international industry competitors, including both wholesalers and retailers in the sporting goods sector. It found the CEO’s base salary was below market median. The CEO’s new remuneration is positioned between the median and the 75th percentile for base salary and total remuneration against the Australian peer group. However, it remains below median total remuneration when compared to the international peers.
3. Internal relativities and benchmarking showed that some KMP remuneration had gradually fallen out of
alignment with other roles. For other KMP, the Group undertook a review of internal relativities and benchmarked against companies within the ASX 200 of a similar size to the Billabong Group. Additionally international peer data was reviewed. This information highlighted the need to adjust base salaries for several KMP.
4. Retention of valuable experience and expertise that is difficult to replace. The executives who received base
salary increases are all long serving, having been with the Group for between seven and 28 years. They have valuable experience and expertise that would be difficult to replace in the current competitive executive global talent market. During the 2010-11 financial year Chris Kypriotis, GM South America, left for a role with an international competitor. His leaving highlighted to the Board the importance of ensuring key executives are remunerated adequately within a global market.
For
per
sona
l use
onl
y

Directors’ report : :
Billabong International Limited 2010-11 Full Financial Report Page 23
Remuneration Report (continued) Variable remuneration components
Short Term Incentive (STI)
What is the purpose of the STI?
STI performance hurdles focus executive attention on the Group’s critical performance metrics and key business objectives. It rewards executives for achieving Billabong Group performance targets against annual budget and regional budget expectations (where regional budget targets are relevant) and for meeting personal key performance indicators (KPIs).
Who participates? All Key Management Personnel (KMP).
What are the performance conditions?
Each executive has a target STI amount that can be earned each year, subject to performance against the measures relevant to their role. If all performance objectives are fully met as set, 100% of the STI is earned. If performance objectives are only partially met, a corresponding proportional percentage of STI is earned. To further incentivise and drive performance, the five most senior executives also have the potential to earn a stretch STI amount. The Board has discretion to pay beyond the target (100%) STI amount only in exceptional circumstances. This discretion is wholly based on the financial performance of the Group.
Executive Performance measures
CEO and CFO • Billabong Group Net Profit After Tax (NPAT) performance
• Group working capital as a percentage of sales • Performance against non-financial objectives *
Regional GMs • Billabong Group NPAT performance • Regional Earnings Before Interest and Tax
(EBIT) performance • Regional working capital as a percentage of
sales • Performance against non-financial objectives *
Other Senior Executives
• Regional EBIT performance • Performance against non-financial objectives *
* Details of the actual financial and non-financial performance measures (that is, the
KPIs) set for the five most senior executives for 2010-11, together with the performance achieved, are provided on pages 30 to 31.
How is it measured to determine payments?
With the exception of Group NPAT, financial performance is assessed in local constant currency terms so that executives are appropriately rewarded for their performance and their rewards are not skewed by currency fluctuations that are beyond their control.
Over what period is it measured?
Performance is measured over the 12 month period from 1 July to 30 June. STI payments are made early in the following September.
For
per
sona
l use
onl
y
Directors’ report : :
Billabong International Limited 2010-11 Full Financial Report Page 24
Remuneration Report (continued)
Short Term Incentive (STI) (continued)
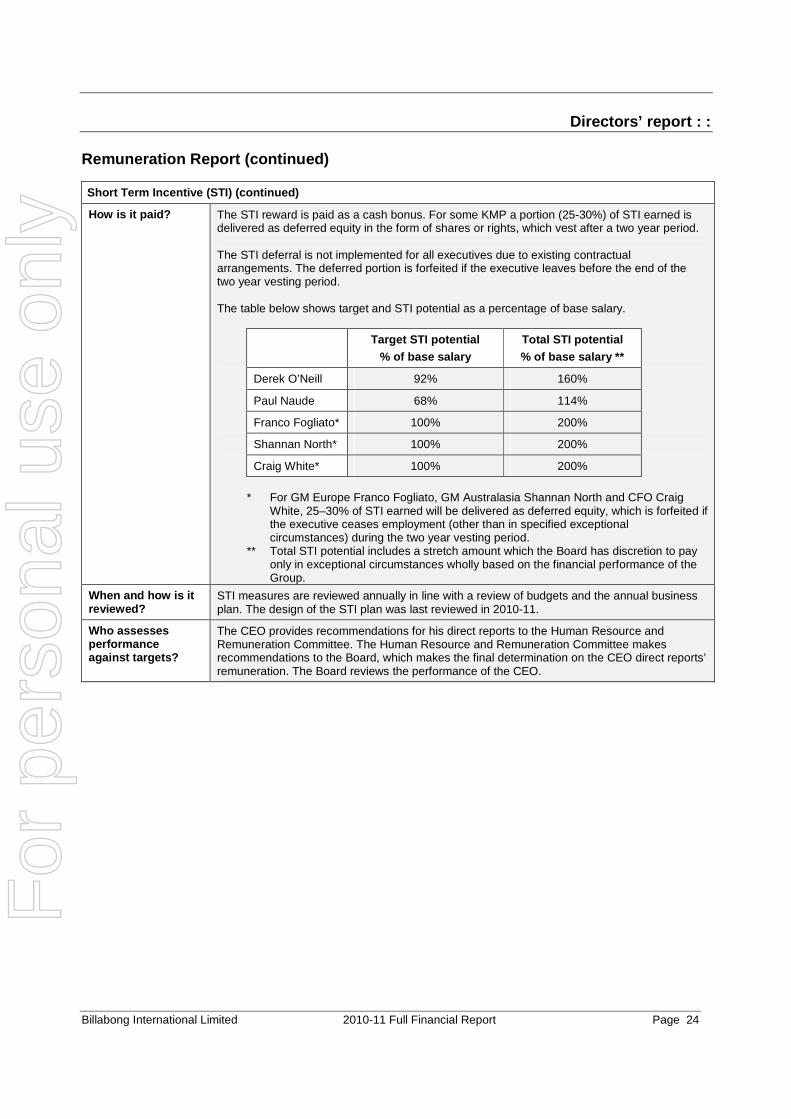
How is it paid? The STI reward is paid as a cash bonus. For some KMP a portion (25-30%) of STI earned is delivered as deferred equity in the form of shares or rights, which vest after a two year period. The STI deferral is not implemented for all executives due to existing contractual arrangements. The deferred portion is forfeited if the executive leaves before the end of the two year vesting period. The table below shows target and STI potential as a percentage of base salary.
Target STI potential % of base salary
Total STI potential % of base salary **
Derek O’Neill 92% 160%
Paul Naude 68% 114%
Franco Fogliato* 100% 200%
Shannan North* 100% 200%
Craig White* 100% 200%
* For GM Europe Franco Fogliato, GM Australasia Shannan North and CFO Craig
White, 25–30% of STI earned will be delivered as deferred equity, which is forfeited if the executive ceases employment (other than in specified exceptional circumstances) during the two year vesting period.
** Total STI potential includes a stretch amount which the Board has discretion to pay only in exceptional circumstances wholly based on the financial performance of the Group.
When and how is it reviewed?
STI measures are reviewed annually in line with a review of budgets and the annual business plan. The design of the STI plan was last reviewed in 2010-11.
Who assesses performance against targets?
The CEO provides recommendations for his direct reports to the Human Resource and Remuneration Committee. The Human Resource and Remuneration Committee makes recommendations to the Board, which makes the final determination on the CEO direct reports’ remuneration. The Board reviews the performance of the CEO.
For
per
sona
l use
onl
y

Directors’ report : :
Billabong International Limited 2010-11 Full Financial Report Page 25
Remuneration Report (continued)
Executive Performance Share Plan (EPSP) / Long Term Incentive (LTI) plan
What is the purpose of the EPSP?
The EPSP is a long term incentive plan that focuses executives on the long term performance of the Group. Executives are rewarded in the form of shares or conditional rights, depending on the tax implications in the relevant market, when targets are met and exceeded.
Who participates? The five most senior executives: CEO Derek O’Neill, GM North America Paul Naude, GM Europe Franco Fogliato, GM Australasia Shannan North and CFO Craig White participate in the hurdled EPSP, details of which are set out below. For management below the five most senior executives, the EPSP is focused on retention and provides equity-based reward based on continued service, without performance hurdles.
What are the performance conditions?
Executives must meet the Group’s three-year Earnings Per Share (EPS) performance targets.
EPS is a key financial indicator that measures how the Group’s earnings have grown over the performance period. EPS takes into account the impact of currency movements, as these movements impact the value created for shareholders.
The Board has proposed the introduction of a second performance hurdle based on relative Total Shareholder Return (TSR). Subject to shareholder approval, this will apply to 2011-12 awards and onwards.
Relative TSR demonstrates how the Company has returned value to its shareholders relative to other Australian companies listed in the S&P/ASX 200 at the beginning of each performance period, excluding those companies classified within the Financials and Energy sectors and Metals and Mining Industry Group. This means executives will be rewarded only where Billabong’s shareholder return has at least met the median of its peers, with 100% of the EPSP grant vesting only if the Group’s performance is in the upper quartile of the selected peer group.
TSR will be measured over a three year period.
50% of awards will be tested on EPS and 50% tested on TSR. This will be subject to shareholder approval for the grants to Executive Directors. Adopting EPS and TSR measures as two separate measures in the plan will allow the Group to balance an internal performance metric (EPS), with an external performance metric (TSR). The combination of the two measures will ensure that executives receive 100% of their EPSP share awards only where the Group has not only met the EPS performance targets set for the EPSP, but also achieved a level of shareholder return significantly above the majority of its listed Australian comparators.
For
per
sona
l use
onl
y

Directors’ report : :
Billabong International Limited 2010-11 Full Financial Report Page 26
Remuneration Report (continued)
Executive Performance Share Plan (EPSP) / Long Term Incentive (LTI) plan (continued)
How is it measured to determine payments?
For awards granted during 2010-11, the EPS performance targets are measured as follows. All figures are calculated based on EPS achieved in the 2009-10 base year: • For 6% EPS compound annual growth, 50% of the EPSP award vests. • For 10% or greater EPS compound annual growth, 100% of the EPSP award vests. • Straight line vesting of awards for performance between these two targets. • Below 6% EPS compound annual growth, nothing vests.
Commencing for the 2011-12 awards, EPS will be calculated on a pooling approach which requires the Company to achieve an aggregated target pool of EPS over the performance period, with the target pool calculated based on challenging EPS compound growth targets ranging from 6% to 10% per annum growth for minimum and maximum vesting respectively. If relative TSR is introduced as an additional EPSP performance hurdle, TSR performance targets will be measured as follows: • If relative TSR performance is at or above the 75th percentile, full vesting of the TSR
portion (100%) occurs. • For performance between the 50th percentile and the 75th percentile, 50% to 100% of the
TSR portion will vest on a pro-rata basis. • For relative TSR performance below the 50th percentile against the selected comparator
group of companies, none of the TSR portion will vest.
Over what period is it measured?
All EPSP performance is measured over a three year period commencing 1 July in the year the grants were made. For example, the performance period for the 2010-11 awards is 1 July 2010 to 30 June 2013.
How is it paid? For senior KMP participants receiving hurdled grants, these are approved annually and vest on the third anniversary of the grant being made subject to meeting the EPS performance hurdles in the relevant performance period. The performance periods for outstanding awards are as follows:
Grant approved Performance period
Vesting subject to performance
testing
2008-09 From July 2008 to June 2011 August 2011
2009-10 From July 2009 to June 2012 August 2012
2010-11 From July 2010 to June 2013 August 2013
Currently, executives who receive their award as shares can vote and receive dividends in respect of performance shares allocated to them during the vesting period. However, the Board has proposed that for future awards shares be held in trust during the performance period and net dividends paid to executives only on performance shares that vest. If no shares vest, no dividends are payable. These changes do not apply to awards granted up to and including the 2010-11 awards, the terms of which were determined before the 2010 Annual General Meeting and approved by shareholders. Dividends will continue to be paid on smaller, retention focused awards to management who participate in the unhurdled EPSP. Dividends will also be paid on any STI deferral earned. For
per
sona
l use
onl
y
Directors’ report : :
Billabong International Limited 2010-11 Full Financial Report Page 27
Remuneration Report (continued)
Executive Performance Share Plan (EPSP) / Long Term Incentive (LTI) plan (continued)
When and how is it reviewed?
At the end of each performance period, the Human Resource and Remuneration Committee considers the EPS performance of the Company and determines to what extent the awards should vest.
What market benchmark is applied?
Each year, prior to awards being granted, the Human Resource and Remuneration Committee considers the market environment, the Group’s business strategy, performance expectations and shareholder expectations and sets the performance targets for the awards to be granted that year. No retesting is permitted.
Are performance conditions set?
Target and stretch performance hurdles are set in line with economic conditions and business objectives and are designed to be challenging but ultimately achievable if the Group performs in accordance with its business strategy.
Who assesses performance against targets?
The Human Resource and Remuneration Committee.
Executive Performance and Retention Plan (EPRP) The EPRP was a one-off initiative in 2008-09 to reward and retain the Group’s senior executives for growing Billabong’s market value, measured by share price growth, over the five year period to 2012-13. Under the EPRP, the five most senior executives were granted options, which, provided they vest and become exercisable, can be converted into ordinary company shares. The plan directly links executive performance to shareholder return by requiring executives to achieve two Total Shareholder Return (TSR) performance targets: a ‘gateway’ hurdle under which executives need to achieve above median TSR performance relative to a comparator group and a ‘stretch’ hurdle requiring the achievement of a 120% target over five years. In 2010-11 the Company’s TSR performance against the gateway relative TSR hurdle is below the level that will permit any of the award to vest (that is, it is below the median of the comparator group). In addition, absolute TSR has not achieved the 80%, 100% or 120% target. This means that no EPRP incentive payments vested in 2010-11. Equity arrangements for Billabong Employees Billabong encourages employee share ownership to promote alignment between employee and shareholder interests. Billabong currently offers a Tax Exempt Employee Share Plan and a Tax Deferred Employee Share Plan to Australian based employees with at least 12 months of service. Executives are eligible to participate in these plans. The plans operate as follows: • Tax Exempt Employee Share Plan: Eligible employees can purchase a maximum of $1,000 of ordinary shares in
the Company (which includes a Group contribution of $200) at a discount by voluntarily sacrificing either their base salary or bonus on a pre-tax basis.
• Tax Deferred Employee Share Plan: Eligible employees can purchase shares in the Company at market value by voluntarily sacrificing their base salary and/or bonus on a pre-tax basis. A minimum contribution of $2,000 applies to the purchase of shares (with a maximum of $4,800), with the Group making a $200 contribution towards the purchase.
Billabong’s Hedging Policy Executives are prohibited from hedging or otherwise reducing or eliminating the risk associated with equity-based incentives offered by Billabong, such as unvested performance shares and options or vested shares that remain subject to a disposal restriction. If an executive breaches this policy by hedging or otherwise enters into an arrangement which is designed to reduce or eliminate the risk associated with equity-based incentives, the executive’s incentives will be forfeited or lapse.
For
per
sona
l use
onl
y

Directors’ report : :
Billabong International Limited 2010-11 Full Financial Report Page 28
0%
20%
40%
60%
80%
100%
% Forfeited
% Paid
Remuneration Report (continued) Remuneration outcomes for 2010-11 Overall the amount of executive remuneration paid and/or vested decreased in 2010-11 by around 20%. This reflects the Group’s business performance in what continues to be a challenging economic environment. The table below contains a snapshot of the Group’s performance against key annual performance indicators over the past five years.
Table: D
Financial year ended 30 June 2006-07 2007-08 2008-0 9 2009-10 2010-11
Closing share price ($) 17.95 10.80 8.75 8.74 6.01
Dividends paid (cents per share) * 47.0 54.0 55.5 36.0 34.0
Basic EPS (cents per share) ** 77.5 81.8 69.2 58.3 47.4
EBIT ($m) 237.3 264.7 237.2 217.8 150.0
NPAT ($m) 167.3 176.4 152.8 146.0 119.1
* dividends paid in the financial year ** EPS calculations have been restated for the Capital Raising in 2008-09
Five year performance and reward relationship The overall level of executive reward takes into account the performance of the Group over a number of years. Over the past five years, the Group’s profit from ordinary activities after income tax has decreased at a compound rate of 4.0% per annum, and shareholder wealth has decreased at a compound rate of 13.6% per annum, assuming all dividends are re-invested back into Billabong International Limited shares on the payment date. During the same period, executive remuneration has decreased at a compound rate of 3.8% per annum.
Short Term Incentive (STI) outcomes aligned with company performance As STI outcomes depend on executive performance against agreed Group and regional financial objectives and against personal performance objectives, STI payments decreased in line with declining key financial performance metrics while the amount of STI forfeited increased. As shown below, in 2010-11 due to the Group’s overall financial performance, despite achieving several of his non-financial KPI’s, the Board and CEO Derek O’Neill agreed that he should receive no STI. GM North America Paul Naude, GM Europe Franco Fogliato, GM Australasia Shannan North and CFO Craig White received between 18% and 26% of target STI. The payments that were earned were based on the achievement of KPIs, as disclosed on pages 30 to 31. CEO STI The following chart shows the CEO’s total potential STI (includes stretch) paid or forfeited over the last five years.
For
per
sona
l use
onl
y
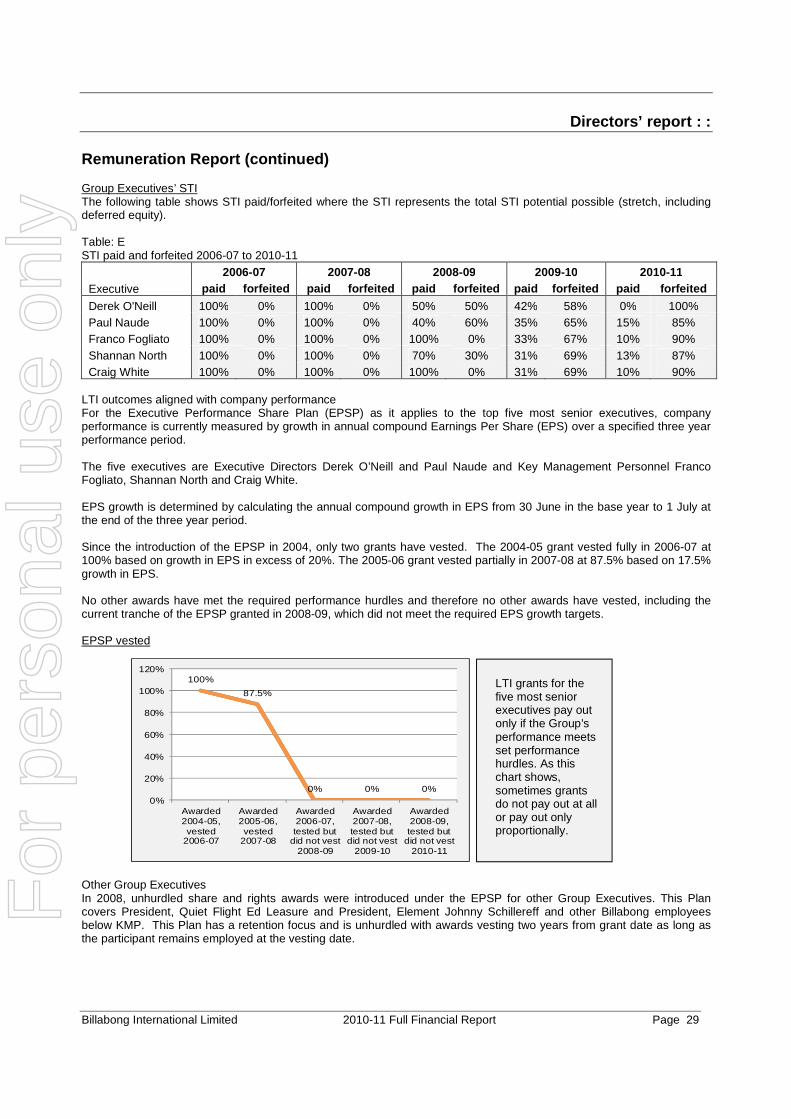
Directors’ report : :
Billabong International Limited 2010-11 Full Financial Report Page 29
Remuneration Report (continued) Group Executives’ STI The following table shows STI paid/forfeited where the STI represents the total STI potential possible (stretch, including deferred equity). Table: E STI paid and forfeited 2006-07 to 2010-11
2006-07 2007-08 2008-09 2009-10 2010-11 Executive paid forfeited paid forfeited paid forfeited paid f orfeited paid forfeited
Derek O'Neill 100% 0% 100% 0% 50% 50% 42% 58% 0% 100% Paul Naude 100% 0% 100% 0% 40% 60% 35% 65% 15% 85% Franco Fogliato 100% 0% 100% 0% 100% 0% 33% 67% 10% 90% Shannan North 100% 0% 100% 0% 70% 30% 31% 69% 13% 87% Craig White 100% 0% 100% 0% 100% 0% 31% 69% 10% 90%
LTI outcomes aligned with company performance For the Executive Performance Share Plan (EPSP) as it applies to the top five most senior executives, company performance is currently measured by growth in annual compound Earnings Per Share (EPS) over a specified three year performance period. The five executives are Executive Directors Derek O’Neill and Paul Naude and Key Management Personnel Franco Fogliato, Shannan North and Craig White. EPS growth is determined by calculating the annual compound growth in EPS from 30 June in the base year to 1 July at the end of the three year period. Since the introduction of the EPSP in 2004, only two grants have vested. The 2004-05 grant vested fully in 2006-07 at 100% based on growth in EPS in excess of 20%. The 2005-06 grant vested partially in 2007-08 at 87.5% based on 17.5% growth in EPS. No other awards have met the required performance hurdles and therefore no other awards have vested, including the current tranche of the EPSP granted in 2008-09, which did not meet the required EPS growth targets. EPSP vested
100%
87.5%
0% 0% 0%0%
20%
40%
60%
80%
100%
120%
Awarded2004-05,vested
2006-07
Awarded2005-06,vested
2007-08
Awarded2006-07,tested but
did not vest2008-09
Awarded2007-08,tested but
did not vest2009-10
Awarded2008-09,tested but
did not vest2010-11
Other Group Executives In 2008, unhurdled share and rights awards were introduced under the EPSP for other Group Executives. This Plan covers President, Quiet Flight Ed Leasure and President, Element Johnny Schillereff and other Billabong employees below KMP. This Plan has a retention focus and is unhurdled with awards vesting two years from grant date as long as the participant remains employed at the vesting date.
LTI grants for the five most senior executives pay out only if the Group’s performance meets set performance hurdles. As this chart shows, sometimes grants do not pay out at all or pay out only proportionally.
For
per
sona
l use
onl
y

Directors’ report : :
Billabong International Limited 2010-11 Full Financial Report Page 30
Remuneration Report (continued) Total remuneration received 2008-09 to 2010-11 The table below shows Total Remuneration received by Executive Directors Derek O’Neill and Paul Naude and by other KMP Franco Fogliato, Shannan North and Craig White from 2008-09 to 2010-11:
Table: F
Name 2008-09
$’000 2009-10
$’000 2010-11
$’000
Derek O’Neill 2,263 2,280 1,279
Paul Naude 2,157 1,750 1,321
Franco Fogliato 1,116 815 749
Shannan North 1,040 865 879
Craig White 1,326 1,007 885
Total remuneration for most executives has reduced significantly over the period 2008-09 to 2010-11, particularly for the highest paid executives: CEO Derek O’Neill, GM North America Paul Naude and CFO Craig White. Summary of executive performance measures set and achieved The table below shows the performance measures (that is, the Key Performance Indicators or KPIs) set for the five most senior executives for 2010-11, together with the performance achieved against each KPI. Both financial and non-financial KPIs are detailed. Table: G
Executive Summary of performance measures / KPIs We ighting Achievement 2010-11
CEO Derek O’Neill
Financial measures include: • Billabong Group Net Profit After Tax (NPAT)
performance and Group working capital as a percentage of sales
60%
Not achieved
Non-financial measures include: • The integration of acquisitions • The turnaround of underperforming
businesses • Overhead reductions and workforce
structural improvements • Key executive succession planning • Workforce safety improvements
40%
Partially achieved: despite partial achievement of some of his KPIs, following discussions between the CEO and the Board, it was determined the CEO would not receive an STI payment.
GM North America Paul Naude
Financial measures include: • Billabong Group NPAT performance and
Group working capital as a percentage of sales
30%
Not achieved
• Regional Earnings Before Interest and Taxes (EBIT) performance (in constant currency terms)
30% Partially achieved: a contractual obligation related to the delivery of regional profit against budget was met resulting in a 25% bonus payment.
Non-financial measures include : • The turnaround of non performing retail
banners • Integration of West 49 • Workforce safety improvements
40%
Partially achieved
For
per
sona
l use
onl
y
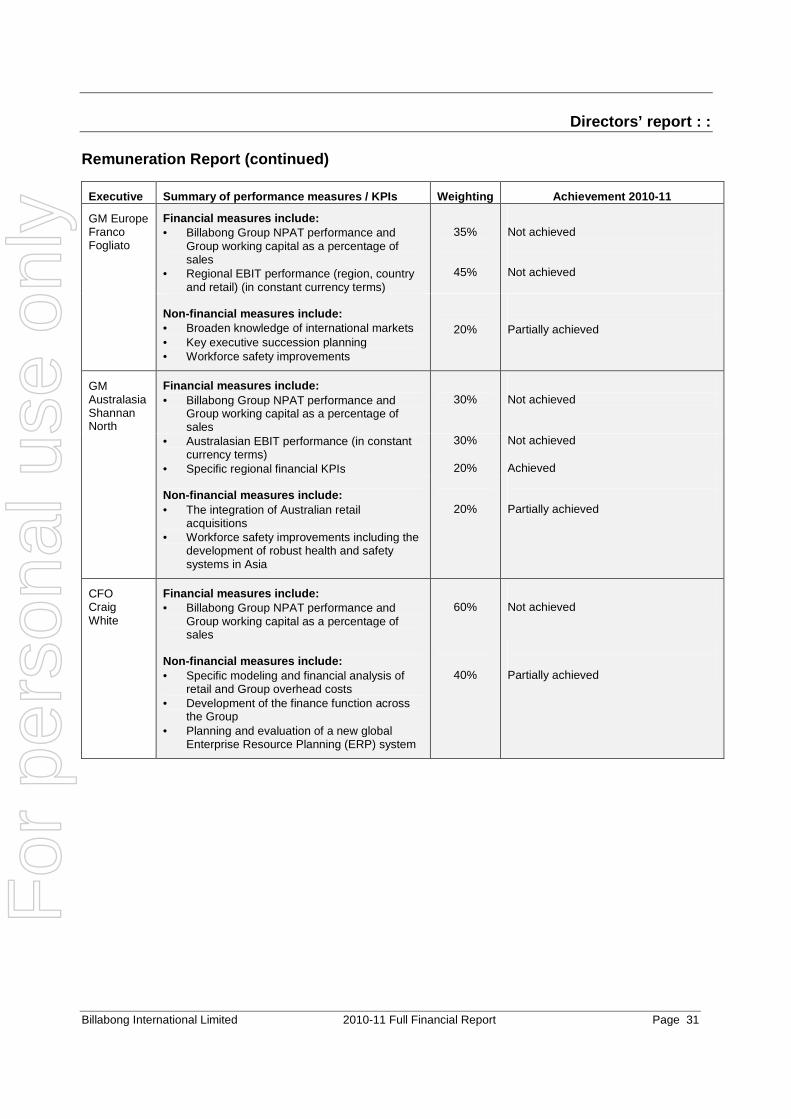
Directors’ report : :
Billabong International Limited 2010-11 Full Financial Report Page 31
Remuneration Report (continued)
Executive Summary of performance measures / KPIs Weighti ng Achievement 2010 -11
GM Europe Franco Fogliato
Financial measures include: • Billabong Group NPAT performance and
Group working capital as a percentage of sales
• Regional EBIT performance (region, country and retail) (in constant currency terms)
35%
45%
Not achieved Not achieved
Non-financial measures include: • Broaden knowledge of international markets • Key executive succession planning • Workforce safety improvements
20%
Partially achieved
GM Australasia Shannan North
Financial measures include: • Billabong Group NPAT performance and
Group working capital as a percentage of sales
30%
Not achieved
• Australasian EBIT performance (in constant currency terms)
30% Not achieved
• Specific regional financial KPIs 20% Achieved
Non-financial measures include: • The integration of Australian retail
acquisitions • Workforce safety improvements including the
development of robust health and safety systems in Asia
20%
Partially achieved
CFO Craig White
Financial measures include: • Billabong Group NPAT performance and
Group working capital as a percentage of sales
60%
Not achieved
Non-financial measures include: • Specific modeling and financial analysis of
retail and Group overhead costs • Development of the finance function across
the Group • Planning and evaluation of a new global
Enterprise Resource Planning (ERP) system
40%
Partially achieved
For
per
sona
l use
onl
y

Directors’ report : :
Billabong International Limited 2010-11 Full Financial Report Page 32
Remuneration Report (continued) Summary of executive contracts Executive contracts set out remuneration details and other terms of employment for each individual executive. The contracts provide for base salary inclusive of superannuation, reviewed annually by the Human Resource and Remuneration Committee, performance-related cash bonuses, other benefits including health insurance, car allowances and tax advisory services, and participation, where eligible, in long-term incentive plans. The key provisions of the executive contracts relating to the terms of contract and notice periods are set out in the table below. Contractual terms vary due to the timing of contracts, individual negotiations and different local market practices. Position Term of
contract Notice period required by executive
Notice period required by the company
Maximum contractual termination payment for good leavers
CEO Derek O’Neill
On-going 12 months 24 months Payment in lieu of notice
GM Billabong North America Paul Naude
On-going 18 months 18 months One and a half times annual base salary plus the performance bonus for the year of termination
GM Billabong Europe Franco Fogliato
On-going 3 months 6 months 6 month separation payment plus payment in lieu of notice *
GM Billabong Australasia Shannan North
On-going 12 months 12 months Payment in lieu of notice *
CFO Craig White
On-going 6 months, unless leaving to undertake “restricted activities” (including working for a competitor), in which case 9 months notice is required
12 months Payment in lieu of notice *
President, Element Skateboards Johnny Schillereff
On-going No express notice period provided
No express notice period provided
Payment of annual base salary, plus the performance bonus for the year of termination pro-rata to the date of termination and paid at the same time as bonuses are paid to continuing executives
President, Quiet Flight Ed Leasure
Maximum term contract until 30 June 2012
No express notice period provided
No express notice period provided
Payment of annual base salary for balance of the term of the contract, plus the performance bonus for the year of termination pro-rata to the date of termination and paid at the same time as bonuses are paid to continuing executives
* Payment will be “scaled back” if it would otherwise exceed the new 12 month average base salary termination benefit
cap applicable under Australian law.
For
per
sona
l use
onl
y

Directors’ report : :
Billabong International Limited 2010-11 Full Financial Report Page 33
Remuneration Report (continued) Termination benefit cap legislation Under the Federal legislation applying to termination benefits payable to certain executives, which was revised in November 2009, all new or substantially varied contracts require termination benefits to be approved by shareholders where the benefit exceeds 12 months “base salary”. Base salary as it relates to this legislation refers to all non-performance based components of remuneration. In 2010-11 GM Europe Franco Fogliato, GM Australasia Shannan North and CFO Craig White signed new/updated Employment Agreements reflecting changes to their remuneration structure, in particular the introduction of deferred equity as a component of their short term incentive opportunity. As noted above, each of the new Agreements is consistent with the revised termination benefit cap, with each Executive’s termination benefits restricted to no more than 12 months’ base salary (based on the average of the last three years annual base salary). The Employment Agreements of CEO Derek O’Neill, GM North America Paul Naude, President, Element Johnny Schillereff and President, Quiet Flight Ed Leasure have not been amended since the legislative changes were implemented. Departure of Chris Kypriotis During 2010-11, Chris Kypriotis, GM South America resigned. He ceased employment on 31 January 2011. Mr Kypriotis’ termination arrangements were consistent with the terms of his pre-existing contract and he was paid all statutory entitlements owed. His 2010-11 remuneration is detailed in the table below.
For
per
sona
l use
onl
y

Directors’ report : :
Billabong International Limited 2010-11 Full Financial Report Page 34
Remuneration Report (continued) Statutory remuneration disclosures Table: H
Name
Year
Short term employee benefits Post employment
benefits
Long term
benefits
Share based payments
Total remun- eration
$’000
Cash salary
$’000
Cash bonus
$’000
Bonus deferred
$’000
Non- monetary benefits
$’000
Super-annuation
$’000
Long service leave
$’000
Options*
$’000
Rights***
$’000
Executive Directors
D. O’Neill 2011 1,261 --- --- 3 15 206 286 (146) 1,625 2010 1,142 1,119 --- 5 14 39 286 146** 2,751 P. Naude ^ 2011 1,112 190 --- 16 3 --- 238 (126) 1,433 2010 1,036 695 --- 16 3 --- 238 126** 2,114
Other Key Management Personnel
F. Fogliato ^/ 2011 612 95 32 10 --- --- 91 (72) 768 2010 521 284 --- 10 --- --- 91 72** 978 C. Kypriotis ^# 2011 307 --- --- 43 48 --- --- (37) 361 2010 374 248 --- 24 19 --- --- 37 702 S. North / 2011 675 130 52 7 15 47 143 (73) 996 2010 570 277 --- 4 14 --- 143 73** 1,081 J. Schillereff ^/ 2011 464 25 --- 23 2 --- --- 97 611 2010 505 68 --- 16 3 --- --- 63** 655 C. White / 2011 720 103 44 3 15 26 143 (84) 970 2010 667 324 --- 2 14 9 143 84** 1,243
Other Group Executives
E. Leasure ^/ 2011 516 76 --- 21 --- --- --- 49 662 2010 566 110 --- 15 --- --- --- 31** 722
Total 2011 5,667 619 128 126 98 279 901 (392) 7,426 2010 5,381 3,125 --- 92 67 48 901 632** 10,246 ^ Remuneration impacted by exchange rate fluctuations / Denotes one of the five highest paid executives of the Group, as required to be disclosed under the Corporations Act
2001. * Remuneration in the form of options relates to the accounting charge recognised in the Group's income statement
based on the fair value of the award at the date of grant amortised on a straight-line basis over the vesting period of the EPRP. The accounting charge is reflected as an expense in the financial statements regardless of whether the EPRP may fully vest, partially vest or not vest at all.
** Remuneration in the form of rights relates to the accounting charge recognised in the Group's income statement in respect of the EPSP. The accounting charge reflects at 30 June 2010 the most probable likelihood of the 2009-10 and 2010-11 grants vesting to the individual.
*** Remuneration in the form of rights includes negative amounts for the write back in the accumulated expense previously recognised in the Group's income statement in respect of the EPSP as a result of performance hurdles in relation to certain components of the EPSP not being met or which are unlikely to be met.
# GM South America Chris Kypriotis resigned from the Group effective 31 January 2011. Cash salary included statutory entitlements of $27k and a one-off retention bonus of $63k relating to a prior financial year. F
or p
erso
nal u
se o
nly

Directors’ report : :
Billabong International Limited 2010-11 Full Financial Report Page 35
Remuneration Report (continued) 4. NON-EXECUTIVE DIRECTOR REMUNERATION Approach to setting Non-Executive Director remunera tion Individual Non-Executive Director fees and the Non-Executive Director fee pool are benchmarked annually against data provided by Korn Ferry, Godfrey Remuneration Group and Ernst & Young. Appropriate benchmark data is selected by setting parameters around revenue, market capitalisation, ASX rank, assets and operating profit before tax. Non-Executive Directors’ remuneration is reviewed annually by the Board. It is also benchmarked annually against data from Godfrey Remuneration Group, Korn Ferry and Ernst & Young. The review takes into account a range of factors such as the Group’s financial performance, existing capacity within the pool and external market benchmark data, including external market surveys. Non-Executive Director fees are based on fees paid by similar sized Australian companies and take into account each Non-Executive Director’s role and responsibilities. Non-Executive Directors receive fixed remuneration in the form of a base fee plus a fee for membership or chairmanship of Board committees. Directors do not receive variable remuneration or other performance-related incentives such as equity-based awards or retirement benefits other than statutory superannuation payments. Currently, Non-Executive Directors fees are as follows: Table: I
Non-Executive Director fees
Fee Amount *
Board Chair fee $325,000
Director base fee $130,000
Committee Chair fee (Audit and Human Resource and Remuneration) – paid in addition to base fee $25,000
* Excludes superannuation.
Approved fee pool Non-Executive Director fees are determined within a maximum Directors’ fee pool limit. In 2010, with shareholder approval, this pool fund was increased from $1,200,000 to $1,500,000 to provide flexibility to make required additions to the Board and to revise fees in line with external market rates. Total Non-Executive Remuneration 2010-11 As seen in the table below, apart from minor changes to superannuation amounts, the only change to individual Non-Executive Director fees was Margaret Jackson’s. The increase to her fees represent an increase which was applied on 1 July 2010 to reflect her broadened responsibilities as Human Resource and Remuneration Committee Chair and to align her remuneration with that of the Audit Committee Chair. No other change has been made to individual Non-Executive Director fees since 1 July 2007. F
or p
erso
nal u
se o
nly

Directors’ report : :
Billabong International Limited 2010-11 Full Financial Report Page 36
Remuneration Report (continued) Fees paid during 2010-11 (and comparatives) Table: J
Name
Fees
$’000
Non-
monetary
benefits
$’000
Superannuation
$’000
Long
service
leave
$’000
Total remuneration
$’000 Ted Kunkel 2011 325 2 15 --- 342 2010 325 2 14 --- 341 Tony Froggatt 2011 130 2 12 --- 144 2010 130 2 10 --- 142 Margaret Jackson 2011 155 2 14 --- 171 2010 145 2 13 --- 160 Allan McDonald 2011 155 2 14 --- 171 2010 155 2 14 --- 171 Gordon Merchant 2011 130 2 12 --- 144 2010 130 2 12 --- 144 Collette Paull 2011 130 2 12 --- 144 2010 130 2 12 --- 144 Total 2011 1,025 12 79 --- 1,116 2010 1,015 12 75 --- 1,102
5. ADDITIONAL STATUTORY DISCLOSURES Share-based compensation Executive Performance Share Plan (EPSP) Details of equity instruments, comprising either performance shares or conditional rights (collectively “rights”), provided as remuneration to each executive are set out below. When vested, each instrument will entitle the holder to one ordinary share of the Company. Rights under the EPSP will vest only if applicable performance hurdles are satisfied in the relevant performance period. Table: K
Name
Number of rights awarded during the year
Number of rights vested
during the year 2010-11 2010-11
Executive Directors
Derek O’Neill (approved at the 2010 Annual General Meeting) 118,735 ---
Paul Naude (approved at the 2010 Annual General Meeting) 103,168 ---
Other Key Management Personnel
Franco Fogliato 51,400 ---
Shannan North 51,400 ---
Craig White 51,400 ---
Johnny Schillereff 10,793 6,518
Other Group Executives
Ed Leasure 5,397 3,259 The assessed fair value at grant date of rights granted under the EPSP during the year ended 30 June 2011 was $7.80 per right (2010: $10.51). The fair value at grant date is determined by reference to the Company’s share price at grant date, taking into account the terms and conditions under which the rights were granted. Participants do not need to pay for awards on grant, vesting or exercise.
For
per
sona
l use
onl
y

Directors’ report : :
Billabong International Limited 2010-11 Full Financial Report Page 37
Remuneration Report (continued) Executive Performance and Retention Plan (EPRP) The EPRP provides for grants of options over ordinary shares in the Company. Under the EPRP, selected executives were granted options that vest only if certain performance conditions are met and the executives are still employed by the Group at the end of the vesting period. Once vested, the options remain exercisable for a period of two years. The terms and conditions of each grant of options affecting remuneration in the current or a future reporting period are as follows: Table: L
Grant date Date vested and exercisable Expiry date Exercise
price
Value per option at
grant date
Performance achieved
% Vested
31 October 2008 31 October 2013 31 October 2015 $11.08 * $2.27 To be determined
n/a
24 November 2008 24 November 2013 24 November 2015 $10.80 $1.45 To be determined
n/a
* Shareholder approval was obtained at the 2009 Annual General Meeting to change the exercise price of options
granted during the 2008-09 financial year to take into account the Company’s entitlement offer in May 2009. Previously, the exercise price for the options was the five day volume weighted average price of the Company’s shares up to the date of the grant.
Options granted under the EPRP carry no dividend or voting rights.
For
per
sona
l use
onl
y

Directors’ report : :
Billabong International Limited 2010-11 Full Financial Report Page 38
Remuneration Report (continued) Short Term Incentive (STI) and options For STI paid, the percentage of the potential STI that was earned or paid, in the financial year, and the percentage that was forfeited are set out below. STI includes stretch cash and deferred equity. Details of cash bonuses, performance shares and conditional rights Table: M
Name
Short Term Incentive Performance shares and conditi onal rights
Earned or paid
Forfeited
Year
granted
Vested
Forfeited
Financial years in which
may vest
Maximum total value of grant yet to
vest *
$’000
Derek O’Neill 0% 100% 2011
2010
2009
2008
---
---
---
---
---
---
---
100%
30 June 2014
30 June 2013
30 June 2012
30 June 2011
926
927
926
---
Paul Naude 15% 85% 2011
2010
2009
2008
---
---
---
---
---
---
---
100%
30 June 2014
30 June 2013
30 June 2012
30 June 2011
805
802
801
---
Franco Fogliato ^
10% 90% 2011
2010
2009
2008
---
---
---
---
---
---
---
100%
30 June 2014
30 June 2013
30 June 2012
30 June 2011
401
455
454
---
Shannan North ^
13% 87% 2011
2010
2009
2008
---
---
---
---
---
---
---
100%
30 June 2014
30 June 2013
30 June 2012
30 June 2011
401
463
463
---
Craig White ^ 10% 90% 2011
2010
2009
2008
---
---
---
---
---
---
---
100%
30 June 2014
30 June 2013
30 June 2012
30 June 2011
401
536
535
---
Johnny Schillereff
25% 75% 2011
2010
2009
2008
---
---
100%
---
---
---
---
100%
30 June 2013
30 June 2012
30 June 2011
30 June 2011
53
8
---
---
Ed Leasure 50% 50% 2011
2010
2009
---
---
100%
---
---
---
30 June 2013
30 June 2012
30 June 2011
26
4
--- ^ GM Europe Franco Fogliato, GM Australasia Shannan North and CFO Craig White each received between 25% to
30% of their STI payment as deferred equity. * The maximum total value of grant yet to vest and yet to be expensed. The figures above are calculated as the
amount of the grant date fair value of the performance shares and conditional rights and assuming 100% of the award vests.
For
per
sona
l use
onl
y
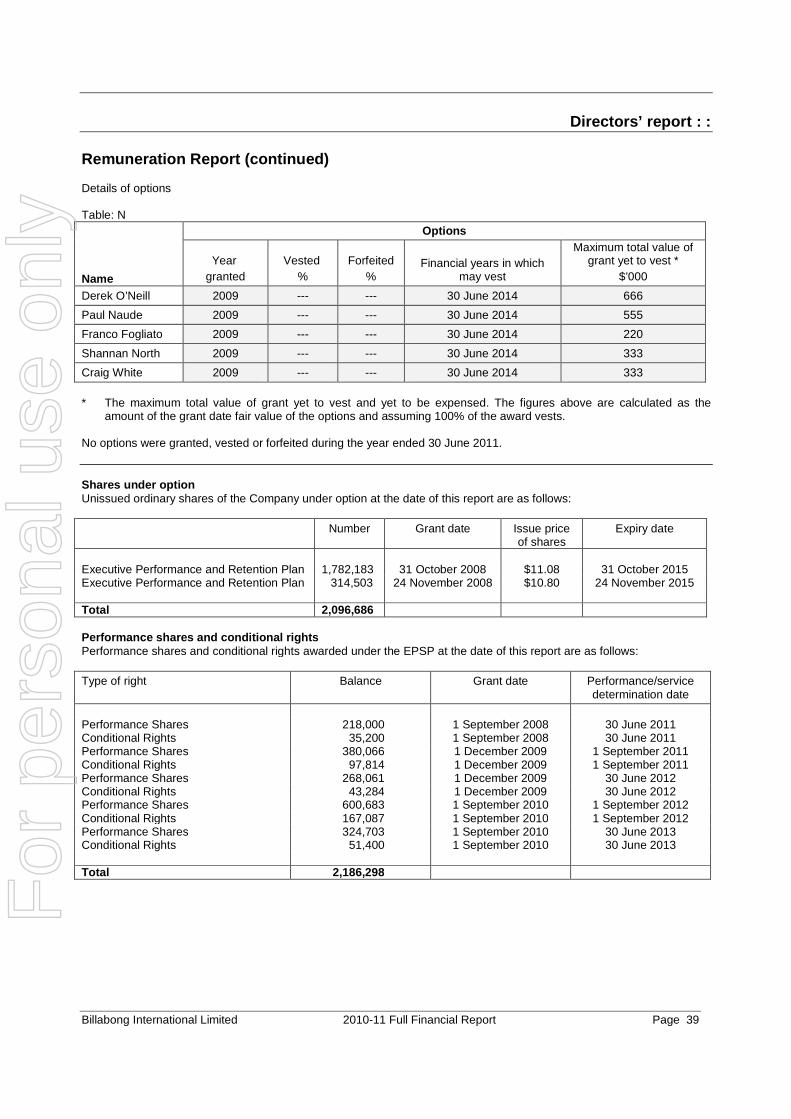
Directors’ report : :
Billabong International Limited 2010-11 Full Financial Report Page 39
Remuneration Report (continued) Details of options Table: N
Name
Options
Year granted
Vested %
Forfeited %
Financial years in which may vest
Maximum total value of grant yet to vest *
$’000
Derek O’Neill 2009 --- --- 30 June 2014 666
Paul Naude 2009 --- --- 30 June 2014 555
Franco Fogliato 2009 --- --- 30 June 2014 220
Shannan North 2009 --- --- 30 June 2014 333
Craig White 2009 --- --- 30 June 2014 333
* The maximum total value of grant yet to vest and yet to be expensed. The figures above are calculated as the
amount of the grant date fair value of the options and assuming 100% of the award vests. No options were granted, vested or forfeited during the year ended 30 June 2011. Shares under option Unissued ordinary shares of the Company under option at the date of this report are as follows: Number Grant date Issue price
of shares Expiry date
Executive Performance and Retention Plan 1,782,183 31 October 2008 $11.08 31 October 2015 Executive Performance and Retention Plan 314,503 24 November 2008 $10.80 24 November 2015 Total 2,096,686 Perfo rmance shares and conditional rights Performance shares and conditional rights awarded under the EPSP at the date of this report are as follows: Type of right Balance Grant date
Performance/service determination date
Performance Shares 218,000 1 September 2008 30 June 2011 Conditional Rights 35,200 1 September 2008 30 June 2011 Performance Shares 380,066 1 December 2009 1 September 2011 Conditional Rights 97,814 1 December 2009 1 September 2011 Performance Shares 268,061 1 December 2009 30 June 2012 Conditional Rights 43,284 1 December 2009 30 June 2012 Performance Shares 600,683 1 September 2010 1 September 2012 Conditional Rights 167,087 1 September 2010 1 September 2012 Performance Shares 324,703 1 September 2010 30 June 2013 Conditional Rights 51,400 1 September 2010 30 June 2013 Total 2,186,298
For
per
sona
l use
onl
y
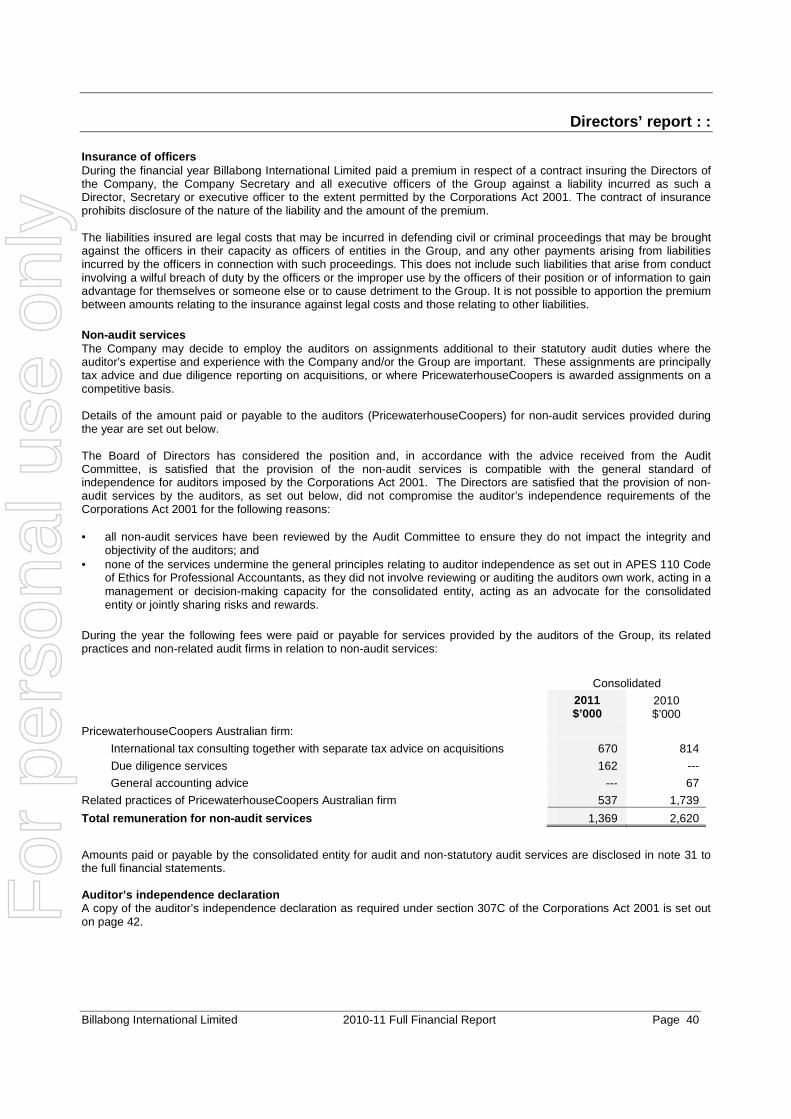
Directors’ report : :
Billabong International Limited 2010-11 Full Financial Report Page 40
Insurance of officers During the financial year Billabong International Limited paid a premium in respect of a contract insuring the Directors of the Company, the Company Secretary and all executive officers of the Group against a liability incurred as such a Director, Secretary or executive officer to the extent permitted by the Corporations Act 2001. The contract of insurance prohibits disclosure of the nature of the liability and the amount of the premium. The liabilities insured are legal costs that may be incurred in defending civil or criminal proceedings that may be brought against the officers in their capacity as officers of entities in the Group, and any other payments arising from liabilities incurred by the officers in connection with such proceedings. This does not include such liabilities that arise from conduct involving a wilful breach of duty by the officers or the improper use by the officers of their position or of information to gain advantage for themselves or someone else or to cause detriment to the Group. It is not possible to apportion the premium between amounts relating to the insurance against legal costs and those relating to other liabilities.
Non-audit services The Company may decide to employ the auditors on assignments additional to their statutory audit duties where the auditor’s expertise and experience with the Company and/or the Group are important. These assignments are principally tax advice and due diligence reporting on acquisitions, or where PricewaterhouseCoopers is awarded assignments on a competitive basis. Details of the amount paid or payable to the auditors (PricewaterhouseCoopers) for non-audit services provided during the year are set out below. The Board of Directors has considered the position and, in accordance with the advice received from the Audit Committee, is satisfied that the provision of the non-audit services is compatible with the general standard of independence for auditors imposed by the Corporations Act 2001. The Directors are satisfied that the provision of non-audit services by the auditors, as set out below, did not compromise the auditor’s independence requirements of the Corporations Act 2001 for the following reasons: • all non-audit services have been reviewed by the Audit Committee to ensure they do not impact the integrity and
objectivity of the auditors; and • none of the services undermine the general principles relating to auditor independence as set out in APES 110 Code
of Ethics for Professional Accountants, as they did not involve reviewing or auditing the auditors own work, acting in a management or decision-making capacity for the consolidated entity, acting as an advocate for the consolidated entity or jointly sharing risks and rewards.
During the year the following fees were paid or payable for services provided by the auditors of the Group, its related practices and non-related audit firms in relation to non-audit services:
Consolidated
2011 $’000
2010 $’000
PricewaterhouseCoopers Australian firm:
International tax consulting together with separate tax advice on acquisitions 670 814
Due diligence services 162 ---
General accounting advice --- 67
Related practices of PricewaterhouseCoopers Australian firm 537 1,739
Total remuneration for non-audit services 1,369 2,620
Amounts paid or payable by the consolidated entity for audit and non-statutory audit services are disclosed in note 31 to the full financial statements. Auditor’s independence declaration A copy of the auditor’s independence declaration as required under section 307C of the Corporations Act 2001 is set out on page 42.
For
per
sona
l use
onl
y
Directors’ report : :
Billabong International Limited 2010-11 Full Financial Report Page 41
Rounding of amounts The Company is of a kind referred to in Class Order 98/0100, issued by the Australian Securities and Investments Commission, relating to the “rounding off” of amounts in the Directors’ Report. Amounts in the Directors’ Report have been rounded off in accordance with that Class Order to the nearest thousand dollars. Auditors PricewaterhouseCoopers continues in office in accordance with section 327 of the Corporations Act 2001. This report is made in accordance with a resolution of the Directors.
Ted Kunkel Chairman Gold Coast, 19 August 2011
For
per
sona
l use
onl
y

Billabong International Limited 2010-11 Full Financial Report Page 42
Auditor’s independence declaration As lead auditor for the audit of Billabong International Limited for the year ended 30 June 2011, I declare that to the best of my knowledge and belief, there have been: (a) no contraventions of the auditor independence requirements of the Corporations Act 2001 in relation to the audit; and (b) no contraventions of any applicable code of professional conduct in relation to the audit. This declaration is in respect of Billabong International Limited and the entities it controlled during the period.
Robert Hubbard Partner PricewaterhouseCoopers Brisbane, 19 August 2011
PricewaterhouseCoopers, ABN 52 780 433 757 Riverside Centre, 123 Eagle Street, GPO BOX 150, BRISBANE QLD 4001 DX 77 Brisbane, Australia T +61 7 3257 5000, F +61 7 3257 5999, www.pwc.com.au Liability limited by a scheme approved under Professional Standards Legislation
For
per
sona
l use
onl
y

Corporate governance statement : :
Billabong International Limited 2010-11 Full Financial Report Page 43
The Board of Directors is responsible to shareholders for the performance of the Group and believes that high standards of corporate governance underpin the Company’s objective of maximising returns to shareholders. The Board is committed to the highest level of governance and endeavours to foster a culture that rewards ethical standards and corporate integrity. As required by the ASX Listing Rules this statement sets out the extent to which the Company has complied with the ASX Corporate Governance Principles and Recommendations (ASX Recommendations) during the financial year ended 30 June 2011. The Board of Directors considers that the Group’s corporate governance practices comply with the ASX Recommendations. PRINCIPLE 1: Lay solid foundations for management and oversight The Directors are responsible to the shareholders for the performance of the Group in both the short and the longer term. Their focus is to enhance the interests of shareholders and other key stakeholders and to ensure the Company is properly managed. A summary of matters reserved for the Board are as follows: • setting objectives, goals and strategic direction for each of the major business units; • monitoring financial performance including approving business plans, the annual operating and capital expenditure
budgets and financial statements; • establishing, monitoring and evaluating the effectiveness of internal controls, risk management and compliance
systems; • appointing and reviewing the performance of the CEO and senior management; • approving and monitoring major capital expenditure, capital management, acquisitions, divestments and identified
business drivers; • monitoring areas of significant business risk and ensuring arrangements are in place to manage those risks; • ensuring conformance to environmental, social and occupational health and safety requirements; and • reporting to shareholders on performance. A copy of a Statement of Matters Reserved for the Board is available on the Company’s corporate website. Beyond those matters, the Board has delegated all authority to achieve the objectives of the Company to the CEO and senior management as set out in the Group’s Delegation of Authority document. The Delegation of Authority document is reviewed on an annual basis. The Board set, on an annual basis, financial and non-financial performance hurdles for the CEO and senior executives and performance is assessed against these performance hurdles. A performance assessment for the CEO and senior executives last took place in August 2011. PRINCIPLE 2: Structure the Board to add value During the financial year the Board comprised six Non-Executive Directors (including the Chairman) and two Executive Directors (CEO and General Manager North America). The names, skills and experience of the Directors in office at the date of this Statement, and the period of office of each Director, are set out in the Directors’ Report. Independent Professional Advice Directors and Board Committees have the right, in connection with their duties and responsibilities, to seek independent professional advice at the Company’s expense. Prior approval of the Chairman is required, but this will not be unreasonably withheld. The advice obtained must be made available to all Board members in due course, where appropriate. Independence of Directors An assessment of Non-Executive Director’s independence is carried out annually or at any other time where the circumstances of a Director change such as to warrant reconsideration. When determining the independence of Non-Executive Directors consideration is given to whether the Non-Executive Director: • is a substantial shareholder of the Company or an officer of, or otherwise associated directly with, a substantial
shareholder of the Company; • is employed, or has previously been employed in an executive capacity by the Company, and there has not been a
period of at least three years between ceasing such employment and serving on the Board;
For
per
sona
l use
onl
y
Corporate governance statement : :
Billabong International Limited 2010-11 Full Financial Report Page 44
• has within the last three years been a principal of a material professional advisor or a material consultant to the Company, or an employee materially associated with the service provided;
• is a material supplier or customer of the Company, or an officer of or otherwise associated directly or indirectly with a material supplier or customer; and
• has a material contractual relationship with the Company other than as a Director.
Materiality for these purposes is determined on both quantitative and qualitative bases.
Mr Gordon Merchant is a substantial shareholder of the Company and accordingly he is not considered to be independent of the Company based on the ASX Recommendations. Mr Merchant is a founder of the Billabong Group and the Board considers that it is in the best interests of all shareholders to have a Director with Mr Merchant’s industry and business expertise and Company history as a member of the Board. It is noted that Ms. Colette Paull was previously employed in an executive capacity by the Company and there was not a period of three years between her ceasing employment in 1999 and joining the Board. The Board has concluded that Ms. Paull is an independent director not withstanding this prior relationship, as she exercises her judgement in an independent and unfettered manner, is aware of her duties and takes them seriously, bringing independent thought and experience to her role. All other Non-Executive Directors do not have any business interest or other relationship that could materially interfere with the exercise of their independent judgement and their ability to act in the best interests of the Company. Accordingly a majority of the Board are independent Directors. The Board assesses independence each year. To enable this process, the Directors must provide all information that may be relevant to the assessment. The Chairman of the Company is an independent Non-Executive Director. The roles of Chairman and CEO are exercised by separate individuals. The Independence of Directors Policy is available on the Company’s corporate website. Nominations Committee Committee Members Ted Kunkel (Chairman) Tony Froggatt Margaret Jackson Allan McDonald Gordon Merchant Colette Paull The Nominations Committee consists only of Non-Executive Directors and a majority of the members of the Committee are independent. The Chairman of the Committee is a Non-Executive Director. The main functions of the Committee are to: • assess periodically the skill set required to discharge competently the Board’s duties, having regard to the strategic
direction of the Group, and assess the skills currently represented on the Board; • regularly review and make recommendations to the Board regarding the structure, size and composition of the Board
(including the balance of skills, knowledge, expertise and diversity of gender, age, experience and relationships of the Board) and keep under review the leadership needs of the Company, both executive and non-executive;
• identify suitable candidates to fill Board vacancies as and when they arise and nominating candidates for the approval of the Board;
• ensure that, on appointment, all Directors receive a formal letter of appointment, setting out the time commitment and responsibility envisaged in the appointment including any responsibilities with respect to Board Committees;
• oversee appropriate Board succession planning; and • establish a process for the review of the performance of individual Directors and the Board as a whole.
For
per
sona
l use
onl
y

Corporate governance statement : :
Billabong International Limited 2010-11 Full Financial Report Page 45
When a new Director is to be appointed, the Committee reviews the range of skills, experience and expertise on the Board, identifies its needs and prepares a short-list of candidates with appropriate skills and experience. Where necessary, advice is sought from independent search consultants. The full Board then appoints the most suitable candidate who must submit themselves to shareholders for election at the first Annual General Meeting following their appointment. New Directors are provided with a letter of appointment setting out the Company’s expectations including involvement with committee work, their responsibilities, remuneration, including superannuation and expenses, requirement to disclose their interests and any matters which affect the Director’s independence. New Directors are also provided with all relevant policies including the Company’s share trading policy, a copy of the Company’s Constitution, organisational chart and details of indemnity and insurance arrangements. A formal induction program which covers the operation of the Board and its Committees and financial, strategic, operations and risk management issues is also provided to ensure that Directors have significant knowledge about the Company and the industry within which it operates. New Directors are advised of the time commitment required of them in order to appropriately discharge their responsibilities as a Director of the Company. Directors are required to confirm that they have sufficient time to meet this requirement. The Nominations Committee Charter is available on the Company’s corporate website. The Nominations Committee reports to, and makes recommendations to the full Board in relation to each of its functions. Tenure of Office Non-Executive Directors have open-ended contracts and tenure is subject to the individual performance of the Director and rotational requirements for re-election by shareholders. Board Performance The Board undertakes an annual self-assessment of the performance of the Board as a whole, its Committees, the Chairman, individual Directors and governance processes that support Board work. Performance of individual Directors is assessed against a range of dimensions including the ability of the Director to consistently create shareholder value, to contribute to the development of strategies and risk identification, to provide clarity of direction to senior management, to listen to the views of fellow Directors and members of management and key third party stakeholders and to provide the time commitment to ensure the discharge of duties and obligations to the Company. The Chairman meets privately with each Director to discuss individual and collective performance of Directors. Commitment The Board held nine scheduled board meetings and three unscheduled board meetings including a corporate strategy workshop during the year. The number of meetings of the Company’s Board of Directors and of each Board committee held during the year ended 30 June 2011, and the number of meetings attended by each Director is disclosed on page 11. PRINCIPLE 3: Promote ethical and responsible decis ion-making Group Code of Conduct The Company has a Group Code of Conduct, which is available in five languages and draws together all of the Company’s practices and policies. The Code reflects the Company’s values of integrity, honesty, trust, teamwork, respect and a desire for excellence in everything the Company does. It reinforces the need for Directors, employees, consultants and all other representatives of the Company to always act in good faith, in the Company’s best interests and in accordance with all applicable policies, procedures, laws and regulations relevant to the regions in which the Company operates. The Company has a detailed Securities Trading Policy which regulates dealings by Directors, senior managers and certain employees in shares, options and other securities issued in the Company. The policy prohibits trading from the close of trading on 30 June until after two clear trading days have elapsed from the date upon which the Company gives to the ASX its full-year result and from the close of trading on 31 December until after two clear days have elapsed from the date upon which the Company gives to the ASX it half-year result. A copy of the Securities Trading Policy is available on the Company’s corporate website. The Group Code of Conduct encourages employees to report conduct which they reasonably believe to be corrupt, illegal or unethical on a confidential basis, using the Company’s whistleblower program. It applies to all Company employees, contractors and consultants and is designed to protect individuals who, in good faith, report such conduct on a confidential basis, without fear of reprisal, dismissal or discriminatory treatment.
For
per
sona
l use
onl
y

Corporate governance statement : :
Billabong International Limited 2010-11 Full Financial Report Page 46
Appropriate training programs on the Group Code of Conduct are undertaken in each of the regions in which the Company operates. A copy of the main provisions of the Group Code of Conduct is available on the Company’s corporate website. Workplace Equity and Diversity Policy The Company values diversity and recognises the benefits it can bring to the Company’s ability to achieve its goals. Accordingly, a Workplace Equity and Diversity Policy has been established, a copy of which can be found on the Company’s corporate website. This policy outlines the Company’s commitment to diversity with specific reference to gender diversity. It includes the responsibilities of the Board, the Senior Executive team and staff in supporting and enhancing diversity across the business. The policy also outlines the requirement for the Board and Senior Executive team to establish, review and report on measurable objectives for improving female representation at Board and senior levels of the Company. In accordance with this policy and the ASX Recommendations, the following objectives have been established in relation to gender diversity. The aim is to achieve these objectives over the coming three to four years as Director and Senior Executive positions become available and appropriately skilled candidates are available.
Actual - No. of Females 30 June 2011
Actual - % of Females 30 June 2011
Objective - No. of
Females
Objective - % of
Females Number of females on the Board
2
33%
3
43%
Number of females in Senior Executive positions *
9 17% 13 25%
Number of females in the whole Company
3,743 52% Maintain female representation of not less than 50%
* Senior Executives include the CEO and the next two levels of management
In order to achieve these objectives the Company has established a five year gender diversity strategy which includes various action items in the general areas of communications, recruitment, retention, development and work practices. A Company wide communications program will be developed aimed at increasing commitment to diversity by articulating the business case for a gender balanced workforce. The program will include key input from the Company’s Senior Executive team. A Diversity Council will be established and tasked with working with Senior Executives and management to drive the diversity strategy and develop initiatives aimed at enhancing diversity across the Company. One of the Diversity Council’s responsibilities will be to review, select and recommend an annual development program focused on developing the Company’s ‘talent pipeline’. The selected program will be aimed to achieve the targets detailed above and may take the form of a mentoring program, external or internal course or one-on-one coaching. Recruitment and selection methodologies will be reviewed to include diversity attributes in shortlisting processes and hiring decisions. Further action items, all aimed at working towards the achievement of our diversity objectives, are included in the strategy. For the financial year ended 30 June 2011, much of the Company’s work on diversity focused on collating, researching and reviewing information from each of its operating centres. In consultation with the Board, this information was then utilised to develop the Company’s Workplace Equity and Diversity Policy, objectives and strategy. The Procedure for the Selection and Appointment of New Directors was also revised to ensure gender diversity is a key consideration in Board appointments. The 2011-12 financial year will see the commencement of the execution of the diversity strategy with a key focus on building momentum and engagement across all levels of the business in order to achieve greater gender diversity at senior levels of the Company.
For
per
sona
l use
onl
y

Corporate governance statement : :
Billabong International Limited 2010-11 Full Financial Report Page 47
PRINCIPLE 4: Safeguard integrity in financial repo rting Audit Committee Committee Members Allan McDonald (Chairman) Tony Froggatt Margaret Jackson Ted Kunkel The Board is committed to implementing and maintaining strong corporate governance practices. During the financial year some Australian shareholder advisory bodies raised concerns over the independence of Mr. Gordon Merchant and Ms. Colette Paull and their membership of the Audit Committee. While the Board has concluded that Ms. Paull is an independent Non-Executive Director, it was agreed that Mr. Merchant and Ms. Paull would cease to be members of the Company’s Audit Committee. In Ms. Paull’s case, this decision was made to counter any perceived lack on independence. Consequently Mr. Merchant and Ms. Paull did not participate in any Audit Committee decisions after December 2010. As at the date of signing the Directors’ Report, all members of the Audit Committee are Non-Executive Directors and are all independent Directors. The Chairman of the Committee is a Non-Executive Director. The Committee may extend an invitation to any person to attend all or part of any meeting of the Committee which it considers appropriate. The main functions of the Committee are to: • ensure the integrity and reliability of the Company’s financial statements and all other financial information published
by the Company or released to the market; • review the scope and results of external and compliance audits; • assess compliance with applicable legal and regulatory requirements; • assess the effectiveness of the systems of internal control and risk management; • review the appointment, remuneration, qualifications, independence and performance of the external auditors and the
integrity of the audit process as a whole; and • monitor and review the nature of non-audit services of external auditors and related fees and ensure it does not
adversely impact on auditor independence.
The Audit Committee has authority, within the scope of its responsibilities, to seek any information it requires from any employee or external party. The Audit Committee Charter is available on the Company’s corporate website.
The Audit Committee reports to, and makes recommendations to the full Board in relation to each of its functions. In fulfilling its responsibilities, the Audit Committee: • receives regular reports from management and the external auditors; • meets with the external auditors at least twice a year, or more frequently if necessary; and • meets separately with the external auditors at least twice a year without the presence of management. Certification of Financial Reports The CEO and CFO state in writing to the Board each reporting period that the Company’s financial reports present a true and fair view, in all material respects, of the Company’s financial position and operational results and are in accordance with relevant accounting standards. The statements from the CEO and CFO are based on a formal sign-off framework established throughout the Company. External Auditors The external auditor (PricewaterhouseCoopers) has declared its independence to the Board through is representations to the Committee and provision of its Statement of Independence to the Board, stating that they have maintained their independence in accordance with the provisions of APES 110 Code of Ethics for Professional Accountants and the applicable provisions of the Corporations Act 2001. It is PricewaterhouseCoopers’ policy to rotate audit engagement partners on listed companies at least every five years, and in accordance with that policy a new audit engagement partner will be introduced for the year ending 30 June 2012.
For
per
sona
l use
onl
y
Corporate governance statement : :
Billabong International Limited 2010-11 Full Financial Report Page 48
The performance of the external auditor is reviewed annually. An analysis of fees paid to the external auditors, including a breakdown of fees for non-audit services, is provided in the Directors’ Report and in the notes to the financial statements. The external auditor is requested to attend the Annual General Meeting and be available to answer shareholder questions about the conduct of the audit and the preparation and content of the audit report. A policy on the Selection and Appointment of External Auditors is available on the Company’s corporate website. PRINCIPLES 5 and 6: Make timely and balanced discl osure and respect the rights of shareholders The Company has an established policy and procedure for timely disclosure of material information concerning the Company. This includes internal reporting procedures to ensure that any material price sensitive information is reported to the Company Secretary in a timely manner. The Company Secretary has been nominated as the person responsible for communication with the Australian Securities Exchange (ASX). This role includes responsibility for ensuring compliance with the continuous disclosure requirements of the ASX Listing Rules and overseeing and co-ordinating information disclosure to the ASX, analysts, brokers, shareholders, the media and the public. All information disclosed to the ASX is posted on the Company’s corporate website as soon as it is disclosed to the ASX. When analysts are briefed following half-year and full-year results announcements, the material used in the presentations is released to the ASX prior to the commencement of the briefing. This information is also posted on the Company’s corporate website. Procedures have also been established for reviewing whether any price sensitive information has been inadvertently disclosed and, if so, this information is also immediately released to the market. The Company is committed to ensuring that all stakeholders and the market are provided with relevant and accurate information regarding its activities in a timely manner. A copy of the Continuous Disclosure Policy is available on the Company’s corporate website. The Company aims to keep shareholders informed of the Company’s performance and all major developments in an ongoing manner. Information is communicated to shareholders through: • the Interim Financial Report and Full Financial Report, Shareholder Review, Notice of Meetings and explanatory
materials which are published on the Company’s corporate website and distributed to shareholders where nominated; • the Annual General Meeting, and any other formally convened Company meetings; • transcripts of analyst briefings held by teleconference for half-year and full-year results announcements which are
posted on the Company’s corporate website within 24 hours of the briefing; and • all other information released to the ASX is posted to the Company’s corporate website.
The Company’s corporate website maintains, at a minimum, information about the last three years’ press releases or announcements. Where possible the Company arranges for advance notification of significant group briefings (including, but not limited to, results announcements) and makes them widely accessible, including through the use of webcasting. A copy of the Stakeholder Communications Policy is available on the Company’s corporate website. PRINCIPLE 7: Recognise and manage risk The Board, through the Audit Committee, is responsible for ensuring the adequacy of the Company’s risk management and compliance framework and system of internal controls and for regularly reviewing its effectiveness. The Company has implemented a risk management system based on AS/NZS 4360:2004; Risk Management standard and the ASX Recommendations. The framework is based around the following risk activities: • Risk Identification: Identify all significant foreseeable risks associated with business activities in a timely and
consistent manner; • Risk Evaluation: Evaluate risks using an agreed risk assessment criteria; • Risk Treatment/Mitigation: Develop mitigation plans for risk areas where the residual risk is greater than tolerable
risk levels; and • Risk Monitoring and Reporting: Report risk management activities and risk specific information to appropriate levels
of management in a timely manner. The Board, through the Audit Committee, reviews the Risk Management Policy and framework on a regular basis and satisfies itself that management has in place appropriate systems for managing risk and maintaining internal controls. The CEO and senior management team are responsible for identifying, evaluating and monitoring risk in accordance with the risk management framework. Senior management are responsible for the accuracy and validity of risk information
For
per
sona
l use
onl
y

Corporate governance statement : :
Billabong International Limited 2010-11 Full Financial Report Page 49
reported to the Board and also for ensuring clear communication of the Board and senior management’s position on risk throughout the Company. In particular, at the Board and senior management strategy planning sessions held throughout the year, the CEO and management team reviews and identifies key business and financial risks which could prevent the Company from achieving its objectives. Additionally a formal risk assessment process is part of each major capital acquisition with a post acquisition review undertaken after 18 to 24 months of major business acquisitions, major capital expenditures or significant business initiatives. Certification of risk management controls In conjunction with the certification of financial reports under Principle 4, the CEO and CFO state in writing to the Board each reporting period that: • the statement is founded on a sound system of risk management and internal compliance and control which
implements the policies adopted by the Board; and • the Company’s risk management and internal compliance and control system is operating efficiently and effectively in
all material respects.
The Risk Management Policy is available on the Company’s corporate website. PRINCIPLE 8: Remunerate fairly and responsibly Human Resource and Remuneration Committee Committee Members Margaret Jackson (Chairman) Tony Froggatt Ted Kunkel Allan McDonald Gordon Merchant Colette Paull The Human Resource and Remuneration Committee consists only of Non-Executive Directors and a majority of the members of the Committee are independent. The Chairman of the Committee is an independent Non-Executive Director. The Committee may extend an invitation to any person to attend all or part of any meeting of the Committee which it considers appropriate. The main functions of the Committee are to assist the Board in establishing remuneration policies and practices which: (a) enable the Group to attract and retain Executives and Directors (Executive and Non-Executive) who will create
sustainable value for shareholders and other stakeholders; (b) fairly and responsibly reward Executives and Directors having regard to the Group’s overall strategy and objectives,
the performance of the Group, the performance of the Executive and the general market environment; and (c) comply with all relevant legislation and regulations including the ASX Listing Rules and Corporations Act 2001.
In particular to: • review the remuneration for each Executive Director (including base pay, incentive payments, equity awards and
retirement or severance benefits), having regard to the Executive remuneration policy and whether in respect of any elements of remuneration any shareholder approvals are required;
• annually appraise the performance of the CEO and provide appropriate Executive development programs; • review the remuneration (including incentive awards, equity awards and service employment contracts) for the CEO
and senior management, to ensure they are consistent with the Executive remuneration policy; • review Non-Executive Director remuneration with the assistance of external consultants as appropriate; • review all equity based plans and all cash-based Executive incentive plans; • review the appropriateness of management succession plans; • review annually the remuneration trends (including major changes in employee benefit structures, philosophies and
practices) across the Group in its various regions; • review policies, reports and performance relating to diversity, conduct and any other Group Human Resource
matters; and • ensure that the Board is aware of all relevant legal requirements regarding disclosure of remuneration.
For
per
sona
l use
onl
y

Corporate governance statement : :
Billabong International Limited 2010-11 Full Financial Report Page 50
The Committee reviews and sets key performance indicators (KPI’s) relating to financial and non-financial targets for senior management at the commencement of each financial year. These KPI’s are evaluated at the end of each reporting period and impact on the discretionary element of the Executive’s remuneration. Committee members receive briefings from external remuneration consultants on recent developments on remuneration and related matters. The Human Resource and Remuneration Committee Charter is available on the Company’s corporate website. The Human Resource and Remuneration Committee reports to, and makes recommendations to the full Board in relation to each of its functions. Structure of Remuneration Details of the nature and amount of each element of the remuneration for Directors and key Executives of the Company are set out in the ‘Remuneration Report’ section of the Directors’ Report. The current maximum aggregate remuneration pool for Non-Executive Directors is currently $1,500,000 per annum which was approved by shareholders at the Annual General Meeting on 26 October 2010. There are no Directors’ retirement benefits other than statutory superannuation.
For
per
sona
l use
onl
y
Billabong International
Limited ABN 17 084 923 946
Contents Page
Consolidated income statement 52
Consolidated statement of comprehensive income 53
Consolidated balance sheet 54
Consolidated statement of changes in equity 55
Consolidated cash flow statement 56
Notes to the consolidated financial statements 57
Directors’ declaration 130
Independent auditor’s report to the members 131
: : FINANCIAL REPORT 30 JUNE 2011
This financial report covers the consolidated entity consisting of Billabong International Limited and its subsidiaries. The financial report is presented in Australian currency.
Billabong International Limited is a company limited by shares, incorporated and domiciled in Australia. Its registered office and principal place of business is:
Billabong International Limited 1 Billabong Place Burleigh Heads QLD 4220
A description of the nature of the consolidated entity’s operations and its principal activities is included in the Directors’ report on pages 2 – 6, which is not part of this financial report.
The financial report was authorised for issue by the Directors on 19 August 2011. The Company has the power to amend and reissue the financial report.
Through the use of the internet, we have ensured that our corporate reporting is timely, complete, and available globally at minimum cost to the Company. All press releases, financial reports and other information are available on our corporate website at www.billabongbiz.com.
For
per
sona
l use
onl
y
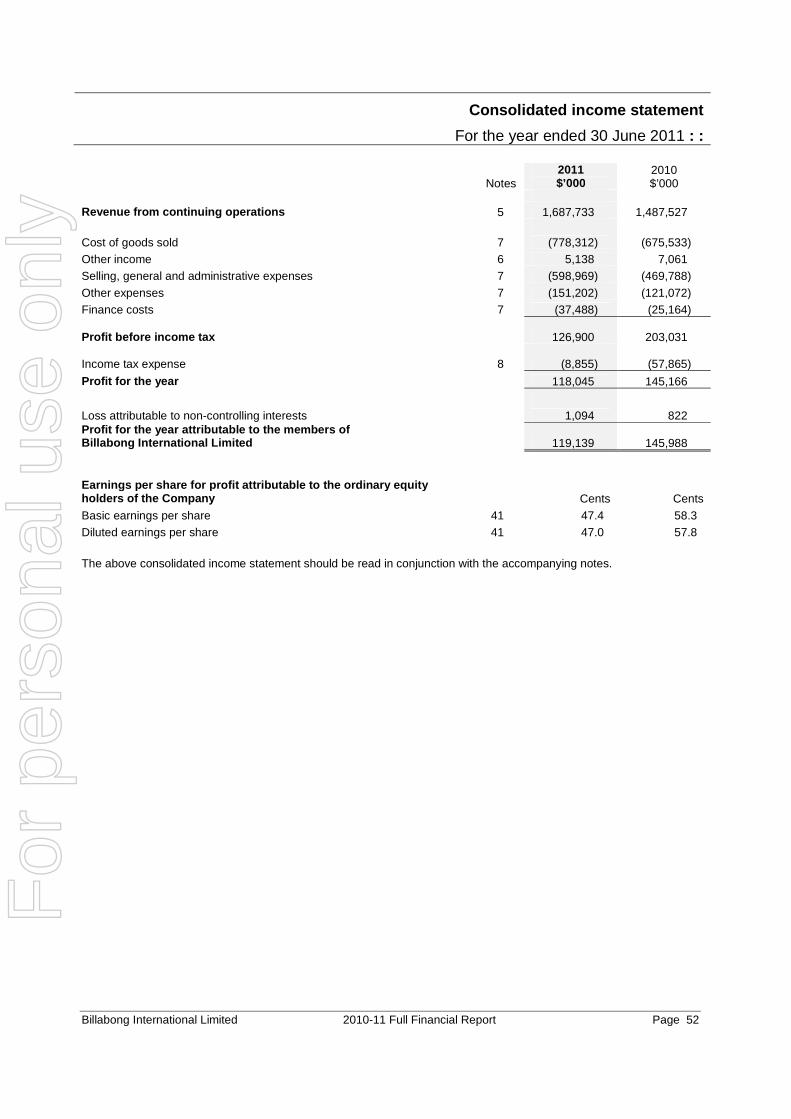
Consolidated income statement
For the year ended 30 June 2011 : :
Billabong International Limited 2010-11 Full Financial Report Page 52
Notes
2011 $’000
2010 $’000
Revenue from continuing operations 5 1,687,733 1,487,527
Cost of goods sold 7 (778,312) (675,533) Other income 6 5,138 7,061 Selling, general and administrative expenses 7 (598,969) (469,788)
Other expenses 7 (151,202) (121,072) Finance costs 7 (37,488) (25,164) Profit before income tax
126,900 203,031
Income tax expense
8 (8,855) (57,865)
Profit for the year 118,045 145,166
Loss attributable to non-controlling interests 1,094 822 Profit for the year attributable to the members of Billabong International Limited
119,139 145,988
Earnings per share for profit attributable to the o rdinary equity holders of the Company
Cents Cents
Basic earnings per share 41 47.4 58.3 Diluted earnings per share 41 47.0 57.8 The above consolidated income statement should be read in conjunction with the accompanying notes.
For
per
sona
l use
onl
y

Consolidated statement of comprehensive income
For the year ended 30 June 2011 : :
Billabong International Limited 2010-11 Full Financial Report Page 53
The above consolidated statement of comprehensive income should be read in conjunction with the accompanying notes.
Notes 2011 $’000
2010 $’000
Profit for the year
118,045
145,166
Other comprehensive income
Changes in the fair value of cash flow hedges, net of tax 27(b) (3,452) 11,304
Exchange differences on translation of foreign operations 27(b) (52,205) (14,486)
Net investment hedge, net of tax 27(b) (10,064) (16,981)
Other comprehensive expense for the year, net of ta x (65,721) (20,163) Total comprehensive income for the year 52,324 125,003
Loss attributable to non-controlling interests 1,094 822 Total comprehensive income for the year attributabl e to members of Billabong International Limited 53,418 125,825
For
per
sona
l use
onl
y
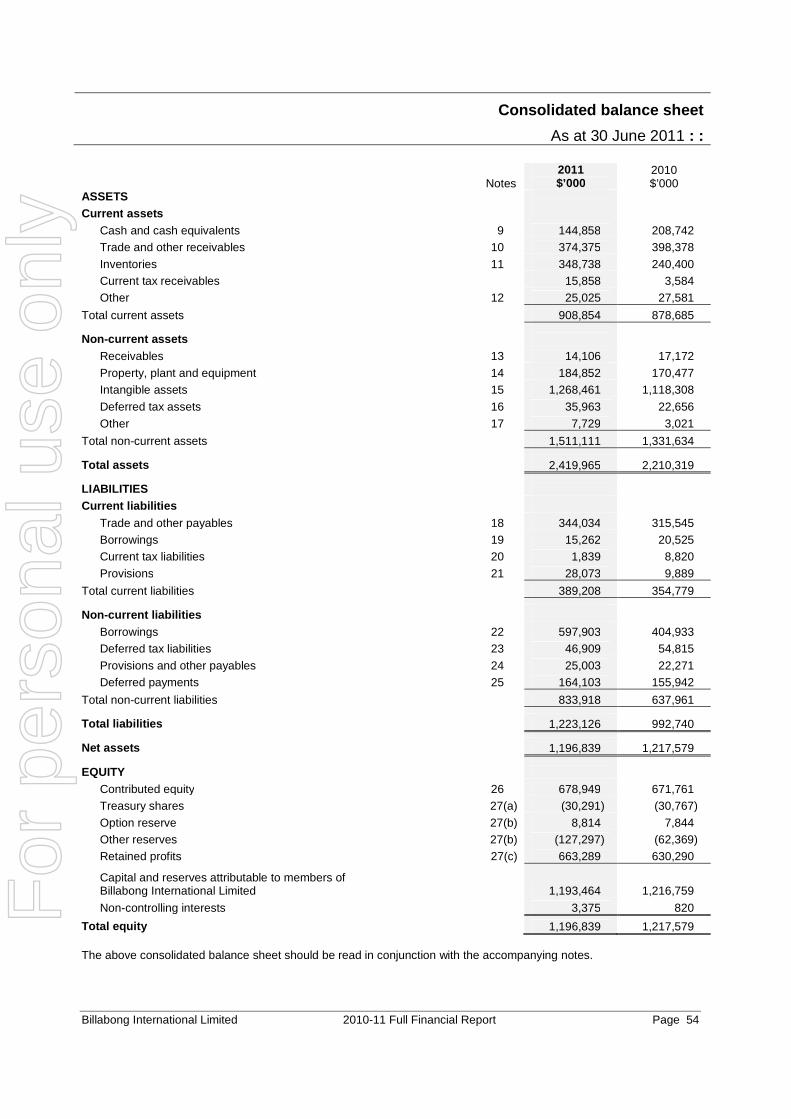
Consolidated balance sheet
As at 30 June 2011 : :
Billabong International Limited 2010-11 Full Financial Report Page 54
Notes
2011 $’000
2010 $’000
ASSETS
Current assets
Cash and cash equivalents 9 144,858 208,742 Trade and other receivables 10 374,375 398,378
Inventories 11 348,738 240,400 Current tax receivables 15,858 3,584 Other 12 25,025 27,581
Total current assets 908,854 878,685
Non-current assets Receivables 13 14,106 17,172
Property, plant and equipment 14 184,852 170,477 Intangible assets 15 1,268,461 1,118,308
Deferred tax assets 16 35,963 22,656
Other 17 7,729 3,021
Total non-current assets 1,511,111 1,331,634 Total assets 2,419,965 2,210,319
LIABILITIES Current liabilities
Trade and other payables 18 344,034 315,545 Borrowings 19 15,262 20,525 Current tax liabilities 20 1,839 8,820
Provisions 21 28,073 9,889
Total current liabilities 389,208 354,779 Non-current liabilities
Borrowings 22 597,903 404,933 Deferred tax liabilities 23 46,909 54,815
Provisions and other payables 24 25,003 22,271 Deferred payments 25 164,103 155,942
Total non-current liabilities 833,918 637,961 Total liabilities 1,223,126 992,740 Net assets 1,196,839 1,217,579 EQUITY
Contributed equity 26 678,949 671,761 Treasury shares 27(a) (30,291) (30,767)
Option reserve 27(b) 8,814 7,844 Other reserves 27(b) (127,297) (62,369) Retained profits 27(c) 663,289 630,290
Capital and reserves attributable to members of Billabong International Limited
1,193,464 1,216,759
Non-controlling interests 3,375 820
Total equity 1,196,839 1,217,579 The above consolidated balance sheet should be read in conjunction with the accompanying notes.
For
per
sona
l use
onl
y

Consolidated statement of changes in equity
For the year ended 30 June 2011 : :
Billabong International Limited 2010-11 Full Financial Report Page 55
Attributable to members of
Billabong International Limited
Notes
Contri -buted equity Reserves
Retained earnings Total
Non-con -trolling
interests Total equity
$’000 $’000 $’000 $’000 $’000 $’000 Balance at 1 July 2009 659,012 (57,256) 575,180 1,176,936 --- 1,176,936 Profit for the year --- --- 145,988 145,988 (822) 145,166
Other comprehensive income --- (20,163) --- (20,163) --- (20,163) Total comprehensive income for the year --- (20,163) 145,988 125,825
(822)
125,003
Transactions with equity holders in their capacity as equity holders:
Dividend reinvestment plan issues 26(b) 12,749 --- --- 12,749 --- 12,749 Dividends paid 28 --- --- (90,878) (90,878) --- (90,878) Treasury shares purchased by employee share plan trusts 27(a) --- (3,472) --- (3,472) --- (3,472) Option reserve in respect of employee share plan 27(b) --- 5,325 --- 5,325 --- 5,325 Redemption option for non-controlling derivative 27(b) --- (9,726) --- (9,726) --- (9,726) Non-controlling interests on acquisition of subsidiary 35 --- --- --- --- 1,642 1,642
12,749 (7,873) (90,878) (86,002) 1,642 (84,360)
Balance at 30 June 2010 671,761 (85,292) 630,290 1,216,759 820 1,217,579
Profit for the year --- --- 119,139 119,139 (1,094) 118,045
Other comprehensive income --- (65,721) --- (65,721) --- (65,721) Total comprehensive in come for the year --- (65,721)
119,139
53,418 (1,094) 52,324
Transactions with equity holders in their capacity as equity holders:
Dividend reinvestment plan issues 26(b) 7,188 --- --- 7,188 --- 7,188
Dividends paid 28 --- --- (86,140) (86,140) --- (86,140) Treasury shares purchased by employee share plan trusts 27(a) --- (4,446) --- (4,446) --- (4,446) Option reserve in respect of employee share plan 27(b) --- 5,892 --- 5,892 --- 5,892 Redemption option for non-controlling derivative 27(b) --- 793 --- 793 --- 793 Non-controlling interests on acquisition of subsidiary 35 --- --- --- --- 3,649 3,649
7,188 2,239 (86,140) (76,713) 3,649 (73,064)
Balance at 30 June 2011 678,949 (148,774) 663,289 1,193,464 3,375 1,196,839
The above consolidated statement of changes in equity should be read in conjunction with the accompanying notes.
For
per
sona
l use
onl
y

Consolidated cash flow statement
For the year ended 30 June 2011 : :
Billabong International Limited 2010-11 Full Financial Report Page 56
Notes
2011 $’000
2010 $’000
Cash flows from operating activities
Receipts from customers (inclusive of GST) 1,773,303 1,551,174 Payments to suppliers and employees (inclusive of GST) (1,673,100) (1,299,033)
100,203 252,141
Interest received 2,287 3,319 Other revenue 2,264 3,726
Finance costs (35,688) (22,774)
Income taxes paid (44,730) (49,165)
Net cash inflow from operat ing activities 39 24,336 187,247 Cash flows from investing activities Payments for purchase of subsidiaries and businesses, net of cash acquired
35 (215,064) (49,591)
Payments for property, plant and equipment (43,244) (53,064)
Payments for intangible assets (9,126) (3,393) Proceeds from sale of property, plant and equipment 499 284
Net cash outflow from investing activities (266,935) (105,764) Cash flows from financing activities
Payments for treasury shares held by employee share plan trusts (4,446) (3,472) Proceeds from borrowings 956,023 698,832 Repayment of borrowings (671,674) (809,333)
Dividends paid 28 (78,952) (78,129)
Net cash inflow/(outflow) from financing activities 200,951 (192,102) Net decrease in cas h and cash equivalents (41,648) (110,619) Cash and cash equivalents at the beginning of the year 208,742 332,937 Effects of exchange rate changes on cash and cash equivalents (22,669) (13,576)
Cash and cash equivalents at the end of the year 9 144,425 208,742 Financing arrangements 22 Non-cash investing and financing activities 40 The above consolidated cash flow statement should be read in conjunction with the accompanying notes.
For
per
sona
l use
onl
y
Notes to the consolidated financial statements 30 J une 2011 : :
Billabong International Limited 2010-11 Full Financial Report Page 57
Contents of the notes to the consolidated financial sta tements Page Note 1. Summary of significant accounting policies 58 Note 2. Financial risk management 72 Note 3. Critical accounting estimates and judgements 78 Note 4. Segment information 79 Note 5. Revenue 81 Note 6. Other income 81 Note 7. Expenses 82 Note 8. Income tax expense 83 Note 9. Current assets – Cash and cash equivalents 84 Note 10. Current assets – Trade and other receivables 85 Note 11. Current assets – Inventories 86 Note 12. Current assets – Other 87 Note 13. Non-current ass ets – Receivables 87 Note 14. Non-current assets – Property, plant and equipment 88 Note 15. Non-current assets – Intangible assets 89 Note 16. Non-current assets – Deferred tax assets 91 Note 17. Non-current assets – Other 91 Note 18. Current liabili ties – Trade and other payables 92 Note 19. Current liabilities – Borrowings 92 Note 20. Current liabilities – Current tax liabilities 93 Note 21. Current liabilities – Provisions 93 Note 22. Non-current liabilities – Borrowings 94 Note 23. Non-curren t liabilities – Deferred tax liabilities 96 Note 24. Non-current liabilities – Provisions and other payables 96 Note 25. Non-current liabilities – Deferred payment s 97 Note 26. Contributed equity 97 Note 27. Treasury shares, reserves and retained profi ts 99 Note 28. Dividends 101 Note 29. Derivative financial instruments 102 Note 30. Key management personnel disclosures 105 Note 31. Remuneration of auditors 110 Note 32. Contingencies 111 Note 33. Commitments 111 Note 34. Related party transaction s 112 Note 35. Business combinations 113 Note 36. Subsidiaries 118 Note 37. Deed of cross guarantee 119 Note 38. Events occurring after the balance sheet date 121 Note 39. Reconciliation of profit for the year to net cash in flow from operating activit ies 121 Note 40. Non-cash investing and financing activities 121 Note 41. Earnings per share 122 Note 42. Share-based payments 123 Note 43. Parent entity financial information 129
For
per
sona
l use
onl
y
Notes to the consolidated financial statements 30 J une 2011 : :
Billabong International Limited 2010-11 Full Financial Report Page 58
Note 1. Summary of significant accounting policies The principal accounting policies adopted in the preparation of these consolidated financial statements are set out below. These policies have been consistently applied to all the years presented, unless otherwise stated. The financial statements are for the consolidated entity consisting of Billabong International Limited and its subsidiaries (the Group or consolidated entity). (a) Basis of preparation
The general purpose financial report has been prepared in accordance with Australian Accounting Standards, other authoritative pronouncements of the Australian Accounting Standards Board (AASB), Urgent Issues Group Interpretations and the Corporations Act 2001. Compliance with IFRS The financial report of the consolidated entity also complies with International Financial Reporting Standards (IFRS) as issued by the International Accounting Standards Board (IASB). Early adoption of standards The Group has elected not to early apply accounting standards that are not applicable to the accounting period ended 30 June 2011. Historical cost convention These financial statements have been prepared under the historical cost convention, as modified by the revaluation of financial assets and liabilities (including derivative instruments) at fair value through profit or loss and certain classes of property, plant and equipment. Critical accounting estimates The preparation of financial statements requires the use of certain critical accounting estimates. It also requires management to exercise its judgement in the process of applying the Group’s accounting policies. The areas involving a higher degree of judgement or complexity, or areas where assumptions and estimates are significant to the financial statements, are disclosed in note 3.
(b) Principles of consolidation
(i) Subsidiaries The consolidated financial statements incorporate the assets and liabilities of all subsidiaries of Billabong International Limited (the Company or parent entity) as at 30 June 2011 and the results of all subsidiaries for the year then ended. Subsidiaries are all entities (including special purpose entities) over which the Group has the power to govern the financial and operating policies, generally accompanying a shareholding of more than one-half of the voting rights. The existence and effect of potential voting rights that are currently exercisable or convertible are considered when assessing whether the Group controls another entity. Subsidiaries are fully consolidated from the date on which control is transferred to the Group. They are de-consolidated from the date that control ceases. The acquisition method of accounting is used to account for business combinations by the Group (refer to note 1(h)). Intercompany transactions, balances and unrealised gains on transactions between Group companies are eliminated. Unrealised losses are also eliminated unless the transaction provides evidence of the impairment of the asset transferred. Accounting policies of subsidiaries have been changed where necessary to ensure consistency with the policies adopted by the Group. Non-controlling interests in the results and equity of subsidiaries are shown separately in the consolidated income statement, statement of comprehensive income, statement of changes in equity and balance sheet respectively.
Investments in subsidiaries are accounted for at cost in the separate financial statements of Billabong International Limited.
For
per
sona
l use
onl
y

Notes to the consolidated financial statements 30 J une 2011 : :
Billabong International Limited 2010-11 Full Financial Report Page 59
Note 1. Summary of significant accounting policies (continued) (ii) Employee Share Trust
The Group has formed trusts to administer the Group’s Executive Performance Share Plan. The trusts are consolidated, as the substance of the relationship is that the trusts are controlled by the Group. Shares held by the Billabong Executive Performance Share Plan – Australia trust and the Billabong Executive Performance Share Plan trust are disclosed as treasury shares and deducted from equity.
(iii) Changes in ownership interests
The Group treats transactions with non-controlling interests that do not result in a loss of control as transactions with equity owners of the Group. A change in ownership interest results in an adjustment between the carrying amounts of the controlling and non-controlling interest to reflect their relative interests in the subsidiary. Any difference between the amount of the adjustment to non-controlling interests and any consideration paid or received is recognised in a separate reserve within equity attributable to members of Billabong International Limited. When the Group ceases to have control, joint control or significant influence, any retained interest in the entity is remeasured to its fair value with the change in carrying amount recognised in profit or loss. The fair value is the initial carrying amount for the purposes of subsequently accounting for the retained interest as an associate, jointly controlled entity or financial asset. In addition, any amounts previously recognised in other comprehensive income in respect of that entity are accounted for as if the Group had directly disposed of the related assets or liabilities. This may mean that amounts previously recognised in other comprehensive income are reclassified to profit or loss. If the ownership interest in a jointly-controlled entity or an associate is reduced but joint control or significant influence is retained, only a proportionate share of the amounts previously recognised in other comprehensive income are reclassified to profit or loss where appropriate.
(c) Segment reporting
Operating segments are reported in a manner consistent with the internal reporting provided to the chief operating decision maker. The chief operating decision maker, who is responsible for allocating resources and assessing performance of the operating segments, has been identified as the Chief Executive Officer (CEO).
(d) Foreign currency translation
(i) Functional and presentation currency Items included in the financial statements of each of the Group’s entities are measured using the currency of the primary economic environment in which the entity operates (‘the functional currency’). The consolidated financial statements are presented in Australian dollars, which is the Company’s functional and presentation currency.
(ii) Transactions and balances Foreign currency transactions are translated into the functional currency using the exchange rates prevailing at the dates of the transactions. Foreign exchange gains and losses resulting from the settlement of such transactions and from the translation at year end exchange rates of monetary assets and liabilities denominated in foreign currencies are recognised in the income statement, except when deferred in equity as qualifying cash flow hedges and qualifying net investment hedges, or are attributable to part of the net investment in a foreign operation.
(iii) Group companies
The results and financial position of all the Group entities (none of which has the currency of a hyperinflationary economy) that have a functional currency different from the presentation currency are translated into the presentation currency as follows: o assets and liabilities for each balance sheet presented are translated at the closing rate at the date of
that balance sheet; o income and expenses for each income statement and statement of comprehensive income are
translated at average monthly exchange rates (unless this is not a reasonable approximation of the cumulative effect of the rates prevailing on the transaction dates, in which case income and expenses are translated at the dates of the transactions); and
o all resulting exchange differences are recognised in other comprehensive income.
For
per
sona
l use
onl
y

Notes to the consolidated financial statements 30 J une 2011 : :
Billabong International Limited 2010-11 Full Financial Report Page 60
Note 1. Summary of significant accounting policies (continued)
On consolidation, exchange differences arising from the translation of any net investment in foreign entities, and of borrowings and other financial instruments designated as hedges of such investments, are recognised in other comprehensive income. When a foreign operation is sold or borrowings repaid, a proportionate share of such exchange differences is reclassified to profit or loss as part of the gain or loss on sale, where applicable. Goodwill and fair value adjustments arising on the acquisition of a foreign entity are treated as assets and liabilities of the foreign entity and translated at the closing rate.
(e) Revenue recognition
Revenue is measured at the fair value of the consideration received or receivable. Amounts disclosed as revenue are net of returns, trade allowances and amounts collected on behalf of third parties. Revenue is recognised for the major business activities as follows:
(i) Sale of goods
Revenue from sale of goods is recognised when it can be reliably measured, the significant risks and rewards of ownership have passed to, and the goods been accepted by, the customer and collectability of the related receivable is probable.
Sales terms determine when risks and rewards are considered to have passed to the customer. Given that sales terms vary between regions and customers the Group recognises some wholesale sales on shipment and others on delivery of goods to the customer, whichever is appropriate. The Group recognises retail sales at the time of sale of the goods to the customer.
(ii) Interest income
Interest income is recognised on a time proportion basis using the effective interest method. When a receivable is impaired, the Group reduces the carrying amount to its recoverable amount, being the estimated future cash flow discounted at the original effective interest rate of the instrument, and continues unwinding the discount as interest income over the discounted period.
(iii) Royalty income
Royalty income is recognised as it accrues.
(iv) Agent commissions Revenue earned from the sourcing of product on behalf of licensees is recognised net of the cost of the goods, reflecting the sourcing commission only. Sourcing commission is recognised when the goods are provided.
(f) Income tax
The income tax expense or revenue for the period is the tax payable on the current period’s taxable income based on the applicable income tax rate for each jurisdiction adjusted by changes in deferred tax assets and liabilities attributable to temporary differences and to unused tax losses. The current income tax charge is calculated on the basis of the tax laws enacted or substantively enacted at the end of the reporting period in the countries where the Company’s subsidiaries and associates operate and generate taxable income. Management periodically evaluates positions taken in tax returns with respect to situations in which applicable tax regulation is subject to interpretation. It establishes provisions where appropriate on the basis of amounts expected to be paid to the tax authorities. Deferred income tax is provided in full, using the liability method, on temporary differences arising between the tax bases of assets and liabilities and their carrying amounts in the consolidated financial statements. However, the deferred income tax is not accounted for if it arises from initial recognition of an asset or liability in a transaction other than a business combination that at the time of the transaction affects neither accounting nor taxable profit or loss. Deferred income tax is determined using tax rates (and laws) that have been enacted or substantially enacted by the balance sheet date and are expected to apply when the related deferred income tax asset is realised or the deferred income tax liability is settled.
Deferred tax assets are recognised for deductible temporary differences and unused tax losses only if it is probable that future taxable amounts will be available to utilise those temporary differences and losses.
For
per
sona
l use
onl
y
Notes to the consolidated financial statements 30 J une 2011 : :
Billabong International Limited 2010-11 Full Financial Report Page 61
Note 1. Summary of significant accounting policies (continued) Deferred tax liabilities and assets are not recognised for temporary differences between the carrying amount and tax bases of investments in controlled entities where the parent entity is able to control the timing of the reversal of the temporary differences and it is probable that the differences will not reverse in the foreseeable future. Deferred tax assets and liabilities are offset when there is a legally enforceable right to offset current tax assets and liabilities and when the deferred tax balances relate to the same taxation authority. Current tax assets and tax liabilities are offset where the entity has a legally enforceable right to offset and intends either to settle on a net basis, or to realise the asset and settle the liability simultaneously. Current and deferred tax is recognised in profit or loss, except to the extent that it relates to items recognised in other comprehensive income or directly in equity. In this case, the tax is also recognised in other comprehensive income or directly in equity, respectively. Investment allowances Companies within the Group may be entitled to claim special tax deductions for investments in qualifying assets (investment allowances). The Group accounts for such allowances as tax credits, which means that the allowance reduces income tax payable and current tax expense. Any unclaimed tax credits may be carried forward as deferred tax assets.
(g) Leases
Leases of property, plant and equipment where the Group, as lessee, has substantially all the risks and rewards of ownership are classified as finance leases. Finance leases are capitalised at the lease’s inception at the fair value of the leased property or, if lower, the present value of the minimum lease payments. The corresponding rental obligations, net of finance charges, are included in other short-term and long-term payables. Each lease payment is allocated between the liability and finance cost. The interest element of the finance cost is charged to the income statement over the lease period so as to produce a constant periodic rate of interest on the remaining balance of the liability for each period. The property, plant and equipment acquired under finance lease is depreciated over the shorter of the asset’s useful life and the lease term if there is no reasonable certainty that the Group will obtain ownership at the end of the lease term. Leases in which a significant portion of the risks and rewards of ownership are not transferred to the Group as lessee are classified as operating leases (note 33). Payments made under operating leases (net of any incentives received from the lessor) are charged to the income statement on a straight-line basis over the period of the lease. Lease income from operating leases where the Group is a lessor is recognised in income on a straight-line basis over the lease term. The respective leased assets are included in the balance sheet based on their nature.
(h) Business combinations
The acquisition method of accounting is used to account for all business combinations, regardless of whether equity instruments or other assets are acquired. The consideration transferred for the acquisition of a subsidiary comprises the fair values of the assets transferred, the liabilities incurred and the equity interests issued by the Group. The consideration transferred also includes the fair value of any contingent consideration arrangement and the fair value of any pre-existing equity interest in the subsidiary. Acquisition-related costs are expensed as incurred. Identifiable assets acquired and liabilities and contingent liabilities assumed in a business combination are, with limited exceptions, measured initially at their fair values at the acquisition date. On an acquisition-by-acquisition basis, the Group recognises any non-controlling interest in the acquiree either at fair value or at the non-controlling interest’s proportionate share of the acquiree’s net identifiable assets. The excess of the consideration transferred, the amount of any non-controlling interest in the acquiree and the acquisition-date fair value of any previous equity interest in the acquiree over the fair value of the Group’s share of the net identifiable assets acquired is recorded as goodwill. If those amounts are less than the fair value of the net identifiable assets of the subsidiary acquired and the measurement of all amounts has been reviewed, the difference is recognised directly in profit or loss as a bargain purchase. Deferred or contingent consideration – acquisitions pre 1 July 2009 When deferred or contingent consideration payable becomes probable and the amount can be reliably measured the Group brings it to account. Where settlement of any part of cash consideration is deferred and recognised as a non-current liability, the amounts payable in the future are discounted to their present value as at the date of exchange. The discount rate used is the Group’s risk-free rate.
For
per
sona
l use
onl
y

Notes to the consolidated financial statements 30 J une 2011 : :
Billabong International Limited 2010-11 Full Financial Report Page 62
Note 1. Summary of significant accounting policies (continued) Deferred or contingent consideration – acquisitions post 1 July 2009 Where settlement of any part of cash consideration is deferred or contingent on future events, the amounts payable in the future are discounted to their present value as at the date of exchange. The discount rate used is the Group’s risk-free rate. Amounts classified as a payable are subsequently remeasured to fair value with changes in fair value recognised in the income statement.
(i) Impairment of assets
Goodwill and intangible assets that have an indefinite useful life are not subject to amortisation and are tested annually for impairment, or more frequently if events or changes in circumstances indicate that they might be impaired. Other assets are reviewed for impairment whenever events or changes in circumstances indicate that the carrying amount may not be recoverable. An impairment charge is recognised for the amount by which the asset’s carrying amount exceeds its recoverable amount. The recoverable amount is the higher of an asset’s fair value less costs to sell and value-in-use. For the purposes of assessing impairment, assets are grouped at the lowest levels for which there are separately identifiable cash inflows which are largely independent of the cash inflows from other assets or groups of assets (cash-generating units). Non-financial assets other than goodwill that suffered an impairment are reviewed for possible reversal of the impairment at each reporting date. No amortisation is provided against the carrying value of purchased brands on the basis that these assets are considered to have an indefinite useful life. Key factors taken into account in assessing the useful life of brands are:
• The brands are well established and protected by trademarks across the globe which are generally subject to an indefinite number of renewals upon appropriate application; and
• There are currently no legal, technical or commercial obsolescence factors applying to the brands or the products to which they attach which indicate that the life should be considered limited.
(j) Cash and cash equivalents
For cash flow statement presentation purposes, cash and cash equivalents includes cash on hand, deposits held at call with financial institutions, other short-term, highly liquid investments with original maturities of three months or less that are readily convertible to known amounts of cash and which are subject to an insignificant risk of changes in value, and bank overdrafts. Bank overdrafts are shown within borrowings in current liabilities on the balance sheet.
(k) Trade receivables
All trade receivables are recognised at the date they are invoiced, initially at fair value and subsequently measured at amortised cost, and are principally on 30 day terms. They are presented as current assets unless collection is not expected for more than 12 months after the balance sheet date. Collectability of trade receivables is reviewed on an ongoing basis. Debts which are known to be uncollectible are written off by reducing the carrying amount directly. An allowance account (provision for impairment of trade receivables) is established when there is objective evidence that the Group will not be able to collect all amounts due according to the original terms of the receivables. Significant financial difficulties of the debtor, probability that the debtor will enter bankruptcy or financial reorganisation, and default or delinquency in payments are considered indicators that the trade receivable is impaired. The amount of the impairment allowance is the difference between the asset’s carrying amount and the present value of estimated future cash flows, discounted at the original effective interest rate. Cash flows relating to short-term receivables are not discounted if the effect of discounting is immaterial. The amount of the impairment charge is recognised in the income statement within other expenses. When a trade receivable for which an impairment allowance had been recognised becomes uncollectible in a subsequent period, it is written off against the allowance account. Subsequent recoveries of amounts previously written off are credited against other expenses in the income statement. Other receivables is comprised of amounts receivable under a factoring arrangement and amounts due as a result of transactions outside the normal course of trading.
For
per
sona
l use
onl
y

Notes to the consolidated financial statements 30 J une 2011 : :
Billabong International Limited 2010-11 Full Financial Report Page 63
Note 1. Summary of significant accounting policies (continued)
(l) Inventories
Raw materials, work in progress and finished goods are stated at the lower of cost and net realisable value. (i) Raw materials
Cost is determined using the first-in, first-out (FIFO) method and standard costs approximating actual costs. (ii) Work in progress and finished goods
Cost is standard costs approximating actual costs including direct materials, direct labour and an allocation of variable and fixed overhead expenditure, the latter being allocated on the basis of normal operating capacity. Costs of purchased inventory are determined after deducting rebates and discounts.
Net realisable value is the estimated selling price in the ordinary course of business, less applicable variable selling expenses. Cost also includes the transfer from equity of any gains/losses on qualifying cash flow hedges relating to purchases.
(m) Investments and other financial assets
Classification The Group classifies its financial assets in the following categories: financial assets at fair value through profit and loss, loans and receivables, held-to-maturity investments, and available-for-sale financial assets. The classification depends on the purpose for which the investments were acquired. Management determines the classification of its investments at initial recognition and, in the case of assets classified as held-to-maturity, re-evaluates this designation at each reporting date. (i) Loans and receivables
Loans and receivables are non-derivative financial assets with fixed or determinable payments that are not quoted in an active market. They are included in current assets, except for those with maturities greater than 12 months after the balance sheet date which are classified as non-current assets. Loans and receivables are included in trade and other receivables (note 10) and receivables (note 13) in the balance sheet.
(ii) Held-to-maturity investments
Held-to-maturity investments are non-derivative financial assets with fixed or determinable payments and fixed maturities that the Group’s management has the positive intention and an ability to hold to maturity. If the Group were to sell other than an insignificant amount of held-to-maturity financial assets, the whole category would be tainted and reclassified as available-for-sale. Held-to-maturity financial assets are included in non-current assets, except for those with maturities less than 12 months from the reporting date, which are classified as current assets.
Recognition and derecognition Regular purchases and sales of financial assets are recognised on trade-date – the date on which the Group commits to purchase or sell the asset. Financial assets are derecognised when the rights to receive cash flows from the financial assets have expired or have been transferred and the Group has transferred substantially all the risks and rewards of ownership. Subsequent measurement Loans and receivables and held-to-maturity investments are carried at amortised cost using the effective interest method. Financial assets at fair value through profit or loss are subsequently carried at fair value. Gains or losses arising from changes in the fair value of the ‘financial assets at fair value through profit or loss’ category, including interest and dividend income, are presented in the income statement within other income or other expenses in the period in which they arise. Changes in the fair value of monetary securities denominated in a foreign currency and classified as available-for-sale are analysed between translation differences resulting from changes in the amortised cost of the security and other changes in the carrying amount of the security. The translation differences related to changes in the amortised cost are recognised in profit or loss, and other changes in carrying amount are recognised in other comprehensive income. Changes in the fair value of other monetary and non-monetary securities classified as available-for-sale are recognised in other comprehensive income.
For
per
sona
l use
onl
y

Notes to the consolidated financial statements 30 J une 2011 : :
Billabong International Limited 2010-11 Full Financial Report Page 64
Note 1. Summary of significant accounting policies (continued) Details on how the fair value of financial instruments is determined are disclosed in note 2. Impairment The Group assesses at each balance date whether there is objective evidence that a financial asset or group of financial assets is impaired. In the case of equity securities classified as available-for-sale, a significant or prolonged decline in the fair value of a security below its cost is considered as an indicator that the securities are impaired. If any such evidence exists for available-for-sale financial assets, the cumulative loss – measured as the difference between the acquisition cost and the current fair value, less any impairment charge on that financial asset previously recognised in profit and loss – is reclassified from equity and recognised in the income statement. Impairment charges recognised in the income statement on equity instruments classified as available-for-sale are not reversed through the income statement. Assets carried at amortised cost For loans and receivables, the amount of the loss is measured as the difference between the asset’s carrying amount and the present value of estimated future cash flows (excluding future credit losses that have not been incurred), discounted at the financial asset’s original effective interest rate. The carrying amount of the asset is reduced and the amount of the loss is recognised in the consolidated income statement. If a loan or held-to-maturity investment has a variable interest rate, the discount rate for measuring any impairment loss is the current effective interest rate determined under the contract. If, in a subsequent period, the amount of the impairment loss decreases and the decrease can be related objectively to an event occurring after the impairment was recognised (such as an improvement in the debtor’s credit rating), the reversal of the previously recognised impairment loss is recognised in the consolidated income statement. Impairment testing of trade receivables is described in note 1(k).
(n) Derivatives and hedging activities
Derivatives are initially recognised at fair value on the date a derivative contract is entered into and are subsequently remeasured to their fair value at each reporting date. The accounting for subsequent changes in fair value depends on whether the derivative is designated as a hedging instrument, and if so, the nature of the item being hedged. The Group designates certain derivatives as either:
– hedges of a particular risk associated with the cash flows of recognised assets and liabilities and highly probable forecast transactions (cash flow hedges), or
– hedges of a net investment in a foreign operation (net investment hedges). The Group documents at the inception of the transaction the relationship between hedging instruments and hedged items, as well as its risk management objective and strategy for undertaking various hedge transactions. The Group also documents its assessment, both at hedge inception and on an ongoing basis, of whether the derivatives that are used in hedging transactions have been and will continue to be highly effective in offsetting changes in fair values or cash flows of hedged items.
The fair values of various derivative financial instruments used for hedging purposes are disclosed in note 29. Movements in the hedging reserve in shareholders' equity are shown in note 27(b). The full fair value of a hedging derivative is classified as a non-current asset or liability when the remaining maturity of the hedged item is more than 12 months and it is classified as a current asset or liability when the remaining maturity of the hedged item is less than 12 months. Trading derivatives are classified as a current asset or liability. (i) Cash flow hedge
The effective portion of changes in the fair value of derivatives that are designated and qualify as cash flow hedges is recognised in other comprehensive income and accumulated in reserves in equity. The gain or loss relating to the ineffective portion is recognised immediately in the income statement within other income or other expenses.
For
per
sona
l use
onl
y

Notes to the consolidated financial statements 30 J une 2011 : :
Billabong International Limited 2010-11 Full Financial Report Page 65
Note 1. Summary of significant accounting policies (continued) Amounts accumulated in equity are recycled in the income statement in the periods when the hedged item will affect profit or loss (for instance when the forecast sale that is hedged takes place). The gain or loss relating to the effective portion of interest rate swaps hedging variable rate borrowings is recognised in the income statement within ‘finance costs’. However, when the forecast transaction that is hedged results in the recognition of a non-financial asset (for example, inventory) the gains and losses previously deferred in equity are transferred from equity and included in the initial measurement of the cost of the asset. The deferred amounts are ultimately recognised in profit or loss as cost of goods sold in the case of inventory.
When a hedging instrument expires or is sold or terminated, or when a hedge no longer meets the criteria for hedge accounting, any cumulative gain or loss existing in equity at that time remains in equity and is recognised when the forecast transaction is ultimately recognised in the income statement. When a forecast transaction is no longer expected to occur, the cumulative gain or loss that was reported in equity is immediately transferred to the income statement.
(ii) Net investment hedges
Hedges of net investments in foreign operations are accounted for similarly to cash flow hedges. Any gain or loss on the hedging instrument relating to the effective portion of the hedge is recognised in other comprehensive income and accumulated in reserves in equity. The gain or loss relating to the ineffective portion is recognised immediately in the income statement within other income or other expenses. Gains and losses accumulated in equity are included in the income statement when the foreign operation is partially disposed of or sold.
(iii) Derivatives that do not qualify for hedge accounting
Certain derivative instruments do not qualify for hedge accounting. Changes in the fair value of any derivative instrument that does not qualify for hedge accounting are recognised immediately in the income statement and are included in other income or other expenses.
(o) Property, plant and equipment
Land and buildings are shown at cost. Subsequent costs are included in the asset’s carrying amount or recognised as a separate asset, as appropriate, only when it is probable that future economic benefits associated with the item will flow to the Group and the cost of the item can be measured reliably. All repairs and maintenance are charged to the income statement during the financial period in which they are incurred.
Land is not depreciated. Depreciation on other assets is calculated using the straight-line method to allocate their cost, net of their residual values, over their estimated useful lives, as follows:
– Buildings 20-40 years – Owned and leased plant and equipment 3-20 years – Furniture, fittings and equipment 3-20 years
The assets’ residual values and useful lives are reviewed, and adjusted if appropriate, at each balance sheet date.
An asset’s carrying amount is written down immediately to its recoverable amount if the asset’s carrying amount is greater than its estimated recoverable amount (note 1(i)).
Gains and losses on disposals are determined by comparing proceeds an asset’s with carrying amount. These are included in the income statement.
For
per
sona
l use
onl
y

Notes to the consolidated financial statements 30 J une 2011 : :
Billabong International Limited 2010-11 Full Financial Report Page 66
Note 1. Summary of significant accounting policies (continued) (p) Intangible assets
(i) Goodwill Goodwill represents the excess of the consideration transferred, the amount of any non-controlling interest in the acquiree and the acquisition-date fair value of any previous equity interest in the acquiree over the fair value of the Group’s share of the net identifiable assets of the acquired subsidiary at the date of acquisition. Goodwill on acquisitions of subsidiaries is included in intangible assets. Goodwill is not amortised. Instead, goodwill is tested for impairment annually, or more frequently if events or changes in circumstances indicate that it might be impaired, and is carried at cost less accumulated impairment charges. Gains and losses on the disposal of an entity include the carrying amount of goodwill relating to the entity sold. Goodwill is allocated to cash-generating units for the purpose of impairment testing. The allocation is made to those cash-generating units or groups of cash-generating units that are expected to benefit from the business combination in which the goodwill arose.
(ii) Brands
Expenditure incurred in developing or enhancing brands is expensed as incurred. Brands are shown at historical cost. Brands have a limited legal life, however the Group monitors global expiry dates and renews registrations where required. Brands recorded in the financial statements are not currently associated with products which are likely to become commercially or technically obsolete. Accordingly, the Directors are of the view that brands have an indefinite life. Brands are tested annually for impairment and carried at cost less accumulated impairment charges.
(iii) Computer software
Acquired computer software licences are capitalised on the basis of the costs incurred to acquire and bring to use the specific software. These costs are amortised over their estimated contractual lives (three to five years). Costs associated with developing or maintaining computer software programs are expensed as incurred.
(q) Trade and other payables
These amounts represent liabilities for goods and services provided to the consolidated entity prior to the end of the financial year and which are unpaid. The amounts are unsecured and are usually paid within 30 days of recognition. Trade and other payables are presented as current liabilities unless payment is not due within 12 months from the balance sheet date. They are recognised initially at their fair value and subsequently measured at amortised cost using the effective interest method.
(r) Borrowings
Borrowings are initially recognised at fair value, net of transaction costs incurred. Borrowings are subsequently measured at amortised cost. Any difference between the proceeds (net of transaction costs) and the redemption amount is recognised in the income statement over the period of the borrowings using the effective interest method. Fees paid on the establishment of loan facilities, which are not an incremental cost relating to the actual draw-down of the facility, are recognised as prepayments and amortised on a straight-line basis over the term of the facility. Borrowings are removed from the balance sheet when the obligation specified in the contract is discharged, cancelled or expires. The difference between the carrying amount of a financial liability that has been extinguished or transferred to another party and the consideration paid, including any non-cash assets transferred or liabilities assumed, is recognised in other income or other expenses. Borrowings are classified as current liabilities unless the Group has an unconditional right to defer settlement of the liability for at least 12 months after the reporting period.
(s) Borrowing costs
Borrowing costs incurred for the construction of any qualifying asset are capitalised during the period of time that is required to complete and prepare the asset for its intended use or sale. Other borrowing costs are expensed.
For
per
sona
l use
onl
y

Notes to the consolidated financial statements 30 J une 2011 : :
Billabong International Limited 2010-11 Full Financial Report Page 67
Note 1. Summary of significant accounting policies (continued)
(t) Provisions
Provisions, other than for employee entitlements, are recognised when the Group has a present legal or constructive obligation as a result of past events, it is more likely than not that an outflow of resources will be required to settle the obligation and the amount can be reliably estimated. Provisions are not recognised for future operating losses. Where there are a number of similar obligations, the likelihood that an outflow will be required in settlement is determined by considering the class of obligations as a whole. A provision is recognised even if the likelihood of an outflow with respect to any one item included in the same class of obligations may be small. Provisions are measured at the present value of management’s best estimate of the expenditure required to settle the present obligation at the balance sheet date. The discount rate used to determine the present value is a pre-tax rate that reflects current market assessments of the time value of money and the risks specific to the liability. The increase in the provision due to the passage of time is recognised as interest expense.
(u) Employee benefits
(i) Short-term obligations Liabilities for wages and salaries, including non-monetary benefits, annual leave and accumulating sick
leave expected to be settled within 12 months after the end of the period in which the employees render the related service are recognised in respect of employees’ services up to the end of the reporting period and are measured at the amounts expected to be paid when the liabilities are settled. The liability for annual leave and accumulating sick leave is recognised in the provision for employee benefits. All other short-term employee benefit obligations are presented as other payables.
(ii) Other long-term employee benefit obligations
The liability for long service leave and annual leave which is not expected to be settled within 12 months after the end of the period in which the employees render the related service is recognised in the provision for employee benefits and measured as the present value of expected future payments to be made in respect of services provided by employees up to the reporting period using the projected unit credit method. Consideration is given to expected future wage and salary levels, experience of employee departures and periods of service. Expected future payments are discounted using market yields at the end of the reporting period on national government bonds with terms to maturity and currency that match, as closely as possible, the estimated future cash outflows.
(iii) Termination benefits
Termination benefits are payable when employment is terminated before the normal retirement date, or whenever an employee accepts voluntary redundancy in exchange for these benefits. The Group recognises termination benefits when it is demonstrably committed to either terminating the employment of current employees according to a detailed formal plan without possibility of withdrawal, or providing termination benefits as a result of an offer made to encourage voluntary redundancy. Benefits falling due more than 12 months after balance sheet date are discounted to present value.
(iv) Profit-sharing and bonus plans The Group recognises a liability and an expense for bonuses and profit-sharing, based on a formula that
takes into consideration the profit attributable to the Company’s shareholders after certain adjustments. The Group recognises a provision where contractually obliged or where there is a past practice that has created a constructive obligation.
(v) Contributed equity
Ordinary shares are classified as equity.
Incremental costs directly attributable to the issue of new shares or options are shown in equity as a deduction, net of tax, from the proceeds. Incremental costs directly attributable to the issue of new shares or options for the acquisition of a business, are not included in the cost of the acquisition as part of the purchase consideration.
For
per
sona
l use
onl
y
Notes to the consolidated financial statements 30 J une 2011 : :
Billabong International Limited 2010-11 Full Financial Report Page 68
Note 1. Summary of significant accounting policies (continued) (w) Dividends
Provision is made for the amount of any dividend declared, being appropriately authorised and no longer at the discretion of the entity, on or before the end of the financial year but not distributed at balance date.
(x) Earnings per share
(i) Basic earnings per share
Basic earnings per share is calculated by dividing the profit attributable to equity holders of the Company, excluding any costs of servicing equity other than ordinary shares, by the weighted average number of ordinary shares outstanding during the year, adjusted for bonus elements in ordinary shares issued during the year and excluding treasury shares.
(ii) Diluted earnings per share Diluted earnings per share adjusts the figures used in the determination of basic earnings per share to take into account the after income tax effect of interest and other financing costs associated with dilutive potential ordinary shares and the weighted average number of shares assumed to have been issued for no consideration in relation to dilutive potential ordinary shares.
(y) Employee and executive share plans
Equity-based compensation benefits are provided to employees via the Billabong Executive Performance Share Plan and the Executive Performance and Retention Plan. Billabong Executive Performance Share Plan Share-based compensation benefits are provided to the executive team via the Billabong Executive Performance Share Plan. Information relating to this Plan is set out in note 42. The market value of shares issued to employees for no cash consideration under the employee share scheme is recognised as an employee benefit expense with a corresponding increase in equity when the employees become entitled to the shares. The fair value of equity instruments granted under the Billabong Executive Performance Share Plan is recognised as an employee benefit expense over the period during which the employees become unconditionally entitled to the instruments. There is a corresponding increase in equity, being recognition of an option reserve. Once the employees become unconditionally entitled to the instruments the option reserve is set-off against the treasury shares vested. The fair value of equity instruments granted is measured at grant date and is determined by reference to the Billabong International Limited share price at grant date, taking into account the terms and conditions upon which the rights were granted.
To facilitate the operation of the Billabong Executive Performance Share Plan third party trustees are used to administer the trusts which hold shares allocated under the Plan. CPU Share Plans Pty Ltd and CRS Nominees Ltd are third party trustees for the Billabong Executive Performance Share Plan – Australia trust (for Australian employees) and the Billabong Executive Performance Share Plan trust (for non-Australian employees) respectively. As the trusts were established by the Company for the benefit of the consolidated entity, through the provision of a component of the consolidated entities executive remuneration, the trusts are consolidated in the consolidated entity.
Current equity based instruments granted under the Billabong Executive Performance Share Plan include performance shares and conditional rights. Both performance shares and conditional rights are subject to performance hurdles. Through contributions to the trusts the consolidated entity purchases shares of the Company on market to underpin performance shares and conditional rights issued. The shares are recognised in the balance sheet as treasury shares. Treasury shares are excluded from the weighted average number of shares used as the denominator for determining basic earnings per share and net tangible asset backing per share. The performance shares and conditional rights of the Billabong Executive Performance Share Plan are treated as potential ordinary shares for the purposes of diluted earnings per share. The Group incurs expenses on behalf of the trusts. These expenses are in relation to administration costs of the trusts and are recorded in the income statement as incurred.
For
per
sona
l use
onl
y
Notes to the consolidated financial statements 30 J une 2011 : :
Billabong International Limited 2010-11 Full Financial Report Page 69
Note 1. Summary of significant accounting policies (continued) Billabong Executive Performance and Retention Plan Share-based compensation benefits are also provided to the executive team via the Billabong Executive Performance and Retention Plan. Information relating to this Plan is set out in note 42. The fair value of the options granted under the Billabong Executive Performance and Retention Plan is recognised as an employee benefit expense with a corresponding increase in equity. The fair value is measured at grant date and recognised over the period during which the executive team becomes unconditionally entitled to the options. The fair value at grant date is independently determined using the Monte-Carlo simulation valuation technique that takes into account the exercise price, the term of the option, the share price at grant date and expected price volatility of the underlying share, the expected dividend yield and the risk free interest rate for the term of the option. The fair value of the options granted is adjusted to reflect market vesting conditions, but excludes the impact of any non-market vesting conditions (for example, profitability and sales growth targets). Non-market vesting conditions are included in assumptions about the number of options that are expected to become exercisable. At each reporting date, the entity revises its estimate of the number of options that are expected to become exercisable. The employee benefit expense recognised each period takes into account the most recent estimate. The impact of the revision to original estimates, if any, is recognised in the income statement with a corresponding adjustment to equity.
(z) Financial guarantee contracts Financial guarantee contracts are recognised as a financial liability at the time the guarantee is issued. The liability is initially measured at fair value and subsequently at the higher of the amount determined in accordance with AASB 137 Provisions, Contingent Liabilities and Contingent Assets and the amount initially recognised less cumulative amortisation, where appropriate. The fair value of financial guarantees is determined as the present value of the difference in net cash flows between the contractual payments under the debt instrument and the payments that would be required without the guarantee, or the estimated amount that would be payable to a third party for assuming the obligations. Where guarantees in relation to loans or other payables of subsidiaries or associates are provided for no compensation, the fair values are accounted for as contributions and recognised as part of the cost of the investment.
(aa) Parent entity financial information
The financial information for the parent entity, Billabong International Limited, disclosed in note 43 has been prepared on the same basis as the consolidated financial report, except as set out below. Investments in subsidiaries Investments in subsidiaries are accounted for at cost in the financial report of Billabong International Limited. Dividends received from subsidiaries are recognised in the parent entity’s income statement rather than being deducted from the carrying amount of these investments.
Tax consolidation legislation Billabong International Limited and its wholly-owned Australian controlled entities have implemented the tax consolidation legislation as of 1 July 2002. The head entity, Billabong International Limited, and the controlled entities in the tax consolidated group continue to account for their own current and deferred tax amounts. These tax amounts are measured as if each entity in the tax consolidated group continues to be a stand alone taxpayer in its own right. In addition to its own current and deferred tax amounts, Billabong International Limited also recognises the current tax liabilities (or assets) and the deferred tax assets arising from unused tax losses and unused tax credits assumed from controlled entities in the tax consolidated group.
For
per
sona
l use
onl
y

Notes to the consolidated financial statements 30 J une 2011 : :
Billabong International Limited 2010-11 Full Financial Report Page 70
Note 1. Summary of significant accounting policies (continued) The entities have also entered into a tax funding agreement under which the wholly-owned entities fully compensate Billabong International Limited for any current tax payable assumed and are compensated by Billabong International Limited for any current tax receivable and deferred tax assets relating to unused tax losses or unused tax credits that are transferred to Billabong International Limited under the tax consolidation legislation. The funding amounts are determined by reference to the amounts recognised in the wholly-owned entities’ financial statements. The amounts receivable/payable under the tax funding agreement are due upon receipt of the funding advice from the head entity, which is issued as soon as practicable after the end of each financial year. The head entity may also require payment of interim funding amounts to assist with its obligations to pay tax instalments. Assets or liabilities arising under tax funding agreements with the tax consolidated entities are recognised as current amounts receivable from or payable to other entities in the group. Any difference between the amounts assumed and amounts receivable or payable under the tax funding agreement are recognised as a contribution to (or distribution from) wholly-owned tax consolidated entities. Financial guarantees Where the parent entity has provided financial guarantees in relation to loans and payables of subsidiaries for no compensation, the fair values of these guarantees are accounted for as contributions and recognised as part of the cost of the investment.
(bb) Goods and Services Tax (GST)
Revenues, expenses and assets are recognised net of the amount of associated GST, unless the GST incurred is not recoverable from the taxation authority. In this case it is recognised as part of the cost of acquisition of the asset or as part of the expense.
Receivables and payables are stated inclusive of the amount of GST receivable or payable. The net amount of GST recoverable from, or payable to, the taxation authority is included with other receivables or payables in the balance sheet. Cash flows are presented on a gross basis. The GST components of cash flows arising from investing or financing activities which are recoverable from, or payable to the taxation authority, are presented as operating cash flow.
(cc) Rounding of amounts
The Company is of a kind referred to in Class order 98/0100, issued by the Australian Securities and Investments Commission, relating to the “rounding off” of amounts in the financial report. Amounts in the financial report have been rounded off in accordance with that Class Order to the nearest thousand dollars.
(dd) New accounting standards and interpretations
Certain new accounting standards and interpretations have been published that are not mandatory for 30 June 2011 reporting periods. The Group’s assessment of the impact of these new standards and interpretations is set out below:
(i) AASB 9 Financial Instruments, AASB 2009-11 Amendments to Australian Accounting Standards arising
from AASB 9 and AASB 2010-7 Amendments to Australian Accounting Standards arising from AASB 9 (December 2010) (effective for annual reporting periods beginning on or after 1 January 2013) AASB 9 Financial Instruments addresses the classification, measurement and derecognition of financial assets and financial liabilities. The standard is not applicable until 1 January 2013 but is available for early adoption. The Group is still to assess its full impact. The Group has not yet decided when to adopt AASB 9.
(ii) IFRS 13 Fair value measurement (effective 1 January 2013) IFRS 13 was released in May 2011. The AASB is expected to issue an equivalent Australian standard shortly. IFRS 13 explains how to measure fair value and aims to enhance fair value disclosures. The Group does not use fair value measurements extensively. It is therefore unlikely that the new rules will have a significant impact on any of the amounts recognised in the financial statements. However, application of the new standard will impact the type of information disclosed in the notes to the financial statements. The Group does not intend to adopt the new standard before its operative date, which means that it would be first applied in the annual reporting period ending 30 June 2014.
For
per
sona
l use
onl
y

Notes to the consolidated financial statements 30 J une 2011 : :
Billabong International Limited 2010-11 Full Financial Report Page 71
Note 1. Summary of significant accounting policies (continued) (iii) AASB 2010-4 Further amendments to Australian Accounting Standards arising from the annual
improvements project (effective from 1 January 2011) In June 2010 the AASB issued a number of amendments to Australian Accounting Standards as a result of the IASB's annual improvements project. The amendments will generally apply to financial reporting periods commencing on or after 1 January 2011. The Group will apply the revised standards from the relevant application dates.
For
per
sona
l use
onl
y

Notes to the consolidated financial statements 30 J une 2011 : :
Billabong International Limited 2010-11 Full Financial Report Page 72
Note 2. Financial risk management The Group’s activities expose it to a variety of financial risks; market risk (including foreign exchange risk and cash flow interest rate risk), credit risk and liquidity risk. The Group’s overall risk management program focuses on the unpredictability of financial markets and seeks to minimise potential adverse effects on the financial performance of the Group. The Group uses derivative financial instruments such as foreign exchange contracts and interest rate swaps to hedge certain risk exposures. Derivatives are used exclusively for hedging purposes and not for trading or speculative purposes. (a) Market risk (i) Foreign exchange risk The Group operates internationally and is exposed to foreign exchange risk arising from various currency exposures, primarily with respect to United States Dollars. Foreign currency transaction risk arises when assets and liabilities, and forecasted purchases and sales are denominated in a currency other than the functional currency of the respective entities. As sales are mainly denominated in the respective local currency which is the functional currency, the major transactional exposure is in relation to inventory purchases, other than for the United States of America, which are typically denominated in United States Dollars. The risk is measured using sensitivity analysis and cash flow forecasting. Forward contracts are used to manage foreign exchange risk. The Group’s Risk Management Policy is for each region to hedge greater than 80% of forecast foreign denominated inventory purchases for the upcoming season. Further hedges can be executed following receipt of customer orders. All hedges of projected purchases qualify as “highly probable” forecast transactions for hedge accounting purposes. The Group has, as outlined in note 29, forward exchange contracts designated as cash flow hedges. The carrying amounts of the Group’s financial assets and liabilities that are denominated in Australian Dollars and significant foreign currency (figures in Australian Dollars), are set out below:
Notes 2011 $’000
2010 $’000
Australian Dollars Cash and cash equivalents 9 23,243 25,887 Trade and other receivables 10, 13 51,178 49,530 Borrowings 19, 22 (104,777) (11,915) Trade and other payables 18 (35,515) (21,590) (65,871) 41,912 United States Dollars Cash and cash equivalents 9 82,308 132,709 Trade and other receivables 10, 13 122,467 147,013 Borrowings 19, 22 (423,897) (379,505) Trade and other payables 18 (202,187) (210,807) (421,309) (310,590) European Euros Cash and cash equivalents 9 10,280 11,827 Trade and other receivables 10, 13 93,803 97,357 Borrowings 19, 22 (31,524) (13,941) Trade and other payables 18 (52,711) (49,921) 19,848 45,322 Other Cash and cash equivalents 9 29,027 38,319 Trade and other receivables 10, 13 121,033 121,650 Borrowings 19, 22 (52,967) (20,097) Trade and other payables 18 (53,621) (33,227) 43,472 106,645
For
per
sona
l use
onl
y
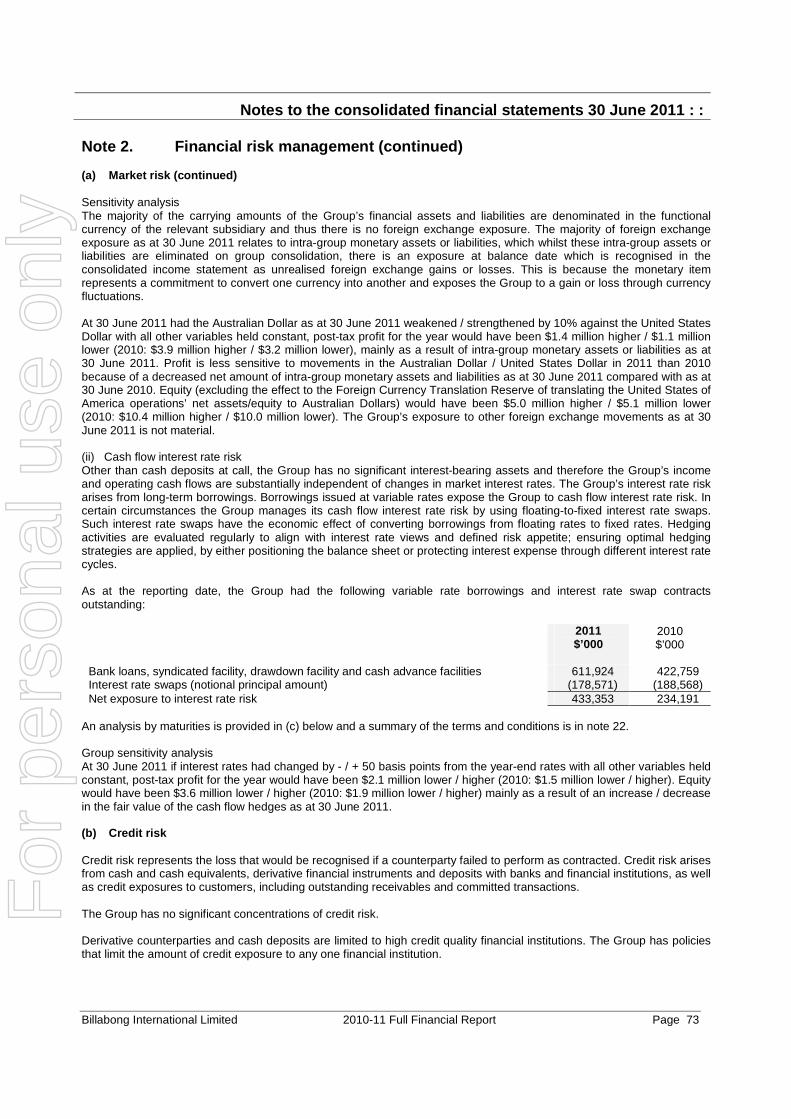
Notes to the consolidated financial statements 30 J une 2011 : :
Billabong International Limited 2010-11 Full Financial Report Page 73
Note 2. Financial risk management (continued) (a) Market risk (continued) Sensitivity analysis The majority of the carrying amounts of the Group’s financial assets and liabilities are denominated in the functional currency of the relevant subsidiary and thus there is no foreign exchange exposure. The majority of foreign exchange exposure as at 30 June 2011 relates to intra-group monetary assets or liabilities, which whilst these intra-group assets or liabilities are eliminated on group consolidation, there is an exposure at balance date which is recognised in the consolidated income statement as unrealised foreign exchange gains or losses. This is because the monetary item represents a commitment to convert one currency into another and exposes the Group to a gain or loss through currency fluctuations. At 30 June 2011 had the Australian Dollar as at 30 June 2011 weakened / strengthened by 10% against the United States Dollar with all other variables held constant, post-tax profit for the year would have been $1.4 million higher / $1.1 million lower (2010: $3.9 million higher / $3.2 million lower), mainly as a result of intra-group monetary assets or liabilities as at 30 June 2011. Profit is less sensitive to movements in the Australian Dollar / United States Dollar in 2011 than 2010 because of a decreased net amount of intra-group monetary assets and liabilities as at 30 June 2011 compared with as at 30 June 2010. Equity (excluding the effect to the Foreign Currency Translation Reserve of translating the United States of America operations’ net assets/equity to Australian Dollars) would have been $5.0 million higher / $5.1 million lower (2010: $10.4 million higher / $10.0 million lower). The Group’s exposure to other foreign exchange movements as at 30 June 2011 is not material. (ii) Cash flow interest rate risk Other than cash deposits at call, the Group has no significant interest-bearing assets and therefore the Group’s income and operating cash flows are substantially independent of changes in market interest rates. The Group’s interest rate risk arises from long-term borrowings. Borrowings issued at variable rates expose the Group to cash flow interest rate risk. In certain circumstances the Group manages its cash flow interest rate risk by using floating-to-fixed interest rate swaps. Such interest rate swaps have the economic effect of converting borrowings from floating rates to fixed rates. Hedging activities are evaluated regularly to align with interest rate views and defined risk appetite; ensuring optimal hedging strategies are applied, by either positioning the balance sheet or protecting interest expense through different interest rate cycles. As at the reporting date, the Group had the following variable rate borrowings and interest rate swap contracts outstanding:
2011 $’000
2010 $’000
Bank loans, syndicated facility, drawdown facility and cash advance facilities 611,924 422,759 Interest rate swaps (notional principal amount) (178,571) (188,568) Net exposure to interest rate risk 433,353 234,191
An analysis by maturities is provided in (c) below and a summary of the terms and conditions is in note 22. Group sensitivity analysis At 30 June 2011 if interest rates had changed by - / + 50 basis points from the year-end rates with all other variables held constant, post-tax profit for the year would have been $2.1 million lower / higher (2010: $1.5 million lower / higher). Equity would have been $3.6 million lower / higher (2010: $1.9 million lower / higher) mainly as a result of an increase / decrease in the fair value of the cash flow hedges as at 30 June 2011. (b) Credit risk
Credit risk represents the loss that would be recognised if a counterparty failed to perform as contracted. Credit risk arises from cash and cash equivalents, derivative financial instruments and deposits with banks and financial institutions, as well as credit exposures to customers, including outstanding receivables and committed transactions. The Group has no significant concentrations of credit risk. Derivative counterparties and cash deposits are limited to high credit quality financial institutions. The Group has policies that limit the amount of credit exposure to any one financial institution.
For
per
sona
l use
onl
y

Notes to the consolidated financial statements 30 J une 2011 : :
Billabong International Limited 2010-11 Full Financial Report Page 74
Note 2. Financial risk management (continued) (b) Credit risk (continued) It is the Group’s policy that all customers who wish to trade on credit terms are subject to credit verification procedures including an assessment of their financial position, past experience and other factors. Credit limits are set for each individual customer in accordance with parameters set by the Board. These credit limits are regularly monitored. In addition, receivable balances are monitored on an ongoing basis with the result that the Group’s exposure to bad debts is not significant. Sales to retail customers are settled in cash or using major credit cards, mitigating credit risk. Credit risk further arises in relation to financial guarantees given to certain parties. Such guarantees are only provided in exceptional circumstances and are subject to specific Board approval. The credit quality of financial assets that are neither past due nor impaired can be assessed by reference to external credit ratings (if available) or to historical information about counterparty default rates. The vast majority of cash at bank and short-term bank deposits are held with banks with at least a credit rating of ‘A’. Derivative counterparties have a credit rating of at least ‘A’. The vast majority of trade receivables are with existing customers (who have been customers for at least six months) with no defaults in the past (for further information about impaired trade receivables and past due but not impaired receivables refer to note 10). (c) Liquidity risk
Due to the financial liabilities within the Group, the Group is exposed to liquidity risk, being the risk of encountering difficulties in meeting such obligations. Prudent liquidity risk management implies maintaining sufficient cash and marketable securities, the availability of funding through an adequate amount of committed credit facilities and the ability to closeout market positions. At the end of the reporting period the Group held deposits at call of $3.2 million (2010: $2.4 million). Due to the dynamic nature of the underlying businesses, the Group aims at maintaining flexibility in funding by keeping committed credit lines available. Refer to note 22(d) for information in regards to the Group’s financing arrangements. Refer to note 26(g) for information in regards to the Group’s capital management strategy. Management monitors rolling forecasts of the Group’s liquidity reserve (comprising the undrawn borrowing facilities) and cash and cash equivalents (note 9) on the basis of expected cash flows. This is generally carried out at a local level in the operating companies of the Group in accordance with practice and limits set by the Group. These limits vary by location to take into account the liquidity of the market in which the entity operates. In addition, the Group’s liquidity management policy involves monitoring balance sheet liquidity ratios against internal and external regulatory requirements and maintaining debt financing plans. The table below analyses the Group’s financial liabilities, net and gross settled derivative financial instruments into relevant maturity groupings based on the remaining period at the reporting date to the contractual maturity date. The amounts disclosed in the table are the contractual undiscounted cash flows. For net settled and gross settled derivatives the cash flows have been estimated using spot interest rates applicable at the reporting date.
For
per
sona
l use
onl
y

Notes to the consolidated financial statements 30 J une 2011 : :
Billabong International Limited 2010-11 Full Financial Report Page 75
Note 2. Financial risk management (continued) (c) Liquidity risk (continued)
2011 Less than 6 months
$’000
Between 6 and 12 months
$’000
Between 1 and 2 years
$’000
Between 2 and 5 years
$’000
Over 5 years
$’000
Total contractual cash flows
$’000
Carrying amount
(assets) / liabilities
$’000 Non-interest bearing trade and other payables
340,671
---
---
---
---
340,671
340,671
Fixed rate debt 667 600 16 --- --- 1,283 1,241 Variable rate debt 26,147 13,124 25,067 615,250 --- 679,588 611,924 Net settled derivatives (interest rate swaps)
703
1,046
2,093
2,249
---
6,091
2,371
Net variable rate liabilities 26,850 14,170 27,160 617,499 --- 685,679 614,295 Less: Cash (i) (144,858) --- --- --- --- (144,858) (144,858) Net variable rate liquidity position
(118,008)
14,170
27,160
617,499
---
540,821
469,437
Gross settled derivatives (forward exchange contracts)
- (inflow) (90,967) (28,417) --- --- --- (119,384) --- - outflow 93,621 29,269 --- --- --- 122,890 2,812 2,654 852 --- --- --- 3,506 2,812
Syndicated facility As at 30 June 2010 the Group had an unsecured Syndicated Revolving Multi-Currency Facility with a limit of US$483.5 million (US$266.75 million due for roll-over on or prior to 1 July 2011 and US$216.75 million due for roll-over on or prior to 1 July 2012). On 4 August 2010, the Group renegotiated this unsecured Syndicated Revolving Multi-Currency Facility with an increase in the total facility limit from US$483.5 million to US$790.0 million. Of this US$790.0 million, US$395.0 million is due for roll-over on or prior to 28 July 2013 with the remaining US$395.0 million due for roll-over on or prior to 28 July 2014. These facility limits and roll-over dates remain the same at 30 June 2011. The renegotiation of this facility on 4 August 2010 provided the Group with improved tenor and lower borrowing margins compared to those available when the Group rolled over a portion of the facility on 11 August 2009. Drawdown facility At 30 June 2010 the Group had an US$100.0 million unsecured multi-currency drawdown facility which was due for roll-over on or prior to 1 July 2012. On 30 June 2011, the Group renegotiated this US$100.0 million unsecured multi-currency drawdown facility which included an extension to 28 July 2013 of the facility which was previously due for roll-over on or before 1 July 2012. The renegotiation of this facility provides the Group with improved tenor and lower borrowing margins compared to those available when the Group rolled over the facility on 7 September 2009.
For
per
sona
l use
onl
y
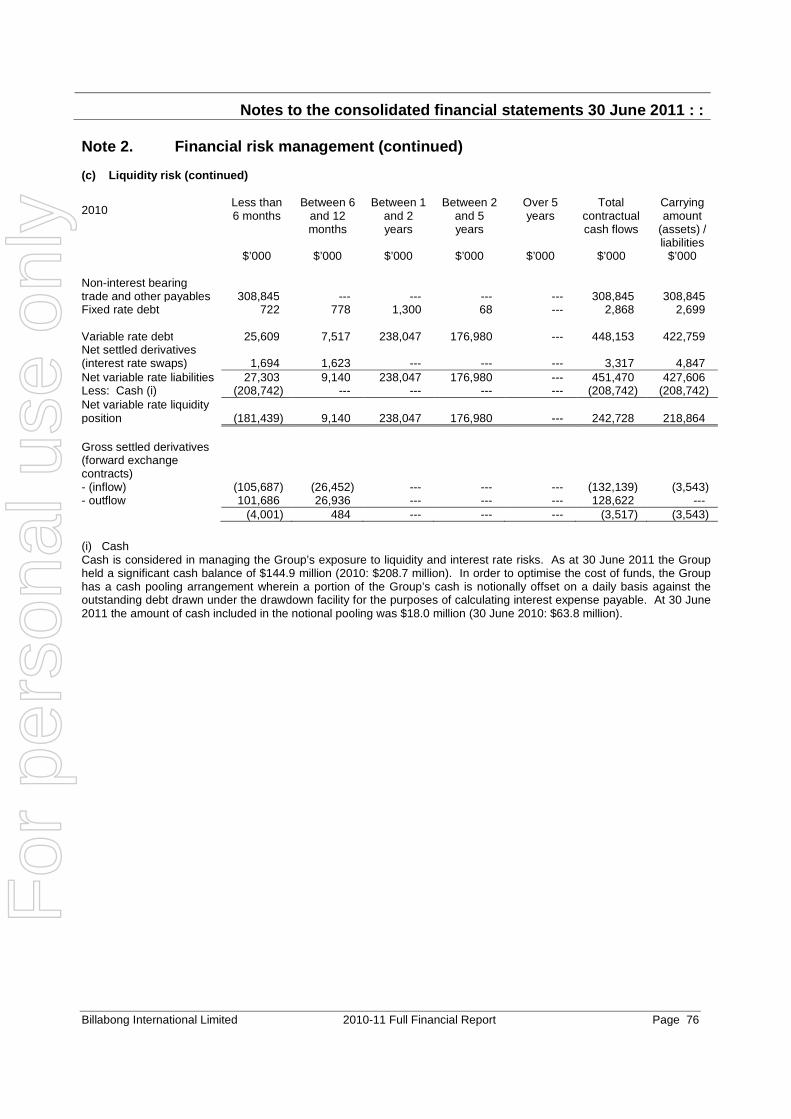
Notes to the consolidated financial statements 30 J une 2011 : :
Billabong International Limited 2010-11 Full Financial Report Page 76
Note 2. Financial risk management (continued) (c) Liquidity risk (continued)
2010 Less than 6 months
$’000
Between 6 and 12 months
$’000
Between 1 and 2 years
$’000
Between 2 and 5 years
$’000
Over 5 years
$’000
Total contractual cash flows
$’000
Carrying amount
(assets) / liabilities
$’000 Non-interest bearing trade and other payables
308,845
---
---
---
---
308,845
308,845
Fixed rate debt 722 778 1,300 68 --- 2,868 2,699 Variable rate debt 25,609 7,517 238,047 176,980 --- 448,153 422,759 Net settled derivatives (interest rate swaps)
1,694
1,623
---
---
---
3,317
4,847
Net variable rate liabilities 27,303 9,140 238,047 176,980 --- 451,470 427,606 Less: Cash (i) (208,742) --- --- --- --- (208,742) (208,742) Net variable rate liquidity position
(181,439)
9,140
238,047
176,980
---
242,728
218,864
Gross settled derivatives (forward exchange contracts)
- (inflow) (105,687) (26,452) --- --- --- (132,139) (3,543) - outflow 101,686 26,936 --- --- --- 128,622 --- (4,001) 484 --- --- --- (3,517) (3,543)
(i) Cash
Cash is considered in managing the Group’s exposure to liquidity and interest rate risks. As at 30 June 2011 the Group held a significant cash balance of $144.9 million (2010: $208.7 million). In order to optimise the cost of funds, the Group has a cash pooling arrangement wherein a portion of the Group’s cash is notionally offset on a daily basis against the outstanding debt drawn under the drawdown facility for the purposes of calculating interest expense payable. At 30 June 2011 the amount of cash included in the notional pooling was $18.0 million (30 June 2010: $63.8 million).
For
per
sona
l use
onl
y

Notes to the consolidated financial statements 30 J une 2011 : :
Billabong International Limited 2010-11 Full Financial Report Page 77
Note 2. Financial risk management (continued) (d) Fair value measurements
The fair value of financial assets and financial liabilities must be estimated for recognition and measurement or for disclosure purposes. AASB 7 Financial Instruments: Disclosures requires disclosure of fair value measurements by level of the following fair value measurement hierarchy:
(a) Quoted prices (unadjusted) in active markets for identical assets or liabilities (level 1), (b) Inputs other than quoted prices included within level 1 that are observable for the asset or liability, either
directly (as prices) or indirectly (derived from prices) (level 2), and (c) Inputs for the asset or liability that are not based on observable market data (unobservable inputs) (level 3).
The following table presents the Group’s assets and liabilities measured and recognised at fair value at 30 June 2011 and 30 June 2010.
At 30 June 2011 Level 1 $’000
Level 2 $’000
Level 3 $’000
Total $’000
Assets Forward exchange contracts – cash flow hedges --- 551 --- 551 Total assets --- 551 --- 551 Liabilities Forward exchange contracts – cash flow hedges --- 3,363 --- 3,363 Interest rate swap contracts – cash flow hedges --- 2,371 --- 2,371 Total liabilities --- 5,734 --- 5,734
At 30 June 2010 Level 1 $’000
Level 2 $’000
Level 3 $’000
Total $’000
Assets Forward exchange contracts – cash flow hedges --- 5,396 --- 5,396 Total assets --- 5,396 --- 5,396 Liabilities Forward exchange contracts – cash flow hedges --- 1,853 --- 1,853 Interest rate swap contracts – cash flow hedges --- 4,847 --- 4,847 Total liabilities --- 6,700 --- 6,700 The fair value of financial instruments traded in active markets (such as publicly traded derivatives, and trading and available-for-sale securities) is based on quoted market prices at the end of the reporting period. These instruments are included in level 1. The Group does not hold any of these financial instruments at 30 June 2011 or 30 June 2010. The fair value of financial instruments that are not traded in an active market (for example, over-the-counter derivatives) is determined using valuation techniques. The Group uses a variety of methods and makes assumptions that are based on market conditions existing at the end of each reporting period. Quoted market prices or dealer quotes for similar instruments are used to estimate fair value for long-term debt for disclosure purposes. Other techniques, such as estimated discounted cash flows, are used to determine fair value for the remaining financial instruments. The fair value of interest rate swaps is calculated as the present value of the estimated future cash flows. The fair value of forward exchange contracts is determined using forward exchange market rates at the end of the reporting period. These instruments are included in level 2 and comprise derivative financial instruments. In the circumstances where a valuation technique for these instruments is based on significant unobservable inputs, such instruments are included in level 3. The Group does not hold any level 3 financial instruments at 30 June 2011 or 30 June 2010. The carrying value less impairment provision of trade receivables and payables are assumed to approximate their fair values due to their short-term nature. The fair value of borrowings is based upon market prices where a market exists or by discounting the expected future cash flows by the current interest rates that are available to the Group for similar financial instruments. Refer to note 13(b) and 22(f) for further information.
For
per
sona
l use
onl
y
Notes to the consolidated financial statements 30 J une 2011 : :
Billabong International Limited 2010-11 Full Financial Report Page 78
Note 3. Critical accounting estimates and judgement s Estimates and judgements are continually evaluated and are based on historical experience and other factors, including expectations of future events that may have a financial impact on the entity and that are believed to be reasonable under the circumstances. The Group makes estimates and assumptions concerning the future. The resulting accounting estimates will, by definition, seldom equal the related actual results. The estimates and assumptions that have a risk of causing a material adjustment to the carrying amounts of assets and liabilities within the next financial year are discussed below. Estimated impairment of goodwill and indefinite life intangibles The Group tests annually whether goodwill and indefinite life intangibles have suffered any impairment and if any intangibles cease to have an indefinite life, in accordance with the accounting policy stated in note 1(i). The recoverable amounts of cash-generating units (CGU) have been determined based on value-in-use calculations (VIU). These calculations require the use of estimates and judgements, in particular the achievement of forecast growth rates which are determined through a Board approved budgeting process. Assumptions used in impairment testing are detailed in note 15. If the VIU of a CGU is lower than its carrying amount, then the CGU’s fair value less costs to sell (FVLCTS) is determined as AASB 136 requires the recoverable amount of a CGU to be the higher of VIU and FVLCTS. In applying the FVLCTS approach, the recoverable amount of a CGU is assessed using market based valuation techniques such as discounted cash flow analysis, comparable transactions and observable trading multiples. Assumptions used in impairment testing are detailed in note 15. Business combinations and goodwill The Group has made a number of acquisitions during the year. Judgements and estimates are made in respect of the measurement of the provisional and final fair values of assets and liabilities acquired and the considerations transferred. The portion of the purchase price not allocated to assets and liabilities has been attributed to goodwill. Deferred or contingent consideration – acquisitions pre 1 July 2009 In relation to certain acquisitions that have been made by the Group pre 1 July 2009, deferred or contingent consideration may be payable in cash if certain specific conditions are achieved. When the deferred or contingent consideration payable becomes probable and the amount can be reliably measured, the Group brings it to account (refer note 25) and the amount of the contingent liability is disclosed in note 32. Where settlement of any part of cash consideration is deferred, the amounts payable in the future are discounted to their present value as at the date of exchange (refer note 32). The discount rate used is the Group’s risk-free rate. The calculation of the payable for each acquisition requires the use of estimates and judgements which are reviewed at each reporting period. Deferred or contingent consideration – acquisitions post 1 July 2009 In relation to certain acquisitions that have been made by the Group post 1 July 2009, deferred or contingent consideration may be payable in cash if certain specific conditions are achieved. Where settlement of any part of cash consideration is deferred, the amounts payable in the future are discounted to their present value as at the date of exchange (refer note 32). The discount rate used is the Group’s risk-free rate. Amounts classified as a payable are subsequently remeasured to fair value with changes in fair value recognised in the income statement. The calculation of the payable for each acquisition requires the use of estimates and judgements which are reviewed at each reporting period. Taxation The Group is subject to income taxes in Australia and jurisdictions where it has foreign operations. Significant judgement is required in determining the worldwide provision for income taxes. There are certain transactions and calculations undertaken during the ordinary course of business for which the ultimate tax determination is uncertain. The Group estimates its tax liabilities based on the Group's understanding of the tax law. Where the final tax outcome of these matters is different from the amounts that were initially recorded, such differences will impact the current and deferred income tax assets and liabilities in the period in which such determination is made.
For
per
sona
l use
onl
y

Notes to the consolidated financial statements 30 J une 2011 : :
Billabong International Limited 2010-11 Full Financial Report Page 79
Note 4. Segment information (a) Description of segments
Management has determined the operating segments based on the reports reviewed by the CEO. The results of the operating segments are analysed and strategic decisions made as to the future operations of the segment. This review is also used to determine how resources will be allocated across the segments. The CEO considers the business from a geographic perspective and has identified three reportable segments being Australasia, Americas and Europe. The CEO monitors the performance of these geographic segments separately. Each segment’s areas of operation include the wholesaling and retailing of surf, skate and snow apparel and accessories. The geographic segments are organised as below: Australasia This segment includes Australia, New Zealand, Japan, South Africa, Singapore, Malaysia, Indonesia, Thailand, South Korea and Hong Kong. Americas This segment includes the United States of America, Canada, Brazil, Peru and Chile. Europe This segment includes Austria, Belgium, the Czech Republic, England, France, Germany, Italy, Luxembourg, the Netherlands and Spain. Rest of the World This segment relates to royalty receipts from third party operations. Segment Earnings Before Interest, Taxes, Depreciation and Amortisation (EBITDA) excludes inter-company royalties and sourcing fees and includes an allocation of global overhead costs (which include corporate overhead, international advertising and promotion costs, central sourcing costs and foreign exchange movements). The geographical segment assets exclude deferred tax assets and derivative assets.
(b) Segment information provided to the CEO
The segment information provided to the CEO for the reportable segments for the year ended 30 June 2011 is as follows:
2011
Australasia
Americas
Europe Rest of
the World
Total $’000 $’000 $’000 $’000 $’000
Sales to external customers 501,904 843,737 337,627 --- 1,683,268 Third party royalties --- --- --- 2,211 2,211 Total segment revenue 501,904 843,737 337,627 2,211 1,685,479 EBITDA 55,225 80,194 54,246 2,211 191,876 Less: depreciation and amortisation (41,931) Less: net interest expense (23,045) Profit before income tax 126,900 Segment assets 1,938,617 1,115,789 294,948 --- 3,349,354 Elimination (965,903) Unallocated assets: Deferred tax 35,963 Derivative assets 551 Total assets 2,419,965 Acquisitions of property, plant and equipment, intangibles and other non-current segment assets 128,483 230,604 9,628
--- 368,715
For
per
sona
l use
onl
y
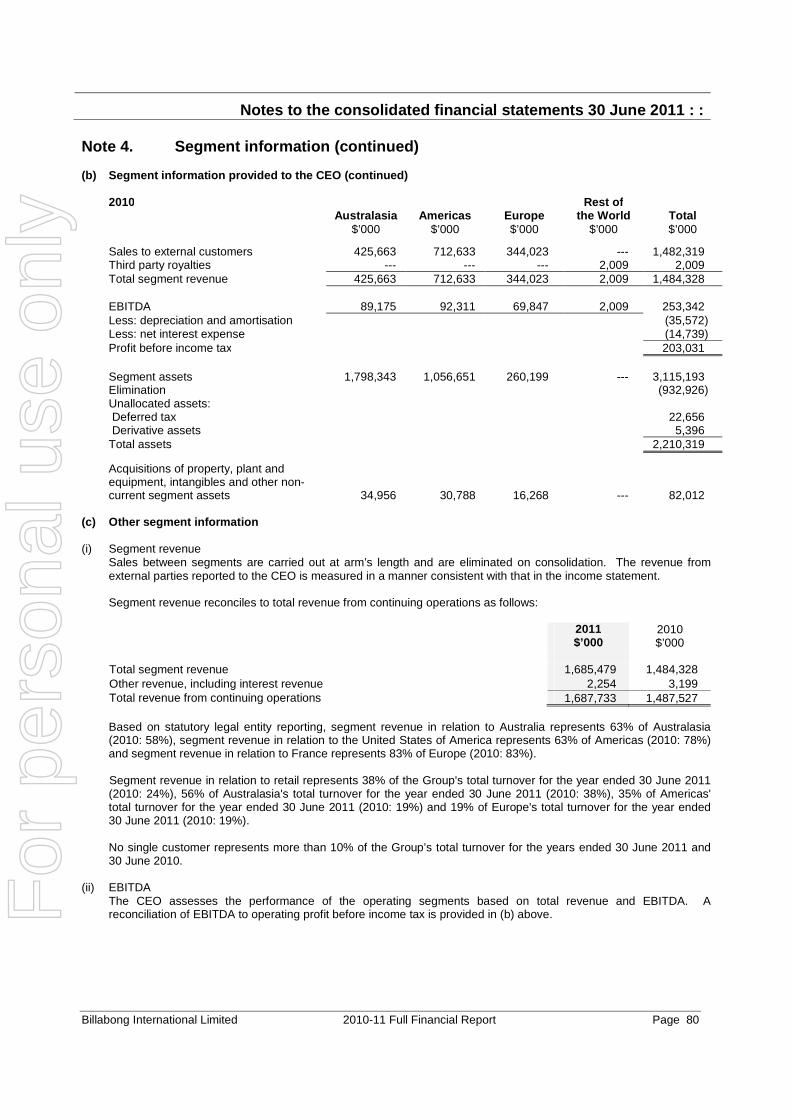
Notes to the consolidated financial statements 30 J une 2011 : :
Billabong International Limited 2010-11 Full Financial Report Page 80
Note 4. Segment information (continued)
(b) Segment information provided to the CEO (contin ued) 2010
Australasia
Americas
Europe Rest of
the World
Total $’000 $’000 $’000 $’000 $’000
Sales to external customers 425,663 712,633 344,023 --- 1,482,319 Third party royalties --- --- --- 2,009 2,009 Total segment revenue 425,663 712,633 344,023 2,009 1,484,328 EBITDA 89,175 92,311 69,847 2,009 253,342 Less: depreciation and amortisation (35,572) Less: net interest expense (14,739) Profit before income tax 203,031 Segment assets 1,798,343 1,056,651 260,199 --- 3,115,193 Elimination (932,926) Unallocated assets: Deferred tax 22,656 Derivative assets 5,396 Total assets 2,210,319
Acquisitions of property, plant and equipment, intangibles and other non-current segment assets 34,956 30,788 16,268 --- 82,012
(c) Other segment information (i) Segment revenue Sales between segments are carried out at arm’s length and are eliminated on consolidation. The revenue from
external parties reported to the CEO is measured in a manner consistent with that in the income statement. Segment revenue reconciles to total revenue from continuing operations as follows: 2011
$’000 2010 $’000
Total segment revenue 1,685,479 1,484,328 Other revenue, including interest revenue 2,254 3,199 Total revenue from continuing operations 1,687,733 1,487,527
Based on statutory legal entity reporting, segment revenue in relation to Australia represents 63% of Australasia
(2010: 58%), segment revenue in relation to the United States of America represents 63% of Americas (2010: 78%) and segment revenue in relation to France represents 83% of Europe (2010: 83%).
Segment revenue in relation to retail represents 38% of the Group's total turnover for the year ended 30 June 2011 (2010: 24%), 56% of Australasia's total turnover for the year ended 30 June 2011 (2010: 38%), 35% of Americas' total turnover for the year ended 30 June 2011 (2010: 19%) and 19% of Europe's total turnover for the year ended 30 June 2011 (2010: 19%).
No single customer represents more than 10% of the Group’s total turnover for the years ended 30 June 2011 and
30 June 2010. (ii) EBITDA The CEO assesses the performance of the operating segments based on total revenue and EBITDA. A
reconciliation of EBITDA to operating profit before income tax is provided in (b) above.
For
per
sona
l use
onl
y

Notes to the consolidated financial statements 30 J une 2011 : :
Billabong International Limited 2010-11 Full Financial Report Page 81
Note 4. Segment information (continued) (c) Other segment information (continued) (iii) Segment assets The amounts provided to the CEO with respect to total assets are measured in a manner consistent with that of the
financial statements. These assets are allocated based on the operations of the segment and the physical location of the asset. A reconciliation of the segment assets to the total assets is provided in (b) above.
Segment assets, excluding deferred tax assets and derivative assets, in relation to Australia represents 89% of
Australasia (2010: 88%), segment assets, excluding deferred tax assets and derivative assets, in relation to the United States of America represents 77% of Americas (2010: 87%) and segment assets, excluding deferred tax assets and derivative assets, in relation to France represents 88% of Europe (2010: 89%).
Note 5. Revenue 2011
$’000 2010 $’000
From continuing operations Sales revenue Sale of goods 1,683,268 1,482,319 Royalties 2,211 2,009
1,685,479 1,484,328 Other revenue
Interest 1,717 2,488 Other 537 711 2,254 3,199 Total revenue from continuing operations 1,687,733 1,487,527 Note 6. Other income 2011
$’000 2010 $’000
Foreign exchange gains --- 6,183 Gain from adjustment to contingent consideration 1,011 --- Fair value adjustment to derivative liabilities 1,521 --- Other 2,606 878 5,138 7,061
For
per
sona
l use
onl
y
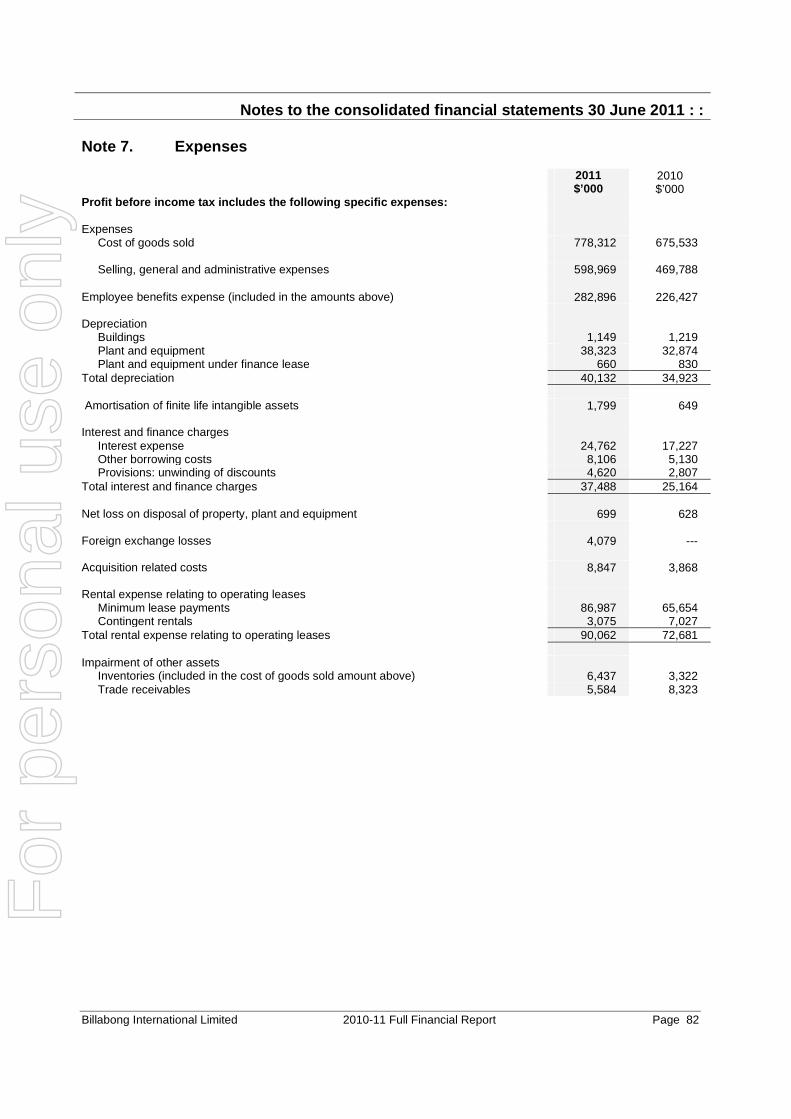
Notes to the consolidated financial statements 30 J une 2011 : :
Billabong International Limited 2010-11 Full Financial Report Page 82
Note 7. Expenses 2011
$’000 2010 $’000
Profit before income tax includes the following spe cific expenses: Expenses Cost of goods sold 778,312 675,533 Selling, general and administrative expenses 598,969 469,788 Employee benefits expense (included in the amounts above) 282,896 226,427 Depreciation Buildings 1,149 1,219 Plant and equipment 38,323 32,874 Plant and equipment under finance lease 660 830 Total depreciation 40,132 34,923 Amortisation of finite life intangible assets 1,799 649 Interest and finance charges Interest expense 24,762 17,227 Other borrowing costs 8,106 5,130 Provisions: unwinding of discounts 4,620 2,807 Total interest and finance charges 37,488 25,164 Net loss on disposal of property, plant and equipment 699 628 Foreign exchange losses 4,079 --- Acquisition related costs 8,847 3,868 Rental expense relating to operating leases Minimum lease payments 86,987 65,654 Contingent rentals 3,075 7,027 Total rental expense relating to operating leases 90,062 72,681 Impairment of other assets Inventories (included in the cost of goods sold amount above) 6,437 3,322 Trade receivables 5,584 8,323
For
per
sona
l use
onl
y

Notes to the consolidated financial statements 30 J une 2011 : :
Billabong International Limited 2010-11 Full Financial Report Page 83
Note 8. Income tax expense 2011
$’000 2010 $’000
(a) Income tax expense Current tax 23,168 65,148 Deferred tax (12,240) (8,510) Adjustments for current tax of prior periods (2,073) 1,227 8,855 57,865 Deferred income tax revenue included in income tax expense comprises: Increase in deferred tax assets (note 16) (18,706) (9,103) Increase in deferred tax liabilities (note 23) 6,466 593 (12,240) (8,510) (b) Numerical reconciliation of inc ome tax expense to prima facie tax
payable
Profit from continuing operations before income tax expense 126,900 203,031 Tax at the Australian tax rate of 30% (2010: 30%) 38,070 60,909 Tax effect of amounts which are not deductible/(taxable) in calculating taxable income:
Net exempt income (15,432) (9,681) Sundry items (2,761) 36 Other non-deductible permanent differences 5,018 4,263 24,895 55,527 Difference in overseas tax rates 239 1,111 (Over)/under provision in prior years (2,073) 1,227 Prior year tax losses previously not recognised (4,077) --- Deferred tax on deferred consideration previously not recognised (10,129) --- Income tax expense 8,855 57,865 (c) Tax expense / (income) relating to items of other comprehensive income Cash flow hedges (note 16, note 23) (1,411) 6,215 Investment hedge (note 16, note 23) (3,222) (4,488) (4,633) 1,727 (d) Tax losses Unused tax losses for which no deferred tax asset has been recognised
40,135
17,672
Potential tax benefit @ 30% 12,041 5,302 All unused tax losses were incurred by entities that are not part of the Australian tax consolidated group.
For
per
sona
l use
onl
y
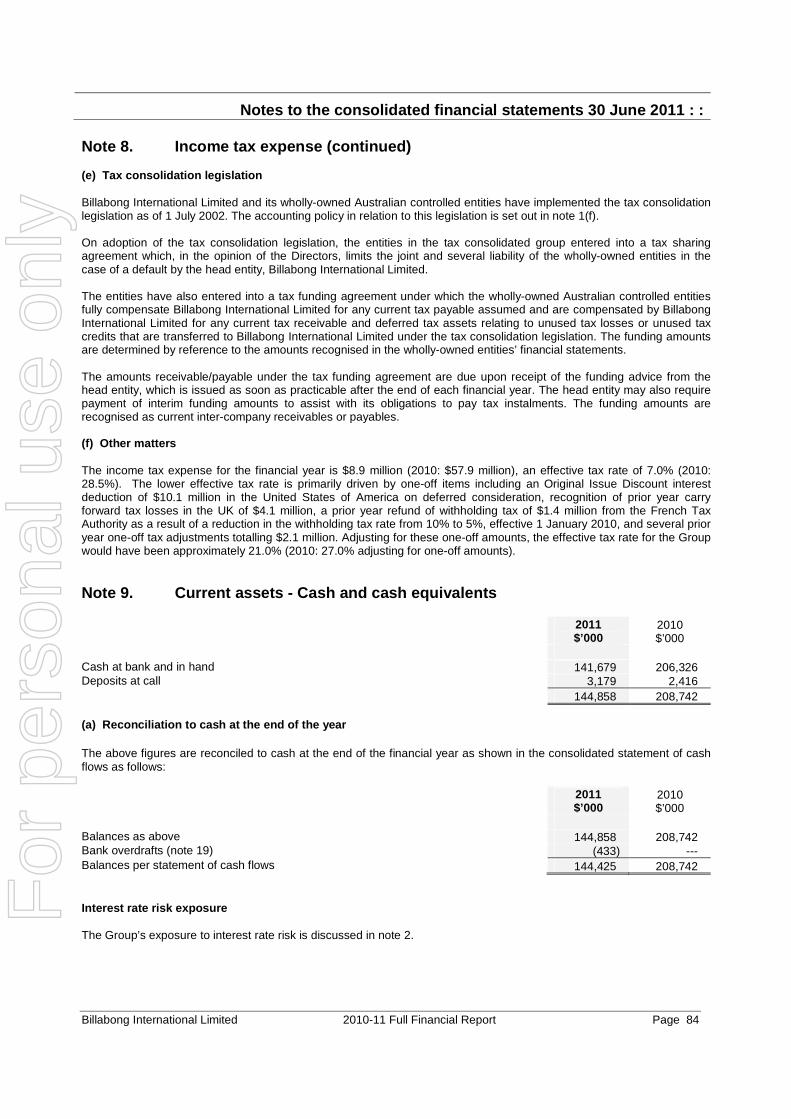
Notes to the consolidated financial statements 30 J une 2011 : :
Billabong International Limited 2010-11 Full Financial Report Page 84
Note 8. Income tax expense (continued) (e) Tax consolidation legislation Billabong International Limited and its wholly-owned Australian controlled entities have implemented the tax consolidation legislation as of 1 July 2002. The accounting policy in relation to this legislation is set out in note 1(f). On adoption of the tax consolidation legislation, the entities in the tax consolidated group entered into a tax sharing agreement which, in the opinion of the Directors, limits the joint and several liability of the wholly-owned entities in the case of a default by the head entity, Billabong International Limited. The entities have also entered into a tax funding agreement under which the wholly-owned Australian controlled entities fully compensate Billabong International Limited for any current tax payable assumed and are compensated by Billabong International Limited for any current tax receivable and deferred tax assets relating to unused tax losses or unused tax credits that are transferred to Billabong International Limited under the tax consolidation legislation. The funding amounts are determined by reference to the amounts recognised in the wholly-owned entities’ financial statements. The amounts receivable/payable under the tax funding agreement are due upon receipt of the funding advice from the head entity, which is issued as soon as practicable after the end of each financial year. The head entity may also require payment of interim funding amounts to assist with its obligations to pay tax instalments. The funding amounts are recognised as current inter-company receivables or payables. (f) Other matters The income tax expense for the financial year is $8.9 million (2010: $57.9 million), an effective tax rate of 7.0% (2010: 28.5%). The lower effective tax rate is primarily driven by one-off items including an Original Issue Discount interest deduction of $10.1 million in the United States of America on deferred consideration, recognition of prior year carry forward tax losses in the UK of $4.1 million, a prior year refund of withholding tax of $1.4 million from the French Tax Authority as a result of a reduction in the withholding tax rate from 10% to 5%, effective 1 January 2010, and several prior year one-off tax adjustments totalling $2.1 million. Adjusting for these one-off amounts, the effective tax rate for the Group would have been approximately 21.0% (2010: 27.0% adjusting for one-off amounts).
Note 9. Current assets - Cash and cash equivalents 2011
$’000 2010 $’000
Cash at bank and in hand 141,679 206,326 Deposits at call 3,179 2,416 144,858 208,742 (a) Reconciliation to cash at the end of the year The above figures are reconciled to cash at the end of the financial year as shown in the consolidated statement of cash flows as follows: 2011
$’000 2010 $’000
Balances as above 144,858 208,742 Bank overdrafts (note 19) (433) --- Balances per statement of cash flows 144,425 208,742 Interest rate risk exposure The Group’s exposure to interest rate risk is discussed in note 2.
For
per
sona
l use
onl
y

Notes to the consolidated financial statements 30 J une 2011 : :
Billabong International Limited 2010-11 Full Financial Report Page 85
Note 10. Current assets – Trade and other receivabl es 2011
$’000 2010 $’000
Trade receivables 361,214 410,549 Provision for impairment of receivables (note (a)) (19,854) (21,521) 341,360 389,028 Other receivables (note (c)) 33,015 9,350 374,375 398,378 (a) Impaired trade receivables As at 30 June 2011 current trade receivables of the Group with a nominal value of $20.8 million (2010: $26.1 million) were impaired. The amount of the provision was $19.9 million (2010: $21.5 million). The individually impaired receivables mainly relate to retailers encountering difficult economic conditions. It was assessed that a portion of the receivables is expected to be recovered. The ageing of these receivables is as follows:
2011 $’000
2010 $’000
Up to 3 months 6,135 9,774 3 to 6 months 912 1,923 Over 6 months 13,705 14,392 20,752 26,089 Movements in the provision for impairment of receivables are as follows:
2011 $’000
2010 $’000
At 1 July 21,521 23,133 Provision for impairment recognised during the year 5,584 8,323 Receivables written off during the year (4,816) (7,898) Exchange differences (2,435) (2,037) At 30 June 19,854 21,521 The creation and release of the provision for impaired receivables has been included in 'other expenses' in the income statement. Amounts charged to the allowance account are generally written off when there is no expectation of recovering additional cash. (b) Past due but not impaired As at 30 June 2011, trade receivables of $67.8 million (2010: $82.8 million) were past due but not impaired. These relate to a number of independent customers for whom there is no recent history of default. The ageing analysis of these trade receivables is as follows:
2011 $’000
2010 $’000
Up to 3 months 35,013 46,239 3 to 6 months 13,208 19,465 Over 6 months 19,558 17,105 67,779 82,809
The other classes within trade and other receivables do not contain impaired assets and are not past due. Based on the credit history of these other classes, it is expected that these amounts will be received when due.
For
per
sona
l use
onl
y
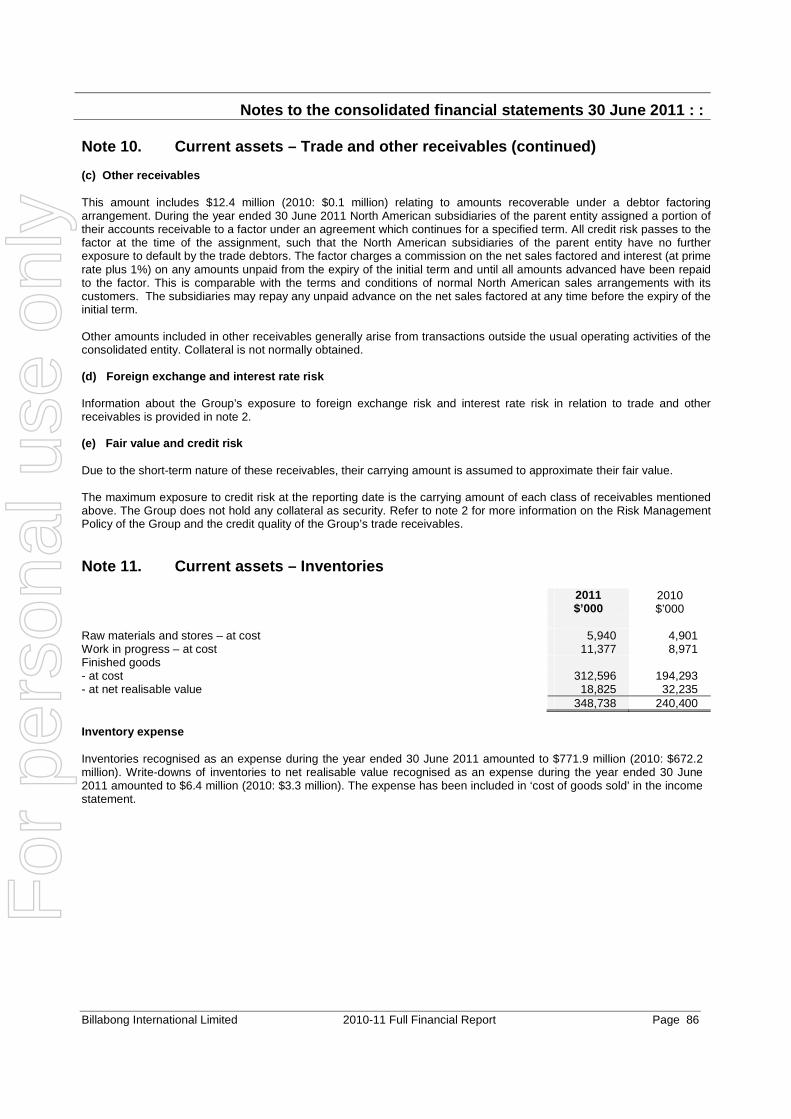
Notes to the consolidated financial statements 30 J une 2011 : :
Billabong International Limited 2010-11 Full Financial Report Page 86
Note 10. Current assets – Trade and other receivabl es (continued) (c) Other receivables This amount includes $12.4 million (2010: $0.1 million) relating to amounts recoverable under a debtor factoring arrangement. During the year ended 30 June 2011 North American subsidiaries of the parent entity assigned a portion of their accounts receivable to a factor under an agreement which continues for a specified term. All credit risk passes to the factor at the time of the assignment, such that the North American subsidiaries of the parent entity have no further exposure to default by the trade debtors. The factor charges a commission on the net sales factored and interest (at prime rate plus 1%) on any amounts unpaid from the expiry of the initial term and until all amounts advanced have been repaid to the factor. This is comparable with the terms and conditions of normal North American sales arrangements with its customers. The subsidiaries may repay any unpaid advance on the net sales factored at any time before the expiry of the initial term. Other amounts included in other receivables generally arise from transactions outside the usual operating activities of the consolidated entity. Collateral is not normally obtained. (d) Foreign exchange and interest rate risk Information about the Group’s exposure to foreign exchange risk and interest rate risk in relation to trade and other receivables is provided in note 2. (e) Fair value and credit risk Due to the short-term nature of these receivables, their carrying amount is assumed to approximate their fair value. The maximum exposure to credit risk at the reporting date is the carrying amount of each class of receivables mentioned above. The Group does not hold any collateral as security. Refer to note 2 for more information on the Risk Management Policy of the Group and the credit quality of the Group’s trade receivables. Note 11. Current assets – Inventories 2011
$’000 2010 $’000
Raw materials and stores – at cost 5,940 4,901 Work in progress – at cost 11,377 8,971 Finished goods - at cost 312,596 194,293 - at net realisable value 18,825 32,235 348,738 240,400 Inventory expense Inventories recognised as an expense during the year ended 30 June 2011 amounted to $771.9 million (2010: $672.2 million). Write-downs of inventories to net realisable value recognised as an expense during the year ended 30 June 2011 amounted to $6.4 million (2010: $3.3 million). The expense has been included in ‘cost of goods sold’ in the income statement.
For
per
sona
l use
onl
y

Notes to the consolidated financial statements 30 J une 2011 : :
Billabong International Limited 2010-11 Full Financial Report Page 87
Note 12. Current assets - Other 2011
$’000 2010 $’000
Prepayments 24,474 22,185 Derivative financial assets (note 29) 551 5,396 25,025 27,581 Risk exposure Information about the Group’s exposure to credit risk, foreign exchange and interest rate risk is provided in note 2.
Note 13. Non-current assets - Receivables 2011
$’000 2010 $’000
Other receivables 14,106 17,172 14,106 17,172 Other receivables predominantly relate to store lease deposits. Non-current assets pledged as security Refer to note 22(c) for information on non-current assets pledged as security by the consolidated entity. (a) Impaired receivables and receivables past due None of the non-current receivables are impaired, however $2.6 million (US$2.7 million) is considered past due but not impaired (2010: $4.8 million or US$4.1 million). (b) Fair values The fair values and carrying values of non-current receivables are as follows: 2011 2010
Carrying amount
Fair value
Carrying amount
Fair value
$’000 $’000 $’000 $’000 Other receivables 14,106 14,106 17,172 17,172 (c) Risk exposure Information about the Group’s exposure to credit risk, foreign exchange and interest rate risk is provided in note 2.
For
per
sona
l use
onl
y

Notes to the consolidated financial statements 30 J une 2011 : :
Billabong International Limited 2010-11 Full Financial Report Page 88
Note 14. Non-current assets – Property, plant and e quipment
Land and buildings
Furniture, fittings and equipment
Leased plant and equipment
Total
$’000 $’000 $’000 $’000 At 30 June 200 9 Cost or fair value 43,821 235,957 11,917 291,695 Accumulated depreciation (2,505) (122,592) (4,782) (129,879) Net book amount 41,316 113,365 7,135 161,816 Year ended 30 June 20 10 Opening net book amount 41,316 113,365 7,135 161,816 Additions from acquisitions (note 35) --- 1,117 --- 1,117 Additions 11,416 40,816 22 52,254 Disposals --- (848) (64) (912) Depreciation charge (1,219) (32,874) (830) (34,923) Exchange differences (534) (7,183) (1,158) (8,875) Closing net book amount 50,979 114,393 5,105 170,477 At 30 June 20 10 Cost or fair value 54,520 258,689 9,690 322,899 Accumulated depreciation (3,541) (144,296) (4,585) (152,422) Net book amount 50,979 114,393 5,105 170,477
Land and buildings
Furnitu re, fittings and equipment
Leased plant and equipment
Total
$’000 $’000 $’000 $’000 Year ended 30 June 2011 Opening net book amount 50,979 114,393 5,105 170,477 Additions from acquisitions (note 35) --- 27,532 --- 27,532 Additions --- 41,858 56 41,914 Disposals --- (1,198) --- (1,198) Depreciation charge (1,149) (38,323) (660) (40,132) Exchange differences (1,535) (11,926) (280) (13,741) Closing net book amount 48,295 132,336 4,221 184,852 At 30 June 201 1 Cost or fair value 51,442 291,999 9,083 352,524 Accumulated depreciation (3,147) (159,663) (4,862) (167,672) Net book amount 48,295 132,336 4,221 184,852 Non-current assets pledged as security Refer to note 22(c) for information on non-current assets pledged as security by the consolidated entity.
For
per
sona
l use
onl
y
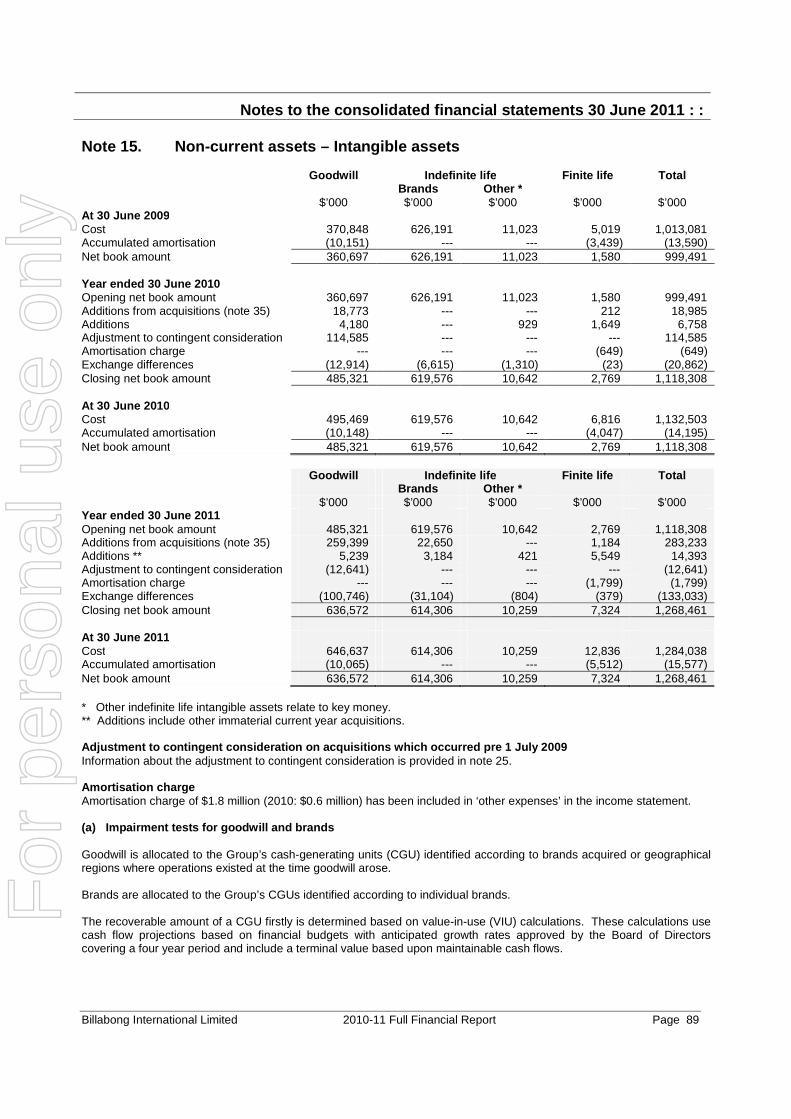
Notes to the consolidated financial statements 30 J une 2011 : :
Billabong International Limited 2010-11 Full Financial Report Page 89
Note 15. Non-current assets – Intangible assets Goodwill Indefinite life Finite life Total Brands Other * $’000 $’000 $’000 $’000 $’000 At 30 June 200 9 Cost 370,848 626,191 11,023 5,019 1,013,081 Accumulated amortisation (10,151) --- --- (3,439) (13,590) Net book amount 360,697 626,191 11,023 1,580 999,491 Year ended 30 June 20 10 Opening net book amount 360,697 626,191 11,023 1,580 999,491 Additions from acquisitions (note 35) 18,773 --- --- 212 18,985 Additions 4,180 --- 929 1,649 6,758 Adjustment to contingent consideration 114,585 --- --- --- 114,585 Amortisation charge --- --- --- (649) (649) Exchange differences (12,914) (6,615) (1,310) (23) (20,862) Closing net book amount 485,321 619,576 10,642 2,769 1,118,308 At 30 June 20 10 Cost 495,469 619,576 10,642 6,816 1,132,503 Accumulated amortisation (10,148) --- --- (4,047) (14,195) Net book amount 485,321 619,576 10,642 2,769 1,118,308 Goodwill Indefinite life Finite l ife Total Brands Other * $’000 $’000 $’000 $’000 $’000 Year ended 30 June 2011 Opening net book amount 485,321 619,576 10,642 2,769 1,118,308 Additions from acquisitions (note 35) 259,399 22,650 --- 1,184 283,233 Additions ** 5,239 3,184 421 5,549 14,393 Adjustment to contingent consideration (12,641) --- --- --- (12,641) Amortisation charge --- --- --- (1,799) (1,799) Exchange differences (100,746) (31,104) (804) (379) (133,033) Closing net book amount 636,572 614,306 10,259 7,324 1,268,461 At 30 June 201 1 Cost 646,637 614,306 10,259 12,836 1,284,038 Accumulated amortisation (10,065) --- --- (5,512) (15,577) Net book amount 636,572 614,306 10,259 7,324 1,268,461 * Other indefinite life intangible assets relate to key money. ** Additions include other immaterial current year acquisitions. Adjustment to contingent consideration on acquisiti ons which occurred pre 1 July 2009 Information about the adjustment to contingent consideration is provided in note 25. Amortisation charge Amortisation charge of $1.8 million (2010: $0.6 million) has been included in ‘other expenses’ in the income statement. (a) Impairment tests for goodwill and brands Goodwill is allocated to the Group’s cash-generating units (CGU) identified according to brands acquired or geographical regions where operations existed at the time goodwill arose. Brands are allocated to the Group’s CGUs identified according to individual brands. The recoverable amount of a CGU firstly is determined based on value-in-use (VIU) calculations. These calculations use cash flow projections based on financial budgets with anticipated growth rates approved by the Board of Directors covering a four year period and include a terminal value based upon maintainable cash flows.
For
per
sona
l use
onl
y

Notes to the consolidated financial statements 30 J une 2011 : :
Billabong International Limited 2010-11 Full Financial Report Page 90
Note 15. Non-current assets – Intangible assets (co ntinued) (a) Impairment tests for goodwill and brands (con tinued) If the VIU of a CGU is lower than its carrying amount, then the CGU’s fair value less costs to sell (FVLCTS) is determined as AASB 136 requires the recoverable amount of a CGU to be the higher of VIU and FVLCTS. In applying the FVLCTS approach, the recoverable amount of a CGU is assessed using market based valuation techniques such as discounted cash flow analysis, comparable transactions and observable trading multiples.
(b) Key assumptions used for value-in-use calcula tions Pre-tax cash flow projections for brand CGUs are discounted using a pre-tax discount rate range between 12.0% and 14.0% (2010: 12.0% and 14.0%). Pre-tax cash flow projections for regional CGUs with allocated goodwill are discounted using a pre-tax discount rate between 12.5% and 16.3% (2010: 12.5% and 16.3%). The discount rates used reflect specific risks relating to the relevant region of operation or the brand and are derived from the Group’s weighted average cost of capital. Terminal growth rates used in the VIU calculations range between 4.0% and 5.0% (2010: 4.0% and 5.0%). The terminal growth rates used reflect the maturity and establishment of the brand or region. These assumptions have been used for the analysis of each CGU. (c) Key assumptions used for fair value less costs to sell calculations For the South African CGU, its recoverable amount was determined using a FVLCTS approach. The cash flow forecasts used in the discounted cash flow model were based on past experience, economic trends such as GDP growth and inflation as well as industry and market trends. The forecasts also took into account the expected impact from new product initiatives, retail store expansion, and further distribution of Group brands into the South African market. The forecasts were adopted by the Board and were for a period of ten years to reflect the capturing of the benefits of the new product initiatives.
Goodwill Brands 2011
$’000 2010 $’000
2011 $’000
2010 $’000
Billabong 55,083 52,574 434,533 434,533 Element 850 850 28,630 25,733 Von Zipper --- --- 1,187 1,187 Kustom 3,746 3,746 10,540 10,540 Palmers --- --- 5,113 5,113 Honolua 6,180 7,751 4,385 4,385 Beachculture --- --- 853 853 Nixon 81,579 88,037 51,691 64,819 Amazon --- --- 1,059 1,141 Xcel 9,850 12,884 3,195 4,007 Tigerlily 1,889 1,889 3,600 3,600 Sector 9 24,335 35,202 8,459 10,607 DaKine 102,154 150,664 42,264 53,058 RVCA 70,853 --- 18,797 --- Australia 74,864 12,744 --- --- New Zealand 8,202 8,647 --- --- South Africa 36,971 41,433 --- --- North America 153,371 60,304 --- --- United Kingdom 6,645 8,596 --- --- 636,572 485,321 614,306 619,576
For
per
sona
l use
onl
y
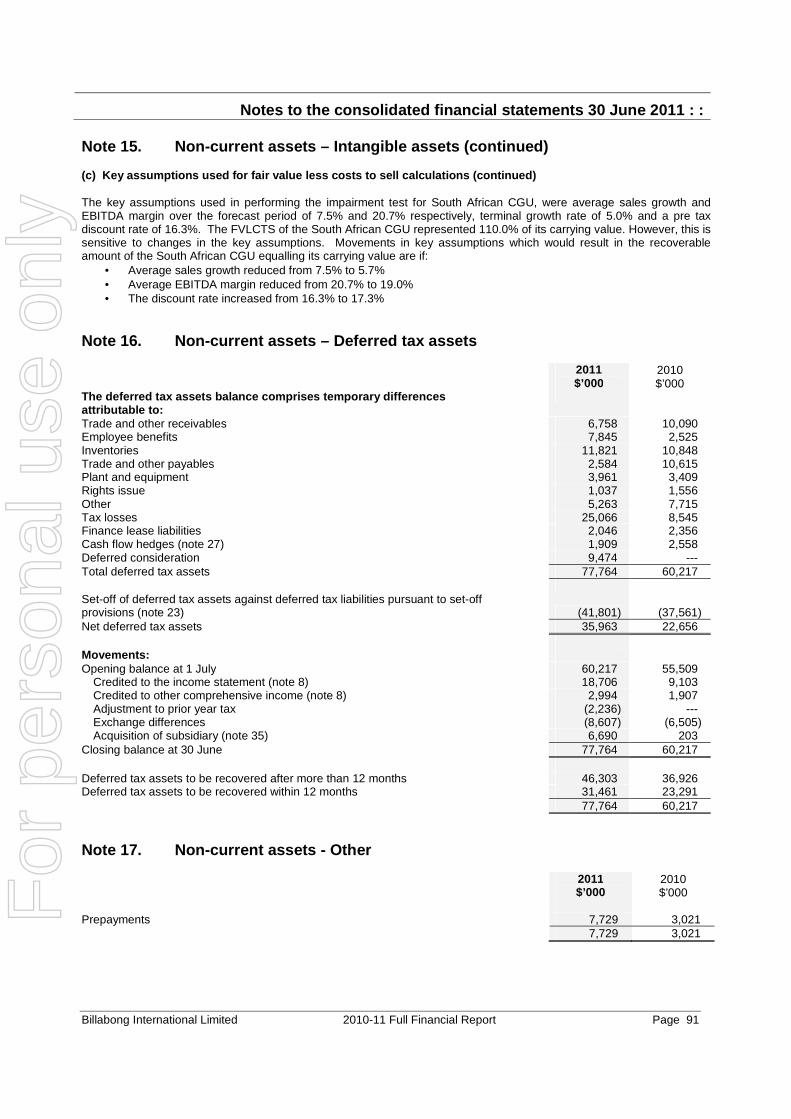
Notes to the consolidated financial statements 30 J une 2011 : :
Billabong International Limited 2010-11 Full Financial Report Page 91
Note 15. Non-current assets – Intangible assets (co ntinued) (c) Key assumptions used for fair value less costs to sell calculations (continued) The key assumptions used in performing the impairment test for South African CGU, were average sales growth and EBITDA margin over the forecast period of 7.5% and 20.7% respectively, terminal growth rate of 5.0% and a pre tax discount rate of 16.3%. The FVLCTS of the South African CGU represented 110.0% of its carrying value. However, this is sensitive to changes in the key assumptions. Movements in key assumptions which would result in the recoverable amount of the South African CGU equalling its carrying value are if:
• Average sales growth reduced from 7.5% to 5.7% • Average EBITDA margin reduced from 20.7% to 19.0% • The discount rate increased from 16.3% to 17.3%
Note 16. Non-current assets – Deferred tax assets 2011
$’000 2010 $’000
The deferred tax assets balance comprises temporary differences attributable to:
Trade and other receivables 6,758 10,090 Employee benefits 7,845 2,525 Inventories 11,821 10,848 Trade and other payables 2,584 10,615 Plant and equipment 3,961 3,409 Rights issue 1,037 1,556 Other 5,263 7,715 Tax losses 25,066 8,545 Finance lease liabilities 2,046 2,356 Cash flow hedges (note 27) 1,909 2,558 Deferred consideration 9,474 --- Total deferred tax assets 77,764 60,217 Set-off of deferred tax assets against deferred tax liabilities pursuant to set-off provisions (note 23) (41,801)
(37,561)
Net deferred tax assets 35,963 22,656 Movements: Opening balance at 1 July 60,217 55,509
Credited to the income statement (note 8) 18,706 9,103 Credited to other comprehensive income (note 8) 2,994 1,907 Adjustment to prior year tax (2,236) --- Exchange differences (8,607) (6,505) Acquisition of subsidiary (note 35) 6,690 203
Closing balance at 30 June 77,764 60,217 Deferred tax assets to be recovered after more than 12 months 46,303 36,926 Deferred tax assets to be recovered within 12 months 31,461 23,291 77,764 60,217
Note 17. Non-current assets - Other
2011
$’000 2010 $’000
Prepayments 7,729 3,021 7,729 3,021
For
per
sona
l use
onl
y

Notes to the consolidated financial statements 30 J une 2011 : :
Billabong International Limited 2010-11 Full Financial Report Page 92
Note 18. Current liabilities – Trade and other paya bles
2011
$’000 2010 $’000
Trade payables 195,087 175,750 Other payables 145,584 133,095 Derivative financial liabilities (note 29) 3,363 6,700 344,034 315,545 (a) Risk exposure Information about the Group’s exposure to foreign exchange risk is provided in note 2. (b) Other payables Included in other payables is deferred payments payable of $86.2 million (US$91.8 million) relating to Quiet Flight, Nixon and Xcel (2010: $85.3 million (US$72.4 million) deferred payment payable to Quiet Flight and Nixon).
Note 19. Current liabilities – Borrowings
2011 $’000
2010 $’000
Secured Bank overdrafts 433 --- Lease liabilities (note 33) --- 11 Total secured current borrowings 433 11 Unsecured Bank loans 13,049 18,615 Lease liabilities (note 33) 1,225 1,365 Other loans 555 534 Total unsecured current borrowings 14,829 20,514 Total current borrowings 15,262 20,525 (a) Bank loans Bank loans represent term loans with variable interest rates. (b) Other loans Other loans represent term loans with variable interest rates. (c) Security and fair value disclosures Details of the security relating to each of the secured liabilities, the fair value of each of the borrowings and further information on the bank loans are set out in note 22. (d) Risk exposure Details of the Group’s exposures to risks arising from current and non-current borrowings are set out in note 2.
For
per
sona
l use
onl
y
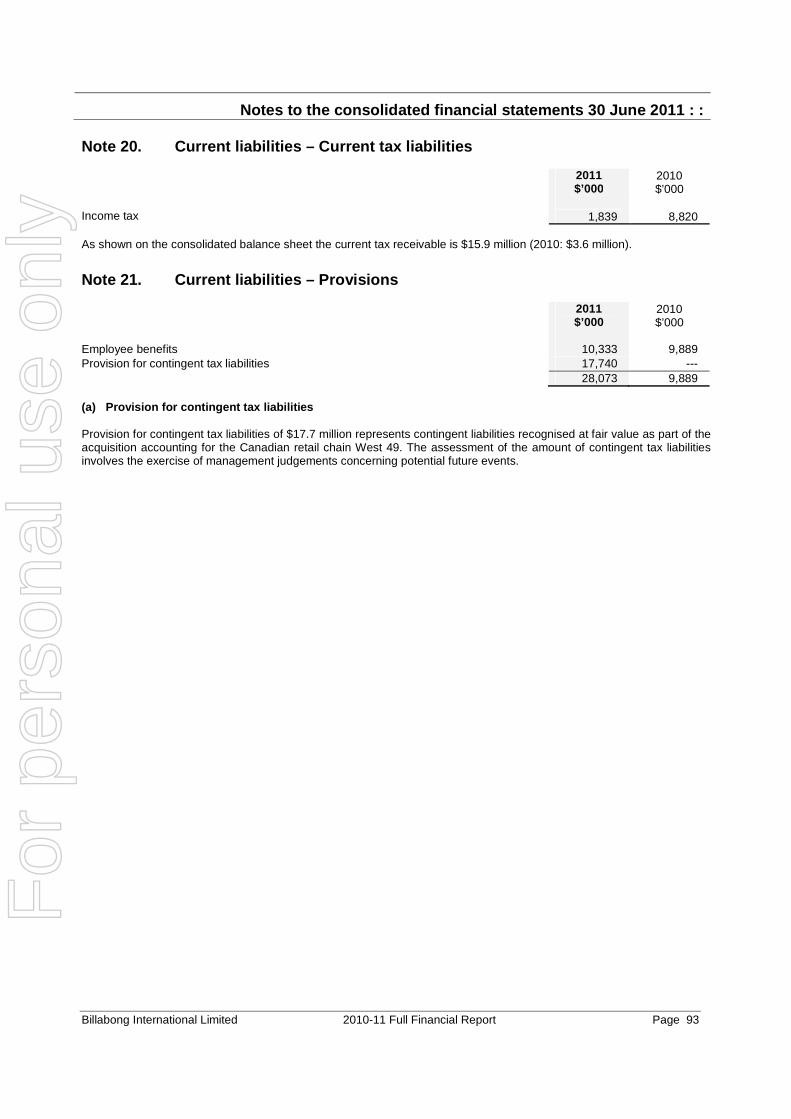
Notes to the consolidated financial statements 30 J une 2011 : :
Billabong International Limited 2010-11 Full Financial Report Page 93
Note 20. Current liabilities – Current tax liabilit ies 2011
$’000 2010 $’000
Income tax 1,839 8,820 As shown on the consolidated balance sheet the current tax receivable is $15.9 million (2010: $3.6 million).
Note 21. Current liabilities – Provisions
2011
$’000 2010 $’000
Employee benefits 10,333 9,889 Provision for contingent tax liabilities 17,740 --- 28,073 9,889
(a) Provision for contingent tax liabilities
Provision for contingent tax liabilities of $17.7 million represents contingent liabilities recognised at fair value as part of the acquisition accounting for the Canadian retail chain West 49. The assessment of the amount of contingent tax liabilities involves the exercise of management judgements concerning potential future events.
For
per
sona
l use
onl
y

Notes to the consolidated financial statements 30 J une 2011 : :
Billabong International Limited 2010-11 Full Financial Report Page 94
Note 22. Non-current liabilities – Borrowings
2011 $’000
2010 $’000
Unsecured Syndicated facility 564,112 380,547 Drawdown facility 33,775 23,063 Lease liabilities (note 33) 16 1,323 Total unsecured non-current borrowings 597,903 404,933 Total non-current borrowings 597,903 404,933 (a) Syndicated facility The syndicated facility is utilised by the Group’s major regions and is a multi-currency facility enabling the Group to borrow in Australian Dollars (AUD), United States Dollars (USD), Euro (EUR), Great Britain Pounds (GBP), Japanese Yen (JPY), New Zealand Dollars (NZD), Canadian Dollars (CAD), Singapore Dollars (SGD) and Hong Kong Dollars (HKD). The syndicated facility has funding periods of 1, 2, 3, 4 and 6 calendar months. Interest is payable in arrears and calculated as the benchmark reference rate plus a margin. Applicable benchmark reference rates include: London Interbank Offered Rate (LIBOR); USD LIBOR; and Bank Bill Swap Rate (BBSY). The syndicated facility may be drawn at any time during the term of the facility provided the Company or Group does not trigger an event of default. As at 30 June 2010 the Group had an unsecured Syndicated Revolving Multi-Currency Facility with a limit of US$483.5 million (US$266.75 million due for roll-over on or prior to 1 July 2011 and US$216.75 million due for roll-over on or prior to 1 July 2012). On 4 August 2010, the Group renegotiated this unsecured Syndicated Revolving Multi-Currency Facility with an increase in the total facility limit from US$483.5 million to US$790.0 million. Of this US$790.0 million, US$395.0 million is due for roll-over on or prior to 28 July 2013 with the remaining US$395.0 million due for roll-over on or prior to 28 July 2014. These facility limits and roll-over dates remain the same at 30 June 2011. The renegotiation of this facility on 4 August 2010 provided the Group with improved tenor and lower borrowing margins compared to those available when the Group rolled over a portion of the facility on 11 August 2009. (b) Drawdown facility The drawdown facility is utilised by the Group’s major regions and enables the Group to borrow in AUD, USD, CAD, EUR, GBP and Korean Won (KRW). The facility may be drawn at any time during the term of the facility provided the Company or Group does not trigger an event of default. At 30 June 2010 the Group had an US$100.0 million unsecured multi-currency drawdown facility which was due for roll-over on or prior to 1 July 2012. On 30 June 2011, the Group renegotiated this US$100.0 million unsecured multi-currency drawdown facility which included an extension to 28 July 2013 of the facility which was previously due for roll-over on or before 1 July 2012. The renegotiation of this facility provides the Group with improved tenor and lower borrowing margins compared to those available when the Group rolled over the facility on 7 September 2009.
For
per
sona
l use
onl
y

Notes to the consolidated financial statements 30 J une 2011 : :
Billabong International Limited 2010-11 Full Financial Report Page 95
Note 22. Non-current liabilities – Borrowings (cont inued) (c) Assets pledged as security Finance lease liabilities are effectively secured as the rights to the leased assets recognised in the financial statements revert to the lessor in the event of default. The carrying amounts of assets pledged as security for current and non-current borrowings are: 2011
$’000 2010 $’000
Current Floating charge Trade and other receivables 433 --- Total current assets pledged as security 433 --- Non-current Finance lease Plant and equipment --- 12 Total non-current assets pledged as security --- 12 Total assets pledged as security 433 12 (d) Financing arrangements 2011
$’000 2010 $’000
Credit standby arrangements Total facilities Bank overdrafts and at-call facilities 12,462 12,064 Trade finance facilities 77,495 56,265 Syndicated, drawdown and other facilities 842,100 688,850 932,057 757,179 Used at balance date Bank overdrafts and at-call facilities 433 --- Trade finance facilities 37,728 16,261 Syndicated, drawdown and other facilities 600,339 404,676 638,500 420,937 Unused at balance date Bank overdrafts and at-call facilities 12,029 12,064 Trade finance facilities 39,767 40,004 Syndicated, drawdown and other facilities 241,761 284,174 293,557 336,242 Bank loan facilities Total facilities 20,970 23,933 Used at balance date 13,049 18,615 Unused at balance date 7,921 5,318 Trade finance facilities, utilised by the Group for the provision of letters of credit to suppliers, may be drawn upon at any time and may be terminated by the bank at any time by way of written notice. Subject to no event of default, the Group may draw down on the syndicated and drawdown facilities at any time over the term of the facilities. (e) Risk exposure Information about the Group’s exposure to interest rate and foreign exchange risk is provided in note 2.
For
per
sona
l use
onl
y

Notes to the consolidated financial statements 30 J une 2011 : :
Billabong International Limited 2010-11 Full Financial Report Page 96
Note 22. Non-current liabilities – Borrowings (cont inued)
(f) Fair value The carrying amounts and fair values of borrowings at balance date are: 2011 2010
Carrying amount
Fair value
Carrying amount
Fair value
$’000 $’000 $’000 $’000 On-balance sheet Lease liabilities 1,241 1,206 2,699 2,598 1,241 1,206 2,699 2,598 All other fair values equal the carrying values of borrowings. Fair value is inclusive of costs which would be incurred on settlement of a liability. The fair value of the borrowings on balance sheet is based upon market prices where a market exists or by discounting the expected future cash flows by the current interest rates for liabilities with similar risk profiles. None of the borrowings are traded. Note 23. Non-current liabilities – Deferred tax lia bilities 2011
$’000 2010 $’000
The deferred tax liabilities balance comprises temp orary differences attributable to:
Trade and other receivables 391 521 Property, plant and equipment 5,766 4,164 Prepayments 7,098 5,226 Other 2,040 7,478 Intangible assets – brands 73,208 72,366 Cash flow hedges (note 27) 207 2,621 Total deferred tax liabilities 88,710 92,376 Set-off of deferred tax assets pursuant to set-off provisions (note 16) (41,801) (37,561) Net deferred tax liabilities 46,909 54,815 Movements: Opening balance at 1 July 92,376 90,271
Charged to the income statement (note 8) 6,466 593 Charged to other comprehensive income (note 8) (1,639) 3,634 Adjustment to prior year tax (989) --- Exchange differences (7,517) (2,234) Acquisition of subsidiary (note 35) 13 112
Closing balance at 30 June 88,710 92,376 Deferred tax liabilities to be settled after more than 12 months 85,532 89,719 Deferred tax liabilities to be settled within 12 months 3,178 2,657 88,710 92,376 Note 24. Non-current liabilities – Provisions and o ther payables 2011
$’000 2010 $’000
Employee benefits 3,580 3,593 Derivative financial liabilities (note 29) 10,501 9,192 Other 10,922 9,486 25,003 22,271
For
per
sona
l use
onl
y

Notes to the consolidated financial statements 30 J une 2011 : :
Billabong International Limited 2010-11 Full Financial Report Page 97
Note 25. Deferred payments The non-current deferred payments payable of $164.1 million relates to the Sector 9, DaKine, RVCA, Two Seasons, Swell and SDS/Jetty Surf acquisitions (2010: $155.9 million relates to Xcel, Sector 9, DaKine, Two Seasons and Swell acquisitions). Included in note 18 ‘other payables’ is deferred payments payable of $86.2 million relating to Quiet Flight, Nixon and Xcel (2010: $85.3 million relates to Quiet Flight and Nixon). The current deferred payment in relation to Nixon was restated during the year ended 30 June 2011 taking into account actual results which resulted in an increase of approximately US$11.7 million in the underlying USD payable. The deferred payment for Xcel was reclassified from non-current to current during the 2010-11 financial year, and was also restated taking into account the latest Board approved forecast, resulting in a decrease of approximately US$0.5 million in the underlying USD payable. The non-current deferred payments were restated during the year ended 30 June 2011 taking into account the latest Board approved forecasts. This resulted in a decrease of approximately US$25.1 million in the underlying USD payable relating to DaKine, Sector 9 and Swell and a decrease of approximately GBP 0.4 million in the underlying GBP payable relating to Two Seasons. An adjustment in relation to Swell has been recognised in the income statement. Refer to note 6. As at 30 June 2011 the deferred consideration relating to all acquisitions has been fully recognised at present value taking into account the latest Board approved forecasts. Refer to note 32. Note 26. Contributed equity
Notes
2011 Shares
2010 Shares
2011
2010
’000 ’000 $’000 $’000 (a) Share capital Ordinary shares Fully paid (b),(c) 254,038 253,123 675,998 668,810 Other equity securities (d) --- --- 2,951 2,951 Total contributed equity 254,038 253,123 678,949 671,761 (b) Movements in ordinary share capital
2010
Date
Details Notes
Number of shares
$’000
1 July 2009 Opening balance 252,017,759 656,061 23 October 2009 Dividend reinvestment plan issue (f) 845,577 9,869 22 April 2010 Dividend reinvestment plan issue (f) 259,216 2,880 30 June 2010 Balance 253,122,552 668,810 2011
Date
Details Notes
Number of shares
$’000
1 July 2010 Opening balance 253,122,552 668,810 22 October 2010 Dividend reinvestment plan issue (f) 491,274 3,970 21 April 2011 Dividend reinvestment plan issue (f) 423,761 3,218 30 June 2011 Balance 254,037,587 675,998
(c) Ordinary shares Ordinary shares entitle the holder to participate in dividends and the proceeds on winding up of the Company in proportion to the number of and amounts paid on the shares held. On a show of hands every holder of ordinary shares present at a meeting in person or by proxy, is entitled to one vote, and upon a poll each share is entitled to one vote. Ordinary shares have no par value and the Company does not have a limited amount of authorised capital.
For
per
sona
l use
onl
y

Notes to the consolidated financial statements 30 J une 2011 : :
Billabong International Limited 2010-11 Full Financial Report Page 98
Note 26. Contributed equity (continued) (d) Other equity securities The amount shown for other equity securities is the value of the options issued in relation to the Element acquisition. Each option is convertible into one ordinary share. Each option is not entitled to participate in dividends or the proceeds on winding up of the Company. Options issued as part of the Element acquisition are as follows:
Date of issue
Number of options issued
Exercise price
Date of exercise
2006 11 August 2005 5,981 $13.69 10 August 2006 11 August 2005 11,959 $13.69 10 August 2007 11 August 2005 5,981 $13.69 10 August 2008 2005 11 August 2004 10,977 $7.99 10 August 2005 11 August 2004 21,952 $7.99 10 August 2006 11 August 2004 10,977 $7.99 10 August 2007 2004 10 August 2003 15,032 $6.32 9 August 2004 10 August 2003 30,066 $6.32 9 August 2005 10 August 2003 15,032 $6.32 9 August 2006 2003 10 August 2002 15,049 $7.70 9 August 2003 10 August 2002 30,096 $7.70 9 August 2004 10 August 2002 15,048 $7.70 9 August 2005 (e) Executive performance share plan The Billabong Executive Performance Share Plan – Australia trust and the Billabong Executive Performance Share Plan trust holds 2,404,551 (2010: 2,215,751) shares on issue at the end of the year. Refer to note 42 for further information. (f) Dividend reinvestment plan Having regard to current volatile and uncertain global economic conditions and, in particular, the Company’s current share price, it has been decided to suspend the Dividend Reinvestment Plan (DRP) for the final ordinary dividend to be paid on 21 October 2011. The reinstatement of the DRP may be considered for future dividends beyond the final dividend for the year ended 30 June 2011. (g) Capital risk management The Group's policy is to maintain a strong capital base so as to preserve investor, creditor and market confidence and to sustain the future development of the business. The Group defines capital base as net debt divided by total capital. Net debt is calculated as total borrowings less cash and cash equivalents. Total capital is calculated as ‘equity’ as shown in the balance sheet (including non-controlling interests) plus net debt.
For
per
sona
l use
onl
y
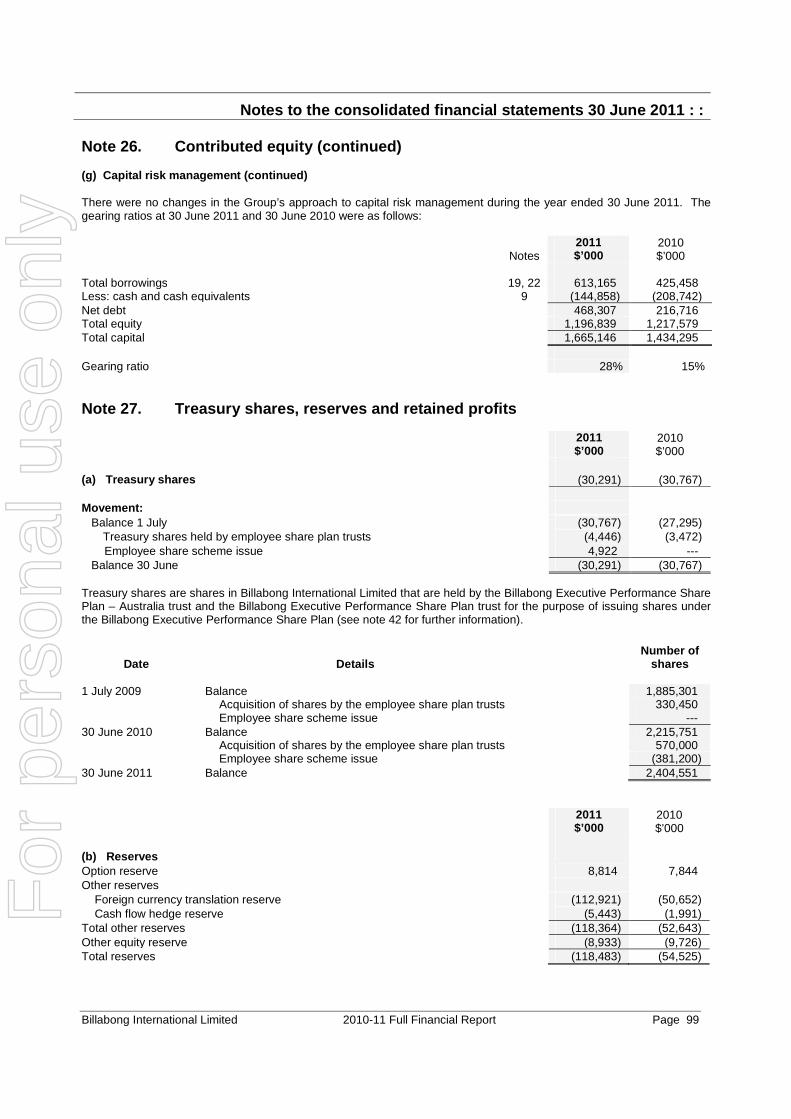
Notes to the consolidated financial statements 30 J une 2011 : :
Billabong International Limited 2010-11 Full Financial Report Page 99
Note 26. Contributed equity (continued) (g) Capital risk management (continued) There were no changes in the Group’s approach to capital risk management during the year ended 30 June 2011. The gearing ratios at 30 June 2011 and 30 June 2010 were as follows:
Notes 2011 $’000
2010 $’000
Total borrowings 19, 22 613,165 425,458 Less: cash and cash equivalents 9 (144,858) (208,742) Net debt 468,307 216,716 Total equity 1,196,839 1,217,579 Total capital 1,665,146 1,434,295 Gearing ratio 28% 15% Note 27. Treasury shares, reserves and retained pro fits 2011
$’000 2010 $’000
(a) Treasury shares (30,291) (30,767) Movement: Balance 1 July (30,767) (27,295)
Treasury shares held by employee share plan trusts (4,446) (3,472) Employee share scheme issue 4,922 --- Balance 30 June (30,291) (30,767) Treasury shares are shares in Billabong International Limited that are held by the Billabong Executive Performance Share Plan – Australia trust and the Billabong Executive Performance Share Plan trust for the purpose of issuing shares under the Billabong Executive Performance Share Plan (see note 42 for further information).
Date
Details
Number of shares
1 July 2009 Balance 1,885,301 Acquisition of shares by the employee share plan trusts 330,450 Employee share scheme issue --- 30 June 2010 Balance 2,215,751 Acquisition of shares by the employee share plan trusts 570,000 Employee share scheme issue (381,200) 30 June 2011 Balance 2,404,551 2011
$’000 2010 $’000
(b) Reserves Option reserve 8,814 7,844 Other reserves Foreign currency translation reserve (112,921) (50,652) Cash flow hedge reserve (5,443) (1,991) Total other reserves (118,364) (52,643) Other equity reserve (8,933) (9,726) Total reserves (118,483) (54,525)
For
per
sona
l use
onl
y
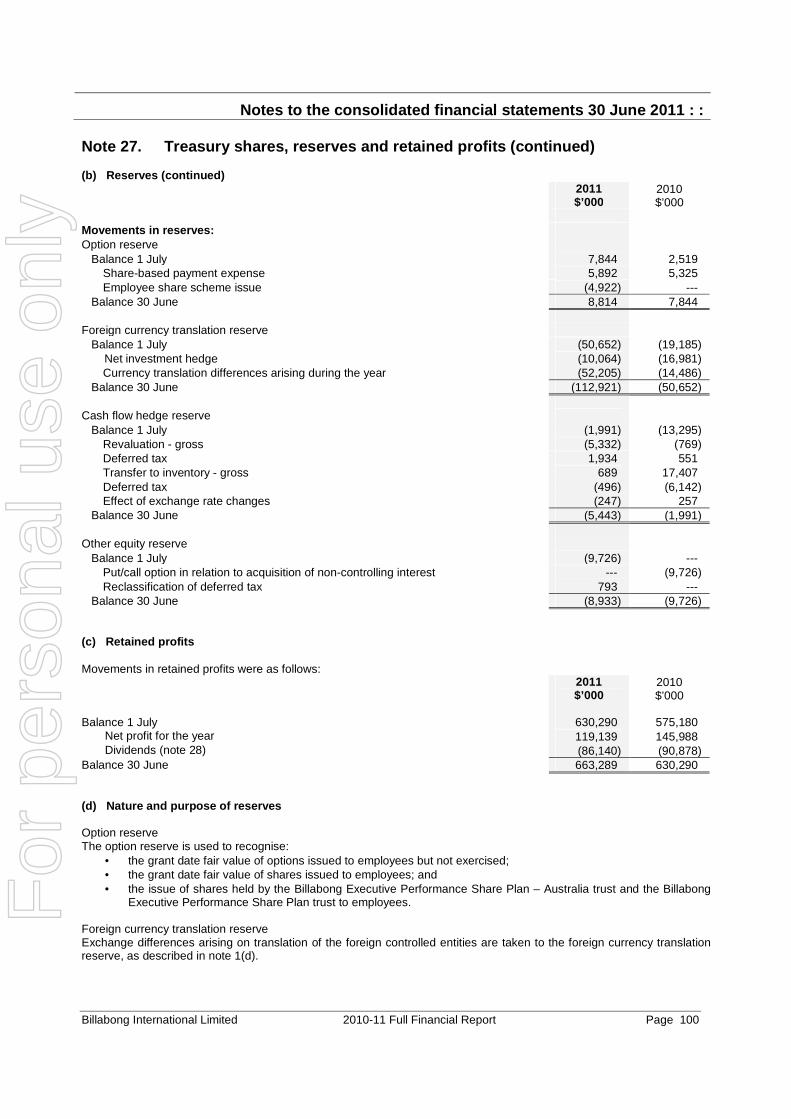
Notes to the consolidated financial statements 30 J une 2011 : :
Billabong International Limited 2010-11 Full Financial Report Page 100
Note 27. Treasury shares, reserves and retained pro fits (continued) (b) Reserves (continued)
2011 $’000
2010 $’000
Movements in reserves: Option reserve Balance 1 July 7,844 2,519
Share-based payment expense 5,892 5,325 Employee share scheme issue (4,922) ---
Balance 30 June 8,814 7,844 Foreign currency translation reserve Balance 1 July (50,652) (19,185) Net investment hedge (10,064) (16,981)
Currency translation differences arising during the year (52,205) (14,486) Balance 30 June (112,921) (50,652) Cash flow hedge reserve Balance 1 July (1,991) (13,295)
Revaluation - gross (5,332) (769) Deferred tax 1,934 551 Transfer to inventory - gross 689 17,407 Deferred tax (496) (6,142) Effect of exchange rate changes (247) 257
Balance 30 June (5,443) (1,991) Other equity reserve Balance 1 July (9,726) ---
Put/call option in relation to acquisition of non-controlling interest --- (9,726) Reclassification of deferred tax 793 ---
Balance 30 June (8,933) (9,726) (c) Retained profits Movements in retained profits were as follows: 2011
$’000 2010 $’000
Balance 1 July 630,290 575,180
Net profit for the year 119,139 145,988 Dividends (note 28) (86,140) (90,878)
Balance 30 June 663,289 630,290 (d) Nature and purpose of reserves Option reserve The option reserve is used to recognise:
• the grant date fair value of options issued to employees but not exercised; • the grant date fair value of shares issued to employees; and • the issue of shares held by the Billabong Executive Performance Share Plan – Australia trust and the Billabong
Executive Performance Share Plan trust to employees. Foreign currency translation reserve Exchange differences arising on translation of the foreign controlled entities are taken to the foreign currency translation reserve, as described in note 1(d).
For
per
sona
l use
onl
y

Notes to the consolidated financial statements 30 J une 2011 : :
Billabong International Limited 2010-11 Full Financial Report Page 101
Note 27. Treasury shares, reserves and retained pro fits (continued) (d) Nature and purpose of reserves (continued) Cash flow hedge reserve The hedging reserve is used to record gains or losses on a hedging instrument in a cash flow hedge that are recognised directly in equity, as described in note 1(n). Amounts are recognised in the income statement when the associated hedged transaction affects profit and loss. Other equity reserve This reserve is in relation to the symmetrical put and call options at the present value of the expected redemption amount for the acquisition of the non-controlling interest of Surfstitch Pty Ltd. Note 28. Dividends Parent entity 2011
$’000 2010 $’000
(a) Ordinary shares 2010 final dividend of 18.0 cents per fully paid share paid on 22 October 2010 (2009 final dividend of 18.0 cents per fully paid share paid on 23 October 2009)
Partially franked to 50% based on tax paid at 30% 45,562 45,363
2011 interim dividend of 16.0 cents per fully paid share paid on 21 April 2011 (2010 interim dividend of 18.0 cents per fully paid share paid on 22 April 2010)
Partially franked to 50% based on tax paid at 30% 40,578 45,515 Total dividends paid 86,140 90,878 Dividends paid in cash or satisfied by the issue of shares under the dividend reinvestment plan during the year ended 30 June 2011 is as follows:
Paid in cash 78,952 78,129 Satisfied by issue of shares (note 26(b)) 7,188 12,749
86,140 90,878
(b) Divid ends not recognised at year end In addition to the above dividends, since year end the Directors have resolved to pay a final dividend of 13.0 cents per fully paid ordinary share partially franked to 25% based on tax paid at 30% (2010: 18.0 cents partially franked to 50% based on tax paid at 30%). The aggregate amount of the proposed dividend expected to be paid on 21 October 2011 out of retained profits at 30 June 2011, but not recognised as a liability at year end, is
33,025
45,562
The unfranked portion of the dividend is declared to be conduit foreign income. Australian dividend withholding tax is not payable by non-resident shareholders on the unfranked portion of the dividend sourced from conduit foreign income. (c) Dividend reinvestment plan Having regard to current volatile and uncertain global economic conditions and, in particular, the Company’s current share price, it has been decided to suspend the Dividend Reinvestment Plan (DRP) for the final ordinary dividend to be paid on 21 October 2011. The reinstatement of the DRP may be considered for future dividends beyond the final dividend for the year ended 30 June 2011.
For
per
sona
l use
onl
y
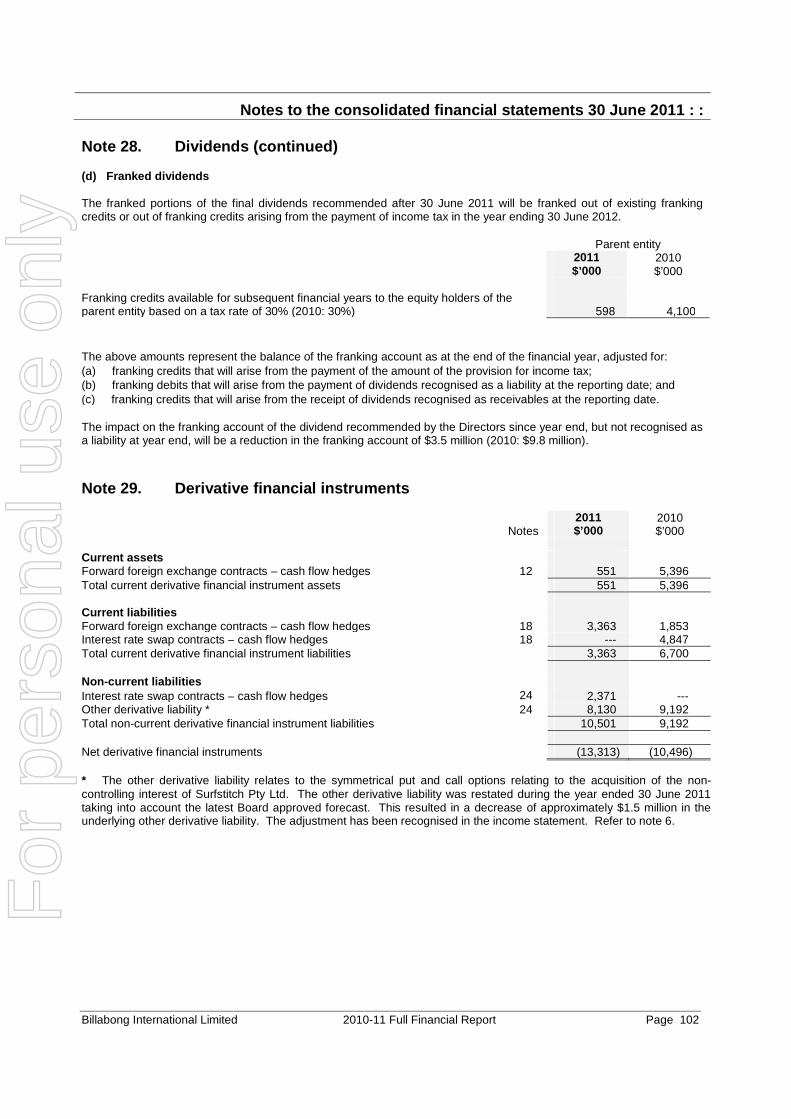
Notes to the consolidated financial statements 30 J une 2011 : :
Billabong International Limited 2010-11 Full Financial Report Page 102
Note 28. Dividends (continued) (d) Franked dividends
The franked portions of the final dividends recommended after 30 June 2011 will be franked out of existing franking credits or out of franking credits arising from the payment of income tax in the year ending 30 June 2012.
Parent entity 2011
$’000 2010 $’000
Franking credits available for subsequent financial years to the equity holders of the parent entity based on a tax rate of 30% (2010: 30%)
598
4,100
The above amounts represent the balance of the franking account as at the end of the financial year, adjusted for: (a) franking credits that will arise from the payment of the amount of the provision for income tax; (b) franking debits that will arise from the payment of dividends recognised as a liability at the reporting date; and (c) franking credits that will arise from the receipt of dividends recognised as receivables at the reporting date. The impact on the franking account of the dividend recommended by the Directors since year end, but not recognised as a liability at year end, will be a reduction in the franking account of $3.5 million (2010: $9.8 million). Note 29. Derivative financial instruments
Notes 2011 $’000
2010 $’000
Current assets Forward foreign exchange contracts – cash flow hedges 12 551 5,396 Total current derivative financial instrument assets 551 5,396 Current liabilities Forward foreign exchange contracts – cash flow hedges 18 3,363 1,853 Interest rate swap contracts – cash flow hedges 18 --- 4,847 Total current derivative financial instrument liabilities 3,363 6,700 Non-current liabilities Interest rate swap contracts – cash flow hedges 24 2,371 --- Other derivative liability * 24 8,130 9,192 Total non-current derivative financial instrument liabilities 10,501 9,192 Net derivative financial instruments (13,313) (10,496) * The other derivative liability relates to the symmetrical put and call options relating to the acquisition of the non-controlling interest of Surfstitch Pty Ltd. The other derivative liability was restated during the year ended 30 June 2011 taking into account the latest Board approved forecast. This resulted in a decrease of approximately $1.5 million in the underlying other derivative liability. The adjustment has been recognised in the income statement. Refer to note 6.
For
per
sona
l use
onl
y

Notes to the consolidated financial statements 30 J une 2011 : :
Billabong International Limited 2010-11 Full Financial Report Page 103
Note 29. Derivative financial instruments (continue d) (a) Instruments used by the Group The Group is party to derivative financial instruments in the normal course of business in order to hedge exposure to fluctuations in interest and foreign exchange rates in accordance with the Group’s financial risk management policies (refer to note 2). (i) Interest rate swap contracts – cash flow hedges The Group has entered into interest rate swap contracts under which it is obliged to receive interest at variable rates and to pay interest at fixed rates. The contracts are settled on a net basis and the net amount receivable or payable at the reporting date is included in other debtors or other creditors. At balance date the notional principal amount of the interest rate swap contracts covered 48% (2010: 50%) of outstanding USD denominated borrowings. The contract requires settlement of net interest receivable or payable every three months. The settlement dates coincide with the dates on which interest is payable on the underlying debt. Details of the interest rate swap contracts outstanding at balance date are set out below:
Notional principal amount Expiry Fixed interest rat e 90 day bank bill rate at 30 June 2011
US$60 million (2010: n/a)
US$30 million (2010: n/a)
US$100 million (2010: n/a)
July 2013
October 2013
October 2014
1.10% (2010: n/a)
1.25% (2010: n/a)
1.63% (2010: n/a)
0.2% (2010: n/a)
0.2% (2010: n/a)
0.2% (2010: n/a)
The gain or loss from remeasuring the hedging instruments at fair value is deferred to equity in the cash flow hedge reserve, to the extent that the hedge is effective, and reclassified into the income statement when the hedged interest expense is recognised. The ineffective portion is recognised in the income statement immediately. At balance date the fair value of the interest rate swap contracts were US$2.5 million derivative financial instrument liabilities (2010: US$4.1 million derivative financial instrument liabilities). (ii) Forward exchange contracts – cash flow hedges – product purchases From time to time and in order to protect against exchange rate movements, the Group enters into forward exchange contracts to purchase USD, EUR and AUD. The contracts are hedging highly probable forecast purchases for the upcoming season and are timed to mature when major shipments of inventory are scheduled to arrive.
For
per
sona
l use
onl
y

Notes to the consolidated financial statements 30 J une 2011 : :
Billabong International Limited 2010-11 Full Financial Report Page 104
Note 29. Derivative financial instruments (continue d) (a) Instruments used by the Group (continued) The cash flows are expected to occur at various dates within one year from the balance date. At balance date, the details of outstanding contracts are: Buy USD Average exchange rate 2011
US$’000 2010
US$’000 2011
2010
0 – 6 Months Sell Euro 53,300 52,214 1.3833 1.3315 Sell AUD 25,000 20,000 1.0360 0.8745 Sell BRL 2,838 1,000 0.5857 0.5459 Sell CAD --- 3,500 --- 0.9646 Sell Yen 1,194 3,602 0.0122 0.0111 Sell ZAR 2,325 2,441 0.1396 0.1249 6 – 12 Months Sell Euro 22,400 12,215 1.3932 1.2119 Sell Yen 6,867 2,900 0.0123 0.0112 Sell ZAR 170 350 0.1369 0.1224 Buy Euro Average exchange rate 2011
EUR’000 2010
EUR’000 2011
2010
0 – 6 Months Sell GBP 5,996 3,329 0.8426 0.9011 6 – 12 Mont hs Sell GBP --- 4,692 --- 0.8312 Buy AUD Average exchange rate 2011
AU$’000 2010
AU$’000 2011
2010
0 – 6 Months Sell NZD 3,250 3,250 0.7760 0.8062 Sell Yen --- 102 --- 0.0124 6 – 12 Months Sell NZD 750 750 0.7821 0.8061 Sell Yen --- 710 --- 0.0134 Amounts disclosed above represent currency acquired, measured at the contracted rate. The portion of the gain or loss on the hedging instrument that is determined to be an effective hedge is recognised directly in equity. When the cash flow occurs, the Group adjusts the initial measurement of the inventory recognised in the balance sheet by the related amount deferred in equity. At balance date these contracts were net liabilities of $2.8 million (2010: net assets of $3.5 million). The South African Derivative Products facility is secured by local debtors. (iii) Hedge of net investment in foreign entity The foreign exchange loss of $10.1 million (2010: loss of $17.0 million) on translation of inter-company loans to AUD at reporting date is transferred to the foreign currency translation reserve, in equity (note 27(b)). There was no ineffectiveness to be recorded from net investments in foreign entity hedges. (b) Risk exposures Information about the Group’s exposure to credit risk, foreign exchange and interest rate risk and about the methods and assumptions used in determining fair values is provided in note 2.
For
per
sona
l use
onl
y
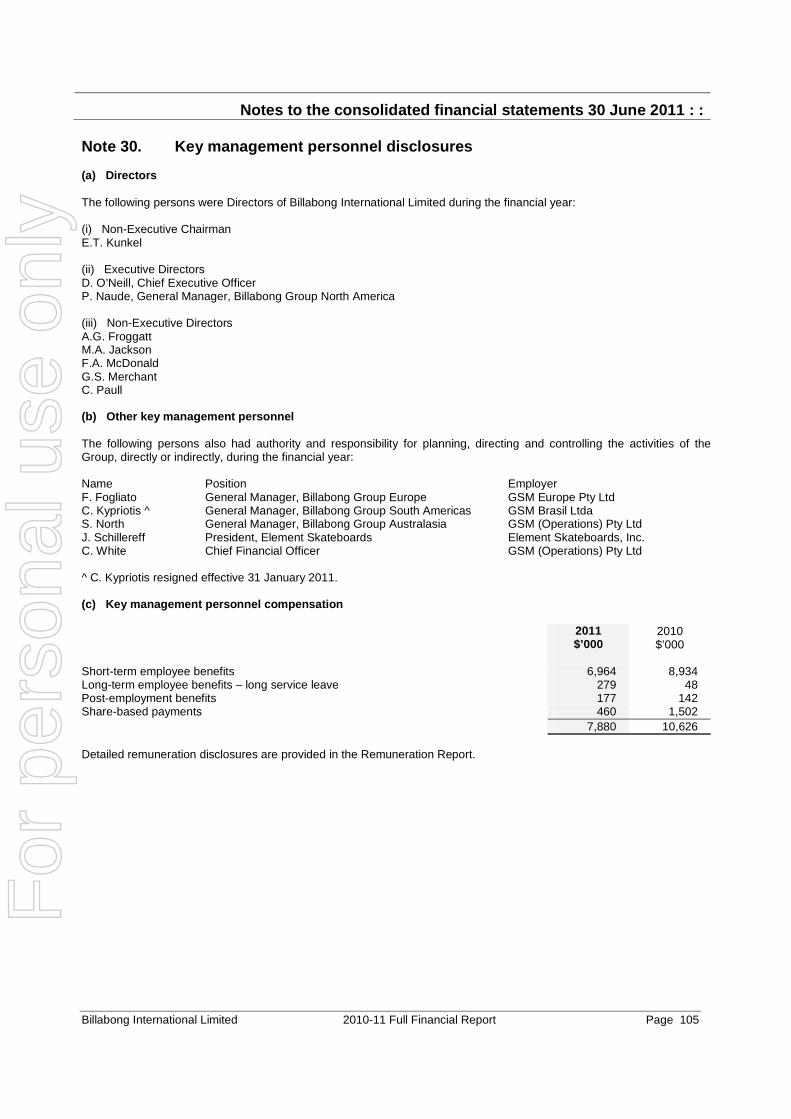
Notes to the consolidated financial statements 30 J une 2011 : :
Billabong International Limited 2010-11 Full Financial Report Page 105
Note 30. Key management personnel disclosures (a) Directors The following persons were Directors of Billabong International Limited during the financial year: (i) Non-Executive Chairman E.T. Kunkel (ii) Executive Directors D. O’Neill, Chief Executive Officer P. Naude, General Manager, Billabong Group North America (iii) Non-Executive Directors A.G. Froggatt M.A. Jackson F.A. McDonald G.S. Merchant C. Paull (b) Other key management personnel The following persons also had authority and responsibility for planning, directing and controlling the activities of the Group, directly or indirectly, during the financial year: Name Position Employer F. Fogliato General Manager, Billabong Group Europe GSM Europe Pty Ltd C. Kypriotis ^ General Manager, Billabong Group South Americas GSM Brasil Ltda S. North General Manager, Billabong Group Australasia GSM (Operations) Pty Ltd J. Schillereff President, Element Skateboards Element Skateboards, Inc. C. White Chief Financial Officer GSM (Operations) Pty Ltd ^ C. Kypriotis resigned effective 31 January 2011. (c) Key management personnel compensation 2011
$’000 2010 $’000
Short-term employee benefits 6,964 8,934 Long-term employee benefits – long service leave 279 48 Post-employment benefits 177 142 Share-based payments 460 1,502 7,880 10,626 Detailed remuneration disclosures are provided in the Remuneration Report.
For
per
sona
l use
onl
y
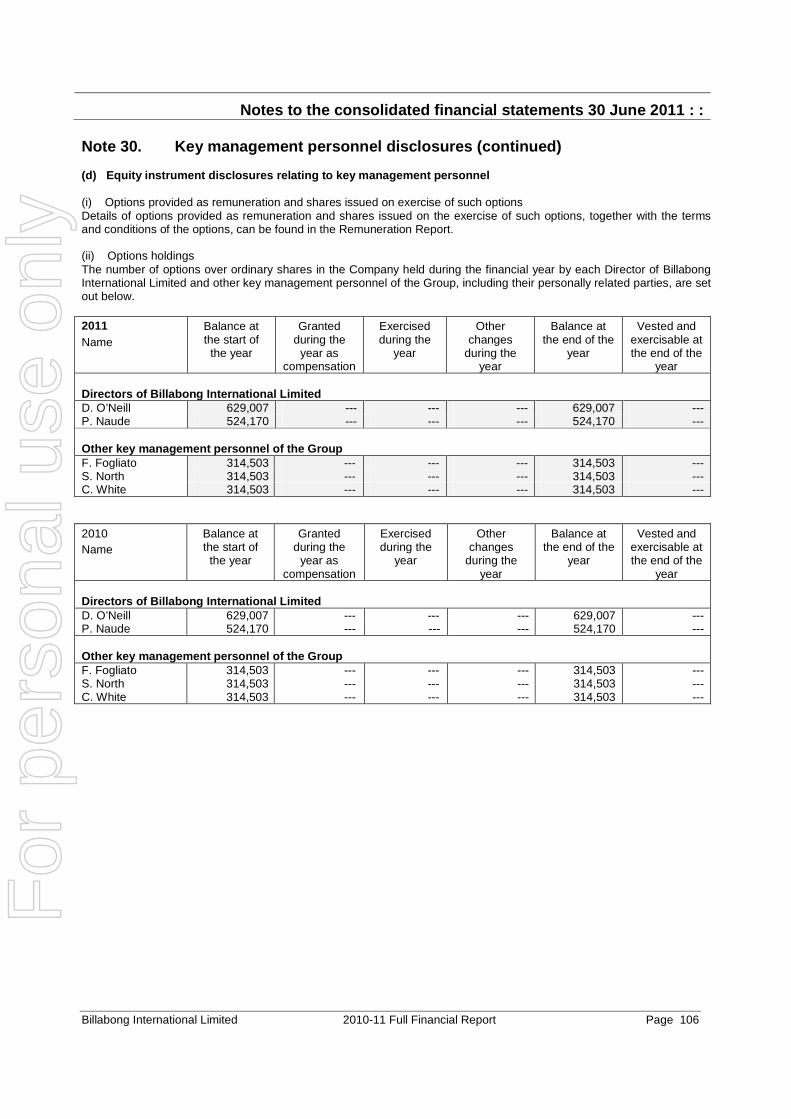
Notes to the consolidated financial statements 30 J une 2011 : :
Billabong International Limited 2010-11 Full Financial Report Page 106
Note 30. Key management personnel disclosures (cont inued) (d) Equity instrument disclosures relating to key management personnel (i) Options provided as remuneration and shares issued on exercise of such options Details of options provided as remuneration and shares issued on the exercise of such options, together with the terms and conditions of the options, can be found in the Remuneration Report. (ii) Options holdings The number of options over ordinary shares in the Company held during the financial year by each Director of Billabong International Limited and other key management personnel of the Group, including their personally related parties, are set out below. 2011 Name
Balance at the start of
the year
Granted during the
year as compensation
Exercised during the
year
Other changes
during the year
Balance at the end of the
year
Vested and exercisable at the end of the
year Directors of Billabong International Limited
D. O’Neill 629,007 --- --- --- 629,007 --- P. Naude 524,170 --- --- --- 524,170 --- Other key management personnel of the Group
F. Fogliato 314,503 --- --- --- 314,503 --- S. North 314,503 --- --- --- 314,503 --- C. White 314,503 --- --- --- 314,503 --- 2010 Name
Balance at the start of
the year
Granted during the
year as compensation
Exercised during the
year
Other changes
during the year
Balance at the end of the
year
Vested and exercisable at the end of the
year Directors of Billabong International Limited
D. O’Neill 629,007 --- --- --- 629,007 --- P. Naude 524,170 --- --- --- 524,170 --- Other key management personnel of the Group
F. Fogliato 314,503 --- --- --- 314,503 --- S. North 314,503 --- --- --- 314,503 --- C. White 314,503 --- --- --- 314,503 ---
For
per
sona
l use
onl
y

Notes to the consolidated financial statements 30 J une 2011 : :
Billabong International Limited 2010-11 Full Financial Report Page 107
Note 30. Key management personnel disclosures (cont inued) (d) Equity instrument disclosures relating to key management personnel (continued) (iii) Rights holdings Details of rights provided as remuneration and shares issued on the vesting of such rights, together with the terms and conditions of the rights, can be found in the Remuneration Report. The number of rights over ordinary shares in the Company held during the financial year by each Director of Billabong International Limited and other key management personnel of the Group are set out below. 2011 Name
Balance at the start of
the year
Granted during the
year as compensation
Exercised during the
year
Other changes
during the year
Balance at the end of the
year
Vested and exercisable at the end of the
year Directors of Billabong International Limited
D. O’Neill 216,237 118,735 --- (56,363) 278,609 --- P. Naude 187,027 103,168 --- (48,745) 241,450 --- Other key management personnel of the Group
F. Fogliato 106,154 51,400 --- (27,670) 129,884 --- C. Kypriotis ^ 55,042 --- --- (55,042) --- --- S. North 108,119 51,400 --- (28,182) 131,337 --- J. Schillereff 22,931 10,793 (6,518) (8,399) 18,807 --- C. White 124,964 51,400 --- (32,568) 143,796 --- ^ C. Kypriotis resigned effective 31 January 2011. 2010 Name
Balance at the start of
the year
Granted during the
year as compensation
Exercised during the
year
Other changes
during the year
Balance at the end of the
year
Vested and exercisable at the end of the
year Directors of Billabong International Limited
D. O’Neill 172,190 88,170 --- (44,123) 216,237 --- P. Naude 152,682 76,262 --- (41,917) 187,027 --- Other key management personnel of the Group
F. Fogliato 80,971 43,284 --- (18,101) 106,154 --- C. Kypriotis 44,365 22,443 --- (11,766) 55,042 --- S. North 84,941 44,085 --- (20,907) 108,119 --- J. Schillereff 22,119 8,014 --- (7,202) 22,931 --- C. White 100,156 50,956 --- (26,148) 124,964 ---
For
per
sona
l use
onl
y

Notes to the consolidated financial statements 30 J une 2011 : :
Billabong International Limited 2010-11 Full Financial Report Page 108
Note 30. Key management personnel disclosures (cont inued) (d) Equity instrument disclosures relating to key management personnel (continued)
^ C. Kypriotis resigned effective 31 January 2011 – details of C. Kypriotis’ share holdings subsequent to his resignation are not required to be disclosed.
(iv) Share holdings The numbers of ordinary shares in the Company held during the financial year by each Director of Billabong International Limited and other key management personnel of the Group, including their personally related entities, are set out below.
2011 Name
Balance at the start of the year
Received on the exercise of rights
holdings
Received on the exercise of
options
Other changes during the year
Balance at the end of the year
Directors of Billabong International Limited E.T. Kunkel 116,435 --- --- --- 116,435 D. O’Neill 1,117,516 --- --- 244,500 1,362,016 A.G. Froggatt 7,505 --- --- --- 7,505 M.A. Jackson 275,838 --- --- 4,337 280,175 F.A. McDonald 153,046 --- --- --- 153,046 G.S. Merchant 37,770,098 --- --- --- 37,770,098 P. Naude 1,105,988 --- --- (60,000) 1,045,988 C. Paull 2,973,289 --- --- --- 2,973,289 Other key management personnel of the Group F. Fogliato 25,191 --- --- --- 25,191 C. Kypriotis ^ 21,211 --- --- (21,211) --- S. North 70,452 --- --- (24,597) 45,855 J. Schillereff 47,548 --- --- (17,221) 30,327 C. White 10,000 --- --- --- 10,000
2010 Name
Balance at the start of the year
Received on the exercise of rights
holdings
Received on the exercise of
options
Other changes during the year
Balance at the end of the year
Directors of Billabong International Limited E.T. Kunkel 116,033 --- --- 402 116,435 D. O’Neill 1,467,779 --- --- (350,263) 1,117,516 A.G. Froggatt 7,505 --- --- --- 7,505 M.A. Jackson 270,259 --- --- 5,579 275,838 F.A. McDonald 153,046 --- --- --- 153,046 G.S. Merchant 37,770,098 --- --- --- 37,770,098 P. Naude 1,175,988 --- --- (70,000) 1,105,988 C. Paull 2,973,289 --- --- --- 2,973,289 Other key management personnel of the Group F. Fogliato 25,191 --- --- --- 25,191 C. Kypriotis 21,211 --- --- --- 21,211 S. North 70,452 --- --- --- 70,452 J. Schillereff 67,908 --- --- (20,360) 47,548 C. White 30,029 --- --- (20,029) 10,000
For
per
sona
l use
onl
y

Notes to the consolidated financial statements 30 J une 2011 : :
Billabong International Limited 2010-11 Full Financial Report Page 109
Note 30. Key management personnel disclosures (continued) (e) Other transactions with Directors and other key management personnel Directors of Billabong International Limited During 2010 and 2011 Burleigh Point Limited utilised property of Director P. Naude for use in certain advertising and promotional activities. There was no consideration paid by Burleigh Point Limited to P. Naude for use of the property. A subsidiary of the Company leases a retail store in South Africa from the wife of Director P. Naude. The rental agreement is based on normal commercial terms and conditions. Key management personnel of the consolidated entity Mr J. Schillereff was a Director of Element Skate Inc at the time the Company acquired the assets comprising the “Element” skate operation. The transaction was effective from 1 July 2002 and as part of the consideration paid by the Company for these assets Mr J. Schillereff was granted 423,053 options. Additionally, as part of the acquisition terms, Mr J. Schillereff was entitled to receive four further tranches of options, granted in August following the first, second, third and fourth anniversary of the transaction. The terms and conditions of each grant of options under the Element acquisition agreement to 30 June 2011 are as follows:
Grant date
Expiry date
Exercise price
Number of
options granted
Value per
option at
grant date
Date exercisable
04 Jul 01 30 Jun 05 $5.35 423,053 $1.74 25% after 30 Jun 02; 50% after 30 Jun 03; 25% after 30 Jun 04 10 Aug 02 09 Aug 06 $7.70 8,847 $1.25 25% after 9 Aug 03; 50% after 9 Aug 04; 25% after 9 Aug 05 10 Aug 03 09 Aug 07 $6.32 8,836 $1.42 25% after 9 Aug 04; 50% after 9 Aug 05; 25% after 9 Aug 06 11 Aug 04 10 Aug 08 $7.99 6,453 $1.26 25% after 10 Aug 05; 50% after 10 Aug 06; 25% after 10 Aug 07 11 Aug 05 10 Aug 09 $13.69 3,516 $2.22 25% after 10 Aug 06; 50% after 10 Aug 07; 25% after 10 Aug 08
For
per
sona
l use
onl
y

Notes to the consolidated financial statements 30 J une 2011 : :
Billabong International Limited 2010-11 Full Financial Report Page 110
Note 31. Remuneration of auditors During the year the following fees were paid or payable for services provided by the auditors of the Group, its related practices and non-related audit firms: 2011
$’000 2010 $’000
(a) Audit services PricewaterhouseCoopers Australian firm Audit and review of financial reports 736 683 Other assurance services 133 --- Related practices of PricewaterhouseCoopers Australian firm Audit and review of financial reports 990 861 Other assurance services 232 --- Total remuneration for audit services 2,091 1,544 (b) Non -audit services Audit-related services PricewaterhouseCoopers Australian firm Due diligence services 162 --- General accounting advice --- 67 Related practices of PricewaterhouseCoopers Australian firm Due diligence services 43 351 General accounting advice 61 31 Total remuneration for audit-related services 266 449 Taxation services PricewaterhouseCoopers Australian firm International tax consulting together with separate tax advice on acquisitions 670 814 Related practices of PricewaterhouseCoopers Australian firm International tax consulting together with separate tax advice on acquisitions 433 1,357 Total remuneration for taxation services 1,103 2,171 Total remuneration for non -audit services 1,369 2,620 It is the Group’s policy to employ PricewaterhouseCoopers on assignments additional to their statutory audit duties where PricewaterhouseCoopers’ expertise and experience with the Group are important. These assignments are principally tax advice and due diligence reporting on acquisitions, or where PricewaterhouseCoopers is awarded assignments on a competitive basis. The Group and its Audit Committee are committed to ensuring the independence of the external auditors, both in appearance as well as in fact. Accordingly, significant attention is directed toward the appropriateness of the external auditors to perform services other than the audit. A formal pre-approval policy of audit and non-audit services provided by the external auditor has been adopted in this regard such that proposed services may either (1) be pre-approved without consideration of specific case-by-case services by the Audit Committee (“general pre-approval”), for example statutory or financial audits/reviews; or (2) require the specific pre-approval of the Audit Committee (“specific pre-approval”), for example taxation and other services. The Audit Committee believes that the combination of these two approaches, and the inclusion of prohibited services, in this policy will result in an effective and efficient procedure to pre-approve services performed by the external auditor.
For
per
sona
l use
onl
y
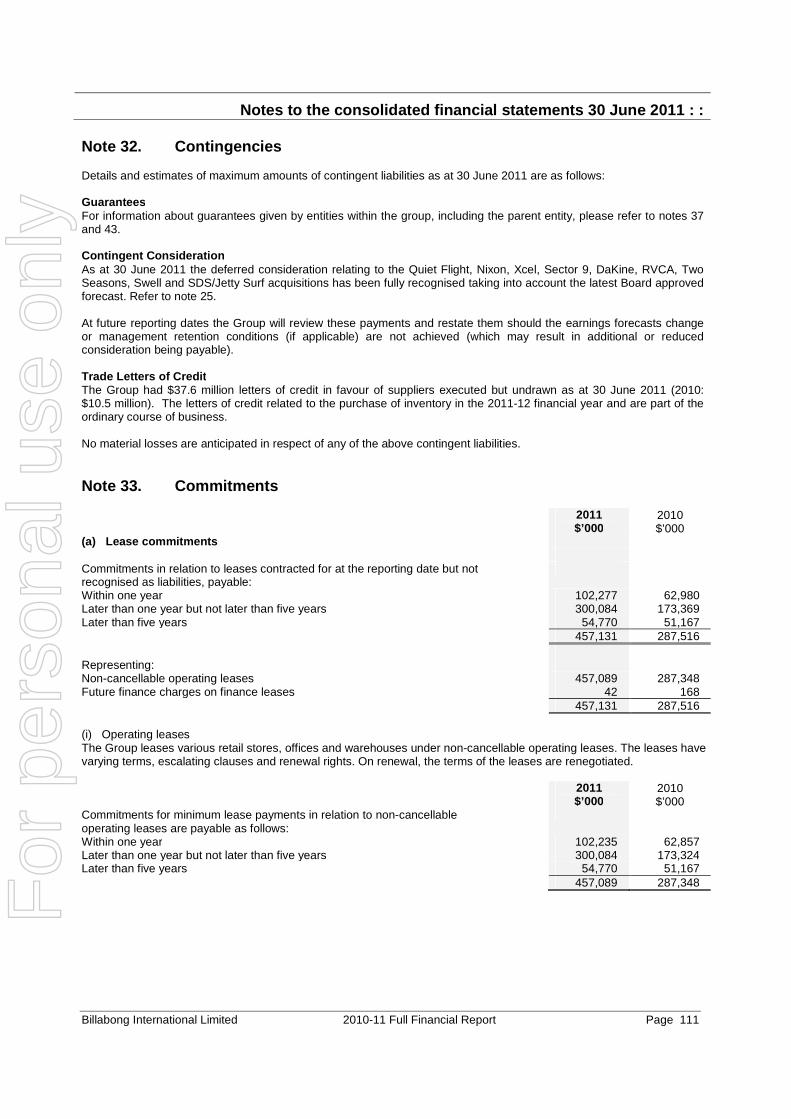
Notes to the consolidated financial statements 30 J une 2011 : :
Billabong International Limited 2010-11 Full Financial Report Page 111
Note 32. Contingencies Details and estimates of maximum amounts of contingent liabilities as at 30 June 2011 are as follows: Guarantees For information about guarantees given by entities within the group, including the parent entity, please refer to notes 37 and 43. Contingent Consideration As at 30 June 2011 the deferred consideration relating to the Quiet Flight, Nixon, Xcel, Sector 9, DaKine, RVCA, Two Seasons, Swell and SDS/Jetty Surf acquisitions has been fully recognised taking into account the latest Board approved forecast. Refer to note 25. At future reporting dates the Group will review these payments and restate them should the earnings forecasts change or management retention conditions (if applicable) are not achieved (which may result in additional or reduced consideration being payable). Trade Letters of Credit The Group had $37.6 million letters of credit in favour of suppliers executed but undrawn as at 30 June 2011 (2010: $10.5 million). The letters of credit related to the purchase of inventory in the 2011-12 financial year and are part of the ordinary course of business. No material losses are anticipated in respect of any of the above contingent liabilities. Note 33. Commitments 2011
$’000 2010 $’000
(a) Lease commitments Commitments in relation to leases contracted for at the reporting date but not recognised as liabilities, payable:
Within one year 102,277 62,980 Later than one year but not later than five years 300,084 173,369 Later than five years 54,770 51,167 457,131 287,516 Representing: Non-cancellable operating leases 457,089 287,348 Future finance charges on finance leases 42 168 457,131 287,516 (i) Operating leases The Group leases various retail stores, offices and warehouses under non-cancellable operating leases. The leases have varying terms, escalating clauses and renewal rights. On renewal, the terms of the leases are renegotiated. 2011
$’000 2010 $’000
Commitments for minimum lease payments in relation to non-cancellable operating leases are payable as follows:
Within one year 102,235 62,857 Later than one year but not later than five years 300,084 173,324 Later than five years 54,770 51,167 457,089 287,348
For
per
sona
l use
onl
y

Notes to the consolidated financial statements 30 J une 2011 : :
Billabong International Limited 2010-11 Full Financial Report Page 112
Note 33. Commitments (continued) (a) Lease commitments (continued) (ii) Finance leases The Group leases various plant and equipment with a carrying amount of $4.2 million (2010: $5.1 million). 2011
$’000 2010 $’000
Commitments in relation to finance leases are payable as follows: Within one year 1,267 1,499 Later than one year but not later than five years 16 1,368 Later than five years --- --- Minimum lease payments 1,283 2,867 Future finance charges (42) (168) Total lease liabilities recognised as a liability 1,241 2,699 Representing lease liabilities: Current (note 19) 1,225 1,376 Non-current (note 22) 16 1,323 1,241 2,699 The present value of finance lease liabilities is as follows: Within one year 1,225 1,376 Later than one year but not later than five years 16 1,323 Later than five years --- --- Minimum lease payments 1,241 2,699 2011
$’000 2010 $’000
(b) Contests and athletes Commitments in relation to sponsorship of athletes and contests are payable as follows:
Within one year 16,112 13,144 Later than one year but not later than five years 11,970 15,536 28,082 28,680 (c) Remuneration commitments Employment contracts for key management personnel do not have a fixed end date and therefore have not been included in the above note. Note 34. Related party transactions (a) Parent entities The ultimate parent entity within the Group is Billabong International Limited. (b) Subsidiaries Interests in subsidiaries are set out in note 36. (c) Key management personnel Disclosures relating to key management personnel are set out in note 30.
For
per
sona
l use
onl
y
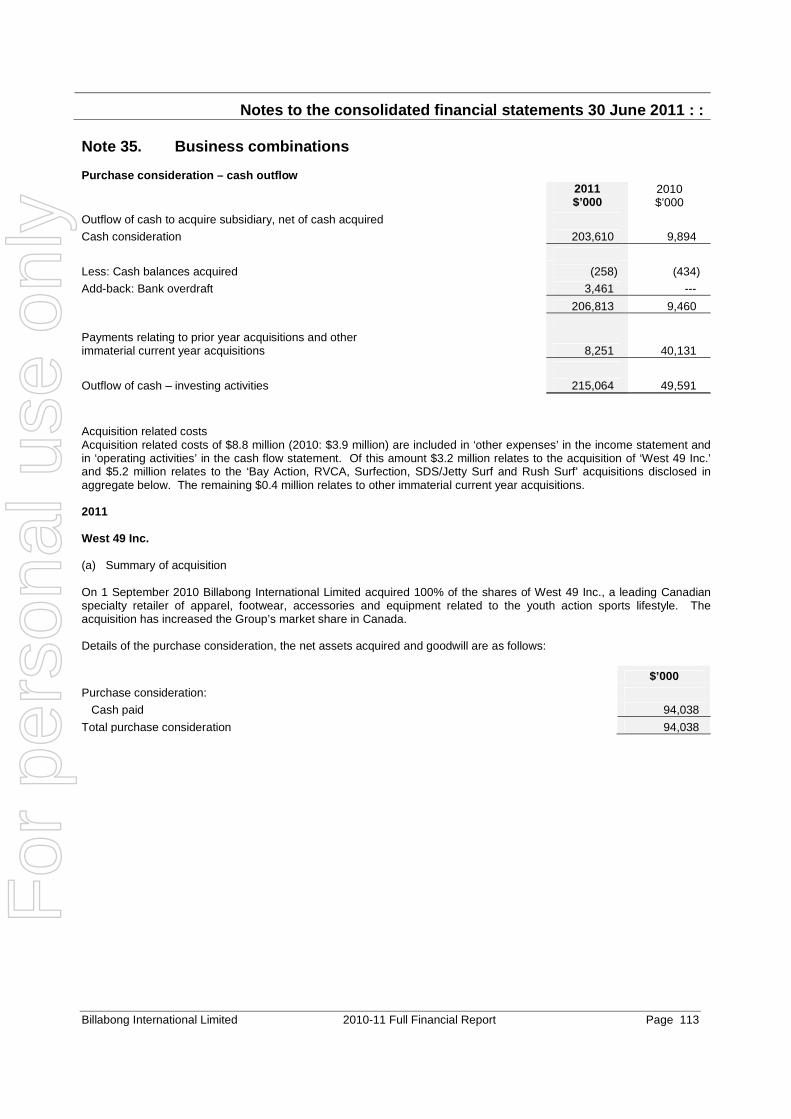
Notes to the consolidated financial statements 30 J une 2011 : :
Billabong International Limited 2010-11 Full Financial Report Page 113
Note 35. Business combinations Purchase consideration – cash outflow 2011
$’000 2010 $’000
Outflow of cash to acquire subsidiary, net of cash acquired
Cash consideration 203,610 9,894
Less: Cash balances acquired (258) (434)
Add-back: Bank overdraft 3,461 ---
206,813 9,460
Payments relating to prior year acquisitions and other immaterial current year acquisitions 8,251 40,131
Outflow of cash – investing activities 215,064 49,591
Acquisition related costs Acquisition related costs of $8.8 million (2010: $3.9 million) are included in ‘other expenses’ in the income statement and in ‘operating activities’ in the cash flow statement. Of this amount $3.2 million relates to the acquisition of ‘West 49 Inc.’ and $5.2 million relates to the ‘Bay Action, RVCA, Surfection, SDS/Jetty Surf and Rush Surf’ acquisitions disclosed in aggregate below. The remaining $0.4 million relates to other immaterial current year acquisitions. 2011 West 49 Inc. (a) Summary of acquisition On 1 September 2010 Billabong International Limited acquired 100% of the shares of West 49 Inc., a leading Canadian specialty retailer of apparel, footwear, accessories and equipment related to the youth action sports lifestyle. The acquisition has increased the Group’s market share in Canada. Details of the purchase consideration, the net assets acquired and goodwill are as follows: $’000 Purchase consideration: Cash paid 94,038
Total purchase consideration 94,038 F
or p
erso
nal u
se o
nly

Notes to the consolidated financial statements 30 J une 2011 : :
Billabong International Limited 2010-11 Full Financial Report Page 114
Note 35. Business combinations (continued) (a) Summary of acquisition (continued) The assets and liabilities recognised as a result of the acquisition are as follows:
Fair value
$’000 Other receivables 1,224
Inventory 36,590
Plant and equipment 19,894
Prepayments 704 Deferred tax assets 1,262
Bank overdrafts (3,461)
Trade and other payables (54,640)
Provision for contingent tax liabilities (19,581) Identifiable intangible assets 286
Net identifiable assets acquired (17,722)
Add: goodwill 111,760
Net assets acquired 94,038 Provision for contingent tax liabilities represents contingent liabilities recognised at fair value. The assessment of the amount of contingent tax liabilities involves the exercise of management judgements concerning potential future events. Goodwill is attributable to the workforce and synergies expected to arise after the acquisition of the business. The above accounting in regards to the ‘West 49 Inc.’ acquisition has been determined provisionally pending a review of the fair value of identifiable assets and liabilities. The acquired business contributed revenues of $152.8 million and net loss after tax (including $3.2 million of acquisition related costs) of $5.6 million to the Group for the period from acquisition to 30 June 2011. Bay Action, RVCA, Surfection, SDS/Jetty Surf and Ru sh Surf (a) Summary of acquisitions On 2 July 2010 GSM (Operations) Pty Ltd and Pineapple Trademarks Pty Ltd acquired the assets and certain liabilities of Bay Action Pty Ltd, Byron Concepts Pty Ltd, Big Kahoona Pty Ltd and the Timperley Partnership, a number of retail stores primarily featuring surf and related lifestyle apparel and accessories. The acquisition has increased the Group’s market share in the Australian retail sector. On 21 July 2010 Seal Trademarks Pty Ltd, GSM Add 2, Inc. and GSM Investments Ltd acquired the assets and certain liabilities of RVCA Corporation, RVCA Platform, LLC, VASF LLC and RVCA LA, LLC, a progressive art and design-driven brand. The acquisition has provided the opportunity to further expand the North American and international sales representation through the Group’s distribution network. On 23 September 2010 GSM (Operations) Pty Ltd acquired 50% of the issued share capital of Surfection Pty Ltd, a retail chain primarily featuring surf and related lifestyle apparel and accessories, and control of the entity through the acquisition of greater than 50% of the voting rights. The acquisition has increased the Group’s market share in the Australian retail sector. Surfection Pty Ltd has been fully consolidated from the date on which control was transferred to the Group. On 8 November 2010 Board Sports Retail Pty Ltd and Pineapple Trademarks Pty Ltd acquired the assets and certain liabilities of Jetty Surf Pty Ltd, a retail chain operating under the banners SDS and Jetty Surf, primarily featuring surf and related lifestyle apparel and accessories. The acquisition has increased the Group’s market share in the Australian retail sector.
For
per
sona
l use
onl
y

Notes to the consolidated financial statements 30 J une 2011 : :
Billabong International Limited 2010-11 Full Financial Report Page 115
Note 35. Business combinations (continued) (a) Summary of acquisitions (continued)
On 26 November 2010 GSM (Operations) Pty Ltd and Pineapple Trademarks Pty Ltd acquired the assets and certain liabilities of Rush Lifestyle Australia Pty Ltd, Rush Lifestyle Clothing Australia Pty Ltd and W R James Pty Ltd, a retail chain primarily featuring surf and related lifestyle apparel and accessories. The acquisition has increased the Group’s market share in the Australian retail sector. Details of the aggregated purchase consideration, the net assets acquired and goodwill are as follows: $’000 Purchase consideration: Cash paid 109,572 Deferred consideration 37,783
Contingent consideration 40,388
Total purchase consideration 187,743 The assets and liabilities recognised as a result of the acquisitions are as follows:
Fair value
$’000 Cash and cash equivalents 258 Trade and other receivables 6,200
Inventory 30,776
Plant and equipment 7,638
Prepayments 230 Deferred tax assets 5,428
Employee entitlements (1,248)
Trade and other payables (29,064)
Deferred tax liabilities (13) Identifiable intangible assets 30,293
Net identifiable assets acquired 50,498
Less: non-controlling interests (3,649) Add: goodwill 140,894
Net assets acquired 187,743 Goodwill is attributable to the workforce and synergies expected to arise after the acquisition of the businesses. Goodwill is only deductible in the United States of America for tax purposes. For acquisitions that occurred in the year ended 30 June 2011, up to $75.8 million will be deductible for tax purposes. The acquired businesses contributed revenues of $160.5 million and net profit after tax and non-controlling interests (including $5.2 million of acquisition related costs) of $5.2 million to the Group for the period from the date of each acquisition to 30 June 2011.
For
per
sona
l use
onl
y

Notes to the consolidated financial statements 30 J une 2011 : :
Billabong International Limited 2010-11 Full Financial Report Page 116
Note 35. Business combinations (continued) (a) Summary of acquisitions (continued) (i) Deferred and contingent consideration In relation to the acquisition of the assets and certain liabilities of RVCA Corporation, RVCA Platform, LLC, VASF LLC and RVCA LA, LLC, additional deferred and contingent consideration will be payable in cash on or after 1 July 2015 based on the earnings achieved for the year ending 30 June 2015. In relation to the acquisition of the assets and certain liabilities of Jetty Surf Pty Ltd, additional pre-determined deferred consideration will be payable in cash from 1 November 2013. As at their respective acquisition dates a present value amount totalling $78.2 million was recognised as a non-current deferred consideration liability for these acquisitions of which $37.8 million is deferred and $40.4 million is contingent consideration. The aggregated range of the contingent consideration is a minimum of nil and there is no prescribed maximum. (ii) Acquired receivables The fair value of acquired trade and other receivables is $7.4 million. The gross contractual amount of the acquired trade receivables is $9.9 million and an amount of $2.5 million is considered to be uncollectible as at the acquisition date. (iii) Non-controlling interests The Group elected to recognise the non-controlling interests for Surfection Pty Ltd at fair value. (iv) Revenue and profit contribution If the acquisitions had occurred on 1 July 2010, consolidated revenue and consolidated net profit after tax and non-controlling interests (including acquisition related costs) for the year ended 30 June 2011 would have been $1,770.5 million and $114.0 million respectively based on best estimates. 2010 (a) Summary of acquisitions On 1 November 2009 GSM Online Retail, Inc. and Seal Trademarks Pty Ltd acquired the assets and certain liabilities of Swell Commerce, Inc., a leading online retailer in the US boardsport sector. The acquisition has increased the Group’s market share in the US online boardsports retail sector. On 1 December 2009 GSM (Operations) Pty Ltd acquired 20% of the issued share capital of Surfstitch Pty Ltd, a leading Australian online boardsport retailer, and control of the entity through the acquisition of greater than 50% of the voting rights. The acquisition has increased the Group’s market share in the Australian online boardsports retail sector. Surfstitch Pty Ltd has been fully consolidated from the date on which control was transferred to the Group. GSM (Operations) Pty Ltd has put and call options to acquire the remaining 80% of the business. From 1 January 2010 GSM (Europe) Pty Ltd has acquired the DaKine distribution rights from distributors of DaKine products in Austria, Belgium, France, Germany and Luxembourg. GSM (Europe) Pty Ltd now has exclusive rights to distribute DaKine products in these countries. On 23 April 2010 GSM (Europe) Pty Ltd and GSM Czech Republic s.r.o. acquired the assets and certain liabilities of OTTY s.r.o. a company duly established and existing in accordance with the laws of the Czech Republic. The acquisition has increased the Group’s market share in Europe. On 1 May 2010 Billabong Retail, Inc. and Seal Trademarks Pty Ltd acquired the assets and certain liabilities of Becker Surf Boards, Inc., a US retail chain featuring surf and related lifestyle apparel and accessories. The acquisition has increased the Group’s market share in the US retail sector. Details of the aggregated purchase consideration, the net assets acquired and goodwill are as follows: $’000 Purchase consideration: Cash paid 9,894 Estimated cash payable 2,699 Contingent consideration 7,277
Total purchase consideration 19,870
For
per
sona
l use
onl
y
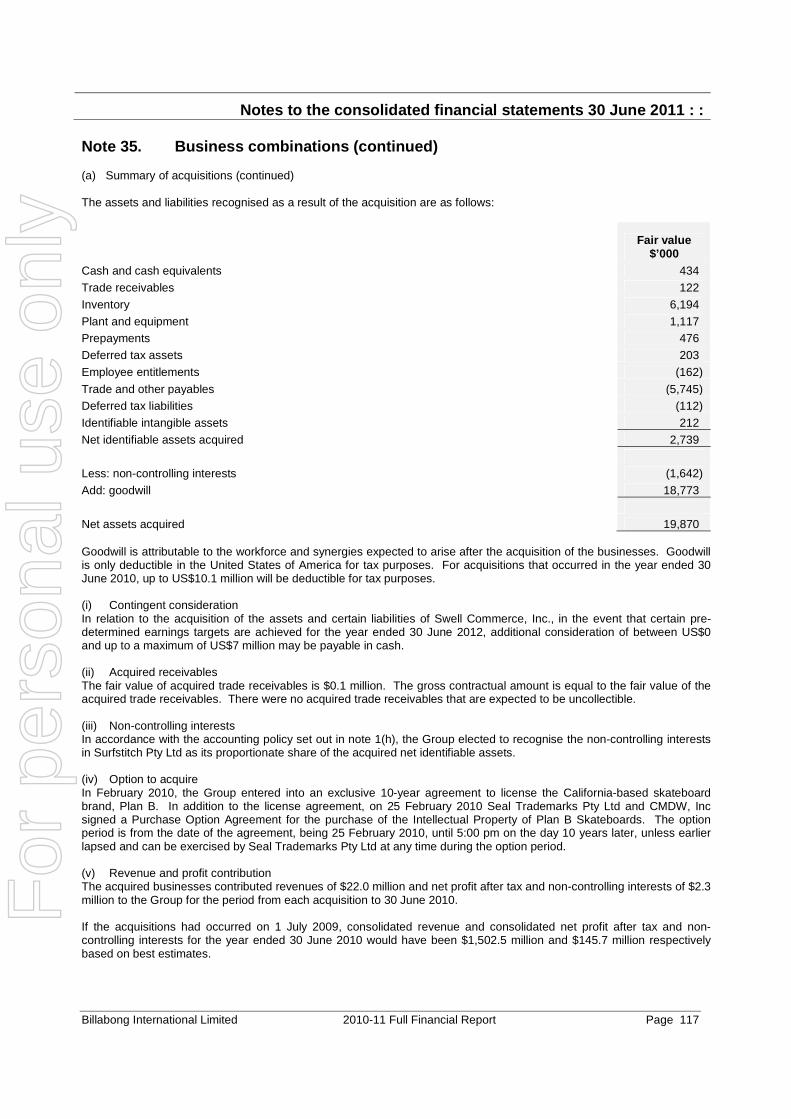
Notes to the consolidated financial statements 30 J une 2011 : :
Billabong International Limited 2010-11 Full Financial Report Page 117
Note 35. Business combinations (continued) (a) Summary of acquisitions (continued) The assets and liabilities recognised as a result of the acquisition are as follows:
Fair value
$’000 Cash and cash equivalents 434
Trade receivables 122
Inventory 6,194
Plant and equipment 1,117 Prepayments 476
Deferred tax assets 203
Employee entitlements (162)
Trade and other payables (5,745) Deferred tax liabilities (112)
Identifiable intangible assets 212
Net identifiable assets acquired 2,739
Less: non-controlling interests (1,642)
Add: goodwill 18,773
Net assets acquired 19,870 Goodwill is attributable to the workforce and synergies expected to arise after the acquisition of the businesses. Goodwill is only deductible in the United States of America for tax purposes. For acquisitions that occurred in the year ended 30 June 2010, up to US$10.1 million will be deductible for tax purposes. (i) Contingent consideration In relation to the acquisition of the assets and certain liabilities of Swell Commerce, Inc., in the event that certain pre-determined earnings targets are achieved for the year ended 30 June 2012, additional consideration of between US$0 and up to a maximum of US$7 million may be payable in cash. (ii) Acquired receivables The fair value of acquired trade receivables is $0.1 million. The gross contractual amount is equal to the fair value of the acquired trade receivables. There were no acquired trade receivables that are expected to be uncollectible. (iii) Non-controlling interests In accordance with the accounting policy set out in note 1(h), the Group elected to recognise the non-controlling interests in Surfstitch Pty Ltd as its proportionate share of the acquired net identifiable assets. (iv) Option to acquire In February 2010, the Group entered into an exclusive 10-year agreement to license the California-based skateboard brand, Plan B. In addition to the license agreement, on 25 February 2010 Seal Trademarks Pty Ltd and CMDW, Inc signed a Purchase Option Agreement for the purchase of the Intellectual Property of Plan B Skateboards. The option period is from the date of the agreement, being 25 February 2010, until 5:00 pm on the day 10 years later, unless earlier lapsed and can be exercised by Seal Trademarks Pty Ltd at any time during the option period. (v) Revenue and profit contribution The acquired businesses contributed revenues of $22.0 million and net profit after tax and non-controlling interests of $2.3 million to the Group for the period from each acquisition to 30 June 2010. If the acquisitions had occurred on 1 July 2009, consolidated revenue and consolidated net profit after tax and non-controlling interests for the year ended 30 June 2010 would have been $1,502.5 million and $145.7 million respectively based on best estimates.
For
per
sona
l use
onl
y
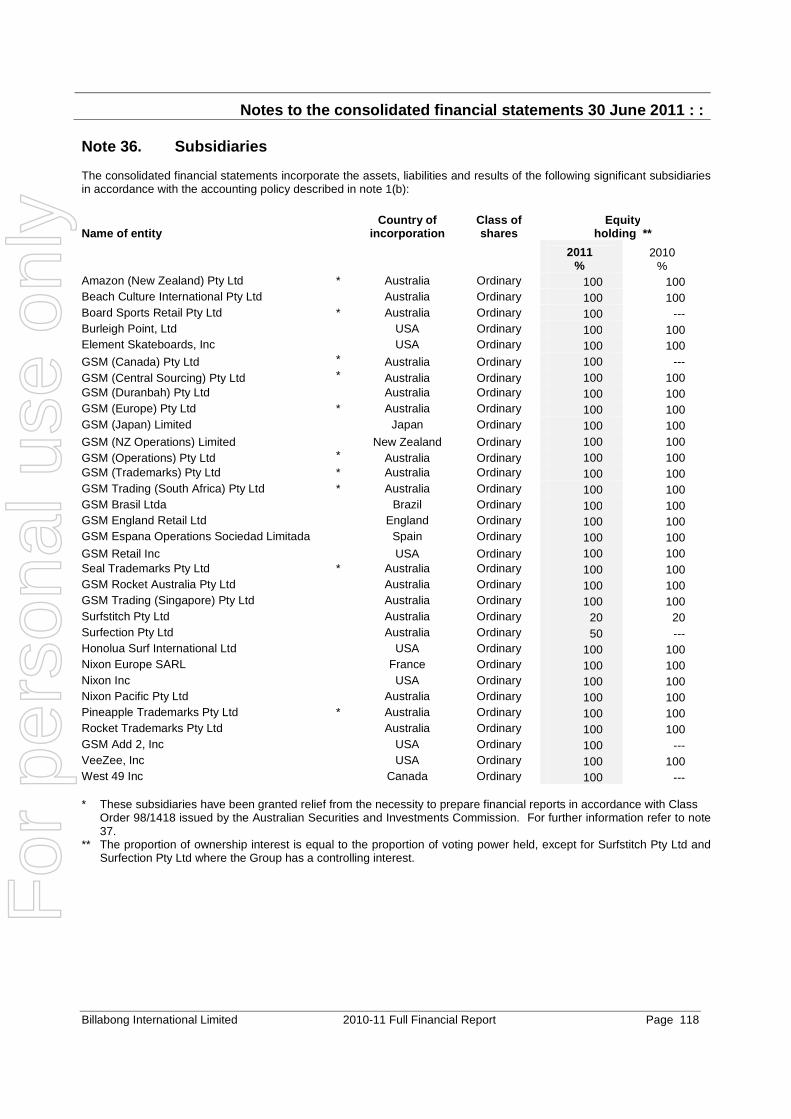
Notes to the consolidated financial statements 30 J une 2011 : :
Billabong International Limited 2010-11 Full Financial Report Page 118
Note 36. Subsidiaries The consolidated financial statements incorporate the assets, liabilities and results of the following significant subsidiaries in accordance with the accounting policy described in note 1(b):
Name of entity
Country of incorporation
Class of shares
Equity holding **
2011
% 2010
% Amazon (New Zealand) Pty Ltd * Australia Ordinary 100 100 Beach Culture International Pty Ltd Australia Ordinary 100 100 Board Sports Retail Pty Ltd * Australia Ordinary 100 --- Burleigh Point, Ltd USA Ordinary 100 100 Element Skateboards, Inc USA Ordinary 100 100 GSM (Canada) Pty Ltd * Australia Ordinary 100 --- GSM (Central Sourcing) Pty Ltd * Australia Ordinary 100 100 GSM (Duranbah) Pty Ltd Australia Ordinary 100 100 GSM (Europe) Pty Ltd * Australia Ordinary 100 100 GSM (Japan) Limited Japan Ordinary 100 100 GSM (NZ Operations) Limited New Zealand Ordinary 100 100 GSM (Operations) Pty Ltd * Australia Ordinary 100 100 GSM (Trademarks) Pty Ltd * Australia Ordinary 100 100 GSM Trading (South Africa) Pty Ltd * Australia Ordinary 100 100 GSM Brasil Ltda Brazil Ordinary 100 100 GSM England Retail Ltd England Ordinary 100 100 GSM Espana Operations Sociedad Limitada Spain Ordinary 100 100 GSM Retail Inc USA Ordinary 100 100 Seal Trademarks Pty Ltd * Australia Ordinary 100 100 GSM Rocket Australia Pty Ltd Australia Ordinary 100 100 GSM Trading (Singapore) Pty Ltd Australia Ordinary 100 100 Surfstitch Pty Ltd Australia Ordinary 20 20 Surfection Pty Ltd Australia Ordinary 50 --- Honolua Surf International Ltd USA Ordinary 100 100 Nixon Europe SARL France Ordinary 100 100 Nixon Inc USA Ordinary 100 100 Nixon Pacific Pty Ltd Australia Ordinary 100 100 Pineapple Trademarks Pty Ltd * Australia Ordinary 100 100 Rocket Trademarks Pty Ltd Australia Ordinary 100 100 GSM Add 2, Inc USA Ordinary 100 --- VeeZee, Inc USA Ordinary 100 100 West 49 Inc Canada Ordinary 100 --- * These subsidiaries have been granted relief from the necessity to prepare financial reports in accordance with Class
Order 98/1418 issued by the Australian Securities and Investments Commission. For further information refer to note 37.
** The proportion of ownership interest is equal to the proportion of voting power held, except for Surfstitch Pty Ltd and Surfection Pty Ltd where the Group has a controlling interest.
For
per
sona
l use
onl
y

Notes to the consolidated financial statements 30 J une 2011 : :
Billabong International Limited 2010-11 Full Financial Report Page 119
Note 37. Deed of cross guarantee Billabong International Limited, GSM (Europe) Pty Ltd, GSM (Operations) Pty Ltd, GSM (Trademarks) Pty Ltd, Pineapple Trademarks Pty Ltd, GSM (Central Sourcing) Pty Ltd, Amazon (New Zealand) Pty Ltd, GSM Trading (South Africa) Pty Ltd, Board Sports Retail Pty Ltd, Seal Trademarks Pty Ltd and GSM (Canada) Pty Ltd are parties to a deed of cross guarantee under which each company guarantees the debts of the others. By entering into the deed, the wholly-owned entities have been relieved from the requirement to prepare a financial report and Directors’ report under Class Order 98/1418 (as amended) issued by the Australian Securities and Investments Commission. (a) Consolidated income statement, statement of com prehensive income and summary of movements in consolidated retained profits The above companies represent a ‘Closed Group’ for the purposes of the Class Order. Set out below are the condensed consolidated income statement, a consolidated statement of comprehensive income and a summary of movements in consolidated retained profits for the year ended 30 June 2011 of the Closed Group, consisting of Billabong International Limited, GSM (Europe) Pty Ltd, GSM (Operations) Pty Ltd, GSM (Trademarks) Pty Ltd, Pineapple Trademarks Pty Ltd, GSM (Central Sourcing) Pty Ltd, Amazon (New Zealand) Pty Ltd, GSM Trading (South Africa) Pty Ltd, Board Sports Retail Pty Ltd, Seal Trademarks Pty Ltd and GSM (Canada) Pty Ltd. Prior year figures set out below represent the condensed consolidated income statement, a consolidated statement of comprehensive income and a summary of movements in consolidated retained profits for the year ended 30 June 2010 of the Closed Group, at that time consisting of the entities Billabong International Limited, GSM (Europe) Pty Ltd, GSM (Operations) Pty Ltd, GSM (Trademarks) Pty Ltd, Pineapple Trademarks Pty Ltd, Rocket Trademarks Pty Ltd, GSM (Central Sourcing) Pty Ltd, Amazon (New Zealand) Pty Ltd and GSM Trading (South Africa) Pty Ltd. 2011
$’000 2010 $’000
Income statement Revenue from continuing operations 838,542 890,952 Other income 2,906 3,603 Finance costs (20,739) (9,786) Other expenses (687,046) (656,248) Profit before income tax 133,663 228,521 Income tax expense (33,020) (43,803) Profit for the year 100,643 184,718 Loss attributable to non-controlling interests 1,094 822 Profit for the year attributable to the members of the closed group 101,737 185,540 Statement of comprehensive income Profit for the year 100,643 184,718 Other comprehensive income Changes in the fair value of cash flow hedges, net of tax (3,340) 7,690 Exchange differences on translation of foreign operations (25,597) (26,703) Net investment hedge, net of tax (10,420) (7,940) Other comprehensive income for the year, net of tax (39,357) (26,953) Total comprehensive income for the year 61,286 157,765 Loss attributable to non-controlling interests 1,094 822 Total comprehensive income for the year attributabl e to members of the closed group
62,380
158,587
Summary of movements in consolidated retained profi ts
Retained profits at the beginning of the financial year 472,456 452,178 Profit for the year 101,737 185,540 Dividends paid (86,140) (90,878) Retained profits at the end of the financial year 488,053 546,840
For
per
sona
l use
onl
y

Notes to the consolidated financial statements 30 J une 2011 : :
Billabong International Limited 2010-11 Full Financial Report Page 120
Note 37. Deed of cross guarantee (continued) (b) Balance sheet Set out below is a consolidated balance sheet as at 30 June 2011 and 30 June 2010 of the Closed Group, consisting of the entities as named above at each point in time. 2011
$’000 2010 $’000
ASSETS Current assets
Cash and cash equivalents 82,918 108,404 Trade and other receivables 199,650 174,131 Inventories 156,537 99,179 Current tax receivables 1,947 --- Other 9,940 12,516
Total current assets 450,992 394,230 Non-current assets
Receivables 205,271 297,963 Other financial assets 490,440 539,276 Property, plant and equipment 53,102 56,131 Intangible assets 292,767 187,687 Deferred tax assets 16,327 17,623 Other 5,297 2,251
Total non-current assets 1,063,204 1,100,931 Total assets 1,514,196 1,495,161 LIABILITIES Current liabilities
Trade and other payables 135,005 109,931 Borrowings 1,161 1,294 Current tax liabilities --- 11,143 Provisions 6,006 5,238
Total current liabilities 142,172 127,606 Non-current liabili ties
Borrowings 245,511 162,573 Deferred tax liabilities 10,337 9,635 Provisions 2,935 2,806 Other 27,088 11,361
Total non-current liabilities 285,871 186,375 Total liabilities 428,043 313,981 Net assets 1,086,153 1,181,180 EQUITY
Contributed equity 678,949 671,761 Reserves (84,224) (38,241) Retained profits 488,053 546,840 Capital and reserves attributable to members of the closed group
1,082,778
1,180,360
Non-controlling interests 3,375 820
Total equity 1,086,153 1,181,180
For
per
sona
l use
onl
y

Notes to the consolidated financial statements 30 J une 2011 : :
Billabong International Limited 2010-11 Full Financial Report Page 121
Note 38. Events occurring after the balance sheet d ate On 3 August 2011 the majority of the deferred consideration payment in relation to Nixon was paid with the remaining amount outstanding subject to the finalisation of a review of the taxation treatment of the payment in the hands of the recipients. The remaining amount outstanding is expected to be paid within the next year and other than this amount no further amounts are due in relation to this acquisition. Other than the item mentioned above, there has not arisen in the interval between the end of the financial year and the date of this report any item, transaction or event of a material and unusual nature likely, in the opinion of the Directors of the Group, to affect significantly the operations of the Group, the results of those operations, or the state of affairs of the Group, in future financial years. Note 39. Reconciliation of profit for the year to n et cash inflow from operating
activities
2011 $’000
2010 $’000
Profit for the year, before non-controlling interests 118,045 145,166 Depreciation and amortisation 41,931 35,572 Share-based payment amortisation expense 5,892 5,325 Provisions: unwinding of discount 4,620 2,807 Net loss on sale of non-current assets 699 628 Gain from adjustment to contingent consideration (1,011) --- Fair value adjustment to derivative liabilities (1,521) --- Net exchange differences (1,469) (1,401) Change in operating assets and liabilities, excluding effects from business combinations:
(Increase)/decrease in trade debtors 9,440 (46,174) (Increase)/decrease in inventories (69,087) 2,002 (Increase)/decrease in deferred tax assets (16,002) (6,015) (Increase)/decrease in provision for income taxes receivable (12,096) 9,370 (Increase)/decrease in other operating assets (34,006) 21,709 Increase/(decrease) in trade creditors and other operating liabilities (19,800) 6,468 Increase/(decrease) in provision for income taxes payable (5,031) 9,142 Increase/(decrease) in deferred tax liabilities 898 4,356 Increase/(decrease) in other provisions 2,834 (1,708) Net cash inflow from operating activities 24,336 187,247 Note 40. Non-cash investing and financing activitie s 2011
$’000 2010 $’000
Acquisition of plant and equipment by means of finance lease 56 22 56 22 Dividends satisfied by the issue of shares under the Dividend Reinvestment Plan are shown in note 28.
For
per
sona
l use
onl
y
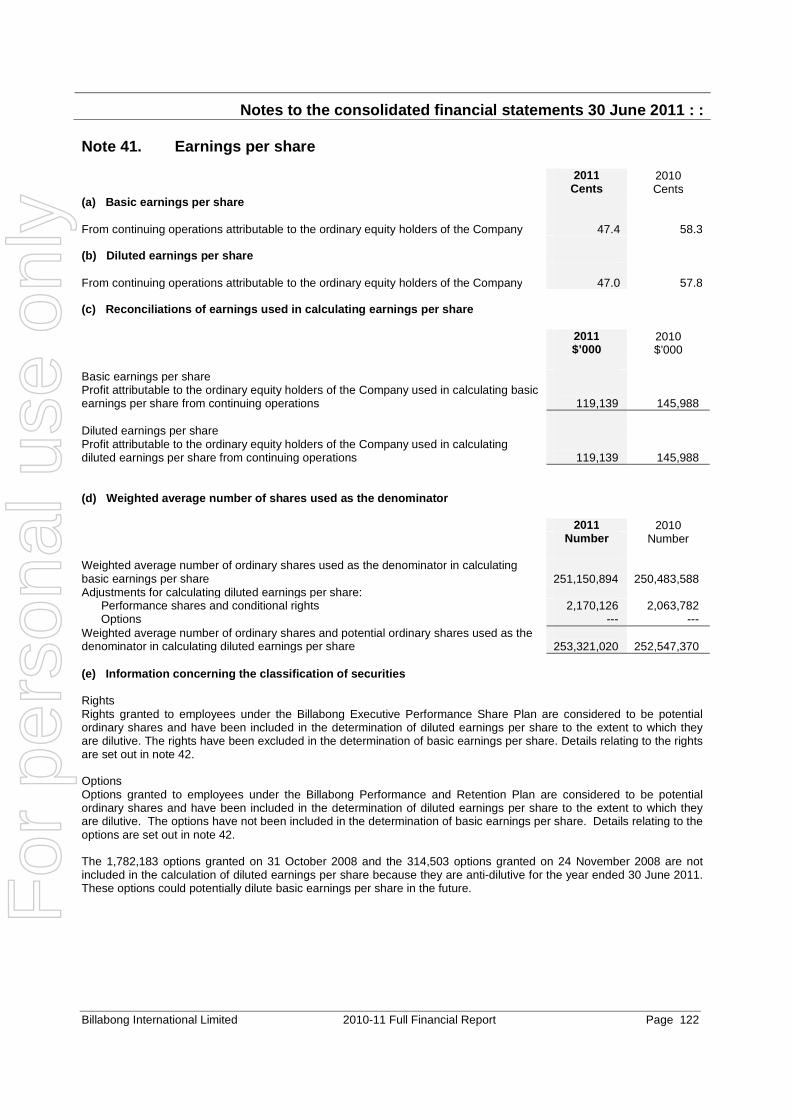
Notes to the consolidated financial statements 30 J une 2011 : :
Billabong International Limited 2010-11 Full Financial Report Page 122
Note 41. Earnings per share
2011 2010 Cents Cents
(a) Basic earnings per share
From continuing operations attributable to the ordinary equity holders of the Company 47.4 58.3
(b) Diluted earnings p er share
From continuing operations attributable to the ordinary equity holders of the Company 47.0 57.8
(c) Reconciliations of earnings used in calculati ng earnings per share 2011
$’000 2010 $’000
Basic earnings per share Profit attributable to the ordinary equity holders of the Company used in calculating basic earnings per share from continuing operations
119,139
145,988
Diluted earnings per share Profit attributable to the ordinary equity holders of the Company used in calculating diluted earnings per share from continuing operations
119,139
145,988
(d) Weighted average number of shares used as the denominator
2011 2010 Number Number Weighted average number of ordinary shares used as the denominator in calculating basic earnings per share
251,150,894
250,483,588
Adjustments for calculating diluted earnings per share: Performance shares and conditional rights 2,170,126 2,063,782 Options --- --- Weighted average number of ordinary shares and potential ordinary shares used as the denominator in calculating diluted earnings per share
253,321,020
252,547,370
(e) Information concerning the classification of securities Rights Rights granted to employees under the Billabong Executive Performance Share Plan are considered to be potential ordinary shares and have been included in the determination of diluted earnings per share to the extent to which they are dilutive. The rights have been excluded in the determination of basic earnings per share. Details relating to the rights are set out in note 42. Options Options granted to employees under the Billabong Performance and Retention Plan are considered to be potential ordinary shares and have been included in the determination of diluted earnings per share to the extent to which they are dilutive. The options have not been included in the determination of basic earnings per share. Details relating to the options are set out in note 42. The 1,782,183 options granted on 31 October 2008 and the 314,503 options granted on 24 November 2008 are not included in the calculation of diluted earnings per share because they are anti-dilutive for the year ended 30 June 2011. These options could potentially dilute basic earnings per share in the future.
For
per
sona
l use
onl
y

Notes to the consolidated financial statements 30 J une 2011 : :
Billabong International Limited 2010-11 Full Financial Report Page 123
Note 42. Share-based payments (a) Billabong Executive Performance Share Plan (E PSP) Following the review of executive remuneration undertaken by the Committee in 2008, the EPSP was restructured into Tier 1 and Tier 2. EPSP – Tier 1 Tier 1 participants comprise the executives of the Group who are directly responsible for driving the growth strategy of the Group. The objectives of the EPSP for Tier 1 participants remain the same i.e. to provide executives with an equity-based reward opportunity that vests based on the Group’s three year EPS performance. The establishment of the EPSP was approved by shareholders at the 2004 Annual General Meeting. Under the EPSP the Group awards the following equity subject to the tax implications in the relevant jurisdiction.
Equity vehicle Overview Tier 1 Performance shares
An employee awarded performance shares is not legally entitled to shares in the Company before the performance shares allocated under the EPSP vest. However, the employee can vote and receive dividends in respect of shares allocated to them. For Australian employees, once the shares have vested they remain in the trust until the earlier of the employee leaving the Group, the tenth anniversary of the date the performance shares were awarded or the Board approving an application for their release. For non-Australian employees, once their performance shares vest the shares are transferred to them (or sold on their behalf if they choose). However, if the performance shares do not vest, they are forfeited by the employee for no consideration.
Tier 1 Conditional rights
An employee awarded conditional rights is not legally entitled to shares in the Company before the rights allocated under the EPSP vest. Once vested, each right entitles the employee to receive one share in the Company. For French employees granted rights after 1 July 2005, shares associated with vested rights are automatically transferred to the employee. These shares cannot be disposed of before the end of a 24 month restriction period following the allocation date, except in the event of death. Until such time that the rights have vested the employee cannot use the rights to vote or receive dividends. For all other employees, from the time of the employee receiving notice of the rights having vested they have one month to exercise the rights and either sell the shares or transfer them into their name. If the rights are not exercised by the employee they will automatically exercise and the shares will be transferred to the employee. Until such time that the rights are exercised the employee cannot use the rights to vote or receive dividends. However, if the conditional rights do not vest they are forfeited by the employee for no consideration.
Note that for the purposes of the remuneration tables in this report, performance shares and conditional rights are collectively referred to as “rights”. Award, vesting and exercises under the EPSP are made for no consideration.
For
per
sona
l use
onl
y

Notes to the consolidated financial statements 30 J une 2011 : :
Billabong International Limited 2010-11 Full Financial Report Page 124
Note 42. Share-based payments (continued) (a) Billabong Executive Performance Share Plan (E PSP) (continued) Awards under the EPSP vest on the third anniversary of grant only if the EPS performance hurdles are satisfied in the relevant performance period. The performance periods are summarised in the table below:
Grant Performance period
2008-09 2007-08 (base year EPS) to 2010-11
2009-10 2008-09 (base year EPS) to 2011-12
2010-11 2009-10 (base year EPS) to 2012-13
The following chart summarises the EPS performance hurdles for outstanding unvested grants and the grants made in financial years ended 30 June 2008 and 30 June 2009 (which vested following the close of the financial years ended 30 June 2010 and 30 June 2011 respectively).
The Board selected EPS as the appropriate hurdle for the EPSP as the EPSP is intended to focus executives on the long-term (three year) earnings performance of the Group. Each year, prior to awards being granted, the Human Resource and Remuneration Committee considers the market environment, the Group’s business strategy and performance expectations and shareholder expectations and sets the performance targets for the awards to be granted that year. Due to the growth of the Group and the challenges of maintaining the high growth rate of earnings from a resulting higher EPS base, the targets set at grant differ for each of the 2007-08, 2008-09, 2009-10 and 2010-11 grants. Details of the awards to Executive Directors, Derek O’Neill and Paul Naude, in the 2011-12 financial year will be set out for shareholder approval in the Notice of Meeting and Explanatory Memorandum for the Company’s 2011 Annual General Meeting. At the end of the relevant performance period, in line with its charter, the Human Resource and Remuneration Committee consider the EPS performance of the Group on an as reported basis and determines to what extent the awards should vest based on the above vesting conditions.
EPSP performance hurdle summary
50%
75%
50%
60%
100%
120%
50%
100%
120%
100%
20%
40%
60%
80%
100%
120%
6.0% 8.0% 10.0% 12.5% 15.0% 17.5% 20.0%
Compound EPS growth per annum
% o
f aw
ards
ves
ting
Stretch performance component (FY08 & FY09)
awards onlyFY10 & FY11
FY09 FY08
For
per
sona
l use
onl
y

Notes to the consolidated financial statements 30 J une 2011 : :
Billabong International Limited 2010-11 Full Financial Report Page 125
Note 42. Share-based payments (continued) (a) Billabong Executive Performance Share Plan (E PSP) (continued) EPSP - Tier 2 Tier 2 participants comprise other senior management of the Group, including one of the key management personnel, President, Element Skateboards, Inc. The primary objective of the Tier 2 EPSP is retention. Under the EPSP, Tier 2 participants are awarded performance shares and conditional rights. The awards do not vest unless the employee has completed a period of two years of employment from the date the awards are granted. The Group awards the following equity subject to the tax implications in the relevant jurisdiction:
Equity vehicle Overview Tier 2 Performance shares
An employee awarded performance shares is not legally entitled to shares in the Company before the performance shares allocated under the EPSP vest. However, the employee can vote and receive dividends in respect of shares allocated to them. Once the shares have vested the shares are transferred to the employee. However, if the performance shares do not vest they are forfeited for no consideration.
Tier 2 Conditional rights
An employee awarded conditional rights is not legally entitled to shares in the Company before the rights allocated under the EPSP vest. Once vested, each right entitles the employee to receive one share in the Company. Until such time that the rights are exercised the employee cannot use the rights to vote or receive dividends. However, if the conditional rights do not vest they are forfeited for no consideration.
Set out below is a summary of equity based rights (performance shares and conditional rights) awarded under the EPSP:
Type of right
Grant date
Performance determination
date
Balance at start of
year Number
Granted during
the year Number
Exercised during the
year Number
Expired during the
year Number
Balance at end of
year Number
2011 Performance Shares 1 November 2007 30 June 2013 1,827,619 981,262 (310,802) (684,503) 1,813,576 Conditional Rights 1 November 2007 30 June 2013 364,814 232,494 (70,398) (132,125) 394,785
2,192,433 1,213,756 (381,200) (816,628) 2,208,361
2010 Performance Shares 1 October 2006 30 June 2012 1,538,680 716,143 --- (427,204) 1,827,619 Conditional Rights 1 October 2006 30 June 2012 288,155 156,269 --- (79,610) 364,814
1,826,835 872,412 --- (506,814) 2,192,433 None of the rights awarded under the EPSP vested or became exercisable during the year. The total equity based rights that expired during the year ended 30 June 2011 and have not yet been granted under a new award was 196,190 (2010: 23,318). These expired equity based rights are held pending in the EPSP until further awards are made. Fair value of rights granted The assessed fair value at grant date of rights granted under the EPSP during the year ended 30 June 2011 was $7.80 per right (2010: $10.51). The fair value at grant date is determined by reference to the Billabong International Limited share price at grant date, taking into account the terms and conditions upon which the rights were granted, the expected dividend yield and the expected price volatility of the underlying share.
For
per
sona
l use
onl
y

Notes to the consolidated financial statements 30 J une 2011 : :
Billabong International Limited 2010-11 Full Financial Report Page 126
Note 42. Share-based payments (continued) (b) Billabong Executive Performance and Retention Plan (EPRP) The establishment of the EPRP was approved at the Annual General Meeting of the Company held on 28 October 2008. The EPRP is designed to retain and effectively reward key senior executives over a five year period for growing the market value of the Group and delivering returns to shareholders. Under the EPRP, the executive team are granted options. The options will only vest if certain performance hurdles are met and if the individual is still employed by the Group at the end of the vesting period. Vesting of the options is subject to the Company’s Total Shareholder Return (TSR) performance. TSR measures growth in the Company’s share price, together with the value of dividends received during the relevant period. Two TSR performance hurdles must be achieved in order for awards to vest: • A 'gateway' relative TSR hurdle of above median of a comparator group of companies over the five year performance
period, measured from start of performance period to end of year five; and • Absolute TSR hurdle with a 120% target (equivalent to approximately 12.8% share price growth per annum over five
years) to be achieved at any point over the five year performance period. The comparator group for the relative TSR comparator group is the constituents of the S&P/ASX 100 Index at the start of the performance period (excluding companies in the Global Industry Classification Standard (GICS) name codes: ‘Oil, Gas and Consumable Fuels’ and ‘Metals and Mining’). The use of a relative TSR hurdle gateway directly aligns executive reward and shareholder return by ensuring that executives are only rewarded for the absolute TSR performance if they are also in the "top half" of ASX 100 (excluding certain GICS industries) performers at the time performance is tested. The use of the stretch absolute TSR performance target focuses executives on significantly growing the business in line with the strategic plan and generating strong returns for shareholders. An early banking opportunity is also provided to executives where the absolute and relative performance hurdles are satisfied. However, in order for the options to vest the continued employment condition must be satisfied. The banking approach allows for executives to be rewarded for “early” high TSR performance. However, due to the continued employment requirement and the delivery vehicle being options, the EPRP encourages sustained share price performance throughout the five year period and enhances the retention impact of the awards. The performance hurdles and the early banking opportunities are summarised in the table below: Date Year 3 test
30 June 2011 Year 4 test
30 June 2012 Year 5 test
30 June 2013 Absolute TSR
80% TSR achieved at any time during the prior three years.
100% TSR achieved at any time during the prior four years.
120% TSR achieved at any time during the prior five years.
Relative TSR
Above median TSR performance achieved against comparator group of companies.
Above median TSR performance achieved against comparator group of companies.
Above median TSR performance achieved against comparator group of companies.
Banking 1/3 of total options. 2/3 of total options. All options earned.
Once vested the options remain exercisable for a period of two years. Options granted under the EPRP carry no dividend or voting rights. When exercisable each option is convertible into one ordinary share upon receipt of funds. The exercise price of options is based on the weighted average price at which the Company's shares are traded on the Australian Securities Exchange during the five trading days immediately before the options are granted. Amounts received on the exercise of options are recognised as share capital.
For
per
sona
l use
onl
y
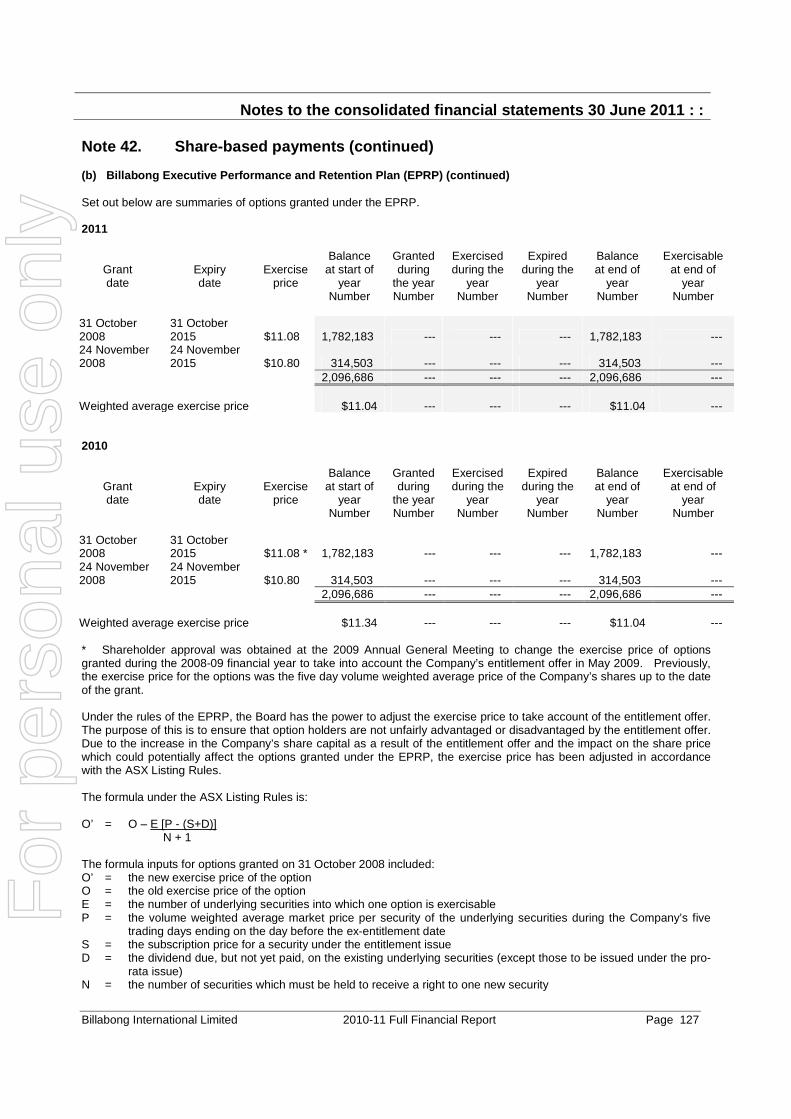
Notes to the consolidated financial statements 30 J une 2011 : :
Billabong International Limited 2010-11 Full Financial Report Page 127
Note 42. Share-based payments (continued) (b) Billabong Executive Performance and Retention Plan (EPRP) (continued) Set out below are summaries of options granted under the EPRP. 2011
Grant date
Expiry date
Exercise price
Balance at start of
year Number
Granted during
the year Number
Exercised during the
year Number
Expired during the
year Number
Balance at end of
year Number
Exercisable at end of
year Number
31 October 2008
31 October 2015
$11.08 1,782,183 --- --- --- 1,782,183 ---
24 November 2008
24 November 2015
$10.80 314,503 --- --- --- 314,503 ---
2,096,686 --- --- --- 2,096,686 --- Weighted average exercise price $11.04 --- --- --- $11.04 --- 2010
Grant date
Expiry date
Exercise price
Balance at start of
year Number
Granted during
the year Number
Exercised during the
year Number
Expired during the
year Number
Balance at end of
year Number
Exercisable at end of
year Number
31 October 2008
31 October 2015
$11.08 * 1,782,183 --- --- --- 1,782,183 ---
24 November 2008
24 November 2015
$10.80 314,503 --- --- --- 314,503 ---
2,096,686 --- --- --- 2,096,686 --- Weighted average exercise price $11.34 --- --- --- $11.04 --- * Shareholder approval was obtained at the 2009 Annual General Meeting to change the exercise price of options granted during the 2008-09 financial year to take into account the Company’s entitlement offer in May 2009. Previously, the exercise price for the options was the five day volume weighted average price of the Company’s shares up to the date of the grant. Under the rules of the EPRP, the Board has the power to adjust the exercise price to take account of the entitlement offer. The purpose of this is to ensure that option holders are not unfairly advantaged or disadvantaged by the entitlement offer. Due to the increase in the Company’s share capital as a result of the entitlement offer and the impact on the share price which could potentially affect the options granted under the EPRP, the exercise price has been adjusted in accordance with the ASX Listing Rules. The formula under the ASX Listing Rules is: O’ = O – E [P - (S+D)] N + 1 The formula inputs for options granted on 31 October 2008 included: O’ = the new exercise price of the option O = the old exercise price of the option E = the number of underlying securities into which one option is exercisable P = the volume weighted average market price per security of the underlying securities during the Company’s five
trading days ending on the day before the ex-entitlement date S = the subscription price for a security under the entitlement issue D = the dividend due, but not yet paid, on the existing underlying securities (except those to be issued under the pro-
rata issue) N = the number of securities which must be held to receive a right to one new security
For
per
sona
l use
onl
y

Notes to the consolidated financial statements 30 J une 2011 : :
Billabong International Limited 2010-11 Full Financial Report Page 128
Note 42. Share-based payments (continued) (b) Billabong Executive Performance and Retention Plan (EPRP) (continued) The calculation to determine the reduced exercise price for the options granted on 31 October 2008 is as follows: O’ = 11.43 – 1 [9.80 – (7.50 + 0)] 5.5 + 1 O’ = 11.08 The options granted on 24 November 2008 relate to Franco Fogliato, General Manager, Billabong Europe who is a French resident and was granted options under a French sub-plan, which complies with French legal and taxation requirements and which therefore restricts the ability to amend the exercise price of options after their grant date. As a result, the exercise price for these options was not adjusted and the terms of these options were not amended. Fair value of options granted The assessed fair value at grant date of options granted to the individuals is allocated equally over the period from grant date to vesting date, and the amount is included in the remuneration tables above. Fair values at grant date are independently determined using the Monte-Carlo simulation option pricing model that takes into account the exercise price, the term of the option, the share price at grant date and expected price volatility of the underlying share, the expected dividend yield and the risk-free interest rate for the term of the option. Grant Date The model inputs for options granted during the year ended 30 June 2009 included:
31 October 2008 24 November 2008
(a) exercise price: $11.43 $10.80 (b) vesting date: 31 October 2013 24 November 2013 (c) expiry date: 31 October 2015 24 November 2015 (d) share price at grant date: $11.92 $9.60 (e) expected price volatility of the Company’s shares: 30% 30% (f) expected dividend yield: 3.80% 4.20% (g) expected life: 6.0 years 6.0 years (h) risk-free interest rate: 4.84% 4.20% (i) options are granted for no consideration and vest based on the Company’s TSR, including share price growth,
dividends and capital returns, compared to the TSR of the constituents of the S&P/ASX 100 Index at the start of the performance period (excluding companies under the Global Industry Classification Standard name codes: ‘Oil, Gas and Consumable Fuels’ and ‘Metals and Mining’) over a five year period. Vested options are exercisable for a period of two years after vesting.
(c) Expenses arising from share-based payment tra nsactions Total expenses arising from share-based payment transactions recognised during the period as part of employee benefits expense were as follows: 2011
$’000 2010 $’000
Operating costs of the Billabong Executive Performance Share Plan 22 20 Share-based payment expense 5,892 5,325 5,914 5,345
For
per
sona
l use
onl
y
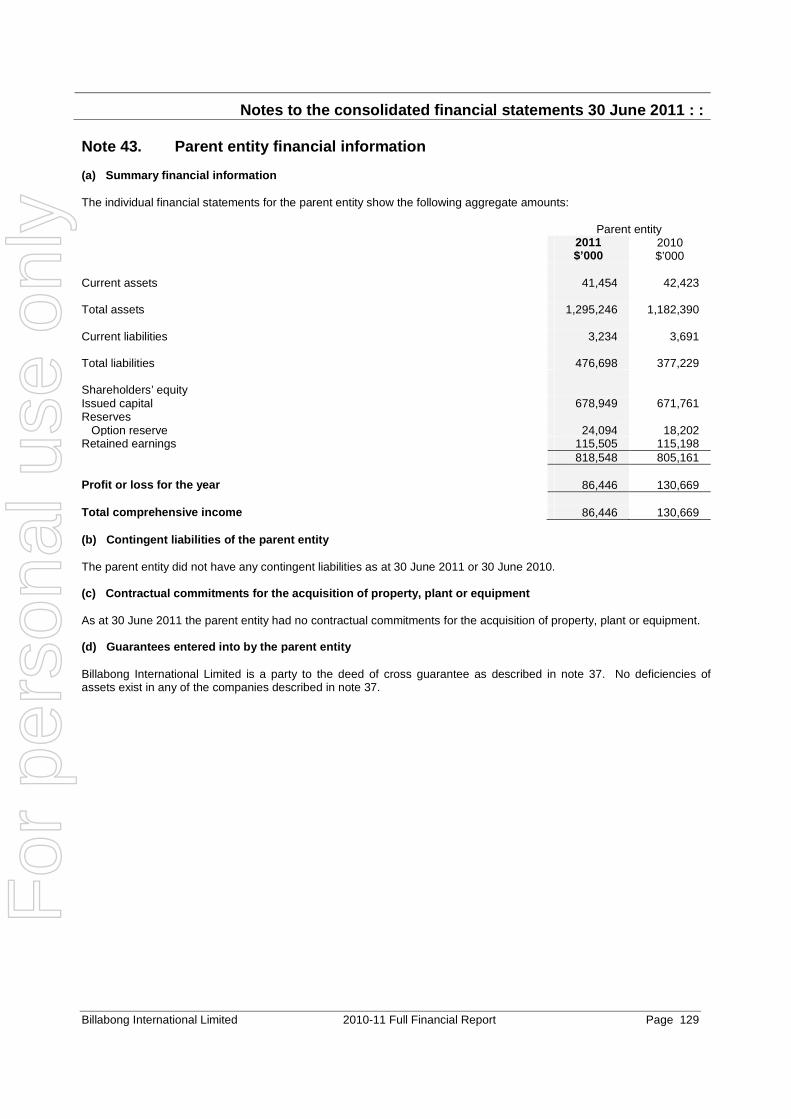
Notes to the consolidated financial statements 30 J une 2011 : :
Billabong International Limited 2010-11 Full Financial Report Page 129
Note 43. Parent entity financial information (a) Summary financial information The individual financial statements for the parent entity show the following aggregate amounts: Parent entity 2011
$’000 2010 $’000
Current assets 41,454 42,423 Total assets 1,295,246 1,182,390 Current liabilities 3,234 3,691 Total liabilities 476,698 377,229 Shareholders’ equity Issued capital 678,949 671,761 Reserves Option reserve 24,094 18,202 Retained earnings 115,505 115,198 818,548 805,161 Profit or loss for the year 86,446 130,669 Total comprehensive inc ome 86,446 130,669 (b) Contingent liabilities of the parent entity The parent entity did not have any contingent liabilities as at 30 June 2011 or 30 June 2010. (c) Contractual commitments for the acquisition o f property, plant or equipment As at 30 June 2011 the parent entity had no contractual commitments for the acquisition of property, plant or equipment. (d) Guarantees entered into by the parent entity Billabong International Limited is a party to the deed of cross guarantee as described in note 37. No deficiencies of assets exist in any of the companies described in note 37.
For
per
sona
l use
onl
y

Directors’ declaration : :
Billabong International Limited 2010-11 Full Financial Report Page 130
In the Directors’ opinion: (a) the financial statements and notes set out on pages 52 to 129 are in accordance with the Corporations Act 2001,
including: (i) complying with Accounting Standards, the Corporations Regulations 2001 and other mandatory
professional reporting requirements, and (ii) giving a true and fair view of the Company’s and consolidated entity's financial position as at 30 June
2011 and of their performance for the financial year ended on that date, and (b) there are reasonable grounds to believe that the Company will be able to pay its debts as and when they
become due and payable, and (c) at the date of this declaration, there are reasonable grounds to believe that the members of the Extended Closed
Group identified in note 37 will be able to meet any obligations or liabilities to which they are, or may become, subject by virtue of the deed of cross guarantee described in note 37.
Note 1(a) confirms that the financial statements also comply with International Financial Reporting Standards as issued by the International Accounting Standards Board. The Directors have been given the declarations by the Chief Executive Officer and Chief Financial Officer required by section 295A of the Corporations Act 2001. This declaration is made in accordance with a resolution of the Directors.
Ted Kunkel Chairman Gold Coast 19 August 2011
For
per
sona
l use
onl
y

Billabong International Limited 2010-11 Full Financial Report Page 131
Independent auditor’s report to the members of Bill abong International Limited Report on the financial report We have audited the accompanying financial report of Billabong International Limited (the Company), which comprises the balance sheet as at 30 June 2011, and the income statement, the statement of comprehensive income, statement of changes in equity and statement of cash flows for the year ended on that date, a summary of significant accounting policies, other explanatory notes and the Directors’ declaration for the Billabong Group (the consolidated entity). The consolidated entity comprises the Company and the entities it controlled at the year's end or from time to time during the financial year. Directors’ responsibility for the financial report The Directors of the Company are responsible for the preparation of the financial report that gives a true and fair view in accordance with Australian Accounting Standards and the Corporations Act 2001 and for such internal control as the Directors determine is necessary to enable the preparation of the financial report that is free from material misstatement, whether due to fraud or error. In note 1(a), the Directors also state, in accordance with Accounting Standard AASB 101 Presentation of Financial Statements, that the financial statements comply with International Financial Reporting Standards. Auditor’s responsibility Our responsibility is to express an opinion on the financial report based on our audit. We conducted our audit in accordance with Australian Auditing Standards. These Auditing Standards require that we comply with relevant ethical requirements relating to audit engagements and plan and perform the audit to obtain reasonable assurance whether the financial report is free from material misstatement. An audit involves performing procedures to obtain audit evidence about the amounts and disclosures in the financial report. The procedures selected depend on the auditor’s judgement, including the assessment of the risks of material misstatement of the financial report, whether due to fraud or error. In making those risk assessments, the auditor considers internal control relevant to the entity’s preparation and fair presentation of the financial report in order to design audit procedures that are appropriate in the circumstances, but not for the purpose of expressing an opinion on the effectiveness of the entity’s internal control. An audit also includes evaluating the appropriateness of accounting policies used and the reasonableness of accounting estimates made by the Directors, as well as evaluating the overall presentation of the financial report. Our procedures include reading the other information in the Annual Report to determine whether it contains any material inconsistencies with the financial report. We believe that the audit evidence we have obtained is sufficient and appropriate to provide a basis for our audit opinions. Independence In conducting our audit, we have complied with the independence requirements of the Corporations Act 2001. PricewaterhouseCoopers, ABN 52 780 433 757 Riverside Centre, 123 Eagle Street, GPO BOX 150, BRISBANE QLD 4001 DX 77 Brisbane, Australia T +61 7 3257 5000, F +61 7 3257 5999, www.pwc.com.au Liability limited by a scheme approved under Professional Standards Legislation
For
per
sona
l use
onl
y
Billabong International Limited 2010-11 Full Financial Report Page 132
Independent auditor’s report to the members of Bill abong International Limited (continued) Auditor’s opinion In our opinion: (a) the financial report of Billabong International Limited is in accordance with the Corporations Act
2001, including:
(i) giving a true and fair view of the consolidated entity’s financial position as at 30 June 2011 and of its performance for the year ended on that date; and (ii) complying with Australian Accounting Standards (including the Australian Accounting Interpretations) and the Corporations Regulations 2001; and
(b) the financial report and notes also comply with International Financial Reporting Standards as
disclosed in note 1(a). Report on the Remuneration Report We have audited the Remuneration Report included in pages 13 to 39 of the Directors’ report for the year ended 30 June 2011. The Directors of the Company are responsible for the preparation and presentation of the Remuneration Report in accordance with section 300A of the Corporations Act 2001. Our responsibility is to express an opinion on the Remuneration Report, based on our audit conducted in accordance with Australian Auditing Standards. Auditor’s opinion In our opinion, the Remuneration Report of Billabong International Limited for the year ended 30 June 2011, complies with section 300A of the Corporations Act 2001.
PricewaterhouseCoopers
Robert Hubbard Partner Brisbane 19 August 2011 Liability limited by a scheme approved under Professional Standards Legislation
For
per
sona
l use
onl
y

Shareholder information : :
Billabong International Limited 2010-11 Full Financial Report Page 133
The shareholder information set out below was applicable as at 15 August 2011. Distribution of Equity Securities Analysis of numbers of equity security holders by size of holding: Ordinary shares Unquoted options
Number of share holders
Number of shares
Number of option holders
Number of options
1 − 1,000 13,006 5,328,221 --- --- 1,001 − 5,000 5,944 12,797,535 --- --- 5,001 − 10,000 625 4,331,790 --- ---
10,001 − 100,000 342 7,737,230 --- --- 100,001 and over 55 223,842,811 5 2,096,686
19,972 254,037,587 5 2,096,686 There were 1,710 holders of less than a marketable parcel of ordinary shares.
Equity Security Holders Twenty largest quoted equity security holders The names of the twenty largest holders of quoted equity securities are listed below: Ordinary shares Name Number
held Percentage of issued
shares
National Nominees Limited 49,032,954 19.30%
J P Morgan Nominees Australia Limited 43,186,359 17.00%
Gordon Merchant 37,770,098 14.87%
HSBC Custody Nominees (Australia) Limited 34,089,046 13.42%
Citicorp Nominees Pty Limited <Colonial First State Inv A/C> 13,357,087 5.26%
Citicorp Nominees Pty Limited 9,584,215 3.77%
J P Morgan Nominees Australia Limited <Cash Income A/C> 7,036,036 2.77%
RBC Dexia Investor Services Australia Nominees Pty Limited 3,117,020 1.23%
Colette Paul 2,973,289 1.17%
Cogent Nominees Pty Limited 2,932,267 1.15%
Queensland Investment Corporation 2,564,054 1.01%
AMP Life Limited 1,566,780 0.62%
Derek O’Neill 1,320,271 0.52%
Jontex Pty Ltd 1,315,578 0.52%
Argo Investments Limited 1,180,528 0.46%
UBS Wealth Management Australia Nominees Pty Ltd 1,121,409 0.44%
CPU Share Plans Pty Limited <BBG PSP Aus Control A/C> 1,081,904 0.43%
Paul Naude 1,045,988 0.41%
Citicorp Nominees Pty Limited <Cfsil Cwlth Aust Shs 18 A/C> 894,832 0.35%
Perpetual Trustee Company Limited 776,292 0.31%
215,946,007 85.01%
For
per
sona
l use
onl
y

Shareholder information : :
Billabong International Limited 2010-11 Full Financial Report Page 134
Unquoted Equity Securities
Number on issue
Number of holders
Options issued under the Executive Performance and Retention Plan as approved by shareholders at the Annual General Meeting on 28 October 2008:
Class – BBGAI Class – BBGAK
1,782,183 314,503
4 1
The options listed above are the only unquoted equity securities on issue. The following people hold 20% or more of these securities:
Class – BBGAI Derek O’Neill Paul Naude Class – BBGAK Franco Fogliato
629,007 524,170
314,503
Substantial Holders As at 15 August 2011 the names of substantial holders in the Company who have notified the Company in accordance with section 671B of the Corporations Act 2001 are set out below: Ordinary Shares
Number
Percentage
Gordon Stanley Merchant & Gordon Merchant No. 2 Pty Ltd 33,013,703 15.95% Commonwealth Bank of Australia 19,165,209 7.57% Maple-Brown Abbott Limited 18,859,427 7.42% National Australia Bank Limited 16,131,425 6.35% FMR LLC and FIL Limited (FIL) 15,840,409 6.25% Invesco Australia Limited 12,742,665 5.02% Franklin Resources, Inc. 12,679,517 5.00%
Voting Rights The voting rights attaching to each class of equity securities are set out below: (a) Ordinary shares On a show of hands every holder of ordinary shares present at a meeting in person or by proxy, is entitled to one vote, and upon a poll each share is entitled to one vote. (b) Options No voting rights. Stock Exchange Listing The shares of the Company are listed under the symbol BBG on the Australian Securities Exchange. The Company's home branch is Brisbane. Shareholder Enquiries If you are a shareholder with queries about your holdings you should contact the Company’s Share Registry as follows: Computershare Investor Services Pty Limited GPO Box 2975 MELBOURNE VIC 3001
Telephone Australia: 1300 850 505 Telephone International: +61 3 9415 4000 Fax: +61 3 9473 2500 Email: [email protected]
For
per
sona
l use
onl
y
Shareholder information : :
Billabong International Limited 2010-11 Full Financial Report Page 135
Become an Online Shareholder You can also access your current shareholding and update your details online. To register, you should visit the share registry at www.computershare.com.au/easyupdate/bbg and enter your personal securityholder information (eg Holder Identification Number (HIN) or Securityholder Reference Number (SRN)) and postcode, then click on 'Submit' and follow the prompts. Change of Address Issuer sponsored shareholders should notify the share registry immediately upon any change in their address quoting their Securityholder Reference Number (SRN) either in writing or online. Changes in addresses for broker sponsored holders should be directed to the sponsoring brokers with the appropriate Holder Identification Number (HIN). Dividends Dividend payments may be paid directly into your nominated financial institution in Australia, New Zealand, United Kingdom or United States. Dividend payments are electronically credited on the dividend payment date and confirmed by payment advices mailed directly to your registered shareholder address. Application forms are available from our Share Registry or update your details online. If you have not provided direct credit instructions to have your dividend paid directly into a nominated financial institution or you do not have your shareholding registered in one of the above four countries, then you will receive an Australian dividend cheque. Billabong International Limited also pays dividends by local currency cheque to shareholders who maintain a registered address in the following jurisdictions: Europe – Euro, Hong Kong - $HK, Japan- Yen, New Zealand - $NZ, United Kingdom – GBP, and United States - $US. Dividend Reinvestment Plan The Company’s Dividend Reinvestment Plan is suspended until further notice. Annual Report The latest Annual Report can be accessed from the Company’s corporate website at www.billabongbiz.com. If you are a shareholder and you wish to receive a hard copy of the Annual Report, please contact our Share Registry or update your details online. Tax File Numbers (TFN) Billabong International Limited is obliged to deduct tax from unfranked or partially franked dividends paid to shareholders registered in Australia who have not provided their TFN to the Company. If you wish to provide your TFN, please contact the Share Registry or update your details online. Consolidation of Multiple Shareholdings If you have multiple shareholding accounts that you wish to consolidate into a single account, please advise the Share Registry in writing. If your holdings are broker sponsored, please contact the sponsoring broker directly. Other Shareholder Information Visit the Company’s corporate website at www.billabongbiz.com for the Company’s latest information. F
or p
erso
nal u
se o
nly