Bill Winkelman National Pork Board Update. Pork Production Per Year With weight and volume up, 2015...
31
Bill Winkelman National Pork Board Update
-
Upload
gregory-harrell -
Category
Documents
-
view
222 -
download
0
Transcript of Bill Winkelman National Pork Board Update. Pork Production Per Year With weight and volume up, 2015...

Bill Winkelman
National Pork Board Update

Pork Production Per Year
With weight and volume up, 2015 may be the largest pork production year on record!

PEDv: Few sow herd breaksData from 708 sow
farms, 14 of 19 large systems reporting.
2.022 million sows!

Today’s U.S. Pork Production
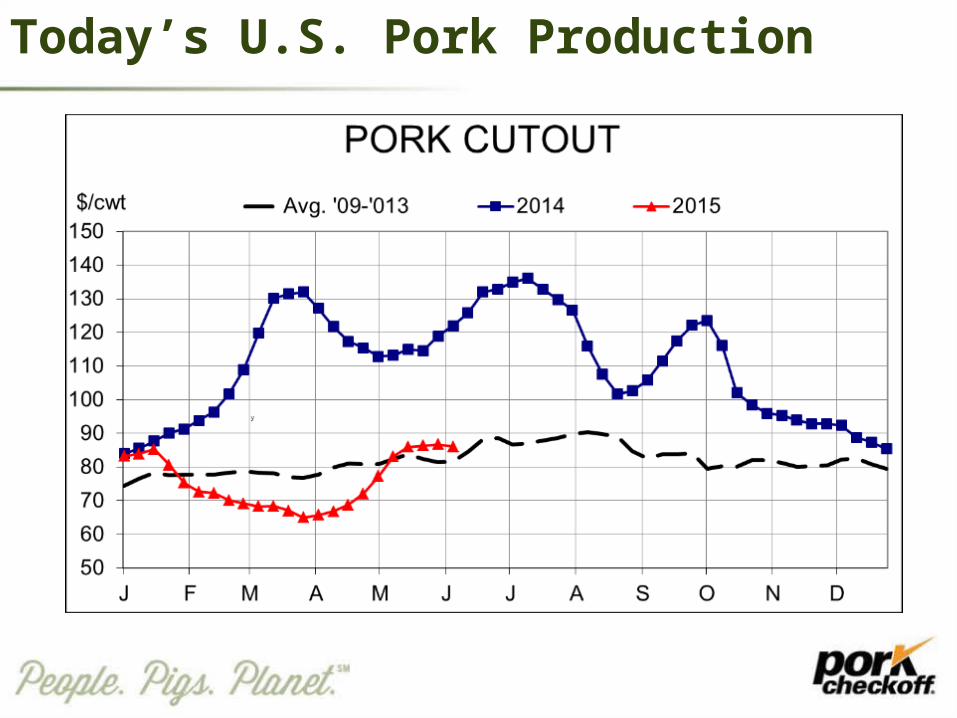
Today’s U.S. Pork Production

So, where are we going?
Support the National Pork Board’s vision to:
Build Consumer
Trust
Drive Sustainable Production
Grow Consumer Demand
Goal 1 – Build Consumer Trust
Working collaboratively with food chain partners, the National Pork Board will enhance consumer trust in modern pork production by promoting producer adoption of on-farm management practices that reflect our ethical principles and by sharing our commitment to continuous improvement with consumers and key stakeholders.

Building Trust – Antibiotics
• FDA regulated • Involves food safety and human health • Not pork-specific (crosses all species)• No real, strong advocates• For customers, changes are a brand differentiator
This IS a different situation!

Our Focus: Research, Education, Communication
Defined 5 strategic research prioritiesPilot project and blue-ribbon taskforceIncrease funding in 2016
PQA Plus revision focused on Good Production PracticesEmphasize producer record-keeping toolsProducer publications – newsletter, magazine, pork.org
Be present at industry and government hearingsProactive media outreach – reporters and bylinesOn-farm continuous improvement shared through stories

Since 2000, $5.3 million invested in research
2000 2001 2002 2003 2004 2005 2006 2007 2008 2009 2010 2011 2012 2013 2014 2015$0
$100,000
$200,000
$300,000
$400,000
$500,000
$600,000
$112,000
$236,000
$439,000
$207,000
$319,000
$271,000
$357,000
$307,000$317,000
$306,000
$264,000
$431,000
$468,000
$527,000$551,000
$192,000
Budget
National Pork Board Actions
ACTION: National Pork Board adopted the new position and policy statement as presented in the June 2015 Board meeting.
ACTION: The National Pork Board intends to allocate
up to $1.4 million in funding of scientific research and antibiotic risk assessment studies, producer education and consumer awareness programs.
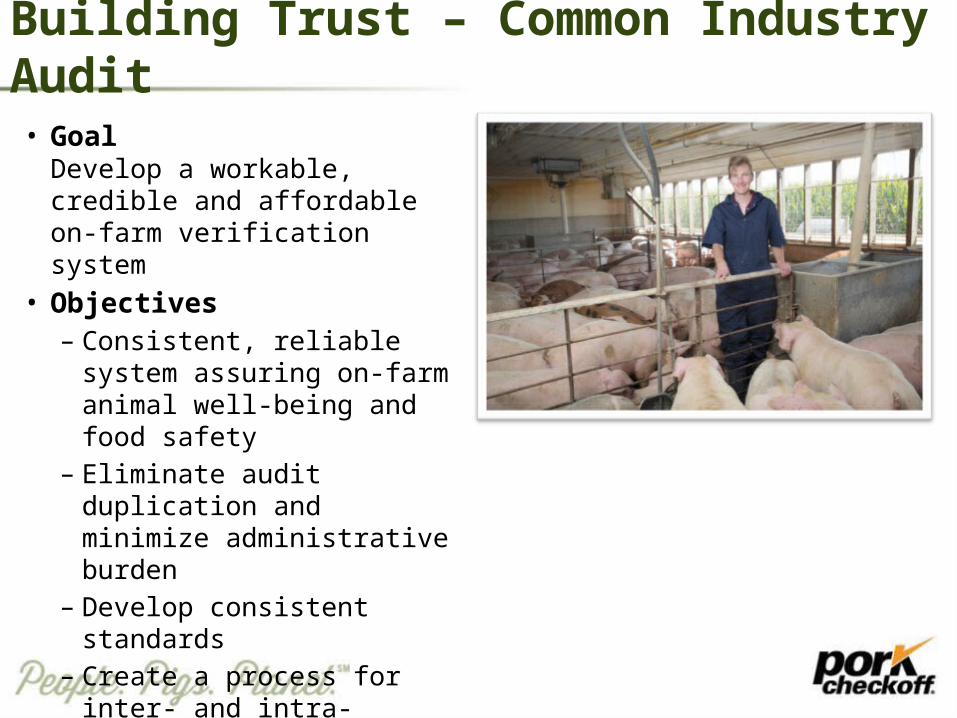
Building Trust – Common Industry Audit
• Goal Develop a workable, credible and affordable on-farm verification system
• Objectives– Consistent, reliable system assuring
on-farm animal well-being and food safety
– Eliminate audit duplication and minimize administrative burden
– Develop consistent standards– Create a process for inter- and
intra-observer consistency and protection of herd health

Goal 2 – Drive Sustainable Production
The National Pork Board will invest in research and producer education programs that enhance the productivity and sustainability of pork production and deliver benefits to producers, consumers and the community.

Drive Sustainable Production – Swine Health
• Anecdotal reports from the region• Published papers from researchers• Researcher to researcher communications• Reports to AASV Swine Health Committee
BUT, what did we do with this information?
$15 million investment in a Swine Health Information Center
American Association of Swine Veterinarians
Task Force determination:
PEDv NOT a surprise.

Scope of
Work
Swine Disease Matrix project
Swine health data –
analysis &
monitoring for trends
Global swine health
and issues
identification
Improve the
biosecurity
ability of the US swine herd
New Swine Health Information Center
Executive Director – Dr. Paul SundbergBoard comprised of NPB, NPPC, AASV and at-large representatives
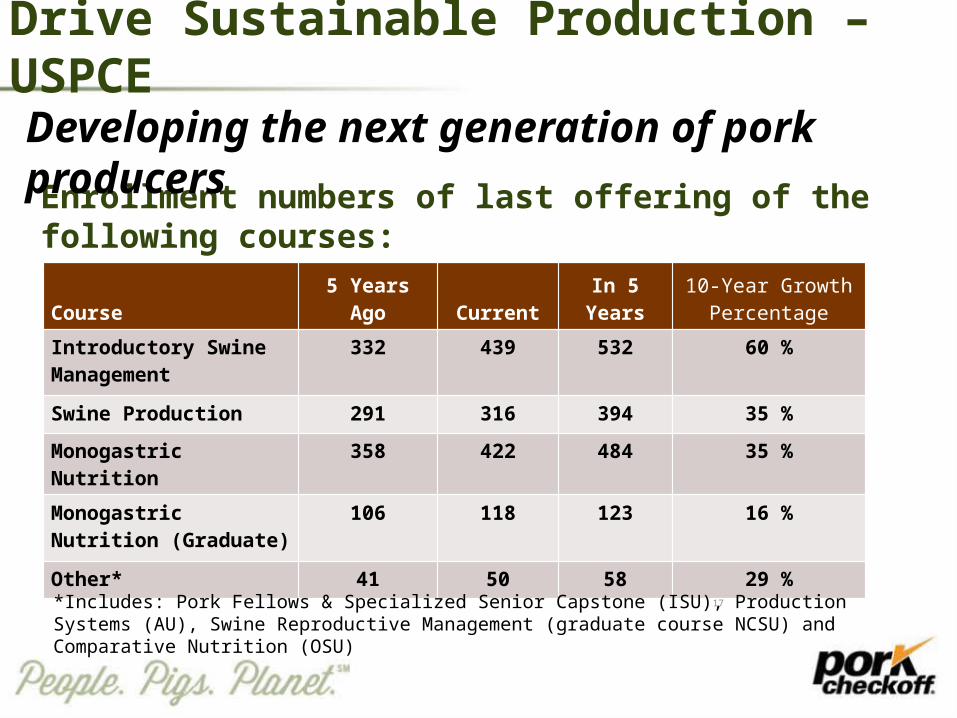
Enrollment numbers of last offering of the following courses:
Course 5 Years Ago Current In 5 Years10-Year Growth
PercentageIntroductory Swine Management
332 439 532 60 %
Swine Production 291 316 394 35 %
Monogastric Nutrition 358 422 484 35 %
Monogastric Nutrition (Graduate)
106 118 123 16 %
Other* 41 50 58 29 %
*Includes: Pork Fellows & Specialized Senior Capstone (ISU), Production Systems (AU), Swine Reproductive Management (graduate course NCSU) and Comparative Nutrition (OSU)
17
Drive Sustainable Production – USPCE
Developing the next generation of pork producers

Drive Sustainable Production – USPCE
Number of individuals training in swine-related research at any given time:
Level of Study 5 Years Ago Current In 5 Years* 10-Year Growth Percentage
Undergraduates 174 263 343 97 %
Masters of Science 75 74 92 23 %
Doctoral Candidates 58 65 75 29 %
Post-doctoral Fellows 12 14 20 67 %
*Assuming funding will increase
18
Developing the next generation of pork producers

Working in concert with food chain partners, the National Pork Board will grow domestic and international consumer demand by focusing on pork’s improved nutrition, quality and sustainability.
Goal 3 – Grow Consumer Demand
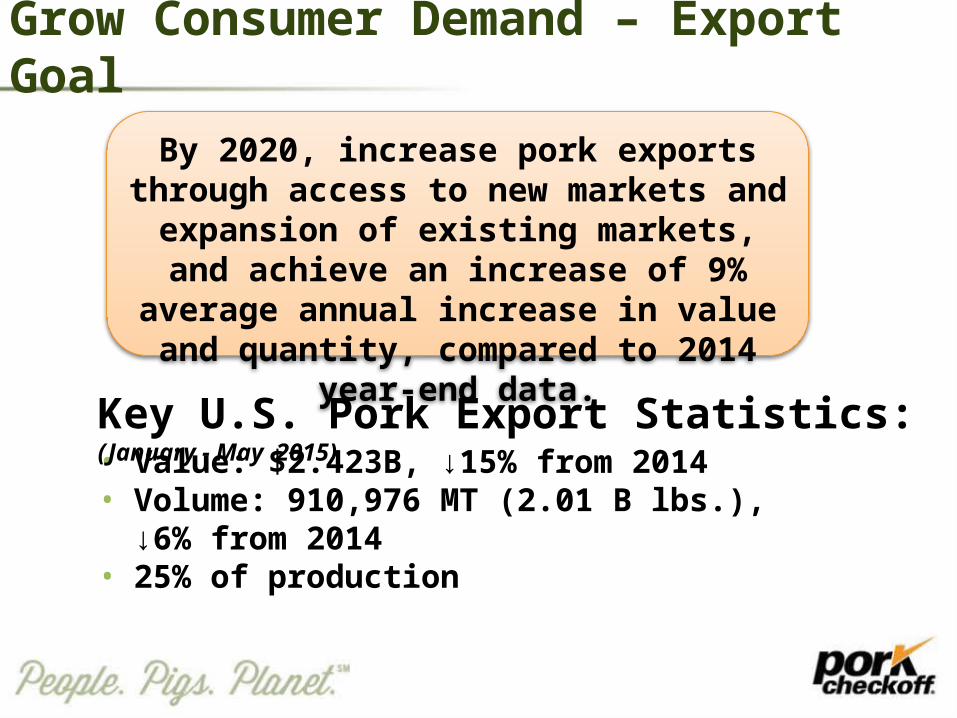
Grow Consumer Demand – Export Goal
By 2020, increase pork exports through access to new markets and expansion of existing
markets, and achieve an increase of 9% average annual increase in value and quantity,
compared to 2014 year-end data.
• Value: $2.423B, ↓15% from 2014• Volume: 910,976 MT (2.01 B lbs.), ↓6% from 2014• 25% of production
Key U.S. Pork Export Statistics: (January - May 2015)

Grow Consumer Demand – China
• Population: 1.355 billion or 20% of world population•More migration to urban areas• Increasing disposable income• Growing modern retail segment • Outside experts, economists and
U.S. Meat Export Federation see China as the No.1 priority market for pork exports through 2025

Grow Consumer Demand – China
• Challenges: –Scarcity of arable land–High feed costs–Pollution, water, disease
• Declining sow numbers and production• Climbing live hog prices• Is there a pork gap coming?• China has a zero-tolerance on ractopamine in pork
imports
Self-sufficiency projected to be over 90% in 2020…?

Grow Consumer Demand – U.S. Consumer
Meat is trending: Protein is in! Fat is back!

Grow Consumer Demand – U.S. Consumer

Segmentation Study 2010 vs. 2015
• As compared to 2010, now significant group of consumers eat fresh pork 3+ times every two weeks.
• In 2010, we could not find a group that ate fresh pork 3 times/week.
Ave. number of serving at home in last 2 weeks
Total U.S.
NPBTarget
Fresh Pork 1.5 3.2
Total Beef 2.8 3.5
Chicken 3.9 4.6
Ground Beef 1.6 1.8
Beef Steaks/Roasts 1.2 1.7
Grow Consumer Demand – U.S. Consumer

Where do we go from here?

Productivity measures are CRITICAL in 2015!
• June report farrowing intentions look low, but the reason is that year-ago farrowings were high vs. the breeding herd.
• Litter size is back on its 2% growth path – and March-May was RECORD LARGE litter sizes.

Production up 12.2% week ending 6/26/15

Profit Past and Future

The Opportunities Ahead
• Elevate demand for U.S. pork in Asia and Latin America• Working with NPPC on trade issues (MCOOL, TPP, new access)• Expand the domestic consumer base and spending on pork • Lead the conversation on antibiotics• Develop capability to monitor and respond to foreign disease threat• Continue to improve animal handling practices • Support alternative production• Be the catalyst bringing people and investment into our industry

New Producer Tools for 2016
• PQA revision and site assessment alignment with Common Audit• Update and re-launch of our Safety System toolkit• Resources for producers to create a We Care Barn
Culture• Zoetis Individual Pig Care extended to additional
producers through NPB• Small/Beginning Producer Resources - P.I.G.• Self-study guide for Certified Swine Manager
Program

This message funded by America’s Pork Producers and the Pork Checkoff
Thank you!