Bilateral alterations of the ERG and retinal histology following ...
13
Investigative Ophthalmology & Visual Science, Vol. 29, No. 8, August 1988 Copyright © Association for Research in Vision and Ophthalmology Bilateral Alterations of the ERG and Retinal Histology Following Unilateral HSV-1 Inoculation D. I. Hamasaki,* Richard D. Dix,*t and Sally S. Arherron*t The physiological condition of the retinas of BALB/c mice inoculated unilaterally in the anterior chamber with the KOS strain of herpes simplex virus type 1 (HSV-1) was monitored by ERG recordings. After the ERG recordings, the retinas were examined for histopathological changes. In the inoculated eye, depressed ERGs were recorded on day 2 PI and abolished ERGs on day 4 PI. The changes in the ERGs were complete by day 5-6 PI. Of the 53 inoculated eyes followed for longer than day 6 PI, four (7.5%) remained normal, 30 (56.6%) had reduced ERGs and 19 (35.8%) had abolished ERGs. In the contralateral eyes, the first changes were noted on day 8 PI, and abolished ERGs were recorded on day 9 PI. Of the 55 contralateral eyes followed for longer than 10 days, 15 (27.3%) remained normal, four (7.2%) had reduced ERGs and 36 (65.4%) had abolished ERGs. The percentage of eyes with depressed ERGs was significantly higher in the inoculated than in the uninoculated eyes, and the percentage of eyes with abolished ERGs was significantly higher in the uninoculated eyes than in the inoculated eyes. The histopathological alterations were different for the two eyes. In the inoculated eyes, the changes were mainly in the outer retina, with characteristic folds in the photore- ceptor and outer nuclear layer interspersed with normal appearing retina. The pigment epithelium was also abnormal. In the uninoculated eyes, the changes began in the inner retina but rapidly spread to all layers of the retina. This panretinal necrosis accounted for the higher percentage of abolished ERGs in the uninoculated eyes. The differences in the alterations of the ERG and the histopathological changes may be related to the underlying mechanism of action of the HSV-1 during the evolution of the experimental retinopathy. Invest Ophthalmol Vis Sci 29:1242-1254,1988 Inoculation of the KOS strain of herpes simplex virus type 1 (HSV-1) into the anterior chamber of one eye of rabbits or mice leads to characteristic histo- pathological changes in the anterior and posterior segments of both eyes. 1 " 3 In the inoculated eye, there is severe anterior uveitis with corneal edema, cells and flare in the anterior chamber and cataract for- mation. A mild vitritis with inflammatory cells is ob- served by day 3 postinoculation (PI). The histopatho- logical changes in the ipsilateral retinas are mild with preservation of the retinal architecture. 3 However, if a more virulent strain (RE strain) of HSV-1 is inocu- From the *William L. McKnight Vision Research Institute, Bas- com Palmer Eye Institute, and thef Department of Microbiology and Immunology, University of Miami, School of Medicine, Miami, Florida. Supported in part by a Public Health Service Grant EY-00376 from the National Eye Institute, National Institutes of Health Be- thesda, Maryland (DIH); from the Joe and Emily Lowe Founda- tion, Palm Beach, Florida (RDD); and EY-06012 from the Na- tional Eye Institute (SSA) and a generous grant from the Nesicka Charitable Trust, Tacoma, Washington (SSA). Submitted for publication: July 10, 1987; accepted March 28, 1988. Reprint requests: D. I. Hamasaki, Bascom Palmer Eye Institute, University of Miami, School of Medicine, Miami, FL 33136. lated into the AC of ICR mice, severe retinopathy is induced in the inoculated eye. 4 In the contralateral eye, there is mild iridocyclitis 5 and the retina remains quiet until days 7-10 PI when inflammatory cells invade the retina and cell degeneration begins. 3 By day 14 PI, the retina is completely necrotic with loss of all retinal architecture. Between 60 to 70% of the contralateral eyes show the panretinal necrosis; the remaining eyes appear histologically normal. Thus, with the KOS strain of HSV-1, there is the somewhat paradoxical finding that the retina of the inoculated eye is preserved while the retina of the uninoculated eye is completely destroyed. Immunoperoxidase staining has demonstrated the presence of virus-specific antigens in the iris on day 1 PI, and in the ciliary body and inner layers of the peripheral retina on days 2-7 PI in the inoculated eyes. 6 In the contralateral eyes, virus-specific antigens were first detected in the ganglion cells and inner retina on day 7 PI. On subsequent days, cells in all layers of the contralateral retina stained positively for viral antigens. Virus recovery studies have shown that the virus titer is very high in the ipsilateral eye for the first 5 days and then decreases rapidly until day 14 PI when virus cannot be detected. 5 In the contralateral eyes, 1242 Downloaded From: http://iovs.arvojournals.org/pdfaccess.ashx?url=/data/journals/iovs/933372/ on 03/26/2018
-
Upload
hoangduong -
Category
Documents
-
view
213 -
download
1
Transcript of Bilateral alterations of the ERG and retinal histology following ...

Investigative Ophthalmology & Visual Science, Vol. 29, No. 8, August 1988Copyright © Association for Research in Vision and Ophthalmology
Bilateral Alterations of the ERG and Retinal HistologyFollowing Unilateral HSV-1 Inoculation
D. I. Hamasaki,* Richard D. Dix,*t and Sally S. Arherron*t
The physiological condition of the retinas of BALB/c mice inoculated unilaterally in the anteriorchamber with the KOS strain of herpes simplex virus type 1 (HSV-1) was monitored by ERGrecordings. After the ERG recordings, the retinas were examined for histopathological changes. In theinoculated eye, depressed ERGs were recorded on day 2 PI and abolished ERGs on day 4 PI. Thechanges in the ERGs were complete by day 5-6 PI. Of the 53 inoculated eyes followed for longer thanday 6 PI, four (7.5%) remained normal, 30 (56.6%) had reduced ERGs and 19 (35.8%) had abolishedERGs. In the contralateral eyes, the first changes were noted on day 8 PI, and abolished ERGs wererecorded on day 9 PI. Of the 55 contralateral eyes followed for longer than 10 days, 15 (27.3%)remained normal, four (7.2%) had reduced ERGs and 36 (65.4%) had abolished ERGs. The percentageof eyes with depressed ERGs was significantly higher in the inoculated than in the uninoculated eyes,and the percentage of eyes with abolished ERGs was significantly higher in the uninoculated eyes thanin the inoculated eyes. The histopathological alterations were different for the two eyes. In theinoculated eyes, the changes were mainly in the outer retina, with characteristic folds in the photore-ceptor and outer nuclear layer interspersed with normal appearing retina. The pigment epithelium wasalso abnormal. In the uninoculated eyes, the changes began in the inner retina but rapidly spread to alllayers of the retina. This panretinal necrosis accounted for the higher percentage of abolished ERGs inthe uninoculated eyes. The differences in the alterations of the ERG and the histopathological changesmay be related to the underlying mechanism of action of the HSV-1 during the evolution of theexperimental retinopathy. Invest Ophthalmol Vis Sci 29:1242-1254,1988
Inoculation of the KOS strain of herpes simplexvirus type 1 (HSV-1) into the anterior chamber of oneeye of rabbits or mice leads to characteristic histo-pathological changes in the anterior and posteriorsegments of both eyes.1"3 In the inoculated eye, thereis severe anterior uveitis with corneal edema, cellsand flare in the anterior chamber and cataract for-mation. A mild vitritis with inflammatory cells is ob-served by day 3 postinoculation (PI). The histopatho-logical changes in the ipsilateral retinas are mild withpreservation of the retinal architecture.3 However, ifa more virulent strain (RE strain) of HSV-1 is inocu-
From the *William L. McKnight Vision Research Institute, Bas-com Palmer Eye Institute, and thef Department of Microbiologyand Immunology, University of Miami, School of Medicine,Miami, Florida.
Supported in part by a Public Health Service Grant EY-00376from the National Eye Institute, National Institutes of Health Be-thesda, Maryland (DIH); from the Joe and Emily Lowe Founda-tion, Palm Beach, Florida (RDD); and EY-06012 from the Na-tional Eye Institute (SSA) and a generous grant from the NesickaCharitable Trust, Tacoma, Washington (SSA).
Submitted for publication: July 10, 1987; accepted March 28,1988.
Reprint requests: D. I. Hamasaki, Bascom Palmer Eye Institute,University of Miami, School of Medicine, Miami, FL 33136.
lated into the AC of ICR mice, severe retinopathy isinduced in the inoculated eye.4 In the contralateraleye, there is mild iridocyclitis5 and the retina remainsquiet until days 7-10 PI when inflammatory cellsinvade the retina and cell degeneration begins.3 Byday 14 PI, the retina is completely necrotic with lossof all retinal architecture. Between 60 to 70% of thecontralateral eyes show the panretinal necrosis; theremaining eyes appear histologically normal. Thus,with the KOS strain of HSV-1, there is the somewhatparadoxical finding that the retina of the inoculatedeye is preserved while the retina of the uninoculatedeye is completely destroyed.
Immunoperoxidase staining has demonstrated thepresence of virus-specific antigens in the iris on day 1PI, and in the ciliary body and inner layers of theperipheral retina on days 2-7 PI in the inoculatedeyes.6 In the contralateral eyes, virus-specific antigenswere first detected in the ganglion cells and innerretina on day 7 PI. On subsequent days, cells in alllayers of the contralateral retina stained positively forviral antigens.
Virus recovery studies have shown that the virustiter is very high in the ipsilateral eye for the first 5days and then decreases rapidly until day 14 PI whenvirus cannot be detected.5 In the contralateral eyes,
1242
Downloaded From: http://iovs.arvojournals.org/pdfaccess.ashx?url=/data/journals/iovs/933372/ on 03/26/2018

No. 8 DEPRESSION OF ERG DY HSV-1 / Homosoki er ol 1243
there are two waves of virus reaching the eye: theinitial wave of virus is found on day 1 PI, but' thevirus doe^ not replicate and the virus titer remainslow; a later wave occurs on day 7 PI, the titer of whichincreases to a second peak on day 10 PI.
The earlier studies used histopathological methodsto assess the damage to the retinas induced by theHSV-1. Histopathological methods have also beenused to assess the retinal damage induced by othertypes of virus, eg, feline leukemia virus,7 blue tonguevirus,8 mumps virus,9 and lymphocytic choriomenin-gitis virus.10 The question arises regarding the physio-logical condition of the retinas during the viral infec-tion. Tremain and Ikeda reported that the latencies ofthe neural responses from the superior colliculus werelonger in mice infected with the Semliki Forestvirus." They attributed the longer latencies to thedemyelination of the optic nerve fibers which isknown to be produced by this virus.
For our study, we used the electroretinogram(ERG) to monitor the physiological state of the ret-ina, and we shall show that inoculation of HSV-1leads to alterations of the ERG of both eyes. The timecourse and degree of the alterations, however, weredifferent for the two eyes: in the ipsilateral eyes, over90% of the eyes had altered ERGS and changes couldbe noted by day 2 PI; in the contralateral eyes, ap-proximately 70% of the eyes had reduced ERGs andchanges began at day 8 PI and were complete by days9-10 PI. The histopathological changes were differentfor the two eyes and were present in all eyes whichshowed changes in the ERG.
Materials and Methods
Animals
All experiments were conducted on adult (9-12weeks) BALB/c mice obtained from Taconic Farms(Germantown, NY). The mice were held in standardcages and fed Lab Chow (Purina). The animals werekept on a 12:12 light:dark schedule.
The treatment and procedures used in this studyconformed to the ARVO Resolution on the Use ofAnimals in Research.
Inoculation
Under IP chloral hydrate anesthesia (0.36 mg/gbody weight), the right eye was proposed and 1.5X 10⁴ PFU/4 fi\ of the KOS strain of HSV-1 wasinjected into the anterior chamber as described indetail earlier.12 The contralateral eye was not sham-injected. For controls, animals were either sham-in-jected in one eye with the same amount of carriersolution, or had their crystalline lens deliberately
ruptured in one eye. In both groups, the ERG andretinal histology were not altered.
Electroretinography (ERGs)
ERGs were picked up by a wick electrode placedon the cornea of mice anesthetized with IP chloralhydrate. The indifferent electrode was placed subcu-taneously on the top of the head, and the animal wasgrounded by another electrode placed subcutane-ously in the neck region.
The ERGs were amplified and displayed on anoscilloscope with a time constant of 0.2 seconds. Thehigh frequency cutoff was set at 1 Kc. The amplifiedresponses were fed from the oscilloscope to a Nicolet(Madison, WI) 1072 Signal Averager, and 16 re-sponses were averaged with a dwell time of 4 msec.The averaged ERGs were plotted on a MFE 715MX-Y plotter. The responses were also sent from theoscilloscope to a Hewlett Packard 3964A analoguetape recorder (Palo Alto, CA) for permanent storageof the individual responses. The b-wave amplitudeswere measured from the trough of the a-wave to thepeak of the b-wave.
Stimulus
The stimulus light was obtained from a 150 Wquartz-halogen light bulb. The light was collected andfocused onto a 3 mm diameter fiber optic bundle.The fiber optic bundle was brought into the Faradaycage and placed 1 cm from the eye. Under these con-ditions, the stimulus can considered to be a ganzfeldstimulus.
The irradiance of the unattenuated stimulus was2.91 X 103 /uW/cm2 (United Detector TechnologyRadiometer; Santa Monica, CA), and neutral densityfilters were used to reduce the intensity. Stimulus in-tensities will be referred to by the value of the neutraldensity filter used to attenuate the full intensity stim-ulus. A Uniblitz (Rochester, NY) shutter was used todeliver 250 msec pulses at an interstimulus interval of5 seconds.
Procedure
The anesthetized animal was taped down to ametal plate and one of the eyes taped open. The platewas placed on a heating pad to keep the animalwarm. After the electrodes were placed and the fiberoptic bundle adjusted for uniform illumination of theeye, a response was recorded with a 2.0 neutral den-sity filter. This initial ERG not only demonstratedthat everything was aligned but also gave an indica-tion of the physiological status of the retina.
The animal was then dark-adapted for 30 min, andresponses were recorded beginning with a 5.0 log unit
Downloaded From: http://iovs.arvojournals.org/pdfaccess.ashx?url=/data/journals/iovs/933372/ on 03/26/2018
1244 INVESTIGATIVE OPHTHALMOLOGY b VISUAL SCIENCE / Augusr 1988 Vol. 29
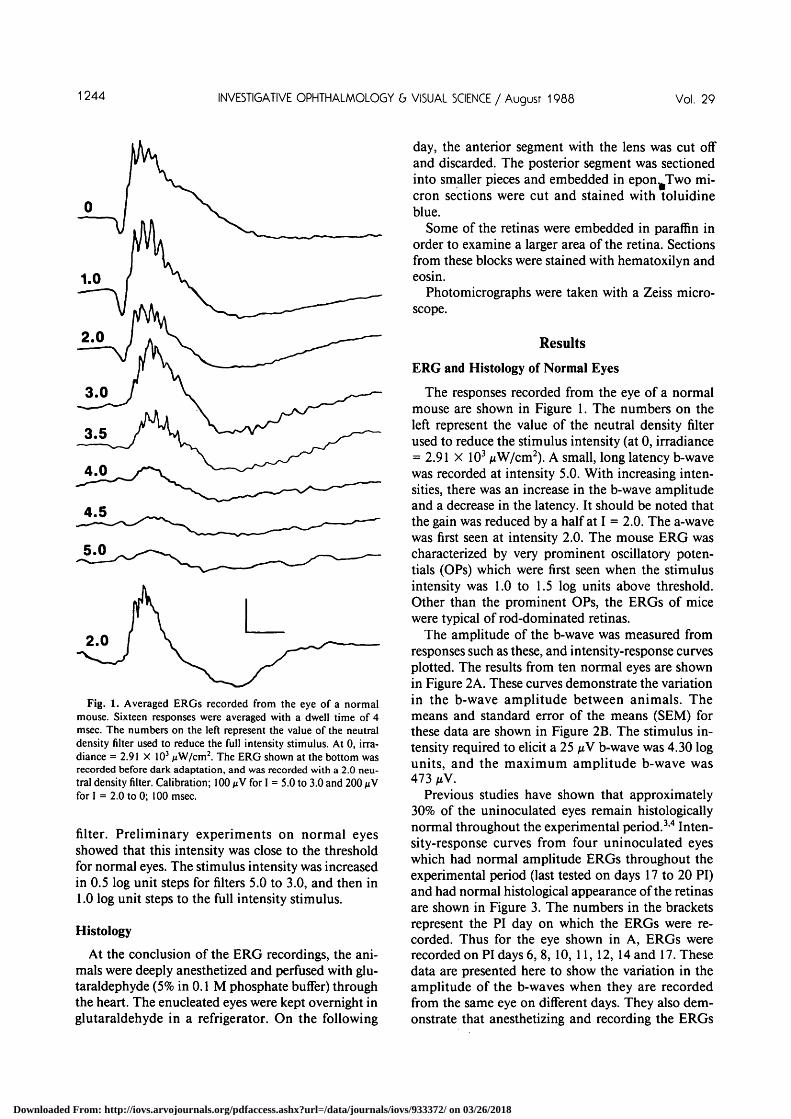
Fig. 1. Averaged ERGs recorded from the eye of a normalmouse. Sixteen responses were averaged with a dwell time of 4msec. The numbers on the left represent the value of the neutraldensity filter used to reduce the full intensity stimulus. At 0, irra-diance = 2.91 X 10³ /xW/cm2. The ERG shown at the bottom wasrecorded before dark adaptation, and was recorded with a 2.0 neu-tral density filter. Calibration; 100 jiV for I = 5.0 to 3.0 and 200 ^Vfor I = 2.0 to 0; 100 msec.
filter. Preliminary experiments on normal eyesshowed that this intensity was close to the thresholdfor normal eyes. The stimulus intensity was increasedin 0.5 log unit steps for filters 5.0 to 3.0, and then in1.0 log unit steps to the full intensity stimulus.
Histology
At the conclusion of the ERG recordings, the ani-mals were deeply anesthetized and perfused with glu-taraldephyde (5% in 0.1 M phosphate buffer) throughthe heart. The enucleated eyes were kept overnight inglutaraldehyde in a refrigerator. On the following
day, the anterior segment with the lens was cut offand discarded. The posterior segment was sectionedinto smaller pieces and embedded in epon. Two mi-cron sections were cut and stained with toluidineblue.
Some of the retinas were embedded in paraffin inorder to examine a larger area of the retina. Sectionsfrom these blocks were stained with hematoxilyn andeosin.
Photomicrographs were taken with a Zeiss micro-scope.
Results
ERG and Histology of Normal Eyes
The responses recorded from the eye of a normalmouse are shown in Figure 1. The numbers on theleft represent the value of the neutral density filterused to reduce the stimulus intensity (at 0, irradiance= 2.91 X 10³ ixW/cm2). A small, long latency b-wavewas recorded at intensity 5.0. With increasing inten-sities, there was an increase in the b-wave amplitudeand a decrease in the latency. It should be noted thatthe gain was reduced by a half at I = 2.0. The a-wavewas first seen at intensity 2.0. The mouse ERG wascharacterized by very prominent oscillatory poten-tials (OPs) which were first seen when the stimulusintensity was 1.0 to 1.5 log units above threshold.Other than the prominent OPs, the ERGs of micewere typical of rod-dominated retinas.
The amplitude of the b-wave was measured fromresponses such as these, and intensity-response curvesplotted. The results from ten normal eyes are shownin Figure 2A. These curves demonstrate the variationin the b-wave amplitude between animals. Themeans and standard error of the means (SEM) forthese data are shown in Figure 2B. The stimulus in-tensity required to elicit a 25 nV b-wave was 4.30 logunits, and the maximum amplitude b-wave was473 /xV.
Previous studies have shown that approximately30% of the uninoculated eyes remain histologicallynormal throughout the experimental period.3'4 Inten-sity-response curves from four uninoculated eyeswhich had normal amplitude ERGs throughout theexperimental period (last tested on days 17 to 20 PI)and had normal histological appearance of the retinasare shown in Figure 3. The numbers in the bracketsrepresent the PI day on which the ERGs were re-corded. Thus for the eye shown in A, ERGs wererecorded on PI days 6, 8, 10, 11, 12, 14 and 17. Thesedata are presented here to show the variation in theamplitude of the b-waves when they are recordedfrom the same eye on different days. They also dem-onstrate that anesthetizing and recording the ERGs
Downloaded From: http://iovs.arvojournals.org/pdfaccess.ashx?url=/data/journals/iovs/933372/ on 03/26/2018

No. 8 DEPRESSION OF ERG DY HSV-1 / Homosoki er ol 1245
Fig. 2. (A) Intensity-re-sponse curves obtainedfrom the eyes often normalmice. The log of the stimu-lus intensity is shown on theabscissa and the amplitudeof the b-wave on the ordi-nate. (B) The mean andstandard error of means forthe data shown in A. Coor-dinates as in A.
600,-
500
> 400
I 300
A 200
100
500
400
300
200
100
5.0 4.0 3.0 2.0log stimulus intensity
1.0 5.0 4.0 3.0 2.0 1.0
log stimulus Intensity
on successive days do not depress or otherwise alterthe ERGs.
A photomicrograph of a normal uninfected mouseretina is shown in Figure 4. The histological architec-ture of the mouse retina is typical of rod-dominatedretinas.
ERGs and Histopathology of the InoculatedIpsilateral Eyes
ERGs were recorded from 53 inoculated eyes. Anexample of one type of change induced in the ERGsof the ipsilateral eyes is shown in Figure 5. When firsttested on day 3 PI, there was a general depression ofall components of the ERG without any preferentialloss of one component. The threshold stimulus in-tensity was elevated to 3.00 log units, and the maxi-mum amplitude of the b-wave was reduced to 260nV. When tested again on day 6 PI, only a weakresponse of abnormal shape was elicited at the higherintensities (1.0 and 0). On day 21 PI, a response couldnot be elicited from this eye, ie, the ERG was abol-ished. These findings demonstrate that HSV-1 canlead to the abolition of all responses from the inocu-lated eye.
A more common finding is illustrated in the re-sponses recorded from another inoculated eye (Fig.6). When first tested on day 4 PI, the threshold stimu-lus intensity was higher at 3.5 to 3.0 log units, and the.maximum b-wave amplitude was reduced to 140 nV.All components of the ERG were depressed. TheERGs at day 7 PI were slightly smaller than at 4 days,
log •tlmulut Intamlly log Itlmului Intanally
Fig. 3. Intensity-response curves obtained from four uninocu-lated eyes which remained normal (physiologically and histologi-cally) throughout the experimental period. The number in thebrackets represents the PI day on which the ERGs were recorded.
Downloaded From: http://iovs.arvojournals.org/pdfaccess.ashx?url=/data/journals/iovs/933372/ on 03/26/2018

1246 INVESTIGATIVE OPHTHALMOLOGY 6 VISUAL SCIENCE / Augusr 1988 Vol. 29
IPSILATERAL EVE
7 DAYS
Fig. 4. Photomicrograph of a normal mouse retina, originalmagnification X200. PE = pigment epithelium; OS and IS = outerand inner segment of photoreceptors; ONL = outer nuclear layer;INL = inner nuclear layer; IPL = inner plexiform layer; GCL= ganglion cell layer.
3 DAYS
IPSILATERAL EYE
6 DAYS
Fig. 5. Averaged ERGs recorded from an inoculated ipsilateraleye on days 3, 6 and 21 PI. Sixteen responses were averaged with adwell time of 4 msec. The numbers to the left of each ERG repre-sent the value of the neutral density filter used to attenuate the fullintensity stimulus. The recordings labelled "B" are the baselinenoise levels. The ERG shown at the bottom of the day 3 PI record-ings was recorded before dark adaptation with a 2.0 neutral densityfilter. No response was recorded on day 21 PI. Calibration: 200 fiVfor I = 0 on day 3 PI, and 100 ixV for all others; 100 msec.
Fig. 6. Averaged ERGs recorded from an inoculated eye on days4, 7 and 11 PI. Sixteen responses were averaged with a dwell time of4 msec. The numbers to the left of each ERG represent the value ofthe neutral density filter used to attenuate the full intensity stimu-lus. The recordings labelled "B" are the baseline noise levels. TheERGs shown at the bottom of the days 4 and 11 PI recordings wererecorded before dark adaptation and was recorded with a 2.0 neu-tral density filter. Calibration: 100 *iV; 100 msec.
but no further reduction was noted at 11 days. Thus,in this eye, the inoculation of HSV-1 led to a reduc-tion but not abolition of all components of the ERG.
The question then arose as to when the changes inthe ERG can be first detected in the inoculated eyes.The ERGs recorded from two ipsilateral eyes at day 2PI are shown in Figure 7. In both eyes, the thresholdstimulus intensity was elevated to 3.0 log units, andthe maximum b-wave amplitude was reduced to 190and 200 ^V. As in the previously shown ERGs, allcomponents were depressed. Four other eyes weretested on day 2 PI, and the means and SEM of theb-wave amplitudes for these six eyes are shown inFigure 8 along with the mean intensity-responsecurve for the normals. As in the individual ERGs, themean data showed that the threshold was higher (3.10log units) and the maximum b-wave amplitude wasreduced (200 jtV). An analysis of variance (with theNewman-Keuls multiple comparison procedure)showed that the responses at day 2 PI were signifi-cantly weaker than the normals (P < 0.001).
Similar ERG recordings were obtained from sixeyes tested on days 3, 4, and 5 PL The means andSEM of these results also are shown in Figure 8.There was no significant change between days 2 to 3PI, and between days 4 and 5 PI (P > 0.05). However,the decrease between days 2 and 4 was significant (P< 0.05).
The maximum b-wave amplitude (Vmax) was re-duced by approximately 60% on days 2-3 PI and by80% on days 4-5 PI. However, the stimulus intensity(I50) required to elicit a b-wave of one-half the Vmax
Downloaded From: http://iovs.arvojournals.org/pdfaccess.ashx?url=/data/journals/iovs/933372/ on 03/26/2018

No. 8 DEPRESSION OF ERG DY HSV-1 / Homosoki er ol 1247
IPSILATERAL EYE
2 DAYS 2 DAYS
Fig. 7. Averaged ERGs recorded from two inoculated eyes onday 2 PI. Sixteen responses were averaged with a dwell time of 4msec. The numbers to the left of each ERG represent the value ofthe neutral density filter used to attenuate the full intensity stimu-lus. The recordings labelled "B" are the baseline noise levels. TheERG shown at the bottom of the recordings in the left column wasrecorded before dark adaptation with a 2.0 neutral density filter.Calibration: 200 /uV for I = 0 and 1.0 for ERGs in right column,100 MV for all others; 100 msec.
>
500
400
300
200
100 J. J5 days
* "*" "i4 days
5.0 4.0 3.0 2.0 1.0 0
log stimulus Intensity
Fig. 8. A comparison of the intensity-response curves recordedfrom the inoculated eyes on days 2, 3, 4 and 5 PI with the inten-sity-response curves often normal eyes. Means and SEM are plot-ted. Six eyes were tested on each of the PI days. The log of thestimulus intensity is plotted on the abscissa and the b-wave ampli-tude on the ordinate.
was reduced only by approximately 0.50 log units fordays 2 through 5 PI. Thus, the herpesvirus has alteredthe Vmax more significantly than the sensitivity of theretina.
The mean and SEM of the b-waves obtained fromten ipsilateral retinas recorded after day 10 PI (days10-32) are shown in Figure 9 along with the data forthe eyes tested on day 5 PI. An analysis of varianceshowed that the differences were not significant (P> 0.05). These results indicate that the changes in theERG of the ipsilateral eyes are essentially completeby day 5 PI.
The alteration of the ERGs of the ipsilateral eyeswere classified as normal, reduced or abolished afterthe changes had run the full course (PI > 5-6 days).Of the 53 ipsilateral eyes followed for longer than 6days, four (7.5%) remained normal, 30 (56.6%) hadreduced ERGs and 19 (35.8%) had abolished ERGs(Table 1). These results demonstrate that followingthe inoculation of this dosage of the KOS strain ofHSV-1 into the anterior chamber, there is a reductionor abolition of the ERG in 92.4% of the inoculatedeyes.
Photomicrographs of retinas obtained at variousstages of the retinopathy in the inoculated eyes areshown in Figure 10A-D. A characteristic finding inthe retinas with reduced ERGs was the presence of
125
100
75
50
25
0
-
-
•
T/"
—V
I• — • PI
O---D PI
1
Ni
> 10 days
= 5 days
• i
5.0 4.0 3.0 2.0 1.0 0
log stimulus Intensity
Fig. 9. Intensity-response curves recorded on days 5 and 10 PI.Means and SEM are plotted. The log of the stimulus intensity isplotted on the abscissa and b-wave amplitude on the ordinate.
Downloaded From: http://iovs.arvojournals.org/pdfaccess.ashx?url=/data/journals/iovs/933372/ on 03/26/2018
1248 INVESTIGATIVE OPHTHALMOLOGY & VISUAL SCIENCE / August 1988 Vol. 29
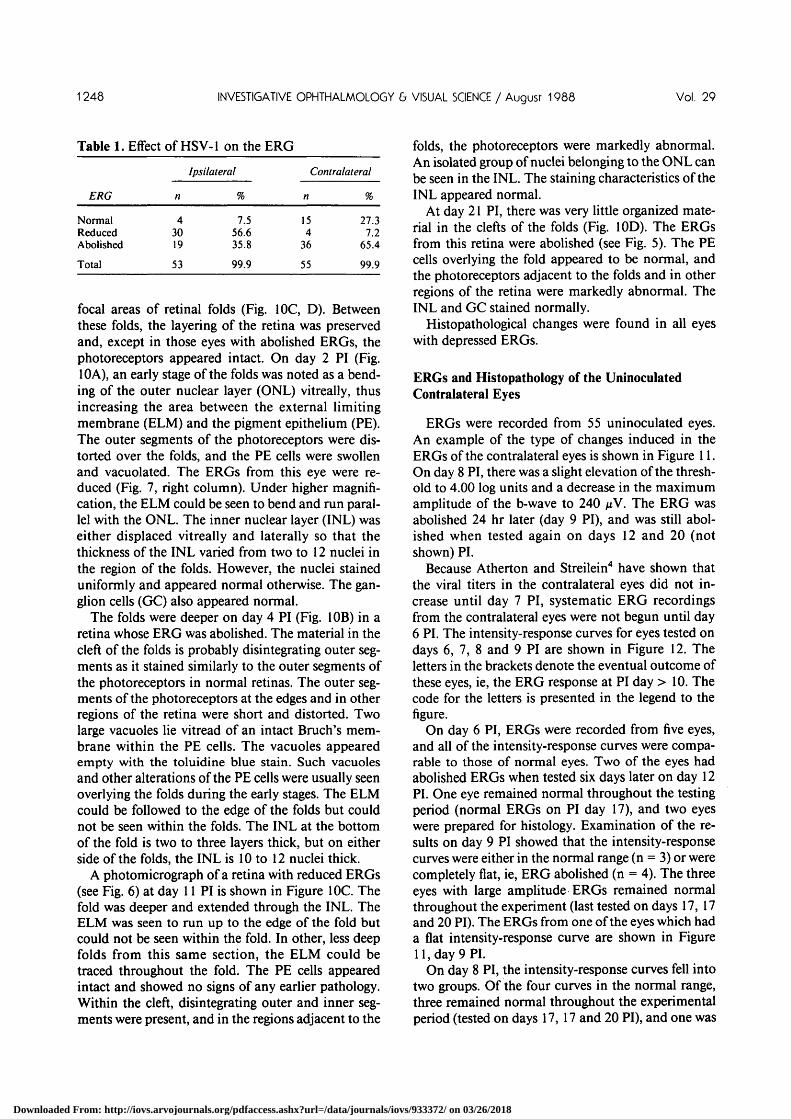
Table 1. Effect of HSV-1 on the ERG
ERG
NormalReducedAbolished
Total
n
43019
53
Ipsilateral
%
7.556.635.8
99.9
Contralateral
n
154
36
55
%
27.37.2
65.4
99.9
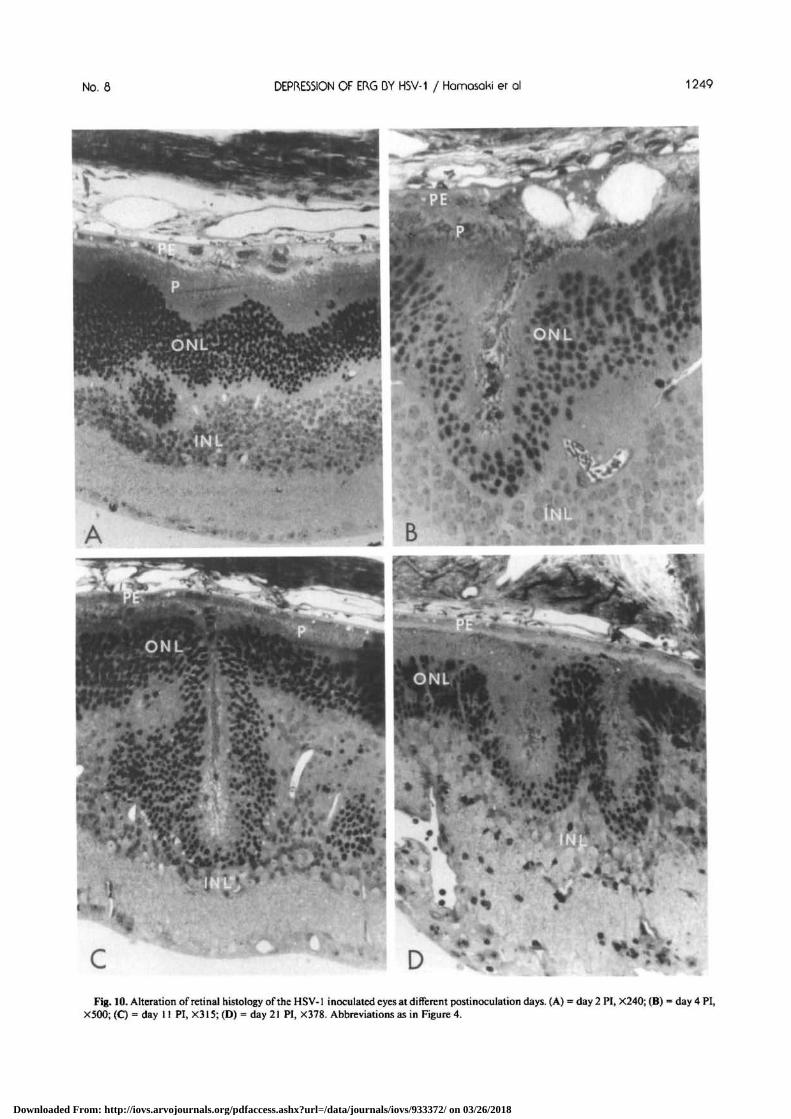
focal areas of retinal folds (Fig. IOC, D). Betweenthese folds, the layering of the retina was preservedand, except in those eyes with abolished ERGs, thephotoreceptors appeared intact. On day 2 PI (Fig.10 A), an early stage of the folds was noted as a bend-ing of the outer nuclear layer (ONL) vitreally, thusincreasing the area between the external limitingmembrane (ELM) and the pigment epithelium (PE).The outer segments of the photoreceptors were dis-torted over the folds, and the PE cells were swollenand vacuolated. The ERGs from this eye were re-duced (Fig. 7, right column). Under higher magnifi-cation, the ELM could be seen to bend and run paral-lel with the ONL. The inner nuclear layer (INL) waseither displaced vitreally and laterally so that thethickness of the INL varied from two to 12 nuclei inthe region of the folds. However, the nuclei staineduniformly and appeared normal otherwise. The gan-glion cells (GC) also appeared normal.
The folds were deeper on day 4 PI (Fig. 10B) in aretina whose ERG was abolished. The material in thecleft of the folds is probably disintegrating outer seg-ments as it stained similarly to the outer segments ofthe photoreceptors in normal retinas. The outer seg-ments of the photoreceptors at the edges and in otherregions of the retina were short and distorted. Twolarge vacuoles lie vitread of an intact Bruch's mem-brane within the PE cells. The vacuoles appearedempty with the toluidine blue stain. Such vacuolesand other alterations of the PE cells were usually seenoverlying the folds during the early stages. The ELMcould be followed to the edge of the folds but couldnot be seen within the folds. The INL at the bottomof the fold is two to three layers thick, but on eitherside of the folds, the INL is 10 to 12 nuclei thick.
A photomicrograph of a retina with reduced ERGs(see Fig. 6) at day 11 PI is shown in Figure IOC. Thefold was deeper and extended through the INL. TheELM was seen to run up to the edge of the fold butcould not be seen within the fold. In other, less deepfolds from this same section, the ELM could betraced throughout the fold. The PE cells appearedintact and showed no signs of any earlier pathology.Within the cleft, disintegrating outer and inner seg-ments were present, and in the regions adjacent to the
folds, the photoreceptors were markedly abnormal.An isolated group of nuclei belonging to the ONL canbe seen in the INL. The staining characteristics of theINL appeared normal.
At day 21 PI, there was very little organized mate-rial in the clefts of the folds (Fig. 10D). The ERGsfrom this retina were abolished (see Fig. 5). The PEcells overlying the fold appeared to be normal, andthe photoreceptors adjacent to the folds and in otherregions of the retina were markedly abnormal. TheINL and GC stained normally.
Histopathological changes were found in all eyeswith depressed ERGs.
ERGs and Histopathology of the UninoculatedContralateral Eyes
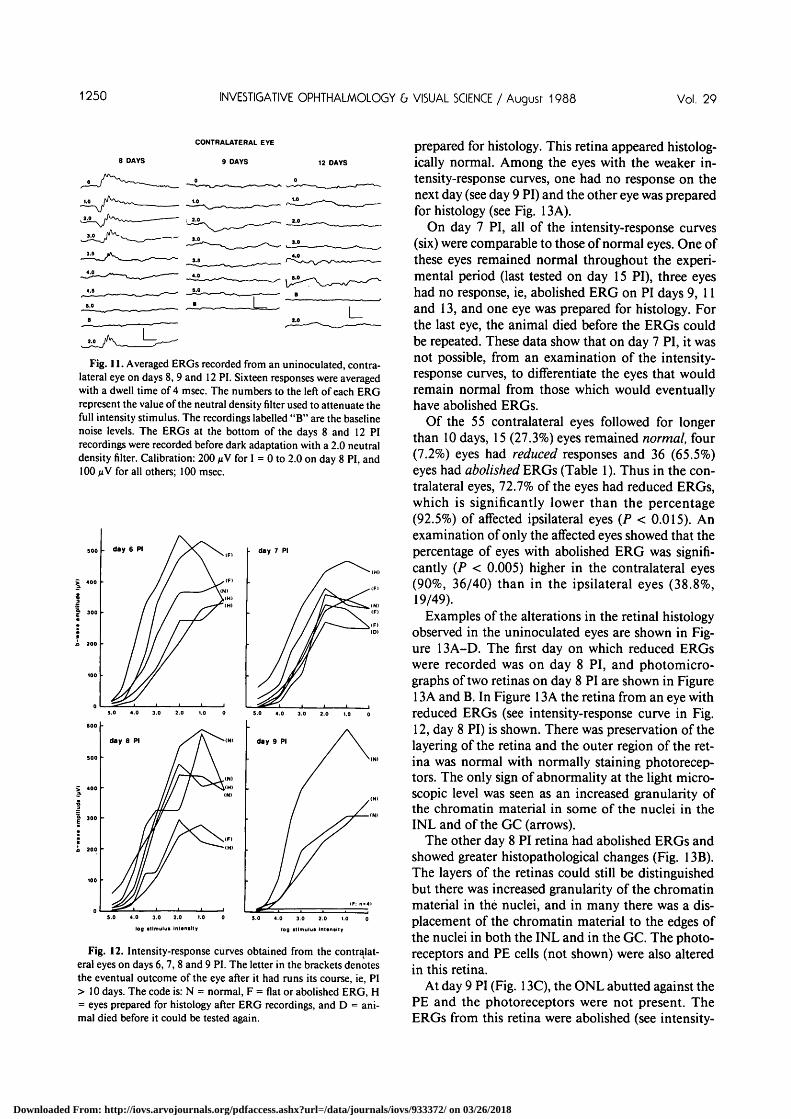
ERGs were recorded from 55 uninoculated eyes.An example of the type of changes induced in theERGs of the contralateral eyes is shown in Figure 11.On day 8 PI, there was a slight elevation of the thresh-old to 4.00 log units and a decrease in the maximumamplitude of the b-wave to 240 nV. The ERG wasabolished 24 hr later (day 9 PI), and was still abol-ished when tested again on days 12 and 20 (notshown) PI.
Because Atherton and Streilein4 have shown thatthe viral titers in the contralateral eyes did not in-crease until day 7 PI, systematic ERG recordingsfrom the contralateral eyes were not begun until day6 PI. The intensity-response curves for eyes tested ondays 6, 7, 8 and 9 PI are shown in Figure 12. Theletters in the brackets denote the eventual outcome ofthese eyes, ie, the ERG response at PI day > 10. Thecode for the letters is presented in the legend to thefigure.
On day 6 PI, ERGs were recorded from five eyes,and all of the intensity-response curves were compa-rable to those of normal eyes. Two of the eyes hadabolished ERGs when tested six days later on day 12PI. One eye remained normal throughout the testingperiod (normal ERGs on PI day 17), and two eyeswere prepared for histology. Examination of the re-sults on day 9 PI showed that the intensity-responsecurves were either in the normal range (n = 3) or werecompletely flat, ie, ERG abolished (n = 4). The threeeyes with large amplitude ERGs remained normalthroughout the experiment (last tested on days 17, 17and 20 PI). The ERGs from one of the eyes which hada flat intensity-response curve are shown in Figure11, day 9 PI.
On day 8 PI, the intensity-response curves fell intotwo groups. Of the four curves in the normal range,three remained normal throughout the experimentalperiod (tested on days 17, 17 and 20 PI), and one was
Downloaded From: http://iovs.arvojournals.org/pdfaccess.ashx?url=/data/journals/iovs/933372/ on 03/26/2018
No. 8 DEPRESSION OF ERG DY HSV-1 / Hamosoki er ol 1249
D *' \ 'Fig. 10. Alteration of retinal histology of the HSV-1 inoculated eyes at different postinoculation days. (A) = day 2 PI, X240; (B) = day 4 PI,
X500; (C) = day 11 PI, X315; (D) = day 21 PI, X378. Abbreviations as in Figure 4.
Downloaded From: http://iovs.arvojournals.org/pdfaccess.ashx?url=/data/journals/iovs/933372/ on 03/26/2018
1250 INVESTIGATIVE OPHTHALMOLOGY b VISUAL SCIENCE / August 1988 Vol. 29
CONTRALATERAL EYE
9 DAYS
Fig. 11. Averaged ERGs recorded from an uninoculated, contra-lateral eye on days 8, 9 and 12 PI. Sixteen responses were averagedwith a dwell time of 4 msec. The numbers to the left of each ERGrepresent the value of the neutral density filter used to attenuate thefull intensity stimulus. The recordings labelled "B" are the baselinenoise levels. The ERGs at the bottom of the days 8 and 12 PIrecordings were recorded before dark adaptation with a 2.0 neutraldensity filter. Calibration: 200 /xV for I = 0 to 2.0 on day 8 PI, and100 MV for all others; 100 msec.
log atlmului Intontlty
Fig. 12. Intensity-response curves obtained from the contralat-eral eyes on days 6, 7, 8 and 9 PI. The letter in the brackets denotesthe eventual outcome of the eye after it had runs its course, ie, PI> 10 days. The code is: N = normal, F = flat or abolished ERG, H= eyes prepared for histology after ERG recordings, and D = ani-mal died before it could be tested again.
prepared for histology. This retina appeared histolog-ically normal. Among the eyes with the weaker in-tensity-response curves, one had no response on thenext day (see day 9 PI) and the other eye was preparedfor histology (see Fig. 13A).
On day 7 PI, all of the intensity-response curves(six) were comparable to those of normal eyes. One ofthese eyes remained normal throughout the experi-mental period (last tested on day 15 PI), three eyeshad no response, ie, abolished ERG on PI days 9, 11and 13, and one eye was prepared for histology. Forthe last eye, the animal died before the ERGs couldbe repeated. These data show that on day 7 PI, it wasnot possible, from an examination of the intensity-response curves, to differentiate the eyes that wouldremain normal from those which would eventuallyhave abolished ERGs.
Of the 55 contralateral eyes followed for longerthan 10 days, 15 (27.3%) eyes remained normal, four(7.2%) eyes had reduced responses and 36 (65.5%)eyes had abolished ERGs (Table 1). Thus in the con-tralateral eyes, 72.7% of the eyes had reduced ERGs,which is significantly lower than the percentage(92.5%) of affected ipsilateral eyes (P < 0.015). Anexamination of only the affected eyes showed that thepercentage of eyes with abolished ERG was signifi-cantly (P < 0.005) higher in the contralateral eyes(90%, 36/40) than in the ipsilateral eyes (38.8%,19/49).
Examples of the alterations in the retinal histologyobserved in the uninoculated eyes are shown in Fig-ure 13A-D. The first day on which reduced ERGswere recorded was on day 8 PI, and photomicro-graphs of two retinas on day 8 PI are shown in Figure13 A and B. In Figure 13 A the retina from an eye withreduced ERGs (see intensity-response curve in Fig.12, day 8 PI) is shown. There was preservation of thelayering of the retina and the outer region of the ret-ina was normal with normally staining photorecep-tors. The only sign of abnormality at the light micro-scopic level was seen as an increased granularity ofthe chromatin material in some of the nuclei in theINL and of the GC (arrows).
The other day 8 PI retina had abolished ERGs andshowed greater histopathological changes (Fig. 13B).The layers of the retinas could still be distinguishedbut there was increased granularity of the chromatinmaterial in the nuclei, and in many there was a dis-placement of the chromatin material to the edges ofthe nuclei in both the INL and in the GC. The photo-receptors and PE cells (not shown) were also alteredin this retina.
At day 9 PI (Fig. 13C), the ONL abutted against thePE and the photoreceptors were not present. TheERGs from this retina were abolished (see intensity-
Downloaded From: http://iovs.arvojournals.org/pdfaccess.ashx?url=/data/journals/iovs/933372/ on 03/26/2018

No. 8 DEPRESSION OF ERG DY HSV-1 / Homosoki er ol 1251
Fig. 13. Alteration of retinal histology of the uninoculated eyes at different post-inoculation days. (A) = day 8 PI, X625; (B) = day 8 PI,X528; (C) = day 9 PI, X800; and (D) = day 11 PI, X65O. Abbreviations as in Figure 4.
Downloaded From: http://iovs.arvojournals.org/pdfaccess.ashx?url=/data/journals/iovs/933372/ on 03/26/2018

1252 INVESTIGATIVE OPHTHALMOLOGY 6 VISUAL SCIENCE / August 1988 Vol. 29
Table 2. Correlation between the ERGs of paired eyes
Inoculated
NormalReducedAbolished
Normal
314
Uninoculated
Reduced
030
Abolished
0168
response curve in Fig. 12, day 9 PI). Most of thenuclei in the INL were devoid of chromatin materialand appeared as empty circles. The nuclei of the ONLwere intermixed with those of the INL which made itdifficult to differentiate these two layers. There wasalso increased granularity of the chromatin materialin the nuclei of the PE cells.
By day 11 PI (Fig. 13D), the retinal architecturewas lost, with nuclei of the ONL and INL intermixed.The ERG was abolished from this retina. The nucleiof the ONL were abutted against the PE cells with nosign of the photoreceptors. The histopathological ap-pearance of the other eye of this animal is shown inPlate IOC, and the ERGs are shown in Figure 6. Byday 14 PI, the retina was completely necrotic withcomplete loss of all retinal architecture.3'514
All of the uninoculated eyes with depressed ERGshad retinal histopathological changes and those withnormal ERGs (n = 15) had normal retinas.
Correlation Between the ERG Changes in theInoculated and Uninoculated Eyes
An examination was made of 35 pairs of eyeswhich had ERGs recorded from both eyes after thepathological process had run its full course, ie, afterday 10 PI (Table 2). There were three inoculated eyeswhich had normal ERGs and in all three animals, theopposite eyes also had normal responses. In none ofthe 35 pairs of eyes was there a pair with normalERGs in the inoculated eyes and depressed ERG inthe other eye. These findings would suggest that inthe inoculated eyes with normal ERGs the virus didnot get to the retina of the inoculated eyes.
A comparison of the changes in the two eyesshowed that the uninoculated eyes with abolishedERGs were paired with eyes with either reduced orabolished ERGs. There were eight uninoculated eyeswith normal ERGs and three of these were pairedwith inoculated eyes with normal ERGs. For theother five eyes, the ERGs were abolished in four andreduced in one of the paired inoculated eyes. Thissuggests that the absence of a pathological change inthese eyes was not due to the failure of injecting thevirus into the other eye.
Discussion
The results of this study have shown that the ERGchanges induced by HSV-1 inoculation into the ante-rior chamber of one eye were very different for theinoculated and uninoculated eyes. In the inoculatedeyes, reduced amplitude ERGs were recorded in92.5% of the eyes, which was significantly higher thanthe 72.7% of the contralateral eyes with reduced re-sponses. The percentage of eyes with abolishedERGs, on the other hand, was significantly higher inthe contralateral eyes (90%) than in the ipsilateraleyes (38.8%). Another difference between the eyeswas the time course of the changes: in the ipsilateraleyes, the changes were seen as early as day 2 PI andcompletely abolished ERGs were seen by day 4 PI; inthe contralateral eyes, the first changes were noted atday 8 and abolished responses were recorded on days8 to 9 PI.
At first hand, it might be suggested that the higherpercentage of altered ipsilateral eyes is related to thefact that the inoculation was performed in this eye.However, while the peak viral titers in the ipsilateraland contralateral eyes were comparable, the time ofpeak titers was different.5 In addition, the percentageof eyes (posterior segments) from which viral DNAcould be recovered was the same for the two eyes,although the day of peak recovery was different.5
Thus, the significantly higher percentage of inocu-lated eyes with altered ERGs cannot be explained asresulting from the inoculation of the herpesvirus intothis eye.
The histological study of the retinas showed thatthe pathological changes in the two eyes were alsovery different. In the inoculated eyes, the changeswere mainly in the outer retina and PE. There werefocal areas of retinal folds interspersed with regions ofnormal-appearing retina. Associated with these foldswere pathological changes in the PE. The photorecep-tors within and adjacent to the folds were degener-ated, and in some retinas, the photoreceptors wereabnormal throughout the retina. The inner retina ap-peared to be normal. In the uninoculated eye, on theother hand, changes were first seen in the inner retinaas alterations in the chromatin material of the nucleiin the INL and in the GCL. There was then a rapidprogression of the changes to include the photorecep-tors and the PE. After running its full course, theretina was completely necrotic with fibrous tissue re-placing the retina.
The pathological changes in the ipsilateral retina—the retinal folds—has not been described previouslyin this model of herpetic retinitis although folds in theretina have been described previously in newbornrabbits following subcutaneous inoculation of
Downloaded From: http://iovs.arvojournals.org/pdfaccess.ashx?url=/data/journals/iovs/933372/ on 03/26/2018

No. 8 DEPRESSION OF ERG DY HSV-1 / Homosoki er ol 1250
HSV-2.14 Retinal folds have also been observed fol-lowing other viral infection of neonatal retinas in avariety of animals.7"10 Although it is difficult to "fol-low" the evolution of the folds by histological studies,it appears that the depth of the folds can increase overthe first several days PI. The mechanism for the gen-eration of these folds remains unclear but the juxta-position of PE changes and the folds might suggest acausal relationship.
The significant higher percentage of abolishedERGs in the uninoculated eyes is probably a reflec-tion of the more severe histopathological changes inthe contralateral retinas. In the contralateral eyes,there is complete retinal necrosis so that even thegross structure of the retina is lost (Fig. 13D).3-5 Thispanretinal necrosis can easily account for the abol-ished ERGs. In the four eyes with reduced ERGs, theretinas were not completely necrotic. In the ipsilateraleyes, the layering of the retina is preserved3 (Fig.10A-D), but the retina is not completely normal ascharacteristic retinal folds were observed in the ipsi-lateral retinas with reduced ERGs. Between thesefolds, normal-appearing retina is present. We suggestthat the responses arise from these areas of normalretina, and that the folds account for the reduction ofthe ERGs. In those inoculated eyes with abolishedERGs, the photoreceptors throughout the sectionsexamined were abnormal. However, because of thelimited area of the retina examined in histologicalsections, it is not possible to state that the photorecep-tors throughout the entire retina were abnormal. Inlike manner, it was not possible to correlate the de-gree of reduction of the ERG with the degree of reti-nal pathology because of the limited sampling of theretina.
The pathogenesis of the retinopathy of the inocu-lated and uninoculated eyes has not been established,and two hypotheses have been put forth on the mech-anism.3'513 The first hypothesis states that thechanges result from the direct cytopathic effect of theherpesvirus, and the second hypothesis states that thechanges result from the immunological responses ofthe animal which attack and destroy the virus-in-fected cells. The differences in the ERG and histo-pathological changes in the two eyes may indicatethat these two mechanisms may be operating in the .two eyes.
It should also be considered that initially the her-pesvirus may alter the excitability mechanisms of theretinal neurons without altering the morphology ofthe retinal cells, as has been reported for dorsal rootganglion cells (DRG) in culture. Fukuda and Ku-rata15 and Mayer et al16 have shown that infection ofDRG cells by HSV-1 resulted in the loss of excitabil-ity with the preservation of the resting membrane
potential and the input resistance of the cells. Thegross morphology of the cells was not altered at thisstage. The depression of excitability was explained asresulting from a decrease in Na+ channel activity sim-ilar to tetrodotoxin poisoning. This loss of excitabilitywas induced by two nonsyncytial strains of theHSV-1. In contrast, one syncytial strain of HSV-1 didnot alter the excitability of the DRG cells but inducedspontaneous action potentials.16 The KOS strain ofHSV-1 used here is a nonsyncytial strain of HSV-1.Thus, if the KOS strain of the HSV-1 is acting in asimilar fashion on the retinal neurons, there might bea reduction in the amplitude of the ERG withoutsignificant alterations in the morphology of theretina.
As shown, there was a depression of all compo-nents of the ERG in both the inoculated and uninoc-ulated eyes. This finding is somewhat unusual inas-much as alteration of the extracellular environment,eg, pH, PO2, high K+, or the exposure of the retina totoxins usually leads to a preferential loss of the b-wave leaving the late receptor potential.17"19 This lossof the b-wave has been interpreted as resulting fromthe greater sensitivity of the cells in the inner retina tothe altered conditions. With HSV-1 infection, how-ever, it appears that either all of the retinal cells areaffected or that the photoreceptors are primarily af-fected, leading to depression of cells fed by the photo-receptors. Immunoperoxidase staining showed thatantigen-bearing cells were found in all layers of theretina,6 and thus the effect of the virus does not ap-pear to be primarily on the photoreceptors.
The use of the ERG has provided new informationon the pathological changes in retinal function in-duced by HSV-1 infection. The ability to follow thetime course of the disease and to assess the extent ofthe loss of excitability may provide additional infor-mation on the mechanism of the HSV-1 induced pa-thology.Key words: herpes simplex virus type 1, HSV-1, virus, elec-troretinogram, mouse, histopathology, retinopathy
Acknowledgments
We acknowledge gratefully Ms. Maria Saenz, Mr. O. Na-varro and Mr. Pablo Calzada for their excellent assistancewith the experiments. We also thank Mr. Bill Feuer for thestatistical analysis.
References1. von Szily A: Experimentelle endogene Infektionsubertragung
von Bulbus zu Bulbus. Klin Monatsbl Augenheilkd 72:593,1924.
2. Kimura SJ: Herpes simplex uveitis: A clinical and experimen-tal study. Trans Am Ophthalmol Soc 60:440, 1962.
3. Whittum JA, McCulley JP, Niederkorn JY, and Streilein JW:
Downloaded From: http://iovs.arvojournals.org/pdfaccess.ashx?url=/data/journals/iovs/933372/ on 03/26/2018

1254 INVESTIGATIVE OPHTHALMOLOGY & VISUAL SCIENCE / Augusr 1988 Vol. 29
Ocular disease induced in mice by anterior chamber inocula-tion of herpes simplex virus. Invest Ophthalmol Vis Sci25:1065, 1984.
4. Holland GN, Togni BI, Briones OC, and Dawson CR: A mi-croscopic study of herpes simplex virus retinopathy in mice.Invest Ophthalmol Vis Sci 28:1181, 1987.
5. Atherton SS and Streilein JW: Two waves of virus followinganterior chamber inoculation of HSV-1. Invest OphthalmolVis Sci 28:571, 1987.
6. Dix RD, Saenz M, and Atherton SS: Distribution of virus-spe-cific antigens during the evolution of experimental herpessimplex virus type 1 retinitis. ARVO Abstracts. Invest Oph-thalmol Vis Sci 28(Suppl):45, 1987.
7. Albert DM, Lahav M, Colby ED, and Shadduck JA: Retinalneoplasia and dysplasia: I. Induction by feline leukemia virus.Invest Ophthalmol 16:325, 1977.
8. Silverstein AM, Parshall CJ Jr, Osburn BI, and PrendergastRA: An experimental, virus-induced retinal dysplasia in thefetal lamb. Am J Ophthalmol 72:22, 1971.
9. Love A, Malm G, Rydbeck R, Norrby E, and Kristensson K:Developmental disturbances in the hamster retina caused by amutant of mumps virus. Dev Neurosci 7:65, 1985.
10. Monjan A A, Silverstein AM, and Cole GA: Lymphocyticchroiomeningitis virus-induced retinopathy in newborn rats.Invest Ophthalmol 11:850, 1972.
11. Tremain ICE and Ikeda H: Physiological deficits in the visualsystem of mice infected with Semliki Forest virus and their
correlation with those seen in patients with demyelinating dis-ease. Brain 106:879, 1983.
12. Niederkorn JY, Streilein JW, and Shadduck JA: Deviant im-mune responses to allogeneic tumors injected intracamerallyand subcutaneously in mice. Invest Ophthalmol Vis Sci20:355, 1981.
13. Whittum-Hudson J, Farazdaghi M, and Prendergast RA: Arole for T lymphocytes in preventing experimental herpessimplex virus type 1-induced retinitis. Invest Ophthalmol VisSci 26:1524, 1985.
14. Brick DC, Oh JO, and Sicher SE: Ocular lesions associatedwith dissemination of type 2 herpes simplex virus from skininfection in newborn rabbits. Invest Ophthalmol Vis Sci21:681, 1981.
15. Fukuda J and Kurata T: Loss of membrane excitability afterherpes simplex virus infection in tissue-cultured nerve cellsfrom adult mammals. Brain Res 211:235, 1981.
16. Mayer ML, James MH, Russell RJ, Kelly JS, and PasternakCA: Changes in excitability induced by herpes simplex virus inrat dorsal root ganglion neurons. J Neurosci 6:391, 1986.
17. Brown KT: The electroretinogram: Its components and theirorigin. Vision Res 8:633, 1968.
18. Fujino T and Hamasaki DI: The effect of occluding the retinal'and choroidal circulation on the electroretinogram of mon-keys. J Physiol 180:837, 1965.
19. Rodieck RW: The Vertebrate Retina: Principles of Structureand Function. San Francisco, W.F. Freeman & Co., 1973.
Downloaded From: http://iovs.arvojournals.org/pdfaccess.ashx?url=/data/journals/iovs/933372/ on 03/26/2018


![Retinal Electrophysiology Is a Viable Preclinical Biomarker ......[39].Thussystemic(i.e.,intramuscular,IM)applicationof muscimol should result in ERG and VEP changes similar to those](https://static.fdocuments.in/doc/165x107/601b118572a05904a428c810/retinal-electrophysiology-is-a-viable-preclinical-biomarker-39thussystemicieintramuscularimapplicationof.jpg)