BIHAR KOSI FLOOD (2008) NEEDS ASSESSMENT …...1 BIHAR KOSI FLOOD (2008) NEEDS ASSESSMENT REPORT...
74
BIHAR KOSI FLOOD (2008) NEEDS ASSESSMENT REPORT Prepared by Government of Bihar World Bank Global Facility for Disaster Reduction & Recovery June 2010
Transcript of BIHAR KOSI FLOOD (2008) NEEDS ASSESSMENT …...1 BIHAR KOSI FLOOD (2008) NEEDS ASSESSMENT REPORT...

1
BIHAR
KOSI FLOOD (2008)
NEEDS ASSESSMENT REPORT
Prepared by
Government of Bihar
World Bank
Global Facility for Disaster Reduction & Recovery
June 2010

2
Executive Summary
On 18 August 2008, the Kosi River burst through its eastern embankment about 13 km upstream of the
Kosi Barrage in Nepal, 8 km north of the Indian border. At its peak, the intensity of water force went up
to 166,000 cubic feet per second (cusec) compared with the regular 25,744 cusec, running straight down
south through a new course 15-20 km wide and 150 long north to south. This created major flooding in
Nepal and India - Bihar in particular. According to official sources, a total of 3.3 million people were
affected in Bihar alone.
The districts of Supaul, Saharsa, Madhepura, Araria and Purnia in Bihar were severely affected by the
flood. A total area of close to 3700 sq. km, 30 percent of the affected areas districts, was inundated,
affecting 412 Panchayats and 993 villages. Approximately 493 lives were lost and 3,500 were reported
missing after the disaster.
The Government of Bihar (GoB) was extremely proactive in relief operations in the immediate aftermath
of the flood. An emergency response effort was initiated by the State government with assistance from the
Indian Army, Air Force, Navy, National Disaster Response Force (NDRF), as well as a number of
international and national relief organizations. An extensive evacuation operation was undertaken to bring
approximately 1 million evacuees to safety. The State Government set up 360 relief camps within school
and college buildings and tents to house evacuees. At peak, more than 440,000 people were living in
camps.
The floods impacted already vulnerable communities with low human and economic development
indicators and relatively low coping capacities. Bihar‟s poverty rate is 42 percent compared with India‟s
average of 28 percent. Rural poverty in Bihar was 45 percent in 2004, the second highest after Orissa. 1
The population in Bihar is perennially affected by floods - 30 of its 38 districts (73 percent of its
geographical area) are flood-prone and afflicted by floods almost annually, especially from the rivers west
of the Kosi. The state is the most flood-prone in the country. Bihar‟s hydrological vulnerability is
aggravated by its flat topography, high rainfall (more than 2,500 mm annually and up to 80 percent of
annual precipitation from June to September) and high sediment loads of rivers.
The Government of Bihar‟s institutional capacity to manage the disaster was particularly challenged with
the preceding large-scale flood of 2007 followed by the Kosi floods of 2008. Furthermore, the affected
districts were not exposed to inundation from the Kosi River since it‟s embankment in 1963. The
population, as well as local and state government structures, was not fully prepared for such a level of
disaster. Hence, recovery from these two consecutive „unprecedented‟ disasters ha stretched public
infrastructure, public services, and fiscal resources beyond limits. While GoB was extremely proactive in
1 In India, Below Poverty Line (BPL) is an economic benchmark and poverty threshold used by the Government of
India to indicate economic disadvantage and identify individuals and households in need of government assistance
and aid. Criteria have been developed for rural and urban areas to measure the degree of deprivation through a host
of parameters with scores given from 0-4. Families with 17 marks or less out of 52 marks are classified as BPL. The
World Bank recognizes the poverty line to be per capita income under US$2 a day.

3
the emergency response, there has not been any significant reconstruction, and recovery needs are still
enormous and beyond present capacity.
The Bank received a request for reconstruction assistance in December 2009. A mission to the affected
areas in April 2010 concurred with the GoB that a comprehensive assistance program was urgent.
Reconstruction and recovery activities have been significantly delayed due to insufficient funding.
Already vulnerable populations are stretched to the limits to cope with the aftermath of the disaster. The
Bank immediately initiated the preparation of an emergency recovery project, beginning with a Needs
Assessment.
The objective of the Needs Assessment is: (i) to guide the design and investment prioritization of the
proposed Kosi Flood Recovery project; (ii) provide a damage overview in key sectors including water
resources and flood management, roads and bridges, housing, agriculture, social, environmental, and
health; (iii) to identify current recovery initiatives and progress made; and, (iv) to identify short, medium,
and long-term needs and priority interventions. The Needs Assessment was undertaken by a World
Bank/GFDRR team in close cooperation with GoB.
Methodology and Limitations
A three-pronged methodology was employed to complete information gathering in the Needs Assessment:
(i) obtaining government damage data from the relevant government departments; (ii) review of reports
on damage and recovery needs from GoB and other sources; and, (iii) limited cross-verification of the
centrally obtained data through focused sample surveys, field visits, and the aggregation of the needs in
the relevant sectors as derived from the verified damages.
During the Needs Assessment mission in May 2010, World Bank staff held extensive discussions with
Development Commissioner, GoB, and Principal Secretaries of Planning, Water Resources, Minor Water
Resources, Agriculture, Road Construction, Rural Works, Disaster Management and other relevant
departments and obtained damage data. These reports were reviewed and followed by a field visit for
sample verification of damages and validation of data furnished by GoB.
Subsequently, an extensive discussion was held with the GoB on the priorities of the report. It was
determined that greater emphasis would be given to a forward-looking recovery framework and the
treatment of challenges and longer-term issues that GoB would utilize for planning its longer-term
disaster risk management and reduction work plan.
As mentioned previously, a considerable period has lapsed since the disaster event – 22 months – which
has impacted the overall Assessment as some amount of reconstruction work has been complete or is
already underway. This poses a large structural limitation to verification of disaster damage.
The second limitation is data availability. As comprehensive data is not available on economic losses, it
was not feasible to deploy the UN-ECLAC Damage and Loss Assessment Methodology.2 The
2 Methodology for disaster damage and loss assessment developed by the UN Economic Commission for Latin
America and the Caribbean (UN-ECLAC)

4
Assessment Team used the empirical methodology of assessing damages and determining needs based on
disaster risk reduction elements and under the overall reconstruction paradigm of building back better.
As GoB requested the team to focus on the worst-hit sectors and on the key components of the proposed
Kosi Flood Reconstruction project, some sectors that are normally covered in typical Needs Assessments
have not been covered due to negligible damage in those sectors, paucity of time, prioritization of sectors
by the Government, and constraints of data availability.
Damage Overview
Housing: According to GoB figures, 236,632 houses were fully or partially destroyed across the districts
of Supaul, Madhepura, Saharsa, Araria, and Purnea. The estimated damage is Rs. 5,935 million (US$
134.9 million). Of these, the first three districts were the worst hit with over 95 percent of the reported
damage.
Roads and Bridges: About 1800 kilometers of paved and unpaved roads and about 1100 bridges and
culverts were destroyed in the floods. Maximum damages were reported in Supaul, Madhepura and
Saharsa.
Water Resources (Irrigation and Flood Protection): Extensive structural damage was caused to irrigation
and flood protection infrastructure, including the Kosi barrage. More than 6 km of the main Eastern Kosi
Canal was fully damaged, 3 km of the branch, and 1 km partially damaged. Over 150 km of the
distributaries and sub-distributaries were fully damaged, as well as 730 km of the water courses, 151
canal bridges, and 138 regulators.
Agriculture and Livestock: Over 350,000 acres of paddy, 18,000 acres of maize and 240,000 of other
crops were adversely affected, impacting close to 500,000 farmers. Approximately 10,000 milk animals,
3000 draught animals, and 2500 small ruminants perished in the disaster
In addition to these sectors, major damages were caused to the livelihoods, health, education, social, and
environment sectors. Over 90 percent of the flood affected population was dependent on agricultural
livelihoods which were severely affected. Educational infrastructure and scholastic calendars were
affected in all five districts, and regular curative and preventative health services disrupted. In addition,
273,000 acres of arable land has been rendered fallow due to sand-casting with long-term implications for
the environment, agriculture, and livelihoods.
Overview of Recovery and Reconstruction Needs
Housing: Immediate reconstruction needs in the housing sector have been calculated at Rs. 9.9 billion
(US$ 225 million) for 157,428 houses declared eligible for assistance under current GoB interventions.
Special attention needs to be paid to the landless, to affordable availability of quality construction
materials and re-verification of eligible beneficiaries.
Roads and Bridges: The need for reconstruction for roads and bridges has been estimated at Rs 13.9
billion (US$317 million) taking into account the time elapsed since the disaster, the need for multi-hazard
resistant construction, and better quality construction to “build back better” after the disaster.

5
Water Resources (Irrigation and Flood Protection): A comprehensive assessment of long-term needs for
water resources has not been complete, however, GoB figures estimate the need for reconstruction in the
sector to be Rs 26828 million (US$591.4 million). This approximate figure is for reconstruction needs of
the bund, barrage, embankments, and Kosi Main canal and related irrigation networks.
Agriculture and livestock: With long-term damage to the agricultural sector, the needs assessment has
identified a set of technological and agricultural measures to be taken in the medium and long-term to
restore fertility, where possible, and to assist populations to transition to alternative livelihoods wherever
reclamation is not feasible.
The Assessment also identified a number of priority areas for recovery in the livelihoods, health,
education, social, and environmental sectors. There is a need to build a strategy that includes increasing
agricultural productivity as well as developing alternative livelihood options in the non-farming sector.
Other needs include reconstructing destroyed academic institutions, putting in place counseling programs
for students and teachers, re-distributing pedagogic materials, strengthening basic health services in
communities, and maintaining vector and water-borne disease control.
Challenges
Recovery of flood affected areas in Bihar should be an opportunity to initiate improvements in quality of
life and changes in attitudes about risk while undertaking reconstruction tasks. Sustainable reconstruction
efforts after a disaster can help revive the local economy, restore livelihoods, and improve access to
housing, its quality and safety, as well as social and community infrastructures. Peoples‟ participation in
reconstruction activities through processes such as owner-driven reconstruction reinforces equity and
strengthens community networks.
While the Needs Assessment points to a number of specific interventions and activities for future
recovery, the real challenge in a vulnerable State such as Bihar is to ultimately achieve policy and
institutional paradigm shifts towards mainstreaming disaster risk management into the overall
development process rather than one-time initiatives focusing on small groups of people, or led through
short-term project approaches. There is an urgent need for long-term transformations on how risk is
managed in the State to ensure that the normal stay of development interventions are not put in jeopardy.
This specifically entails measures for risk reduction from future flooding of the Kosi through a
combination of structural and non-structural measures as well as the development of an overall state-wide
holistic flood risk management master plan. In the long term, measures should include scaling up of Kosi-
specific measures to the entire State of Bihar. The interventions need to be supported by institutional and
structural measures for enhanced disaster risk reduction and better disaster response preparedness to
ensure that the Bihar growth story remains sustainable in the long run.
Recovery Framework
A two-phased approach for reconstruction is recommended in order to address the short, medium, and
long-term needs of recovery. The objective of Phase I would be to provide timely and focused support to
Bihar‟s reconstruction efforts in the short-term with World Bank assistance for reconstruction and
restoration of priority infrastructure, housing reconstruction and livelihoods restoration of the affected

6
population in the Kosi Command Area. The objective of Phase II would be to enlarge the interventions of
Phase I to the entire disaster-prone areas of Bihar in and beyond the Kosi Command Area, including
support for the State‟s longer-term needs for overall disaster management, in particular, flood risk
management.
The presented assessment report should be understood as an important contribution for identifying key
priority areas in support of long-term sustainable development in the State of Bihar.

7
Contents
Executive Summary 2
List of Abbreviations 7
List of Tables, Figures, Box 8
Section 1 The Disaster 10
1.1 The 2008 Kosi Floods
1.2 Emergency Response
1.3 The Kosi districts in the context of Bihar
Section 2 Objective, Methodology, and Limitations 14
2.1 Overview
2.2 Objectives
2.3 Methodology
2.4 Limitations
Section 3 Needs Assessment 16
3.1 Overview
Infrastructure
3.2 Housing
3.3 Roads and Bridges
3.4 Water resources
Productive sectors
3.5 Agriculture (Crops, Livestock)
3.6 Livelihoods
Social sectors
3.7 Education
3.8 Health
3.9 Social
Crosscutting
3.10 Environment
Section 4 Crosscutting Challenges and Opportunities 46
4.1 Low human development
4.2 High disaster risks
4.3 Flood risk management
4.4 Disaster risk management
4.5 Conclusions
Section 5 Recovery Framework 53
Annexes 55

8
List of Abbreviations
BPL Below Poverty Line
CCA Cultivable Command Area
CSO Central Statistical Organization
DaLA Damage and Loss Assessment
DRR Disaster Risk Reduction
ERM Emergency Repair and Maintenance
GDP Gross Domestic product
GFDRR Global Facility for Disaster Reduction and Recovery
GoB Government of Bihar
GoI Government of India
GoN Government of Nepal
GSDP Gross State Domestic Product
IAY Indira Awas Yojana
ICDS Integrated Child Development Scheme
IRC Indian Road Congress
KBCAT Kosi Breach Closure Advisory Team
MDR Major District Road
MoSPI Ministry of Statistics and Program Implementation, GoI
NH National Highway
NRHM National Rural Health Mission
NSSO National Sample Survey Organization
PHC Primary Health Center
SHC Subsidiary Health Center
TSC Total Sanitation Campaign
SH State Highway

9
List of Tables
1 Summary of damages and needs by sector 16
2 Number of houses damaged in Kosi Floods 2008, by district and 17
type of housing
3 Cumulative housing reconstruction needs 17
4 GoB relief packages based on household categories 19
5 Estimated damages to roads and bridges, national highways, 20
state highways, and major district roads
6 Estimated Damages to Roads and Bridges in Rural Areas 21
7 Estimated cost of damages to roads and bridges in affected 22
areas (in INR, million)
8 Cumulative needs in roads and bridges sector (in INR, million) 23
9 Reconstruction needs for Eastern Afflux Bund, Bhimnagar Barrage and 29
Embankments and costing in INR, millions
10 Damage to crops by district 32
11 Estimates for livelihoods support activities 36
12 Estimates of needs in the education sector 37
13 Damages in the health sector 38
14 Needs in the health sector 39
15 Summary of key environmental damages 43
16 Area affected by sand casting 43
17 GSDP at Current Prices 2000-2007 46
18 Proposed recovery framework 53
List of Figures
1 State of Bihar 10
2 Map of Kosi river inundated areas in Bihar 10
3 Evacuated people and livestock, Saharsa, August 2008 11
4 Arial view of Kosi floods, 2008 12

10
5 Average per capita income in select Indian cities 47
6 Hydrological Map of the Ganga Basin in Bihar 47
7 Silt deposition near Kosi embankment at Navbhata, Saharsa, Bihar 48
8 Flood risks in Bihar 48
List of Boxes
1 History of Kosi Embankment Breaches 13
2 Indira Awas Yojana (IAY) 18
3 Background of Kosi Eastern Afflux Embankment 26
4 The Kosi River and its Catchment 49

11
Section 1 The Disaster
1.1 The 2008 Kosi Floods
On 18 August 2008, the Kosi River burst through its eastern embankment
about 13 km upstream of the Kosi Barrage in Nepal, 8 km north of the
Indian border. At its peak, the intensity of water force went up to 166,000
cubic feet per second (cusec) compared with the regular 25,744 cusec,
running straight down south through a new course 15-20 km wide and 150
long north to south. This created major flooding in Nepal and India - Bihar
in particular. According to official figures, a total of 3.3 million people
were affected in Bihar.
Bihar is divided into 38 districts, of which five
districts, namely Supaul, Saharsa, Madhepura,
Araria and Purnia, were severely affected by
the flood. These districts make up 12 percent
of Bihar‟s landmass. They had not
experienced significant flooding since the
completion of the barrage and afflux
embankments in 1963, with consequent lack
of preparedness. The total population in the 5
main affected districts is estimated to be 9.4
million, of which 32 percent (3 million) were
affected by the floods.3 A total area of close to
3700 sq. km was inundated, affecting 412
Panchayats and 993 villages.
Approximately 493 lives were lost and 3,500
were reported missing after the disaster. The
flood triggered one of the largest evacuation
operations with over 1 million people
evacuated, and about 460,000 people accommodated in 360 relief camps.
Houses, schools, roads, hospitals all were damaged. A total of 236,632 houses were either fully or
partially destroyed in rural blocks across the five affected districts. Significant damage to infrastructure
including rural roads, culverts and bridges was reported with approximately 1800 km of roads and 1100
3 "Table: Ranking of Districts in Bihar by Population Size in 1991 and 2001.”Office of the Registrar General and
Census Commissioner, India. http://www.censusindia.gov.in. Retrieved 2010-06-26.
Figure 2. Map of Kosi river inundated areas in Bihar. Sphere India:
Unified Response Strategy.
Figure 1 State of Bihar

12
bridges and culverts damaged. All categories of roads ranging from national highways to village roads
were affected. Many bridges collapsed and were not trafficable.
The floods resulted in a significant decline in the agricultural production base due to sediment deposition
and loss of livestock, farm working capital and other farm assets (e.g. tube wells, implements, etc.). As
per official estimates, coarse sediment was deposited on an area of 284,000 ha in 1063 villages in 35
blocks of the five districts. Generally, the deposits of sediment are deep, continuous and widespread in the
northern parts (Supaul District) and relatively shallow and patchy in other districts.
The floods also caused severe damage to the East Kosi Main Canal and lower-order irrigation
infrastructure in the large Kosi Irrigation Scheme. The damage included serious siltation of the main canal
and distributaries, breaches and siltation of smaller canals and water courses, and destruction of hydraulic
and other structures.
1.2 Emergency response
An emergency response effort was immediately initiated by the
State government with assistance from the Indian Army, Air
Force, Navy, and National Disaster Response Force (NDRF).
Relief materials were airdropped by helicopter including 121,892
packets containing food and water purification tablets. Food
packets totaling 239,858 were also distributed in the interior areas
by boats.
In terms of evacuation, an extensive operation was undertaken
involving 5,000 civilian personnel, 3,500 police personnel, 35
columns of the Army and 4 of the Navy working with 855 NDRF
personnel and the Air Force. The evacuation operation involved 2,000 traditional country and mechanized
boats to bring approximately 1 million evacuees to safety. The State Government set up 360 relief camps
within school and college buildings and tents to house evacuees. At peak, more than 440,000 people were
living in camps. The government camps were used for a period of approximately 4 months.
The Government of Bihar (GoB) was extremely proactive in relief operations in the immediate aftermath
of the flood and also received GoI support of US$230 million from the Calamity Relief Fund. Although
no formal international appeal for foreign assistance was made by the Government, the international
community responded and contributed to the recovery effort. International and national organizations
mobilized aid to assist with recovery needs both in India and Nepal. The WHO, for instance, provided
emergency medical supplies and equipment for almost 200,000 people in Bihar. Other agencies such as
WFP were active in distribution of food aid. Several national organizations launched relief efforts. See
Annex 6 for the list of multilateral and bilateral support for recovery activities in Bihar.
Figure 3. Evacuated people and
livestock, Saharsa, August 2008
13
The Bank offered support immediately after the disaster through the Global Facility for Disaster
Reduction and Recovery (GFDRR), and the World Bank donated 10 motorboats to the Government of
Bihar and 6 to the Government of Nepal.
1.3 The Kosi districts in the context of Bihar
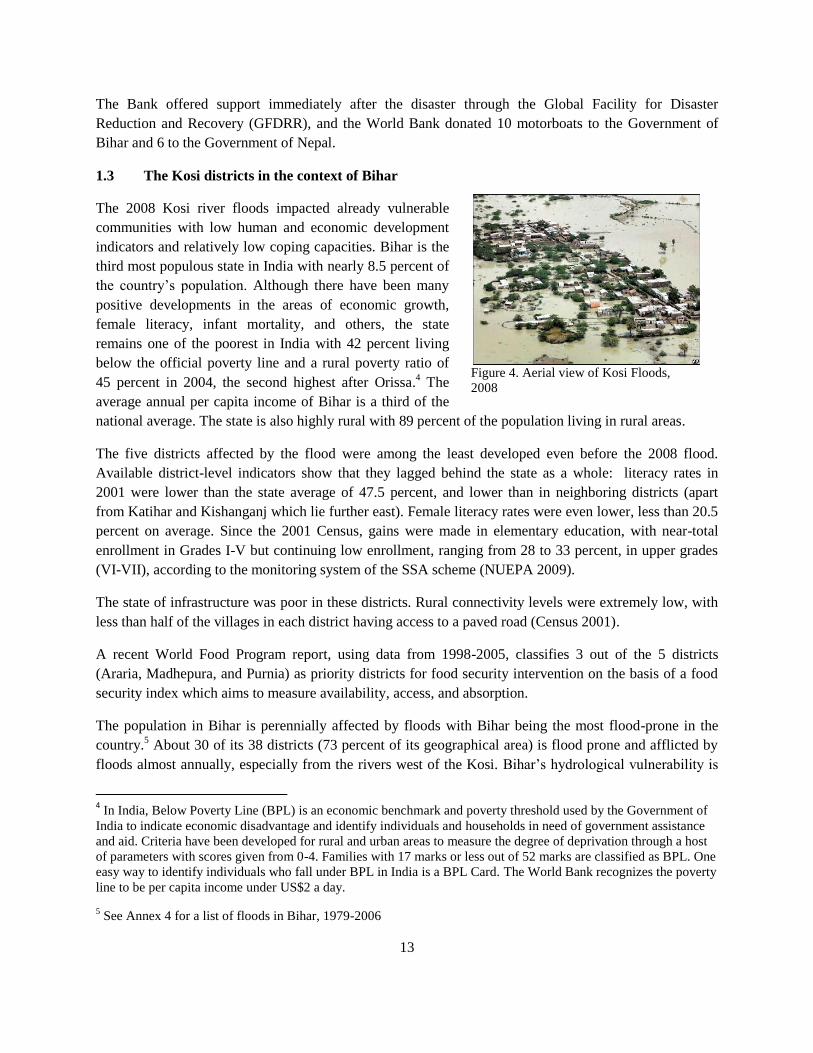
The 2008 Kosi river floods impacted already vulnerable
communities with low human and economic development
indicators and relatively low coping capacities. Bihar is the
third most populous state in India with nearly 8.5 percent of
the country‟s population. Although there have been many
positive developments in the areas of economic growth,
female literacy, infant mortality, and others, the state
remains one of the poorest in India with 42 percent living
below the official poverty line and a rural poverty ratio of
45 percent in 2004, the second highest after Orissa.4 The
average annual per capita income of Bihar is a third of the
national average. The state is also highly rural with 89 percent of the population living in rural areas.
The five districts affected by the flood were among the least developed even before the 2008 flood.
Available district-level indicators show that they lagged behind the state as a whole: literacy rates in
2001 were lower than the state average of 47.5 percent, and lower than in neighboring districts (apart
from Katihar and Kishanganj which lie further east). Female literacy rates were even lower, less than 20.5
percent on average. Since the 2001 Census, gains were made in elementary education, with near-total
enrollment in Grades I-V but continuing low enrollment, ranging from 28 to 33 percent, in upper grades
(VI-VII), according to the monitoring system of the SSA scheme (NUEPA 2009).
The state of infrastructure was poor in these districts. Rural connectivity levels were extremely low, with
less than half of the villages in each district having access to a paved road (Census 2001).
A recent World Food Program report, using data from 1998-2005, classifies 3 out of the 5 districts
(Araria, Madhepura, and Purnia) as priority districts for food security intervention on the basis of a food
security index which aims to measure availability, access, and absorption.
The population in Bihar is perennially affected by floods with Bihar being the most flood-prone in the
country.5 About 30 of its 38 districts (73 percent of its geographical area) is flood prone and afflicted by
floods almost annually, especially from the rivers west of the Kosi. Bihar‟s hydrological vulnerability is
4 In India, Below Poverty Line (BPL) is an economic benchmark and poverty threshold used by the Government of
India to indicate economic disadvantage and identify individuals and households in need of government assistance
and aid. Criteria have been developed for rural and urban areas to measure the degree of deprivation through a host
of parameters with scores given from 0-4. Families with 17 marks or less out of 52 marks are classified as BPL. One
easy way to identify individuals who fall under BPL in India is a BPL Card. The World Bank recognizes the poverty
line to be per capita income under US$2 a day.
5 See Annex 4 for a list of floods in Bihar, 1979-2006
Figure 4. Aerial view of Kosi Floods,
2008

14
aggravated by its flat topography, high rainfall (more than 2,500 mm annually and up to 80 percent of
annual precipitation from June to September) and high sediment loads of rivers.
In particular, the Kosi River is well-known in India for rapid and frequent changes of its course and the
extensive flood damages it causes almost every year. As its waters carry a heavy silt load and the river has
a steep gradient, the river has a tendency to move sideways. In about 200 years, the river has moved
laterally by about 150 km.
The Government of Bihar‟s institutional capacity to manage
the 2008 Kosi disaster was limited as considerable resources
had been spent in dealing with the extensive floods on 2007,
which affected nearly 25 million people in a different part of
Bihar.
While GoB was extremely proactive in the emergency
response, there has not been any significant reconstruction
and recovery needs are still enormous and beyond present
capacity.
Box 1. History of Kosi
Embankment Breaches
The Kosi River presents a challenge in
terms of long and recurring flood
hazard. A major flood in 1953-54 led
to the „Kosi project‟ which was aimed
at flood control and irrigation. The
project led to the creation of a barrage
and embankments on each side were
designed to protect approximately
2800 km2 of land in north Bihar and
Nepal. Despite this intervention and a
long history of flood control
management in the basin for more
than 5 decades, the river continues to
cause extensive flooding due to
breaches.
1963: The first breach on the western
embankment in Nepal
1968: Five breaches in north Bihar
1971: Collapse of the 1969-built
Bhatania Approach Bund
1980: Eastern embankment breach
1984: Eastern embankment breach
1991: Breach in the western
embankment near Joginia in Nepal
2008: Breach in eastern embankment

15
Section 2 Objectives, Methodology, and Limitations
2.1 Overview
A Needs Assessment was undertaken by the World Bank and GFDRR in close cooperation with GoB
from May 24 to June 4, 2010. A considerable period of time had elapsed since the disaster event and a
post-disaster needs assessment could help take stock of damages, present progress in reconstruction, and
identify priority gap areas for potential assistance under the project.
2.2 Objectives
The objective of the Needs Assessment is: (i) to guide the design and investment prioritization of the
proposed Kosi Flood Recovery project; (ii) provide a damage overview in key sectors including water
resources and flood management, roads and bridges, housing, agriculture, social, environmental, and
health; (iii) to identify current recovery initiatives and progress made; and, (iv) to identify short, medium,
and long-term needs and priority interventions.
This report presents the findings of the Needs Assessment exercise. It is structured with more emphasis
on post-disaster recovery needs and priority interventions to support the elaboration of the proposed
World Bank Kosi Flood Reconstruction project. With considerable time elapsed, accurate estimation of
losses was neither possible nor required by the Government. In addition, a number of organizations,
including the UN, undertook assessments early on, focusing on the impact of the disaster and immediate
needs. Therefore, these tasks were not repeated in the present Needs Assessment.
This report is based on the GoB‟s and others‟ findings of the impact and immediate recovery initiatives
while providing recommendations for current as well as long-term recovery needs. Greater emphasis has
been placed on the sectors that were worst affected by the disaster while mention has been made of others
important but less emphasized areas.
2.3 Methodology
A three-pronged methodology was employed to complete information gathering in the Needs Assessment:
(i) obtaining government damage data from the relevant government departments; (ii) review of reports
on damage and recovery needs from GoB and other sources; and, (iii) limited cross-verification of the
centrally obtained data through focused sample surveys, field visits and the aggregation of the needs in
the relevant sectors as derived from the verified damages.
During the Needs Assessment mission from May 24 to June 4, 2010, World Bank staff (see Annex 13 for
list) held extensive discussions with Development Commissioner, GoB, and Principal Secretaries of
Planning, Water Resources, Minor Water Resources, Agriculture, Road Construction, Rural Works,
Disaster Management and other relevant departments and obtained damage data. Baseline and disaster
impact data were provided through templates shared with GoB (see Section 3). Sectoral reports were
reviewed and followed by a field visit for sample verification of damages and validation of data furnished
by GoB. In particular, sectoral damage data verification exercises were undertaken in the district of

16
Supaul in North Bihar. Upon return from field verification surveys, the Assessment team interacted
intensively with the District Magistrate, Supaul and district-level departmental officers. This was
followed up with focused interactions with government officials in Patna in order to validate the findings
of the field surveys.
Subsequently, an extensive discussion was held with the GoB on the priorities of the report. It was
determined that greater emphasis would be given to a forward-looking recovery framework and the
treatment of challenges and longer-term issues that GoB would utilize for planning its longer-term
disaster risk management and reduction work plan.
2.4 Limitations
As mentioned previously, a considerable period has lapsed since the disaster event – 22 months – which
has impacted the overall Assessment as some amount of reconstruction work has been complete or is
already underway. This poses a large structural limitation to verification of disaster damage.
The second limitation is data availability. As comprehensive data is not available on economic losses, it
was not feasible to deploy the UN-ECLAC Damage and Loss Assessment Methodology. 6
The
Assessment Team used the empirical methodology of assessing damages and determining needs based on
disaster risk reduction elements and under the overall reconstruction paradigm of building back better.
As GoB requested the team to focus on the worst-hit sectors and on the key components of the proposed
Kosi Flood Reconstruction project, some sectors that are normally covered in typical Needs Assessments
have not been covered due to negligible damage in those sectors, paucity of time, prioritization of sectors
by the Government, and constraints of data availability.
6 Methodology for disaster damage and loss assessment developed by the UN Economic Commission for Latin
America and the Caribbean (UN-ECLAC)

17
Section 3 Needs Assessment
3.1 Overview
The following section details the findings of the Needs Assessment with sector-specific profiles. Each
sector profile provides a brief damage overview, identifies current recovery initiatives and progress made
thus far, and short, medium, and long-term needs and priority interventions. This is not an exhaustive
sectoral review but a snapshot to guide the elaboration of the proposed World Bank Kosi Flood
Reconstruction and Recovery project. Greater emphasis has been given to post-disaster recovery needs in
the following sectors: housing, roads and bridges, water resources and flood management, agriculture,
social, environmental, and health.
Summary
Table 1 provides a summary of the reported damages and needs by sector.
Sector Sub-Sector Disaster Damages Reconstruction Needs
INR Million US$
Million7
INR Million US$
Million
Infrastructure
Housing 5935 134.9 99000 225
Roads and
bridges
5695 129 13936 317
Water resources - - 26828 591.4
Productive sectors
Agriculture - - - -
Livelihoods - - 1622.5 36.9
Social sectors
Education - - 1251 28.4
Health - - 730.2 16.6
Social - - - -
Cross-cutting
issues
Environment - - - -
7 A standard exchange rate of US$1=Rs 44 has been used throughout the report.
18
Infrastructure
3.2 Housing
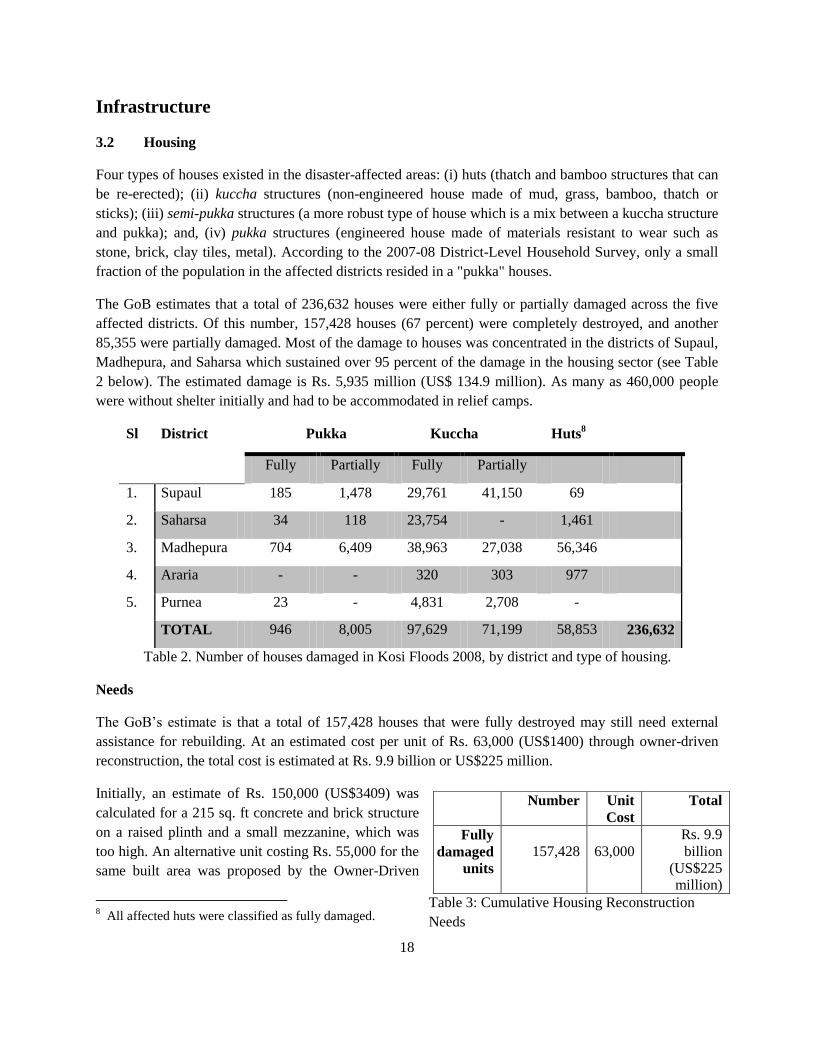
Four types of houses existed in the disaster-affected areas: (i) huts (thatch and bamboo structures that can
be re-erected); (ii) kuccha structures (non-engineered house made of mud, grass, bamboo, thatch or
sticks); (iii) semi-pukka structures (a more robust type of house which is a mix between a kuccha structure
and pukka); and, (iv) pukka structures (engineered house made of materials resistant to wear such as
stone, brick, clay tiles, metal). According to the 2007-08 District-Level Household Survey, only a small
fraction of the population in the affected districts resided in a "pukka" houses.
The GoB estimates that a total of 236,632 houses were either fully or partially damaged across the five
affected districts. Of this number, 157,428 houses (67 percent) were completely destroyed, and another
85,355 were partially damaged. Most of the damage to houses was concentrated in the districts of Supaul,
Madhepura, and Saharsa which sustained over 95 percent of the damage in the housing sector (see Table
2 below). The estimated damage is Rs. 5,935 million (US$ 134.9 million). As many as 460,000 people
were without shelter initially and had to be accommodated in relief camps.
Sl District Pukka Kuccha Huts8
Fully Partially Fully Partially
1. Supaul 185 1,478 29,761 41,150 69
2. Saharsa 34 118 23,754 - 1,461
3. Madhepura 704 6,409 38,963 27,038 56,346
4. Araria - - 320 303 977
5. Purnea 23 - 4,831 2,708 -
TOTAL 946 8,005 97,629 71,199 58,853 236,632
Table 2. Number of houses damaged in Kosi Floods 2008, by district and type of housing.
Needs
The GoB‟s estimate is that a total of 157,428 houses that were fully destroyed may still need external
assistance for rebuilding. At an estimated cost per unit of Rs. 63,000 (US$1400) through owner-driven
reconstruction, the total cost is estimated at Rs. 9.9 billion or US$225 million.
Initially, an estimate of Rs. 150,000 (US$3409) was
calculated for a 215 sq. ft concrete and brick structure
on a raised plinth and a small mezzanine, which was
too high. An alternative unit costing Rs. 55,000 for the
same built area was proposed by the Owner-Driven
8 All affected huts were classified as fully damaged.
Number Unit
Cost
Total
Fully
damaged
units
157,428
63,000
Rs. 9.9
billion
(US$225
million)
Table 3: Cumulative Housing Reconstruction
Needs
19
Reconstruction Collaborative (ODRC), a not-for-profit organization working closely with GoB. With
additions including solar lighting and toilets, the total cost per unit is estimated at Rs. 63,000 (US$1430).
The model that has been proposed is owner-driven with GoB and ODRC providing technical, supervision,
and monitoring support. The units include an elevated plinth of brick and concrete and a superstructure
which uses reinforced bamboo poles as load-bearing columns and CGI sheeting with bamboo insulation
as a roof. It would have a mezzanine for storage and shelter. This basic cost of Rs. 55,000 does not
include a kitchen or toilet, with GoI‟s Total Sanitation Scheme expected to provide toilets. Solar lighting
is estimated at an additional cost of Rs. 5000.
A number of key factors relating to quality and disaster mitigation have been integrated into the units‟
design given that the affected areas are prone to floods, earthquakes, and windstorms. The districts of
Araria and Supaul also lie in seismic hazard Zone V, and Madhepura, Saharsa and Purnea in Zone IV.
Kala Azar, a vector-borne disease, is prevalent in the area.9 Therefore, the design is earthquake, flood and
windstorm resistant and includes plastered walls to prevent Kala Azar.
Housing reconstruction is expected to take a phased approach
due to resource constraints. The districts of Supaul, Saharsa,
and Madhepura would be prioritized with fully damaged
kuccha houses and huts (approximately 150,000 units) taken
up in the first phase. Eligible Below the Poverty Line (BPL)
households that have not yet benefited from the Indira Awas
Yogana (IAY) rural housing scheme (see Box 2) would receive IAY benefits with GoB meeting the
deficit. Other eligible households would be covered by GoB through its own resources.
Land issues are also important in shelter reconstruction. Approximately one in three beneficiaries is
landless and would require land prior to reconstruction. Thus, adequate support to procure land is
inseparable from housing reconstruction. GoB is contemplating commensurate additional assistance to
support the eligible landless households to obtain right/title to land for housing reconstruction.
Demand for building materials needs to be addressed as well, with enormous demand potentially
impacting the cost of supplies. There is a need to facilitate private sector suppliers to produce and stock
these materials in sufficient quantities and to monitor fair price trades to discourage profiteering. The
entire program could also trigger a potential shortage of bamboo required for the housing reconstruction
at this scale. The proposed design requires mature (at least three years) and chemically reinforced
bamboo. In addition, effective chemical treatment of bamboo is possible only within 6-7 hours of harvest.
Re-verification of eligible beneficiaries with community participation is necessary as many victims were
absent during the Government of Bihar household survey, having relocated to different areas for safety
and better livelihood options. Re-verification is even more necessary as some anomalous incongruities
among affected districts were noted in the respective numbers of huts damaged.
9 World Bank is funding a Program, National Vector Borne Disease Project that includes the eradication of Kala
Azar.
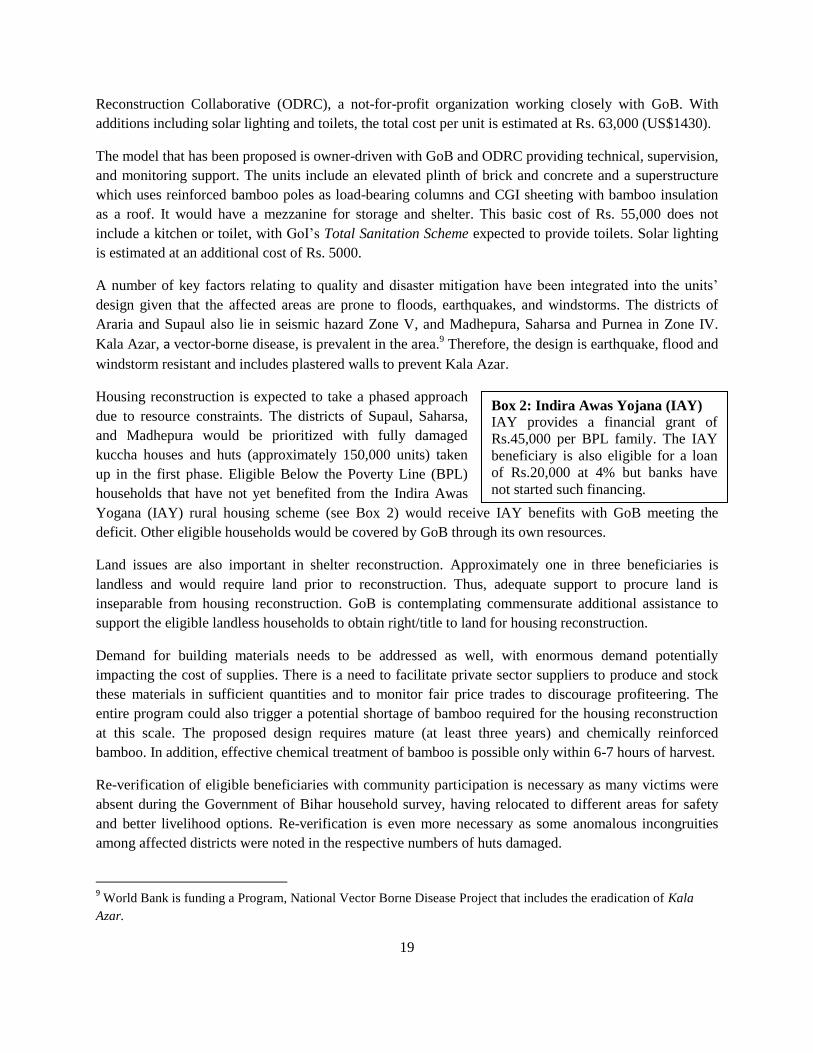
Box 2: Indira Awas Yojana (IAY)
IAY provides a financial grant of
Rs.45,000 per BPL family. The IAY
beneficiary is also eligible for a loan
of Rs.20,000 at 4% but banks have
not started such financing.

20
It is also recommended that those who reconstructed houses with personal resources remain eligible.
Excluding them would act as a perverse incentive and discourage communities from engaged in self-
driven recovery through personal and community efforts.
Finally, the issue of the initial gratuitous relief given by GoB for reconstruction requires review. Between
Rs. 2,000 and Rs. 25,000 was given by GoB early into recovery. The amount given was based on
households based as follows:
Damaged house Category Relief compensation / household (INR Rs.)
Pukka: fully damaged 25,000
Pukka: partially damaged 5,000
Kuccha: fully damaged 10,000
Kuccha: partially damaged 2,500
Huts 2,000
Table 4. GoB relief packages based on household categories
GoB is contemplating adjusting the proposed housing reconstruction grant by this initial relief, which
may however, have already been spent by households for recovery needs other than housing
reconstruction. Such a practice may have serious consequences on the viability and quality of
reconstruction. Moreover, the current estimates are already austere and if such adjustments are made,
households will either resort to spending their own money (if they have it) to complete houses or abandon
reconstruction midway due to lack of funds. Finally, it may result in poor quality housing which may
suffer from the same vulnerabilities existent prior to the disaster. GoB may want to reconsider the issue
and its implications.
21
3.3 Roads and Bridges
A large number of roads and bridges were damaged by the floods. The embankment breach caused the
following: (i) formation of new streams where no cross drainage works existed; and, (ii) flows in excess
of design discharge of existing cross drainages structures resulting in the collapse of bridges and culverts
and severe damage to roads.
A total of 1,830 km (78.9 percent) of roads in the five affected districts were either fully or partially
damaged. Of this, a total of approximately 1,357 km (58.5 percent) were fully destroyed. In addition, a
total of close to 1,100 bridges and culverts were damaged or destroyed.
With these districts having large rural concentrations, roads in rural areas were disproportionally affected.
Rural roads sustained over 70 percent of total damage with 1635 km of rural roads either totally or
partially destroyed. Of this number, 1212.8 km (72 percent) were fully destroyed, while the remainder
422.3 km partially destroyed. Table 5 and 6 provide the breakdown of damages to national and state
highways and major district roads, as well as rural roads.
District Road Type
Affected Roads
(km)
Damaged Bridges
(No.)
Damaged Culverts
(No.)
Fully
damaged
Partly
damaged
Fully
damaged
Partly
damaged
Fully
damaged
Partly
damaged
Supaul
National
highway
State
highway
Major
district road
25.70
(24.4%) 13
Madhep
ura
National
highway
16.00
(44.4%) 7
State
highway
Major
district road
28.10
(35%)
22.00
(27.5%) 1 6
Saharsa
National
highway
5.70
(10.8%)
30.00
(56.9%) 2
State
highway 10
Major
district road
55.25
(93.6%) 2 8
Araria
National
highway
State
highway
Major 2.00 11 3

22
District Road Type
Affected Roads
(km)
Damaged Bridges
(No.)
Damaged Culverts
(No.)
Fully
damaged
Partly
damaged
Fully
damaged
Partly
damaged
Fully
damaged
Partly
damaged
district road (2.6%)
Purnea
National
highway
10.00
(16.4%) 2 2
State
highway
Major
district road
1.00
(1.4%) 1 7
Sub-
Total
National
highway
31.70
(21.2%)
30
(20%) 2 11 - -
State
highway - - 10 - - -
Major
district
road
112.05
(24.3%)
22
(19.6%) 28 - 24 -
Grand
Total
143.75
(22.6%)
52
(8.2%)
40
11 24
Table 5: Estimated damages to roads and bridges, national highways, state highways, and major district roads
District
Damaged paved
roads (km)
Damaged unpaved
roads (km)
No. of damaged -
Bridges/Culverts
Fully
damaged
Partly
damaged
Fully
damaged
Partly
damaged
Fully
damaged
Partly
damaged
Supaul 136.15 44.35 232.01 37.80 298 19
Madhepura 104.05 33.80 692.70 71.15 490 4
Saharsa 12.73 79.35 0.00 0.00 15 65
Araria 13.61 66.46 0.00 0.00 5 34
Purnea 21.51 89.43 0.00 0.00 11 48
Total 288.05
(17.1%)
313.38
(18.6%)
924.71
(55%)
108.95
(6.5%) 819 170
Table 6. Estimated Damages to Roads and Bridges in Rural Areas

23
In terms of districts, of the total length of roads damaged, roads in Madhepura sustained close to 53
percent of total damage at 967.8 km, followed by Supaul at 26 percent (476 km), and Saharsa at 10
percent (183 km).
In terms of cost of damage to roads, including bridges and culverts along them, the total is estimated at
Rs. 5.7 billion (US$129 million). See Table 7 below for the breakdown per district. The cost of damages
to bridges and culverts is included in the cost of the roads.
District NH SH MDR Rural Roads Total
Supaul 0.00 0.00 414.20 884.21 1298.41
Madhepura 440.00 0.00 272.60 1212.08 1924.68
Saharsa 287.00 500.00 395.50 209.62 1392.12
Araria 0.00 0.00 241.00 187.36 428.36
Purnea 340.00 0.00 47.00 264.88 651.88
Total 1067.00 500.00 1370.30 2758.15 5695.45
Table 7: Estimated cost of damages to roads and bridges in affected areas (in INR, million)
Needs
Since the disaster event, minimal reconstruction of damaged roads and bridges has been undertaken. It
was noted by the Needs Assessment Team that almost all damaged bridges and culverts have been
restored via temporary diversions. While majority of the paved roads have been restored, albeit the
approaches to cross drainage works and near the new streams, the unpaved roads have not been
substantially repaired. Therefore, reconstruction need for the roads and bridges is still substantial.
The total reconstruction need for road infrastructure including bridges and culverts is estimated at Rs 13.9
billion (US$317 million). This estimate was calculated taking into account the time elapsed since the
disaster, the need for multi-hazard resistant construction, and the need for better quality construction to
“build back better” after the disaster.

24
District National
Highways
State
Highways
Major
District
Roads
Rural
Roads Total
Supaul 0.00 0.00 621.30 2568.82 3190.12
Madhepura 1080.00 0.00 408.90 5308.80 6797.70
Saharsa 550.50 750.00 593.25 314.43 2208.18
Araria 0.00 0.00 361.50 281.05 642.55
Purnea 630.00 0.00 70.50 397.32 1097.82
Total 2260.50 750.00 2055.45 8870.41
13936.36
(US$317 million)
Table 8. Cumulative needs in roads and bridges sector (in INR, million)
For reconstruction of roads and bridges, the following has been taken into account in the cost estimation:
Reconstruction cost would be 50 percent above the value of damage. About 30 percent extra for
build back better and about 20 percent to account for inflation. This is in line with the overall
reconstruction needs calculated by GoB
All fully as well as partially damaged bridges and culverts would need to be constructed anew,
regardless of the extent of damage
New bridges and culverts would be required at locations where new streams and channels have
been created after the disaster
Bridges and culverts would be designed as a minimum of two-lanes irrespective of current traffic
needs as reconstructed brides and culverts would have an expected lifespan of 50 years and there
is potential of increased traffic over this period
All damaged roads, including those currently fair-weather roads, would be reconstructed as all-
weather/bituminous roads
Recommendations for disaster risk reduction led reconstruction
Based on the observations of the Assessment Team, the following recommendations are proposed to
ensure that appropriate disaster-resistant features are incorporated in the reconstruction of roads and
bridges:
Bridges should be constructed above the high flood line (HFL). The exact height should be
determined through in-depth studies. No submersible bridges, causeways, spillways should be
rebuilt.

25
Future bridge designs should allow for stopper blocks to prevent dislodgement, and adequate
anchoring to prevent uplifting of the superstructure. This recommendation comes from
observations that in many bridges inspected during Assessment, the superstructure was laterally
displaced due to overtopping by flood waters and inadequate anchoring of concrete pavement to
the supporting pillars.
It is not recommended to base the design of bridges, culverts and roads on the impact level of the
Kosi flood of 2008. This occurred as a result of an anomalous incident – a breach in the
embankment. The IRC code precludes any such abnormal highs like dam burst, tsunamis etc.
Design should be based on longer-term trends derived from available records of past years as well
as field surveys including robust soil testing.
Adequate protection work for the heads as well as sides of the approach roads should be provided
(where the HFL width is larger than the bridge width, causing impact on approach embankments
due to perpendicular flow of flood waters).
Single circular piers in the bridges with cantilever pier heads supporting the superstructure are
recommended. This will take care of skewed flows, if any.
Bridges should be constructed on deep foundations except for culverts, using either well or pile
foundations. Pile foundations are recommended over wells as they are faster and cheaper to
construct. They are also more flexible than well foundations. This is further recommended given
the seismic rating of the region.
Elastomer bearings deflect considerably under horizontal force. Here, reference may be made to
the amendment to IRC: 6.10
This may halve the seismic coefficient from 0.18. It might be
feasible to then design Elastomer bearings good for this reduced force. If such bearings are still
unable to take the force, these could be designed for its maximum capacity and the balance force
transferred to seismic arrester blocks as indicated in the above mentioned amendment of IRC:6
It is recommended that proper hydrological and topographical surveys be undertaken on road
stretches that had no bridges/culvert but were damaged due to road embankment breaches. Such
surveys would improve scientific planning by identifying new flow channels that might have
developed due to sedimentation of old channels or any other topographic changes. Waterway and
bridge lengths may be fixed after assessing discharges through the new waterways and not on
historical data which may be misleading
Open foundations are recommended for small bridges and culverts. However, adequate disaster
resistant features should be provided to safeguard the reconstructed structures from future
disasters. Usual rigid concrete apron flooring flanked by adequately designed cut-off walls,
10
Published in “Indian Highways”, January 2003.

26
forming a protective box enclosure around the foundations, should be provided. Flexible
launching aprons comprising boulder pitching on the bed both upstream and downstream and
next to the cutoff walls form the last frontier and should be provided to safeguard against
scouring.
Bituminous roads should be designed based on soil characteristics and necessary soil
investigations should be carried out.
Wherever high embankments are required, necessary slope protection should be provided.

27
3.4 Water Resources
The floods severely damaged the Eastern Kosi
Main Canal and secondary and tertiary irrigation
infrastructure in the Kosi Irrigation Command
Area.
A total of 6.32 km of the main Eastern Kosi
Canal was fully damaged, 3 km of the branch
canal was also fully damaged and 1 km was
partially damaged.
158 km of the distributaries and sub-
distributaries/minor canals was fully damaged
and 4 km partially damaged.
730 km of the water courses, 151 canal bridges
and 138 regulators were fully damaged
The floods also caused substantial siltation of the
main canal and distributaries, breaches in and
siltation of smaller canals and water courses, as
well as destruction of hydraulic and other
structures. These damages have rendered the
Eastern Kosi Canal system nearly dysfunctional to
the present day resulting in a devastating impact on
agriculture and livelihoods. The Kosi Cultivable
Command Area (CCA) is 612,000 hectares in the
five districts. Millions of people depend on this for
agriculture and livelihoods.
Needs
Although the breach and resultant floods of 2008 were exceptional, going forward there is a need to
relook and reformulate the way floods are perceived and managed throughout the state through activities
in the short, medium and long-term. A more comprehensive flood risk management system is needed with
a mix of structural (e.g. shelters, upstream storage, embankment rationalization, and asset management
system) approaches as well as non-structural (e.g. institutional coordination, forecasting and
communication systems, data monitoring, zoning, insurance) measures in an integrated basin context.
Kosi Eastern Afflux Bund & Related Infrastructure
GoB and GoI along with the Kosi High Level Committee (KHLC) conducted a series of investigative
studies of the Eastern Afflux Bund which breached on August 2008. Areas of severe impact were closely
examined at various discharges varying from 50,000 cusecs to 500,000 cusecs using post-2008 flood
survey data and satellite imagery. In addition, model experiments were carried out and the flow patterns
Box 3. Background of Kosi Eastern Afflux
Embankment
In order to contain the Kosi, GoI prepared a scheme in
1954 consisting of a barrage at Bhimnagar (Nepal) with
canals with irrigation potential of millions of hectares,
afflux bunds up to 13 km on western and 32 km on
eastern side upstream of the barrage, and downstream
flood embankments up to 100 km on the western and
124.5 km on eastern side.
On August 18, 2008, a 1.77 km wide breach opened in
the Eastern Afflux Bund at about 13 km upstream. As
this occurred at a river discharge of 164,000 cusecs (far
less than the design discharge of 9,50,000 cusecs, the
breach cannot be attributed to exceptional discharge. It
was caused by a gradual shift of the flow due to uneven
siltation impacting the left embankment and by lack of
adequate and timely maintenance of the embankments.
It was exacerbated by several shoals (sandbanks) that
constricted the flow in narrow rapid channels. The
breach was more devastating as it forced almost 80% of
the discharge into an old channel, severely and abruptly
flooding the five districts. The breach caused partial
damage to the spur at km 11.90 and complete damage
to spurs at km 12.1 and 12.9 on the Eastern Afflux
Bund. The damage also included complete erosion of
the nose at km 13.6. In addition, the countryside slope
of the embankment was damaged from the Bhimnagar
Barrage to km 11.7 upstream into Nepal.

28
were observed at spurs located at 11.9 km, 13.6 km, 15.8 km, 17.35 km, and 23.52 km on the Eastern
Afflux Bund. These studies led to a series of recommendations summarized below:
Closure of the eastern channel near the spur at 23.52 km on the Eastern Afflux bund
Extension of the spur at 15.80 km by 125m on Eastern Afflux Bund
Dredging a new pilot channel west of existing pilot channel to centralize the flow
Extension of the left downstream guide bund; and,
Dredging of the central pilot channel downstream of the barrage.
Additional recommendations include:
Blocking the upstream river channel by RCC porcupines opposite to the spur at 23.52 km on the
Eastern Afflux Bund to weaken the attack on the spurs up to 15.8 km on the Bund
Restoration of the nose of the spur at 15.80 km; restoration and strengthening of the noses of
spurs at 5.31 km, 6.25 km, 6.94 km, 9.25 km, 10.0 km, 11.70 km and 14.10 km on the Eastern
Afflux Bund, under attack
Revision of the gate regulation of the barrage to improve the flow of the proposed pilot channel
Stockpile materials, particularly sand filled geo bags/boulders, at vulnerable locations
Based on the recommendations of KBCAT, GoB initially requested assistance from GoI for closing the
breach and protection works estimated at Rs.1.43 billion (US$32.5 million). However, after the works
were completed the WRD revised its costs down to Rs. 1.14 billion (US$25.9 million) for the following
works carried out: 11
Construction of pilot channel, dredging, porcupines;
Breach closure including protection works;
Construction of five new spurs in the damaged portion;
Restoration of two damaged spurs near the breach; and,
Miscellaneous works (including equipment, mechanical works, jungle clearance, etc.).
In addition, modernization of the Barrage at an additional cost of Rs. 0.87 billion (US$19.7 million) was
also planned. This included automation and repairs of the gates and dividing walls, not directly linked to
the Kosi Floods but are necessary as longer-term disaster risk reduction measures.
After the Eastern Afflux Bund repair, GoB undertook an assessment of the state of downstream
embankments. Though the floods did not cause any direct damage to the Eastern and Western Kosi
Embankment systems, they were in a state of disrepair and required urgent renovation. Many anti-flood
sluices were non-functional due to progressive elevation of the river bed and had reduced the operational
capacity of the embankments. This aggravated flooding and water logging in the affected districts along
the Eastern and Western Embankments. Thus, suitable measures to strengthen the existing downstream
embankments have become a complementary need.
11
These works were completed at a cost of Rs. 1.14 billion (US$25.9 million).

29
GoB initiated a program titled the “Raising, Strengthening and Construction of Bituminous Road over
Eastern and Western Kosi Embankments” at an estimated cost of Rs. 3.39 billion (US$77.1 million).
Overall, in this project there is a provision for five new structures: two Double Lane Road (DLR) bridges,
two anti-flood sluices in the Western Embankment and one anti-flood sluice in the Eastern Embankment.
GoB holds that the construction of bituminous roads on the embankment would stabilize the surface,
make the embankments more flood resistant and ensure road connectivity during floods. However,
although the roads will have a strengthening effect and allow for improved connectivity and embankment
maintenance they may form an obstacle for future enhancement of the embankments. Therefore, this
practice may have to be evaluated for long-term sustainability.
Eastern Kosi Canal & Related Irrigation Infrastructure
As noted above, the Eastern Afflux Bund breach severely impacted the main Eastern Kosi Canal, its
branches and distributaries. Already under stress due to siltation, the floods rendered the entire irrigation
network in the Kosi Command Area dysfunctional. Pre-2008 GoB reports had flagged that the head of
the main canal and branch canals had gradually silted considerably reducing canal capacity and that the
canal flow had encroached the free board of the canal endangering the safety of its embankments and
related structures. In short, lack of maintenance and steady siltation aggravated the impact of the floods
on the irrigation system. Currently, the irrigation system is servicing less than 50 percent of its command
area.
GoB has initiated a program for repair and reconstruction works called the Extension, Renovation,
Modernization (ERM) to address the -damages to the Eastern Kosi Canal System with an estimated cost
of Rs. 7.50 billion (US$170 million) and an additional Rs. 0.37 billion (US$8.4 million) from the
Calamity Relief Fund (CRF) for the repair and renovation of the main Eastern Kosi canal. The objectives
of the project are to restore the irrigation capacity to 64 percent Kharif (monsoon), 62.5 percent Rabi
(winter), 22 percent hot weather crops, and 1.5 percent annual crops.
Long-term Irrigation needs
A lingering concern for the East Kosi Main Canal system is the high sediment intake and the high seepage
loss due to sandy loam sub-soil. There is a longstanding plan for concrete lining of the main canal and
distributaries, estimated to cost Rs. 12 billion (US$ 256 million). It is not included in the ERM project.
Drainage schemes are also not included under the project. Another concern is the ten-odd new small river
streams (dhars), with a total length of 250 km which were created after the floods. No action has been
taken for their training and management. These are now running through areas with no canal coverage
and require urgent re-sectioning, re-grading, re-channelization/diversion. GoB has estimated that this
would cost an additional Rs. 200 million (US$4.3 million) which is outside the scope of the ERM project.
GoB has requested for World Bank support for addressing any additional works for the dhars.
The summary of costs for reconstruction needs of the bund, barrage, embankments, and Kosi Main canal
and related irrigation networks is detailed in Table 9 below.

30
Type of Reconstruction Need INR Million US$
Million
Breach Closure Works on Eastern Afflux Bund 1140 25.9
Kosi Bhimnagar Barrage 870 19.7
Strengthening of Eastern & Western Kosi
Embankments (including 8 km on Western
Embankment)
3628 82.1
ERM Scheme for Eastern Kosi Main Canal System
(incl. funds from Calamity Relief Fund)
7870 178.4
Lining of Eastern Kosi Main Canal 12000 256
Renovation of irrigations system to include 10 Dhars 200 4.3
Piloting of river training, localized erosion control, and
strengthening of sections of embankments
328 7.0
Non- structural knowledge management and capacity
building measures (incl. technical studies, models, flood
forecasting, etc.)
792 18
Total 26828 591.4
Table 9: Reconstruction need of the Eastern Afflux Bund, the Bhimnagar Barrage, Kosi Embankments, the
Eastern Kosi Main Canal system, and other structural and non-structural needs costing in INR, million
The following are specific structural and non-structural needs in the medium and long-term that are
required to ensure improved flood management capacity in the state.
A. Structural Interventions Needed
Constructing and maintaining flood embankments in a more sustainable manner by using modern
design parameters and standards and more suitable construction materials.
Developing and maintaining an asset management system for flood embankments and other flood
management infrastructure using satellite imagery to detect river flow behavior changes and at-
risk embankments. This should be corroborated by a system of regular physical monitoring and
inspection.
Strengthening of eight km of Kosi Western Embankment downstream in Bihar.

31
Piloting of river training, erosion control and strengthening of sections of embankments using
more suitable materials and construction techniques.
Renovation of several dhars (small streams) that currently affect the Eastern Kosi Main Canal and
related irrigation networks.
B. Non-Structural Interventions Needed
Providing emergency/routine maintenance equipment to maintain the course of the Kosi River
upstream of the barrage as much as possible in its central channel combined with a systematic silt
management plan.
Conducting a series of technical studies, geotechnical and other investigations, and setting up a
center of excellence for water resources and flood management research and development, all
aimed at improving the knowledge of river, flood, and sediment management in Bihar.
Developing mathematical models to describe the morpho-dynamic behavior of the Kosi River to
increase the understanding of the river dynamics, to predict river behavior under different events,
and to determine the impact of interventions.
Preparation of a comprehensive integrated flood and sediment management master plan that
determines a set of priority structural and non-structural measures that will provide sustainable
flood and sediment management up to an agreed safety level. A review of the current situation
and arrangements of flood management in the state and the constraints and barriers to the
improvement of practices needs to take place. Building on the existing situation with flood and
sediment management and the identified constraints and barriers, the master plan should be
prepared that will guide government and agencies during the next two decades towards
sustainable flood and sediment management in the state.
Additional measures like flood warning are required to minimize the risk of damage and
casualties caused by a flood event. Flood forecasting significantly enhances the accuracy and
increases the lead time of forecasts. Building on the completed and ongoing activities by the
Bank-funded Flood Management Information System (FMIS) Cell within WRD, the flood
forecasting and early warning capacity in the state will be enhanced. Such activities could include
the preparation of a digital elevation model (DEM) for the Kosi River Basin to enable the
preparation of hazard and risk maps and assessments, setting up and automatic hydro-
meteorological monitoring system (field stations, observer and communication), development of
rainfall-runoff and flood routing models including data collection (topography, river profiles,
historic data, etc.), development of a flood risk forecasting system and the related institutional
development for its operation; and development of flood warning and emergency management
capacity.
Managing Disaster Response and Preparedness: This should include development of standard
operating procedures to be activated by all agencies and the coordination mechanism for its
32
observance. It should also include training and capacity building of GoB functionaries at all
levels in the methodology and techniques of disaster risk reduction and in post-disaster needs
assessments.
Managing Vulnerability to the Residual Flood Risks: This should include such activities as
developing and implementing programs for community awareness building and engagement in
flood risk management, and provision of adequate community-owned and community-operated
flood warning and emergency response systems;
Conducting study tours to study successful flood management and erosion control measures in
river systems such as the Yellow River (China) and Mississippi River (USA). In addition,
researchers at the Center and engineers from the Water Resources Department should explore
opportunities to participate at courses and other training events at specialized international
technology centers and universities.

33
Productive Sectors
3.5 Agriculture (Crops, Livestock)
Crops
The floods caused significant damage in the agriculture sector with damage to standing crop and sand-
casting of cultivable land. GoB has estimated that 350,000 acres of paddy, 18,000 acres of maize and
240,000 acres of other crops were adversely affected, impacting close to 500,000 farmers.
Detailed district wise breakups of the crop damage and sand-casting are below. District wise, the majority
of damage was in Madhepura, followed by Supaul. The Assessment Team verified that sand-casting has
occurred at different places from 3-4 feet to 3-6 inches. The northern blocks of Supaul have the maximum
level of sand-casting although farmers have re-started cultivation in spite of sand-casting with higher
labor and irrigation inputs and lower yields. Discussions with farmers revealed a significant drop (up to
50%) in productivity and increase in input costs. A high number of private tube wells were also damaged
by the floods but no baseline data was available to ascertain damage.
Districts Paddy
(ha)
Maize
(ha)
Other
(including
(ha)
Total
(ha)
Supaul 75,342 642 49,896 125,880
Madhepura 138,320 14,511 106,519 259,350
Saharsa 55,822 15 15,524 71,361
Araria 56,884 0 37,470 94,354
Purnea 27,849 2,739 30,554 61,142
Total 612,087
Table 10. Damage to crops by district
Livestock
The floods also affected livestock with GoB reporting 10,000 milk animals, 3000 draught animals, and
2500 small ruminants (e.g. goats and sheep) perishing in the floods. The substantial increase in the price
of milk is a direct effect of the drop in supply.
Fisheries
In terms of fisheries, GoB has reported that 519 private and public fish ponds were fully or partially
damaged.

34
Needs
Crops
Recovery requirements in the agricultural sector break down into short-, medium-, and long-term needs.
The immediate needs must support the restoration of incomes of small/marginal farmers and the landless.
The long-term needs need to be aimed at revitalizing agriculture. The latter may be prioritized for flood-
prone districts and eventually extended to all areas.
The overall strategy for recovery in agriculture needs to be tailored for the varying degrees of sand-
casting (high, medium and low). In areas with high sand casting, de-siltation would not be financially
viable in terms of available technology and cost implications. GoB estimates that 6,000 cubic meters per
hectare of sand needs to be removed in such areas. This is impractical as the cost would be exorbitant and
large areas would be required for storing removed sand, which would have its own environmental and
social implications. Heaping into mounds would not be feasible as sand would continue to scatter over
adjacent fields. The cost-benefit of such investments is negative: high costs (Rs. 45,000 per ha,
US$1,000) and uncertain benefits.
Therefore, alternative cropping systems such as horticultural and plantation crops (e.g., mango and litchi)
is recommended. As fruit crops have long gestation, this would require intermediate support through
inter-cropping like fodder for livestock (e.g., Kash is a local fodder and grows on sandy soil). However,
this would require quality planting material and other inputs for these high-value cash crops. The farmers
would also need to be supported with proactive agricultural extension services, technological and
marketing support and timely and adequate credit support.
In medium sand casting areas, recovery requirements relate to supporting farmers in shifting to alternate
cropping patterns. A start has already been made by some of the farmers who have moved out of the
conventional paddy-wheat cropping cycle to gourds and melons that grow better in sandy soil. Extension
support services, marketing and credit support would be needed. In addition, restoration of shallow tube
wells for groundwater irrigation would be needed. Water user groups (WUGs) should be promoted for
optimal utilization, operation and maintenance. Several WUGs can be federated and serve as a node for
dissemination of new technologies (e.g., seed drill).
In low/no sand casting areas, efforts need to be made to increase agricultural productivity by
strengthening agricultural support services. The focus should be on providing access to critical inputs and
disseminating improved technologies for the main crops grown in the area by organizing effective farmer
training programs and demonstration farms. This would also require upgrading the knowledge and skills
of extension functionaries in the line departments.
Livestock
Most of the farmers and landless own livestock whose productivity is low due to poor genetic potential,
inadequate nutrition and poor animal health due to weak systems of disease surveillance and control.
While improvement of genetic potential is time-taking, immediate support for improving livestock

35
potential must be provided through extension services like fodder demonstrations and animal health
camps for vaccinations and de-worming.
36
3.6 Livelihoods
Approximately 2.3 million people were affected by the floods. Of this, approximately 90 percent of the
flood affected population‟s livelihood was dependent on agriculture.12
With significant damage to
agriculture and livestock, livelihoods were severely affected. The floods also affected the households
deriving their income from non-farm sources (e.g., potters, basket weavers, etc) and small micro-
enterprises due to damage to their productive assets.
Interactions with communities revealed that households have resorted to coping strategies that include:
Outward migration: The decrease in cultivable area and productivity has forced outmigration to
labor-deficit areas like Delhi, Punjab and Haryana for wage labor. The affected landless have less
access to agricultural labor options and have been compelled to migrate in large numbers.
Relying on remittances: The assessment team‟s interactions with communities revealed that
intra-country remittances form a large part of their income. There were some reports of informal
remittance networks that were charging exorbitant rates for money transfer mushrooming in the
aftermath of the disaster.
Borrowing funds: In terms of access to credit, the public sector banking system does not have
adequate mechanisms to cater to the needs of the population. This has led to local and informal
usury. Interactions with communities revealed that the disaster has resulted in an increase in the
level of indebtedness. In most cases, debts were taken out for consumption needs like food and
healthcare. Interest rates as high as 10 percent per month have been reported in some affected
areas. The conjunction of depressed incomes and increased expenditures are forcing affected
households into debt traps.
The Assessment Team also learnt that household expenditure on healthcare has gone up after the floods.
Sand-casting and lower productivity have also impacted food security among the poorest.
Needs
Overall, there is a need to build a strategy that includes increasing agricultural productivity for small and
marginal farmers and helping them diversify their income sources by promoting income from livestock,
as well as developing alternative livelihood options in the non-farming sector. The landless who are
already involved in micro-enterprises and specialized crafts like pottery or basket-making need to be
provided with access to credit and other value chain support like technical support in procurement, design
and marketing for reviving their enterprises. Households that are purely dependent on agricultural labor
and migration need to be provided with alternative livelihood options like dairy, goat-rearing, nonfarm
options including skill-building to enable them access to jobs in the service sector. Livelihood revival
must also occur in conjunction with better access to credit, better food security, and a reduction of health-
related expenditure
12
Economic Survey, GoB 2009-10

37
Immediate needs include focusing on recovery of rural livelihoods of small/marginal farmers and the
landless. In Bihar, an ongoing Bank-financed rural livelihoods project, “Jeevika” has been operating since
2007 and is focused on enhancing social and economic empowerment of the rural poor in Bihar. Key
project activities include community institutional development, a community investment fund for
restoring and improving livelihoods, and improving the quantity of quality of services provision.
This project, aimed at livelihood regeneration, can be extended to the most affected blocks of these
districts. The estimated cost of doing so would require an investment of Rs. 147.5 million (US$ 3.4
million) per block. There are an estimated 11 blocks in the Kosi affected areas that require livelihood
support. This would cover about 18,000 households per block under the program.
A tentative costing per block is below in Table 11. At 11 blocks, the total cost of the program is Rs.
1622.5 million (US$36.9 million)
Item Unit cost per
Self-Help Group
Number per
block
Cost per
block (INR
million)
Total cost (11
blocks) (INR
million)
Promoting and building the capacity
of community institutions
15,000 1500 22.5
Revolving fund for restoring and
improving livelihoods
80,000 1500 120
Technical assistance funds NA 1500 5
Total Investment 147.5 1622.5
(US$36.9
million)
Table 11: Estimates for livelihoods support activities per block

38
Social Sectors
3.7 Education
Educational infrastructure and scholastic calendars were affected in all five districts, mostly in Madhepura
and Supaul. The schools in the path of the new river course got completely washed away. About 1428 (19
percent) of total schools in the affected districts were fully or partially damaged. GoB has reported 173
government schools as fully damaged, 481 as partly damaged, and 774 with minor damages. More
extensive damage has occurred to elementary and secondary schools than to higher and technical
education institutions. Private schools are excluded from these damage estimates.
District-wise Education Sector Damages
The lives of educational administrators, teachers and students were impacted both physically and
emotionally. While difficult to quantify, the floods caused psychological trauma and social impact on
many students, especially girl students, teachers and educational administrators. In addition, the annual
academic calendar was disrupted with a serious impact on students in certifying years for Secondary and
Higher Secondary education in India.
Needs
Immediate needs in the education sector are: (a) to reconstruct destroyed educational institutions and
repair damaged classrooms in primary, secondary, and all other educational institutions; (b) to set in place
a counseling program to address the psycho-social needs of students and teachers; and, (c) to re-distribute
pedagogic materials to students that were lost in the floods.
For (a), the need for reconstruction and repair has been estimated at Rs 1.25 billion (US$28.4 million). A
summary of needs are in Table 12 below.
Access to education is strongly dependent on good roads infrastructure. Connecting each school with a
pukka (all weather) road from the service villages may improve educational levels by encouraging
continued enrollment. In addition, provision of mid-day meals to school children should be strengthened,
as well as grants-in-aid to secondary schools.
Sector
Affected
Schools/
Colleges
Total estimated cost of
reconstruction/repair
(INR, million)
Primary Education 1428 917.26
Secondary Education 105 290.50
Higher Education 7 43.86
Total 1540 1251.63
Table 12: Estimates of Needs in Education Sector

39
3.8 Health
The affected districts have inadequate health infrastructure in comparison to Bihar state averages, with the
primary health care (PHC) availability ratio at 0.65 per 30,000 persons. Similarly, the sub-centre
availability ratio is 0.51 per 5,000 persons. Total health facilities coverage per 100,000 persons in the
affected districts is between 9 and 11 while the state average is 11 per 100,000. Thus, basic health
indicators such as the crude birth rate, crude death rate, infant mortality rate, and total fertility rate are
considerably above the state and national averages.
Already stretched health infrastructure and regular curative and preventive health services were disrupted
by the floods. Supaul, Madhepura and Saharsa were the most severely affected. However, no building
was completely damaged in any affected district.
The floods jeopardized the health of affected people through food shortages, depleted purchasing power,
and the spread of water-borne or food deficiency-related diseases. Casualties were mostly caused by
water-borne diseases and drowning. GoB reports state that 11 pregnant mothers perished due to the lack
of emergency health facilities. Ailments like viral fever, cough and cold were pervasive. GoB reports
indicate that gastro-enteric, dermatological and viral diseases were rampant during and after the floods.
Estimated damages in the health sector are detailed below:
Table 13: Damages in the health sector. Source: Estimates provided by GoB
Needs
The immediate need in the affected areas is to strengthen basic health services in the communities,
increase outreach services, maintain vector- and water-borne disease control, repair damaged hospitals,
and fill the gap need of doctors and paramedical staff. Approximately 48 percent of sanctioned doctors‟
positions are vacant in the flood-affected districts.
The medium term objective is to eliminate the gross shortages of hospitals as per National Rural Health
Mission (NRHM) norms. Post-disaster recovery should be seen as an opportunity to strengthen the
existing health system in the affected districts. Provision of basic sanitation, monitoring of water quality,
surveillance for epidemic prone illnesses, psycho-social support, measures to prevention of HIV/AIDS are
also crucial in these communities. Deployment of mobile medical teams in the most-affected villages is
also desirable. A preliminary estimate of the cost for the short and medium term interventions is estimated
at Rs.730.2 million (US$16.6 million). These services would be rendered by the public sector.
No District Partially Affected Units Equipment/Stocks
(INR, Million)
1 Supaul 36 67
2 Madhepura 57 36.5
3 Araria 0 0
4 Saharsa 70 8.8
5 Purnea 8 0
Total 171 11.23

40
(INR, Million)
Sl Item Supaul Madhepura Araria Saharsa Purnea Total
1 POL for Ambulance
Service & Vehicles,
Engagement of Technician
& Medicine
4.7 4.7 4.2 4.2 3.2 16.8
2 POL for Ambulance
Service & Vehicles,
Engagement of Technician
& Medicine includes
medicine cost received
from GoI
18 18.6 13 17 23 89.6
3 Mobile Medical Teams
(Additional medical staff)
13.5 16 14 23 12.6 79.1
4 Control of Vector Borne
and Water Borne Diseases
and Surveillance
2 18.6 0.69 0.74 0.51 5.8
5 Healthcare in Relief Camps 2.3 2.2 1.5 4.8 4.8 15.6
6 Immunization Campaigns 2.3 2.2 3.2 2.3 4.8 14.8
7 Repair of health
infrastructure
103.5 222 0 143.5 39.5 508.5
Total 730.2
Table 14: Needs in the health sector. Source: Estimates provided by GoB

41
3.9 Social
The population of Bihar is 82.8 million.13
Scheduled Castes and Scheduled Tribes (socially disadvantaged
groups) comprise 15.7 percent and 0.9 percent of the total respectively. Approximately 90 percent of
Bihar resides in rural areas and depends on agriculture. Bihar‟s literacy rate is 47.5 percent as compared
to a national rate of 65.4 percent. Its sex ratio is 921 compared to the national ratio of 933. Three out of
four villages in the affected districts did not have electricity. Bihar scores low on all human development
indices and is a low-income state of India with considerable regional disparity in income distribution and
a distinct rural-urban divide.
The flood-affected districts are amongst the poorest in India. The total population of these districts is 9.4
million. Araria and Purnea have significant minority community populations while Madhepura and
Saharsa have a high density of Scheduled Castes. Work participation rates in all five are higher than the
state average, which confirms widespread poverty and depressed wages. Out-migration is a regular cause
of poverty. Only 7 to 10 percent of people are engaged in non-agricultural activities. Demographic,
occupational, socio-economic and infrastructural factors aggravate the social vulnerability of the area.
Flood-related deaths, diseases and injuries have impacted the social fabric of the affected areas.
Livelihoods have been distorted, especially for the poorest. Floods have accentuated pre-existing
vulnerabilities with long-term implications in the affected communities, especially weaker sections like
women, widows, children, orphans, adolescent girls, the elderly, and socially disadvantaged groups. The
fear of future floods further intensifies these prevailing insecurities.
Some other psycho-social impacts are high social costs of homelessness, psychological trauma, poor
health, fear of dwelling in damaged houses, and loss of earnings for the homeless. Loss of property
documents adds difficulties as proof of title/possession is linked with compensation and reconstruction
eligibility.
A very large number of working population of these districts migrates to other parts of India for work due
to lack of local employment opportunities and depressed wages. Sand-casting has further reduced
agricultural wage labor opportunities. The proportion of out-migration and the duration of such migration
have both shot up after the floods. This has increased stress on women, children and the elderly as the
migrating workers are generally male heads of households.
Needs
Recovery in the social sector requires holistic integration of human development into disaster
preparedness and response, as well as post-disaster reconstruction. Special attention needs to be paid to
shelter, livelihoods, social security and the legal requirements of vulnerable groups like orphans,
separated children, widows, woman-headed households, single parents, the disabled and the elderly, as
well as marginalized groups like scheduled castes and the minorities.
Post-disaster needs include but are not limited to the following:
Psycho-social counseling initiatives for flood-affected children to help recover from trauma
Expansion of immunization programs
13
All figures in this section are from Census of India, 2001.

42
Distribution of milk and other basic nutrients
Regular health check-ups
Extra classes to cover education losses and the distribution of books and other pedagogic materials
to students
Free health and housing facilities to the elderly and support to sick and disabled
Social safety nets, pensions and free rations through the public distribution system
Special monitoring of girl students to stem drop-outs triggered by death of adult females
Addressing the needs of doctors and teachers, many of whom are under family pressure to
permanently relocate out of the flood affected districts
Restoration of records of property rights for homestead, commercial, and other lands, especially of
the poor, scheduled castes, and those living in informal settlements
Coordination between the education and social welfare departments to attain optimum convergence
between schools and ICDS centers
Involvement of local communities in planning, decision-making, implementation and supervision of
post-disaster reconstruction plans. Community participation ensures longer-term community
ownership, reduces trauma, and enhances transparency and accountability. An accessible and
reliable public grievance redressal system is recommended
Urgent restoration of public services, including health, education, water supply, power,
communications, municipal and environmental infrastructure
Rapid and targeted support to restore the livelihoods of vulnerable people in the affected areas.

43
Crosscutting
3.10 Environment
Ganga is the main drainage system of Bihar, bisecting the state into South Bihar and North Bihar with
eight major river basins - Ghaghra, Gandak, Burhi Gandak, Bagmati, Adhwara group of rivers, Kamala,
Kosi, and Mahananda. The flat terrain and major seasonal variation in the discharge of the rivers cause
extensive flooding in the North Bihar plains. Gradients vary from 22 cm per km at the Indo-Nepal border
to 7.5 cm per km at the confluence of the Kosi and Ganga. Their minimum and maximum discharges
differ widely – 10 to 20 times more in the monsoon causing soil run-offs, swift current and high sediment
loads. The rivers decelerate in the plains and deposits sediment loads, causing recurrent shifts in river
courses. Kosi has moved westwards by 120 km over time from Purnea to Saharsa and flowed in 12
distinct channels.
The Kosi barrage, afflux bunds and embankments confine the river to flow within embankments.
Approximately 246 km of downstream embankments have been constructed to thwart the westward
movement of the river. The embankments are 12 - 16 km wide and serve as a silt trap.
In spite of these, Bihar is the most flood-prone states in India with the highest at-flood risk population in
India. The recurrent shifts in course of the Kosi cause flooding, water-logging, erosion, sand casting and
the emergence of new alluvial land. These new char (low-lying diluvia) remain waterlogged for years
before they become productive. The Kosi accounts for 25 percent of the total river run-off and 50 percent
of total sediment loss of Nepal. Embankments, canals, roads, and railway tracks planned with insufficient
geo-technical studies impede the natural drainage of the basin. GoB estimates show that one million
hectares of land in Bihar is water-logged, 85 percent of it in North Bihar.
The direct environmental impacts of the floods include: (a) sand casting; (b) soil erosion; (c) debris
disposal; (d) damage to water management resources; and, (e) damage to plantations.
The indirect impacts include: (a) pressure on environmental resources in areas receiving the out-
migration; (b) environmental degradation due to pollution caused by reconstruction; and, (c) change in
land-use due to sand casting. Lack of baseline ecological data and slow onset of impacts make it difficult
to assess the specific environmental impacts immediately. Long-term impacts on the ecosystem would
require a detailed assessment. Table 15 summarizes the key environmental impacts.14
14
The impact on environmental services such as carbon sequestration, water flow regulation, fishery habitat and
agro-forestry is not quantifiable due to paucity of data.

44
Type of Impact Severity Extent Recovery Cost
Physical/Natural Environment
Sand Casting Very Severe Extensive Long Term Vey High
Soil Erosion/ Destabilization Severe Extensive Long Term High
Sedimentation of water bodies Moderate Extensive Long Term Incalculable
Washing of debris onto land water
bodies Low Local Medium Term Moderate
Water Contamination Moderate Local Medium Term Moderate
Biological/Social Environment
Impact on human health Very Severe Extensive Medium Term High
Loss/damage of vegetation cover Moderate Moderate Medium Term Moderate
Impact on livestock Severe Extensive Medium Term High
Table 15: Summary of key environmental damages
Sand Casting: Sand casting has rendered about 4,828 sq.
km barren. The impact is intractable as there seems to be
no financially viable solution for heavy sand casting. Table
16 provides the details.
Sanitation and Waste Management: Open defecation is a
common practice as most households do not have latrines.
Safe defecation was a key issue during the floods.
Villagers generally used tila15
, road and railway
embankments or boats for defecation. Hygiene, modesty,
and water quality suffered.
Debris: No baseline or damage data was available on this.
In rural areas, debris was less concentrated. However, as a
large number of buildings were destroyed or damaged, the cumulative debris is significant. Its hazardous
disposal would create unwarranted environmental impacts.
Vegetation Cover: People depend on timber, bamboo and fuel wood for various needs. Tree-felling for
fuel wood and transitional shelter needs during and after the floods also added to the loss of vegetation
cover that used to arrest erosion. In Birpur Forest Division, 66.4 percent of the saplings planted along
canals and roads in 2008 were destroyed. Damages in other divisions were not available to the
Assessment Team.
Impact to Water and Water Management Resources: Environmental impacts of damages to water
infrastructure include (a) contamination of surface water; (b) contamination of shallow ground water due
to poor sanitation, waste management and improper disposal of animal carcasses.
Environmental Degradation linked to Reconstruction: Reconstruction would require production, transport
and usage of vast quantities of construction materials (cement, bricks, earth, water etc). This will further
strain the environment.
15
Village high lands
S. No. District Affected Area
(Ha)
1 Sapaul 74,000
2 Madhepura 58,000
3 Saharsa 97,000
4 Purnea 15,000
5 Araria 40,000
Total 284,000
Table 16. Area affected by sand casting

45
Changes in Land Use: The above factors would combine to force change in land use patterns. This is
specifically true for areas where extensive sand casting and water logging have rendered reclamation
unviable. The involuntary outmigration from degraded areas will also force a change in the land use of the
receiving areas where exploitation of land would intensify due to demographic pressure.
Needs
Environmental degradation, settlement patterns, livelihood options and behavior contribute to disaster
risk. This in turn adversely affects human development and generates a vicious circle of environmental
degradation. Inadequately planned recovery processes that fail to take into account the state of
environment and ecosystem services may aggravate existing vulnerabilities or create new ones. Several
issues pertaining to post-disaster reconstruction in housing, infrastructure and livelihood restoration have
environmental implications. Therefore, sound environmental planning and management must be
integrated into the short-, medium- and long-term reconstruction plans.
Immediate needs
Identification of location-specific sustainable options for reconstruction of housing and infrastructure
and for livelihood restoration in consultation with communities, NGOs and experts
Development and implementation of guidelines for of debris/rubble disposal to prevent hazardous
disposal to minimize environmental impact
Development of environmental and social guidelines for sectoral reconstruction efforts
Establishment of an empowered co-ordination mechanism to facilitate dovetailing of the
environmental priorities into various sectoral reconstruction programs.
Medium-term needs
Needs in the medium term include: (a) a comprehensive environment and social impact assessment,
including analysis of alternative livelihood options in affected areas; (b) assessment and monitoring of
environmental and health risks, specifically during infrastructure reconstruction; and; (c) strengthening of
the institutional capacity to better manage environmental risks.
Long-term needs
The complex nature of the Kosi Basin necessitates integrated planning and management, including water
resource management, sediment control, livelihood diversification, maintaining ecological balance, food
security, safe water supply and over-all socio-economic development of the vulnerable population. In the
longer-term, strategies need to be developed and executed for reducing vulnerability from future disasters
and better disaster response preparedness. Scientific flood hazard mapping and appropriate land use
planning in flood-prone areas is recommended.
Recommendations for DRR-led Reconstruction
The following recommendations have the objective of facilitating an environmentally sustainable
rehabilitation and reconstruction program for flood-affected areas in Bihar:
Mainstreaming environmental considerations into sectoral interventions: There are environmental
dimensions to every sector affected by the Kosi flood. This implies that environmental issues should be

46
factored in the sectoral reconstruction plans, particularly in the Roads, Bridges and Water Resources
Management sectors. Such plans must ensure that the broader ecosystem is not jeopardized as an
unintended spin-off. Ideally, the plans should improve the ecosystem for long-term sustainable
development. „Soft‟ options with minimal impact on environment should be preferred over „harder‟
options as far as possible.
Lessons Leant: Lessons from historical trend analyses of the nature, causes and effects of disaster impacts
should inform a cross-sectoral disaster risk reduction strategy. The disaster offers an opportunity to assess
and monitor the resilience of natural and modified ecosystems. This will help plan customized disaster
risk mitigation strategies.
Focus on socially acceptable solutions: Economic, environmental, psycho-social and cultural factors
must be considered in devising disaster risk mitigation strategies. Solutions must be contextualized to
local situations.
Need for an integrated water resource management planning: Human interventions to control river
systems have many consequences, as these are organic systems and any interference can have unintended
impacts. Thus, integrated planning for sustainability of environmental goods and services is of paramount
importance. This in turn will assist poverty reduction, reduce vulnerability to natural hazards and improve
livelihood systems to promote equitable development. The entire reconstruction plan should also be
framed within the broader context of an integrated water resource and flood management plan.

47
Year GSDP (Rs.
billion)
% change
2000-2001 572.79 +14.10
2001-2002 578.04 +0.92
2002-2003 651.17 +12.65
2003-2004 669.61 +2.83
2004-2005 737.91 +10.20
2005-2006 796.82 +7.98
2006-2007 942.51 +18.28
Table 17. GSDP at Current Prices 2000-2007
Figures as of Feb 2008. Source: Ministry of Statistics &
Programme Implementation, GoI
Section 4 Crosscutting Challenges and Opportunities
A number of factors, including high population density, low socio-economic development, inadequate
maintenance of existing flood infrastructure, and weak institutions for water resources and disaster risk
management, pose both challenges as well as opportunities for holistic development in post-disaster
reconstruction; effectively, a window of opportunity for “building back better” and accelerating economic
development in Bihar.
The following are key major challenges for recovery in the region:
4.1 Enhancing economic development
Bihar is the third most populous state in India with nearly 8.5 percent of the country‟s population.
Although there have been many positive developments in the areas of economic growth, female literacy,
infant mortality, and other areas, the state remains one of the poorest in India with 42 percent living below
the poverty line and a rural poverty ratio of 45 percent. The average annual per capita income of Bihar at
$148 is a third of the national average of $997. The state is also highly rural with 89 percent of the
population living in rural areas and a rural poverty ratio of 44.3 percent in 2004, the second highest after
Orissa. Even with low urbanization, urban poverty in Bihar stood at 32.9 percent as compared to the
national average of 23.6 percent.
The economy of Bihar is service-oriented with an
agricultural base. The state has a small industrial sector.
In 2008, agriculture accounted for 35 percent, industry
9 percent, and services 55 percent of the economy of
the state. Manufacturing performed poorly between the
period 2002–2007 with an average growth rate of 0.38
percent compared to the national rate of 7.8 percent.
Bihar has the lowest GDP per capita in India but there
are pockets of higher per capita income: Patna, the
capital city, has a per capita income greater than that of
Bangalore or Hyderabad. The GSDP today stands at Rs
1124.24 billion (Rs. $21 billion nominal GDP). The
current annual growth in GSDP is 11.44 percent and
per capita GSDP is Rs.10,415. In terms of GSDP, Bihar
is ranked 14th out of 28 Indian states in 2008.
Transparency International India has found corruption
to be an important challenge for the government to overcome. GoB has taken many measures to enhance
transparency and accountability and has also initiated economic and social reforms. These measures have
had a salutary impact on the economy. The Doing Business Report 2009 ranked Patna as the second best
city in India to start a business, after Delhi. It also ranked Patna second in enforcement of contracts, ninth
in dealing with construction permits, fifteenth for paying taxes and registering property, tenth for trading
across borders, and fifteenth for closing a business. Overall, the city was placed 14th.

48
There is a North-South dichotomy in Bihar‟s human development.
The southern districts have far larger income profiles than the at-risk
north Bihar districts which include the flood-affected areas of
Saharsa, Madhepura, Supaul, Araria, and Purnia. These five
districts were amongst the least developed even before the
2008 floods. Available district-level indicators show that they
lagged behind the state as a whole: literacy rates were lower
than the state average of 47.5 percent, and lower than in
neighboring districts (apart from Katihar and Kishanganj
which lie further east). Female literacy rates were even lower,
less than 20.5 percent on average. Since the 2001 Census,
gains were made in elementary education, with near-total
enrollment in Grades 1-5 but continuing low enrollment, ranging from 28 to 33 percent, in upper
grades (VI-VII), according to the monitoring system of the SSA scheme (NUEPA 2009).
Neighboring districts performed marginally better with almost total enrollment in lower grades
and enrollment in upper grades ranging from 30 to 40 percent.
The state of infrastructure was poor in these districts. Rural connectivity levels were extremely low, with
less than half of the villages in each district having access to a paved road (Census 2001). In addition, a
recent World Food Program report, using data from 1998-2005, classifies three out of the five districts
(Araria, Madhepura, and Purnia) as priority districts for food security intervention on the basis of a food
security index which aims to measure availability, access, and absorption.
Therefore, there is a need for addressing low human development in these districts through reconstruction
activities aimed at reducing long-term vulnerabilities of affected and at risk communities.
4.2 High Disaster Risks
The State of Bihar is highly
flood prone: 30 of its 38 districts
comprising 73 percent of its
geographical area are flood
prone and afflicted by floods
almost annually, especially from
the rivers west of the Kosi
River. Bihar‟s hydrological
vulnerability is aggravated by its
flat topography, high rainfall
(more than 2,500 mm annually
and up to 80 percent of annual
precipitation from June to
Figure 6. Hydrological Map of the Ganga Basin in Bihar
Figure 5. Average per capita
income in select Indian cities
Figure 3

49
September), and high sediment loads of rivers.
The plains of north Bihar are drained by many rivers with
catchments in the Himalayas. Kosi, Gandak, Burhi Gandak,
Bagmati, Kamala Balan, Mahananda and Adhwara Group of
rivers originate in Nepal and carry very high discharge and
sediment loads. Since independence, Bihar had four other
catastrophic flood events, in 1954, 1974, 1987, and 2004.
However, the 2007 monsoon floods were Bihar‟s worst natural
floods in 20 years, affecting more than 24 million people,
killing nearly 1,000 people, and destroying over 700,000
homes. Historical flood damage data in 1979-2006 can be
found in Annex 4.
The Kosi River is the main cause of recurrent floods in north Bihar. The river runs through a steep
gradient in Nepal. Rainfall in the Kosi catchment in Nepal overloads the barrage compelling release from
the Barrage which causes floods and water-logging in north Bihar. The heavy discharge from the Barrage
causes downstream Bagmati, Burhi Gandak and Ganga rivers to inundate. In addition, the discharge
carries enormous amounts of sandy silt that gets deposited over arable land and renders it fallow.
The timeline of past floods in Bihar is as follows:
1998: Embankment damage along Burhi Gandak, Bagmati,
Adhwara and Kosi rivers accounted for 381
deaths, asset damage worth Rs 1 billion and crops
damage of Rs 3.67 billion.
1999: Excessive precipitation in the catchments caused
flooding of Kamala Balan and Kosi rivers. Crop
damage was estimated at Rs 2.5 billion and property
damage another Rs 0.5 billion.
2000: Eastern Kosi Afflux Bund breached due to excessive
discharge caused by heavy rainfall. This flooded
12351 villages. Crop damage was estimated at Rs 0.8
billion.
2001: Breaches in Kosi, Bhutahi Balan, Bagmati and Burhi Gandak embankments. Crop and property
damages were estimated at Rs 2.6 billion and Rs 1.8 billion respectively.
2002: Kamala Balan left and Khiroi right embankment overtopped. The floods caused 489 deaths. Crop
and property damages estimates stood at Rs 5 billion and Rs 4 billion respectively.
2003: Ganga surpassed the 1978 HFL at Bhagalpur and the 1994 HFL at Patna.
2004: Heavy rainfall caused 53 embankment breaches in Bagmati, Burhi Gandak, Kamala Balan,
Bhutahi Balan and Adhwara rivers. 885 deaths were reported. Crop and property damages were
assessed at Rs 5 billion and Rs 10 billion respectively.
Figure 8. Flood risks in Bihar
Figure 7. Silt deposition near Kosi
embankment at Navbhata, Saharsa, Bihar
Figure 7. Silt deposition near Kosi
embankment at Navbhata, Saharsa, Bihar

50
Box 4. The Kosi River and its Catchment
Kosi originates at 7000 m above mean sea level (MSL)
in the Himalayas. It enters India at Hanuman Nagar,
Nepal and drains into the Ganga in Bihar, India. Its total
catchment is 74,030 sq km of which 11,410 sq km is in
India. The catchment area is home to 6.6 million people.
The catchment has an annual average rainfall of 1456
mm and total discharge of 52219 million cubic meters.
Its main tributaries are Bagmati, Kamala Balan, Bhutahi
Balan, Trijuga, Fariani Dhar and Dhemama Dhar.
Tectonic forces are elevating Kosi‟s gradient by 1 cm
per year, aggravating erosion, inundation and
sedimentation. Its annual sediment load is currently
estimated at 100 million cubic meters. This is projected
to grow six-fold to gradient elevation.
As the gradient flattens in north Bihar, the river
decelerates and deposits the sediment to on its bed. This
elevates the bed progressively, forcing the river to break
out to lower terrain, which it again begins to elevate by
siltation. Thus, one of the world‟s largest conical
alluvial fan over 15,000 sq km has evolved over
centuries. Kosi records a flow of over 25,000 cubic
meters per second (cumecs) where it exits the
Himalayan foothills – enough to flood the entire alluvial
fan with 1.5 meters in a week. This is a rough index of
the flood vulnerability of the Kosi catchment.
2007: Heavy rainfall caused 28 breaches in Burhi Gandak and Bagmati embankments causing extensive
damage to life and property.
2008: Eastern Kosi Afflux Bund breaches upstream and Kosi river floods five districts in north Bihar
In addition to floods, North Bihar is also vulnerable windstorms. The at-risk from floods districts are also
exposed to geo-morphological risks from earthquakes. Araria and Supaul lie in seismic hazard Zone V
while Madhepura, Saharsa and Purnea lie in Zone IV.
High hazard risk compounded by low human and economic development in the State, relatively
insufficient capacity and other resources for proper planning and execution of disaster risk reduction
programs, significantly increase vulnerabilities.
4.3 Flood Risk Management
Embankments
The Kosi embankments were built in late
1950s to contain the Kosi River, one of the
largest tributaries of the Ganga. At this time,
Bihar had approximately 160 km of
embankments and 2.5 million hectares of flood
prone areas. Approximately 50 years later in
2004, Bihar had 3,465 km of embankments but
its flood risk has increased 2.5 times.
Close to 86 percent of the state‟s embankments
(2952 km) are in north Bihar. Their purpose is
to protect 61 percent of the flood prone area in
Bihar, however, in actuality, the rivers that
have been embanked, (including the Kosi) have
reduced channel capacity due to increased
siltation which, in turn, has resulted in more
frequent and severe floods from infrastructure-
related issues. Approximately 16 percent of
north Bihar is susceptible to protracted water-
logging.
Furthermore, embankments fail with regularity
during each major flood. The following
breaches have occurred in the past:
1963: The first breach on the western
embankment in Nepal
1968: Five breaches in north Bihar
1971: Collapse of the 1969-built Bhatania Approach Bund
1980: Eastern Embankment breach
1984: Eastern embankment breach

51
1991: Breach in the western embankment near Joginia in Nepal
2008: Breach in eastern embankment
A cornerstone for effective recovery in the Kosi affected area and mitigation of future flooding is a
comprehensive flood control plan for embankments including better planning, execution, operations and
maintenance.
Upstream disaster risk management and flood management measures
The flooding of the Kosi river is less a national issue than a transnational one. Lack of adequate upstream
containment and mitigation measures in neighbouring Nepal comprises a large part of the disaster risk
profile of north Bihar. Although this Needs Assessment has focused only on Bihar, there is a need to
connect upstream flood management activities to ensure that there is a comprehensively planned flood
risk management system.
Going forward
Bihar has extensive resources (land, water and human) and economic potential. In order to catch up with
the national growth rates, Bihar needs to manage its flood risk in a holistic and outcomes-driven manner.
It is essential that immediate steps are planned and executed to prevent and mitigate the impacts of future
floods and to improve the state‟s adaptation given the hydrological and tectonic inevitability of more
frequent and more devastating floods in the future.
Short-term flood management activities in Bihar should focus on the Kosi basin. It should emphasize: (i)
risk reduction from future flooding of the Kosi through a combination of structural and non-structural
measures; and, (ii) development of an overall state-wide holistic flood risk management master plan.
The long-term measures should scale the Kosi-specific measures to the entire State of Bihar. It should
also see the implementation of priority activities of the integrated flood risk management plan formulated
under the short-term. Indicative examples of activities (some of which were already detailed in Section
3.4) are briefly described below.
Institutional Priority Measures include the implementation of the optimum institutional structure for
future flood management. One agency should be responsible for the design, construction,
management, operation, and maintenance of flood management infrastructure. However, for fully
integrated flood management, it is essential to establish effective partnerships with other technical
and administrative agencies to coordinate flood management planning on an ongoing basis, not just
during and immediately after floods. Agency restructuring will have to be kept to a minimum and
will include a program of capacity building and a comprehensive training and awareness program to
be able not only to carry out the needed functions, but also to raise the exposure of staff at all tiers of
government about integrated flood management.
Structural Priority Measures need to be technically feasible and economically and environmentally
viable. Examples that could possibly be implemented are construction of new embankments or
reconstruction and/or rehabilitation of existing embankments, linking of rivers, and catchment
rehabilitation.

52
Managing Exposure to Flood Hazards can include the development of detailed flood hazard maps by
application of hydrological and hydraulic modeling, coupled with digitally available terrain data and
GIS. This will have to be linked to the development of a program to enforce compliance with the
flood hazard mapping, which is typically a task for district administrations.
East Kosi Main Canal. WRD has proposed the lining of the main canal and its distributaries at a
great cost. Before this can be considered by the World Bank under a separate project a detailed
technical feasibility study would have to be carried out to determine the technical applicability,
technical and environmental benefits (reduction in seepage, water savings, easier operation and
maintenance, etc.), the economic and financial cost-benefit analysis, and a detailed implementation
program.
4.4 Disaster Risk Management
Disaster risk management, in particular, flood risk management in Bihar has suffered from multiple
weaknesses. The absence of comprehensive data and knowledge management systems on water and land
is one the central challenges leading to delayed or inadequate decision-making capacity in GoB. In terms
of data, inaccessibility to topographic data has curtailed attempts at detailed surveys that are essential to
map and forecast inundations. With the trans-border nature of Kosi river, timely dissemination of
information is essential as well as the sharing of real-time and historical gauge data obtained through
bilateral arrangements with neighbouring country, Nepal, as well as vulnerable communities. Past efforts,
even when implemented, have been inadequate and have resulted in less-than-effective and even
counterproductive outcomes.
The absence of an effective asset management system has also curtailed effective disaster management in
the state. The embankments are old and there are currently no adequate asset inventory or operations and
maintenance systems in place.
Finally, adding to the difficulties in the growth of preparedness and risk reduction is the system of
disaster relief and humanitarian aid which are event-driven and highly responsive to catastrophic events.
Knowing that disasters will be taken care of through emergency funding – either internally or externally –
has been a powerful incentive against prevention and mitigation in the State.
Therefore, effective recovery needs to include the development of optimal institutions for state-wide flood
management. There is a need to streamline the disaster management institutional framework and one
agency should be responsible for the design, construction, management, operation, and maintenance of
flood management infrastructure. However, for fully integrated flood management, it is essential to
establish effective and empowered coordination mechanisms with other technical and administrative
agencies to better coordinate flood management planning on a routine basis which has been, until now,
limited to periods during and after floods. Agency restructuring should be minimal and must include a
program of capacity building, and training and an awareness generation to sensitize government staff and
communities about integrated flood management

53
Going forward
Reducing Disaster Risk
This includes various mechanisms including the development of detailed flood hazard maps by
application of hydrological and hydraulic modeling, coupled with digitally available terrain data and GIS.
This will have to be linked to the development of a program to enforce ground compliance with the flood
hazard mapping, which is typically a task for district administrations.
Managing Disaster Response and Preparedness
This includes the development of standard operating procedures to be activated by all agencies and the
coordination mechanism for its observance. It should also include training and capacity building of GoB
functionaries at all levels in the methodology and techniques of disaster risk reduction and in post-disaster
needs assessments.
Managing Vulnerability to the Residual Flood Risks
This includes activities such as developing and implementing programs for community awareness
building and engagement in flood risk management, and provision of adequate community-owned and
community-operated flood warning and emergency response systems.
4.5 Conclusions
Repeated large-scale loss events in Bihar have brought significant destruction, hindering economic
performance and depriving communities of their assets, livelihoods, and labour force, all too often
locking them into endemic poverty cycles. And each year, the State is plagued with the same disasters,
impacting thousands of people, destroying lives and livelihoods, and necessitating the externalization of
disaster response.
The devastation wrought by disasters in the region, however, has also presented an opportunity to initiate
improvements in quality of life and changes in attitudes about risk while undertaking reconstruction tasks.
As seen in examples across the region, good reconstruction after a disaster can help revive the local
economy, restore livelihoods, and improve access to housing, its quality and safety, as well as social and
community infrastructures. Peoples‟ participation in reconstruction activities such as through owner-
driven reconstruction, reinforces equity and strengthens community networks.
While the measures in the needs assessment point to a number of specific interventions and activities, the
real challenge in the region is to ultimately achieve institutional paradigm shifts towards mainstreaming
disaster risk management in the State rather than one-time initiatives focusing on small groups of people,
or led through short-term project approaches. There is an urgent need for long-term transformations on
how we manage risk to ensure that the normal stay of development interventions is not put in jeopardy.

54
Section 5 Recovery Framework
Proposed recovery framework
In order to address the short-, medium-, and long-term needs of recovery, a phased approach for
reconstruction is recommended. The objectives of this approach are to provide timely and focused support
to Bihar‟s reconstruction efforts in the short-term while developing and comprehensive program of
support for the state‟s longer term needs on overall disaster management, in particular, for flood risk
management and sustainable interventions in the areas of agricultural productivity and roads.
In April 2010 during a World Bank mission, the GoB agreed on the proposed Recovery Framework.
Essentially, the agreed Framework stipulates that in Phase-I, the Bank would provide funds for
reconstruction and restoration of priority infrastructure, housing reconstruction and livelihoods restoration
of the affected population in the Kosi Command Area. GoB would dovetail its own resources and those of
GoI (like IAY, TSC etc) to obtain higher synergies. Phase-II of the Recovery Framework envisages the
enlargement of the interventions to the entire disaster-prone areas of Bihar in and beyond the Kosi
Command Area.
Table 18: Proposed Recovery Framework
Draft Framework for World Bank Assistance
Phase I: Short and Medium Term Phase II: Medium and Long Term
• Housing
• Roads / Bridges
• Livelihood Support
• Kosi related Flood Management
• Technical Assistance & Capacity
Building, Project Management Support
• Gaps from Phase I
• State-wide Flood Risk Management • Disaster Management • Agriculture Productivity • Roads
The phased strategy integrates recovery and reconstruction tasks as part of a larger multi-sectoral dialogue
on disaster risk and vulnerability reduction, increased agricultural productivity and connectivity and
overall development. The framework is based on the following considerations:
Phase-I would allow faster delivery of short-term reconstruction assistance, which is particularly
urgent as considerable time elapsed between the disaster and posing of the project to the Bank
Phase-I would ensure that an effective implementation structure is established for delivery of
project objectives and would be available for longer-term engagements in Phase-II
Phase-I would include critical technical assistance for capacity development to deliver Phase-II
satisfactorily.
The phased approach allows faster delivery of reconstruction assistance which is particularly
important as considerable time has elapsed since the Kosi floods

55
The first phase facilitates an effective implementation structure to be set in place that will be
responsible for the delivery of the project and would also engender larger future engagement
The first phase includes key technical assistance programs that would assist in developing
capacity, strategy, and activities for Phase II
The preparation for Phase II can start simultaneously with the preparation of Phase I
Given the nature of the activities envisioned, Phase II would not be limited to the Kosi affected
areas but will have a state wide footprint in order to comprehensively address the targeted sectors
and contribute to the overall economic development of the state

56
Annex 1

57
Annex 2
Visual of 2008 Kosi River Flooding in Bihar

58

59
Annex 3
Satellite Imagery of 2008 Kosi Floods

60
Annex 4
Total Damage in Bihar due to floods in 1979-2006
Source: GoB. Note: INR 1 lakh = INR 0.1 Million

61
Annex 5
Multi-hazard Risk Profile of Bihar
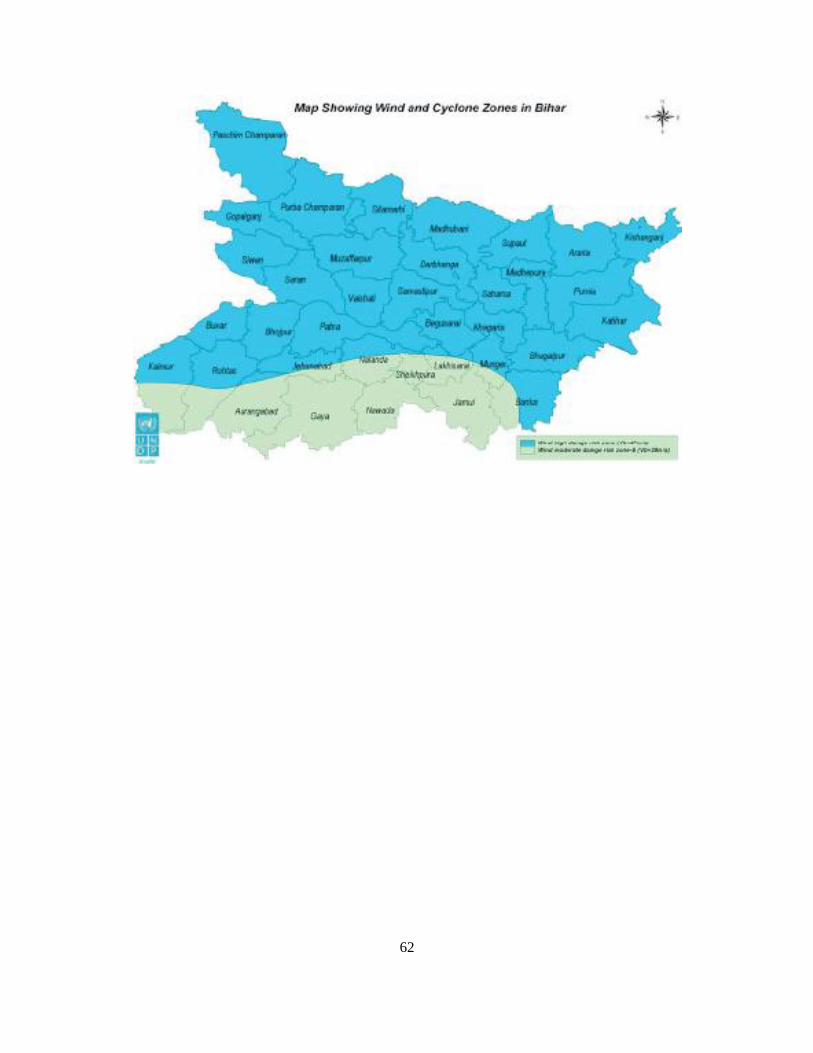
62
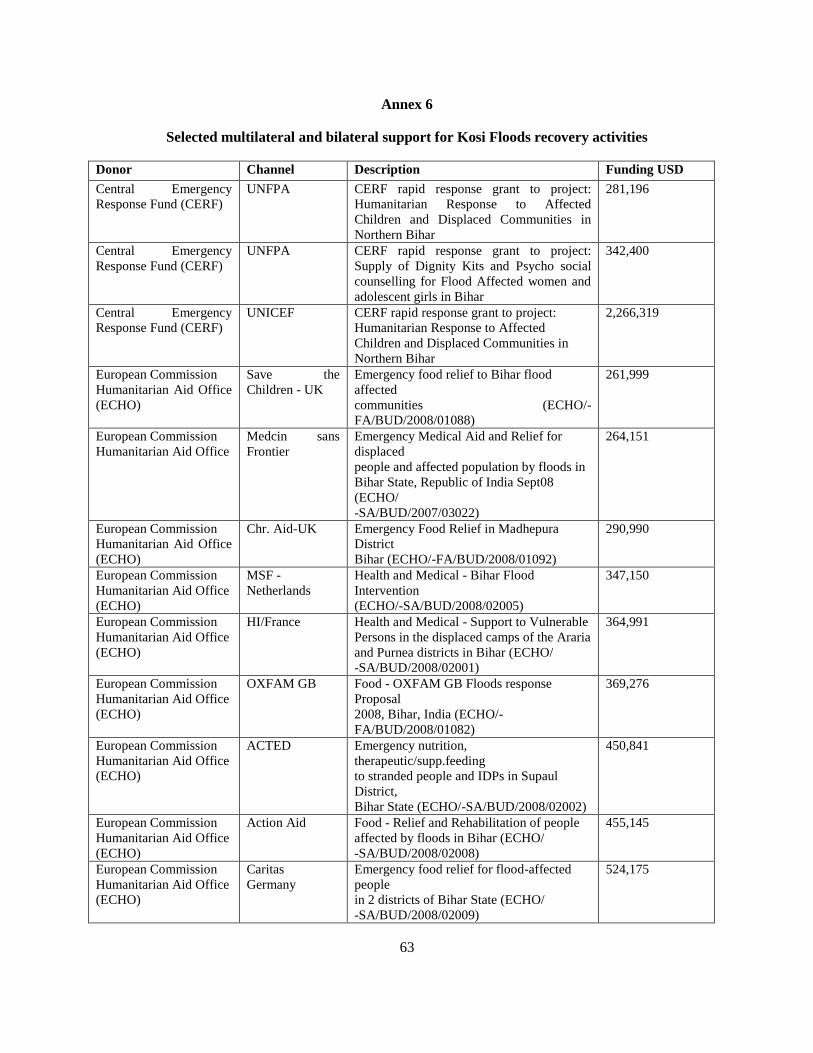
63
Annex 6
Selected multilateral and bilateral support for Kosi Floods recovery activities
Donor Channel Description Funding USD
Central Emergency
Response Fund (CERF)
UNFPA CERF rapid response grant to project:
Humanitarian Response to Affected
Children and Displaced Communities in
Northern Bihar
281,196
Central Emergency
Response Fund (CERF)
UNFPA CERF rapid response grant to project:
Supply of Dignity Kits and Psycho social
counselling for Flood Affected women and
adolescent girls in Bihar
342,400
Central Emergency
Response Fund (CERF)
UNICEF CERF rapid response grant to project:
Humanitarian Response to Affected
Children and Displaced Communities in
Northern Bihar
2,266,319
European Commission
Humanitarian Aid Office
(ECHO)
Save the
Children - UK
Emergency food relief to Bihar flood
affected
communities (ECHO/-
FA/BUD/2008/01088)
261,999
European Commission
Humanitarian Aid Office
Medcin sans
Frontier
Emergency Medical Aid and Relief for
displaced
people and affected population by floods in
Bihar State, Republic of India Sept08
(ECHO/
-SA/BUD/2007/03022)
264,151
European Commission
Humanitarian Aid Office
(ECHO)
Chr. Aid-UK Emergency Food Relief in Madhepura
District
Bihar (ECHO/-FA/BUD/2008/01092)
290,990
European Commission
Humanitarian Aid Office
(ECHO)
MSF -
Netherlands
Health and Medical - Bihar Flood
Intervention
(ECHO/-SA/BUD/2008/02005)
347,150
European Commission
Humanitarian Aid Office
(ECHO)
HI/France Health and Medical - Support to Vulnerable
Persons in the displaced camps of the Araria
and Purnea districts in Bihar (ECHO/
-SA/BUD/2008/02001)
364,991
European Commission
Humanitarian Aid Office
(ECHO)
OXFAM GB Food - OXFAM GB Floods response
Proposal
2008, Bihar, India (ECHO/-
FA/BUD/2008/01082)
369,276
European Commission
Humanitarian Aid Office
(ECHO)
ACTED Emergency nutrition,
therapeutic/supp.feeding
to stranded people and IDPs in Supaul
District,
Bihar State (ECHO/-SA/BUD/2008/02002)
450,841
European Commission
Humanitarian Aid Office
(ECHO)
Action Aid Food - Relief and Rehabilitation of people
affected by floods in Bihar (ECHO/
-SA/BUD/2008/02008)
455,145
European Commission
Humanitarian Aid Office
(ECHO)
Caritas
Germany
Emergency food relief for flood-affected
people
in 2 districts of Bihar State (ECHO/
-SA/BUD/2008/02009)
524,175

64
European Commission
Humanitarian Aid Office
(ECHO)
Chr. Aid-UK Emergency Fod Relief in Madhepura
District
Bihar (ECHO/-SA/BUD/2008/02007)
622,050
European Commission
Humanitarian Aid Office
(ECHO)
CARE-UK Water / Sanitation-Humanitarian Response
for
flood victims of Kosi Floods in North
Eastern
Districts of Bihar (ECHO/-
SA/BUD/2008/02006)
726,174
European Commission
Humanitarian Aid Office
(ECHO)
OXFAM GB Water / Sanitation - Emergency Response to
Bihar Floods (ECHO/-
SA/BUD/2008/02004)
732,064
France ACTED Assistance aux personnes deplacees 147,710
Hong Kong Special
Administrative Region of
the People's Republic of
China
NGOs To undertake relief projects for the flood
victims
in India
629,872
Ireland HelpAge
International
Flood relief 125,697
Ireland Christian Aid To alleviate the immediate humanitarian
food
needs of the flood affected people in Supaul
District (CAID 08 01)
147,710
Ireland Trocaire Enable flood affected families to return to
normality through the provision of relief
assistance (TRO 08 08)
147,710
Italy IFRC To assist affected population 147,710
Luxembourg CARITAS Emergency relief for flood victims in the
State
of Bihar
147,710
Luxembourg Indesch
Patenschaften
Rehabilitation and reconstruction of 70
houses
401,493
Sweden Church of
Sweden
Community health (prev. and curative),
intermediate shelter for 100 families,
Psychosocial assistance
113,000 (pledged)
Sweden Diakonie
Emergency
Aid
Humanitarian support to families affected
by the
floods
30,719
Sweden SMR Humanitarian support to people affected by
the
floods
105,769
Sweden SMR To provide food, water, emergency relief
kits,
temporary shelters and medical services
including trauma counselling to 21 villages
in the
Madhepura district of Bihar
129,970
Sweden SMR Humanitarian support to people affected by
the
flooding
137,890
Sweden InterAct To provide assistance to flood affected
people in Madhepura and Saharsa districts
of Bihar with food and non-food items
156,740

65
(candles, matches, hygiene kits, tarpauline
sheets, bamboo mats & kitchen utensils
Sweden Diakonia,
Sweden
Humanitarian support to people affected by
the
floodings
227,037
Sweden Church of
Sweden
Humanitarian support to people affected by
the
floods in Bihar
231,146 &
245,855
United States of America USAID India/Food Shortage - Logistics and Relief
Commodities (386-G-00-08-00046-00)
50,000
United States of America USAID India/Floods - Disaster Response 100,000
Source: List of all commitments/contributions and pledges for India in 2008 as of 26 June 2010. http://www.reliefweb.int/fts
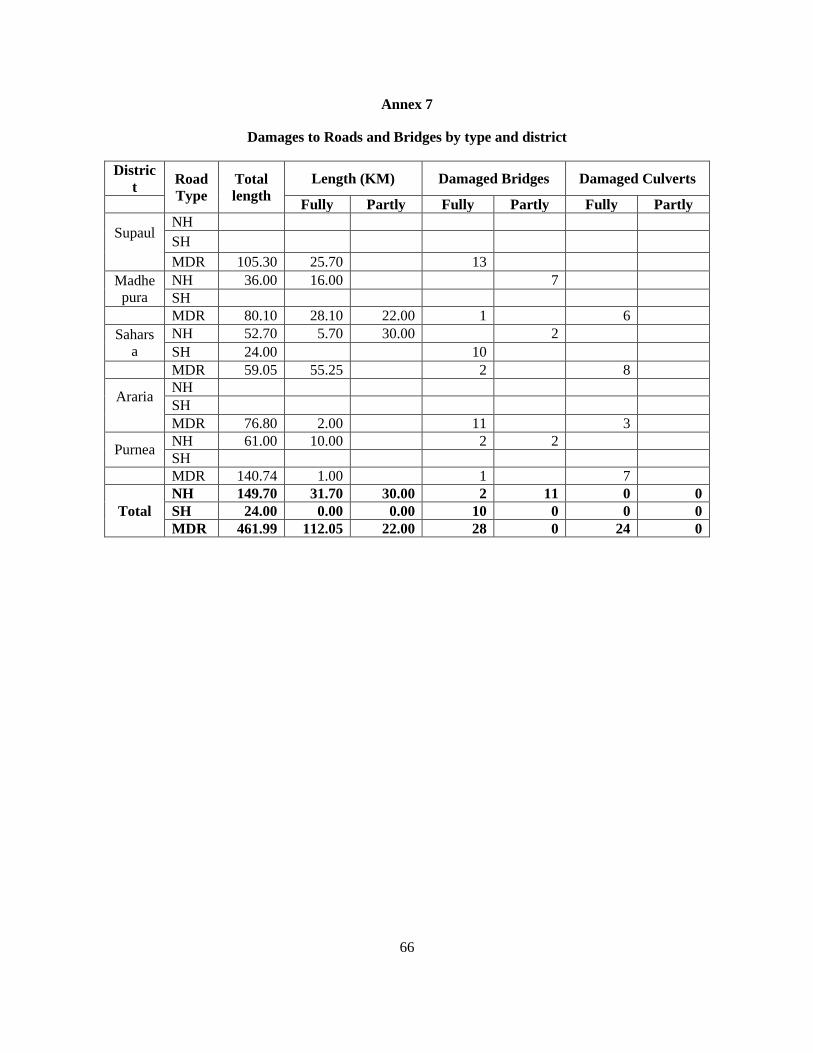
66
Annex 7
Damages to Roads and Bridges by type and district
Distric
t Road
Type
Total
length
Length (KM) Damaged Bridges Damaged Culverts
Fully Partly Fully Partly Fully Partly
Supaul NH
SH
MDR 105.30 25.70 13
Madhe
pura
NH 36.00 16.00 7
SH
MDR 80.10 28.10 22.00 1 6
Sahars
a
NH 52.70 5.70 30.00 2
SH 24.00 10
MDR 59.05 55.25 2 8
Araria NH
SH
MDR 76.80 2.00 11 3
Purnea NH 61.00 10.00 2 2
SH
MDR 140.74 1.00 1 7
Total
NH 149.70 31.70 30.00 2 11 0 0
SH 24.00 0.00 0.00 10 0 0 0
MDR 461.99 112.05 22.00 28 0 24 0

67
Annex 8
Damages to Roads and Bridges
Distric
t
Total length
(KM)
Damaged
paved roads
(km)
Damaged
unpaved
roads (km)
No. of damaged -
Bridges/Culverts
Fully
damaged
Partly
damaged
Fully
dama
ged
Partl
y
dama
ged
Fully
damag
ed
Partly
damag
ed
Supaul 470.39 136.15 44.35 232.0
1 37.80 298 19
Madhe
pura 922.25 104.05 33.80
692.7
0 71.15 490 4
Sahars
a 125.62 12.73 79.35 0.00 0.00 15 65
Araria 80.25 13.61 66.46 0.00 0.00 5 34
Purnea 83.99 21.51 89.43 0.00 0.00 11 48
Total 1682
.50
288.0
5
313.3
8
924.7
1 108.95 819 170
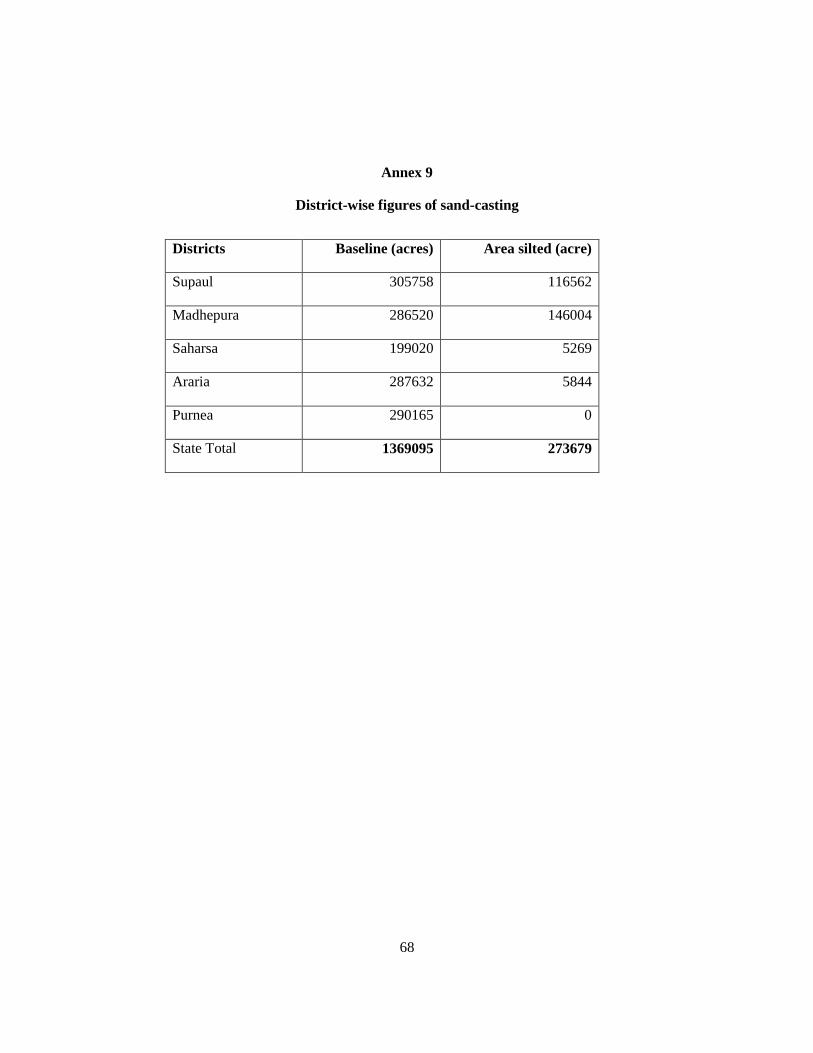
68
Annex 9
District-wise figures of sand-casting
Districts Baseline (acres) Area silted (acre)
Supaul 305758 116562
Madhepura 286520 146004
Saharsa 199020 5269
Araria 287632 5844
Purnea 290165 0
State Total 1369095 273679

69
Annex 10
Literacy Levels in Flood Affected Districts, 2001
Literacy Levels in the Flood Affected Kosi Districts, 2001
Sl No District All Communities SCs STs Minorities
Male Female Total
1 Araria 46.4 22.4 35.6 18.9 21.9 27.6
2 Madhepura 48.8 22.1 36.1 17.1 33.6 26.8
3 Purnea 45.6 23.4 35.1 18.5 24.5 25.9
4 Supaul 52.4 20.8 37.3 19.6 26.9 32.2
5 Saharsa 51.7 25.3 39.1 18.5 24.5 37.3
Bihar 59.7 33.1 47.0 28.5 28.2 41.9
Source: Census of India, 2001, GoI

70
Annex 1116
Details of Needs Reported in the Education Sector
Primary Education
Estimates – Higher Education
Estimates – Secondary Schools
Secondary Education
Secondary Education
16
Needs in the education sector were not verified as part of the assessment.
total No of
schools
affected
Completely
Damage
Major
Damage
Minor
Damage
For
Completely
Damage
For Major
Damage
(Rs. 5 lakh &
10 Lakh for
Pr. & UP
For Minor
Damage
(Rs. 2 lakh &
5 Lakh for P
& UP res.)
Total
Primary 132 0 0 132 0.00 0.00 264.00 264.00
Upp. Pri 34 0 0 34 0 0.00 170.00 170.00
Primary 361 106 150 105 1803.80 750.00 210.00 2763.80
Upp. Pri 174 57 72 45 1763.01 720.00 225.00 2708.01
Primary 232 0 20 212 0.00 100.00 424.00 524.00Upp. Pri 65 0 7 58 0 70.00 290.00 360.00
Primary 86 0 37 49 0.00 185.00 98.00 283.00Upp. Pri 43 0 14 29 0 140.00 145.00 285.00Primary 185 6 117 62 102.10 585.00 124.00 811.10Upp. Pri 116 4 64 48 123.72 640.00 240.00 1003.72
Primary 996 112 324 560 1905.90 1620.00 1120.00 4645.90
Upp. Pri 432 61 157 214 1886.73 1570.00 1070.00 4526.73
Total 1428 173 481 774 3792.63 3190.00 2190.00 9172.63
Supaul
DistrictCatogory
of
Schools
Total
No. of affected SchoolsAmount Required for
reconstruction/ repair of Schools
(Rs. Lakh)
Araria
Madhepura
Purnea
Saharsa
Completely
Damage
Major
Damage
Minor
DamagePrimary 1071 0 0 132Upp. Primary 424 0 0 34Primary 1050 106 150 105Upp. Primary 362 57 72 45Primary 1257 0 20 212Upp. Primary 474 0 7 58Primary 849 0 37 49Upp. Primary 402 0 14 29Primary 1116 6 117 62Upp. Primary 475 4 64 48
Primary 5343 112 324 560Upp. Primary 2137 61 157 214
total 7480 173 481 774
DistrictTotal No.
of Blocks
No. of
Blocks
affected
Catogory of
Schools
Total No.
of
Schools
in
District
No. of affected Schools
4
11
8
6
5
Total
9
13
14
10
11
Araria
Madhepura
Purnea
Saharsa
Supaul
57 34

71
Name of University/ Colleges affectedItem of
Repair
Estimated cost for
Repair
(Rs. In Lakh)
Estimated
cost of
Library @2
lakh per
college
Estimated
cost of
Laboratory
@2 lakh per
college
total
B. N. Mandal University, Madhepura1-
Boundary
Wall
102.79 2.00 2.00 106.79
Bhupendra Narain Vanijaya
Mahavidyalaya, Shahuganj, Madhepura Repair 26.76 2.00 2.00 30.76
Parvati Sceince College, Madhepura Repair 141.12 2.00 2.00 145.12
Kamleshwari Prasad College, murliganj,
MadhepuraRepair 22.95 2.00 2.00 26.95
Harihar Saha College, Uda Kishunganj Repair 18.97 2.00 2.00 22.97
L.N.M.S. College Virpur, Sapaul Repair 17.27 2.00 2.00 21.27
Thakur Prasad College, Madhepura Repair 80.80 2.00 2.00 84.80
Total 410.65 14.00 14.00 438.65
Higher Education
District-wise Education Sector Damages
District Total
Blocks
Affected
Blocks Catogory
Total
Schools
Completely
Damaged
Major
Damage
Minor
Dama
ge
Araria 9 4 Primary 1071 0 0 132
U Primary 424 0 0 34
Madhepura 13 11 Primary 1050 106 150 105
U Primary 362 57 72 45
Purnea 14 8 Primary 1257 0 20 212
UPrimary 474 0 7 58
Saharsa 10 6 Primary 849 0 37 49
U Primary 402 0 14 29
Supaul 11 5 Primary 1116 6 117 62
U Primary 475 4 64 48
SubTotal 57 34 Primary 5343 112 324 560
U Primary 2137 61 157 214
Total 7480 173 481 774

72
Annex 12
Reported needs in health sector17
(INR, Million)
Sl Item Supaul Madhepura Araria Saharsa Purnea Total
1 POL for Ambulance
Service & Vehicles,
Engagement of
Technician &
Medicine
4.7 4.7 4.2 4.2 3.2 16.8
2 POL for Ambulance
Service & Vehicles,
Engagement of
Technician &
Medicine includes
medicine cost received
from GoI
18 18.6 13 17 23 89.6
3 Mobile Medical
Teams (Additional
medical staff)
13.5 16 14 23 12.6 79.1
4 Control of Vector
Borne and Water
Borne Diseases and
Surveillance
2 18.6 0.69 0.74 0.51 5.8
5 Healthcare in Relief
Camps
2.3 2.2 1.5 4.8 4.8 15.6
6 Immunization
Campaigns
2.3 2.2 3.2 2.3 4.8 14.8
7 Repair of health
infrastructure
103.5 222 0 143.5 39.5 508.5
Total 730.2
17
These needs were not verified as part of the assessment

73
Annex 13
Needs Assessment team composition and mission program
Core Mission Team
Prashant Senior DRM Specialist
Deepak Singh Infrastructure Specialist
Saurabh Dani Disaster Risk Management Specialist
Ranu Sinha Water Resources Specialist
Contributing members
Rakhi Bhavnani Disaster Risk Management Consultant
Venkat Rao Bayana Social Development Specialist
Neha Vyas Environmental Specialist
M.K. Chatterjee Bridge Expert
Vinay Kumar Livelihood Specialist
Mission Program
Following and in keeping with the World Bank Scoping Mission of April 19-22, 2010, a Needs
Assessment-cum-Project Preparation Mission arrived in Patna on May 24, 2010 and had a kickoff
meeting with the Principal Secretary, Planning and Development.
After the kick-off meeting at Patna, Bihar, the Team held extensive discussions with Principal Secretaries
of Planning, Water Resources, Minor Water Resources, Agriculture, Road Construction, Rural Works,
Disaster Management and other relevant Departments on May 24, 2010. The filed team consisting of
Prashant, Saurabh, Ranu, M.K. Chatterjee, Venkat and Vinay reached Supaul on May 25, 2010 for sample
verification of damages to validate the data furnished by the Government of Bihar and to prepare the
Needs Assessment that would form the basis for the Project Design and its Components. The Team
returned to the Patna on May 27, 2010 after extensive field verification encompassing assets pertaining to
the Water Resources, Roads, Rural Works, Housing, Agriculture and other sectors in Supaul District of
India and upstream visit to the embankment sites in southern Nepal. Relevant officials of the State
Government accompanied the Team and provided utmost cooperation and support. The Team
acknowledges the cooperation and support of the District Magistrate Offices of Supaul and Madhepura,
Water Resources Department, Rural Works Department, Rural Development Department, Disaster

74
Management Division (DMD), and Ministry of Planning, that assisted during the field verification
surveys.