BigIdea Interactions 4 - The Bio Edge - Home · Interactions 4 INVESTIGATION 13 ENZYME ACTIVITY*...
8
Big Idea Investigation 13 S153 Interactions 4 INVESTIGATION 13 ENZYME ACTIVITY* How do abiotic or biotic factors influence the rates of enzymatic reactions? BACKGROUND Enzymes are the catalysts of biological systems. ey speed up chemical reactions in biological systems by lowering the activation energy, the energy needed for molecules to begin reacting with each other. Enzymes do this by forming an enzyme-substrate complex that reduces energy required for the specic reaction to occur. Enzymes have specic shapes and structures that determine their functions. e enzyme’s active site is very selective, allowing only certain substances to bind. If the shape of an enzyme is changed in any way, or the protein denatured, then the binding site also changes, thus disrupting enzymatic functions. Enzymes are fundamental to the survival of any living system and are organized into a number of groups depending on their specic activities. Two common groups are catabolic enzymes (“cata” or “kata-” from the Greek “to break down”) — for instance, amylase breaks complex starches into simple sugars — and anabolic enzymes (“a-” or “an-” from the Greek “to build up”). (You may know this second word already from stories about athletes who have been caught using anabolic steroids to build muscle.) Catalytic enzymes, called proteases, break down proteins and are found in many organisms; one example is bromelain, which comes from pineapple and can break down gelatin. Bromelain oen is an ingredient in commercial meat marinades. Papain is an enzyme that comes from papaya and is used in some teeth whiteners to break down the bacterial lm on teeth. People who are lactose intolerant cannot digest milk sugar (lactose); however, they can take supplements containing lactase, the enzyme they are missing. All of these enzymes hydrolyze large, complex molecules into their simpler components; bromelain and papain break proteins down to amino acids, while lactase breaks lactose down to simpler sugars. Anabolic enzymes are equally vital to all living systems. One example is ATP synthase, the enzyme that stores cellular energy in ATP by combining ADP and phosphate. Another example is rubisco, an enzyme involved in the anabolic reactions of building sugar molecules in the Calvin cycle of photosynthesis. * Transitioned from the AP Biology Lab Manual (2001)
Transcript of BigIdea Interactions 4 - The Bio Edge - Home · Interactions 4 INVESTIGATION 13 ENZYME ACTIVITY*...
BigIdea
Investigation 13 S153
Interactions 4INVESTIGATION 13
ENZYME ACTIVITY*How do abiotic or biotic factors influence the rates of enzymatic reactions?
! BACKGROUNDEnzymes are the catalysts of biological systems. !ey speed up chemical reactions in biological systems by lowering the activation energy, the energy needed for molecules to begin reacting with each other. Enzymes do this by forming an enzyme-substrate complex that reduces energy required for the speci"c reaction to occur. Enzymes have speci"c shapes and structures that determine their functions. !e enzyme’s active site is very selective, allowing only certain substances to bind. If the shape of an enzyme is changed in any way, or the protein denatured, then the binding site also changes, thus disrupting enzymatic functions.
Enzymes are fundamental to the survival of any living system and are organized into a number of groups depending on their speci"c activities. Two common groups are catabolic enzymes (“cata” or “kata-” from the Greek “to break down”) — for instance, amylase breaks complex starches into simple sugars — and anabolic enzymes (“a-” or “an-” from the Greek “to build up”). (You may know this second word already from stories about athletes who have been caught using anabolic steroids to build muscle.)
Catalytic enzymes, called proteases, break down proteins and are found in many organisms; one example is bromelain, which comes from pineapple and can break down gelatin. Bromelain o#en is an ingredient in commercial meat marinades. Papain is an enzyme that comes from papaya and is used in some teeth whiteners to break down the bacterial "lm on teeth. People who are lactose intolerant cannot digest milk sugar (lactose); however, they can take supplements containing lactase, the enzyme they are missing. All of these enzymes hydrolyze large, complex molecules into their simpler components; bromelain and papain break proteins down to amino acids, while lactase breaks lactose down to simpler sugars.
Anabolic enzymes are equally vital to all living systems. One example is ATP synthase, the enzyme that stores cellular energy in ATP by combining ADP and phosphate. Another example is rubisco, an enzyme involved in the anabolic reactions of building sugar molecules in the Calvin cycle of photosynthesis.
* Transitioned from the AP Biology Lab Manual (2001)

S154 Investigation 13
3p4
To begin this investigation, you will focus on the enzyme peroxidase obtained from a turnip, one of numerous sources of this enzyme. Peroxidase is one of several enzymes that break down peroxide, a toxic metabolic waste product of aerobic respiration. Using peroxidase, you will develop essential skills to examine your own questions about enzyme function.
Later, you will have an opportunity to select an enzyme, research its properties and mode of reaction, and then design an experiment to explore its function. !e investigation also provides an opportunity for you to apply and review concepts you have studied previously, including the levels of protein structure, energy transfer, abiotic and biotic in"uences on molecular structure, entropy and enthalpy, and the role of enzymes in maintaining homeostasis.
! Learning Objectives • To understand the relationship between enzyme structure and function• To make some generalizations about enzymes by studying just one enzyme in
particular• To determine which factors can change the rate of an enzyme reaction• To determine which factors that a#ect enzyme activity could be biologically
important
! General Safety PrecautionsFollow general laboratory safety procedures. Wear proper footwear, safety goggles or glasses, a laboratory coat, and gloves. Use proper pipetting techniques, and use pipette pumps, syringes, or rubber bulbs. Never pipette by mouth! Dispose of any broken glass in the proper container. Since the concentrations of the reactive materials in this laboratory are environmentally friendly (0.1% hydrogen peroxide and 0.3% guaiacol), they can be rinsed down a standard laboratory drain. !e concentrations used here are deemed to be safe by all chemical standards, but recall that any compound has the potentiality of being detrimental to living things and the environment. When you develop your individual investigations you must always consider the toxicity of materials used.
Investigation 13 S155
BIG IDEA 4: INTERACTIONS
! Key VocabularyBaseline is a universal term for most chemical reactions. In this investigation the term is used to establish a standard for a reaction. !us, when manipulating components of a reaction (in this case, substrate or enzyme), you have a reference to help understand what occurred in the reaction. !e baseline may vary with di"erent scenarios pertinent to the design of the experiment, such as altering the environment in which the reaction occurs. In this scenario, di"erent conditions can be compared, and the e"ects of changing an environmental variable (e.g., pH) can be determined.Rate can have more than one applicable de#nition because this lab has two major options of approach, i.e., using a color palette and/or a spectrophotometer to measure percent of light absorbance. When using a color palette to compare the change in a reaction, you can infer increase, decrease, or no change in the rate; this inference is usually called the relative rate of the reaction. When using a spectrophotometer (or other measuring devices) to measure the actual percent change in light absorbance, the rate is usually referred to as absolute rate of the reaction. In this case, a speci#c amount of time can be measured, such as 0.083 absorbance/minute.
! THE INVESTIGATIONS
! Getting Started
! Procedure 1: Developing a Method for Measuring Peroxidase in Plant Material and Determining a Baseline
Peroxide (such as hydrogen peroxide) is a toxic byproduct of aerobic metabolism. Peroxidase is an enzyme that breaks down these peroxides. It is produced by most cells in their peroxisomes.
!e general reaction can be depicted as follows:
Enzyme + Substrate --> Enzyme-Substrate Complex --> Enzyme + Product(s) + $G
For this investigation the speci#c reaction is as follows:
Peroxidase + Hydrogen Peroxide --> Complex --> Peroxidase + Water + Oxygen
2H2O2 % 2H2O + O2 (gas)
Notice that the peroxidase is present at the start and end of the reaction. Like all catalysts, enzymes are not consumed by the reactions. To determine the rate of an
S156 Investigation 13
3p4
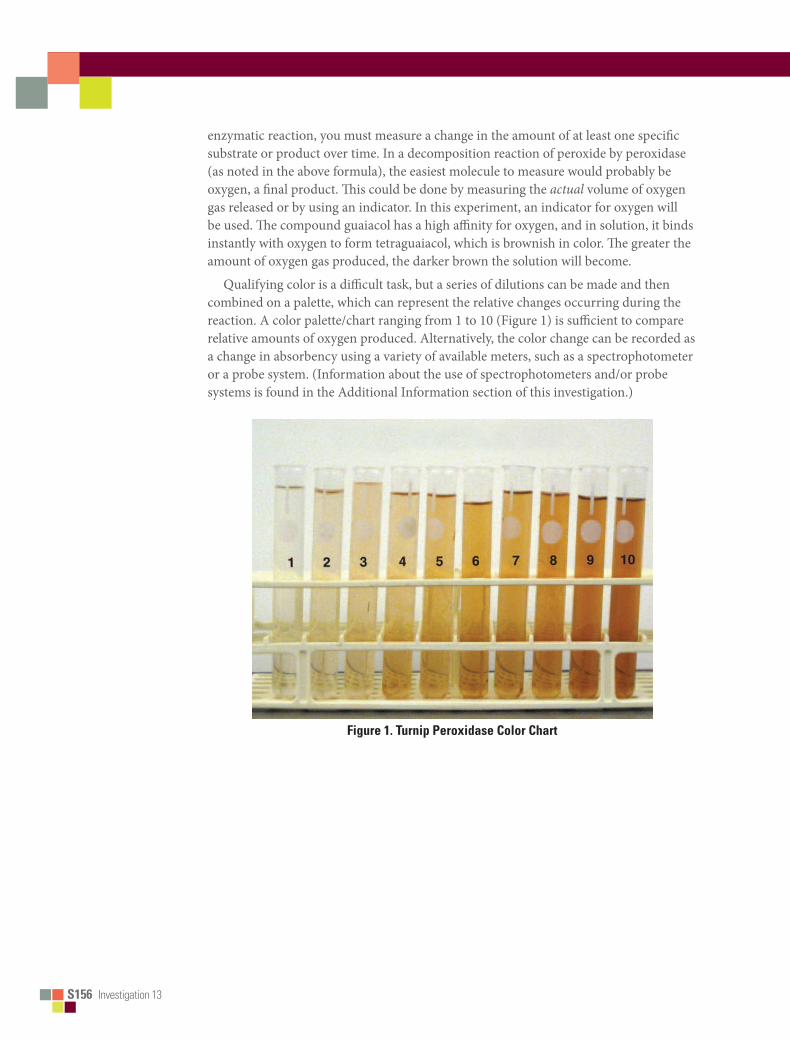
enzymatic reaction, you must measure a change in the amount of at least one speci!c substrate or product over time. In a decomposition reaction of peroxide by peroxidase (as noted in the above formula), the easiest molecule to measure would probably be oxygen, a !nal product. "is could be done by measuring the actual volume of oxygen gas released or by using an indicator. In this experiment, an indicator for oxygen will be used. "e compound guaiacol has a high a#nity for oxygen, and in solution, it binds instantly with oxygen to form tetraguaiacol, which is brownish in color. "e greater the amount of oxygen gas produced, the darker brown the solution will become.
Qualifying color is a di#cult task, but a series of dilutions can be made and then combined on a palette, which can represent the relative changes occurring during the reaction. A color palette/chart ranging from 1 to 10 (Figure 1) is su#cient to compare relative amounts of oxygen produced. Alternatively, the color change can be recorded as a change in absorbency using a variety of available meters, such as a spectrophotometer or a probe system. (Information about the use of spectrophotometers and/or probe systems is found in the Additional Information section of this investigation.)
Figure 1. Turnip Peroxidase Color Chart

Investigation 13 S157
BIG IDEA 4: INTERACTIONS
Materials• Turnip peroxidase• 0.1% hydrogen peroxide• Guaiacol• Distilled (deionized) water• 2 test tubes (approximately 16 x 150
mm) and appropriate test tube rack
• Timer• 1, 5, and 10 mL graduated pipettes,
pipette pumps, or syringes (1, 2, 5, and 10 mL)
!is investigation is designed to be performed without a spectrophotometer, but your teacher may ask you to use a spectrophotometer or probe system. If so, additional equipment may be required.
Step 1 Using two 16 x 150 mm test tubes, mark one “substrate” and the other tube “enzyme.” To the substrate tube, add 7 mL of distilled water, 0.3 mL of 0.1 percent hydrogen peroxide, and 0.2 mL guaiacol for a total volume of 7.5 mL. Cover the test tube with a piece of Para"lm® and gently mix.
Step 2 To the enzyme tube, add 6.0 mL of distilled water and 1.5 mL of peroxidase for a total volume of 7.5 mL. Cover the test tube with a piece of Para"lm and gently mix.
Step 3 Combine the contents of the two tubes (subtrate and enzyme) in another 16 x 150 mL test tube, cover the tube with Para"lm, invert twice to mix, and place the tube in a test tube rack. Immediately begin timing the reaction.
Step 4 Observe the color change for the next 5 minutes. Rotate the tube before each reading. Record the observed color at 0, 1, 2, 3, 4, and 5 minutes. (A cell phone and/or camera are excellent ways to record color change.)
Step 5 Use the color palette/chart (Figure 1) to help you quantify changes in color over time. Graph your data in your laboratory notebook.
Consider the following questions before you proceed to the next experiment:• You measured the color change at di#erent times. Which time will you use for your
later assays? Why? (!e time/color change that you select will serve as your baseline for additional investigations.)
• When you use this assay to assess factors that change enzyme activity, which components of the assay will you change? Which will you keep constant?

S158 Investigation 13
3p4
! Procedure 2: Determining the Effect of pH on Enzymatic Activity
Numerous variables can be employed to observe the e!ects on the rate of an enzymatic reaction and possibly the speci"c "t of the enzyme with the substrate. • What do you predict will occur if the pH in the reaction changes? How do you justify
your prediction?
Materials• Turnip peroxidase• 0.1% hydrogen peroxide• Guaiacol• Bu!ers with range of pH• Distilled (deionized) water• 12 test tubes (approximately 16 x
150 mm) and appropriate test tube rack
• Timer• 1, 5, and 10 mL graduated pipettes,
pipette pumps, or syringes (1, 2, 5, and 10 mL)
• Spectrophotometer or probe system
Step 1 Using clean 16 x 150 mL test tubes, make six sets of pairs of original substrate and enzyme tubes for a total of 12 tubes or 6 pairs. #is time you will substitute a di!erent pH bu!er for the distilled water used in the original enzyme tubes. Prepare the tubes as follows and be sure to label them.• For each substrate tube in a pair, add 7 mL of distilled water, 0.3 mL of hydrogen
peroxide, and 0.2 mL of guaiacol for a total volume of 7. 5 mL.• For each enzyme tube in the pair, add 6.0 mL of a speci"c pH solution and 1.5 mL of
peroxidase for a total volume of 7.5 mL. For example, in the enzyme tube of the "rst pair, you can substitute 6.0 mL of bu!er solution of pH 3 for the distilled water; in the enzyme tube of the second pair, you can substitute 6.0 mL of bu!er solution of pH 5 for the distilled water, and so forth.
• Cover each test tube with a piece of Para"lm, and gently mix.
Step 2 Combine the substrate and enzyme tubes for all six pairs (total volume 15.0 mL per pair), cover with Para"lm, gently mix, and place the tubes back in the test tube rack. Immediately begin timing the reactions.
Step 3 Record the observed color for each tube at 0 minutes and again at the time you chose based on your results in Procedure 1. (Again, a cell phone and/or camera are excellent ways to record color change.)
Investigation 13 S159
BIG IDEA 4: INTERACTIONS
Step 4 Use the palette/color chart (Figure 1) to help you quantify the changes you observe. Graph your data as color intensity versus pH. What conclusions can you draw from your results?
! Designing and Conducting Your InvestigationYou now have the basic information and tools needed to explore enzymes in more depth on your own. In this part of the lab, you will do just that. You will have the chance to develop and test your own hypotheses about enzyme activity. To help you get started, read the following questions, and write your answers in your laboratory notebook. • In Procedure 1, was the limiting factor of your baseline reaction the enzyme or the
substrate? How could you modify the procedure you learned to answer this question?• What are three or four factors that vary in the environment in which organisms live?
Which of those factors do you think could a!ect enzyme activity? How would you modify your basic assay to test your hypothesis?
Design and conduct an experiment to investigate an answer(s) to one of the questions above or another question that might have been raised as you conducted Procedures 1 and 2. Remember, the primary objective of the investigation is to explore how biotic and abiotic factors in"uence the rate of enzymatic reactions.
! Analyzing ResultsFrom the data that you collected from your independent investigation, graph the results. Based on the graph and your observations, compare the e!ects of biotic and abiotic environmental factors on the rate(s) of enzymatic reactions and explain any di!erences.
! Additional InformationIf a spectrophotometer is available, the following information is useful.
#e use of measuring devices can better quantify your results. Using a spectrophotometer, you can select a speci$c wavelength to $t the color/pigment expected in an experiment. #e change in the amount or concentration of color/pigment may be measured as absorbance (amount of the wavelength trapped by the pigment) or transmittance (amount of the wavelength that is not trapped by the pigment).
For Procedure 1: 1. Turn on your spectrophotometer approximately 10 to 15 minutes prior to
starting the investigation so that it will warm up appropriately.
2. To measure the amount of the compound tetraguaiacol, set the wavelength to 470 nm.

S160 Investigation 13
3p4
3. Set your machine at zero absorbance using a blank containing all the appropriate materials except the substrate (i.e., 13.3 mL of distilled water, 0.2 mL of guaiacol, and 1.5 mL of enzyme extract = 15 mL total).
4. Determine the baseline. A. Using two 16 x 150 mm test tubes, label one “substrate” and the other “enzyme.”
Substrate tube: 7 mL of distilled water, 0.3 mL of hydrogen peroxide, and 0.2 mL guaiacol (total volume 7.5 mL) Enzyme tube: 6 mL of distilled water and 1.5 mL of peroxidase (total volume 7.5 mL)
B. Combine the materials of the substrate and enzyme tubes. Mix the tubes twice and pour into a cuvette. (When mixing or rotating always cover the opening of the cuvette with Para!lm.)
C. Place the cuvette into the spectrophometer and record absorbance; this is your initial or “0” time reading. Remove the tube. Repeat recording absorbance at 1, 2, 3, 4, and 5 minutes. Be sure to rotate (use Para!lm to cover) the tube and also clean its surface with a scienti!c cleaning wipe before each reading.
5. Record and graph your data.
For Procedure 2:Follow steps 1, 2, and 3 above. In step 4, set up as outlined above. Make an initial reading at time “0” and a second reading at the time you chose as optimal based on results obtained in Procedure 1. Record and graph your data.