BIG SAINT GERMAIN LAKE - dnr.wi.gov · 04-03-2012 · Physical Characteristics Big Saint Germain...
18
WISCONSIN DEPARTMENT OF NATURAL RESOURCES CREEL SURVEY REPORT BIG SAINT GERMAIN LAKE VILAS COUNTY 2011-12 Treaty Fisheries Publication Compiled by Tim Tobias & Jeff Blonski Treaty Fisheries Technicians
Transcript of BIG SAINT GERMAIN LAKE - dnr.wi.gov · 04-03-2012 · Physical Characteristics Big Saint Germain...
WISCONSIN DEPARTMENT OF NATURAL RESOURCES CREEL SURVEY REPORT
BIG SAINT GERMAIN LAKE VILAS COUNTY
2011-12
Treaty Fisheries Publication
Compiled by Tim Tobias & Jeff Blonski Treaty Fisheries Technicians
CONTENTS INTRODUCTION.................................................................................................................. 1 GENERAL LAKE INFORMATION ..................................................................................... 2 Location ........................................................................................................................... 2 Physical Characteristics ................................................................................................... 2 Seasons Surveyed ............................................................................................................. 2 Weather ............................................................................................................................ 2 Sportfishing Regulations .................................................................................................. 2 SPECIES CATCH AND HARVEST INFORMATION ........................................................ 2 CREEL SURVEY RESULTS AND DISCUSSION .............................................................. 3 Survey Logistics ............................................................................................................... 3 General Angler Information ............................................................................................. 3 SPECIES INFORMATION ................................................................................................... 3 ACKNOWLEDGMENTS ..................................................................................................... 4 SUMMARY TABLES Table 1. Sportfishing effort summary .................................................................................... 5 Table 2. Creel survey synopsis ............................................................................................... 6 SPECIES CATCH AND HARVEST INFORMATION Gamefish Figure 1. Walleye ............................................................................................................. 7 Figure 2. Northern Pike .................................................................................................... 8 Figure 3. Muskellunge ..................................................................................................... 9 Figure 4. Smallmouth Bass .............................................................................................. 10 Figure 5. Largemouth Bass .............................................................................................. 11 Panfish Figure 6. Yellow Perch .................................................................................................... 12 Figure 7. Bluegill ............................................................................................................. 13 Figure 8. Pumpkinseed ..................................................................................................... 14 Figure 9. Rock Bass ......................................................................................................... 15 Figure 10. Black Crappie ................................................................................................. 16 Cover Art: Steve Hilt, Minocqua, WI Fish Graphics: Virgil Beck, Stevens Point, WI
1
INTRODUCTION Fish populations can fluctuate due to natural forces (weather, predation, competition), management actions (stocking, regulations, habitat improvement), inappropriate development (habitat degradation), and harvest impacts. Wisconsin Department of Natural Resources fisheries crews regularly conduct fishery surveys on area lakes and reservoirs to gather the information needed to monitor changes, identify concerns, evaluate past management actions, and to prescribe good fishery management strategies. Netting and electrofishing surveys are used to gather data on the status of fish populations and communities (species composition, population size, reproductive success, size/age distribution, and growth rates). But the other key component of the fishery that we often need to measure is the harvest. On many lakes in the Ceded Territory of northern Wisconsin, harvest of fish is divided between sport anglers and the six Chippewa tribes who harvest fish under rights granted by federal treaties. The tribes harvest fish mostly using a highly efficient method, spearing, during a relatively short time period in the spring. Every fish in the spear harvest is counted – a complete “census” of the harvest. We also measure the sport harvest to assess its impact on the fishery. But because it would be highly impractical and very costly to conduct a complete census of every angler who fishes on a lake, we conduct creel surveys. A creel survey is an assessment tool used to sample the fishing activities of anglers on a body of water and make projections of harvest and other fishery parameters. Creel survey clerks work on randomly-selected
days and shifts, forty hours per week during the open season for gamefish from the first Saturday in May through the first Sunday in March, except during the month of November when fishing effort is low and ice conditions are often unsafe. The survey is run during daylight hours, and shift times change from month to month as day length changes. Creel survey clerks travel their lakes using a boat or snowmobile to count numbers of anglers on a lake at predetermined times, and to interview anglers who have completed their fishing trip to collect data on what species they fished for, catch, harvest, lengths of fish harvested, marks (finclips or tags), and hours of fishing effort. Collecting completed-trip data provides the most accurate assessment of angling activities, and it avoids the need to disturb anglers while they are fishing. A computer program is used to make projections of total catch and harvest of each species, catch and harvest rates, and total fishing effort, by month and for the year in total. Keep in mind that these are only projections based on the best information available, and not a complete accounting of effort, catch, and harvest. Accurate projections require that we sample a sufficient and representative portion of the angling activity on a lake. The accuracy of creel survey results, therefore, depends on good cooperation and truthful responses by anglers when a creel clerk interviews them. You may have encountered a DNR creel survey clerk on a recent fishing trip. We appreciate your cooperation during an interview. The survey only takes a moment of your time and it gives the Department valuable information needed for management of the fishery.
2
This report provides projections of: 1. Overall fishing effort (pressure) 2. Fishing effort directed at each species 3. Catch and harvest rates 4. Numbers of fish caught and harvested Also included are a physical description of Big Saint Germain Lake; discussion of results of the survey; and detailed summaries, by species of fishing effort, catch and harvest. GENERAL LAKE INFORMATION
Location Big Saint Germain Lake is located in Vilas County in the Town of Saint Germain. Physical Characteristics Big Saint Germain Lake is a 1,617 acre drainage lake with a maximum depth of 42 feet. Content and Fawn Lake, which are connected to Big Saint Germain, are not part of the projections in this report. Littoral substrate consists primarily of sand, with some gravel, rock and muck. Big Saint Germain Lake is a moderately fertile lake with alkaline, clear water of moderate transparency. Seasons Surveyed The period referred to in this report as the 2011-12 fishing season ran from May 7, 2011 through March 4, 2012. The open water creel survey ran from May 7 through
October 31, 2011 and the ice fishing creel survey ran from December 1, 2012 through March 4, 2012. Weather Ice-out on Big Saint Germain Lake was around April 27, 2011. Fishable-ice formed on Big Saint Germain Lake in mid December. Sportfishing Regulations The following seasons, daily bag limits, and length limits were in place on Big Saint Germain Lake during the 2011-12 fishing season: Largemouth Bass& 5/7-6/17 Catch&ReleaseSmallmouth Bass 6/18-3/4 5 14"Musky 5/28-11/30 1 34"Northern Pike 5/7-3/4 5 noneWalleye 5/7-3/4 2* 15"Panfish year round 25 noneRock Bass year round none none
* The statewide bag limit was 5
walleye, but due to tribal declarations it was reduced on Big Saint Germain Lake.
SPECIES CATCH AND HARVEST INFORMATION Angling effort, catch, and harvest information is summarized for each species in Table 2 and Figures 1-10. Table 2 also includes a comparison of these statistics with the previous creel survey. Information presented about species whose fishing season extends beyond March 4 should be considered minimum estimates. Each species page has up to five graphs depicting the following: 1. PROJECTED FISHING EFFORT Total calculated number of hours
during each month that anglers spent fishing for a species.
2. PROJECTED SPECIFIC CATCH
Big Saint Germain Lake
3
AND HARVEST RATES Calculated number of hours it takes
an angler to catch or harvest a fish of the indicated species. Only information from anglers who were specifically targeting that species is reported.
3. PROJECTED CATCH AND
HARVEST Calculated number of fish of the
indicated species caught or harvested by all anglers, regardless of targeted species.
4. LENGTH DISTRIBUTION OF
HARVESTED FISH All fish of a species that were
measured by the clerk during the entire creel survey season.
5. LARGEST AND AVERAGE
LENGTH OF HARVESTED FISH Monthly largest and average length
of harvested fish of a species. Only those fish measured by the creel survey clerk are reported.
CREEL SURVEY RESULTS AND DISCUSSION Survey Logistics The creel survey went well. We encountered no unusual problems conducting the survey or calculating the projections contained in the report. This was the second time the department conducted a creel survey on Big Saint Germain Lake. The last creel of Big Saint Germain Lake took place in 1994-95. General Angler Information Anglers spent 71,260 hours or 39.3 hours per acre fishing Big Saint Germain Lake during the 2011-12 season (Table 1). That was more than the Vilas County average of 34.6 hours per acre. July was the most
heavily fished month (12.0 hours per acre). Fishing effort was lightest in December (0.9 hours per acre) for those months when the entire month was creeled. RESULTS BY SPECIES Walleye (Table 2, Figure 1) Walleyes received the most fishing effort during the 2011-12 season. Anglers spent 24,952 hours targeting walleyes. The greatest fishing effort for walleyes was in July (8,498 hours). October had the least amount of walleye fishing effort (318 hours). Total catch of walleyes was 3,506 fish with a harvest of 1,588 fish. Highest catch (1486 fish) and harvest (789 fish) occurred in July. Anglers fished 7.5 hours to catch and 16.2 hours to harvest a walleye during 2011-12. The mean length of harvested walleyes was 19.4 inches and the largest walleye measured was a 28.5 inch fish. Northern Pike (Table 2, Figure 2) Fishing effort directed at northern pike was 8,535 hours during the 2011-12 season. Northern pike fishing effort was greatest in January (2,277 hours). Total catch of northern pike was 3,496 fish with a harvest of 941 fish. The mean length of harvested northern pike was 24.2 inches and the largest northern pike measured was a 33.5 inch fish. Muskellunge (Table 2, Figure 3) Anglers spent 15,320 hours targeting muskellunge during the 2011-12 season. Muskellunge fishing effort was greatest in September (5,372 hours). Total catch of muskellunge was 390 fish. Highest catch (149 fish) occurred in
4
September. Anglers fished 48.5 hours to catch a muskellunge and none were reported harvested during 2011-12. Smallmouth Bass (Table 2, Figure 4) Fishing effort targeted at smallmouth bass was 6,796 hours during the 2011-12 season. Smallmouth bass fishing effort was greatest in July (4,872 hours). Total catch of smallmouth bass was 6,175 fish with 353 harvested. Highest catch (3,386 fish) occurred in July. Anglers fished 2.4 hours to catch a smallmouth bass during 2011-12. Largemouth Bass (Table 2, Figure 5) Fishing effort directed at largemouth bass was 2,044 hours during the 2011-12 season. Largemouth bass fishing effort was greatest in September (1,014 hours). Total catch of largemouth bass was 1,478 fish with a harvest of 44 fish. Highest catch (590 fish) occurred in July. Anglers fished 3.6 hours to catch a largemouth bass during 2011-12. Panfish (Table 2, Figures 6-10) Yellow perch were the most sought after panfish species during the survey. Fishing effort directed at yellow perch was 15,568 hours. Total catch of yellow perch was 33,954 fish with 6,418 harvested. The mean length of yellow perch harvested was 8.4 inches. Black crappies were the second most sought after panfish species during the survey. Fishing effort directed at black crappies was 15,341 hours. Anglers caught 9,696 black crappies and harvested 6,288 fish. The mean length of black crappies harvested was 10.5 inches.
Bluegills were the third sought after panfish species during the survey. Fishing effort directed at bluegills was 12,054 hours. Total catch of bluegills was 34,363 fish with 8,891 harvested. The mean length of bluegills harvested was 7.3 inches. Pumpkinseeds and rock bass were also caught during the 2011-12 season. ACKNOWLEDGMENTS Completion of this survey was possible because of the efforts of the technical staff of the fisheries management and Treaty Fisheries Unit. Treaty staff responsible for ensuring completion of this survey included Jeff Blonski, Joelle Underwood, Marty Kiepke, Jason Halverson, and Tim Tobias. Marty Kiepke and Jeff Blonski were the creel clerks on Big Saint Germain Lake during the survey period. We also thank all the anglers who took the time to offer information about their fishing trip to the survey clerk. Without their cooperation the survey would not have been possible. The department thanks the cooperators, Forest Downs Rec Corporation and Fibbers Restaurant, who generously allowed the department to keep a boat and snowmobile on their property during this survey. This creel report was reviewed by, Steve Gilbert and Dennis Scholl of the Wisconsin Department of Natural Resources, Woodruff, Wisconsin. Additional copies of this report and those covering other local lakes can be obtained from the Woodruff DNR or online at: http://dnr.wi.gov/fish/ceded/reports.html
5
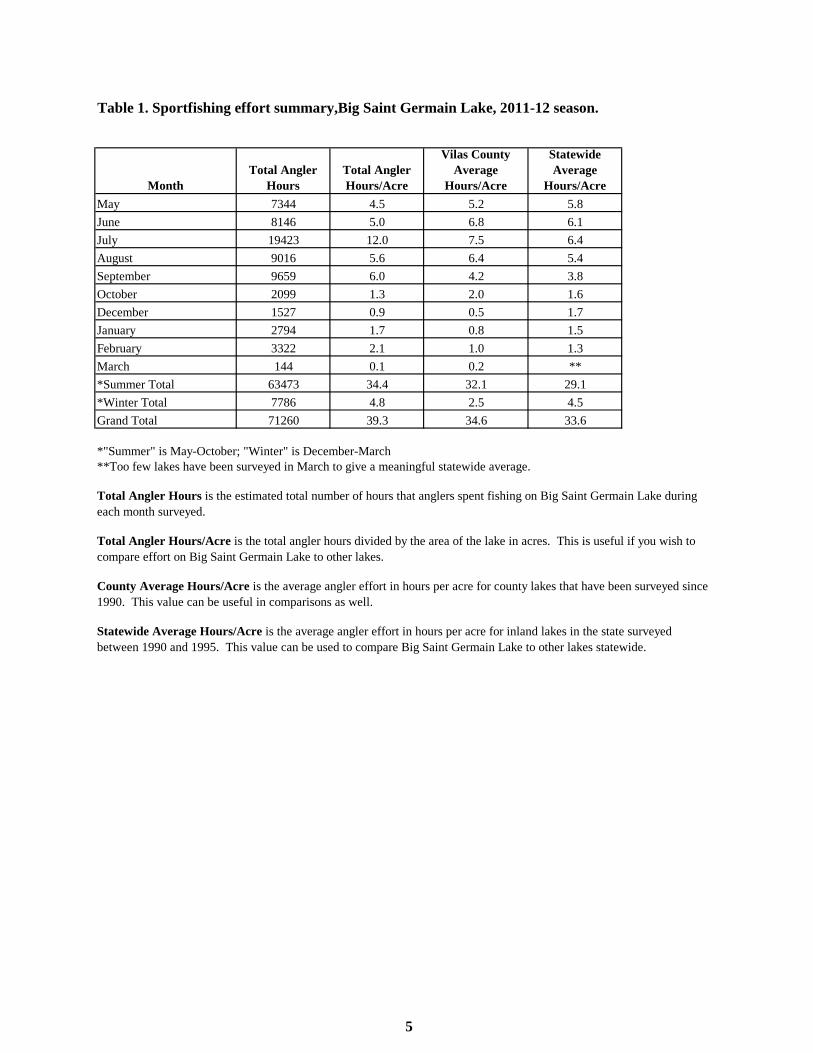
Table 1. Sportfishing effort summary,Big Saint Germain Lake, 2011-12 season.
MonthTotal Angler
HoursTotal Angler Hours/Acre
Vilas County Average
Hours/Acre
Statewide Average
Hours/AcreMay 7344 4.5 5.2 5.8June 8146 5.0 6.8 6.1July 19423 12.0 7.5 6.4August 9016 5.6 6.4 5.4September 9659 6.0 4.2 3.8October 2099 1.3 2.0 1.6December 1527 0.9 0.5 1.7January 2794 1.7 0.8 1.5February 3322 2.1 1.0 1.3March 144 0.1 0.2 ***Summer Total 63473 34.4 32.1 29.1*Winter Total 7786 4.8 2.5 4.5Grand Total 71260 39.3 34.6 33.6
*"Summer" is May-October; "Winter" is December-March**Too few lakes have been surveyed in March to give a meaningful statewide average.
Statewide Average Hours/Acre is the average angler effort in hours per acre for inland lakes in the state surveyed between 1990 and 1995. This value can be used to compare Big Saint Germain Lake to other lakes statewide.
Total Angler Hours is the estimated total number of hours that anglers spent fishing on Big Saint Germain Lake during each month surveyed.
Total Angler Hours/Acre is the total angler hours divided by the area of the lake in acres. This is useful if you wish to compare effort on Big Saint Germain Lake to other lakes.
County Average Hours/Acre is the average angler effort in hours per acre for county lakes that have been surveyed since 1990. This value can be useful in comparisons as well.
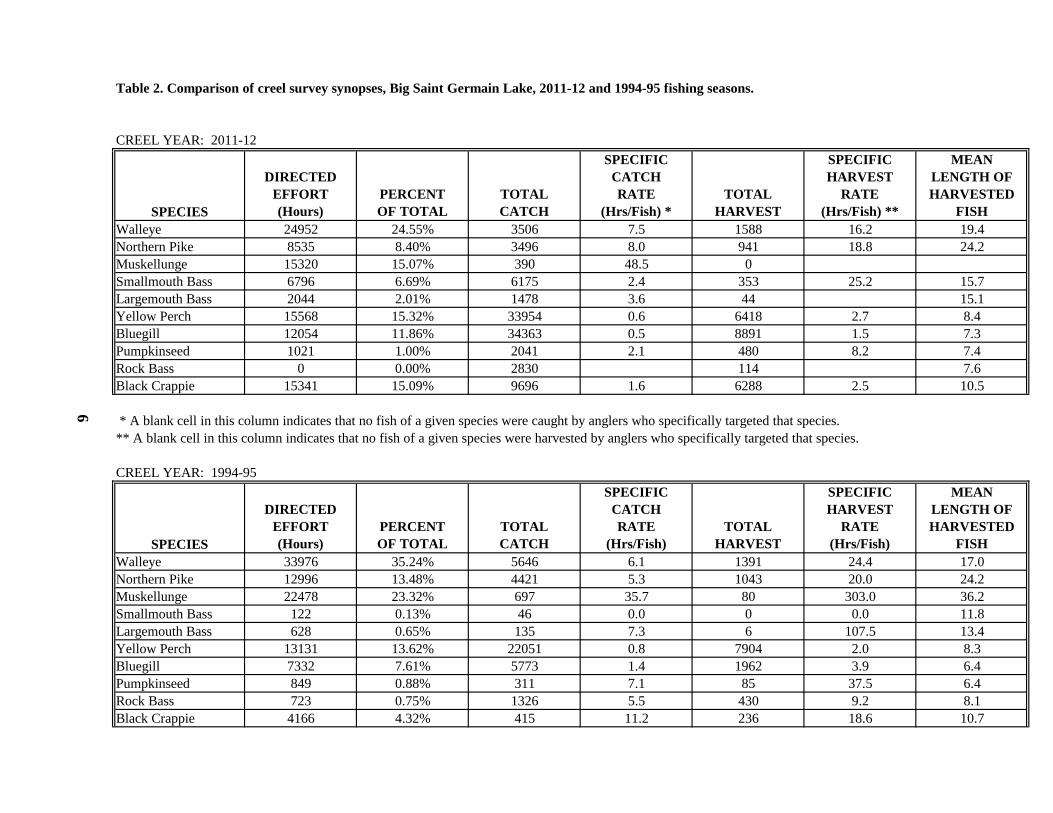
Table 2. Comparison of creel survey synopses, Big Saint Germain Lake, 2011-12 and 1994-95 fishing seasons.
CREEL YEAR: 2011-12
SPECIES
DIRECTEDEFFORT(Hours)
PERCENTOF TOTAL
TOTALCATCH
SPECIFICCATCHRATE
(Hrs/Fish) *TOTAL
HARVEST
SPECIFICHARVEST
RATE(Hrs/Fish) **
MEANLENGTH OFHARVESTED
FISHWalleye 24952 24.55% 3506 7.5 1588 16.2 19.4Northern Pike 8535 8.40% 3496 8.0 941 18.8 24.2Muskellunge 15320 15.07% 390 48.5 0Smallmouth Bass 6796 6.69% 6175 2.4 353 25.2 15.7Largemouth Bass 2044 2.01% 1478 3.6 44 15.1Yellow Perch 15568 15.32% 33954 0.6 6418 2.7 8.4Bluegill 12054 11.86% 34363 0.5 8891 1.5 7.3Pumpkinseed 1021 1.00% 2041 2.1 480 8.2 7.4Rock Bass 0 0.00% 2830 114 7.6Black Crappie 15341 15.09% 9696 1.6 6288 2.5 10.5
6
* A blank cell in this column indicates that no fish of a given species were caught by anglers who specifically targeted that species.** A blank cell in this column indicates that no fish of a given species were harvested by anglers who specifically targeted that species.
CREEL YEAR: 1994-95
SPECIES
DIRECTEDEFFORT(Hours)
PERCENTOF TOTAL
TOTALCATCH
SPECIFICCATCHRATE
(Hrs/Fish)TOTAL
HARVEST
SPECIFICHARVEST
RATE(Hrs/Fish)
MEANLENGTH OFHARVESTED
FISHWalleye 33976 35.24% 5646 6.1 1391 24.4 17.0Northern Pike 12996 13.48% 4421 5.3 1043 20.0 24.2Muskellunge 22478 23.32% 697 35.7 80 303.0 36.2Smallmouth Bass 122 0.13% 46 0.0 0 0.0 11.8Largemouth Bass 628 0.65% 135 7.3 6 107.5 13.4Yellow Perch 13131 13.62% 22051 0.8 7904 2.0 8.3Bluegill 7332 7.61% 5773 1.4 1962 3.9 6.4Pumpkinseed 849 0.88% 311 7.1 85 37.5 6.4Rock Bass 723 0.75% 1326 5.5 430 9.2 8.1Black Crappie 4166 4.32% 415 11.2 236 18.6 10.7
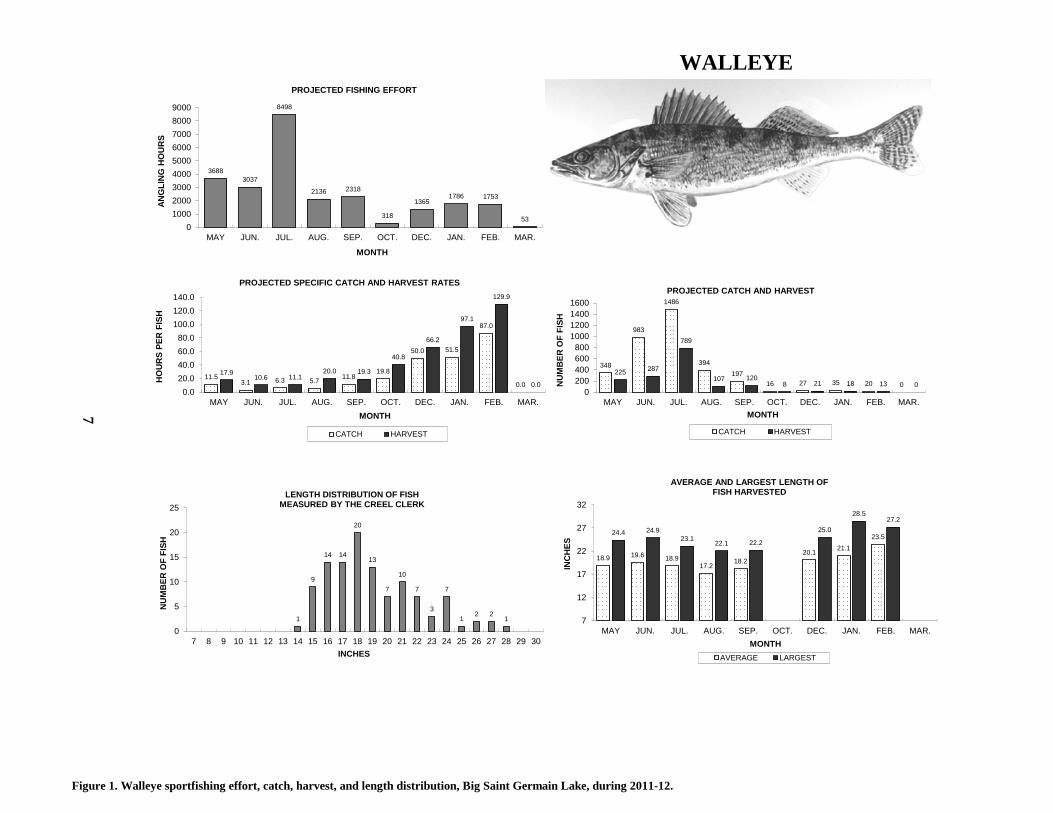
Figure 1. Walleye sportfishing effort, catch, harvest, and length distribution, Big Saint Germain Lake, during 2011-12.
7
11.5 3.1 6.3 5.7 11.8
19.8
50.0 51.5
87.0
0.0
17.9 10.6 11.1
20.0 19.3
40.8
66.2
97.1
129.9
0.0 0.0
20.040.060.080.0
100.0120.0140.0
MAY JUN. JUL. AUG. SEP. OCT. DEC. JAN. FEB. MAR.
HO
UR
S PE
R F
ISH
MONTH
PROJECTED SPECIFIC CATCH AND HARVEST RATES
CATCH HARVEST
348
983
1486
394 197
16 27 35 20 0
225 287
789
107 120 8 21 18 13 0
0200400600800
1000120014001600
MAY JUN. JUL. AUG. SEP. OCT. DEC. JAN. FEB. MAR.
NU
MB
ER O
F FI
SH
MONTH
PROJECTED CATCH AND HARVEST
CATCH HARVEST
1
9
14 14
20
13
7
10
7
3
7
1 2 2
1
0
5
10
15
20
25
7 8 9 10 11 12 13 14 15 16 17 18 19 20 21 22 23 24 25 26 27 28 29 30
NU
MB
ER O
F FI
SH
INCHES
LENGTH DISTRIBUTION OF FISH MEASURED BY THE CREEL CLERK
18.9 19.6 18.9 17.2
18.2 20.1 21.1
23.5 24.4 24.9 23.1
22.1 22.2
25.0
28.5 27.2
7
12
17
22
27
32
MAY JUN. JUL. AUG. SEP. OCT. DEC. JAN. FEB. MAR.
INC
HES
MONTH
AVERAGE AND LARGEST LENGTH OF FISH HARVESTED
AVERAGE LARGEST
3688 3037
8498
2136 2318
318
1365 1786 1753
53 0
100020003000400050006000700080009000
MAY JUN. JUL. AUG. SEP. OCT. DEC. JAN. FEB. MAR.
ANG
LIN
G H
OU
RS
MONTH
PROJECTED FISHING EFFORT
WALLEYE
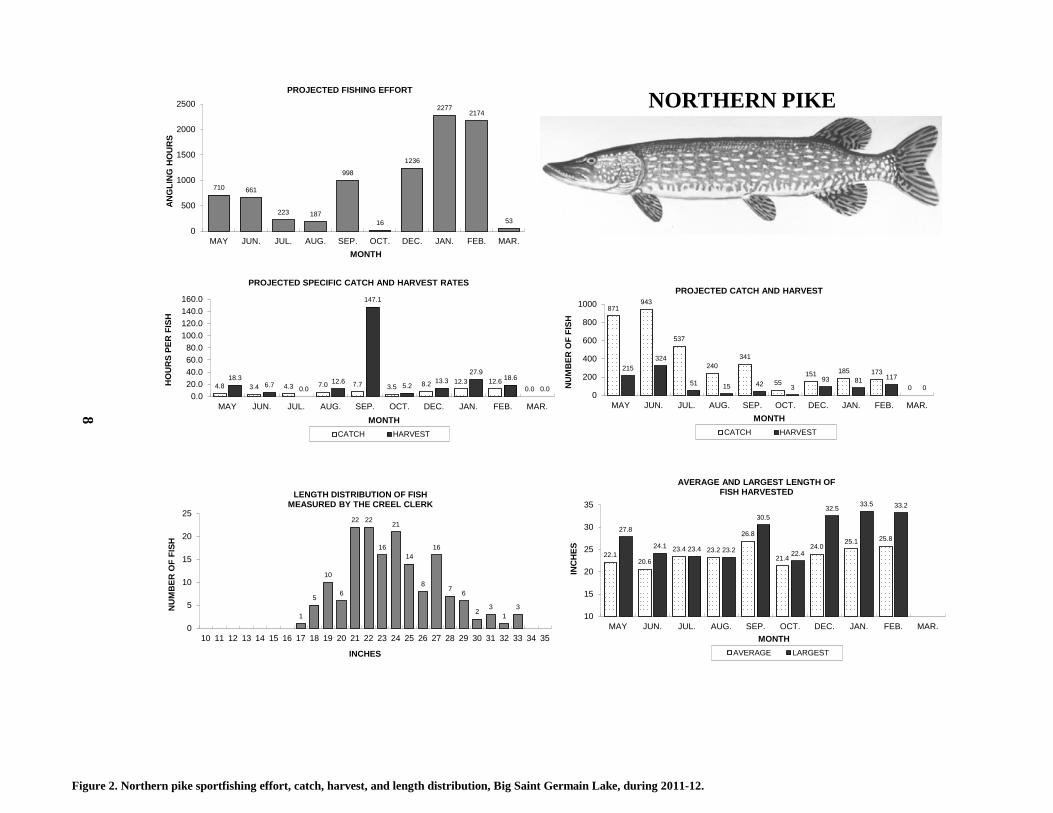
Figure 2. Northern pike sportfishing effort, catch, harvest, and length distribution, Big Saint Germain Lake, during 2011-12.
8
4.8 3.4 4.3 7.0 7.7 3.5 8.2 12.3 12.6 0.0
18.3 6.7 0.0
12.6
147.1
5.2 13.3
27.9 18.6
0.0 0.0
20.040.060.080.0
100.0120.0140.0160.0
MAY JUN. JUL. AUG. SEP. OCT. DEC. JAN. FEB. MAR.
HO
UR
S PE
R F
ISH
MONTH
PROJECTED SPECIFIC CATCH AND HARVEST RATES
CATCH HARVEST
871 943
537
240 341
55 151 185 173
0
215 324
51 15 42 3 93 81 117
0 0
200
400
600
800
1000
MAY JUN. JUL. AUG. SEP. OCT. DEC. JAN. FEB. MAR.
NU
MB
ER O
F FI
SH
MONTH
PROJECTED CATCH AND HARVEST
CATCH HARVEST
1
5
10
6
22 22
16
21
14
8
16
7 6
2 3
1 3
0
5
10
15
20
25
10 11 12 13 14 15 16 17 18 19 20 21 22 23 24 25 26 27 28 29 30 31 32 33 34 35
NU
MB
ER O
F FI
SH
INCHES
LENGTH DISTRIBUTION OF FISH MEASURED BY THE CREEL CLERK
22.1 20.6
23.4 23.2
26.8
21.4
24.0 25.1 25.8
27.8
24.1 23.4 23.2
30.5
22.4
32.5 33.5 33.2
10
15
20
25
30
35
MAY JUN. JUL. AUG. SEP. OCT. DEC. JAN. FEB. MAR.
INC
HES
MONTH
AVERAGE AND LARGEST LENGTH OF FISH HARVESTED
AVERAGE LARGEST
710 661
223 187
998
16
1236
2277 2174
53 0
500
1000
1500
2000
2500
MAY JUN. JUL. AUG. SEP. OCT. DEC. JAN. FEB. MAR.
ANG
LIN
G H
OU
RS
MONTH
PROJECTED FISHING EFFORT NORTHERN PIKE
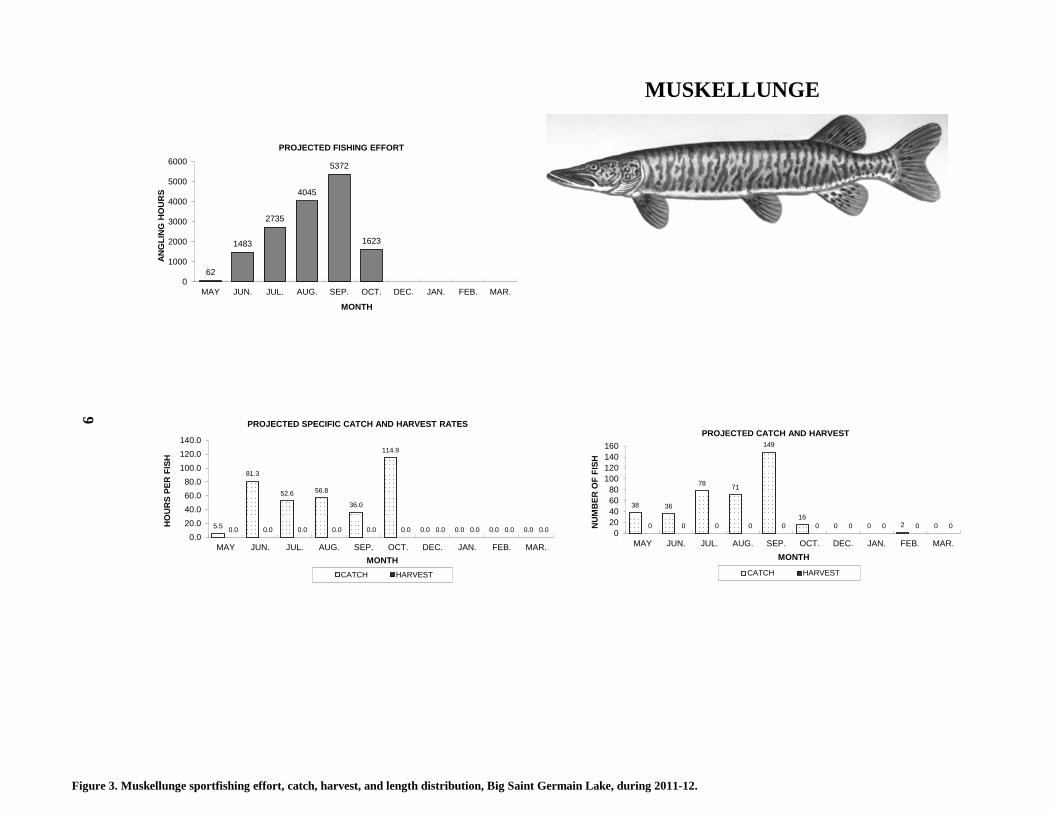
Figure 3. Muskellunge sportfishing effort, catch, harvest, and length distribution, Big Saint Germain Lake, during 2011-12.
9
5.5
81.3
52.6 56.8
36.0
114.9
0.0 0.0 0.0 0.0 0.0 0.0 0.0 0.0 0.0 0.0 0.0 0.0 0.0 0.0 0.0
20.040.060.080.0
100.0120.0140.0
MAY JUN. JUL. AUG. SEP. OCT. DEC. JAN. FEB. MAR.
HO
UR
S PE
R F
ISH
MONTH
PROJECTED SPECIFIC CATCH AND HARVEST RATES
CATCH HARVEST
38 36
78 71
149
16 0 0 2 0 0 0 0 0 0 0 0 0 0 0
020406080
100120140160
MAY JUN. JUL. AUG. SEP. OCT. DEC. JAN. FEB. MAR.
NU
MB
ER O
F FI
SH
MONTH
PROJECTED CATCH AND HARVEST
CATCH HARVEST
62
1483
2735
4045
5372
1623
0
1000
2000
3000
4000
5000
6000
MAY JUN. JUL. AUG. SEP. OCT. DEC. JAN. FEB. MAR.
ANG
LIN
G H
OU
RS
MONTH
PROJECTED FISHING EFFORT
MUSKELLUNGE
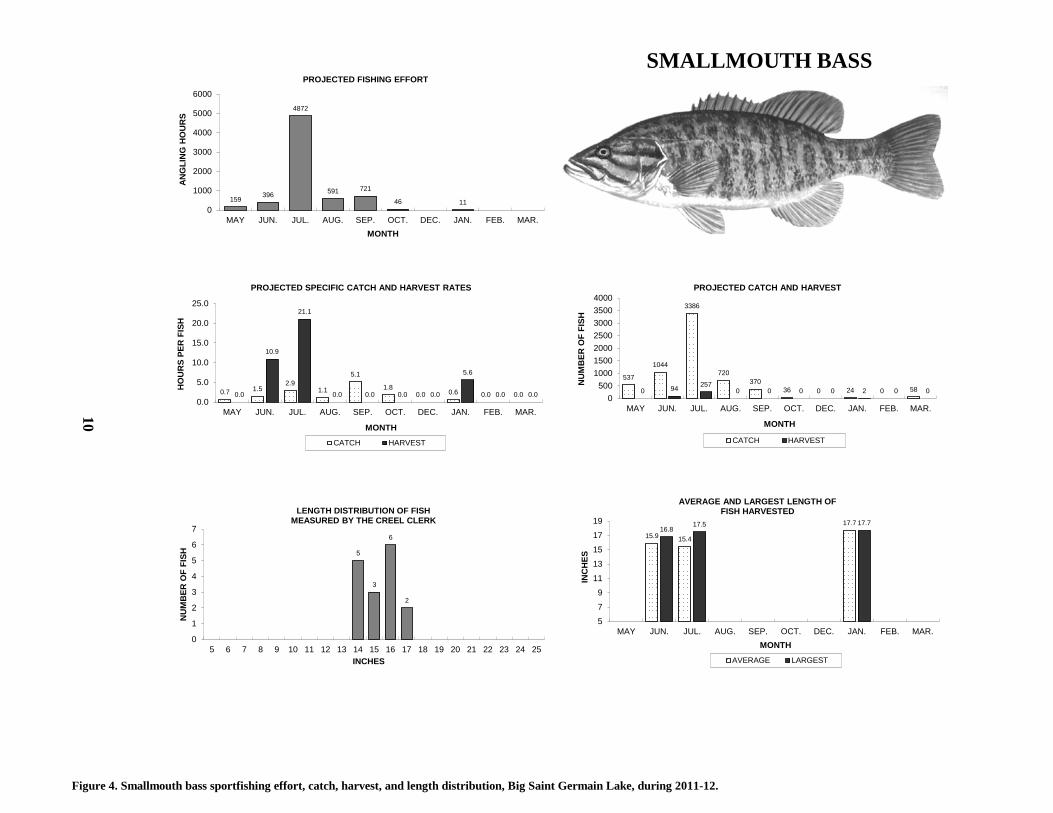
Figure 4. Smallmouth bass sportfishing effort, catch, harvest, and length distribution, Big Saint Germain Lake, during 2011-12.
10
0.7 1.5 2.9
1.1
5.1
1.8 0.0 0.6 0.0 0.0 0.0
10.9
21.1
0.0 0.0 0.0 0.0
5.6
0.0 0.0 0.0
5.0
10.0
15.0
20.0
25.0
MAY JUN. JUL. AUG. SEP. OCT. DEC. JAN. FEB. MAR.
HO
UR
S PE
R F
ISH
MONTH
PROJECTED SPECIFIC CATCH AND HARVEST RATES
CATCH HARVEST
537
1044
3386
720 370
36 0 24 0 58 0 94 257 0 0 0 0 2 0 0
0500
1000150020002500300035004000
MAY JUN. JUL. AUG. SEP. OCT. DEC. JAN. FEB. MAR.
NU
MB
ER O
F FI
SH
MONTH
PROJECTED CATCH AND HARVEST
CATCH HARVEST
5
3
6
2
0
1
2
3
4
5
6
7
5 6 7 8 9 10 11 12 13 14 15 16 17 18 19 20 21 22 23 24 25
NU
MB
ER O
F FI
SH
INCHES
LENGTH DISTRIBUTION OF FISH MEASURED BY THE CREEL CLERK
15.9 15.4
17.7 16.8
17.5 17.7
5
7
9
11
13
15
17
19
MAY JUN. JUL. AUG. SEP. OCT. DEC. JAN. FEB. MAR.
INC
HES
MONTH
AVERAGE AND LARGEST LENGTH OF FISH HARVESTED
AVERAGE LARGEST
159 396
4872
591 721
46 11 0
1000
2000
3000
4000
5000
6000
MAY JUN. JUL. AUG. SEP. OCT. DEC. JAN. FEB. MAR.
ANG
LIN
G H
OU
RS
MONTH
PROJECTED FISHING EFFORT SMALLMOUTH BASS
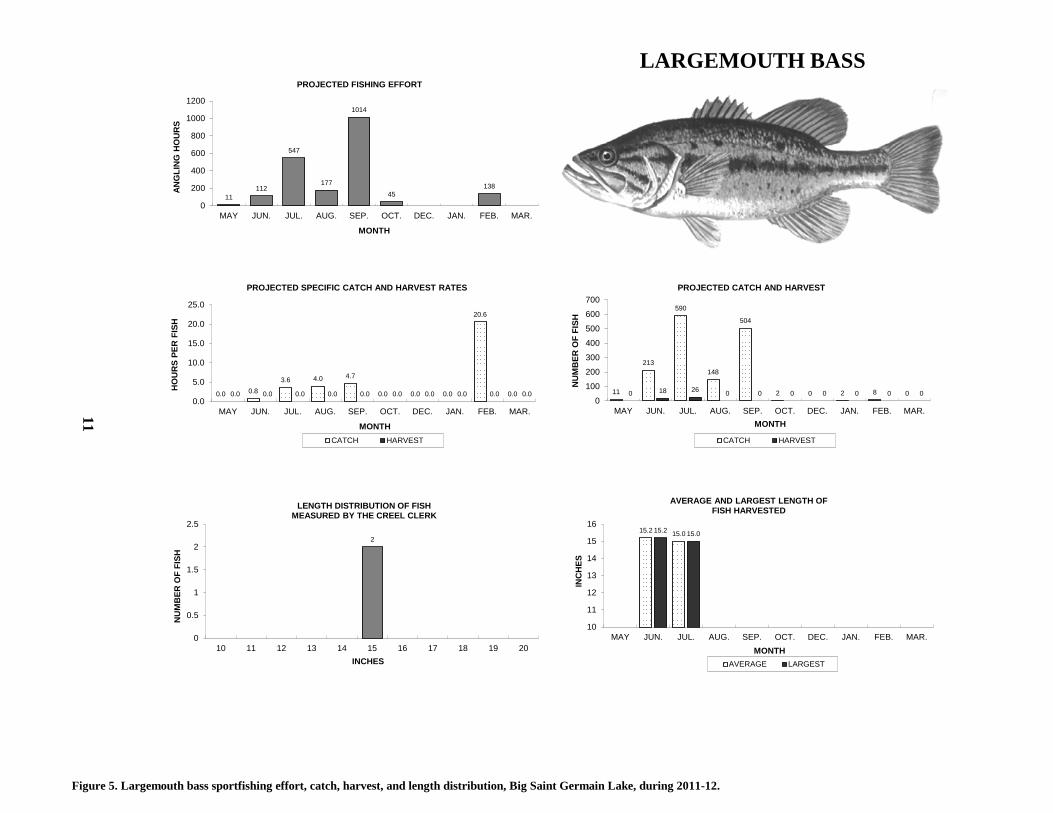
Figure 5. Largemouth bass sportfishing effort, catch, harvest, and length distribution, Big Saint Germain Lake, during 2011-12.
11
0.0 0.8 3.6 4.0 4.7
0.0 0.0 0.0
20.6
0.0 0.0 0.0 0.0 0.0 0.0 0.0 0.0 0.0 0.0 0.0 0.0
5.0
10.0
15.0
20.0
25.0
MAY JUN. JUL. AUG. SEP. OCT. DEC. JAN. FEB. MAR.
HO
UR
S PE
R F
ISH
MONTH
PROJECTED SPECIFIC CATCH AND HARVEST RATES
CATCH HARVEST
11
213
590
148
504
2 0 2 8 0 0 18 26 0 0 0 0 0 0 0 0
100
200
300
400
500
600
700
MAY JUN. JUL. AUG. SEP. OCT. DEC. JAN. FEB. MAR.
NU
MB
ER O
F FI
SH
MONTH
PROJECTED CATCH AND HARVEST
CATCH HARVEST
2
0
0.5
1
1.5
2
2.5
10 11 12 13 14 15 16 17 18 19 20
NU
MB
ER O
F FI
SH
INCHES
LENGTH DISTRIBUTION OF FISH MEASURED BY THE CREEL CLERK
15.2 15.0 15.2 15.0
10
11
12
13
14
15
16
MAY JUN. JUL. AUG. SEP. OCT. DEC. JAN. FEB. MAR.
INC
HES
MONTH
AVERAGE AND LARGEST LENGTH OF FISH HARVESTED
AVERAGE LARGEST
11 112
547
177
1014
45 138
0
200
400
600
800
1000
1200
MAY JUN. JUL. AUG. SEP. OCT. DEC. JAN. FEB. MAR.
ANG
LIN
G H
OU
RS
MONTH
PROJECTED FISHING EFFORT
LARGEMOUTH BASS
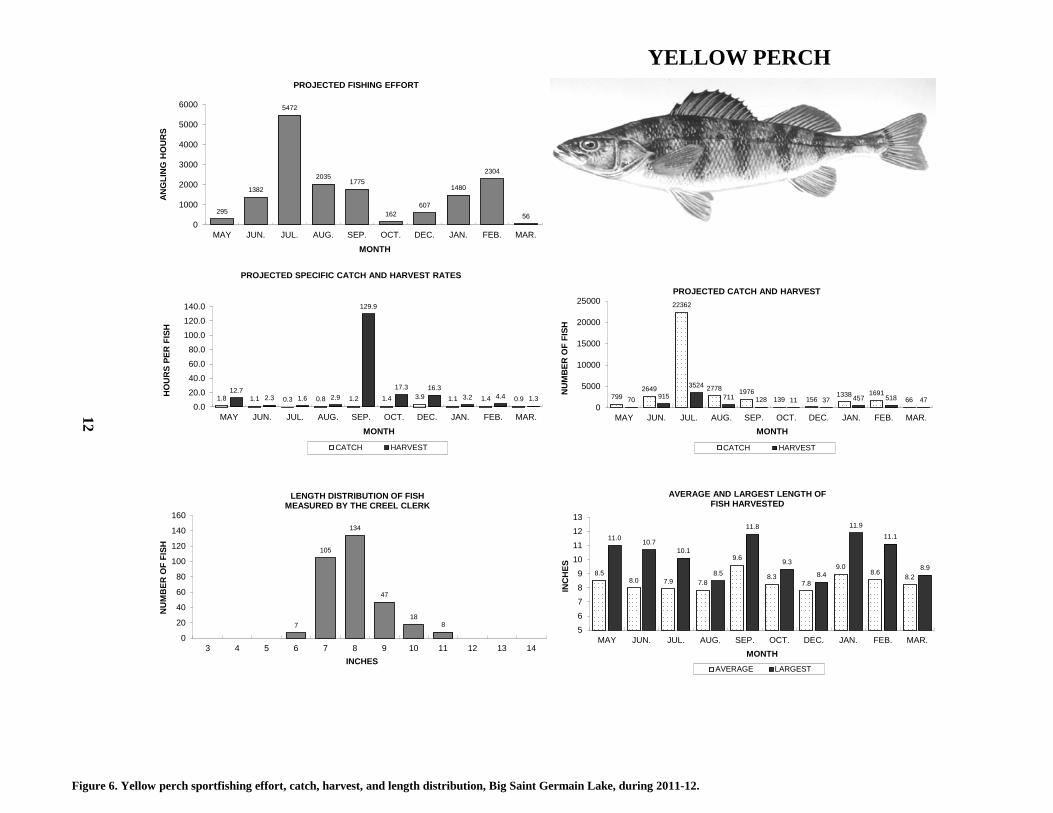
Figure 6. Yellow perch sportfishing effort, catch, harvest, and length distribution, Big Saint Germain Lake, during 2011-12.
12
1.8 1.1 0.3 0.8 1.2 1.4 3.9 1.1 1.4 0.9 12.7
2.3 1.6 2.9
129.9
17.3 16.3 3.2 4.4 1.3
0.0
20.0
40.0
60.0
80.0
100.0
120.0
140.0
MAY JUN. JUL. AUG. SEP. OCT. DEC. JAN. FEB. MAR.
HO
UR
S PE
R F
ISH
MONTH
PROJECTED SPECIFIC CATCH AND HARVEST RATES
CATCH HARVEST
799 2649
22362
2778 1976 139 156
1338 1691 66 70 915
3524
711 128 11 37 457 518 47 0
5000
10000
15000
20000
25000
MAY JUN. JUL. AUG. SEP. OCT. DEC. JAN. FEB. MAR.
NU
MB
ER O
F FI
SH
MONTH
PROJECTED CATCH AND HARVEST
CATCH HARVEST
7
105
134
47
18 8
0
20
40
60
80
100
120
140
160
3 4 5 6 7 8 9 10 11 12 13 14
NU
MB
ER O
F FI
SH
INCHES
LENGTH DISTRIBUTION OF FISH MEASURED BY THE CREEL CLERK
8.5 8.0 7.9 7.8
9.6
8.3 7.8
9.0 8.6
8.2
11.0 10.7 10.1
8.5
11.8
9.3
8.4
11.9 11.1
8.9
56789
10111213
MAY JUN. JUL. AUG. SEP. OCT. DEC. JAN. FEB. MAR.
INC
HES
MONTH
AVERAGE AND LARGEST LENGTH OF FISH HARVESTED
AVERAGE LARGEST
295
1382
5472
2035 1775
162 607
1480
2304
56 0
1000
2000
3000
4000
5000
6000
MAY JUN. JUL. AUG. SEP. OCT. DEC. JAN. FEB. MAR.
ANG
LIN
G H
OU
RS
MONTH
PROJECTED FISHING EFFORT
YELLOW PERCH
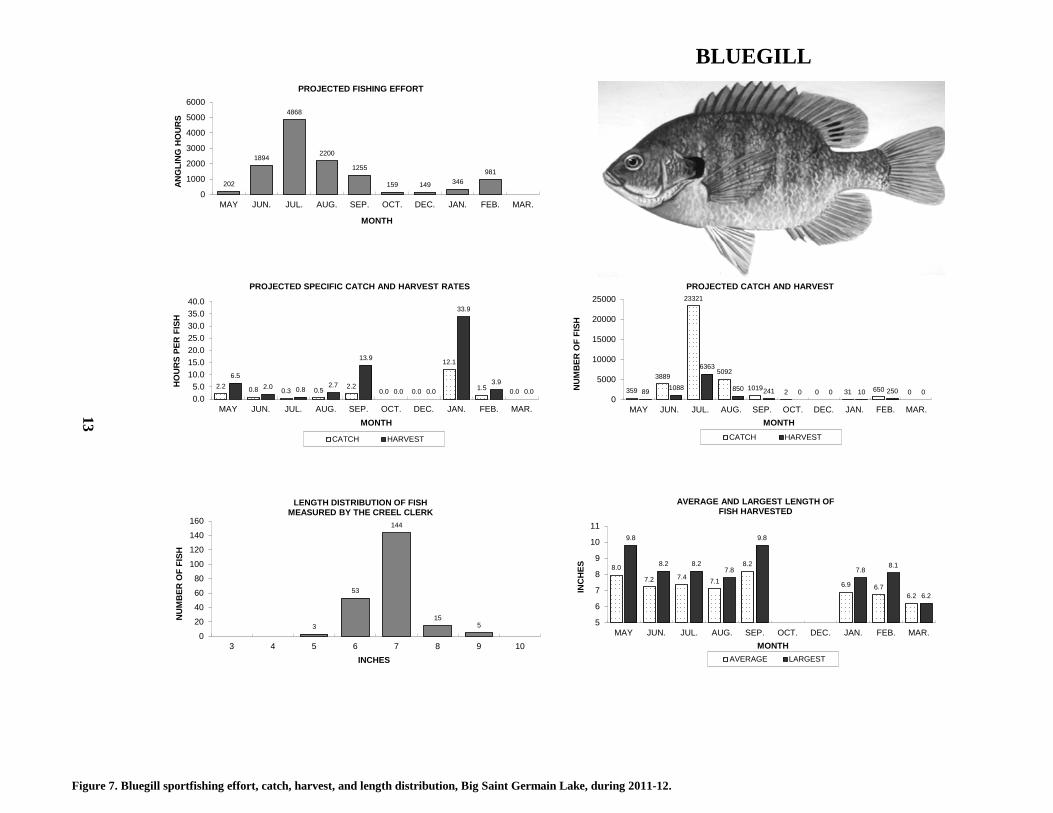
Figure 7. Bluegill sportfishing effort, catch, harvest, and length distribution, Big Saint Germain Lake, during 2011-12.
13
2.2 0.8 0.3 0.5 2.2 0.0 0.0
12.1
1.5 0.0
6.5 2.0 0.8 2.7
13.9
0.0 0.0
33.9
3.9 0.0
0.05.0
10.015.020.025.030.035.040.0
MAY JUN. JUL. AUG. SEP. OCT. DEC. JAN. FEB. MAR.
HO
UR
S PE
R F
ISH
MONTH
PROJECTED SPECIFIC CATCH AND HARVEST RATES
CATCH HARVEST
359
3889
23321
5092
1019 2 0 31 650 0 89 1088
6363
850 241 0 0 10 250 0 0
5000
10000
15000
20000
25000
MAY JUN. JUL. AUG. SEP. OCT. DEC. JAN. FEB. MAR.
NU
MB
ER O
F FI
SH
MONTH
PROJECTED CATCH AND HARVEST
CATCH HARVEST
3
53
144
15 5
0
20
40
60
80
100
120
140
160
3 4 5 6 7 8 9 10
NU
MB
ER O
F FI
SH
INCHES
LENGTH DISTRIBUTION OF FISH MEASURED BY THE CREEL CLERK
8.0
7.2 7.4 7.1
8.2
6.9 6.7 6.2
9.8
8.2 8.2 7.8
9.8
7.8 8.1
6.2
5
6
7
8
9
10
11
MAY JUN. JUL. AUG. SEP. OCT. DEC. JAN. FEB. MAR.
INC
HES
MONTH
AVERAGE AND LARGEST LENGTH OF FISH HARVESTED
AVERAGE LARGEST
202
1894
4868
2200
1255
159 149 346 981
0
1000
2000
3000
4000
5000
6000
MAY JUN. JUL. AUG. SEP. OCT. DEC. JAN. FEB. MAR.
ANG
LIN
G H
OU
RS
MONTH
PROJECTED FISHING EFFORT
BLUEGILL
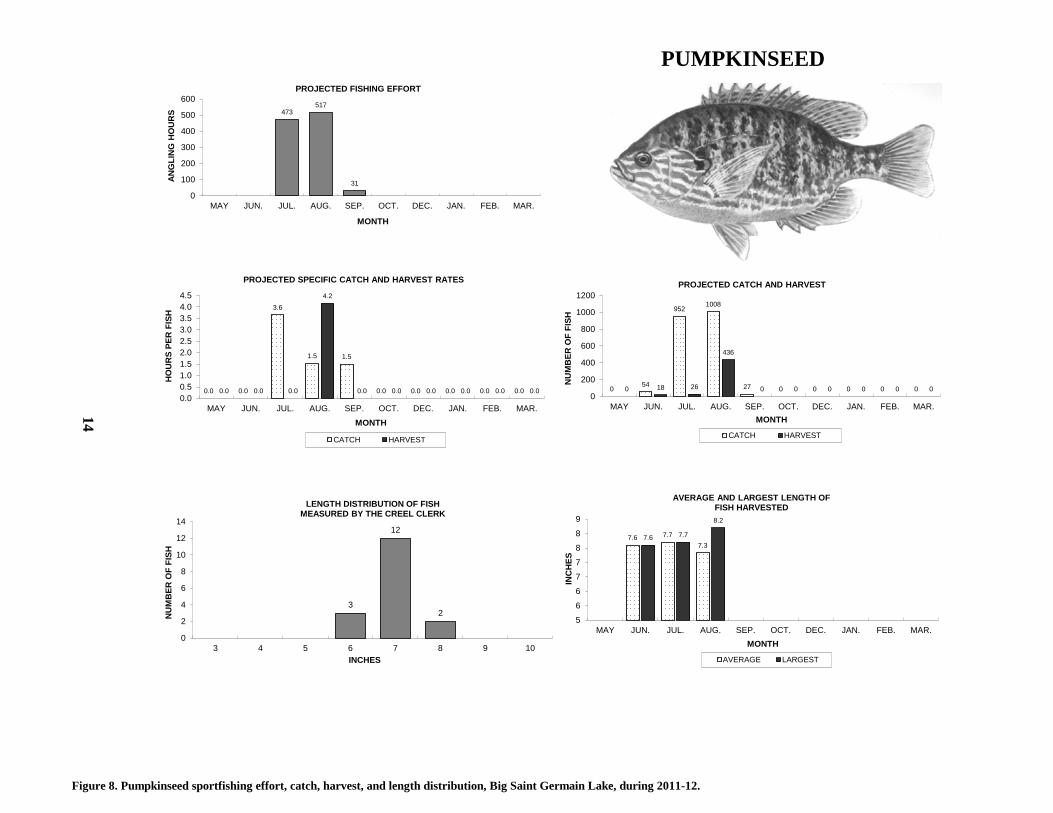
Figure 8. Pumpkinseed sportfishing effort, catch, harvest, and length distribution, Big Saint Germain Lake, during 2011-12.
14
0.0 0.0
3.6
1.5 1.5
0.0 0.0 0.0 0.0 0.0 0.0 0.0 0.0
4.2
0.0 0.0 0.0 0.0 0.0 0.0 0.00.51.01.52.02.53.03.54.04.5
MAY JUN. JUL. AUG. SEP. OCT. DEC. JAN. FEB. MAR.
HO
UR
S PE
R F
ISH
MONTH
PROJECTED SPECIFIC CATCH AND HARVEST RATES
CATCH HARVEST
0 54
952 1008
27 0 0 0 0 0 0 18 26
436
0 0 0 0 0 0 0
200
400
600
800
1000
1200
MAY JUN. JUL. AUG. SEP. OCT. DEC. JAN. FEB. MAR.
NU
MB
ER O
F FI
SH
MONTH
PROJECTED CATCH AND HARVEST
CATCH HARVEST
3
12
2
0
2
4
6
8
10
12
14
3 4 5 6 7 8 9 10
NU
MB
ER O
F FI
SH
INCHES
LENGTH DISTRIBUTION OF FISH MEASURED BY THE CREEL CLERK
7.6 7.7 7.3
7.6 7.7
8.2
5
6
6
7
7
8
8
9
MAY JUN. JUL. AUG. SEP. OCT. DEC. JAN. FEB. MAR.
INC
HES
MONTH
AVERAGE AND LARGEST LENGTH OF FISH HARVESTED
AVERAGE LARGEST
473 517
31
0
100
200
300
400
500
600
MAY JUN. JUL. AUG. SEP. OCT. DEC. JAN. FEB. MAR.
ANG
LIN
G H
OU
RS
MONTH
PROJECTED FISHING EFFORT
PUMPKINSEED
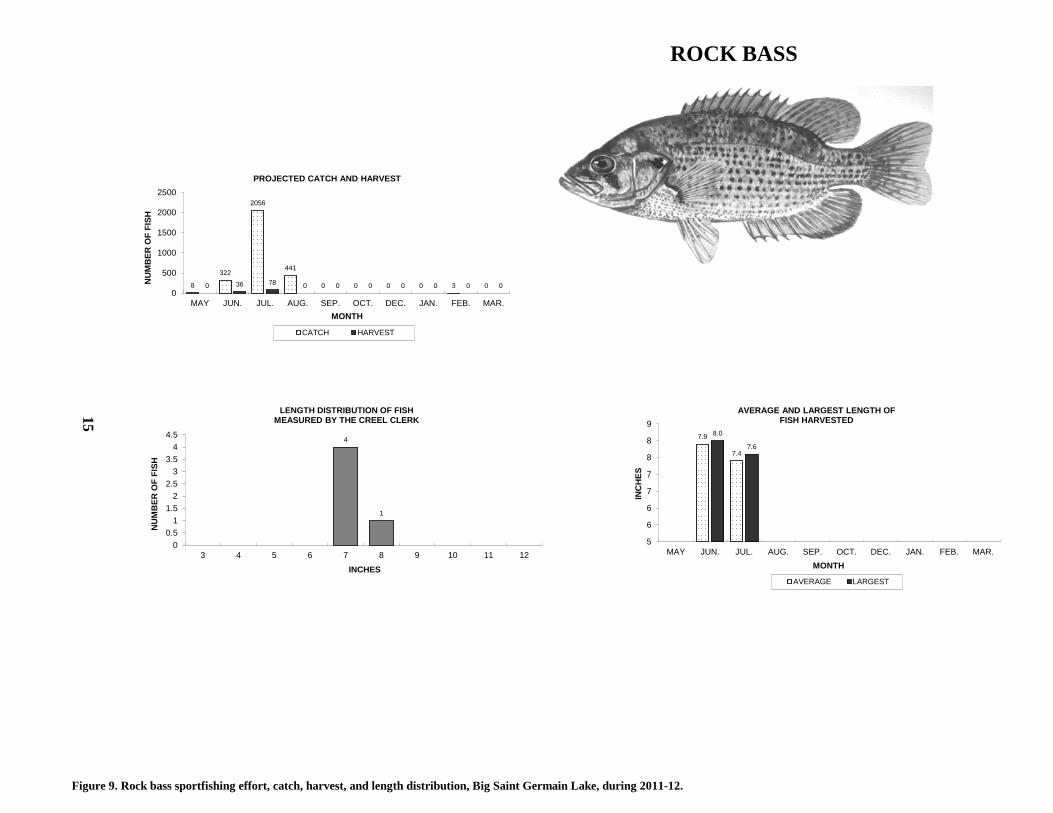
Figure 9. Rock bass sportfishing effort, catch, harvest, and length distribution, Big Saint Germain Lake, during 2011-12.
15
8
322
2056
441
0 0 0 0 3 0 0 36 78 0 0 0 0 0 0 0 0
500
1000
1500
2000
2500
MAY JUN. JUL. AUG. SEP. OCT. DEC. JAN. FEB. MAR.
NU
MB
ER O
F FI
SH
MONTH
PROJECTED CATCH AND HARVEST
CATCH HARVEST
4
1
00.5
11.5
22.5
33.5
44.5
3 4 5 6 7 8 9 10 11 12
NU
MB
ER O
F FI
SH
INCHES
LENGTH DISTRIBUTION OF FISH MEASURED BY THE CREEL CLERK
7.9
7.4
8.0
7.6
5
6
6
7
7
8
8
9
MAY JUN. JUL. AUG. SEP. OCT. DEC. JAN. FEB. MAR.
INC
HES
MONTH
AVERAGE AND LARGEST LENGTH OF FISH HARVESTED
AVERAGE LARGEST
ROCK BASS
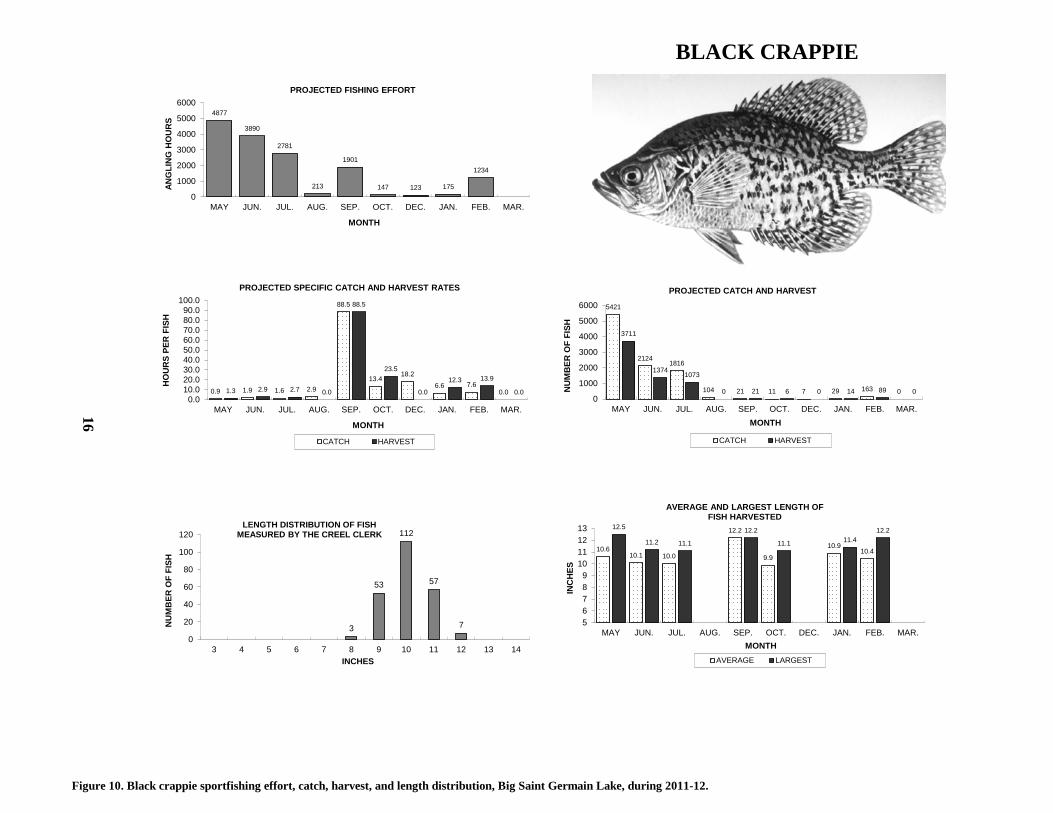
Figure 10. Black crappie sportfishing effort, catch, harvest, and length distribution, Big Saint Germain Lake, during 2011-12.
16
0.9 1.9 1.6 2.9
88.5
13.4 18.2
6.6 7.6 0.0 1.3 2.9 2.7 0.0
88.5
23.5
0.0
12.3 13.9
0.0 0.0
10.020.030.040.050.060.070.080.090.0
100.0
MAY JUN. JUL. AUG. SEP. OCT. DEC. JAN. FEB. MAR.
HO
UR
S PE
R F
ISH
MONTH
PROJECTED SPECIFIC CATCH AND HARVEST RATES
CATCH HARVEST
5421
2124 1816
104 21 11 7 29 163 0
3711
1374 1073
0 21 6 0 14 89 0 0
1000
2000
3000
4000
5000
6000
MAY JUN. JUL. AUG. SEP. OCT. DEC. JAN. FEB. MAR.
NU
MB
ER O
F FI
SH
MONTH
PROJECTED CATCH AND HARVEST
CATCH HARVEST
3
53
112
57
7
0
20
40
60
80
100
120
3 4 5 6 7 8 9 10 11 12 13 14
NU
MB
ER O
F FI
SH
INCHES
LENGTH DISTRIBUTION OF FISH MEASURED BY THE CREEL CLERK
10.6 10.1 10.0
12.2
9.9
10.9 10.4
12.5
11.2 11.1
12.2
11.1 11.4 12.2
56789
10111213
MAY JUN. JUL. AUG. SEP. OCT. DEC. JAN. FEB. MAR.
INC
HES
MONTH
AVERAGE AND LARGEST LENGTH OF FISH HARVESTED
AVERAGE LARGEST
4877
3890
2781
213
1901
147 123 175
1234
0
1000
2000
3000
4000
5000
6000
MAY JUN. JUL. AUG. SEP. OCT. DEC. JAN. FEB. MAR.
ANG
LIN
G H
OU
RS
MONTH
PROJECTED FISHING EFFORT
BLACK CRAPPIE