Big risks require big data thinking...4 Big risks require big data thinking Global Forensic Data...
36
Big risks require big data thinking Global Forensic Data Analytics Survey 2014
Transcript of Big risks require big data thinking...4 Big risks require big data thinking Global Forensic Data...

Big risks require big data thinkingGlobal Forensic Data Analytics Survey 2014

Big risks require big data thinkingGlobal Forensic Data Analytics Survey 2014
Contents
Foreword 1
Executive summary 2
Big risks require big data thinking 5
Why use FDA: key benefits and adoption 11
Technology: the right tools for the right job 16
Missed opportunities: turning data into information 19
Leverage analytics, mitigate risks 26
Secure the buy-in, execute the build 29
Survey approach 31
Contact information 32

1
Big risks require big data thinkingGlobal Forensic Data Analytics Survey 2014
For business executives in multiple functions, across many industries and geographies, “big data” presents tremendous opportunities. For those charged with deterring, detecting and investigating misconduct, mining such data can be a particularly powerful tool to be utilized in their overall compliance and anti-fraud efforts.
With companies increasingly seeking growth in markets with higher perceived levels of fraud, bribery and corruption risk, all while regulators and law enforcement bodies intensify their cross-border collaboration, the costs associated with noncompliance are growing. Out-of-date risk assessments, undetected frauds and poorly executed investigations, followed by failure to properly remediate internal controls, only exacerbate the risks facing companies.
So how are companies leveraging forensic data analytics (FDA) to mine big data? And what do we mean when we use these terms?
For the purpose of this survey, we have adopted Gartner Research’s definition: “big data is high-volume, high-velocity and high-variety information assets that demand cost-effective, innovative forms of information processing for enhanced insight and decision making.”1 The staggering increase in volume, variety and velocity of business information has changed how leading companies manage their compliance challenges and investigate aberrational behavior.
And with respect to FDA, we use the term in this document to refer to the ability to collect and use data both structured (e.g., general ledger or transaction data) and unstructured (e.g., email communications or free-text fields in databases) to identify potentially improper payments, patterns of behavior and trends. FDA can also include integrating continuous monitoring tools, analyzing data in real-, or near-real, time and enable rapid response to prevent suspicious or fraudulent transactions.
As we know from our experience working with leading companies, deploying advanced FDA tools across large data sets provides new insights, leading to more focused investigations, better root cause analysis, and contributing, in a virtuous cycle, to more effective fraud risk management. And of course such tools can be deployed against a wider variety of risks, including competitive practices, insider trading or tax controversies. For our purposes here, however, we shall focus on fraud, bribery and corruption as the risks we find most often discussed by management and boards.
So in an effort to understand how companies in 11 major markets are deploying FDA tools, EY’s Fraud Investigation & Dispute Services (FIDS) practice undertook its first-ever Global Forensic Data Analytics Survey. From November 2013 through January 2014, more than 450 executives were interviewed for this survey.
Foreword
1 Gartner IT Dictionary: http://www.gartner.com/it-glossary/?s=big+data as of 22 February 2014.
The staggering increase in volume, variety and velocity of business information has changed how leading companies manage their compliance challenges and investigate aberrational behavior.
As the report details, our findings suggest that while companies
may be doing some forms of FDA, many are missing important
opportunities to leverage more sophisticated tools. Advanced
technologies that incorporate data visualization, statistical
analysis and text mining concepts — as opposed to spreadsheets
or relational database tools — can be applied to massive data sets
from disparate sources. This, therefore, enables companies to
ask new compliance questions of their data that they had not been
previously able to ask. Establishing important trends in business
conduct, or identifying suspect transactions among millions of
records, is made possible. Senior executives and board members,
many of whom are already benefiting from existing, less
sophisticated FDA efforts, should be interested in the survey
results and case studies contained in this report.
We hope that this survey contributes to meaningful conversations
within your organization, particularly within the finance, internal
audit, compliance and legal functions. Finally, we would like to
thank all of the respondents and business leaders for their
contributions, observations and insights.
Sincerely,
David Stulb
Global Leader
Fraud Investigation & Dispute Services
David Remnitz
Global Leader, Forensic Technology & Discovery Services
Fraud Investigation & Dispute Services

2
Big risks require big data thinkingGlobal Forensic Data Analytics Survey 2014
Big risks require big data thinking
Current regulatory landscape creates further impetus for new approaches in FDAIn today’s regulatory landscape, it is clear that the bar has been raised with respect to regulators’ expectations of what constitutes an effective compliance program. Adopting FDA procedures into the monitoring and testing of compliance can create a cycle of improved adherence to company policy and improved fraud prevention and detection, while providing additional comfort to key stakeholders.
Our survey finds that 87% of respondents agree that regulatory compliance requirements, including anti-corruption laws and recent enforcement trends, are a factor in the design and use of FDA. Indeed, nearly 50% indicate these regulatory compliance requirements are among the top five factors.
FDA efforts are aligned well with perceived company risk areasThe risk of bribery and corruption is identified as having the highest priority in an FDA program, with 65% of the respondents indicating that it is a concern. Notably, more respondents name it a “major concern” than any other risk category. Fortunately, these risks are also well aligned with the use of analytics, as 74% of respondents indicate that they are using FDA to combat bribery and corruption. Our survey results also indicate FDA alignment with other fraud risk areas, including:
► Asset misappropriation, where FDA is used by 75% of respondents
► Financial statement fraud, where FDA is used by 62% of respondents
► Capital project spend, where FDA is used by 53% of respondents
Big data has big potentialOver the past several years, the term big data has been a major theme of the information technology media and increasingly made its way into compliance, internal audit and fraud risk management-related publications. Indeed, in our survey research, 72% of respondents believe that emerging big data technologies can play a key role in fraud prevention and detection. Yet only 7% of respondents are aware of any specific big data technologies, and only 2% of respondents are actually using them. For those survey respondents integrating more advanced FDA technologies, including big data processing capabilities, data visualization, statistical analysis or text mining, we see notable differences in FDA results and recoveries, among other observations.
Why use FDA: key benefits and adoption
FDA enhances the risk assessment process and improves fraud detectionWe asked survey participants about the main benefits of FDA. The top benefits according to our respondents are the ability to “enhance our risk assessment process” (90%) and the ability to “detect potential misconduct that we couldn’t detect before” (89%). The vast majority of respondents also note the following benefits:
► Better comparison of data for improved fraud risk decision making (82%)
► Enhanced audit planning or investigative fieldwork (82%)
► Earlier detection of misconduct (82%)
Executive summary
Big data has big potential
Primary benefit
Believe FDA enhances risk assessment process
90%
72%Believe big data
can play a key role
in fraud prevention
and detection
7%Are aware of
any specific big
data technologies
2%Are actually
using them

3
Big risks require big data thinkingGlobal Forensic Data Analytics Survey 2014
Where is FDA deployed? FDA benefits a wide range of stakeholders within the organization. The vast majority of respondents indicate that the primary users or beneficiaries of FDA include executive management (81%) and boards (68%). Internal audit is the top user or beneficiary at 84%.
Our research finds that no one functional department clearly owns the FDA program. Overall responsibility for the program lies either with corporate executive management with 32% of respondents or legal and compliance with 31% of respondents. In third place comes internal audit functions (22%). After these top three, there is a notable drop with finance (6%), investigations (5%) and other (4%) comprising the remaining responses.
According to our research, companies are generally optimistic that FDA budgets will increase, particularly for those working in countries where regulatory enforcement is high.
Technology: the right tools for the right jobWhile spreadsheet and database applications are components of the overall FDA toolset, companies dealing with increasing data volumes, velocities and varieties of data require more sophisticated technologies. However, our survey research suggests that advanced FDA technologies are not being utilized by the vast majority of companies. Only:
► 26% of respondents utilize forensic analytics software
► 12% utilize visualization and reporting applications
► 11% utilize statistical analysis software
► 2% utilize big data technologies such as Hadoop
Missed opportunities: turning data into information
Lack of awareness and expertiseWhile 69% of respondents suggest that their current anti-fraud and anti-bribery programs are effective, there is a notable need for increased anti-fraud/anti-bribery procedures, which include FDA, as well as a need for increased management awareness of the benefits of FDA. Our research shows that:
► 63% of respondents agree that they need to do more to improve their anti-fraud/anti-bribery procedures, including the use of FDA
► 62% of respondents indicate that they need to improve management’s awareness of the benefits of FDA in general, and of proactive transaction monitoring in particular
The biggest FDA challengesOur respondents indicate that the single biggest challenge in their organization is “getting the right tools or expertise for FDA” (26%). With a wide disbursement of responses, other notable challenges include “analysis process quality improvement” (15%) and “challenges with combining multiple data sources” (15%). Interestingly, cost is a lower factor, with only 10% of respondents indicating that FDA is prohibitively expensive.
“ I think the biggest challenge is to make people conscious of the importance of FDA. Internal policies regarding the scope of its use will need to change.”
Treasury Manager, Brazil
68%List board of directors as top beneficiary
84%List internal audit as top beneficiary

4
Big risks require big data thinkingGlobal Forensic Data Analytics Survey 2014
Data volumes analyzed are relatively smallOur survey finds that 42% of companies with revenues from US$100 million to US$1 billion are working with data sets under 10,000 records. For companies with more than US$1 billion in sales, 71% report working with data sets of one million records or fewer. These data volumes are far from big data, which raises the question that companies may be missing important fraud prevention and detection opportunities by not mining larger data sets to more robustly monitor business activities.
Data sources analyzed are not aligned with technologyOur respondents report an extensive use of unstructured, free-text data sources in FDA, despite the general lack of text mining applications reported in the survey. For example, 47% of respondents who utilize only spreadsheet or database applications in their FDA efforts report analyzing the free-text payment descriptions in the accounts payable fields to identify potentially improper payments. Without the use of more sophisticated text mining technologies, it can be daunting and inefficient to analyze free-text comments among thousands — if not tens of thousands — of records in a spreadsheet. For those companies using more sophisticated FDA tools, we see notable increases in the use of unstructured data, including free-text payment descriptions, email, social media and external data sources.
Right risks, wrong tools?There are notable differences between the FDA technologies that are the most effective and those that are being used. We asked survey participants to name tools that they are aware of in managing fraud and corruption risk. By far the most common answer is “in-house developed tools.” The survey also demonstrates a wide disbursement of the tools in use, with no one FDA tool dominating the market.
Secure the buy-in, execute the build
Technology counts: better tools result in better FDA resultsRespondents who are using FDA technologies beyond spreadsheets and databases have generally observed:
► Improved results and recoveries, 11% more than others
► Earlier detection of misconduct, 15% more than others
► More cost-effective results, 14% more than others
► Higher visibility to the board, 12% more than others
Five success factors for FDA integrationTo build a successful FDA program, companies should consider the following five success factors:
1. Focus on the low-hanging fruit: the priority of the initial project matters
2. Integrate more advanced FDA technologies
3. Communicate early and broadly
4. Sustained FDA success relies on the use of experienced, knowledgeable end-users interpreting the results
5. Enterprise-wide deployment takes time; don’t expect overnight adoption
Work with data sets under 10,000 records
42%
Work with data sets of one million records or fewer
71%
Not such big data!

5
Big risks require big data thinkingGlobal Forensic Data Analytics Survey 2014
Current regulatory landscape creates further impetus for new approaches in FDARecent enforcement actions and settlements, particularly those relating to anti-bribery/anti-corruption (ABAC) legislation such as the US Foreign Corrupt Practices Act (FCPA)2 and, more recently, the UK Bribery Act,3 provide guidance with respect to an effective compliance program. Adopting FDA procedures into the monitoring and testing of compliance can create a cycle of improved adherence to company policy and improved fraud prevention and detection, while providing additional comfort to key stakeholders.
A recent study by the Gibson, Dunn & Crutcher law firm reports that, “The average closing price for a corporate FCPA resolution, inclusive of U.S. Department of Justice (DOJ) and U.S. Securities and Exchange Commission (SEC) fines, penalties, disgorgement and prejudgment interest, was more than US$80 million in 2013.”4 Given these high resolution costs, among other factors, companies today are focusing on evaluating the effectiveness of their compliance and corporate integrity infrastructure. These activities include assessments of their compliance program, organization structure, governance, processes and controls. As depicted in Figure 1, these compliance activities involve an ongoing process of preventing, detecting, investigating and remediating areas of noncompliance. This is where FDA techniques play a key role in increasing effectiveness and accountability.
Figure 1: Compliance monitoring life cycle
Pre
vent Detect
Re
mediate Investig
ate
Big risks require big data thinking
Beyond the FCPA and UK Bribery Act, government interest globally in strengthening anti-corruption legislation and enforcement continues to grow. Some 40 member countries of the Organisation for Economic Co-operation and Development (OECD), including the US, Russia, Brazil, Germany, France and the UK, have adopted the OECD Anti-Bribery Convention. Over the past few years, we have seen a wave of new and more robust local anti-corruption laws being passed, particularly in countries where the perception of corruption risk is high.
2 For guidance on the FCPA, see: “FCPA: A resource guide to the US Foreign Corrupt Practices Act” available via download at: www.sec.gov/spotlight/fcpa/fcpa-resource-guide.pdf.
3 For guidance on the UK Bribery Act, see: “The Bribery Act 2010 Guidance” available via download at www.justice.gov.uk/downloads/legislation/bribery-act-2010-guidance.pdf.
4 For the complete report, download at http://www.gibsondunn.com/publications/Documents/ 2013-Year-End-FCPA-Update.pdf.

6
Big risks require big data thinkingGlobal Forensic Data Analytics Survey 2014
For the purpose of our survey, we define FDA as the ability to collect and use data, both structured and unstructured, to identify areas of potential fraud or corruption — whether it be in the form of potentially improper transactions, noncompliance with laws or company policies, or anomalous patterns or trends in the data.
When it comes to the design and use of FDA in support of corporate compliance programs, our survey respondents indicate a strong linkage between regulatory compliance and the design or use of FDA. Eighty-seven percent of our respondents agree that regulatory compliance requirements, including anti-corruption laws and recent enforcement trends, are a factor in its design and use. Indeed, nearly half of the respondents indicate that these regulatory requirements are among the top five factors they consider in their FDA design and use.
As demonstrated in the case studies and examples of this report, integrating advanced FDA techniques that incorporate big data and other advanced concepts, including high-speed parallel processing, data visualization, statistical analysis and text mining, is emerging as a leading practice in the current regulatory environment. These advanced FDA techniques also consider a broad set of nontraditional data sources, such as third-party watch lists, news media, free-text payment descriptions, email communications (where legally possible) and social media, in order to prioritize and isolate risk areas or rogue conduct.

7
Big risks require big data thinkingGlobal Forensic Data Analytics Survey 2014
FDA efforts are aligned well with perceived company risk areasGiven the current regulatory enforcement trends, it is not surprising that bribery and corruption tops the list of fraud risk concerns (see Figure 2), with strong alignment to FDA (see Figure 3). In addition to aligning FDA with bribery and corruption, we also note that FDA efforts are well aligned with other perceived risks. For example, FDA is most often used for asset misappropriation risks, with respondents indicating its use 75% of the time and 62% for financial statement fraud.
Figure 2. Top fraud risk concerns
Financial statement fraud 26% 17%
16%Mergers and acquisitions 18%
20%Money laundering 12%
Asset misappropriation 24% 36%
Capital projects 23% 26%
Bribery and corruption risk 33% 32%
Of major concern Of some concern
Q: Please tell me to what degree this is of concern to your company? Base: All respondents (466) Multiple answers allowed, may exceed 100%.
Figure 3. Top fraud risk using FDA
Asset misappropriation 75%
Capital projects 53%
Financial statement fraud 62%
Mergers and acquisitions 33%
Money laundering 38%
Bribery and corruption risk 74%
% of companies using FDA to investigate area
Q: In which of these risk areas or types of fraud does your company use FDA when investigating fraud and bribery? Base: All respondents (466) Multiple answers allowed, may exceed 100%.
“ Setting the system to identify high-risk transactions, while minimizing false positives, is our biggest challenge.”
Vice President of Compliance and Privacy, US

8
Big risks require big data thinkingGlobal Forensic Data Analytics Survey 2014
Big data has big potentialAccording to Gartner Research, “big data” is high-volume, high-velocity and high-variety information assets that demand cost-effective, innovative forms of information processing for enhanced insight and decision making.5
IBM suggests that 90% of the world’s data has been generated only in the past two years. Clearly, the data volumes enterprises generate every day impact the effectiveness of how they synthesize and interpret fraud and corruption risks on a timely basis. FDA examples can include real-time analytical processing engines that make rapid business decisions, such as stopping a potentially improper payment or business transaction, or leveraging anti-fraud/anti-corruption monitoring controls that integrate data visualization, statistical analysis and text mining. Spanning beyond traditional databases and spreadsheets, new FDA technologies are available today to keep pace with increasing data volumes, as well as business and regulatory complexities. Further, we see the convergence of social media, email, free-text and other unstructured data sources making their way into traditional accounting analytics that historically rely on only numerical information.
Innovations in FDA incorporate model-based mining and visual analytic tools that allow the data to speak for itself. When deployed over large data sets, they can pinpoint anomalies derived from the multidimensional attributes within the data. Unstructured data sources can also provide a wealth of analytic insight, from evaluating free-text descriptions for suspicious payments, such as “respect payment” or “friend fee,” to email communications indicating risk areas where corrupt intent may be present.
Big data is clearly on the minds of our survey respondents as 72% believe that emerging big data technologies can play a key role in fraud prevention and detection. While the marketing buzz is quite strong around the potential of big data, we found that only 7% of our respondents are aware of any specific big data uses and that only 2% are actually leveraging big data processing capabilities in their FDA programs. The opportunity to provide better compliance insights to management, the board and other stakeholders by mining big data is significant.
As a helpful framework for evaluating companies’ current use of FDA, we developed an FDA maturity model that describes four key quadrants of FDA activity that span both structured data sources, such as transactional data, and unstructured data sources, such as free-text communications. As described on the next page, leading FDA practice incorporates elements of all four quadrants to ensure more effective detection and fewer false positives. This involves integrating statistics-based tools (upper right), unstructured data tools such as keyword search (bottom left), data visualization and text-mining tools (bottom right), and traditional rule-based descriptive queries and analytics (upper left).
5 Gartner IT Dictionary: http://www.gartner.com/it-glossary/?s=big+data as of 19 January 2014.
Case example: Global FCPA review
The setting
A Fortune 100 company conducted an anti-fraud/anti-corruption review in over 15 countries on 5 continents involving thousands of vendors and hundreds of employees.
The big data challenge
► Forensic collection from over 300 custodians globally
► Approximately 2 terabytes of data loaded to review platform comprising over 25 million documents
► 1.3 million documents reviewed by both counsel and forensic accounting professionals
The results
The project team leveraged leading FDA technologies that included data visualization and text mining into their analysis. Incorporating these FDA techniques resulted in improved project efficiencies, particularly with respect to the identification of higher risk vendors, customers and employees. Given the high volumes and varieties of data under review, the use of FDA was critical in meeting the client’s tight deadlines.

9
Big risks require big data thinkingGlobal Forensic Data Analytics Survey 2014
Figure 4. FDA maturity model
Low Detection rate High
High False-positive rate Low
Str
uct
ure
d da
taU
nst
ruct
ure
d da
ta
Matching, grouping, ordering, joining, filtering
“Traditional” rule-based, descriptive queries
and analytics
Keyword search
Traditional keyword searching
Anomaly detection, clustering, risk ranking,
predictive modeling
Statistical analysis
Data visualization, drill down into data, text mining
Data visualization and text mining
Not surprisingly, we find that the majority of the survey respondents primarily focus on the upper-left quadrant, or traditional rule-based, descriptive queries and analytics. When asked what FDA tools are currently in use in their organizations, 65% report the use of spreadsheet tools such as Microsoft Excel and 43% report the use of database tools such as MS Access or MS SQL Server. While these tools are important to every FDA program, they often focus on the matching, grouping, ordering, joining or filtering of data that is primarily descriptive in nature. Meanwhile, there is much lower adoption of more sophisticated FDA tools as depicted in Figure 5 below.
Figure 5: Room for improvement on big data, more sophisticated FDA technologies
Total
Spreadsheet tools such as Microsoft Excel 65%
Database tools such as Microsoft Access or Microsoft SQL Server 43%
Continuous monitoring tools, which may include governance risk and compliance (GRC) tools (SAP, SAI Global, Oracle)
29%
Text analytics tools or keyword searching 26%
Forensic analytics software (ACL, iDEA) 26%
Social media/web monitoring tools 21%
Visualization and reporting tools (Tableau, Spotfire, QlikView) 12%
Statistical analysis and data-mining packages (SPSS, SAS, R, Stata) 11%
Big data technologies (Hadoop, Map Reduce) 2%
Voice searching and analysis (Nexidia, NICE) 2%
Q: From the tools mentioned, which, if any, are you currently using in your organization?Base: All respondents (422). The “I am not aware of any such tools,” “Other” and “None” percentages have been omitted to allow better comparison among the responses given.
For those survey respondents integrating these more advanced FDA technologies, we see notable differences in FDA results and recoveries, including more visibility to the board, faster detection of misconduct and more cost-effective results, all of which will be discussed further in this report.

10
Big risks require big data thinkingGlobal Forensic Data Analytics Survey 2014
Example: analyzing sensitive keywords for potentially improper payments
Payment descriptions, often found in the free-text fields of accounts payable or cash disbursement journals, can be quite powerful when overlaid with payment activity. In the example below, certain keywords, such as “help fee,” “problem resolution” and “facilitation pay” were searched among payments data and linked to payment locations by country. Interpreting the search results for potentially improper payments, the term “problem resolution” was authorized by an employee in Brazil in the amount of approximately US$7,500, while the term “load up fee” was mentioned in the amount of approximately US$4,000 in payments out of China.
EY maintains a library of thousands of these sensitive terms in over two dozen languages. We encourage companies to build similar libraries that also take into consideration industry terms, cultural idioms and company-specific jargon.
Figure 6. Accounts payable visualization of free-text descriptions — identify potentially corrupt payments

11
Big risks require big data thinkingGlobal Forensic Data Analytics Survey 2014
FDA enhances the risk assessment process and improves fraud detection
The top benefits reported from the use of FDA are the ability to “enhance our risk assessment process,” followed by “the ability to detect potential misconduct that we couldn’t detect before.” This sentiment is reflected in both C-suite and other executives we surveyed, with little variation.
Further, 82% of the respondents report that one of the main benefits of FDA is “earlier detection of misconduct.” According to the Association of Certified Fraud Examiners’ (ACFE) latest “Report to the Nations on Occupational Fraud and Abuse,”6 more than 1,300 fraud incidents reported in their study lasted a median of 18 months before being detected. Combining that statistic with the ACFE’s finding that more than 20% of the frauds detected were more than US$1 million in losses, one can see that earlier detection can result in meaningful financial savings to the organization.
Figure 7. Main benefits of FDA
Earlier detection of misconduct 80% 82%
We can review large amount of datain a shorter period of time 70% 79%
Cost effective 57% 63%
Able to detect potential misconductthat we couldn’t detect before 89%84%
Offers better comparison of data forimproved fraud risk decision making 82%79%
Assists in planning our auditsor investigative fieldwork 73% 82%
Able to analyze non-structured data formats alongsidestructured data formats to identify potential misconduct 54% 62%
Enhances our risk assessment process 86% 90%
C-suite Total
Q: What do you think are the main benefits of using forensic data analytics in your anti-fraud and anti-bribery program? Base: All respondents (466) The “Other” percentages have been omitted to allow better comparison among the responses given. Multiple answers allowed, may exceed 100%.
Referencing the previous discussions on big data and other advanced analytics opportunities, we note that 62% of respondents include being “able to analyze non-structured data formats alongside structured data formats to identify potential misconduct.” This further reinforces the benefit that FDA brings through text mining in the context of big data as we see new varieties of data sources, such as social media, being introduced into the FDA platform.
Why use FDA: key benefits and adoption
“ The presence of anti-fraud controls is notably correlated with significant decreases in the cost and duration of occupational fraud schemes.”
2012 ACFE Report to the Nations on Occupational Fraud and Abuse
6 The ACFE “Report to the Nations on Occupational Fraud and Abuse” is available for download on ACFE’s website at www.acfe.com.

12
Big risks require big data thinkingGlobal Forensic Data Analytics Survey 2014
Where is FDA deployed?
Across the organizationFDA is beneficial to a wide range of stakeholders within the organization. This includes executive management, boards, business operations and risk professionals, including legal, audit, compliance and investigations. It is not surprising to see the results of FDA being shared among a broad group of business executives. However, it is surprising to see such a high percentage of senior leadership named as primary business users or beneficiaries of FDA. Eighty-one percent of respondents list “corporate executive management” and 68% identify “board of directors” as primary users or beneficiaries.
Figure 8. FDA benefits extend high into the organization
Business unit managers 70%
68%Board of directors
61%Internal investigations or business integrity
Corporate executive management 81%
Legal/compliance 77%
Internal audit 84%
Q: Who are the primary users or beneficiaries of your forensics data analytics?Base: All respondents (466) The “Other” percentages have been omitted to allow better comparison among the responses given. Multiple answers allowed, may exceed 100%.
With apparently broad interest among senior executives in insights gleaned from FDA, prospects for differential investment in FDA tools and the teams to deploy them appear promising. In addition, with boards frequently asking management about the effectiveness of their anti-fraud and anti-corruption programs, it is more important than ever that internal audit and compliance professionals take advantage of FDA technologies that integrate the big data, advanced analytics concepts discussed previously. For example, making a presentation to the board using static spreadsheets or simple graphics may not be as impactful or insightful as an interactive dashboard that leverages risk ranking or data visualizations. More importantly, less sophisticated FDA approaches may result in lower detection rates, longer wait times for detection or reduced compliance efficiencies.
Common testing areas of FDA in investigations and compliance monitoring include:
► Payment stream, accounts payable analysis
► Altered invoices, duplicate or fake invoices, inflated prices, suspicious payment descriptions, requestor/approver conflicts
► Vendor master/employee master analysis and comparisons
► Fictitious vendors, vendor risk ranking, background due diligence, conflicts of interest
► Employee expenses/travel and entertainment
► Over limits, unusual or inappropriate expenses, miscellaneous/sundry expenses, split or duplicate expenses
► Payroll
► Ghost employees, falsified wages, commission schemes
► Financial misstatement
► Fictitious revenues, bill-and-hold schemes, concealed liabilities, improper disclosures, overstated assets
► Bribery and corruption
► Bid rigging, conflicts of interest, contract compliance, kickbacks, illegal gratuities
► Capital projects
► Contract noncompliance, project abuses and overcharges

13
Big risks require big data thinkingGlobal Forensic Data Analytics Survey 2014
However, it is clear from our respondents that no one functional department clearly owns the FDA implementation in anti-fraud/anti-corruption and compliance programs. Our survey respondents indicate that, in their organizations, FDA lies within the executive management function (32%) or the legal/compliance function (31%). Internal audit and risk functions rank third at 22%. After the top three, the percentages drop dramatically as the finance department ranks fourth at only 6%. The lack of clear ownership by any one department can put a company at risk with respect to maximizing the benefits of FDA and gaining the required executive sponsorship needed to manage fraud and corruption risk across the enterprise.
Figure 9. Who owns the program?
32%
31%
22%
6%
5%4%
Finance department
Investigations
Other
Corporate executive management
Legal/compliance
Internal audit/risk
Q: Who has overall responsibility for the company’s anti-fraud and anti-bribery program, in terms of compliance monitoring and investigations? Base: All respondents (466)
Companies sometimes struggle to determine who should be responsible for fraud risk management. Without a clear idea of who is responsible for managing such risks, anti-fraud efforts may be duplicated and expectation gaps may arise across business functions of the organization.
We see a leading practice emerging in which companies share “ownership” of anti-fraud efforts, among a select group of individuals, across multiple departments, who each have a role in addressing fraud proactively and reactively. Each individual typically has a specific function with greater accountability to the group. For example, internal audit might take on the role of FDA while coordinating with compliance and legal to ensure that proper fraud risks are being addressed as well as IT to ensure that data is made available for analysis.
“ From a European perspective, what we are seeing from big data commentators is a continuous reference to the leveraging of large data volumes for the purposes of customer acquisition and retention. However, what this survey tells us is that the proactive detection of fraud and noncompliance through continuous monitoring and point solutions is very much on the C-suite agenda, and that the exploitation of big data for these purposes is going to be a huge opportunity for organizations to improve risk management.”
Paul Walker, Forensic Technology & Discovery Services, FIDS UK
14
Big risks require big data thinkingGlobal Forensic Data Analytics Survey 2014
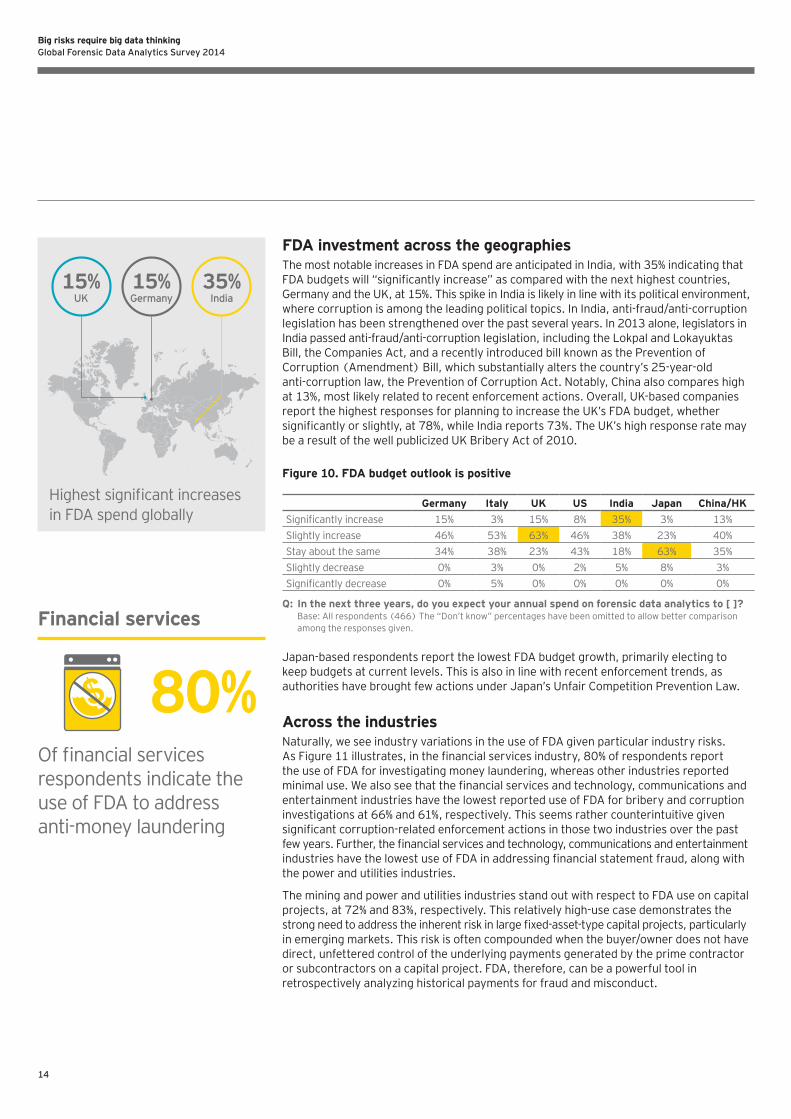
FDA investment across the geographiesThe most notable increases in FDA spend are anticipated in India, with 35% indicating that FDA budgets will “significantly increase” as compared with the next highest countries, Germany and the UK, at 15%. This spike in India is likely in line with its political environment, where corruption is among the leading political topics. In India, anti-fraud/anti-corruption legislation has been strengthened over the past several years. In 2013 alone, legislators in India passed anti-fraud/anti-corruption legislation, including the Lokpal and Lokayuktas Bill, the Companies Act, and a recently introduced bill known as the Prevention of Corruption (Amendment) Bill, which substantially alters the country’s 25-year-old anti-corruption law, the Prevention of Corruption Act. Notably, China also compares high at 13%, most likely related to recent enforcement actions. Overall, UK-based companies report the highest responses for planning to increase the UK’s FDA budget, whether significantly or slightly, at 78%, while India reports 73%. The UK’s high response rate may be a result of the well publicized UK Bribery Act of 2010.
Figure 10. FDA budget outlook is positive
Germany Italy UK US India Japan China/HK
Significantly increase 15% 3% 15% 8% 35% 3% 13%
Slightly increase 46% 53% 63% 46% 38% 23% 40%
Stay about the same 34% 38% 23% 43% 18% 63% 35%
Slightly decrease 0% 3% 0% 2% 5% 8% 3%
Significantly decrease 0% 5% 0% 0% 0% 0% 0%
Q: In the next three years, do you expect your annual spend on forensic data analytics to [ ]? Base: All respondents (466) The “Don’t know” percentages have been omitted to allow better comparison among the responses given.
Japan-based respondents report the lowest FDA budget growth, primarily electing to keep budgets at current levels. This is also in line with recent enforcement trends, as authorities have brought few actions under Japan’s Unfair Competition Prevention Law.
Across the industriesNaturally, we see industry variations in the use of FDA given particular industry risks. As Figure 11 illustrates, in the financial services industry, 80% of respondents report the use of FDA for investigating money laundering, whereas other industries reported minimal use. We also see that the financial services and technology, communications and entertainment industries have the lowest reported use of FDA for bribery and corruption investigations at 66% and 61%, respectively. This seems rather counterintuitive given significant corruption-related enforcement actions in those two industries over the past few years. Further, the financial services and technology, communications and entertainment industries have the lowest use of FDA in addressing financial statement fraud, along with the power and utilities industries.
The mining and power and utilities industries stand out with respect to FDA use on capital projects, at 72% and 83%, respectively. This relatively high-use case demonstrates the strong need to address the inherent risk in large fixed-asset-type capital projects, particularly in emerging markets. This risk is often compounded when the buyer/owner does not have direct, unfettered control of the underlying payments generated by the prime contractor or subcontractors on a capital project. FDA, therefore, can be a powerful tool in retrospectively analyzing historical payments for fraud and misconduct.
Highest significant increases in FDA spend globally
15%UK
15%Germany
35%India
Financial services
Of financial services respondents indicate the use of FDA to address anti-money laundering
80%

15
Big risks require big data thinkingGlobal Forensic Data Analytics Survey 2014
Figure 11. FDA uses by industry
Transportation Financial services
Life sciences
Oil and gas
Manufacturing Consumer products/
retail/wholesale
Technology, communications
and entertainment
Mining Power and utilities
Bribery and corruption risk 82% 66% 80% 76% 74% 74% 61% 90% 77%
Money laundering 30% 80% 24% 29% 23% 31% 17% 24% 17%
Asset misappropriation 82% 56% 78% 86% 71% 85% 70% 90% 74%
Financial statement fraud 79% 54% 67% 63% 71% 68% 52% 62% 51%
Mergers and acquisitions 42% 25% 43% 29% 48% 30% 26% 41% 32%
Capital projects 45% 34% 50% 65% 58% 53% 48% 72% 83%
Other 6% 16% 11% 8% 10% 4% 13% 0% 13%
Q: In which of these risk areas or types of fraud does your company use FDA when investigating fraud and bribery? Base: All respondents (466) Multiple answers allowed, may exceed 100%.
It is also worth noting that the life sciences, manufacturing and mining industries lead the responses with the use of FDA in merger and acquisition (M&A) situations. Respondents in other sectors, including oil and gas and technology, communications and entertainment, appear less willing to use FDA in this context. Anti-fraud/anti-corruption due diligence of target companies — especially companies operating in high-risk markets — can be an important component of the M&A effort, given the risk of paying for revenue streams dependent on corrupt payments and the regulatory risk from successor liability.

16
Big risks require big data thinkingGlobal Forensic Data Analytics Survey 2014
Technology: the right tools for the right job
While spreadsheet and database applications are a component of the overall FDA toolset, global companies with increasing volumes, velocities and varieties of data may require more sophisticated technologies. To address increasing data volumes, big data technologies, such as Hadoop and other parallel processing or in-memory processing systems, can significantly increase the speed at which the analytics are conducted and reduce the complexity in the data to improve decision making.
In this section, we will explore some practical FDA examples of big data use cases — from a volume, velocity and variety perspective. From a data volume perspective, we observed a 10-million-record, complex duplicative payment query reduced from three-and-a-half hours in a traditional SQL environment to under four minutes in a Hadoop distributed computing environment. To address data velocities that incorporate more real-time analysis of transactions, we see leading practices leveraging statistical tools that incorporate predictive modeling, anomaly detection and risk-scoring algorithms that seek to flag or stop potentially improper payments much sooner in the procure-to-pay process. Finally, to address multiple varieties of structured and unstructured data, we see the effective use of natural language processing, or text-mining tools, combined with data visualization tools, to identify “corrupt intent” in the payment or transaction descriptions. Taking these examples into consideration, there is a strong link between the FDA maturity model previously shown in Figure 4 and big data technologies that support high volumes, velocities and varieties of data for FDA analysis.
Two examples of dashboard capabilities in FDA analysis are as follows:
Figure 12.
Third-party watch-list monitoring: Rather than simply comparing watch-list names to a vendor table in a spreadsheet, this example links accounts payable data to third-party watch-list data to identify potentially improper payments to sanctioned or high-risk entities and displays the results in an interactive dashboard.
What is Hadoop? The Apache™ Hadoop® project develops open-source software for reliable, scalable, distributed computing. The Apache™ Hadoop® software library is a framework that allows for the distributed processing of large data sets across clusters of computers using simple programming models. It is designed to scale up from single servers to thousands of machines, each offering local computation and storage.
Source: The Apache Software Foundation, http://hadoop.apache.org

17
Big risks require big data thinkingGlobal Forensic Data Analytics Survey 2014
Figure 13.
Spotting potentially improper payments: This example leverages an accounts payable monitoring dashboard to spot patterns and anomalies. It includes capabilities to pick any country, vendor name or other field and drill down into the transaction details.
Another effective application of FDA technologies is the use of statistical and data-mining techniques such as predictive modeling, clustering and anomaly detection. The same is true for continuous monitoring tools that can operate on top of the enterprise transaction processing, operational or financial accounting system, and monitor for patterns or anomalies, often in real or near-real time.
From an industry-sector perspective, the power and utilities industries stand out as having some of the highest adoption rates of advanced FDA tools, leading in the use of continuous monitoring (41%), text analytics (34%) and statistical analysis/data-mining tools (20%). Factors driving the adoption could be increasing expectations by multiple utility regulators, large-scale energy-trading operations and significant levels of capital spending, as well as high volumes of vendor and customer transactions. With the continued adoption of advanced technologies to deliver and track power usage, such as “smart grids” and “smart meters,” the power and utilities companies can expect a wealth of information being generated from these systems that will likely be subject to compliance monitoring and continued big data technology integration.
From a country perspective, China (including Hong Kong SAR) and Brazil stand out in our research as strong adopters of text analytics and keyword searching technologies at 63% and 44%, respectively. However, China/Hong Kong lacks the broader adoption of visualization and reporting tools and big data technologies. From a social media monitoring perspective, Japan is a clear leader in adoption at 43%, followed once again by China/Hong Kong at 38%. Notably, France is by far the most prominent user of data visualization technologies at 43% adoption, doubling the rate of any other country. Finally, while big data technologies are relatively small overall across all countries, France once again doubles the rate of any other country with 11% adoption as we see increased innovations in that region.
Interestingly, with the exception of forensic analytics software, the US is in the middle ground with respect to the use of FDA technology adoption relative to other countries.
Third-party risk evaluation example
The setting
A European bank performed an evaluation of its third-party banking client sanctions screening process. The project involved identifying the most important information from the bank’s customer relationship management (CRM) database and utilizing fuzzy matching, and near-matching FDA techniques, to scan millions of records against multiple watch lists and information sources.
The big data challenge
► Over 26 million records in the CRM database
► Additional third-party data sources, internet and news feeds required for further due diligence
► 650,000 matches to sanctioned individuals and entities from AML watch lists, requiring validation to eliminate false positives
The results
High-risk entities or individuals were identified, validated and classified into a complex scoring model that incorporated multiple risk attributes. The project was completed in under 90 days.

18
Big risks require big data thinkingGlobal Forensic Data Analytics Survey 2014
Figure 14. Where advanced FDA is being utilized
France UK US Japan China/HK
Australia Brazil
Continuous monitoring tools, which may include governance risk and compliance tools
46% 27% 29% 23% 20% 18% 41%
Text analytics tools or keyword searching
32% 11% 29% 20% 63% 9% 44%
Forensic analytics software 24% 30% 53% 14% 13% 42% 26%
Social media/web monitoring tools
27% 19% 24% 43% 38% 0% 31%
Visualization and reporting tools
43% 8% 13% 14% 0% 6% 21%
Statistical analysis and data-mining packages
14% 16% 13% 11% 13% 3% 18%
Big data technologies 11% 3% 2% 3% 0% 0% 5%
Voice searching and analysis
8% 0% 2% 0% 8% 0% 3%
Q: From the tools mentioned, which, if any, are you currently using in your organization? Base: All respondents (422). The “I am not aware of any such tools,” “Other” and “None” percentages have been omitted to allow better comparison among the responses given.
“ We have seen a significant increase in demand across the region for forensic analytics software as organizations step up their fraud detection and anti-corruption monitoring effort.”
Warren Dunn, Forensic Technology & Discovery Services, FIDS Australia

19
Big risks require big data thinkingGlobal Forensic Data Analytics Survey 2014
Lack of awareness and expertiseWhile the overall sentiment of FDA’s effectiveness is positive among the majority of respondents, our survey indicates that there is more work to be done with respect to FDA awareness and effective procedures. Sixty-nine percent of respondents agree that their current anti-fraud/anti-bribery program is effective in preventing and detecting fraud and corruption. However, 63% of the respondents agree that they need to do more to improve their anti-fraud/anti-bribery procedures, including the use of FDA. Additionally, 62% indicate they need to improve management’s awareness of the benefits of FDA in general and proactive transaction monitoring in particular.
Given that the majority of the respondents indicate positive sentiments about effectiveness, there is an inherent risk that this could be an indication of a false sense of security — especially given that detection can also be made more difficult due to the sophistication of schemes and concealment methods, which often include the circumvention of controls. Further, detection could also be averted, given our survey observation that advanced FDA technology available on the market today is seemingly not being utilized broadly. Survey participants simply may not know what they are missing. Addressing these risks through improved FDA procedures, technologies and communication will go a long way to improving overall FDA effectiveness.
Figure 15. Perceived effectiveness, but more to do
69% 16% 15%
63% 13% 24%
62% 13% 25%
% Agree % Neither/nor % Disagree
Our current anti-fraud and anti-bribery program is effective in preventing
and detecting fraud and corruption
We need to do more to improve ourcurrent anti-fraud and anti-bribery procedures,
including the use of forensic data analytics
We need to improve management’s awarenessof the benefits of forensic data analytics
and proactive transaction monitoring
The biggest FDA challengesAt the end of the survey, we asked the following open-ended question: “With respect to FDA, what is your single biggest challenge or requirement in your organization?” The most frequently cited response across all industries is “getting the right tools or expertise for FDA,” followed by “analysis process quality improvement” and “challenges with multiple data sources.” These top challenges have three key themes in common: people, process and technology.
From a people perspective, traditional audit or investigative skills may not incorporate the more advanced data mining or IT-related skill sets required for advanced FDA techniques. As such, companies can benefit from augmenting the team with personnel familiar with big data and other advanced technology skill sets who can assist with gathering, validating and analyzing the data and turning it into meaningful information. Further, investing the time to develop key business processes for requesting, managing, refreshing and reporting data in a timely manner will play a key role in ensuring long-term sustainability of the FDA program. Finally, as previously discussed, integrating more advanced FDA technologies that incorporate visualization, statistical analytics and text mining features, among other capabilities, will help improve detection rates and reduce false positives.
Missed opportunities: turning data into information

20
Big risks require big data thinkingGlobal Forensic Data Analytics Survey 2014
Figure 16. The biggest challenges
FDA is too expensive
To prevent fraud rather than discover fraud
Poor quality or lack of accuracy in the data
Challenges with combining dataacross various IT systems
Improving the quality of the analysis process
Convincing senior management or thecompany about the benefits of FDA
Difficulty in adapting FDA to comply withdifferent regulations in various markets
Spreading the FDA cultureacross different business units
Lack of human resources ormanpower to operate FDA
To identify fraudulent informationacross large data sets
Huge volume of data to analyze
Getting the right tools or expertise for FDA
FDA is not prevalent to the culture
FDA producing positive results to indicate andprove any fraud or bribery that is occurring
Uncertainty about the relevanceof FDA in the company
26%
15%
15%
10%
10%
9%
8%
6%
6%
5%
5%
4%
3%
3%
2%
Q: With respect to forensic data analytics, what would you say is your single biggest challenge or requirement in your organization? Base: All respondents (466). The “Other,” “Don’t know,” “None” and “Refused” percentages have been omitted to allow better comparison among the responses given. Multiple answers allowed, may exceed 100%.
Many of the comments around getting the right tools and expertise stem from both the information technology challenges related to acquiring the necessary data, in a usable format, and to conducting FDA analysis. Since this skill set also requires database management and data analysis skills, in addition to anti-fraud/anti-corruption and accounting-related skills, it is not surprising that these issues come up as a top factor.
“ Hiring and retaining the best people possible to use data analytics is our biggest challenge. We need people who understand it and are able to draw the proper conclusions from the analysis.”
ChiefComplianceOfficer,US
“ Our biggest challenge is getting a consistent global view from differing local data sources. We don’t have one global source from our enterprise data system, which can frustrate our analytical efforts.”
ChiefComplianceOfficer,UK

21
Big risks require big data thinkingGlobal Forensic Data Analytics Survey 2014
Data volumes analyzed are relatively smallThe vast majority of companies surveyed indicate that they are working with data volumes that do not correlate with the relevant size of their business. One potential reason for this low data volume may be the continued use of data sampling for fraud detection rather than analysis of the entire data universe. When it comes to auditing for process effectiveness, sampling can be an effective technique; however, the most robust approach to fraud and bribery risk mitigation includes accessing larger, more complete data sets. This is especially important given the inherently secretive nature of the fraudulent and/or corrupt act.
Figure 17. Data volumes by company size (in revenue)
All responses
Revenue breakdown
US$ 100m–1b
Over US$1b
0 to 10,000 records 33% 42% 27%
10,000 to 100,000 records 19% 15% 22%
100,000 to 1 million records 20% 18% 22%
1 million to 10 million records 7% 5% 8%
10 million to 100 million records 3% 2% 5%
100 million to a billion records 0% 0% 0%
Over a billion records 2% 0% 3%
Survey counts 466 207 259
Q: What data volume do you typically work with in your forensic data analytics tasks? Base: All respondents (466). All respondents indicating US$100m-1b (207); all respondents indicating over US$1b (259). The “Don’t know” percentages have been omitted to allow better comparison among the responses given.
We do find that FDA data volumes vary based on the roles of the user. Investigations departments clearly stand out as the group handling the larger data sets, with 42% reporting data volumes between 100,000 to 1 million and 8% between 10 million and 100 million. Only 18% of internal audit professionals report working with data volumes in excess of one million records, as shown on the chart on the next page. These relatively low data volumes for internal audit present an opportunity to improve fraud risk sample selections by analyzing 100% of the data and selecting testing samples from only the highest-risk, top-scoring transactions.
“ Our top priorities are working with large data volumes and improving the efficiency of our testing. By using larger data sets we hope to do smarter internal audits, including more effective fraud detection.
Head of Internal Audit, Australia

22
Big risks require big data thinkingGlobal Forensic Data Analytics Survey 2014
The top countries with average data volumes reported by respondents exceeding one million records
26%Brazil
22%US
21%UK
19%Germany
Figure 18. Data volumes by function
Total Finance department excluding
audit
Internal audit and
risk
Legal/compliance
Investigations Business/management
Other
0 to 10,000 records
33% 54% 25% 26% 8% 41% 23%
10,000 to 100,000 records
19% 16% 25% 14% 8% 14% 12%
100,000 to 1 million records
20% 17% 22% 22% 42% 11% 23%
1 million to 10 million records
7% 3% 9% 9% 0% 3% 8%
10 million to 100 million records
3% 1% 5% 5% 8% 0% 4%
100 million to a billion records
0% 0% 1% 0% 0% 0% 0%
Over a billion records
2% 0% 3% 1% 0% 3% 8%
Q: What data volume do you typically work with in your forensic data analytics tasks? Base: All respondents (466). The “Don’t know” percentages have been omitted to allow better comparison among the responses given.
From an industry perspective, only financial services stands out with larger volumes, as 21% report working with data volumes nearing and over one million records — which is still relatively small based on what we would expect from such a data-intensive industry.
Effective fraud detection often requires the analysis of hundreds of thousands or millions of records or communications from multiple systems. It appears that many companies are failing to adequately leverage FDA to bolster their anti-fraud/anti-corruption efforts, missing an opportunity, for example, to look for potentially corrupt payments from complete data sets rather than samples. Given today’s computing power and available analytic tools, the data volumes under review can often be increased by deploying sophisticated FDA tools in a cost-effective manner.

23
Big risks require big data thinkingGlobal Forensic Data Analytics Survey 2014
Data sources analyzed are not aligned with technologyFor additional insight, we stratified the respondents between “base level” users of FDA and “sophisticated” users. Base-level users are categorized by their FDA use of only spreadsheets and relational database tools. Sophisticated users are those who have utilized spreadsheets and database tools along with any other category of technology, such as data visualization, statistical analysis, text mining tools, etc.
When it comes to structured data sources, such as transactional or payment-type data sets, we see little difference between companies that use base-level versus sophisticated tools. However, analytically mature, sophisticated users spend more time than others analyzing network access information, payroll, inventory, and time and expense data, usually noting a 5% to 10% difference between the two.
Switching to unstructured data, we are surprised by the prevalence of free-text sources in FDA, given the scarcity of technology tools for natural language and text processing. As shown in Figure 19 below, there is a much broader gap between companies at varying maturity levels in using free-text-based sources. For example, 62% of sophisticated users are analyzing the free-text descriptions in accounts payable as compared with 47% of base-level users. We have observed similar gaps with email, where 58% of sophisticated users analyze email and only 45% of the rest of the population does.
Figure 19. Sources of unstructured data
Customer call or meeting notes
News feeds or external data sources
Social media, web content and blogs
Employee discussions and interviews
Free-text payment descriptionsin the accounts payable fields
Emails of suspected or high-risk employees
Instant messages of suspected or high-risk employees
Telephone conversations
Other text-based documents56%
66%
59%61%
47%62%
45%58%
55%54%
38%52%
29%42%
24%29%
12%21%
SophisticatedBase level
Q: What unstructured data sources do you use to analyze the above risk areas or types of fraud?Base: All respondents (422). The “Other” and “None/no analysis of unstructured data sources” percentages have been omitted to allow better comparison among the responses given.
“ For us, the biggest challenge is the integration and acceptance of analytical tools within our organization. From an integration perspective, it’s about how we integrate those tools with our existing technology, and from an acceptance perspective, it’s about ensuring that the benefits of prevention are fully understood within the executive management community.”
General Manager, UK
24
Big risks require big data thinkingGlobal Forensic Data Analytics Survey 2014
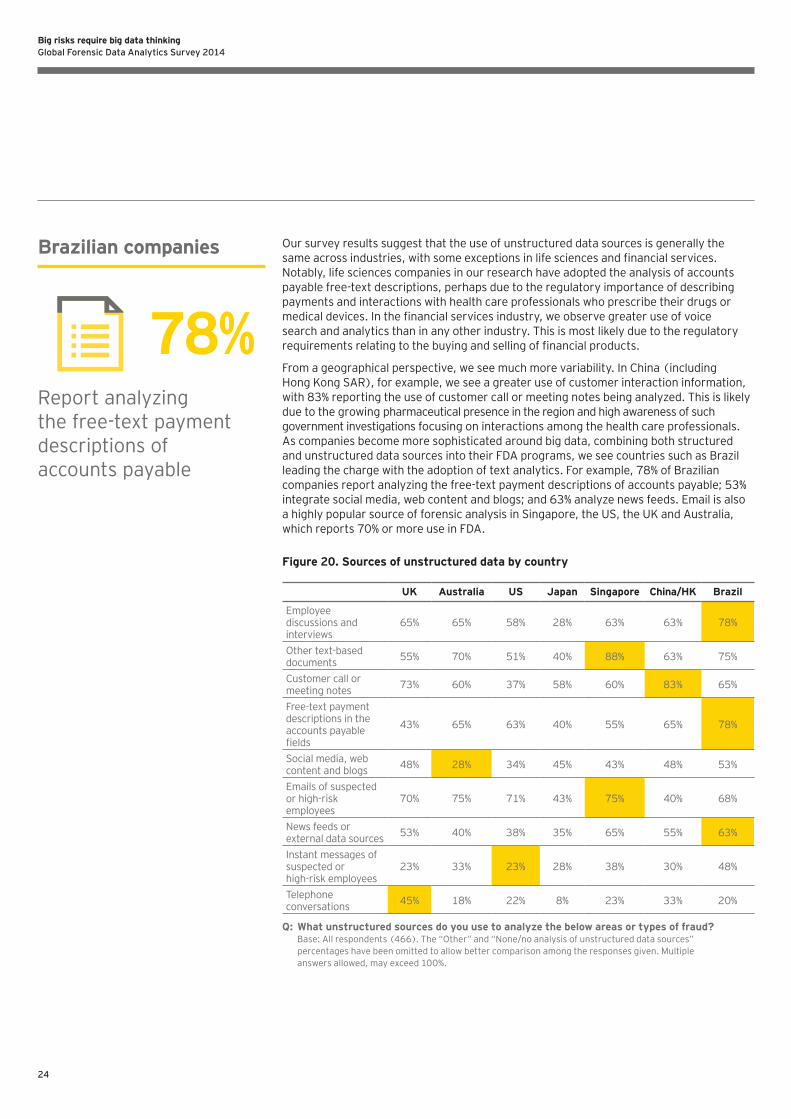
Our survey results suggest that the use of unstructured data sources is generally the same across industries, with some exceptions in life sciences and financial services. Notably, life sciences companies in our research have adopted the analysis of accounts payable free-text descriptions, perhaps due to the regulatory importance of describing payments and interactions with health care professionals who prescribe their drugs or medical devices. In the financial services industry, we observe greater use of voice search and analytics than in any other industry. This is most likely due to the regulatory requirements relating to the buying and selling of financial products.
From a geographical perspective, we see much more variability. In China (including Hong Kong SAR), for example, we see a greater use of customer interaction information, with 83% reporting the use of customer call or meeting notes being analyzed. This is likely due to the growing pharmaceutical presence in the region and high awareness of such government investigations focusing on interactions among the health care professionals. As companies become more sophisticated around big data, combining both structured and unstructured data sources into their FDA programs, we see countries such as Brazil leading the charge with the adoption of text analytics. For example, 78% of Brazilian companies report analyzing the free-text payment descriptions of accounts payable; 53% integrate social media, web content and blogs; and 63% analyze news feeds. Email is also a highly popular source of forensic analysis in Singapore, the US, the UK and Australia, which reports 70% or more use in FDA.
Figure 20. Sources of unstructured data by country
UK Australia US Japan Singapore China/HK Brazil
Employee discussions and interviews
65% 65% 58% 28% 63% 63% 78%
Other text-based documents
55% 70% 51% 40% 88% 63% 75%
Customer call or meeting notes
73% 60% 37% 58% 60% 83% 65%
Free-text payment descriptions in the accounts payable fields
43% 65% 63% 40% 55% 65% 78%
Social media, web content and blogs
48% 28% 34% 45% 43% 48% 53%
Emails of suspected or high-risk employees
70% 75% 71% 43% 75% 40% 68%
News feeds or external data sources
53% 40% 38% 35% 65% 55% 63%
Instant messages of suspected or high-risk employees
23% 33% 23% 28% 38% 30% 48%
Telephone conversations
45% 18% 22% 8% 23% 33% 20%
Q: What unstructured sources do you use to analyze the below areas or types of fraud?Base: All respondents (466). The “Other” and “None/no analysis of unstructured data sources” percentages have been omitted to allow better comparison among the responses given. Multiple answers allowed, may exceed 100%.
Brazilian companies
Report analyzing the free-text payment descriptions of accounts payable
78%

25
Big risks require big data thinkingGlobal Forensic Data Analytics Survey 2014
Right risks, wrong tools?
To gain a perspective on respondent’s views of available FDA tools in the market, we asked survey participants to name FDA tools that they are aware of in managing fraud and corruption risk. By far, the most common answer is “in-house developed tools.” We also notice a wide dispersement of the tools, with no one FDA tool dominating the market. Interestingly, many of the FDA tools mentioned are financial accounting, enterprise resource planning, business intelligence or compliance related in nature. This wide dispersion of tools is a good indication of the broad uses of FDA that can be deployed on multiple technology platforms.
To help us analyze the free-text comments from our survey participants, we utilized word cloud technologies. A word cloud is a well-known analysis tool that is most commonly used to highlight popular or trending terms based on frequency of use and prominence. The following word cloud depicts the frequency of the tools mentioned in the responses.
Figure 21. Word cloud of reported FDA technologies
“ Our FDA monitoring is reliant on manually obtaining data from our financial system. Cleansing the data is a major challenge, and we are often forced to refer back to source documents. Our people need better training if we are to overcome these challenges.”
Assistant General Manager of Vigilance, India
CUE
R3AribaVulnit
Registers IES Tax AuditDetica Netreveal CAAT
Dun & Bradstreet Blacklist Software
Cognos Oracle report writerACI Proactive Risk Manager
Actimize Serasa Experian
Encase Symantec Compliance AcceleratorSiron AML Concur expanse management
SafeWatch i2a Business ObjectsInstinct Caapts OLAP Worldtrack
COSONetmap
ERP systems
Sentinel Great Plains
Sheriff Norcom
Bloomberg Clearwell
Sanction screeningAccounting Software
Navation SogeiPatriot Officer
Procative toolsLotus notes
Business EquityBusiness Intelligence
Insurance Initiative Ltd.
Bridger Insight Datascan
FalconBradesco EquifaxJD EdwardsConcordance
NortonTranswatch
Screening tools
Searchspace hotlineLink Analysis MicroStrategy
Predictive toolsGISVision board info pms
Nincom Inverness Technologies RCTS
In-house framework
Audit tools/training Archiving
Credit worthiness softwareSemantec Discover Data Financial fraud tools
Cross Check Compliance Self-organizing maps ExperianCaseware Monitor Dow Jones
Itau bank in-house tools Data Leakage tools SEPA Hyperion Massbroker Fox mailTon Bella by Seron Schleupen VA Kazion Top CAATS Worldcheck IDEA
MinitabCellentSageSoftwareTraining
Sherpa Trusty NoneIFFSaf tech Trend analysis
External tools/vendor
In-house tools

26
Big risks require big data thinkingGlobal Forensic Data Analytics Survey 2014
The following section is a collection of case studies across multiple industries where we have observed clients successfully deploying the right people, processes and technologies around FDA.
Pharmaceutical company A leading global pharmaceutical company integrated FDA to assist in compliance monitoring between their sales representatives (REPs) and the health care professionals (HCPs) they interact with in certain high-risk countries. Whereas traditional FDA thinking would consider only one data source for analysis, this company incorporated big data thinking and integrated multiple structured and unstructured data sources with more sophisticated applications — in addition to spreadsheet and database applications.
As the model below depicts, the company developed new analytics that incorporate multiple data sources to “risk rank” both REPs and HCPs across a variety of regulatory and corporate integrity risks, including fraud, corruption and off-label marketing. Dynamic monitoring dashboards were provided to local in-country compliance officers and/or division managers, along with adequate training and instruction as to how to spot trends and anomalies. Given the increased transparency into the business, coupled with findings and success stories of rogue employee detection, this FDA program was deployed to dozens of regions over the course of approximately 18 months.
Figure 22
Meal
interactions
Speaking
events
Medical info.
requests
Product
samples
Physician
interactions
Educational
materials
Consulting
agreements
Advisory
boards
Expert input
forums
Application of testing metrics developed into a
risk-scoring model focused on identifications of
high-risk interactions between REPs and HCPs
HCP ranking
model
REP ranking
model
Mu
ltip
le
dat
a so
urc
es
FDA
alg
ori
thm
s
Mo
nit
ori
ng
das
hb
oar
ds
Leverage analytics, mitigate risks

27
Big risks require big data thinkingGlobal Forensic Data Analytics Survey 2014
Financial services In response to regulatory requirements, a leading global financial services firm deployed FDA to monitor its trading operations for rogue activity and leakage of material nonpublic information. Jointly led by the chief compliance officer and the chief information security officer, the company targeted the following peer groups for communications review:
► Selected portfolio managers in higher-risk security products
► Selected regional and local brokerage branch managers
► Selected employees from a recent acquisition
Nicknamed “know your trader” analytics, or KYT, resources were allocated to support ad hoc internal investigations in support of human resource, legal, regulatory and internal affairs matters. In the end, the company identified several high-risk employees violating company data privacy and protection policies, which allowed them to take immediate remedial action.
Below is one of the FDA analytics developed for KYT that utilized email and instant message information, as well as trade activity, to identify potential rogue traders in the organization:
In this analysis interface, email communications were compared to a keyword library of opportunity terms (A), rationalization terms (B) and incentive/pressure terms (C) in line with the fraud triangle7 to identify potential rogue trading activity. In this demonstrative example, Russell Draper (our fictitious employee) exhibits a significant amount of sensitive keyword hits around the fraud triangle in the April 2008, November 2008 and August 2009 time periods, which could warrant further inquiry.
Figure 23
7 Developed by Dr. Donald Cressey, the fraud triangle is a model for explaining the factors that cause someone to commit occupational fraud. It consists of three components which, together, lead to fraudulent behavior: (1) perceived unshareable financial need, (2) perceived opportunity and (3) rationalization. See: www.acfe.com/fraud-triangle.aspx.
“ We are in a high-risk industry given the prevalence of cash payments. Fraud, bribery and corruption risks are significant concerns. Raising awareness among senior management regarding how forensic data analytics can help mitigate these risks is one of my top priorities.”
Risk Director, UK

28
Big risks require big data thinkingGlobal Forensic Data Analytics Survey 2014
InsuranceFollowing its discovery of an agent committing fraud, a large life insurer had concerns about its broader fraud exposure across its international operations. The concern stemmed from how the insurance agents could misappropriate premiums or inflate commission income. The company utilized FDA to monitor for potential fraud based on the premium and commission schemes previously perpetrated. The company deployed leading FDA technologies to identify agents at high risk for fraud based on their individual policies. Among the anomalies detected were policies reassigned to the same agent, multiple policies with the same contact information and a change of address followed by withdrawal of funds.
Using data visualization and statistical anomaly detection techniques, the FDA analysis identified over US$1 million in high-risk policies in one country alone. This FDA program was deployed in further countries with similar results.
Oil and gas A major energy company built FDA into its ABAC program, utilizing customized, country-by-country analytics. Before adopting FDA, the company had budgeted a total of US$500,000 for fieldwork in 20 countries. Instead, the company developed 15 “core” anti-corruption analytics that were run across data from all countries, and an additional 10 “customized” analytics that incorporated unique country, cultural and business-related risks into the pre-fieldwork FDA plan. By analyzing vendor- and procurement-related data, as well as employee/agent expense-related details, the company identified multiple high-risk transactions and process inefficiencies that warranted on-site inquiry. In one country, the text mining of accounts payable data revealed unusual phrases related to facilitation payments and potentially improper payments to government officials.
These findings were used in the design of the fieldwork to select specific transactions. Using FDA, the company analyzed all 20 countries from their corporate headquarters and, based on the risks identified by FDA, the internal audit and compliance team deemed it appropriate to travel to only eight countries. The resulting travel savings of approximately US$300,000 was used in part to fund the ongoing FDA program.
Industrial servicesIn its investigation of alleged improper payments to foreign government officials, a Fortune 500 company used FDA in multiple countries to identify key risk areas. For example, in one country, the project team reviewed 3,000 transactions in detail and used the results to build a statistical, predictive model that examined a further 800,000 transactions to find “more like” the original sample. This analysis identified a further 14,000 statistically similar transactions, representing over US$8 million in potentially improper payments.
Interestingly, the number one most statistically significant variable used to predict a potentially improper payment was when the phrase “special treatment pay” was used in the free-text field description of the payment entry. This variable, combined with other statistically significant variables, provided targeted transactions to the investigation team to help them focus their field work.
Oil and gas
More analysis, less travel: company saved US$300k in travel expense from using FDA
300k

29
Big risks require big data thinkingGlobal Forensic Data Analytics Survey 2014
Technology counts: better tools result in better FDA resultsAs previously mentioned, we stratified our data between respondents with “base level” users of FDA technologies who are using only spreadsheet and database tools for analysis and “sophisticated” users who are using additional FDA technologies beyond spreadsheets and databases. Observations from this stratification are that sophisticated users experience the following benefits:
► Better results, better recoveries. Sixty-three percent of respondents with sophisticated programs say that they “get positive results and/or recoveries from the forensic data analytics tools” as compared with 52% for the others.
► Earlier detection of misconduct. Eighty-five percent of respondents in sophisticated FDA organizations believe that FDA leads to earlier detection of misconduct as compared with 70% for the others.
► More cost-effective results. Sixty-five percent of respondents in sophisticated FDA organizations believe that one of the main benefits of FDA is its cost effectiveness as compared with 51% for the others.
► Higher visibility to the board. Seventy percent of respondents with sophisticated programs list board members as users or beneficiaries of FDA as compared with only 58% for the others.
Five success factors for FDA integrationTo build a successful FDA program and progress toward integrating all four quadrants in the FDA maturity model, while achieving a positive return on investment (ROI), companies should consider the following five success factors:
1. Focus on the low-hanging fruit: the priority of the initial project matters
► Start with the “low-hanging fruit” — since the first project normally incurs the largest cost associated with setting up the analytics infrastructure, it is important that the first project yields tangible recoveries.
2. Go beyond the “rule-based,” descriptive analytics ► One of the key goals of FDA is to increase the detection rate of noncompliance
while reducing the risk of false positives.
► From a technology perspective, companies need to move beyond rule-based spreadsheets and database applications and embrace both structured and unstructured data sources that consider the use of data visualization, text-mining and statistical analysis tools.
► Big data technologies such as Hadoop are promising technologies to help companies address expanding data volume, velocity and variety challenges associated with FDA.
Secure the buy-in, execute the build
“ It is always exciting to see companies reap the benefits from deploying compliance programs that leverage forensic data analytics to mine big data. Yet far too few companies have access to such insights. As our survey research makes clear, there is much work to be done to raise awareness and adoption of these enhanced technologies.”
Vincent Walden, Forensic Technology & Discovery Services, FIDS US

30
Big risks require big data thinkingGlobal Forensic Data Analytics Survey 2014
3. Communicate: share information on early successes across departments and business units to gain broad business support
► Once validated, success stories will generate internal demand for your FDA program.
► Involve a multidisciplinary team, including information technology (IT), business users (i.e., end-users of the analytics) and functional specialists (i.e., those involved in the design of the analytics and day-to-day operations of the FDA program).
► Communicate across multiple departments, keeping key stakeholders updated on your FDA progress under a defined governance program.
► Don’t just seek to report the noncompliance: seek to improve the business.
► Obtain investment incrementally based on success, not the entire enterprise all at once.
4. Leadership support gets it funded, but interpretation of the results by experienced or trained professionals on a regular basis makes the program successful
► Keep the analytics simple and intuitive — don’t cram too much information in one report.
► Invest in automation, not manual refreshes, to make it sustainable.
► Invest in both developing and acquiring professionals with the skill sets required to sustain and leverage your FDA efforts over the long-term.
5. Enterprise-wide deployment takes time; don’t expect overnight adoption
► Analytics integration is a journey, not a destination.
► While quick-hit projects may take four to six weeks, the program and integration will take one to two years, or more.
► Programs need to be refreshed as new risks and business activities change.
Companies need to look at a broader set of risks, incorporate more data sources, use better tools (move away from just end-user, desktop tools) and move to real-time or near-real time analysis and increase data volumes. By embracing these potential areas for improvement, organizations should deliver a more effective and efficient compliance program that is highly focused on the key fraud risk areas, and see improved quality and ROI.

31
Big risks require big data thinkingGlobal Forensic Data Analytics Survey 2014
Between November 2013 and January 2014, researchers from Consensus, a global market research agency, conducted 466 interviews across 11 countries with organizations actively using FDA. Respondents had to be the decision maker responsible for their company’s anti-fraud and anti-corruption program. A breakdown of these survey respondents is as follows:
Survey approach
Industry Interviews
Financial services 107
Consumer products 93
Life sciences 54
Oil and gas 49
Power and utilities 47
Transportation 33
Manufacturing 31
Mining 29
Technology, communications and entertainment 23
Geographic location Interviews
Australia 40
Brazil 40
China (including Hong Kong SAR) 40
France 40
Germany 41
India 40
Italy 40
Japan 40
Singapore 40
UK 40
US 65
Job title Interviews
Head of internal audit/CRO 126
Other audit/risk 65
Other finance 58
Head of compliance 46
CFO/FD 38
Head of legal 31
Financial controller 27
CEO/COO/CIO 18
Head of business unit/division 17
Head of investigations 7
Head of security 5
Company secretary 2
Other management staff 26
Revenue Interviews
More than US$5b 104
US$1b—US$5b 155
US$500m—US$1b 42
US$100m—US$500m 165
Above US$1b 259
Below US$1b 207

32
Big risks require big data thinkingGlobal Forensic Data Analytics Survey 2014
The following FIDS professionals contributed to this research and are available for comments:
Contact Name Telephone
Global FIDS Leader David Stulb +44 20 7951 2456
Global FIDS FTDS Leader David Remnitz +1 212 773 1311
Area FIDS Leaders
Americas Brian Loughman +1 212 773 5343
EMEIA David Stulb +44 20 7951 2456
Asia-Pacific Chris Fordham +852 2846 9008
Japan Ken Arahari +81 3 3503 2510
FDA subject-matter resources
Australia Warren Dunn +61 2 9248 5062
Belgium Frank Staelens +32 0 496 574924
Brazil Marlon Jabbur + 55 11 2573 3554
China/Singapore Jack Jia +852 2846 9002
France Olivier Mesnard +33 1 46 93 67 62
Germany Ingolf Mollat +49 211 9352 13259
India Mukul Shrivastava
Anil Kona
+91 22 6192 2777
+91 80 6727 5500
Italy Gerardo Costabile +39 3771 666 666
Japan Hiroyuki Kaiyama +81 3 3503 3292
United Kingdom Paul Walker +44 20 7951 6935
United States Vincent Walden +1 212 773 3643
Contact information

33
Big risks require big data thinkingGlobal Forensic Data Analytics Survey 2014

EY | Assurance | Tax | Transactions | Advisory
About EYEY is a global leader in assurance, tax, transaction and advisory services. The insights and quality services we deliver help build trust and confidence in the capital markets and in economies the world over. We develop outstanding leaders who team to deliver on our promises to all of our stakeholders. In so doing, we play a critical role in building a better working world for our people, for our clients and for our communities.
EY refers to the global organization, and may refer to one or more, of the member firms of Ernst & Young Global Limited, each of which is a separate legal entity. Ernst & Young Global Limited, a UK company limited by guarantee, does not provide services to clients. For more information about our organization, please visit ey.com.
About EY’s Fraud Investigation & Dispute ServicesDealing with complex issues of fraud, regulatory compliance and business disputes can detract from efforts to succeed. Better management of fraud risk and compliance exposure is a critical business priority — no matter the industry sector. With our more than 2,500 fraud investigation and dispute professionals around the world, we assemble the right multidisciplinary and culturally aligned team to work with you and your legal advisors. And we work to give you the benefit of our broad sector experience, our deep subject matter knowledge and the latest insights from our work worldwide.
© 2014 EYGM Limited All Rights Reserved. SCORE no. DQ0037 ED None
In line with EY’s commitment to minimize its impact on the environment, this document has been printed on paper with a high recycled content.
This material has been prepared for general informational purposes only and is not intended to be relied upon as accounting, tax, or other professional advice. Please refer to your advisors for specific advice.
The views of third parties set out in this publication are not necessarily the views of the global EY organization or its member firms. Moreover, they should be seen in the context of the time they were made.
ey.com/fids