Big Data - USENIX: The Advanced Computing Systems...
46
4/25/98 page 1 John R. Mashey Chief Scientist, SGI Big Data ... and the Next Wave of InfraStress Technology Waves: NOT technology for technology’s sake IT’S WHAT YOU DO WITH IT But if you don’t understand the trends IT’S WHAT IT WILL DO TO YOU Uh-oh! OK!
Transcript of Big Data - USENIX: The Advanced Computing Systems...

4/25/98 page 1
John R. MasheyChief Scientist, SG I
Big Data ... and the Next Wave of InfraStres s
Technology Waves:NOT technology for technology’s sak e
IT’S WHAT YOU DO WITH ITBut if you don’t understand the trends
IT’S WHAT IT WILL DO TO YOUUh−oh!
OK!

4/25/98 page 2
Big DataAnd The Next Wave of InfraStress
General references: John Hennessy, David A Patterson, Computer Architecture: A Quantitiative Approach,Second Edition, Morgan Kaufmann, San Francisco, 1996. ISBN 1−55860−329−8. Also, Computer Organization and Design, Morgan Kaufmann, San Francisco, 1994, ISBN 1−55860−281−X.Also, thanks to Glenn Stettler of SGI, "Disk Drive Futures", 1/20/99.
1. Big data: storage growing bigger faster DRAM: 1.6X/year (4X/3 years) continues
Disk density: 1.3X/year CAGR: historical trendline1.6X/year since ~19902.0X/year leap ~1998/1999
2. Net continues raising user expectationsMore data (image, graphics, models)(Some) more difficult data (audio, video)Pressure on net, especially last mile
=> Explosion of WIDELY−accessible dataCreate, understand, store, move ... or else ...Drown in Wave of Infra structure Stress

4/25/98 page 3
InfraStress= Infra structure Stress
in.fra .stress . n.1. Bad effects of faster change in computer
subsystems & usage :CPUs, memory, disks, demand ...
than in underlying infrastructure:bandwidths, addressability & naming,scalability of interconnect,operating systems, file systems, backup ...
Symptoms: bottlenecks, odd limits, workarounds,instability, unpredictability, nonlinear surprise,over−frequent releases, multiple versions,
hardware obsolete before depreciated
2. In organizations that grow quickly, stress onmanagement and support infrastructure.

4/25/98 page 4
InterNetInterNet
PublicPublic
IntraNet
#1 Have data, cannot find & understand it insight <− data#2 Cannot create data from outside creativity −> data#3 Cannot have/process data, system limits (data)
Server always needs (30%?) headroom power#4 Have the data, but in wrong place/form data <−> data
Internal interconnect; network; firewalls unleash#X Rapid change, surprise amplify all 4 DATA problems
Data distribution more troublesome than CPU distribution
Partners, customersPartners, customers
EmployeesEmployees
#4#1#1
#2#2 #3#3
Environment:4*X Data Problems
#XLAN WAN

4/25/98 page 5
Family bakery in Yorkshire + Website=> suddenly begin selling outside UK.
Predict this?
No ... just predict change & surprise.But, some technology predictions easier...
Hidden flag
http://www.botham.co.uk
4/25/98 page 6
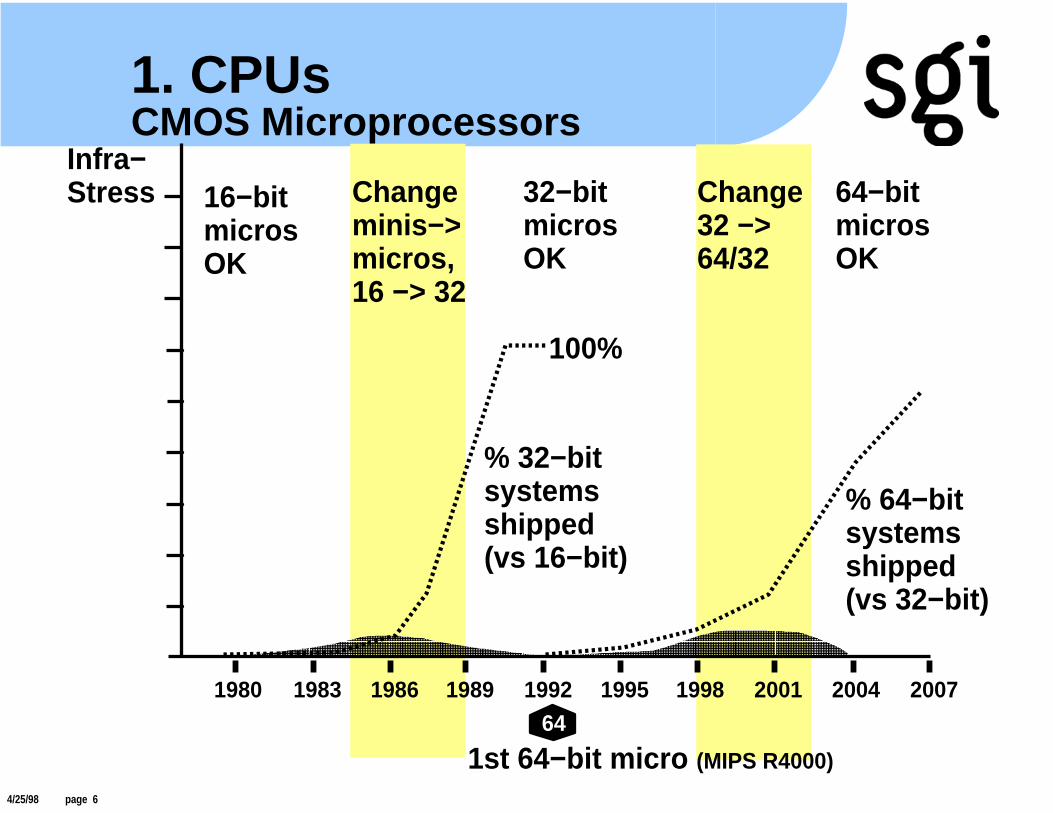
1. CPUs CMOS Microprocessors
1980 1983 1986 1989 1992 1995 1998 2001 2004 200764
????????????????????????????????????????????????????????????????????????????????????????????????????????????????????????????????????????????????
Changeminis−>micros,16 −> 32
Change32 −>64/32
Infra−Stress 32−bit
microsOK
1st 64−bit micro (MIPS R4000)
100%
% 32−bitsystemsshipped(vs 16−bit)
% 64−bitsystemsshipped(vs 32−bit)
64−bitmicrosOK
16−bitmicrosOK

4/25/98 page 7
2. Big Memory & Micros
1980 1983 1986 1989 1992 1995 1998 2001 2004 2007
Infra−Stress
@@@@@@@@@@@@@@@@@@@@@@@@@@@@@@@@@@@@@@@@@@@@@@@@@@@@@@@@@@@@@@@@@@@@@@@@
PCs:640Kpainful limit1MB hack...
large servers> 4GB useful
large servers:<4GB limit painful
Change32 −>64/32
16−bitmicrosOK
32−bit microsOK
64−bit microsOK
Changeminis−>micros,16 −> 32

4/25/98 page 8
BIG NET:The Net, WWW
3. Big Net
1980 1983 1986 1989 1992 1995 1998 2001 2004 2007
BIG NET:The Net, WWW
NetworksOrganizationsProcedures
Infra−Stress Everybody knows
this one!
Note: does not meaneffects stop, just thatmost organizationswill haveWeb−izedoperationsby 2002.

4/25/98 page 9
4. Bigger (Disk) Data
1980 1983 1986 1989 1992 1995 1998 2001 2004 2007
BIGGER DATA3.5" disk density
Disk file systemsBackupsI/O systems
Infra−Stress
http://www.quantum.com/src/history, http://www.disktrend.comhttp://www.ibm.com/storage/microdrive: 340MB Microdrive, 1999. 1.7"x1.4"x.19"
Many mustrewritecriticalsoftware
1.3X 1.6X 2X

4/25/98 page 1 0
@@@@@@@@@@@@@@@@@@@@@@@@@@@@@@@@@@@@@@@@@@@@@@@@@@@@@@@@@@@@@@@@@@@@@@@@@@@@@@@@@@@@@@@@@@@@@@@@@@@@@@@@@@@@@@@@@@@@@@@@@@@@@@@@@@@@@@@@@@@@@@@@@@@@@@@@@@@@@@@@@@@@@@@@@@@@@@@@@@@@@@@@@@@@@@@@@@@@@@@@@@@@@@@@@@@@@@@@@@@@@@@@@@@@@@@@@@@@@@@@@@@@@@@@@@@@@@@@@@@@@@@@@@@@@@
5. HUGE Data (Maybe)Storage Hierarchy
1980 1983 1986 1989 1992 1995 1998 2001 2004 2007
1) Tapes, near−line storage
2) Laser−enhanced magneticsfor removables, maybe fixed disks10X: TeraStorNFR: "Near−Field Recording"
5.25", removable, 2400 RPM, 18ms2Q99: 10GB, 6 MB/sec, <$8004Q99: 20GB, 11 MB/sec, <$1200?? : 40GB, 2−sided
3−5X: Quinta (Seagate), demo 11/98OAW: Optically assisted Winchester
~1999: Laser=enhanced magnetic disks (removable)http://www.quinta.com, http://www.terastor.com
Like bigger,but worse
Infra−Stress

4/25/98 page 1 1
3. BIG NET: The Net, WWW
@@@@@@@@@@@@@@@@@@@@@@@@@@@@@@@@@@@@@@@@@@@@@@@@@@@@@@@@@@@@@@@@@@@@@@@@@@@@@@@@@@@@@@@@@@@@@@@@@@@@@@@@@@@@@@@@@@@@@@@@@@@@@@@@@@@@@@@@@@@@@@@@@@@@@@@@@@@@@@@@@@@@@@@@@@@@@@@@@@@@@@@@@@@@@@@@@@@@@@@@@@@@@@@@@@@@@@@@@@@@@@@@@@@@@@@@@@@@@@@@@@@@@@@@@@@@@@@@@@@@@@@@@@@@@@
InfraStress Addup
1980 1983 1986 1989 1992 1995 1998 2001 2004 2007
1. CPUS: Microprocessors 32 −> 64
4. BIGGER DATA:1.3X −> 1.6X −> 2X
3. BIG NET: The Net, WWW
5. HUGE DATA: Storage hierarchy
2. BIG MEMORY: DRAM vs 32−bit
????????????????????????????????????????????????????????????????????????
Infra−Stress
Infra−Stress

4/25/98 page 1 2
Technology Change RatesExample: Large Server*
0 3 6
YearsH/W chassis 4..6Interconnects I/O bus (PCI...) 4−6+ CPU==mem 3−5 Backplane 3−5 Network variesSubsystems CPU MHz .75−1.5 4X DRAM 3 Disks 1 Graphics 1.5−2.5Software File system 8−10 OS release 1−2 App release 1−2Data forever Media not long
Large Server
Years
# Revisions in 6 years0
0−(1)0−(1)01−2
4−82−(3)6
0−12−62−6
*Desktops &other access devicescycle faster, maybe

4/25/98 page 1 3
Technology Trends
Capacities − Great News
Latencies − Not−so−great News
Bandwidths − InfraStress
Interactions − Surprises
Tradeoffs − keep changing

4/25/98 page 1 4
1"x 3.5" Disk Capacity
20 GB
0 GB
10 GB
30 GB
40 GB
50 GB
60 GB
1980 1983 1986 1989 1992 1995 1998 2001
These are 1" (LP)drives only.
1.6" (HH) driveshave highercapacity,(36−50GBavailable 1Q99).
2004 2007
Capacity
70 GB
80 GB
90 GB
72
"Fear is notan option ..."
1.3X
"Disks are binary devices ... new and full"
>4X / 3 years
1 4.5.59
Traditionaldisk densitygrowth
16.8*
*IBM Desktap 16GP, Giant Magnetoresistive heads (GMR), 4Q97.
18
36
1.6X 2X
1.3X
1.6X
4/25/98 page 1 5
0
− 20
− 40
− 60
− 80
−100
Linear scale
1 416
64
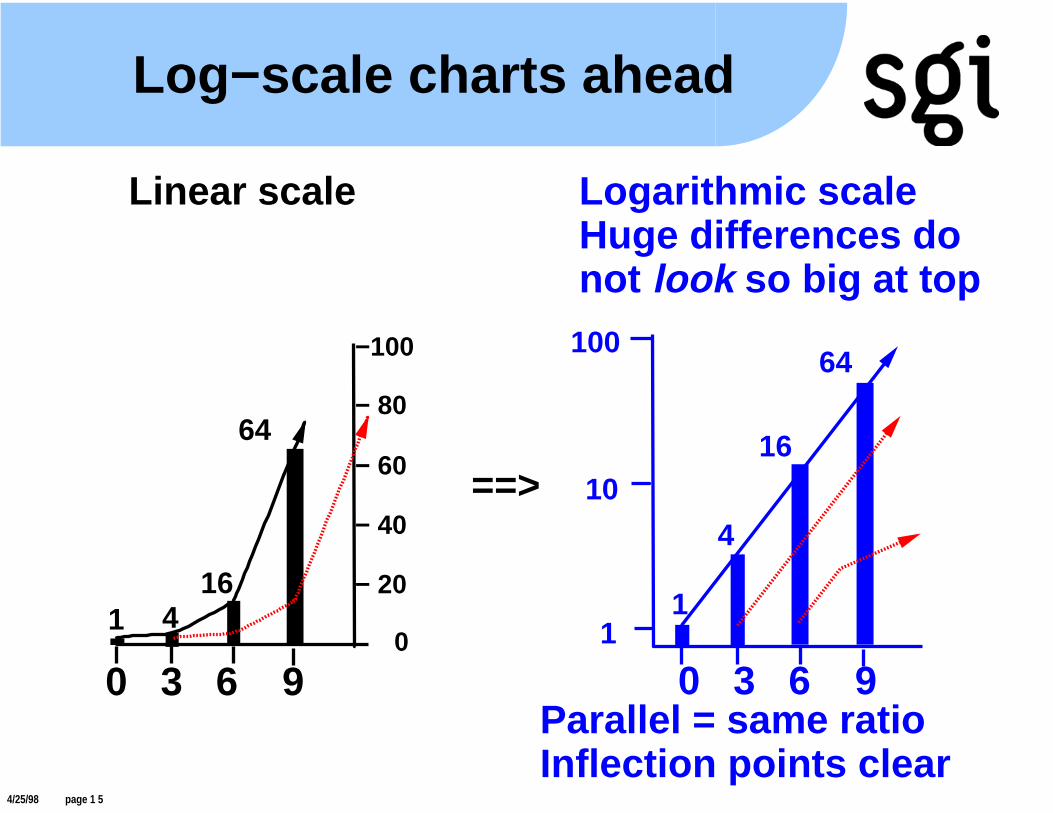
Log−scale charts ahead
100
10
1
Logarithmic scaleHuge differences donot look so big at top
1
4
16
64
==>
0 3 6 9 0 3 6 9Parallel = same ratioInflection points clear

4/25/98 page 1 6
DRAM Capacity: 1.6X CAGR4X / 3 years
100 KB
1 KB
10 KB
1 MB
10 MB
100 MB
1 GB
1980 1983 1986 1989 1992 1995 1998 2001
1 DRAM:Bytes/chip
2004 2007
"1Gb""256Mb"
"64Mb""16Mb"
Capacity
10 GB
100 GB
1 TB
"4Gb"??
See: John R. Mashey, "64−bit Computing", BYTE, September 1991, 135−141.
Total DRAM:actually sold,1−rack system
4GB
6464
1Q92: 1st 64−bit micro 4Q94: technical use
64 T64
MIPS M/50032MB
Power Series 256MBChallenge 2GB
Power Challenge 16GBOrigin2000 (1 Rack) 32GB
Big T3E ~220GBMulti−rack Origin2000 128GB
Supers

4/25/98 page 1 7
Disk Capacity:1.3X −> 1.6X −> 2X
100 KB
1 KB
10 KB
1 MB
10 MB
100 MB
1 GB
1980 1983 1986 1989 1992 1995 1998 2001
1"X 3.5" DiskBytes/disk
14.5
18
2004 2007
1Gb256Mb
64Mb16Mb
Capacity
10 GB
100 GB
1 TB
4Gb??
72144?
.5Historicaltrend1.3X
1 Disk ~=300−500 DRAMs
See: John R. Mashey, Darryl Ramm, "Databases on RISC: still The Future",UNIX Review, September 1996, 47−54.
DRAMBytes/chip
369

4/25/98 page 1 8
3.5" Disk Review
Height (1" or 1.6") X (4" X 5.75")Capacity (1MB = 1,000,000 B)Seek Times (msecs)
Track−to−track (Read/Write)Average (Read/Write) Typical < Average (OS & controllers)Maximum (Read/Write)
Rotational latency (msecs)Average Latency = .5 * rev = 30000/RPM
Bandwidths (MB/sec)Internal Formatted TransferZBR rangeExternal Rate (Bus)
Density (Gbit/sq inch)See:http://www.quantum.com/src/basic_resourcesSee "Disk Performance Background for Tables/Graphs", SGI internal, Radek Aster, Jeremey Higdon, Carl Rigg, June 27, 1997.
Controller
4/25/98 page 1 9
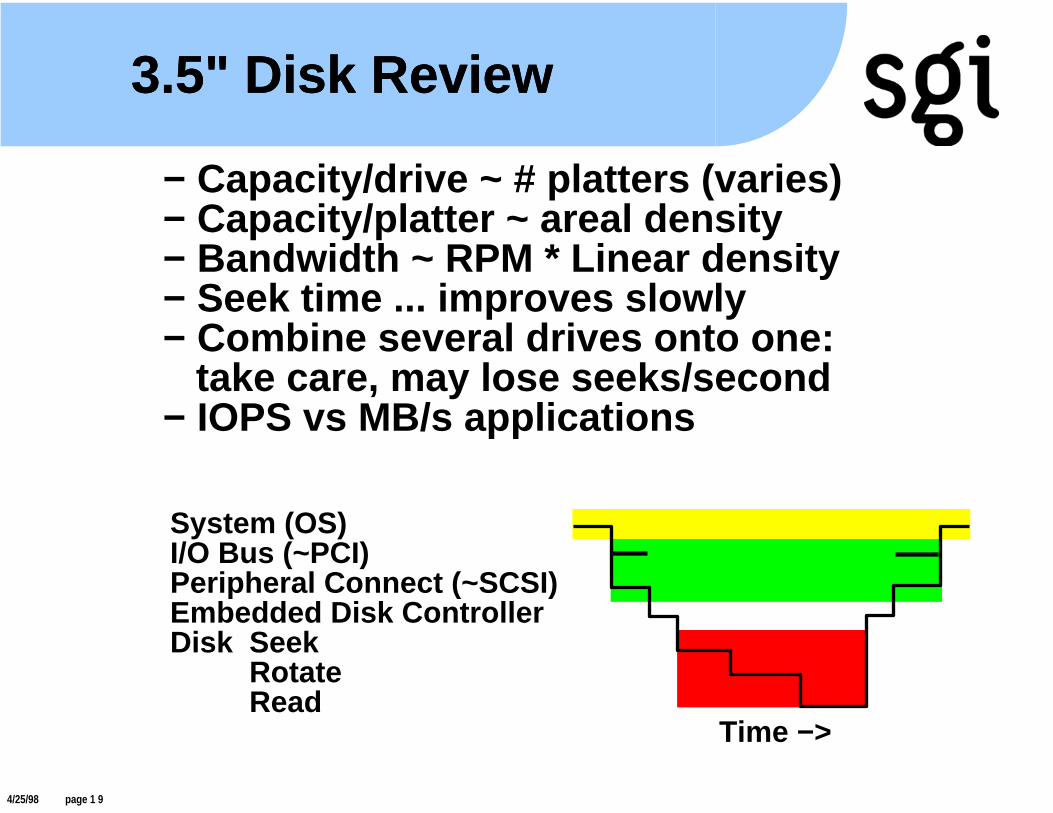
− Capacity/drive ~ # platters (varies)− Capacity/platter ~ areal density− Bandwidth ~ RPM * Linear density− Seek time ... improves slowly− Combine several drives onto one: take care, may lose seeks/second− IOPS vs MB/s applications
3.5" Disk Review3.5" Disk Review
System (OS)I/O Bus (~PCI)Peripheral Connect (~SCSI)Embedded Disk ControllerDisk Seek
RotateRead
Time −>

4/25/98 page 2 0
Common Disk Types
1. By capacityA. Large (1.6" x 3.5", HH) ~8−10 plattersB. Medium (1" X 3.5", LP), ~4−5 plattersC. "Depopulated", 1 platterD. Smaller platters ...E. "Microdrive", 1 small platter
2. By target− High−performance (B: high RPM)− High−capacity (A)− By IOPs (multiples of C & D)− By cost [ATA, IDE versions of A, B, C]− By physical size (mobile, consumer)Bad
Huge disks => long backup timesGood for archive−like applications

4/25/98 page 2 1
Storage Densities
1980 1983 1986 1989 1992 1995 1998 2001 2004 2007
100 Mb
1 Gb
Density/in 2
10 Gb
100 Gb
1 Tb
.660−.981 Gb/in 21.0−1.5 Gb/in 2
2.0−2.8 Gb/in 2
40−70 Gb/in 2
super−paramagneticlimit
GMR: 2.4−2.6 (1997)10 (2001), 40 (2004)
10 Tb
100 Tb
300 Gb/in 2Atomic Forcemicroscope(?)
10,000,000 BillionAtoms/in2
1,000 Tb
10,000 Tb
45 Gb/in 2 AF demo
.129 Gb/in 2: Tape: DDS−3
1 TB/in 3Tape density
See: Merrit E. Jones, The MITRE Corp, "The Limits That Await Us", THIC Meeting April 23, 1997, Falls Church, Va.See http://www.terastor.com on Near−field recording.
Near−field recording
"IBM and other vendors, universities, and the government are working on a holographicstorage system they say will achieve 100Gb per square inch and data transfer rates of30Mb per second by November 1998. Future targets are 100Gb per square inch and100Mb per second data rates by January 1999, and 100Gb per square inch and 1Gb per second transfer by April 1999.
OptiTek, in Mountain View, Calif., is developing holography products, promising 5.25disk capacities of 100GB with cartridges backward−compatible to current automated libraries.The company will release evaluation models in the second half of 1999,and plans to release "write−once" products for use in archiving applications by early 2000."
InfoWorld Electric, "When Data Explodes", http://www.idg.net

4/25/98 page 2 2
Disk IssuesWorkloads Converge
"IOPS" − Transaction / seeks/secondClassic OLTP, small blocks
"MB/s" − Bandwidth (& backup!)Classic technical, larger blocks
Some commercial now more like technical
ClassicTechnical
Classic Commercial
Gflops tpms other
Silicon Graphics
Big Data

4/25/98 page 2 3
Disk Issues − Implications
1. Huge capacity leap breaks old filesystems Hard limits (2GB, 8GB, etc) OR
Algorithmic performance, scaling issues
2. More memory, more bandwidth, everywhereSmall disk blocks even less efficient=> 64−bit addressing more useful=> Big pages, map more pages, MMUs=> More memory => more bandwidth=> More interconnect bandwidth
3. BACKUP ...Must run many tapes, full−speed, parallelSometimes use HSM, RAID, mirrorNew cartridge disks may be useful

4/25/98 page 2 4
Disk Rotational LatenciesHigh−performance − 1/2 Rotation
100 Khz
1 KHz
10 KHz
1 MHz
10 MHz
100 MHz
1 GHz
1980 1983 1986 1989 1992 1995 1998 2001 2004 2007
Clock
1 ns
10 ns
100 ns
1 mics
10 mics
100 mics
1 msec
100 Hz
10 Hz
10 msec
4.17 3.0
8.3 msec
Money can buy bandwidth, but latency is forever.
5.55
3600RPM
5400 7200 10000
Faster rotation ~ 2−3 yearsAverage Latency = .5 * (60/RPM)
1500020000
1.52.0
Platters shrink

4/25/98 page 2 5
Disk Average SeekHigh−performance disks
100 Khz
1 KHz
10 KHz
1 MHz
10 MHz
100 MHz
1 GHz
1980 1983 1986 1989 1992 1995 1998 2001 2004 2007
Clock
1 ns
10 ns
100 ns
1 mics
10 mics
100 mics
1 msec
100 Hz
10 Hz
10 msec
4.17 3.0
8.3 msec 5.55
Faster rotation ~ 2−3 yearsAverage Latency = .5 * (60/RPM)
1/2 Rotation faster than average seek ...But of course, short seeks are faster
Short random blocks dominated by seekLarge blocks dominated by transfer time
1.52.0
16 msec 15 14 12 9 8 6 5 4
1/2 RotationAvg Seek
Avg Seek
4/25/98 page 2 6
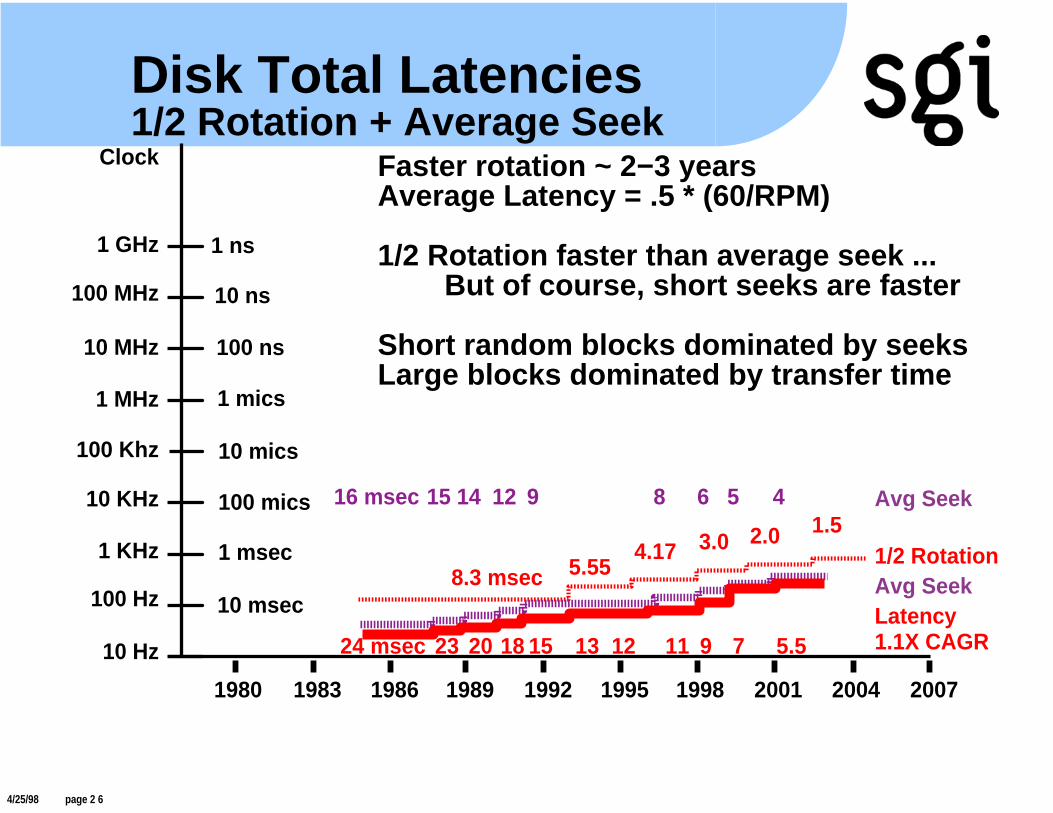
Disk Total Latencies1/2 Rotation + Average Seek
100 Khz
1 KHz
10 KHz
1 MHz
10 MHz
100 MHz
1 GHz
1980 1983 1986 1989 1992 1995 1998 2001 2004 2007
Clock
1 ns
10 ns
100 ns
1 mics
10 mics
100 mics
1 msec
100 Hz
10 Hz
10 msec
4.17 3.0
8.3 msec 5.55
Faster rotation ~ 2−3 yearsAverage Latency = .5 * (60/RPM)
1/2 Rotation faster than average seek ...But of course, short seeks are faster
Short random blocks dominated by seeksLarge blocks dominated by transfer time
1.52.01/2 RotationAvg Seek
24 msec 23 20 18 15 13 12 11 9 7 5.5Latency1.1X CAGR
16 msec 15 14 12 9 8 6 5 4 Avg Seek

4/25/98 page 2 7
CPU Latency, Performance
100 Khz
1 KHz
10 KHz
1 MHz
10 MHz
100 MHz
1 GHz
1980 1983 1986 1989 1992 1995 1998 2001 2004 2007
Clock
1 ns
10 ns
100 ns
1 mics
10 mics
100 mics
1 msec
100 Hz
10 Hz
10 msec
CPU cycle1.4X CAGRRaw DRAM1.1X CAGR125ns
4 ns
120ns
60ns
CPU perform1.4X−1.6X
10ns
Upper edge = raw DRAM access timeLower edge = lean memory system,
including overhead, for acual load2000: 40ns nominal −> 150ns+
80ns100ns
40ns
1 ns10 GHz .1 ns
Effective instruction latency =DRAM ... CPU cycle/peak issue
CPU:DRAM: 40X (cycle) 100X (real) 400X (instrs)Soon:1000X (instrs)
40ns

4/25/98 page 2 8
Latency & Performance
100 Khz
1 KHz
10 KHz
1 MHz
10 MHz
100 MHz
1 GHz
1980 1983 1986 1989 1992 1995 1998 2001 2004 2007
Clock
1 ns
10 ns
100 ns
1 mics
10 mics
100 mics
1 msec
100 Hz
10 Hz
10 msec
125ns
4 ns
120ns
60ns
Humans1X/ ...
10ns
Lower edge = memory system
80ns100ns
40ns
Disk latency1.1X CAGR
CPU:Disk>5M instrs now>30M soon
1 ns
24 msec 23 20 18 15 13 12 11 9 7 5.5
Effective instruction latency =DRAM ... CPU cycle/peak issue10 GHz .1 ns
Raw DRAM1.1X CAGRCPU:DRAM1000X (insts)
40ns
CPU cycle1.4X CAGR
CPU perform1.4X−1.6X
CPU:Disk:1986200K instrs

4/25/98 page 2 9
Latencies − Implications
1. CPU <−> DRAM <−> diskLatency ratios already bad, getting worse."Money can buy bandwidth, but latency is forever."
==> More latency tolerance in CPUs==> Trade (bandwidth, memory, CPU,
PROGRAMMING) for latency==> Already worth 1M instruction
to avoid a disk I/O
2. RDBMS huge buffer areas for indices,small tables, to avoid latency
3. Networks: be alert for latency issues

4/25/98 page 3 0
"I/O certainly has been lagging in the last decade." Seymour Cray
Public Lecture (1976)
"Also, I/O needs a lot of work."David KuckKeynote Address, 15th Annual Symposiumon Computer Architecture (1988)
"Input/output has been the orphan of computer architecture ... I/O’s revenge is at hand"
David A. Patterson, John. L. HennessyComputer Architecture: A Quantitative Approach,2nd Ed (1996), Morgan Kaufmann.
.
Input/Output: A Sad History

4/25/98 page 3 1
I/O Single−Channel Bandwidth
1980 1983 1986 1989 1992 1995 1998 2001 2004 2007
0.1
1
10
0.001
100
GB/sec1000
0.01 10 MBs
1MBs
100 MBs
EISA(.033 p)
Indigo,GIO32 [.1]
Indigo2, IndyGIO64 [.2]
PCI32[.1]
PCI64 [.2]
XIO (4Q96)[1.2 GB/s (2X .64)]
ISA(.007 p)
SunSBUS64[.1]
4X/3
PCI64−66 [.4]
I/O Busses fallingbehind 4X/3 growth,need faster I/O
GigaRing

4/25/98 page 3 2
Bus−Based SMPBandwidth Wall
1980 1983 1986 1989 1992 1995 1998 2001 2004 2007
0.1
1
10
0.001
100
GB/sec1000
0.01 10 MBs
1MBs
100 MBs
SGI PowerSeries 4Q88 (.064)
SGI Challenge1Q93 (1.22)
Sequent HighlyScalable Bus1994, (.107, [.240 p])
Sequent Bus4Q87 (.053)
Intel SHV2Q96, (.534p)
DEC 84002Q95 (1.6)
Sun SC2000 2Q93, (.5)
Sun UE X0002Q96 (2.5)
4X/3
Data gap,big,growing
−2.5 GB/s2X / 3 growth,slowing
SMP Bus,Memory, Total I/O
SMP Busses fallingbehind 4X/3 growth,need change
Laws ofphysics ...are laws ...

4/25/98 page 3 3
Bandwidths (ccNUMA, XBAR)
1980 1983 1986 1989 1992 1995 1998 2001 2004 2007
0.1
1
10
0.001
100
GB/sec1000
0.01 10 MBs
1MBs
100 MBs
128p Origin, Onyx2:up to80GB/s I/O40 GB/s memory,20 GB/s Bisection
1 XIO, 1.28 GB/s
1p
128p
Origin200PCI64,.2 GB/s
I/O BusBandwidth
SMP BusBandwidth
Why ccNUMA?A: Central XBAR $$.
4X/3
Start smallBuy incrementallyScale big

4/25/98 page 3 4
LAN, Interconnect Bandwidths
1980 1983 1986 1989 1992 1995 1998 2001 2004 2007
0.1
1
10
0.001
100
GB/sec1000
0.01 10 MBs
1MBs
100 MBs
4X/3
Ethernet100BT
Ethernet1000BT
Ethernet10BT
HIPPI800
ATMOC3
ATMOC12
GigabyteSystemNetwork (GSN)
High−endSMP busbandwidth
Networks improvingfaster than SMP Bus& I/O Busses
Networksmustimprove tostay aheadof disks
OriginccNUMAI/O
1000BTcomingfaster

4/25/98 page 3 5
Beyond the LAN(Different Scale!)
1980 1983 1986 1989 1992 1995 1998 2001 2004 2007
0.1
1
0.001
0.01 10 MBs
1MBs
Ethernet100BT
Ethernet1000BT
Ethernet10BT
HIPPI800
ATMOC3
ATMOC12
GigabyteSystemNetwork (GSN)
1 GBs
0.0001
0.00001
0.000001
100 KBs
10 KBs
1 KBs
28.8Kbs Modem (3.6 KBs)
56Kbs Modem (7 KBs)
3Mbs Cable Modem (375 KBs)
T1, 1.544 Mbs
ISDN (128Kb, 16 KBs)
All these are theoretical peaks,reality = less
T3, 43.2 Mbs, 5.4 MBs
DS−4, 274 Mbs Mbs
*DSL, 2 Mbs − 7 Mbs

4/25/98 page 3 6
Disk Bandwidths (Highest)
1980 1983 1986 1989 1992 1995 1998 2001 2004 2007
0.1
1
10
0.001
100
GB/sec1000
0.01 10 MBs
1MBs
100 MBs
1998 − 9GB, 7200 RPM, 13 MB/s 10000 RPM , 15 MB/s
2001: Guess 40 MB/s
1234
Bandwidth/1 disk
Striped Bandwidth/4 disks3 disks2 disks
1999 − 18GB,10000 RPM, 28 MB/s
1"X 3.5" DiskBytes/disk

4/25/98 page 3 7
Fast Disk Bandwidth vs Peripheral Connections
1980 1983 1986 1989 1992 1995 1998 2001 2004 2007
0.1
1
10
0.001
100
GB/sec1000
0.01 10 MBs
1MBs
100 MBs100 FC100
40 SCSI F20W 20 FW SCSI 10 F SCSI
80 SCSI LV
# 10MB/s FW SCSI F20W FC100Disks 20 MB/s 40 MB/s 100 MB/s1 10 10 102 18* 20 203 * 30 304 * 32* 40... ... ... ...10 * * 95** Already saturated on bandwidth tasks,like backup or striped−disk I/O.
PeripheralConnectionsMB/s
10 MB/s
40 MB/s28 MB/s
1234
Bandwidth/1 disk
4 disks3 disks2 disks
xx
x
Disk bandwidth growthoverpowers peripheralconnection growth!
160 SCSI200 FC200
xxx = 4 disks exhaustbus in bandwidth apps

4/25/98 page 3 8
Fast Disk Bandwidth vs Networks & Peripheral Connections
1980 1983 1986 1989 1992 1995 1998 2001 2004 2007
0.1
1
10
0.001
100
GB/sec1000
0.01 10 MBs
1MBs
100 MBs
Bandwidth/1 disk
10 MB/s
40 MB/s15 MB/s
Ethernet 1000BaseT
Ethernet 100BaseT
Ethernet 10BaseT
GSN
10BaseT = .1 1997 fast disks (bottleneck100BaseT = 1 1997 fast disk1000BaseT = 2 2001 fast disks (2 X 40 MBs)
= 1 2001 dual−head fast disk (80 MBs)GSN = many disks, still not enough for all!
100 FC100
40 SCSI F20W 20 FW SCSI 10 F SCSI
80 SCSI LV
PeripheralConnectionsMB/s
1234
x
x
Theoretical ... reality much less

4/25/98 page 3 9
Bandwidths − Summary
1980 1983 1986 1989 1992 1995 1998 2001 2004 2007
0.1
1
10
0.001
100
GB/sec1000
0.01 10 MBs
1MBs
100 MBs
4X/3
High−endSMP busbandwidth
1 I/O busbandwidth
Networkbandwidth
Networks and diskspressure on I/O Busand SMP Bus
1234
Diskbandwidth
DisksInfraStress on networks
Disks + networks InfraStress on I/O bus
Disks + nets + memory InfraStress on SMP bus
OriginccNUMAI/O

4/25/98 page 4 0
Bandwidths − Implications
1. SMP Busses not growing with 4X/3Interconnect and memory bandwidth limits==> Crossbars
Centralized (mainframe)Distributed (ccNUMA)
2. Some I/O busses, peripheral connects,and especially networks under pressureto keep up with disk bandwidth
3. Disks are faster than tapes ... backup?
4. SANs for bandwidth and latency

4/25/98 page 4 1
Interactions: Distributed Data
Shape of solution driven by shape of hardware?"Natural" distribution of work: cost−effective"Unnatural" data distribution: very painful
High bandwidth, low latency, or else...
Better: make hardware match shape of problem
Problem Shape Solution Shape?
Good Fit(technology)
Centralize(allocation)
Decentralize(partitioning,
administration)
growth??

4/25/98 page 4 2
BusSMPMemorySystems
Interactions:Bandwidths vs Latencies
0.1
1
10
0.001
100
GB/sec1000
0.01 10 MBs
1MBs
100 MBs
1ns 10ns 100ns 1us 10us 100us 1ms 10ms 100ms 1sec 10 sec 100 sec 1000 10000 sec
.001us .01us .1us 1us 10us 100us 1000us 10000 100000 1M 10M 100M 1B 10B usLatency
− ATM OC3 (90% eff)(.0155)− FDDI (95% eficiency) (.012)
− Ethernet (90% eff) (.001)
− HIPPI, 32−bit (.09, [.1])− ATM OC12 (90% eff) (.062)
−
General Networks
Disk I/O
IBM SP2 Switch.036 GB/s, 39us 1−way.048 GB/s full−duplex[.1 GB/s] MPI
DedicatedSwitch/Network,Clustering
− DEC 8400 [1.6]
Faster
Cheaper
− CRAY T932
− SHV [.5]
Origin
SequentNUMA−Q
Practicalshared−memory
DEC Mem Channel.035−.060 [.1 total]2.9us 1 way best
ServerNet 12X.04 = .083+ .3 per hopS.N.2 = 2.5X
128
1
Typical time to readentire 1" x 3.5" disk
UE1000016..64
− Sun UltraSMP [2.5]
− HIPPI−6400, .8
High−bandwidth,low−latency =>"never having tosay you’re sorry"

4/25/98 page 4 3
Interactions:Disk Technology Trends
CapacitiesGrow very fast
LatenciesBarely improve for small blocksImprove moderately for large blocks
BandwidthsImprove, but not so fast as capacityCapacity/bandwidth ratios get worsePressure −> more smaller disks
Interactions100BaseT, PCI32, F+W SCSI overrunBackup rethinking
Desktop & 2 half−empty disks?Backup servers?

4/25/98 page 4 4
Technology Summary
Good Bad UglyCPU Mhz Parallelism Latency
SRAM On−chip Latency
RAM Capacity Latency
Disk Capacity Latency
Tape Capacity Bandwidth Latency
Network Bandwidth Latency
Software Work!
Sysadmin Technology Exciting

4/25/98 page 4 5
Conclusion: InfraStress Wishlist for Overcoming It
1. Find/understand: insightTools: Navigate, organize, visualize
2. Input: creativityTools: create content from ideas
3. Store and process the data: powerBig addressing, modern file systemBig I/O (number and individual speed)Big compute (HPC or commercial)
4. Move it: unleashScalable interconnectHigh−performance networking
5. Change: survive! Incremental scalability, headroomInfrastructure already upgraded

4/25/98 page 4 6
References
1.http://www.storage.ibm.com/hardsoft/diskdrdl/library/technolo.htm IBM storage web page