
Big data performance management thesis
68
The University of Strathclyde Business School Master of Business Administration Big Data: A Framework for guiding Big Data Analytics Ahmad Muammar 1 st of March 2014 Bahrain Centre Total Number of Words without appendices and table of contents: 14,903
-
Upload
ahmad-muammar -
Category
Business
-
view
637 -
download
0
Transcript of Big data performance management thesis

The University of Strathclyde
Business School
Master of Business Administration
Big Data: A Framework for guiding Big Data
Analytics
Ahmad Muammar
1st of March 2014
Bahrain Centre
Total Number of Words without appendices and table of contents: 14,903

i
Statement of academic honesty
I declare that this dissertation is entirely my own original work.
I declare that, except where fully referenced direct quotations have been included, no aspect of
this dissertation has been copied from any other source.
I declare that all other works cited in this dissertation have been appropriately referenced.
I understand that any act of Academic Dishonesty such as plagiarism or collusion may result in
the non-award of a Masters degree.
Signed _____Ahmad Muammar___________ Dated __March-1st-2014_______

ii
Contents
Statement of academic honesty ............................................................................................................ i
Contents .............................................................................................................................................. ii
List of figures ..................................................................................................................................... iv
2 Introduction ..................................................................................................................................1
3 Literature Review .........................................................................................................................3
3.1 Introduction ..........................................................................................................................3
3.2 Big Data- What and Why? ...................................................................................................4
3.3 Big Data – How and Who? ..................................................................................................8
3.4 Important Related Terms ...................................................................................................10
3.5 Analytics Models ...............................................................................................................11
3.6 Big Data as a strategic initiative ........................................................................................12
4 Cases Review .............................................................................................................................15
4.1 Introduction ........................................................................................................................15
4.2 C-PG: The case of Procter & Gamble (P&G) ....................................................................15
4.3 C-OE: The case of Obama election campaign ...................................................................17
4.4 C-GE: The case of GE .......................................................................................................18
4.5 C- WM: The case of Wal-Mart ..........................................................................................20
5 Methodology ..............................................................................................................................22
5.1 The study purpose and the research objectives. .................................................................22
5.2 Research Choices ...............................................................................................................23
5.2.1 Research Approach and Design. ................................................................................23
5.2.2 Research Methodologies and Methods ......................................................................24
5.2.3 Data Collection Techniques .......................................................................................25
5.2.4 Data Analysis .............................................................................................................27
5.3 Limitations .........................................................................................................................28
5.4 Conclusion .........................................................................................................................29
6 Discussion and Analysis ............................................................................................................29
6.1 Big Data and Organizations ...............................................................................................29
6.2 Different stage, different measurements ............................................................................31

iii
6.2.1 The Start .....................................................................................................................34
6.2.2 The Transformation....................................................................................................37
6.2.3 The Maturity ..............................................................................................................43
7 Conclusion and further studies. ..................................................................................................47
7.1 Future studies .....................................................................................................................47
8 Personal Reflection ....................................................................................................................49
9 Appendix A: Literature Search ..................................................................................................50
10 Appendix B: Common Data Mining Methods(Shearer 2000) ...............................................51
11 Appendix C: Sample of the Coding Matrix ...........................................................................56
12 Appendix D: Turnitin Report .................................................................................................57
Bibliography ......................................................................................................................................58
Interview Consent Form ........................................................................................................................
Interview Participant Information Sheet ................................................................................................

iv
List of figures Figure 1: Gartner Hype Cycle 2012 .....................................................................................................1
Figure 2: Literature review map...........................................................................................................3
Figure 3: IDC's Digital Universe Study, sponsored by EMC, June 2011 ...........................................4
Figure 4: Google Trends for “Big Data” limited to “Business and Industrial” ....................................5
Figure 5: The Vs characterizing Big Data ...........................................................................................6
Figure 6: Michael E. Porter “Competitive Strategy: Techniques for Analyzing Industries and
Competitors”(Bill Schmarzo 2012) .....................................................................................................8
Figure 7: Data Warehouse infrastructure ...........................................................................................10
Figure 8: Phases of the CRISP-DM Reference Mode (Shearer 2000) ...............................................11
Figure 9: virtuous cycle of data mining focuses on business results, ................................................12
Figure 10: Michael Porter’s Value Chain Analysis (Bill Schmarzo 2012) ........................................13
Figure 11: Business Sphere rooms in P&G .......................................................................................15
Figure 12: Example of 1% saving across sectors (Evans & Marco Annunziata n.d.) .......................19
Figure 13: Themes were printed with the interviewer to guide the discussions. ...............................23
Figure 14: Gartner Hype Cycle for emerging technologies as of Aug 2013 ......................................30
Figure 15: IT Industry 3rd
platform of growth and innovation (Source IDS) .....................................31
Figure 16: The stages of KM development (Lopez 2001) .................................................................33
Figure 17: Stages used by the author in the current study .................................................................33
Figure 18: The IT Strategic Impact Grid (Nolan & Mcfarlan 2005) .................................................37
Figure 19: Balanced scorecard (Kaplan & Norton 1992) ..................................................................40
Figure 20: Transformational stage BSC for Big Data ........................................................................43
Figure 21: P&G Value chain and data analytics ................................................................................44

1 Introduction
The world is facing an exponential growth of data; tremendous data is created by smart devices,
RFID technologies, sensors, social media, video surveillance and more. IDC estimated the data
created by humanity in 2000 by two Exabytes of data; a similar amount was created in 2011 every
day (LYMAN, Peter and Varian, Hal, 2011). While data is created primarily by individuals,
organizations are expected to manage this data(Gantz & Reinsel 2011). Isn’t this an unavoidable
burden on organizations? Is the problem of managing and storing data a vital concern that needs an
immediate resolution? Well, Big Data advocates believe that information explosion represents a
huge opportunity for organizations; mining this mountain of dirt will most likely reveal golden
values! In fact, Mckinsey (Manyika et al. 2011) estimates the potential annual value of leveraging
Big Data in US health care to be $300 billion, and more than that figure in Europe’s public sector
administration. Gartner mentioned Big Data more than ten times in its Hype Cycle report of
emerging technologies that evaluates 1900 technologies (Pettey & Meulen 2012). However, a
careful review of the hype indicates that Big Data is about to reach the peak of inflated expectation,
which is followed by trough of disillusionment. Does that mean that Big Data might be a fad and
simply a new IT buzzword to impress the business and sell more of the same stuff?
Figure 1: Gartner Hype Cycle 2012
In parallel to this hype, several companies are competing to create sound technologies to capture,
manage and analyze this huge data. At the same time, other companies are creating more smart
devices and applications to create even more data. Several investments are out there with the

2
purpose of collecting more data with no profit, hoping to figure out how to monetize it later,
following Facebook pathway.
“Because computers have enabled humans to gather more data than we can digest, it is only
natural to turn to computational techniques to help us unearth meaningful patterns and structures
from the massive volumes of data” (U. M. Fayyad et al. 1996)
This new data is mostly unstructured or semi-structured which is different form of data that
traditional technologies used to deal with. It is also created and streamed in a very fast speed, and
dealing with it has to be as fast as possible, some argues. This represents another challenge for the
current traditional technologies.
In this project, my aim is to understand the fascinating topic of Dig Data more thoroughly and to try
to differentiate realities and myths about Big Data. At the same time, I’m hoping to suggest a
practical framework that can be used by ambitious organizations to evaluate and guide their
performance in terms of Big Data. Critical literature review about the topic, synthesizing inputs
from subject matter experts and review successful implementation case studies in contemporary
organizations will be the main pillars for this framework.

3
2 Literature Review
2.1 Introduction
Through the literature review process, one can rapidly discover that “Big Data” topic is in its
infancy stage in the business academic journals and is still far from catching up with their
counterpart in trade and grey journals. Searching in known literature database shows small number
of hits in business academic journals compared to trade journals (refer to Appendix A), and the
number is really negligible if we compare it to Google scholar of more than 6000 hits and 21M in
Google general search hits1. (Lazer et al. 2009) noticed that “the emergence of a data-driven
computational social science has been much slower”. A possible explanation of the phenomenon is
that some aspects of “Big Data” is not relatively new; for example, a large amount of literature have
deep coverage of topics like, analytics, knowledge discovery, data mining, decision making and
business intelligence; both from technological and business point of view. The Big Data term,
however, triggered wild imaginations of ideas and possibilities in the media and trade papers due to
the value that can be created with today’s available technologies.
A semi-systematic literature review was initially followed to capture the maximum amount of
relevant papers. Both academic peer-reviewed and non-peer-reviewed relevant business papers
were studied. This stage was followed by non-systematic literature review, where the focus was
directed to search until certain themes were discovered and converged concepts were reached.
The literature flow and themes are depicted in the figure below
Figure 2: Literature review map
1 29th of November 2012

4
2.2 Big Data- What and Why?
The dynamic interplay between technology and social ecology is a historical phenomenon, and both
have been shaping each other for long time. Technology development, Internet inexpensive
availability, mobile proliferation and smart phones allowed the mainstream to stay connected most
of the time. (Manyika et al. 2011) has estimated the number of mobile phones in use to be 5 billion
in 2010. This has offered the already-rising social media more momentum and wider reach. In fact,
Facebook is around one billion users at the time of writing this research. What Kolter (Kotler et al.
2010) calls the age of participation is equipped now with more advanced and cheap tools for people
to remain connected longer and to create even further participation and additional collaboration,
nonetheless, with greater and more valuable content.
Figure 3: IDC's Digital Universe Study, sponsored by EMC, June 2011
In the other hand, technology is reaching the economy of scale quite faster than before; turning
what was once-restricted to rich, into easily accessible gadgets to the mainstream. This sharp drop
in computing, storage and network prices have not only enabled people to make more collaborative
content, but also enabled humankind to generate more smart digital sensors than before, producing
more data, sending it in real time and stocking it to for analytics.
For decades, organizations have been crunching and analyzing transactional data pursuing insight
and knowledge discovery. Recently, there has been unprecedented interest in big data and big data
analytics. While not particularly reliable, Google trends service shows a large search volume
against “Big Data” and a big hype has been created around the concept. This can give an indication
on the amount of interest about big data. Arguably, the Big Data has established itself as the
buzzword of 2013 and for years to come.

5
Figure 4: Google Trends for “Big Data” limited to “Business and Industrial”
Big data can be described simply as a new type of data that needs different tools and technologies to
deal with and Big Data analytics is the methods used to create insight out of it. Mostly showing up
in computer literature, several big data definitions are centered around size and scale, others have
focused on the technological implications - For example; McKinsey defines Big Data as the
datasets whose size represents a challenge for traditional computing technologies (Manyika et al.
2011). (Eaton et al. 2012), (Edd Dumbill 2012) have also suggested that term applies on the data
that can’t be processed using traditional tools. Those definitions imply that big data today will not
be big data anymore when technologies progress to overcome today’s obstacles! However, this
context is not new and (U. M. Fayyad et al. 1996) have similar proposition describing knowledge
discovery database (aka KDD).
At the same time the characteristics of Big Data, commonly known as 3Vs – have occupied
considerable part of the Big Data explanations (Philip Russom 2011), (Eaton et al. 2012),(Carter
2011) and others:
Volume: This V suggests that the amount of data available to organizations is growing
exponentially, and data sources are increasing in number and in the content they generate. It
also reflects the trend to analyze big chunk of the data rather than small samples, in order to
capture more value, some argue (SAS 2012).
Velocity: refers to the speed of capturing the real-time data and the need to rapidly process
it in real time.
Variety: highlights the importance of unstructured data (text, audio, blogs, micro blogs,
etc.), along with the traditional transactional data.

6
Figure 5: The Vs characterizing Big Data
Others have added the variability and seasonality of data flow (SAS 2012) as another attribute of
big data. Recently, veracity has been proposed to stress the importance of quality and
trustworthiness degree of data (Paul C. Zikopoulos et al. 2012); some data is uncertain by definition
(things like sentiment analysis, economic factors, weather conditions, truthfulness of humans),
which data cleansing can’t traditionally correct. It is also important to highlight that big data and big
data analytics have been widely used as a synonym, in fact, some has deliberately re-defined big
data to focus on the analysis part (Gantz & Reinsel 2011)
The debate about what value big data adds, and how the value is created has started to appear in
researches. The mainstream writers have let their imaginations soar to construct relations between
digital traces in order to foretell possibilities and extract insights. Others have taken the Big Data
further to a bold claim that Big Data is going to redefine science and knowledge as we know it;
(Anderson 2008) claims that applied mathematics will replace every other tool we know. Other
writers have shown some skepticism, seeing the promise of Big Data is over simplistic. At the end
social connections are not equal, frequency of cyber communications is not a relation, and number
of tweets doesn’t mean more social (Boyd & Kate Crawford 2011). In my view, Big Data analytics
is not a replacement for the scientific methodologies, market research or even the “gut feeling”, but
will certainly enrich them and enable faster knowledge-based-actions, in particular, when the speed
is an important factor, and the challenge in differentiating between causation and correlation is not
unique to Big Data analytics. Correlation among search phrases allowed Google in 2009 to predict
the spread the spread of H1N1 better the governmental analysts (Mayer-Schönberger et al. 2013).

7
Undoubtedly, Big Data analysis and discovery will create enormous value, some argue. Its value
comes profoundly from the extracting sophisticated patterns of relationships between its parts
(Boyd & Kate Crawford 2011). Hypothetically, with Big Data, we can rapidly construct detailed
knowledge using both deep data, commonly used in humanity studies, and surface data about lots
of people, commonly used in quantitative disciplines (Manovich 2011); (Lazer et al. 2009, p722)
provided similar argument on what they call, “depth and breadth and scale”.
(Thomas H Davenport et al. 2012) claim that organizations that learn how to use Big Data will
react to changes as they occur and will use different sources of data in real-time to create new
offerings. The speed factor was also emphasized by (LaValle et al. 2011) as an enabler to analyze
complex business decisions based on complex parameters.
There are empirical evidences that companies that use analytics in general outperform competition.
For example, in a survey of 3000 executives in different industries, (LaValle et al. 2011) concluded
that the top-performers companies use analytic much more than under-performing companies.
(Manyika et al. 2011) have identified five ways for Big Data to add value, which can be
summarized as follows:
Creating Transparency: Making Big Data available across functions can reduce time to
market, research and processing time and improve quality
Experimentation: statistical process control across the value chain to monitor and improve
performance.
Micro-segmenting of population: to address individual needs.
Automated decision making
Innovating with new business models, products and services.
(Stubbs 2011) argues that organizations can leverage business analytics at all strategic levels
(Organization planning, business planning and functional planning). It can be used as an input to
several famous strategic tools (i.e. SWOT, Porter’s five forces, PESEL, etc.). An example for Porter
five forces use of Big Data is shown below

8
Figure 6: Michael E. Porter “Competitive Strategy: Techniques for Analyzing Industries and Competitors”
(Bill Schmarzo 2012)
(Davenport & Dyché 2013) suggest that the Big Data objectives are to reduce cost and time, to do
an analytics tasks, or introduce a new product or service.
To conclude, Big Data advocates stressed on the value of Big Data along every point in the value
chain and across several management disciplines. However, similar claims were cited before Big
Data hype in knowledge discovery and data mining. Airlines, Banks, manufacturing - industries
have been collecting data and extracting insight for years. However, data types and sources are
different today, digital social realities have changed and computing power is more capable and
more cost effective.
2.3 Big Data – How and Who?
Data is created as an outcome of every business process, nevertheless the sources of data are not
limited to within organization anymore; data source can be external as well as internal –
transactional and unstructured. Data can be collected from outside organizational boundaries (i.e.,
suppliers, customers, partners, channel, environmental data, data banks, etc.). Its value spans
multiple business functions and its analytics serves multiple purposes. It is, therefore, imperative to
look at the implications from both strategic and tactical point of view. What does it mean to be data-
driven organization?
Organizations who aspire to compete effectively in the digital economy need to look at data and
data analytics as a source of competitive advantage. They need to pursue a strategy that is informed
and shaped by analytics (Davenport 2006), (Manyika et al. 2011), (Kiron & Shockley 2012). From
a system lenses perspective – Analytics needs to be embedded in different organization’s activities
ranging from operations, forecasting, sales and marketing, supply chain, customer service to

9
business development. Data needs to be transformed efficiently into information and consumable
knowledge across organization’s value chain.
Organizations who leverage Big Data act as lean organizations that process data as it comes rather
than stock it for future processing. The real-time processing of data can be used for quicker and
automated decision making or can be used for monitoring the environment (Thomas H. Davenport
et al. 2012). The need for data analysis automation, however, is not a new concept; (U. M. Fayyad
et al. 1996) emphasized the automation and the need for machine processing in his description of
the KDD. One can argue that, the unstructured nature of today’s data and the speed of creating are
some reasons behind the evolution of Big Data thinking. It is also the value of information that can
be extracted from the free raw data embedded in micro blogs, social media, GPS locations and
smart devices that created different possibilities.
(Thomas H Davenport et al. 2012) believe that Big Data ecosystem will evolve, creating an
information network of external and internal services to create more insight. (LaValle et al. 2011)
suggest that the insight created using analytics has to be linked to organization future strategy, and
tightly connected to daily operations. Skilled data-driven organizations use data not only in cost
cutting but also to prescribe actions and choose optimal options. They continuously find new ways
to collect process and consume data.
In a different perspective, (Kiron & Shockley 2012) survey of 4500 respondents shows that cultural
aspect and lack of commitments to analytics can hinder analytics programs. The data-driven culture,
(Kiron & Shockley 2012) argue, sees analytic as a strategic asset with full management support and
company widespread access to the insight analytics creates. While they did not describe how this
culture can be systematically built, they claim that data-oriented culture could be evolved.
(Davenport 2006) provided several practical examples of how the data culture will look in action,
but, again, did not offer an insight on how to sequentially develop this culture.
The talents who are able to cope with Big Data is another critical necessity and market is forecasted
to run short of resources by order of magnitude (Manyika et al. 2011). Those resources are
commonly called “data scientists”. While this term is not entirely defined, several observers have
highlighted the need of different skillsets to fulfill today’s analytics needs. They stressed the need
for both soft and hard skills for data scientist professionals. Those professionals have in-depth
expertise in a certain scientific discipline, nevertheless enjoying a good understanding of wide
business areas (Patil 2011). In his widely cited “Competing On Analytics” paper, (Davenport
2006) highlighted the importance of hiring the right analysts who have quantitative skills, analytics

10
aptitude, math and statistics, but also have the ability to simplify complex ideas and to speak the
business language, while having the skills needed to interact with business leaders.
2.4 Important Related Terms
Data Mining: is defined as the extraction knowledge from large amounts of data (Han et al. 2012).
(Linoff S. & Berry A. 2011) have similar definition with an emphasis on the operation part of the
data mining by declaring it as a business process. Data mining and knowledge discovery for data
(KDD) are often used as synonyms. Others are using the data mining term as one step in the
knowledge discovery process, which is then, refers to the intelligent methods used to extract insight
and pattern from data. Data mining can also be seen as a step in Big Data analytics; its predictive
and descriptive algorithms2 are commonly quoted in writings clarifying the opportunities possible
with Big Data analytics.
Data Warehousing: is the process of capturing data and collecting it from different sources to make
it available for online retrieval (U. Fayyad et al. 1996). In the process, data gets extracted from
operational systems, transformed, cleansed, aggregated and loaded and summarized to a repository
for processing (Bontempo & Zagelow 1998). Data warehouse helps in simplifying decision support
systems and ideally should represent single point of truth about organizations data. Data mart is a
subset of the Data Warehouse accessed typically by a certain line of business.
Figure 7: Data Warehouse infrastructure
2 please see Appendix B for methods used in data mining

11
2.5 Analytics Models
Based on real-world experience(Shearer 2000), CRISP-DM ((CRoss-Industry Standard Process for
Data Mining) was built as a general blueprint for data mining projects
Figure 8: Phases of the CRISP-DM Reference Mode (Shearer 2000)
The model suggests that the process should start by business understanding phase declaring clear
objectives of the undergoing analytic project. It should assess the resources needed and produce
plan for the project. Data Understanding phase includes the exercises needed to get more familiar
with the collected data, identify quality issues, explore and visualize the data and collect more
sources if needed. The phase is followed by Data Preparation where data gets cleaned, derived
attributes get created and data gets formatted, integrated and aggregated. The data mining models
can be applied then and tested in the Modeling phase before the Deployment phase is kicked off.
(Han et al. 2012) have proposed similar model for data mining that includes:
Data cleaning
Data integration
Data selection
Data transformation
Data mining
Pattern evaluation
Knowledge presentation

12
(U. Fayyad et al. 1996) suggest that following methodology, stressing the iterative nature of the
process:
Learning the application domain.
Selecting the datasets.
Data cleaning and preprocessing.
Data reduction and projection.
Choosing the function of data mining.
Data mining.
Choosing the data mining algorithm(s).
Interpretation
Using discovered knowledge.
(Linoff S. & Berry A. 2011) model, shown in figure (9), is more of an abstract methodology, but
with details close to the ones proposed by other models. Measuring results, however, through
financial measures or lifetime customer value is stressed out in this model.
The models are typically comparable; nevertheless they tend to zoom in or out in different aspects
of data treatment.
Figure 9: virtuous cycle of data mining focuses on business results, (Linoff S. & Berry A. 2011)
2.6 Big Data as a strategic initiative
The previous sections suggest that Big Data analytics can be leveraged across the company value
chain as shown in the figure below; it can also be used as an input for several strategic tools guiding
organizations to achieve competitive advantage. It can supports companies to create insight and to

13
ensure an informed and fast decision making. Moreover, Big Data can be used to measure
companies’ performance in a more accurate way and enrich the current BI practices.
Figure 10: Michael Porter’s Value Chain Analysis (Bill Schmarzo 2012)
The previous sections equally stress the vital role of talents, or data scientists, as key requirements
that companies have to nurture in order to be classified as data-driven organization. Those data
scientists will most likely, use some of the analytic models presented earlier, coupled with cross-
discipline knowledge to explore, present and explain data extracted insight.
It makes sense for a critical researcher to assume that Big Data analytics will possibly be seen as an
organizational strategic weapon. However, for skeptical practitioners and senior managers who are
going to kick off Big Data initiatives, there is most likely a need to measure how they are executing
against a set of performance areas. It is anticipated that several managers will be reluctant to
pursue a data transformation projects while they have experience failure in either a BI or data
warehouse projects;- surveys show that high percentage of those expensive projects have either
failed or have not achieved their objectives.
Practitioners will most likely have a strong desire to align their Big Data projects with the company
strategic directions and key performance indicators. The major question that I’m trying to answer
in this dissertation is:
“Assuming that Big Data analytics is a potential differentiator for certain companies, can we build
a framework for measuring the company’s performance in Big Data analytics?”
Additional key questions that can help exploring the main question are:
If Big Data sources and consumption span the corporate value chain, do we need senior managers
to oversee the whole data management strategy, For example is a Chief Data Officer role needed?

14
Is there a need for a separate business unit for analytics, does it need to be embedded in other
business units?
Are there some common characteristics for organizations that have maximized the value of data?
Have they been able to measure this value?
If the data scientists availability is a key requirement, are they acquired or cultivated? And how?
Is there a need for regular review of the analytics processes performance to make sure that
companies are maximizing both data assets and people talents?
How do companies know that the Big Data analytics KPIs are aligned with the corporate KPIs?
Is there a difference in requirements for digitally born organizations, whose main asset is
information, and those who are built on traditional business model?
Some of the questions have been partially answered in scattered literatures. It may possibly be of a
great value to combine those literatures with subject matter experts’ opinions who have witnessed
several successes and failures in the analytics field along with some cases analysis on contemporary
organizations who have achieved tangible results.

15
3 Cases Review
3.1 Introduction
In this chapter, I will be outlining four cases about organizations who have achieved tangible
success in analytics and Big Data. The cases were purposefully selected because of the
organizations success, the richness of the available online content and the revelatory of the cases.
Arguably, the cases would have been more relevant if the selected companies have achieved
competitive advantage and sustainable business growth compared to their peers who have not
leveraged Big Data and analytics. This seems to be a rational proposition; however, this proposition
faces practical challenges, some of which are:
The competitive advantage is complex set of competencies that are difficult to isolate and
measure in real life.
The Big Data topic is still in its infancy stage; with the exception of the digitally-born
organizations (i.e. facebook, Google, Amazon, etc.), it is therefore; challenging to find
many organizations who have developed the full competency and published detailed
information about those competencies.
Organizations who see analytics as competitive advantage could be reluctant to disclose
their initiatives to prevent their competitors to copycat their strategies
For the purpose of this project, I will try to discover some commonality and differences between the
understudy organizations who have achieved published success in analytics. I have consciously
avoided organizations that were built around Big Data (facebook, linkedin, Google, etc.), as their
business model could be difficult to replicate and so far is less common.
3.2 C-PG: The case of Procter & Gamble (P&G)
Figure 11: Business Sphere rooms in P&G

16
With more than 80 countries operations and 4 billion consumers touches every day, P&G has been a
leader in analytics for long. As stated in their innovation report3, the Business Sphere - a patent-
pending system - is transforming the decision making process by harnessing real time data. The
report claims that the system improves productivity and collaboration. Complex data is visualized in
the Business Sphere rooms and made available for the company’s leaders around the globe, driving
a quick and actionable insight. The report claims a 25% reduction on inventory.
(Henschen 2011) has described the Business Sphere rooms as follows:
“With a business analyst at the controls, executives see a global map of markets growing or
shrinking compared with expectations, and they can drill down to the countries and categories,
which range at P&G from laundry detergent and shampoo to diapers and potato chips”
The business sufficiency project in P&G allows its leaders to know
1. What is happening now (i.e. sales, inventory, market share, etc.)?
2. Why is something happening (country sales, marketing campaigns, store level, products)
3. Actions (pricing, products mix, what-if-scenarios)
The “Goldmine” conference is an analytics conference hosted by P&G. P&G invites several other
noncompetitive companies to share experience; it also invites academics and industry leaders to this
conference. After attending P&G “Goldmine” conference, (Davenport 2013) reported that P&G
CEO, Bob McDonald said:
“We see business intelligence as a key way to drive innovation, fueled by productivity, in everything
we do. To do this, we must move business intelligence from the periphery of operations to the center
of how business gets done.”
(Davenport 2013) stated that Filippo Passerini, P&G CIO, has renamed the IT department to
Information and Decision Solutions and outsourced all commodity functions.
In an interview with Passerini, (C. Murphy 2012) highlighted the collaborative decision-making
environment with the Business Sphere rooms which are equipped by videos and real-time data
along with analytics expertise.
In another interesting interview with (Chui 2011), McDonald said how he, personally, follows the
“consumer pulse” comments, - a project that collects data from the social media. This allows him to
react to issues happening in the marketplace and provides insight on how to improve a working
3 http://www.pg.com/en_US/downloads/innovation/factsheet_BusinessSphere.pdf

17
product. In the same interview, McDonald mentioned that analytics and digitization is touching
almost every stage in the value chain; for example, downloading the data in the manufacturing
plants, the Control Tower project handling inbound and outbound transport, connecting with
retailers in an automated way via GDSN4, simulation of molecules in R&D, or virtual walls that
simulate the store shelves.
Reflecting on his clear strategy to hire analytical thinking people, MacDonald said:
“We needed people with backgrounds in computer modeling and simulation. We wanted to find
people who had true mastery in computer science, from the basics of coding to advanced
programing” (Chui 2011)
The case of P&G shows high level commitment of analytics by senior executives in P&G, and
analytics is touching every angle of the organization. It also shows a data-centric strategy for the
organization. Moreover, it indicates a data-embracing culture supported by high expertise of data
analysts. The data is being collected and analyzed in every stage in the value chain; CEO is
listening directly to customers using social media, data is collected from manufacturing and sales,
data integration is happening from supplier to retailers, and management puts data at the center of
their business reviews.
3.3 C-OE: The case of Obama election campaign
This case shows how two years of data crunching by dozens of data gurus was leveraged to boost
personal marketing- or what (Wadhwa 2012) called “political data science” ; and how analytics
helped driving Obama campaign to win the presidency race again in 2012. It is sure that many of
the campaign secrets will not be revealed soon. In fact, a lot of the published information about
Obama campaign use of technology was not made available until Obama was re-elected.
It was the second digital campaign for Obama, but in the second time, the business intelligence
department was five times larger than the previous one. The department has dozens of analytical
positions – (T. Murphy 2012) listed some titles like chief digital strategists, chief integration and
innovation officer, director of digital analytics, and battleground states election analyst. This
highlights not only the importance of the new data science and data scientists, but also the diversity
in the scope that might be created in the coming years for such a profession.
In an interesting TIMES report, (Scherer 2012) cited Jim Messina, Obama campaign manager, after
taking the job “We are going to measure every single thing in this campaign” and his team started
4 Global Data Synchronisation Network.

18
early to consolidate databases for the voters and donators, they were able to microtarget voters and
predict several questions like:
Who was going to vote for Obama? Who was going to vote for Romney?
Who was reluctant? Who would not vote at all?
Who would vote if was approached?
Which types of people would be persuaded by certain kinds of appeals (Scherer 2012)
In an MIT Sloan interview with Andrew McAfee, Principle Research Scientist, said:
“I would hope that it becomes increasingly clear that an [analytical] style is increasingly superior
to the pundit style of decision making,”…“I am not saying that intuition doesn’t exist or is bad or is
wrong; our brains are really wonderful computers. - and our tool kit for doing that is really good
right now — we do not need a balance between intuition and being data driven. We need about a
hundred percent market share of the latter.”(Ferguson 2012)
Although Andrew’s comment of using hundred percent analytics could be seen as exaggerated, but
it truly reflects a new reality where data could give a better insight than guts feeling in many
situations. Obama campaign was able raise $1 billion, out of which 50% was raised digitally, and
he was able to win the digital race again.
Once again, one can observe a commitment from the campaign executives on data-driven programs
to measure everything in the campaign. Several articles out there talking about the mathematical
modeling used, database consolidations conducted, social media footprint, and the sophistications
used during this campaign. Two years of preparations and execution, fully qualified talents,
including Chris Hughes - the cofounder of facebook- and full commitment to analytics had driven
Obama campaign to the success we know.
3.4 C-GE: The case of GE
GE, the world leader in industrial technology, is not only a consumer and practitioner for Big Data,
but it is also an investor in technologies that will enable Big Data. GE has invested in Pivotal, a new
analytics and cloud company created by EMC and VMware, more than $100M to accelerate the
new analytic services. This is almost a 10% of the company market cap. In the era of Big Data,
Internet of things or Industrial Internet, GE is expecting to aggregate the data from machines to
create a value for the customer.(Vellante 2013).
The company is increasingly embedding sensors in array of “things that spin” to improve machine
performance. GE vision is connect the world’s machine together, leverage the power of analytics
and connecting people anytime to create more intelligent operations and design that provide high

19
quality of service. Below figure shows GE estimation of the industrial internet potential that
leverages Big Data to optimize a certain sector over the coming 15 years.(Evans & Marco
Annunziata n.d.)
Figure 12: Example of 1% saving across sectors (Evans & Marco Annunziata n.d.)
(Davenport & Dyché 2013) has highlighted that GE is recruiting roughly a 400 data scientists and
developing a special program for them. GE is focused on optimizing the service and maintenance
intervals for the products. In an interview with Bill Ruh, Vice President and Corporate Officer for
GE’s Global Software Center, (Davenport & Dyché 2013) quoted Ruh saying:
“We’re making a big bet on Big Data,” says Bill Ruh from GE. “With that said, the pilot projects
we’ve put out there have solved some big problems already. Our early proof-points were important.
Now we’re moving forward with even more complex problem sets. We’re making this a part of
everything we do
Our sensors collect signals on the health of blades on a gas turbine engine to show things like
‘stress cracks.’ The blade monitor can generate 500 gigabytes per day—and that’s only one sensor
on one turbine. There are 12,000 gas turbines in our fleet.” (Davenport & Dyché 2013)
In GE case, one can see that GE not only is a consumer and practitioner of Big Data, but it is also
taking the Big Data strategically and investing in other companies to boost what GE calls the
Industrial internet. The company is hiring data scientist to its Global Research. The company
software science and analytics website articulates the purpose of its initiatives

20
“We develop advanced computing and decision-making tools to analyze, interpret and utilize data,
creating software systems, solutions and architectures that will change the way our customers
create, deliver and manage their businesses”5
One can argue that GE is not only consuming the Big Data, but is also enabling more of the Big
Data that is created out of the internet of things. The investment done on both its research center as
well all Pivotal shows a high-level sponsorship for analytics. The commitment to analytics is high
both on what the company produces (machines) and how it produces them (operations and
services). It has established an impressive department for analytics and very serious in hiring data
scientists.
3.5 C- WM: The case of Wal-Mart
Wal-Mart has been using the Big Data even before the term was coined. In 2004, Wal-Mart has
predicted that Beer sales, rather than the obvious things like flashlights, would increase seven times
its normal sales while the Hurricane Frances was on its way! Trucks were speeding to fill out the
stock with products that were sold quickly (HAYS 2004)
According to the Economist, Wal-Mart, the largest retailer, was handling more than 1m customer
transaction a day (Economist 2010). Its famous and continually-refined system “Retail Link” has
been used by suppliers since 1991 from all over the globe. Retail Link is used by suppliers to record
sales, to trigger inventory reorder and to manage their own supply system once an item is scanned
by cash register. Using data from all suppliers, Wal-Mart demands suppliers to drop their prices
year over year and would replace their products in case suppliers could not cope up with this
requirement. Suppliers need also to be quick in order to be a candidate for Wal-Mart; Wal-Mart has
forced Levis to replenish within two days instead of Levi’s five days with other suppliers. Some
claim that Wal-Mart was one of the reasons behind low inflation in US due to its strategy in
squeezing suppliers’ prices (Fishman 2003).
In its 2012 annual report - a $443B revenue report- Michael T. Duke, Wal-Mart President and CEO,
stressed the customer-focus culture as a key strategy for his giant organization. Duke referred to the
world-class analytics developed by the Global Customer Insight Group as a mechanism to identify
customer trends and support marketing decisions (WalMart 2013). (Economist 2010) quoted Rollin
Ford, the CIO of Wal-Mart saying:
5 http://ge.geglobalresearch.com/technologies/software-sciences-analytics/

21
“Every day I wake up and ask, ‘how can I flow data better, manage data better, analyse data
better?”
Wal-Mart analytics DNA has also evolved with time, and data and analytics is no longer limited to
the backward or forward supply chain. It is no longer limited to data sharing and inventory
management, truck scheduling or even price information.
In 2011, Wal-Mart launched @WalmartLabs and acquired an analytic company in the social media
and mobile space, Kosmix. Several applications were developed and data sources have increased to
include data from social media. Wal-Mart collects online data about what customers are saying, and
approaching them with products information and discounts. Wal-Mart applications can help its
customers buy presents to their facebook friends based on their hoppies and interests. Some of these
applications use the concept of crowdsourcing where people pitch their own products in front of
large audience and the best products would be sold at Wal-Mart (Rijmenam 2013).
One can quickly appreciate Wal-Mart’s old commitment to data and analytics. A data-driven supply
chain started early with the company to optimize the most important area for a retailer, inventory
management. Price setting was another key area where data was leveraged for comparison and
bargaining. Wal-Mart has entered the social media game as well and leveraged data to create more
value for both the company and its customers.
The commitment from C-Level management toward data is also high and the company has
established a business unit and acquired another company to leverage the new data sources created
in the social media era.
22
4 Methodology
This chapter attempts to describe and justify the research approaches chosen, the data collection
implemented and outlines the analysis methods selected while highlighting the limitations of the
research.
4.1 The study purpose and the research objectives.
The main aim of this exploratory project has progressively transformed over the course of the study;
it has been evolved from answering generic questions around the being of Big Data into more
focused and practical questions about the maturity of analytics in organizations, with a hope to best
serve the management practice.
The purpose of this study is to understand how to measure the organization effectiveness in the area
of Big Data analytics and gain more insight about the topic of Big Data. The objective is to suggest
a practical framework or a model that can be used by organizations to evaluate and guide their
performance in terms of Big Data analytics.
The main question for this study is:
“If the Big Data analytics is considered by many observers as a potential differentiator for certain
companies, can we build a framework for measuring the company’s performance in Big Data
analytics?”
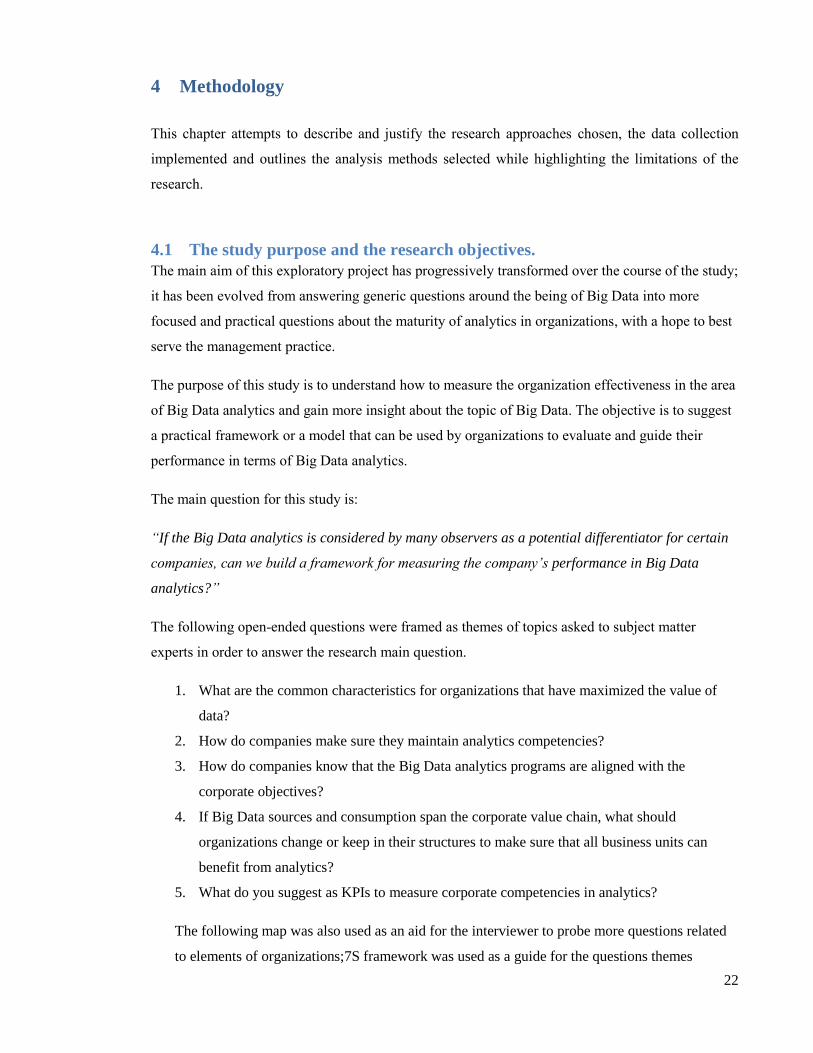
The following open-ended questions were framed as themes of topics asked to subject matter
experts in order to answer the research main question.
1. What are the common characteristics for organizations that have maximized the value of
data?
2. How do companies make sure they maintain analytics competencies?
3. How do companies know that the Big Data analytics programs are aligned with the
corporate objectives?
4. If Big Data sources and consumption span the corporate value chain, what should
organizations change or keep in their structures to make sure that all business units can
benefit from analytics?
5. What do you suggest as KPIs to measure corporate competencies in analytics?
The following map was also used as an aid for the interviewer to probe more questions related
to elements of organizations;7S framework was used as a guide for the questions themes

23
(Mintzberg et al. 1999). The framework was also relatively descriptive of the pattern discovered
during the case studies as explained in the data analysis section.
Figure 13: Themes were printed with the interviewer to guide the discussions.
4.2 Research Choices
4.2.1 Research Approach and Design.
As discussed in the literature review chapter, the topic of Big Data analytics is relatively new
surrounded by a great deal of excitements, and sometimes, exaggerations. It could be tricky to
categorize this research as either a deductive, generation of a theory; or an inductive research,
verification a theory (Cohen et al. 2007); while there are several performance management and key
performance indicators theories and methods in literature, those theories are not generally Big Data
analytics-centric and the preadaptation of a certain theory could narrow the view of analytics
performance dimensions. It was felt that the grounded approach, although time consuming, could
produce a better content. Therefore, the research has taken the approach of collecting primary and

24
secondary data first, to get a feel of the topic under study and its performance management
components in organizations. The outcome was then compared with some existing performance
management theories. Hence, while the research could be classified as inductive due to the absence
of foundation theory, the research was involved in a back-and-forth process of induction and
deduction. For example, in the early stages of the research, the author did not have any particular
theory in mind specific to Big Data performance; however, the author had some understanding of
theories around shareholder value and principal-agent framework, stakeholder’s theory and
balanced scorecard, but all were kept for later review after the case studies and interviews due to the
general nature of these theories. After the coding phase and interpretations of the case studies and
interviews, the author found some similarities between knowledge management and Big Data
management, and hence the literature were revisited again to compare and contrast the available
theories around knowledge management.
One can argue that the categorization of this study could also be of a less practical value; however,
it could be beneficial to the reader to explain the research approach in order to surf through the
material and find out how the author built the answers for the research questions under study. The
literature review was followed by four cases of organizations who achieved worthy outcomes
leveraging analytics, and the objective was to extract some insight on how those companies exceled
in analytics; then the author has interviewed analytics subject matter experts in the analytics field.
The outcome of both cases study and the interviews were assembled, synthesized to come up with a
broader analytics framework(s) measurement that organizations might use to monitor Big Data
analytics competencies.
4.2.2 Research Methodologies and Methods
(Hussey & Hussey 1997) define methodology as the way the research is approached from t the
research foundation theory to the collection of data and the way data is synthesized. Methods can be
described as the means on which these data are collected and analyzed (Collis & Hussey 2003).
For the purpose of this study, the multi-method qualitative study was selected where both semi-
structured interviews and case study documentary review have been chosen.
Qualitative research is a term used to refer to the analysis whose findings can’t be quantified using
quantitative analysis, or simply non-numerical way (Carl McDaniel & Gates 2012). (Maanen
1983,p.9) defines qualitative methodology as “an array of interpretive techniques which seek to
describe, decode, translate and otherwise come to terms with the meaning, not the frequency, of
certain more or less naturally occurring phenomena in the social world”.
25
The Big Data performance management topic is relatively under-researched in the management
literature and there is a little evidence of established theories. (Saunders et al. 2009, p482) argued
that ‘the more ambiguous and elastic our concepts, the less possible it is to quantify our data in a
meaningful way’, and therefore qualitative analysis could be a better strategy. Enormous part of the
researched writings and articles were focused on a single project delivered by certain organizations
to answer a specific question (i.e., why do we have a high churn rate? how can we increase profit in
a certain products? how do we integrate social media feeds into organization’s CRM? etc.) – rather
than looking at the holistic interplay between Big Data performance measurements and the
corporate goals and objectives ; therefore the project is exploratory in nature seeking new insights,
and grounded theory is selected as a research strategy. (Saunders et al. 2009) argue that there are
typically two ways of conducting such exploratory study:
A search of literature
Conducting individual and group interviews.
(Cooper & Schendel 1998) agree that exploratory study is likely to have a qualitative research as
part of the study. Grounded theory is best used in inductive approach and is particularly helpful
where the research emphasis is on developing and building theory (Saunders et al. 2009).
In this research, as semi-structured interview was selected in the exploratory part, as the problem of
Big Data analytics in management is relatively new and little research conducted pertaining to it
(Creswell 2009). (Saunders et al. 2009) suggest that the in-depth interview can be very helpful to
find what is happening in exploratory study, and semi-structured interviews can be also helpful in
the exploratory study. The author selected the semi-structured interview for the following reasons:
The research is dominantly exploratory with explanatory element in the cases section.
The method flexibility it provides in order to deviate from the essential questions when
needed.
The questions themes are open-ended and sometimes complex
The questions order could be changed, and throw-away and probing questions might be
added.
4.2.3 Data Collection Techniques
The research conducted by the author took a mixed approach of documentary review of successful
case studies of organizations that excelled in the analytics along with three interviews by subject
matter experts, who have either worked in analytics to boost the performance of their own
organizations, or those who have helped other organizations to plan and execute analytics programs.

26
For the first part, the conducted research considered four organizations whom the information about
were publicly available, their achievements in the analytics were considered by many observers and
commentators as successful. A free style internet search to find more information about those
companies from the following sources:
Published interviews with some key persons in the organization under study, from
newspapers, books, reports or YouTube videos.
Annual report statements which either show the desire to understand more or some bold
steps like building a large analytics business unit (the case of Wall-Mart) merger and
acquisitions (the case of GE)
News articles addressing successful implementation of analytics programs
Organizations speakers in data science forums.
For the second part, it was not easy to get experts who know Big Data from both theoretical as well
as practical point of view. There are plenty of individuals who understand business intelligence and
are experienced in the traditional way of doing analytics. There is also good number of individuals
who have done some data mining from a technical point of view, however, the number of profiles
who understand Big Data and organizational impact along with good experience in the field was
limited according to my research. It took linkedin searches and several email exchanges in order to
identify the interviewees- (no replies sometimes and apologies in others). The author finally
managed to agree with three subject matter experts to speak about their experience in this space
whose their profiles are listed below.
Code Title Company Location
I-CTO-BDV
CTO, Information Management and Analytics
Confidential Big Data Vendor US
I-DS-Pivotal Data Scientists Lead, EMEA Pivotal UK
I-CIO-QF x CIO Qatar Foundation Middle East
Interviews were conducted in face-to-face and internet video conferences manners. In all cases the
interviewees were asked for permission to record the audio and it was OK in all cases. The main
question of the interview along with questions themes were sent to the interviewees prior to the
interview and transcripts were sent to them after the interview for review. The author asked the
interviewees for their comfortable schedules in order to guarantee on hour during the interviews and
the timing was mutually agreed.

27
At the beginning of every interview, a five minutes introduction was presented by the author about
the purpose of the research and what it tries to accomplish along with a brief on what will happen
after the interview. Although, the questions were designed to be open-ended, in several times, the
author had to rephrase his question and improvise to get more insight about certain idea or topic and
this proved to be helpful.
In several occasions, the interviewees moved little bit beyond the scope due to the multidimensional
facets of Big Data. In most of these cases, the insight was inspiring and the author has tried to
capture it as soon as possible and interfere to move the discussion back to the project scope. In
several occasions, more elaboration was requested by asking for real life examples, and the author
inclined to summarize understanding after every main theme to confirm main ideas.
4.2.4 Data Analysis
As discussed in the research design section the grounded theory approach was selected for this
qualitative research and both case studies from published data as well as interviews with subject
matter experts were conducted, as suggested by (Strauss, 1998) and (Glaser,1967). (Saunders et al.
2009) argued that the qualitative data collection has some implications in the way it gets analyzed
and the researcher will most likely summarize, categorize and restructure the data to come up with
meaningful analysis. All interviews were recorded and subsequently transcribed in a word
document and then sent to interviewees for comments.
The author listened to and read the audio recordings and the written scripts several times while
coding the data by applying brief description on each segment of the transcribed documents.
The data and input collected was analyzed to come up with themes and patterns which were then
compared with the literature to ensure that the patterns are at least associated with the literature
findings. The process of coding started with some ideas of how the patterns might look like,
inspired by literature reviews and the research of the case studies. Mintzberg 7S general framework
was also considered in both the semi-structure interview as well as the description of the text in
hand. However, the lack of related theories in the area of Big Data performance management did
not provide a solid framework of categories.
The initial data analysis stages involved breaking down the data collected from the case studies as
well as the interviews into units, and significant categories were identified and chosen by the
author, on what is called the “open coding”.
“Axial coding” was followed to analyze the relationships between the identified categories, in order
to come up with main themes and sub-themes.

28
At the beginning, the author has created a codebook and tried to come up with codes and categories
(themes and sub-themes). After repetitive investigation of the codebook, it was clear that there are
some inconsistent inputs, or at least not easy to justify relations between inputs, within the same
interview. More examination of the codebook and extra reviews of the scripts, suggested that the
interviewees may have been referring to different characteristics during different phases of
organizational maturity in analytics, i.e., the characteristics and requirements for organizations to
succeed and excel might be different in each phase. So the coding was reviewed again to include the
phase factor into account.
The outcome of the interviews motivated the author to do yet another literature research looking for
similar fields of technology which has a better coverage of performance management, which will be
explained later in the discussion and analysis.
4.3 Limitations
Like any primary research, this study has its own limitations. There are some limitations related to
the “research design” and others related to the “data collection” implemented in this research.
This research was limited to selected industry subject matter experts along with purposefully
selected case studies. The subject matter experts don’t represent the opinion and observations of the
analytics industry. Although the cases are consciously selected to be from different sectors, there
are many other sectors that are still missing and even in the same sector, different business models
can lead to slightly different conclusions.
As discussed in the methodology chapter, the exploratory inductive research is typically related
with a ground theory which, despite the sample size and sample quality, needs more investigations
in order to claim generalisations. The impracticality of a larger sample size both from the case
studies as well as the subject matter experts could challenge the generalization of the findings of
this study; however, the objective of achieving usable results is felt to be reachable with the
expertise sample.
There is also an intrinsic risk that the researcher knowledge of the area of Big Data could lead to
partial influence embodied in the questions asked to the interviewees which could lead to put aside
some insights from the participants (Strauss & Corbin 1998).
The time validity of this research is not discussed, and the way technology is built, managed and
consumed could change overtime, creating new ways of managing it and therefore new ways of
measuring its performance. For example, data scientist nurturing was stressed out, but the future
could reveal that the analytics done by those data scientist could be automated.

29
4.4 Conclusion
The purpose of the research is to understand the topic of Big Data and to suggest a practical
framework to measure Big Data analytics in organizations. The literature review led to more
understanding of Big Data and it also highlighted an under-researched gap related to how
organization can possibly measure the performance of Big Data analytics. The selected case studies
have painted some common patterns of organization who have unleashed the potential of analytics.
This was followed by interviews of subject matter experts, which actually opened other interesting
facts related to the characteristics of these organizations as well as the time dimension in
organizations journey toward analytics. A well-defined research design was conducted
implementing “ground theory” that adopted coding procedure in order to come up to themes
representing the foundation of the new theory
5 Discussion and Analysis The author interviewed three subject matter experts in the area of Big Data and analytics during the
research period combined with case studies from leading analytics organizations.
The main question was:
“If the Big Data analytics is considered by many observers as a potential differentiator for certain
companies, can we build a framework for measuring the company’s performance in Big Data
analytics?”
5.1 Big Data and Organizations
There is no doubt that Big Data is the key buzzword of 2013 in the business information and
information technology and most likely to stay as hot as it is in 2014. By august 2013, see Figure
(14), Big Data has reached the top of Gartner hype cycle for emerging technologies; moving some
steps up from Figure (1) when I started the research on late 2012.With technology hypes, there is
some confusion around the best way of leveraging this hype and making sure that business money is
spent on the right thing for the right reason.
It is also imperative to appreciate that data is touching every part of contemporary organizations
value chains as explained in the literature review. The data could be generated from smart machines
in the production line, customers’ smart phones and social media comments, smart workers and
employees’ desktops, fleet sensors, surveillance, web clicks, etc. Companies will act differently

30
toward this information overload; some will keep measuring past business performance, others will
extend that to predict and optimize the future products and service, sales channels and optimal
prices; other companies will even take bold steps to extract insight out of mountains of data to
optimize their internal operations and understand market dynamics and forces.
Figure 14: Gartner Hype Cycle for emerging technologies as of Aug 2013
(Frank Gens 2012) of IDC predicts that “Vendors' ability (or inability) to effectively and
aggressively compete on the 3rd Platform will reorder leadership ranks within the IT market and
ultimately beyond it within every other industry that uses technology”. For IDC, the third platform
is a hyper-disruptive technology platform which includes “Cloud, Big Data, Mobile and Social”.

31
Figure 15: IT Industry 3rd platform of growth and innovation (Source IDS)
All the interviewees have stressed out the importance of the new technology wave and the impact it
could have in creating value for both organizations and customers. While some interviews argued
that the trigger of Big Data initiatives are most likely defensive in nature (regulation, competition,
risk, cost, etc.), others stressed the offensive nature as a driver for Big Data initiatives (more market
share, better consumer understanding).
The case studies show examples of successful turnover on the way organizations do business. Big
Data can help guiding organization strategies and as I-CTO-BDV said “You don’t need a Big Data
strategy, you need a strategy that incorporates Big Data”. Big Data can help on optimizing the
operations like what P&G has been doing, optimize inventory management like in the case of Wal-
Mart, understand your targeted customers as in the case of Obama election, and optimize products
and services in GE example.
5.2 Different stage, different measurements
Unlike case studies, where C-level commitment was obvious, interviewees’ observations on
organizations that they worked with, suggest that the Big Data initiatives were driven, typically,
bottom-up rather than top-down. I-DS-Pivotal noted that it was typically driven by customer-facing
units (i.e., marketing, customer relation management, etc.). However, the interviewees agreed that
C-level support will make the initiative successful.
32
A further investigation within the interviews and case studies could suggest that the context of
observations are highly dependent on the stages of development and how much data-centric the
organization under discussion is.
The author believes that above observation could be significant for several reasons:
1- It can resolve some conflicts between interviews, also between interviews and case studies
and sometimes within the same interview, for example:
While one interview suggests that C-level executives are typically not the ones who drive
Big Data initiatives, it also suggests that a data culture has to be there and has to spread
across all organization with incentives to encourage this culture. In the interviewees’
wordings: “Information is power, the moment you give up your data and allow others to
look at it, you lose this power…organizations have to have common shared goals behind
the vision on what they are trying to do in the company. Not only shared goals, but also
incentivized. The less incentivized the people are, the less people want to give up some
power and it becomes harder to give up this power”. This is something that typically occurs
with executive sponsorship.
In another interview, the interviewee agrees on the typical bottom-up approach of driving
data projects, but at the same time the interviewee proposes a bold assertion “You don’t
need a Big Data strategy, you need a business strategy that incorporate Big Data, that is a
big difference”.
In the other hand, almost all case studies suggest, high level commitment from executives.
Therefore, the distinction between organizations could be beneficial and more practical, as
it could be stubborn to measure a data-driven organization with the same metrics of want-
to-be organizations.
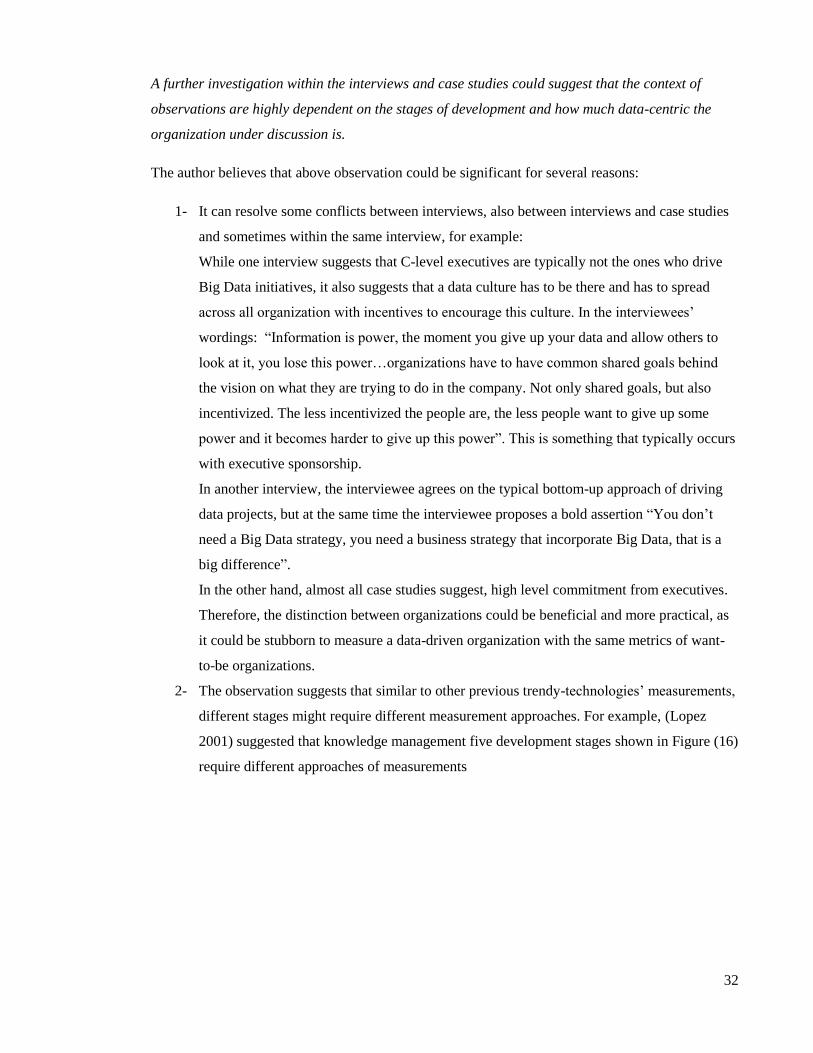
2- The observation suggests that similar to other previous trendy-technologies’ measurements,
different stages might require different measurement approaches. For example, (Lopez
2001) suggested that knowledge management five development stages shown in Figure (16)
require different approaches of measurements

33
Figure 16: The stages of KM development (Lopez 2001)
3- .Similar to knowledge management stage 1, two interviews suggest the necessity of a Big
Data advocate, in early stages, within the organization. In one interview, an advocate
example was given as an individual who is “absolutely passionate about what Big Data can
do and he has enough observations points that he is not afraid to stand in front of a crowd
and make some strong statements even at the risk of his own career”. In the other interview,
it was a global risk department.
Perhaps, it is impractical to apply concrete metrics equally on organizations that have not yet
embraced the data culture, and those who have achieved a certain degree of maturity. It is also
unlikely for the advocate(s) to have the power to enforce such metrics in the early phases of
development.
The author divided the codebook into three phases in order to distinguish the measurement of Big
Data performance at different stages of maturity as shown in Figure (17).
Figure 17: Stages used by the author in the current study
Future researches might test the suitability of the APQC knowledge management development
shown in Figure (16) and its applicability on Big Data, but this is beyond the scope of this study, as
the purpose of this study is not meant to construct a perfect development stages for Big Data in
organizations rather than measuring its performance. The author has proposed three simple stages
on Figure (17) to stress the need for different measurements through different phases of Big Data
that organizations could go through.

34
5.2.1 The Start
One can argue that the common sense suggests that more information will most likely lead to better
decisions, and therefore, analytics should be on top of the agendas for many executives. However,
most of the interviewees’ observations don’t align well with this view.
There is often a trigger that causes the interest in Big Data analytics to appear. This trigger could be
something like a strong advocate, marketing business unit, customer relations management, and
sometimes it is more defensive in nature, (for example, some regulations that needs to be enforced
by risk department).
In the case of the advocates (being a business unit or an individual), he/she usually has the energy,
vision and faith on Big Data that inspires others and pushes the initiatives forward. He/she is
typically focused on success stories and getting a business win or curing an existing pain in order to
prove his/her point.
In one of the interviews, this person is “more laser-focused on the business to show, demonstrate
and deliver quantifiable business value”. This observation, however, should not be confused with a
total business transformation, - but should be understood as a trial to prove a case. This person or
this unit works hard to create coalitions and search for others who share the same beliefs and are
willing to help.
It is also expected that this advocate will inevitably face political resistance. Big Data analytics
requires diverse sources of data that are typically scattered across the Enterprise, and the ability or
inability to acquire this data might lead to the success or failure of the business win that the
advocates is trying to do. Quoting from one of the interviews: “In organizations, knowledge is
power and therefore, the data you have gives you power, it provides you with insight into business
that others don’t have. The moment you give up your data and allow others to look at it, you lose
this power”
The author personal experience strongly supports this idea. In one of the largest banks in Middle
East, there was that advocate who wanted to push the idea of Big Data and he worked with the
author to bring in a data scientist to show one business case of Big Data (enhancing the process of
“loan prospects” based on more sources of data and more attributes of the customer). The project
faced enormous political resistance from several business units. It sometimes caused a lot of
frustrations for the people involved in this project, as the time was passing with little outcome after
several failures of acquiring the required data. The persistence of this advocate and the political
understanding of the bank and the organization structure forced things to start after few setbacks.

35
While the trigger typically comes from a non C-level champion, but interviews suggest that C-level
sponsorship can provide a better chance of success. Once again, the champion needs to realize the
importance of the political understanding.
“Those people might not be a C-Level people. However, the ones that are successful are the ones
who have strong relations with the C-Level people, who can carry that message forward and get
them to move forward” said I-CTO-BDV.
Most of the interviews as well as the case studies have implied the necessity of data culture, for
example, one of the interviews suggests that data driven companies who demonstrate competencies
and create value of analytics should have the following traits:
“Strong desire to let the data tell them what is going on”.
“The willingness to act on what the data tells them”
Perhaps, to get started with Big Data, it could be risky to start measuring the direct correlation
between the whole business value and the Big Data analytics initiatives, however, some value-
added results could be a good thing to leverage in order to influence the key sponsors and start
pushing the analytics culture. One can assume that this culture transformation could be difficult to
achieve in the very early stages of Big Data, and jumping to measure the whole business value
could be challenging to achieve.
Potential measurements in the start stage could reflect some of the above observations, and tangible
and intangible performance measurements might need to be observed around several stakeholders
(employees, management, business customers), those measurements could be quantitative and
qualitative, for example:
Sponsorship and Support
One should be able to observe and measure how much progress being done in order to develop
and grow the sponsorship inside the organization, for example:
o Number and profile of people recruited (supporters, champions, project sponsors,
influencers, etc.). One can use some communications frameworks to keep the
communications flowing in order to keep these stakeholders informed and increase the
support (for example, CAIRO framework)
o How often the Big Data and analytics discussed in front of executives.
o How much funding is available for the pilot projects
How much quantifiable business value could be achieved?
36
As stated before, these value-added results and success stories can help in getting more
support inside the organization and drive more data culture.
Political support and political resistance.
This part should not be underestimated, and the measurement of coalitions, teamwork,
information-sharing flexibility and collaboration should be observed.
Skills available to move the projects forward.
It could be also important to have a strong understanding of the “technical” readiness of the
organization, (some were addressed in literatures), for example:
Data scientist skills available inside the organization or available as contractors.
Number of data sources.
Privacy and regulation around user data.
..
The author also believes that an overall understanding of the organization attitude toward new
technology and information systems in general could be a great help to understand the
organizational culture and the easiness of change. For example, (Nolan & Mcfarlan 2005) IT Grid
shown in Fig(18) could help both the advocates and the company to evaluate the readiness of the
company to accept the idea of the Big Data and therefore, the chance to succeed.
The companies in the strategic and the turnaround modes could be more likely to accept innovation
than those in the factory and the support modes, due to their organic innovative nature, technology
spending ratio to capital expenditure, executives support, etc.

37
Figure 18: The IT Strategic Impact Grid (Nolan & Mcfarlan 2005)
5.2.2 The Transformation
It is assumed at this stage that proper funding would have been allocated to analytics and formal
implementation of the Big Data analytics inside the organization was given the green right with a
fair amount of support from several sponsors including C-level.
At this stage, it is also assumed that the organization would like to build and retain its competencies
in the Big Data analytics as an inimitable assets rather than keeping it as an adventure led by merely
some advocates.
To answer the objective about building and retaining competency and avoiding the loss of
‘corporate-memory’, interviewees have proposed different approaches while highlighting the
difficulties on achieving this due to the limited number of skilled people in the Big Data space and
the exposure associated with skills turnover.
Answering a question about the exposure that organizations might face if experienced data
scientists leave, one interview suggested that “most of the organizations have not thought beyond
the individual, and they are very exposed if this happens”. The interview continued to suggest
building center of excellence (COE), where the best practices, trainings, methodologies, data

38
scientists and other competencies are kept. In another word, it suggests a centralized Big Data
structure within the organization that is in charge of transforming the organization.
The other interview agrees on the difficulties of retaining competencies inside organization rather
than within individuals “At the moment, there is a lot of focus on the hiring, but if all this
knowledge stays within the data scientists, this defeats the purpose of Big Data”, the interviewee
also implicitly suggested some extended responsibilities of data scientists “One of the key tasks of
the data scientists team is to help convert the rest of organization into little data scientists”,
however, the interviewee suggested a different approach for the data scientists team “Ideally, you
need to have data scientist right next to you to help you understand the data right here, right now.
Most executives have a personal assistant, maybe a finance person, maybe a local HR person, never
mind there is a larger HR business unit working with them, in the same way, it makes sense to have
local data scientist expertise, one or more and spread out through the whole organization”. In
another word, it suggests a decentralized team
While the ultimate argument for the interviewees was to stress out the importance of nurturing data
culture as a an intellectual capital in the organization along with the vital role of the data scientists,
the interviewees suggested different approaches on getting the organization to learn rather than
merely getting the individuals to learn. In brief, the structure proposed was centralized team of data
experts versus decentralized team.
The author believes that both options could be appropriate for data driven organizations and they
both could achieve the stated objective of spreading out the data culture. However, the centralized
approach (i.e. the Center of Excellence), might be more practical at the transformation stage. I
argue that at this stage, the organization has already started to be enthusiastic about Big Data
transformation and the sponsoring senior executives are keen to see more business value evidences.
The sponsors would like to keep communications flowing about the new pilot projects and want to
listen to the good news, challenges and the lessons learned in order to provide a better support. The
center of excellent idea could provide a better structured way for initiating new initiatives across
business units, capturing lessons learned, communicating progress and performance measurements,
building skills inside the unit, keeping the communications flowing to the organization.
Perhaps, (Fairchild 2002) observations about the knowledge management measurements objectives
could be applied on Big Data transformation stage;- “ to find out how well the organization has
converted human capital (individual learning/team capabilities) to structural capital”.
The above observations about the cultural readiness, human capabilities and retention, business
values proofs, future readiness might suggest that balanced measurements need be established.

39
The measurements should not be restricted to the direct financial results, but it should also address
the intangible assets, culture, employees and management attitude toward data, technical and
infrastructure readiness. (Kaplan 2010) highlighted the difficulties of measuring the intangible
assets in financial terms:
The value is indirect, the direct impact of insight created by Big Data, technology or
knowledge management is not always easy to quantify, as this typically happens in a chain
of cause-and-effect, and could have some stages in between.
For example, customer records, mobile apps, or social media data can be used to send
greetings message to a customer once he passes by a restaurant. The customer might
decide to dine in immediately so we can measure profitability, dine in later and we could
lose the financial correlation, and maybe he would feel uncomfortable of being tracked.
The value is dependent on the organizational context. Perhaps (Nolan & Mcfarlan 2005)
grid could clarify this concept. For example, data scientist knowledge in a small bakery
shop is not as significant as the knowledge captured in airlines about passengers.
The value of intangible assets is generally bundled with other assets. For example, the
data scientists will be of a less important value if they are not equipped with the right
technology, access to diverse source of data, and the political support inside the
organization.
The author believes that at the transformation stage, the organization needs to have a structured
approach of measuring both tangible and intangible assets, and a balanced measurement should be
adopted in order to track the success of analytics initiatives. These measurements could be either
owned, communicated by center of excellence explained earlier or sponsored as corporate-wide
initiative. The choice will most likely depend on several factors such as, support, funding, capacity,
access, etc.
5.2.2.1 BSC Review
Balanced scorecard (BSC) has been successfully adopted by several organizations to measure
performance, it has also been used as a tool for translating the vision, communicating and
implementing strategy (Kaplan 2010). BSC is a balanced mixture between financial and non-
financial measurements to bind short-term activities to long-term objectives. It is also balanced
because it is not only measuring the historical performance but it also measures nonfinancial
metrics that can predict future performance. (Kaplan & Norton 1992) proposed four perspectives:
Financial (i.e., profit, revenue, share price, etc.)

40
Customer (i.e., how do customers see us?)
Internal (i.e., what we must excel at?)
Learning and growth (i.e., continuous improvement?)
Figure 19: Balanced scorecard (Kaplan & Norton 1992)
(Martinsons et al. 1999) applied the balanced scorecard as a foundation for strategic information
management systems and proposed four perspectives as well:
Measuring business value.
Measuring internal processes.
Measuring user orientation.
Measuring future readiness.
(Wim Van Grembergen et al. 2004) applied the IT BSC as maturity model to determine the
maturity of IT at a major Canadian financial group. (Fairchild 2002) extended the concept of BSC
and applied it on the knowledge management field from two approaches, leveraging different
subsets of BSC perspectives.

41
In the first approach, (Fairchild 2002) used the customer, internal and learning perspectives and
mapped them to social collaboration, structural and human capital respectively. He added the
intellectual capital as a new perspective, which is arguably can be combined with learning.
In the second approach he suggested “viewing the role of KM in organizational strategy via
management based approach, focusing on intellectual capital resources combined with business
processes of the organization” (Fairchild 2002). In other words, he proposed embedding the KM
measurements in the overall organizational BSC.
Knowledge management, arguably, shares some characteristics of analytics field, for example:
Knowledge management and analytics constitute both tangible and intangible assets.
They rely on both human skills and technology engines.
Their impact is arguably dependent on cultural transformation.
Their value stems from capturing data, analyzing information and sharing insight.
In the following section, the author proposes the use of BSC as a guiding tool to measure,
communicate and guide the implementation of Big Data projects.
5.2.2.2 Balanced scorecard and Big Data
Perhaps at the transformation phase, organizational widespread of analytics has not yet reached the
mainstream inside the organization; the management has not yet grasped the full vocabularies of
data as in the case of P&G or Walmart, more external and internal data sources are still being added
and the core technology is in place but large piece of integration is going on. As for the data
scientists, the hiring and training is going forward but within the fund allocated for this initiatives;
“You hire different kind of people, you train different kind of people, you bring more analysts and
data scientists, you acquire more data” said I-CTO-BDV.
As discussed earlier, the center of excellent, and any in-charge entity for this matter, should focus in
different measurements that are grouped in four perspectives in this project as shown in Fig (20)
1. Business value
This perspective answers the question of the contribution of Big Data analytics on key
organizational objectives; financial or nonfinancial measurements. For example; customer churn
rate, customer understanding, customer segmentations, inventory and supply chain optimization,
employee’s performance, etc. The higher the analytics impact on organizational objectives, the
better the chance of analytics to grow within organization.

42
This perspective could also include financial measurements related to the initiative like budgets and
ROI analysis, or financial measurement related the outcome of a certain project or projects
2. Business units and internal users.
The perspective might answer the question about the degree of relevance of analytics to several
business units contributing the value creation process of an organization. The measurements could
be lead measurements, for example the number of data sources from applications integrated for the
purposes of analytics; or lead indicators, i.e., the business units’ objectives that analytics helped to
achieve or measure.
The measurements will help spread the culture of Big Data and get more buy-ins and avoid political
resistance from within the organization.
I-DS-Pivotal suggested examples that could be linked to this perspective:
o “What % of decisions that you have to make at various level of the organization,
are driven by data”.
o “Show me the evidence of the analysis you have reached and show me how often
the decision you have actually made agrees with the recommendation that the
analysts have come up with”.
o “What % of the analysis is based on cross functions data and what % is based on
both internal and external? (Meaning traditional vs. non-traditional)”
3. Structural measurement.
This perspective answers the question about the performance of processes and systems needed in
order to excel. .”At some point after all the awareness and preparation is achieved and all are
onboard, it is very important to translate plans into solid initiatives executed on the ground, BIG
DATA related projects with clear/measureable objectives, timelines, and budget. “I-CIO-QF
Perhaps, this perspective could address questions about project prioritization, operation and
maintenance of Big Data applications, degree of success on acquiring more data sources, privacy
compliance, and time required to answer analytical questions, etc.
4. Future readiness
This perspective might answer the question about the way the COE, or any entity in-charge, will
continue to create and improve value. This might include questions about the skillsets and
motivational aspects inside the COE, turnover rate for data scientists training and development
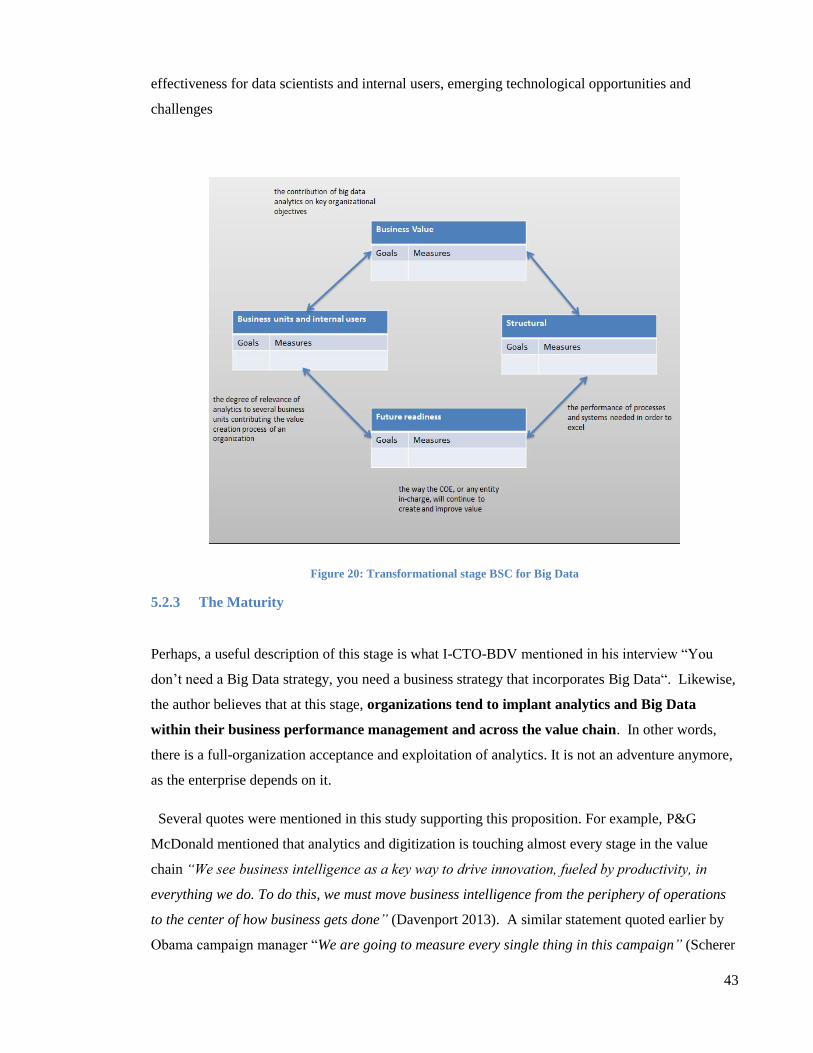
43
effectiveness for data scientists and internal users, emerging technological opportunities and
challenges
Figure 20: Transformational stage BSC for Big Data
5.2.3 The Maturity
Perhaps, a useful description of this stage is what I-CTO-BDV mentioned in his interview “You
don’t need a Big Data strategy, you need a business strategy that incorporates Big Data“. Likewise,
the author believes that at this stage, organizations tend to implant analytics and Big Data
within their business performance management and across the value chain. In other words,
there is a full-organization acceptance and exploitation of analytics. It is not an adventure anymore,
as the enterprise depends on it.
Several quotes were mentioned in this study supporting this proposition. For example, P&G
McDonald mentioned that analytics and digitization is touching almost every stage in the value
chain “We see business intelligence as a key way to drive innovation, fueled by productivity, in
everything we do. To do this, we must move business intelligence from the periphery of operations
to the center of how business gets done” (Davenport 2013). A similar statement quoted earlier by
Obama campaign manager “We are going to measure every single thing in this campaign” (Scherer

44
2012). GE Bill Ruh is cited by (Davenport & Dyché 2013) “Our early proof-points were important.
Now we’re moving forward with even more complex problem sets. We’re making this a part of
everything we do”. (Economist 2010) quoted Rollin Ford, the CIO of Wal-Mart saying: “Every day
I wake up and ask, ‘how can I flow data better, manage data better, analyse data better?”
It could be challenging to discover all evidences about P&G McDonald’s claim or other studied
organization with the available public information, but the below figure is a trial to visualize
Porter’s value chain against the information captured in this dissertation.
Figure 21: P&G Value chain and data analytics
Figure (21) shows a good coverage of data-dependent value creation process across the value chain.
The author believes that market-based-view frameworks (analyzing the customer needs, suppliers,
environmental, social, etc.), or resource-based-views frameworks - Porter’s value chain framework,
(Mintzberg et al. 1999) 7S framework, (Kaplan & Norton 1992) Balanced Scorecard, and other
frameworks about business model and business logic - could really uncover the differences between
the data-driven companies and others. The formers incline to embed the analytics inside everything
they do as cited by several executives in this dissertation, and help them understand the world
around them.
P&G is not an exception, but there were explicit and publicly available information about various
projects supporting several primary and secondary activities. Walmart “Retail Link” project also
spans the primary activities, and is now supported by social crowdsourcing applications that feed it
with more customer data.
It worth mentioning that once again, (Lopez 2001) observation about the “Institutionalize KM”
phase of knowledge management sounds also applicable to analytics and resonates with the

45
executives statements quoted in this dissertation “It does not happen unless KM is embedded in the
business model”.
Revisiting the case reviews presented through Chapter 3 again, one can rapidly internalize tangible
differences between the characteristics of those organizations and those described in the previous
sections. Some of these characteristics were also mentioned in the interviews as well. The data-
personalities span the whole organizations and impact the way they do business, for example:
The analytics benefits have gone beyond proving a value, the value is already proven.
Walmart’s CIO was quoted that he always thinks on how can he” flows data better, manages data
better, analyses data better?” (Economist 2010). P&G business sphere room enables the company
to visualize, analyze and predict performance across the globe while answering questions about
pricing and products mix. GE - the internet of things advocate - has been embedding sensors in its
machinery creating more data. Obama second campaign was doing it for the second time, getting
more fund raising and approaching more voters through the right channel.
Increasing the data sources, while continuously increasing data value.
McDonald, the CEO of P&G, follows the consumer comments created in the social media, Obama
campaign is analyzing unstructured data in social media along with the structured database they
built about voters. GE is actually going beyond ERP data and maintenance schedules, but collecting
data about their machineries through sensors and investing on companies that will potentially
enable analyzing more data. Walmart has created applications that not only collect social media
data, but also creating more data while embracing the crowdsourcing in its business.
I-DS-Pivotal explained the technical phases that companies go through “First of all, combining
existing in-house different data sources that traditionally were separated, and sometimes were
separated functionally, (ERP in one hand never combined with CRM systems)….. The second stage
is the incorporation of external data…”
There is a senior level commitment for analytics
Several executives have been quoted in the case studies, including CEO and CIO, with bold
statements about the importance of data and data analytics and strong faith on the possibilities that
data analytics can bring into every part of the value creation process. “In order to keep the high
momentum, top management need to keep investing in sourcing new methods and acquiring new
data sources in order to keep the organization on the cutting edge. Differentiation using Big Data is
a journey not a destination” I-CIO-QF. The bold statements are supported by bold actions on these

46
organizations; some of these organizations built Big Data research centers, invested on companies
and even acquired others to further enable their capabilities.
There are some evidences of a strong data culture.
The collaborative decision making environment facilitated by P&G business sphere rooms, the
faithful comments from different researchers within Obama campaign, putting data on the center of
everything GE does claims are all evidences of a culture which has big belief in the big thing called
Big Data.
I-CTO-BDV also highlighted the cultural aspects of successful organizations “Once you have a
couple of successes, I think what you will see happen is that cultural change across the
organization about using data to tell you what is going on”.
Data-related roles are not scarce within the organizations.
The amount of data related roles hired in Obama campaign, the 400 human forces constructing the
global research entity created in GE or WalmartLabs in Walmarts can all be seen as good indication
of the maturity of these organizations on hiring and nurturing human capital who can make sense of
data. P&G management abilities to interpret data and visualize it, while taking actions
In brief, organizations in maturity phase show soft and hard characteristics embracing data and data
analytics, they see the insight created by data as both intellectual and structural capital to the
organization, and help them measure everything they do and predict things that they should do.

47
6 Conclusion and further studies.
Many Big Data advocates believe that business is poised for change due to the data proliferation
and the increasing ability of analyzing this data. The ability to do something about this data
explosion and insight created might restructure industry leaderships. However, this should not be
taken as the face value as each industry has its own characteristics. For example airlines are
different than manufacturing or education, as in (Nolan & Mcfarlan 2005) IT grid. Also, although
this is beyond the scope of this thesis, technology and analytics could be easy to imitate if it is not
based on composite competencies.
In brief, there is no size fits all, and this applies also to analytics. Perhaps, metrics and
measurements should reflect the analytics maturity of the organization under study.
While not a particularly precise description of analytics maturity, three stages were suggested and
different measurements were proposed for every stage.
At the start phase, metrics about management support, political alignment, culture, skillsets and
gaps, technical readiness should be closely monitored. Inspiring stories and some business wins
should be spread to gain more support.
In the transformation phase, BSC could be used as a guiding tool to measure the performance.
Perhaps, as the organization get into maturity stage, they might incorporate as much analytics as
they can into their business performance management.
6.1 Future studies
The topic of Big Data is still, and possibly will continue to be, a fascinating one, attracting a lot of
attention from a wide spectrum of observers. To large extend, vast amount of literature focus has
been concentrated on the data mining techniques and algorithms. Justifiably, Media is filling out its
columns with heroic stories about certain discovery here or there, and surprising readers with
correlation between, what could be seen as unrelated variables. I still believe that there is a spacious
research room in the Big Data field and its management implications. The following could be
valuable in both academic and professional fields
Deductive research to test the usability of APQC knowledge management development on
Big Data.
Deductive researches leveraging existing framework of knowledge management
performance theories and testing the applicability of these frameworks on Big Data. The

48
challenge of the suggested researches could be the purposive sampling of the cases and/or
interviews. The purposive sampling should be clear on which phase of the analytics
maturity the focused organizations are in.
Big Data performance management in different management fields, this could be also seen
as inherited BSC for different business units.
o Operations Strategy
o Marketing
o Supply chain
o Risk Management
Big Data management for certain industrial sector.
Privacy aspects of Big Data and what kind governance should be applied.
In-depth study comparing data centric companies and traditional companies.
The impact of organization size on the new analytics capabilities
Building a culture of analytics in organizations.
49
7 Personal Reflection As this project was coming to an end, I always had a feeling that this section will be a difficult one.
It could be hard to summarize days and nights of personal and professional experience in a few
lines, but I will try to get through it. While some readers of this study could expect bullet and
rational points in this section, reflecting not only the nature of “data analytics” project, but also
reflecting long time of structured and critical thinking exercises spent in the school; I decided to
start with a feeling statement and free style writings, avoiding the extra dose of management jargons
I consumed last years as much as I can.
Through the course of the MBA studies and the course of this particular project, I’ve often
surrounded the concepts and ideas I was exposed to, with extra sauce of feelings. Admittedly, there
were moments when rationality and feelings were mixed up in a way I could not differentiate
whether I was in the ‘confirmation bias’ zone, or I was rational supported by evidences.
So, here is what I feel right now
“I’ve just discovered the tip of the iceberg”
I have been always fascinated about how technology can transform humanity, organizations and the
super-system we live in; and how humanity and the system can transform technology. This
interplay between technology and humanity will unlikely to end soon. I learnt that decomposing the
relation between them is both an art and a science.
I learnt that Big Data is likely to be a big thing as long as mankind and machines create more data,
and this project proved to me that I’ve just scratched the surface of knowledge about this game
changer technology and how we can manage it.
Although, I started this project with some confidence on how this piece of work will eventually
look like and was pretty much sure of the traits of the island I was heading to, I found myself
surfing in the knowledge ocean in different directions, seeing different islands and was hoping to
visit them all. I finally landed on one island, hoping that I managed to provide a map similar to the
territory. I also hope that this primitive map will be a brick that will help others craft a better one.

50
8 Appendix A: Literature Search Below results were obtained on 17
th of November 2012
Vendor/Database Search Strings Details Hits
ProQuest: ABI/INFORM Complete "Academic"
"Big Data" "All Field No Full text" Date: 2008-2012 Peer Reviewed Source Type: Conference papers Dissertations Scholary Journal Subject Area: Business
32
ProQuest: ABI/INFORM Complete "Trade"
"Big Data" "All Field No Full text" Date: 2008-2012 Source Type: Trade Journal Reports Subject Area: Business
1608
EBSOS:OmniFile Full Text Mega/OmniFile Full Text Select
"Big Data" "TI, AB, SU" Date: 2008-2012 Source Type: Academic Journal Periodical Conference Proceedings Dissertations/Thesis
25
EBSOS:OmniFile Full Text Mega/OmniFile Full Text Select
"Big Data" "TI, AB, SU" Date: 2008-2012 Source Type: Trade Publication
0
Emerald "Big Data" "Journal" 0
51
9 Appendix B: Common Data Mining Methods(Shearer 2000)
Data Description and Summarization
Data Description and Summarization provides a concise description of the characteristics of data,
typically in elementary and aggregated form, to give users an overview of the data’s structure. Data
description and summarization alone can be an objective of a data mining project. For instance, a
retailer might be interested in the turnover of all outlets, broken down by categories, summarizing
changes and differences as compared to a previous period. In almost all data mining projects, data
description and summarization is a sub-goal in the process, typically in early stages where initial
exploratory data analysis can help to understand the nature of the data and to find potential
hypotheses for hidden information. Summarization also plays an important role in the presentation
of final results.
Many reporting systems, statistical packages, OLAP, and EIS systems can cover data description
and summarization but do not usually provide any methods to perform more advanced modeling. If
data description and summarization is considered a stand- alone problem type and no further
modeling is required, these tools also are appropriate to carry out data mining engagements.
Segmentation
The data mining problem type segmentation separates the data into interesting and meaningful
subgroups or classes that share common characteristics. For instance, in shopping basket analysis,
one could define segments of baskets, depending on the items they contain. An analyst can segment
certain subgroups as relevant for the business question, based on prior knowledge or based on the
outcome of data description and summarization. However, there also are automatic clustering
techniques that can detect previously unsuspected and hidden structures in data that allow
segmentation.
Segmentation can be a data mining problem type of its own when the detection of segments is the
main purpose. For example, all addresses in ZIP code areas with higher than average age and
income might be selected for mailing advertisements on home nursing insurance. However,
segmentation often is a step toward solving other problem types where the purpose is to keep the
size of the data manageable or to find homogeneous data subsets that are easier to analyze.
Appropriate techniques
Clustering techniques

52
Neural nets
Visualization
Example:
A car company regularly collects information about its customers concerning their socioeconomic
characteristics. Using cluster analysis, the company can divide its customers into more
understandable subgroups, analyze the structure of each subgroup, and deploy specific marketing
strategies for each group separately.
Concept Descriptions
Concept description aims at an understandable description of concepts or classes. The purpose is
not to develop complete models with high prediction accuracy, but to gain insights. For instance, a
company may be interested in learning more about their loyal and disloyal customers. From a
description of these concepts (loyal and disloyal customers), the company might infer what could be
done to keep customers loyal or to transform disloyal customers to loyal customers. Typically,
segmentation is performed before concept description. Some techniques, such as conceptual
clustering techniques, perform segmentation and concept description at the same time.
Concept descriptions also can be used for classification purposes. On the other hand, some
classification techniques produce understandable classification models, which then can be
considered concept descriptions. The important distinction is that classification aims to be complete
in some sense. The classification model needs to apply to all cases in the selected population. On
the other hand, concept descriptions need not be complete. It is sufficient if they describe important
parts of the concepts or classes.
Appropriate techniques
Rule induction methods
Conceptual clustering
Example
Using data about the buyers of new cars and using a rule induction technique, a car company could
generate rules that describe its loyal and disloyal customers. Below are simplified examples of the
generated rules:
If SEX = male and AGE > 51 then CUSTOMER = loyal If SEX = female and AGE > 21 then
CUSTOMER = loyal

53
Classification
Classification assumes that there is a set of objects—characterized by some attribute or feature—
which belong to different classes. The class label is a discrete (symbolic) value and is known for
each object. The objective is to build classification models (sometimes called classifiers) that assign
the correct class label to previously unseen and unlabeled objects. Classification models are mostly
used for predictive modeling.
Many data mining problems can be transformed to classification problems. For example, credit
scoring tries to assess the credit risk of a new customer. This can be transformed to a classification
problem by creating two classes, good and bad customers. A classification model can be generated
from existing customer data and their credit behavior. This classification model then can be used to
assign a new potential customer to one of the two classes and hence accept or reject him or her.
Classification has connections to almost all other problem types.
Appropriate techniques
Discriminant analysis
Rule induction methods
Decision tree learning
Neural nets
K Nearest Neighbor
Case-based reasoning
Genetic algorithms
Example
Banks generally have information on the payment behavior of their credit applicants. By combining
this financial information with other information about the customers, such as sex, age, income,
etc., it is possible to develop a system to classify new customers as good or bad customers, (i.e., the
credit risk in acceptance of a customer is either low or high, respectively).
Prediction
Another important problem type that occurs in a wide range of applications is prediction. Prediction
is very similar to classification, but unlike classification, the target attribute (class) in pre- diction is
not a qualitative discrete attribute but a continuous one. The aim of prediction is to find the
numerical value of the target attribute for unseen objects. This problem type is some- times called
regression. If prediction deals with time series data, then it is often called forecasting.
Appropriate techniques:
Regression analysis
Regression trees

54
Neural nets
K Nearest Neighbor
Box-Jenkins methods
Genetic algorithms
Example
The annual revenue of an international company is correlated with other attributes such as
advertisement, exchange rate, inflation rate, etc. Having these values (or their reliable estimations
for the next year), the company can predict its expected revenue for the next year.
Dependency Analysis Dependency analysis finds a model that describes significant dependencies
(or associations) between data items or events. Dependencies can be used to predict the value of a
data item, given information on other data items. Although dependencies can be used for predictive
modeling, they are mostly used for understanding. Dependencies can be strict or probabilistic.
Associations are a special case of dependencies that have recently become very popular.
Associations describe affinities of data items (i.e., data items or events that frequently occur
together). A typical application scenario for associations is the analysis of shop- ping baskets.
There, a rule such as “in 30 percent of all purchases, beer and peanuts have been bought together,”
is a typical example of an association. Algorithms for detecting associations are very fast and
produce many associations. Selecting the most interesting ones is often a challenge.
OF DATA WAREHOUSING Volume 5 Number 4 Fall 2000
Dependency analysis has close connections to prediction and classification, where dependencies are
implicitly used for the formulation of predictive models. There also is a connection to concept
descriptions, which often highlight dependencies. In applications, dependency analysis often co-
occurs with segmentation. In large data sets, dependencies are seldom significant because many
influences overlay each other. In such cases, it is advisable to perform a dependency analysis on
more homogeneous segments of the data.
Sequential patterns are a special kind of dependencies where the order of events is considered. In
the shopping basket domain, associations describe dependencies between items at a given time.
Sequential patterns describe shopping patterns of one particular customer or a group of customers
over time.
Appropriate Techniques
Correlation analysis
Regression analysis

55
Association rules
Bayesian networks
Inductive Logic Programming
Visualization techniques
Example
Using regression analysis, a business analyst might find a significant dependency between the total
sales of a product and its price and the amount of the total expenditures for the advertisement. Once
the analyst discovers this knowledge, he or she can reach the desired sales level by changing the
price and/or the advertisement expenditure accordingly.

56
10 Appendix C: Sample of the Coding Matrix

57
11 Appendix D: Turnitin Report
The full turnitin report is attached with this dissertation as a softcopy
Originality report including quotes:
Similarity Index 5% Similarity by Source Internet Sources: 5% Publications: 1% Student Papers: 1%
Originality report excluding quotes:
Similarity Index 2% Similarity by Source Internet Sources: 1% Publications: 1% Student Papers: 1%

58
Bibliography
Anderson, C., 2008. The End of Theory: The Data Deluge Makes the Scientific Method
Obsolete. Available at: http://www.wired.com/science/discoveries/magazine/16-
07/pb_theory.
Bill Schmarzo, 2012. Big Data MBA: Course 101A – Unit II.
Bontempo, C. & Zagelow, G., 1998. The IBM data warehouse architecture. ACM, 41(9),
pp.38–48.
Boyd, D. & Kate Crawford, 2011. Six Provocation for Big Data. In A Decade in Internet
Time: Symposium on the Dynamics of the Internet and Society. Available at:
http://ssrn.com/abstract=1926431.
Carl McDaniel, J. & Gates, R., 2012. Marketing Research with SPSS, John Wiley & Sons.
Carter, P., 2011. Big Data Analytics: Future Architectures, Skills and Roadmaps for the
CIO, Available at: http://www.sas.com/resources/asset/BigDataAnalytics-
FutureArchitectures-Skills-RoadmapsfortheCIO.pdf.
Chui, M., 2011. Inside P&G’s digital revolution. McKinsey Quarterly. Available at:
https://www.mckinseyquarterly.com/Inside_PGs_digital_revolution_2893#.
Cohen, L., Manion, L. & Morrison, K., 2007. Research Methods in Education Sixth., New
York: Routledge.
Collis, J. & Hussey, R., 2003. Business Research 2nd, ed., Palgrave Macmillian.
Cooper, A. & Schendel, D., 1998. Strategic Resposes to technological threats. Business
Horizons, pp.61–69.
Creswell, J.W., 2009. Research design : Qualitative, quantitative and mixed methods
approaches, Los Angeles: Sage.
Davenport, T.H., 2006. Competing on analytics. Harvard Business Review, 84(1), pp.98–
107, 134. Available at: http://www.ncbi.nlm.nih.gov/pubmed/20929194.
Davenport, T.H., 2013. P&G Finds a “Goldmine” in Analytics. WSJ. Available at:
http://blogs.wsj.com/cio/2013/02/13/pg-finds-a-goldmine-in-analytics/ [Accessed
March 8, 2013].
Davenport, Thomas H, Barth, P. & Bean, R., 2012. How “Big Data” Is Different. MIT
Sloan Management Review, 54(1), pp.p43–46. Available at:
http://search.ebscohost.com/login.aspx?direct=true&db=ofm&AN=80437210
[Accessed October 31, 2012].

59
Davenport, Thomas H., Barth, P. & Bean, R., 2012. How “Big Data” Is Different. MIT
Sloan Management Review, 54(1), pp.p43–46. Available at:
http://search.ebscohost.com/login.aspx?direct=true&db=ofm&AN=80437210
[Accessed October 31, 2012].
Davenport, T.H. & Dyché, J., 2013. Big Data in Big Companies. International Institution
For Analytics. Available at: http://www.sas.com/resources/asset/Big-Data-in-Big-
Companies.pdf.
Eaton, C. et al., 2012. Understanding Big Data, McGraw-Hill.
Economist, 2010. Data, data everywhere. Economist Special Report. Available at:
http://www.economist.com/node/15557443.
Edd Dumbill, 2012. What is Big Data? In Planning for Big Data A CIO Handbook to the
Changing Data Landscape. New York: O’Reilly.
Evans, P. & Marco Annunziata, Industrial Internet: Pushing the Boundaries of Minds and
Machines, Available at: www.ge.com/docs/chapters/Industrial_Internet.pdf.
Fairchild, A.M., 2002. Knowledge Management Metrics via a Balanced Scorecard
Methodology. Hawaii International Conference on System Sciences, 00(35th), pp.1–8.
Fayyad, U., Piatetsky-Shapiro & G, Smyth, P., 1996. The KDD process for extracting
useful knowledge from volumes of data. Communications of the ACM, 39(11), pp.27–
34.
Fayyad, U.M., Piatetsky-Shapiro, G. & Smyth, P., 1996. From data mining to knowledge
discovery: an overview. In U M Fayyad et al., eds. Advances in Knowledge Discovery
and Data Mining. American Association for Artificial Intelligence, pp. 1–34.
Available at: http://portal.acm.org/citation.cfm?id=257942.
Ferguson, R.B., 2012. The Obama Election: Analytics Makes the Call. MITSloan
Management Review. Available at: http://sloanreview.mit.edu/article/the-obama-
election-analytics-makes-the-call/.
Fishman, C., 2003. The Wal-Mart You Don’t Know. Available at:
http://www.fastcompany.com/47593/wal-mart-you-dont-know.
Frank Gens, 2012. I D C P r e d i c t i o n s 2 0 1 3 : C o m p e t i n g o n t h e 3 r d P l a t f
o r m, Framingham, MA.
Gantz, B.J. & Reinsel, D., 2011. Extracting Value from Chaos State of the Universe : An
Executive Summary. , (June), pp.1–12.
Han, J., Micheline Kamber & Jian Pei, 2012. Data Mining Concepts and Techniques 3rd
Editio., Morgan Kaufmann.
60
Henschen, D., 2011. News P&G Turns Analysis Into Action. InfomrationWeeks. Available
at: http://www.informationweek.com/global-cio/interviews/pg-turns-analysis-into-
action/231600959.
Hussey, J. & Hussey, R., 1997. Business Research - a pratical guide for undergraduate and
postgraduate students, New York: Palgrave.
Kaplan, R.S., 2010. Conceptual Foundations of the Balanced Scorecard Conceptual
Foundations of the Balanced Scorecard 1. , pp.1–36.
Kaplan, R.S. & Norton, D.P., 1992. The Balanced Scorecard – Measures that Drive
Performance The Balanced Scorecard — Measures. Harvard business review,
(January-February), pp.70–79.
Kiron, D. & Shockley, R., 2012. Creating Business Value with Analytics. MIT Sloan
Management Review, 53(1), pp.57–63. Available at: http://sloanreview.mit.edu/the-
magazine/2012-spring/53310/creating-value-through-business-model-innovation/.
Kotler, P., Kartajaya, H. & Setiawan, I., 2010. Marketing 3.0: From Products to Customers
to the Human Spirit, Wiley. Available at:
http://books.google.com/books?hl=en&lr=&id=8pk60fGn50oC&oi=fn
d&pg=PR7&dq=Marketing+3.0:+From+Products+to+Customers+to+the+H
uman+Spirit&ots=Ln3_yFSW2v&sig=WiuhiW0QBbI4cWhYXC-
pg96GNtk.
LaValle, S., Lesser, E. & Shockley, R., 2011. Big data, analytics and the path from insights
to value. MIT sloan management …, (52205). Available at:
http://www.ibm.com/smarterplanet/global/files/in_idea_smarter_computing_to_big-
data-analytics_and_path_from_insights-to-value.pdf [Accessed October 28, 2012].
Lazer, D. et al., 2009. Computational Social Science. Science, 323(5915), pp.721–723.
Available at: http://www.sciencemag.org.
Linoff S., G. & Berry A., M.J., 2011. Data Mining Techniques For Marketing, Sales and
Customer Relation Management Third Edit., Indianapolis: Wiley Publishing Inc.
Lopez, K., 2001. lopez.pdf. Knowledge Managment Review, 4(1), pp.20–23.
Maanen, V., 1983. Qualitative Methodology, London: Sage.
Manovich, L., 2011. Trending: The Promises and the Challenges of Big Social Data M. K.
Gold, ed. Debates in the Digital Humanities, pp.1–10. Available at:
http://www.manovich.net/DOCS/Manovich_trending_paper.pdf.
Manyika, J. et al., 2011. Big data: The next frontier for innovation, competition, and
productivity, Available at:
http://scholar.google.com/scholar?hl=en&btnG=Search&q=intitle:Big+data+:+The+ne

61
xt+frontier+for+innovation+,+competition+,+and+productivity#0 [Accessed October
28, 2012].
Martinsons, M., Davison, R. & Tse, D., 1999. The balanced scorecard: a foundation for the
strategic management of information systems. Decision Support Systems, 25(1),
pp.71–88. Available at:
http://linkinghub.elsevier.com/retrieve/pii/S0167923698000864.
Mayer-Schönberger, V., Cukier, K. & Houghton Mifflin, 2013. Big Data, A Revolution
That Will Transform How We Live, Work, and Think.
Mintzberg, H., B, Q. & Ghoshal, S., 1999. The Strategy Process, Harlow, Harlow: Printice
Hall.
Murphy, C., 2012. Why P&G CIO Is Quadrupling Analytics Expertise. InfomrationWeeks.
Murphy, T., 2012. Meet Obama’s Digital Gurus. Mother Jones. Available at:
http://www.motherjones.com/politics/2012/10/obama-campaign-tech-staff [Accessed
February 29, 2013].
Nolan, R. & Mcfarlan, F.W., 2005. Information Technology and the Board of Directors.
Harvard Business Review, pp.96–106.
Patil, D., 2011. Building data science teams. O’Reilly Radar. Available at:
http://radar.oreilly.com/2011/09/building-data-science-teams.html [Accessed
November 17, 2012].
Paul C. Zikopoulos et al., 2012. Harnessing the Power Of Big Data, McGraw-Hill.
Available at:
http://public.dhe.ibm.com/common/ssi/ecm/en/imm14100usen/IMM14100USEN.PDF
.
Pettey, C. & Meulen, R. van der, 2012. Gartner’s 2012 Hype Cycle for Emerging
Technologies Identifies “Tipping Point” Technologies That Will Unlock Long-
Awaited Technology Scenarios. Gartner. Available at:
http://www.gartner.com/it/page.jsp?id=2124315.
Philip Russom, 2011. Big Data Analytics,
Rijmenam, V., 2013. Walmart Makes Big Data Part of Its DNA. Available at:
http://smartdatacollective.com/bigdatastartups/111681/walmart-makes-big-data-part-
its-social-media.
SAS, 2012. Big Data Meets Big Data Analytics Three Key Technologies for Extracting
Real-Time Business Value from the Big Data That Threatens to Overwhelm
Traditional Computing Architectures, Available at:
http://www.sas.com/resources/whitepaper/wp_46345.pdf.

62
Saunders, M., Lewis, P. & Thornhill, A., 2009. for business students fi fth edition Fifth.,
Edinburgh: Pearson Education.
Scherer, M., 2012. Inside the Secret World of the Data Crunchers Who Helped Obama
Win. TIME. Available at: http://swampland.time.com/2012/11/07/inside-the-secret-
world-of-quants-and-data-crunchers-who-helped-obama-win/.
Shearer, C., 2000. The CRISP-DM Model: The New Blueprint for Data Mining. JOURNAL
OF DATA WAREHOUSING, 5, pp.13–22.
Strauss, A. & Corbin, J., 1998. Basics of Qualitative research Techniques and Procedures
for Developing Grounded Theory, London: Sage.
Stubbs, E., 2011. The Value of Business Analytics, John Wiley & Sons.
Vellante, D., 2013. The GE Pivotal Announcement: Rewriting the Rules of Big Data and
Internet of Things. Available at: http://siliconangle.com/blog/2013/04/24/the-ge-
pivotal-announcement-rewriting-the-rules-of-big-data-and-internet-of-things/.
Wadhwa, T., 2012. Nate Silver and the Rise of Political Data Science. HUFF POST
POLICITCS. Available at: http://www.huffingtonpost.com/tarun-wadhwa/nate-silver-
election-predictions_b_2090909.html.
WalMart, 2013. Walmart 2012 Annual Report, Available at:
http://www.walmartstores.com/sites/annual-report/2012/WalMart_AR.pdf.
Wim Van Grembergen, Saull, R. & Steven De Haes, 2004. Linking the IT Balanced
Scorecard to the Business Objectives at a Major Canadian Financial group. UAMS,
(11/27). Available at: www.uams.be/itag.