Big Data in the construction industry: A review of present ...
36
Big Data in the construction industry: A review of present status, opportunities, and future trends Bilal, M, Oyedele, LO, Qadir, J, Munir, K, Ajayi, SO, Akinade, OO, Owolabi, HA, Alaka, HA & Pasha, M Author post-print (accepted) deposited by Coventry University’s Repository Original citation & hyperlink: Bilal, M, Oyedele, LO, Qadir, J, Munir, K, Ajayi, SO, Akinade, OO, Owolabi, HA, Alaka, HA & Pasha, M 2016, 'Big Data in the construction industry: A review of present status, opportunities, and future trends' Advanced Engineering Informatics, vol 30, no. 3, pp. 500- 521 https://dx.doi.org/10.1016/j.aei.2016.07.001 DOI 10.1016/j.aei.2016.07.001 ESSN 2352-7102 Publisher: Elsevier NOTICE: this is the author’s version of a work that was accepted for publication in Advanced Engineering Informatics. Changes resulting from the publishing process, such as peer review, editing, corrections, structural formatting, and other quality control mechanisms may not be reflected in this document. Changes may have been made to this work since it was submitted for publication. A definitive version was subsequently published in Advanced Engineering Informatics, [3, 30, (2016)] DOI: 10.1016/j.aei.2016.07.001 © 2016, Elsevier. Licensed under the Creative Commons Attribution-NonCommercial- NoDerivatives 4.0 International http://creativecommons.org/licenses/by-nc-nd/4.0/ Copyright © and Moral Rights are retained by the author(s) and/ or other copyright owners. A copy can be downloaded for personal non-commercial research or study, without prior permission or charge. This item cannot be reproduced or quoted extensively from without first obtaining permission in writing from the copyright holder(s). The content must not be changed in any way or sold commercially in any format or medium without the formal permission of the copyright holders. This document is the author’s post-print version, incorporating any revisions agreed during the peer-review process. Some differences between the published version and this version may remain and you are advised to consult the published version if you wish to cite from it.
Transcript of Big Data in the construction industry: A review of present ...

Big Data in the construction industry: A review of present status, opportunities, and future trends Bilal, M, Oyedele, LO, Qadir, J, Munir, K, Ajayi, SO, Akinade, OO, Owolabi, HA, Alaka, HA & Pasha, M Author post-print (accepted) deposited by Coventry University’s Repository Original citation & hyperlink:
Bilal, M, Oyedele, LO, Qadir, J, Munir, K, Ajayi, SO, Akinade, OO, Owolabi, HA, Alaka, HA & Pasha, M 2016, 'Big Data in the construction industry: A review of present status, opportunities, and future trends' Advanced Engineering Informatics, vol 30, no. 3, pp. 500-521 https://dx.doi.org/10.1016/j.aei.2016.07.001
DOI 10.1016/j.aei.2016.07.001 ESSN 2352-7102 Publisher: Elsevier NOTICE: this is the author’s version of a work that was accepted for publication in Advanced Engineering Informatics. Changes resulting from the publishing process, such as peer review, editing, corrections, structural formatting, and other quality control mechanisms may not be reflected in this document. Changes may have been made to this work since it was submitted for publication. A definitive version was subsequently published in Advanced Engineering Informatics, [3, 30, (2016)] DOI: 10.1016/j.aei.2016.07.001 © 2016, Elsevier. Licensed under the Creative Commons Attribution-NonCommercial-NoDerivatives 4.0 International http://creativecommons.org/licenses/by-nc-nd/4.0/ Copyright © and Moral Rights are retained by the author(s) and/ or other copyright owners. A copy can be downloaded for personal non-commercial research or study, without prior permission or charge. This item cannot be reproduced or quoted extensively from without first obtaining permission in writing from the copyright holder(s). The content must not be changed in any way or sold commercially in any format or medium without the formal permission of the copyright holders. This document is the author’s post-print version, incorporating any revisions agreed during the peer-review process. Some differences between the published version and this version may remain and you are advised to consult the published version if you wish to cite from it.
1
Big Data in the Construction Industry: A Review ofPresent Status, Opportunities, and Future Trends
Abstract—The ability to process large amounts of data and1
to extract useful insights from data has revolutionised society.2
This phenomenon—dubbed as Big Data—has applications for a3
wide assortment of industries, including the construction industry.4
The construction industry already deals with large volumes of5
heterogeneous data; which is expected to increase exponentially6
as technologies such as sensor networks and the Internet of7
Things are commoditized. In this paper, we present a detailed8
survey of the literature, investigating the application of Big Data9
techniques in the construction industry. We reviewed related10
works published in the databases of American Association of11
Civil Engineers (ASCE), Institute of Electrical and Electronics12
Engineers (IEEE), Association of Computing Machinery (ACM),13
and Elsevier Science Direct Digital Library. While the application14
of data analytics in the construction industry is not new, the15
adoption of Big Data technologies in this industry remains at a16
nascent stage and lags the broad uptake of these technologies in17
other fields. To the best of our knowledge, there is currently no18
comprehensive survey of Big Data techniques in the context of19
the construction industry. This paper fills the void and presents a20
wide-ranging interdisciplinary review of literature of fields such21
as statistics, data mining and warehousing, machine learning, and22
Big Data Analytics in the context of the construction industry.23
We discuss the current state of adoption of Big Data in the24
construction industry and discuss the future potential of such25
technologies across the multiple domain-specific sub-areas of the26
construction industry. We also propose open issues and directions27
for future work along with potential pitfalls associated with Big28
Data adoption in the industry.29
I. INTRODUCTION30
The world is currently inundated with data, with fast advanc-31
ing technology leading to its steady increase. Today, companies32
deal with petabytes (1015 bytes) of data. Google processes33
above 24 petabytes of data per day [1], while Facebook gets34
more than 10 million photos per hour [1]. The glut of data35
increased in 2012 is approximately 2.5 quintillion (1018) bytes36
per day [2]. This data growth brings significant opportunities37
to scientists for identifying useful insights and knowledge.38
Arguably, the accessibility of data can improve the status39
quo in various fields by strengthening existing statistical and40
algorithmic methods [3], or by even making them redundant41
[4].42
The construction industry is not an exception to the per-43
vasive digital revolution. The industry is dealing with sig-44
nificant data arising from diverse disciplines throughout the45
life cycle of a facility. Building Information Modelling (BIM)46
is envisioned to capture multi-dimensional CAD information47
systematically for supporting multidisciplinary collaboration48
among the stakeholders [5]. BIM data is typically 3D ge-49
ometric encoded, compute intensive (graphics and Boolean50
computing), compressed, in diverse proprietary formats, and 51
intertwined [6]. Accordingly, this diverse data is collated in 52
federated BIM models, which are enriched gradually and 53
persisted beyond the end-of-life of facilities. BIM files can 54
quickly get voluminous, with the design data of a 3-story 55
building model easily reaching 50GB in size [7]. Noticeably, 56
this data in any form and shape has intrinsic value to the 57
performance of the industry. With the advent of embedded 58
devices and sensors, facilities have even started to generate 59
massive data during the operations and maintenance stage, 60
eventually leading to more rich sources of Big BIM Data. This 61
vast accumulation of BIM data has pushed the construction 62
industry to enter the Big Data era. 63
Big Data has three defining attributes (a.k.a. 3V‘s), namely 64
(i) volume (terabytes, petabytes of data and beyond); (ii) 65
variety (heterogeneous formats like text, sensors, audio, video, 66
graphs and more); and (iii) velocity (continuous streams of the 67
data). The 3V‘s of Big Data are clearly evident in construction 68
data. Construction data is typically large, heterogeneous, and 69
dynamic [8]. Construction data is voluminous due to large 70
volumes of design data, schedules, Enterprise Resource Plan- 71
ning (ERP) systems, financial data, etc. The diversity of con- 72
struction data can be observed by noting the various formats 73
supported in construction applications including DWG (short 74
for drawing), DXF (drawing exchange format), DGN (short for 75
design), RVT (short for Revit), ifcXML (Industry Foundation 76
Classes XML), ifcOWL (Industry Foundation Classes OWL), 77
DOC/XLS/PPT (Microsoft format), RM/MPG (video format), 78
and JPEG (image format). The dynamic nature of construction 79
data follows from the streaming nature of data sources such 80
as Sensors, RFIDs, and BMS (Building Management System). 81
Utilising this data to optimise construction operations is the 82
next frontier of innovation in the industry. 83
[Fig. 1 about here.] 84
To understand the subtleties of Big Data, we need to 85
disambiguate between two of its complementary aspects: Big 86
Data Engineering (BDE) and Big Data Analytics (BDA). The 87
domain of BDE is primarily concerned with supporting the 88
relevant data storage and processing activities, needed for 89
analytics [9]. BDE encompasses technology stacks such as 90
Hadoop and Berkeley Data Analytics Stack (BDAS). Big Data 91
Analytics (BDA), the second integral aspect, relates to the tasks 92
responsible for extracting the knowledge to drive decision- 93
making [9]. BDA is mostly concerned with the principles, 94
processes, and techniques to understand the Big Data. The 95
essence of BDA is to discover the latent patterns buried 96
inside Big Data and derive useful insights therefrom [10]. 97
These insights have the capability to transform the future 98
of many industries through data-driven decision-making. This 99
2
ability to identify, understanding and reacting to the latent1
trends promptly is indeed a competitive edge in this hyper-2
competitive era.3
Contributions of this paper: While some data-driven so-4
lutions have been proposed for the fields of the construction5
industry, there is currently no comprehensive survey of the6
literature, targeting the application of Big Data in the context7
of the construction industry. This paper fills the void and8
presents a wide-ranging interdisciplinary study of fields such as9
Statistics, Data Mining and Warehousing, Machine Learning,10
Big Data and their applications in the construction industry.11
Organization of this paper: The discussion in this paper12
follow the review structure shown in Fig. 1. We start with a13
thorough review of extant literature on BDE and BDA in the14
construction industry in Section II and III, respectively. After15
which, opportunities of Big Data in the construction industry16
sub-domains are presented in Section IV. Discussions about17
open research issues and future work, and pitfalls of Big Data18
in the construction industry are then presented in Section V19
and VI, respectively.20
II. BIG DATA ENGINEERING (BDE)21
Big Data Engineering (BDE) provide infrastructure to sup-22
port Big Data Analytics (BDA). Some discussions about the23
Big Data platforms worth consideration to understand the BDE24
adequately. Various Big Data platforms are developed so far25
with varied characteristics, which can be divided into two26
groups: (i) horizontal scaling platforms (HSPs), the ones that27
distribute processing across multiple servers and scale out by28
adding new machines to the cluster. (ii) And vertical scaling29
platforms (VSPs), in which scaling is achieved by upgrading30
hardware (processor or memory or disk) of the underlying31
server since it is a single server-based configuration. In the32
interest of brevity of this paper, the discussion here is confined33
to HSPs, notably Hadoop and BDAS only. We refer interested34
readers to Singh et al. [11] for a detailed explanation on their35
comparison and selection criterion.36
Due to clear performance gains of BDAS over Hadoop, it37
is getting more attention recently. However, BDAS is in its38
infancy with limited support and supporting tools. Whereas,39
Hadoop is still widely adopted and has become the de-40
facto framework for Big Data applications. These platforms41
offer tools to store and process Big Data. Some of the most42
prominent tools are discussed in the subsequent sections.43
A. Big Data Processing44
[Fig. 2 about here.]45
Parallel and distributed computation is at the core of BDE.46
A large number of processing models are developed for this47
purpose, which includes but not limited to:48
1) MapReduce (MR): MR is the distributed processing49
model to handle Big Data [13]. The entire analytical tasks50
in MR are written as two functions, i.e., map and reduce51
(see Fig. 2), which are submitted to separate processes called52
Mappers and Reducers. Mapper read data, process it, and gen-53
erate intermediate results. Reducers work on mappers’ output54
and produce final results which are stored back to the file 55
system. Hadoop—a popular Big Data platform—introduced 56
MR initially to the wider public and provided an ecosystem 57
to execute MR programs successfully. In a typical Hadoop 58
cluster, several mappers and reducers simultaneously run MR 59
programs. MR is a powerful model for batch-processing tasks. 60
However, it is struggling with applications that require real- 61
time, graph, or iterative processing. Latest versions of Hadoop 62
have encountered this issue to some extent where processing 63
aspect of MR is detached from rest of the ecosystem. To this 64
end, Yet Another Resource Negotiator (YARN) is introduced 65
that has taken Hadoop to an actually computationally-agnostic 66
Big Data platform. MR runs as a service over YARN, while 67
YARN handles scheduling and resource management related 68
functionalities. This separation has made Hadoop suitable for 69
implementing innovative applications. 70
2) Directed Acyclic Graphs (DAG): DAG is an alternative 71
processing model for Big Data platforms. In contrary to MR, 72
DAG relaxes the rigid map-then-reduce style of MR to a more 73
generic notion. BDAS—an emerging Big Data platform— 74
supports this kind of data processing through its resilient 75
component called Spark [14]. Spark holds supremacy over MR 76
in many aspects. Particularly, in-memory computation and high 77
expressiveness are keys to wider adoption of Spark. These 78
capabilities heralded the Spark a natural choice to support 79
iterative as well as reactive applications [14]. Spark is reported 80
to have ten times faster than MR on disk-resident tasks, 81
whereas hundred times faster for memory-resident tasks [11]. 82
Fig. 3 shows components of Spark. These technologies are 83
designed to support functions that are vital to the development 84
of enterprise applications. 85
[Fig. 3 about here.] 86
Examples of Construction Research using Big Data 87
Processing: MR and Spark have use cases across myriad 88
information systems (IS) of the construction industry. Despite 89
significance, these tools are rarely used to process BIM data 90
in construction industry applications. 91
Chang et al. [16] customised MR for BIM data (MR4B) 92
to optimise the retrieval of partial BIM models. They found 93
legacy data distribution logic of Hadoop MR inadequate, since 94
BIM data is intertwined as well as highly relative, and merely 95
placing it randomly might sparsely distribute BIM elements 96
across different blocks on Hadoop cluster nodes. Such place- 97
ment degrades querying performance due to increased disk 98
I/O required to bring sparsely distributed data together for 99
analysis using MR. To overcome this, a data pre-partition 100
and processing step is devised to parse, analyse and partition 101
logically relevant parts of BIM data (by floor number or 102
material family) and store it in the adjacent spaces on the 103
Hadoop cluster. Node multi-threading is introduced to utilise 104
the CPU maximally during analysis [16]. This way Hadoop 105
is customised for BIM data and querying components are 106
implemented as YARN applications. A BIM system for clash 107
detection and quantity estimation is developed to exploit the 108
proposed YARN applications. It is reported that the system has 109
improved the performance manifold, and the required tasks are 110
3
executed at real time with reasonable response time.1
Lin et al. [7] presented the development of a specialised big2
BIM data storage and retrieval system for experts and naive3
BIM users. The intentions are to develop a highly interactive4
user interface for querying BIM data through mobile devices5
to maximise its utility and usability. User queries in plain6
English are re-formulated using the proposed natural language7
processing approach to retrieve highly complex BIM data,8
which are mapped onto a variety of visualisations. To optimise9
query execution, an MR join pre-processing is demonstrated10
to merge two BIM collections before query evaluation. The11
response time is reported to have enhanced by more than 40%12
compared to the same join pre-processing written in traditional13
technologies.14
B. Big Data Storage15
Another aspect of BDE is the Big Data storage, which is16
provided either by the distributed file systems or emerging17
NoSQL databases. These technologies are briefly discussed in18
the following subsections.19
1) Distributed File Systems: In this subsection, we are20
discussing two competing distributed file systems, namely21
HDFS and Tachyon.22
• Hadoop Distributed File System (HDFS)—HDFS is23
suitably designed for managing the larger datasets [17].24
It is designed specifically to work with a cluster of com-25
modity servers. Since the chances of hardware failure are26
higher in such settings, it provides greater fault tolerance27
for hardware failures. Data distribution and replications28
are the key traits of HDFS to achieve the fault tolerance29
and high availability. There are however situations when30
the usage of HDFS degrades performance, particularly in31
applications requiring low-latency data access. Similarly,32
it is also not ideal for storing a large number of small33
files due to the associated overhead for managing their34
metadata. Lastly, HDFS is not the choice of technology35
if applications require a significant number of concurrent36
modifications at random places in data.37
• Tachyon is the BDAS flagship distributed file system38
that extends HDFS and provides access to the distributed39
data at memory speed across the cluster. Some of the40
features where Tachyon has outsmarted HDFS include:41
(i) in-memory data caching for enhanced performance42
and (ii) backwards compatibility to work seamlessly43
with Spark as well as MR tasks without any code44
changes required to the programs.45
2) NoSQL Databases: Relational databases served IT in-46
dustry for the past couple of decades as de facto data man-47
agement standard. However, recently applications emerged48
that demanded more scalability, performance, and flexibility.49
Relational databases are found unsuitable for these applications50
due to their specialised storage and processing needs. Conse-51
quently, new systems came into being—called “Not only SQL”52
(NoSQL) systems—to fill this technological gap. NoSQL sys-53
tems improved traditional data management in numerous ways.54
More importantly, NoSQL systems eschew the rigid schema- 55
oriented storage in favour of schema-less storage to achieve 56
flexibility [18]. Today these systems are prevalent in myriad 57
data-intensive applications in many industries. Pointedly, the 58
architecture of NoSQL systems is well suited to fragmented 59
nature of construction industry’s data. 60
NoSQL systems store schema-less data in a non-relational 61
data model. Presumably, there are four data models for these 62
systems. 63
1) Key-Value: This is the simplest data model to store 64
unstructured data. However, the underlying data is not 65
self-describing. 66
2) Document: This data model is suitable for storing self- 67
describing entities. However, the storage of this model 68
can be inefficient. 69
3) Columnar: This data model favours the storage of sparse 70
datasets, grouped sub-columns, and aggregated columns. 71
4) Graph: This is a relatively new data model that supports 72
relationship traversal over a huge dataset of property- 73
graphs. Graph databases are getting popular than other 74
data models (see Fig. 4, where the x-axis represents 75
the period of popularity and y-axis shows a change in 76
popularity). Table VIII describes features of 12 prominent 77
databases. 78
[TABLE 1 about here.] 79
[Fig. 4 about here.] 80
Examples of Construction Research using Big Data 81
Storage: Despite significance for massive BIM data storage, 82
existing applications are still lacking their successful imple- 83
mentation. Das et al. [20] proposed Social-BIM to capture 84
social interactions of users along with the building models. 85
A distributed BIM framework, called BIMCloud, is developed 86
to store this data through IFC. Apache Cassandra, hosted 87
on Amazon EC2, is used. Jeong et al. [21] proposed a 88
hybrid data management infrastructure comprised two tiers. 89
The client tier that utilises MongoDB for storing the structured 90
data temporarily for efficiently completing analytical tasks, 91
whereas, the central tier employs Apache Cassandra to store 92
permanently the streams of sensor data generated over time. 93
Cheng et al. [22] have also employed the Apache Cassandra for 94
presenting their query language to extract partial BIM models. 95
Similarly, Lin et al. [7] exploited MongoDB to store BIM data 96
of building models for distributed processing through MapRe- 97
duce. MongoDB is tailored for IFC, with minor alterations to 98
IFC hierarchy for supporting MR-efficient query execution. 99
III. BIG DATA ANALYTICS 100
Big Data Analytics has a rich intellectual tradition and 101
borrows from a wide variety of fields. There have been 102
traditionally many related disciplines that have essentially the 103
same core focus: finding useful patterns in data (but with a 104
different emphasis). These related fields are Statistics (18301) 105
1While it can be difficult to pin down the exact time of genesis of atechnology, the year in which the domain’s seminal work was proposed isprovided to approximately sequence the various Big Data Analytics enablingtechnologies chronologically.

4
[23], Data Mining (1980), Predictive Analytics (1989 [24]),1
Business Analytics (1997), Knowledge Discovery from Data2
(KDD) (2002), Data Analytics (2010), Data Science (2010)3
and now Big Data (2012). Fig. 5 shows the relevance of these4
multidisciplinary fields to Big Data. So, Big Data Analytics5
is a broadening of the field of data analytics and incorporates6
many of the techniques that have already been performed. This7
is the key reason that most of the existing work, presented in8
subsequent subsections, has focused on data analytics rather9
than Big Data is that the Big Data revolution—i.e., the ability10
to process large amounts of diverse data on a large scale—has11
only recently happened. Existing approaches can be possibly12
extended to the environments, dealing with large, diverse13
datasets.14
[TABLE 2 about here.]15
Some ML-based tools have been developed for Big Data16
analytics. Table IX highlight some of the important ones. To17
showcase the implementation of BDA, we use MLlib (MLbase)18
code in the subsequent subsections.19
[Fig. 5 about here.]20
1) Statistics: In scientific studies, rigorous and efficient21
techniques are used to answer research questions. Careful22
observations (data) comprise the backbone of underpinning23
investigations. Statistics is the study of collecting, analysing,24
and drawing conclusions from the data, with the primary25
focus on selecting the right tools and techniques at every26
data analysis stage [29]. Right from the data collections,27
to efficiently analysing it, and then inferring or formulating28
conclusions out of it, all of these steps comes under the scope29
of statistics [30]. Various fields of analytics are borrowing30
techniques from statistics [29].31
Examples of Construction Research using Statistics: The32
industry is employing statistical methods in a variety of appli-33
cation areas, such as identifying causes of construction delays34
[31], learning from post-project reviews (PPRs) [32], decision35
support for construction litigation [33], detecting structural36
damages of buildings [34], identifying actions of workers and37
heavy machinery [35], [36], etc., are to name a few.38
[TABLE 3 about here.]39
2) Data Mining: Data Mining is concerned with the au-40
tomatic or semi-automatic exploration and analysis, of large41
volumes of data, to discover meaningful patterns or rules.42
Data Mining has the broader scope than other traditional data43
analysis fields (such as statistics) since it tends to answer44
non-trivial questions [37], [38]. For patterns discovery and45
extraction, Data Mining is primarily based on the technique(s)46
from statistics, machine learning, and pattern recognition [39],47
[40]. Several models are created and tested to assess the suit-48
ability of particular technique(s) for solving the given business49
problem. Models with the highest accuracy and tolerance are50
chosen and applied to the actual data for generating predictive51
results (including predictions, rules, probability, and predictive52
confidence).53
Databases are crucial to empowering various aspects of 54
data mining, in particular by taking care of the activities of 55
efficient data access, group and ordering of operations and 56
optimising the queries to scale up data mining algorithms. 57
Databases provide native support for analytics in the form 58
of data warehousing. In data warehousing, the copy of the 59
transactional data is stored specifically structured for querying 60
and the analysis [37], [41]. The transactional data is collated 61
from the operational databases using a process usually known 62
as Extract, Transform, and Load (ETL) [42]. Data in the 63
warehouse is typically analysed through the Online Analytical 64
Processing (OLAP). OLAP outperforms SQL in computing the 65
summaries (roll-up) and breakdown (roll-down) of the data. 66
Examples of Construction Research using Data Mining: 67
Kim et al. [31] employed data mining techniques to identify 68
the key factors that cause delays in construction projects. They 69
presented knowledge discovery in databases (KDD) framework 70
to analyse massive construction datasets. Limitations of ML 71
algorithms (such as incorrect prediction) are discussed and 72
overcome through statistical methods. Buchheit et al. [43] also 73
presented KDD process for the construction industry. Data 74
preprocessing is found to be the most challenging and time- 75
consuming step. Also, Soibelman et al. [44] illustrated the 76
applicability of KDD to construction datasets for identifying 77
causes of construction delays, cost overrun, and quality con- 78
trols. 79
Carrilli et al. [32] used data mining to learn from past 80
projects and improve future project delivery. Approaches such 81
as text analysis, link analysis and dimensional matrix analysis 82
are performed on data from multiple projects. Liao et al. [45] 83
employed association rule mining to proactively prevent oc- 84
cupational injuries. In another similar study [46], data mining 85
is used to explore the causes and distribution of occupational 86
injuries and revealed that falls and collapses are the primary 87
reasons of occupational fatalities. While Oh et al. [47] em- 88
ployed DW in construction productivity data, which is utilised 89
using a multi-layer analysis through OLAP in the proposed 90
system. SQL is quite prevalent in the industry for querying 91
partial BIM models query languages such as Express Query 92
Language (EQL) and Building Information Modelling Query 93
Language (BIMQL) are developed in the various construction 94
industry sub-domain applications [48], [49]. 95
These datasets underlying the identification of causes of 96
delays, learning from PPRs, BIM-based knowledge discovery, 97
preventing occupational injury, among others, evidently present 98
the 3V‘s of Big Data, and these applications can easily be 99
extended to this emerging revolution of Big Data Analytics 100
for features like efficiently processing querying partial BIM 101
models. 102
[TABLE 4 about here.] 103
3) Machine Learning Techniques: Machine learning (ML), 104
a sub-field of Artificial Intelligence (AI), focuses on the task 105
of enabling computational systems to learn from data about 106
specific task automatically. ML tasks can be categorized into: 107
i) classification (or supervised learning); ii) clustering (or 108
unsupervised learning); iii) association; iv) numeric prediction 109

5
[51].1
ML has many applications across the construction applica-2
tions, such as the modelling of judicial reasoning and pre-3
dicting the outcomes of litigation is thoroughly studied using4
rule-based learning approaches [52], artificial neural networks5
methods [53], [54], [55], case-based reasoning techniques [56],6
[57], and hybrid methodologies [58], [59]. Such applications7
are discussed by ML techniques in the subsequent sections.8
A. Regression Techniques9
Regression is the supervised ML method, which is con-10
cerned about predicting the numerical value of a target variable11
based on input variables. For instance, estimating the cost of12
the design based on design specifications. Regression can be of13
the following types. The simple linear regression that is used14
for modelling the relationship between a dependent variable y15
and one explanatory variable x. Multiple linear regression that16
is used for modelling the relationship between one dependent17
variable (continuous) and two or more explanatory variables.18
This is commonly used regression approach. The logistic19
regression that is used for modelling the relationship between20
on categorical dependent variable and one or more explanatory21
variables. Listing 1 shows the MLlib code to demonstrate22
loading data, customising regression algorithm, developing the23
model, and finally using it to predict data point.24
1 v a l d f = s q l C o n t e x t . c r e a t e D a t a F r a m e ( d a t a ) .25
2 toDF ( ” l a b e l ” , ” f e a t u r e s ” )26
327
4 v a l r e g = new L o g i s t i c R e g r e s s i o n ( ) . s e t M a x I t e r ( 1 5 )28
5 v a l model = r e g . f i t ( d f )29
6 v a l w e i g h t s = model . w e i g h t s30
7 model . t r a n s f o r m ( d f ) . show ( )31
832
933
Listing 1. A Snapshot of MLlib Code for Regression Analysis
Examples of Construction Research using Regression: Siu34
et al. [60] employed regression for predicting the cycle times35
of construction operations using least-square-error and least-36
mean-square. The approach is evaluated on a project installing37
Viaduct Bridge and is reported to have higher accuracy of38
predictions. Aibinu et al. [61] employed linear regression for39
identifying the delays on construction projects. Their findings40
reveal that cost and time overruns are frequently occurring41
delay factors. Similarly, Sambasivan et al. [62] studied relation-42
ship between the cause and effect of delays in the Malaysian43
construction industry using regression models.44
Trost et al. [63] used multivariate regression analysis for45
predicting the accuracy of estimate during the early stages of46
construction projects. Estimates are given scores for gaining47
prediction accuracy. The results reveal that estimate score48
model is predicting the accuracy with very high significance.49
Chan et al. [64] employed multiple regression analysis for50
predicting the partnering success of contracting parties.51
Fang et al. [65] applied logistic regression analysis to52
explore the relationship between safety climate and individual53
behaviour. The results demonstrate the vivid relationship of54
safety climate and personal behaviour such as gender, marital55
status, education level, number of family members to support, 56
safety knowledge, drinking habits, direct employer, and indi- 57
vidual safety behaviour. 58
B. Classification Techniques 59
Classification is the supervised learning technique in which 60
programs emulate decisions automatically based on the pre- 61
viously made correct decisions. The input to classification 62
algorithms is a particular set of features, and the output is to 63
make a single selection from a short list of choices (categorical 64
or mutually exclusive). It suits situations where single but more 65
focused decisions are involved. Since these algorithms learn 66
by examples, carefully crafted examples of correct decisions 67
aside with input data are vital for algorithms to learn pre- 68
cisely. These algorithms learn to mimic the examples of right 69
decisions contrary to clustering in which algorithms decide 70
on their own without prior guidance. Classification intends 71
to choose a single choice from the limited set of possible 72
choices. Prominent classification algorithms include Logistic 73
Regression, Naive Bayes, Decision Trees, and Support Vector 74
Machine (SVM). These algorithms are slightly discussed in 75
the subsequent sections. 76
1) Naive Bayes Classifier: Naive Bayes is very simple but 77
the popular algorithm to create a broad class of ML classifiers 78
for diverse industrial applications. It is used to calculate the 79
joint probabilities of values with their attributes (features) 80
within the given set of cases. The attributes are considered 81
independent of each other, and this consideration is known as 82
naive assumption of conditional independence. The classifier 83
makes this assumption while evaluating cases. The classifi- 84
cation is made by taking into account the prior information 85
and likelihood of incoming information to constitute posteriori 86
probability model, which can be denoted by the following 87
expression. 88
Posterior = (Prior ∗ Likelihood)/Evidence (1)
Listing 2 shows MLlib code for Naive Bayes classifier, where 89
data is split into training (60%) and test (40%), and model is 90
built and used for making predictions. 91
1 v a l s p l i t s = p a r s e d D a t a . r a n d o m S p l i t ( Array ( 0 . 6 , 0 . 4 ) , 92
s eed = 11L ) 93
2 v a l t r a i n i n g = s p l i t s ( 0 ) 94
3 v a l t e s t = s p l i t s ( 1 ) 95
4 v a l model = NaiveBayes . t r a i n ( t r a i n i n g , lambda = 1 . 0 , 96
modelType = ” m u l t i n o m i a l ” ) 97
5 v a l p r e d i c t i o n A n d L a b e l = t e s t . map ( p => ( model . 98
p r e d i c t ( p . f e a t u r e s ) , p . l a b e l ) ) 99
6 v a l a c c u r a c y = 1 . 0 ∗ p r e d i c t i o n A n d L a b e l . f i l t e r ( x => 100
x . 1 == x . 2 ) . c o u n t ( ) / t e s t . c o u n t ( ) 101
Listing 2. A Snippet of MLlib Code for Naive Bayes
Examples of Construction Research using Naive Bayes 102
Classifiers: Jiang et al. [34] presented a Bayesian probabilis- 103
tic methodology for detecting the structural damages. Bayes 104
factor evaluation metric is computed from Bayes theorem 105
and Gaussian distribution assumption for accurate damage 106
identification. The effectiveness of the proposed techniques 107
is reported for assessing damage confidence of structures 108

6
over five damaged scenarios of four-story buildings bench-1
mark. Gong et al. [35] presented a framework for automated2
classification of actions of workers and heavy machinery3
in complex construction scenarios. They employed Bag-of-4
Video-Features-Model alongside the Bayesian probability for5
evaluating and tuning action discovery. It is revealed that the6
proposed approach is capable of identifying several actions7
in highly complex situations and is faster than the traditional8
methods. Huang et al. [36] studied the effect of severe loading9
events, namely earthquakes or long environmental degradation,10
on civil structures. A Bayesian probabilistic framework is11
proposed to compute the stiffness reduction. Using simulated12
data, the proposed approach is found to measure the stiffness13
accurately. The approaches as mentioned earlier are reportedly14
revealed as compute-intensive; hence require contemporary15
Big Data technologies for enhanced accuracy and response.16
[TABLE 5 about here.]17
2) Decision Trees: Decision trees (DTs) is the modern ML18
method for predicting about qualitative and quantitative target19
features. The process of building DT begins with identifying20
decision node and then recursively split nodes until no further21
divisions are possible. The robustness of DT depends on the22
logic for splitting nodes, which is assessed by using concepts23
such as information gain (IG) or entropy reduction. Listing24
3 shows MLlib code to show DTs implementation; the data25
is split into training and testing sets, initialized parameters,26
created DT, and evaluated the model using data.27
1 v a l s p l i t s = d a t a . r a n d o m S p l i t ( Array ( 0 . 7 , 0 . 3 ) )28
2 v a l ( t r a i n D a t a , t e s t D a t a ) = ( s p l i t s ( 0 ) , s p l i t s ( 1 ) )29
3 v a l numClasses = 230
4 v a l c a t e g o r i c a l F e a t u r e s I n f o = Map[ I n t , I n t ] ( )31
5 v a l i m p u r i t y = ” g i n i ”32
6 v a l maxDepth = 533
7 v a l maxBins = 3234
8 v a l model = D e c i s i o n T r e e . t r a i n C l a s s i f i e r ( t r a i n D a t a ,35
numClasses , c a t e g o r i c a l F e a t u r e s I n f o , i m p u r i t y ,36
maxDepth , maxBins )37
9 v a l l a b e l A n d P r e d s = t e s t D a t a . map { p o i n t => v a l38
p r e d i c t i o n = model . p r e d i c t ( p o i n t . f e a t u r e s ) (39
p o i n t . l a b e l , p r e d i c t i o n )40
Listing 3. A Snippet of MLlib Code for Decision Trees
Examples of Construction Research using Decision Trees:41
Pietrzyk et al. [66] studied the issue of mould germination in42
building structures using fault tree analysis. Structure related43
deficiencies that are introduced during the construction process44
are identified and classified. A probabilistic quantification45
model is generated to compare building structures based on46
their tendency for mould germination. Desai et al. [67] have47
employed decision trees to analyse and assess the labour pro-48
ductivity in the construction industry. The traditional decision49
tree algorithm is slightly customised to suit construction data,50
which is reported to have improved the accuracy of proposed51
methodology, with more realistic results are obtained.52
3) Support Vector Machines (SVM): SVM is a widely53
used technique that is remarkable for being practical and54
theoretically sound, simultaneously. SVM is rooted in the field55
of statistical learning theory, and is systematic: e.g., training56
an SVM has a unique solution (since it involves optimisation 57
of a concave function). SVM uses kernel methods to map data 58
from input/parametric space to higher level dimensional feature 59
space. Listing 4 shows MLlib code to illustrate SVM, where 60
algorithm builds a model, compute accuracy on test data, and 61
evaluate the model. 62
1 v a l s p l i t s = d a t a . r a n d o m S p l i t ( Array ( 0 . 6 , 0 . 4 ) , 63
2 s eed = 11L ) 64
3 v a l t r a i n = s p l i t s ( 0 ) . cache ( ) 65
4 v a l t e s t = s p l i t s ( 1 ) 66
5 67
6 v a l n u m I t e r a t i o n s = 100 68
7 v a l model = SVMWithSGD . t r a i n ( t r a i n , n u m I t e r a t i o n s ) 69
8 70
9 v a l s c o r e A n d L a b e l s = t e s t . map { p o i n t => 71
10 v a l s c o r e = model . p r e d i c t ( p o i n t . f e a t u r e s ) ( s c o r e , 72
p o i n t . l a b e l ) } 73
11 74
12 v a l m e t r i c s = new B i n a r y C l a s s i f i c a t i o n M e t r i c s ( 75
s c o r e A n d L a b e l s ) 76
Listing 4. A Snippet of MLlib Code for SVM
Examples of Construction Research using SVM: To iden- 77
tify the damages in bridges, Liu et al. [68] employed SVM 78
and genetic algorithms (GA). The selection, crossover, and 79
mutation in GA are used for selecting best kernel parameters 80
which are used in SVM as model parameters. A numerical 81
simulation is presented to see the feasibility of the pro- 82
posed approach. Comparative analysis of GA-RBF (radical 83
basis function) and GA-BP (back propagation networks) is 84
conducted, which reveals that the proposed technique has 85
outsmarted these previously used approaches significantly for 86
damage identification in bridges. 87
Mahfouz et al. [69] studied automated construction docu- 88
ment classification using models, based on SVM and Latent 89
Semantic Analysis (LSA). The classification accuracy of these 90
models is compared and contrasted against the Gold standard 91
of human agreement measures. Relatively better results are 92
attained (with accuracy between 71% to 91%) than the pre- 93
viously used models. In another study [70], a construction 94
legal decision support system is developed using SVM. SVM 95
models extract legal factors from earlier cases to help the 96
judges to check the basis for their verdicts. Results of first, 97
second, and third-degree polynomial kernel SVM models are 98
compared and contrasted. Highest accuracy is revealed for the 99
first and second-degree polynomial SVM, of 76% and 85% 100
respectively, implemented using TF-IDF. Similarly, SVM is 101
used in fault detection system for HVAC under real working 102
conditions [71]. The SVM classifiers for fault detection and 103
isolation (FDI) are developed. The proposed approach can 104
efficiently detect and isolate many typical HVAC faults. 105
4) Artificial Neural Networks (ANN): Artificial Neural 106
Networks (ANNs) algorithms are well suited to problems 107
of classification or function estimation. Since their advent, 108
these algorithms are widely used in solving complex industrial 109
problems. Multi-layer perceptron (MLP) is the most commonly 110
used type of ANN. ANNs are typically made up of three 111
layers including an input layer, hidden (intermediate) layer, 112
and output layer. 113
7
Data samples in MLP neural network are normalised and1
are fed into the input layer. This data moves from the input2
layer to one or two hidden layers and is finally passed onto the3
output layer, producing an output of the given ANN algorithm.4
Typically, x:y:z is used to describe the ANN topology in which5
x, y, z corresponds to the number of nodes in input, hidden,6
and output layers, respectively. During the training phase,7
the values of connections between nodes (a.k.a weights) are8
adjusted. Back propagation, simulated annealing and genetic9
algorithms are commonly used for training ANNs. Listing 510
shows MLlib code to explain lifecycle stages of ANN model11
development and evaluation.12
1 v a l s p l i t s = d a t a . r a n d o m S p l i t ( Array ( 0 . 6 , 0 . 4 ) , s eed13
= 1234L )14
2 v a l t r a i n = s p l i t s ( 0 )15
3 v a l t e s t = s p l i t s ( 1 )16
417
5 v a l l a y e r s = Array [ I n t ] ( 4 , 5 , 4 , 3 )18
619
7 v a l t r a i n e r = new M u l t i l a y e r P e r c e p t r o n C l a s s i f i e r ( )20
8 . s e t L a y e r s ( l a y e r s ) . s e t B l o c k S i z e ( 1 2 8 )21
9 . s e t S e e d (1234L ) . s e t M a x I t e r ( 1 0 0 )22
1023
11 v a l model = t r a i n e r . f i t ( t r a i n )24
12 v a l r e s u l t = model . t r a n s f o r m ( t e s t )25
13 v a l p r e d i c t i o n A n d L a b e l s = r e s u l t26
14 . s e l e c t ( ” p r e d i c t i o n ” , ” l a b e l ” )27
15 v a l e v a l u a t o r = new28
M u l t i c l a s s C l a s s i f i c a t i o n E v a l u a t o r ( ) .29
se tMet r i cName ( ” p r e c i s i o n ” )30
Listing 5. A Snippet of MLlib Code for ANN
Examples of Construction Research using ANN: Chen31
et al. [72] tailored ANN for fault detection of engineering32
structures, caused due to vibration and fatigue. The approach33
is reportedly revealed to yield better results in structural fault34
diagnosis. Fang et al. [74] employed ANN for structural35
damage detection. Back propagation algorithm, empowered36
by heuristics-based tunable steepest descent method, is used37
for training the neural network. Frequency response functions38
(FRF) are used for structural damage detection. A case study of39
cantilevered beam is analysed for unseen, single, and multiple40
damage types. Similarly, ANN is employed alongside GA in41
[73] for fault classification, in which ANN and GA comple-42
mented each other in reconstructing the missing input data.43
Moselhi et al. [75] deliberated the usefulness of ANN over the44
conventional expert-based systems, employed in developing45
various applications for the construction industry. A generic46
neural network based architecture is described, which is val-47
idated by implementing an application for optimal markup48
estimation. It is argued that ANN-based intelligent systems49
guarantee ideal performance over the systems, developed using50
conventional expert systems based approaches.51
ANN algorithms have recently brought revolution in ma-52
chine learning through deep learning. New algorithms of ANN53
are designed to learn from high dimensionality data (i.e., Big54
Data), which seek special attention in all the construction55
industry applications where ANN is employed.56
5) Genetic Algorithms (GA): Genetic Algorithms (GA) are57
evolutionary ML algorithms that are inspired by the natural58
evolution process. It computes better solutions to optimisation 59
problems using the concepts such as inheritance, mutation, 60
selection, and crossover. Typically GA algorithms involve 61
creating two integral components, including (i) genetic rep- 62
resentation (array of bits) of the problem, and (ii) a fitness 63
function to evaluate solution domain. The process starts with 64
initiating a solution randomly and then keeps improving it 65
through iterative application of mutation, crossover, inversion 66
and selection unless an optimal solution is found. 67
Examples of Construction Research using GA: Chen et 68
al. [76] used GA to develop cost/schedule integrated planning 69
system (CSIPS) which is focused on assigning crew optimally 70
under complex set of constraints pertaining to resources and 71
workforce. GA couple with BIM and object sequencing matrix 72
is used to achieve feasible crew assignment in CSIPS system. 73
Similarly, Moon et al. [77] developed an active BIM system 74
for assessing the risks imposed by schedule and workspace 75
conflicts that typically happens during the construction phase 76
of a project. This active BIM system used fuzzy and GA 77
algorithms for efficiently generating the optimal plan for 78
workspace conflicts. 79
6) Latent Document Analysis (LDA)/ Latent Semantic 80
Analysis (LSA): LSA determines the meaning of words over 81
a large corpus of documents using statistical techniques. It 82
uses singular value decomposition method as its entire basis 83
for computation. It is widely used in text analytics where it is 84
used for vocabulary recognition, word categorization, sentence 85
word priming, discourse comprehension, and essay quality 86
assessment. LSA is based on the following measures. 87
1 v a l c o r p u s = p a r s e d D a t a . z i p W i t h I n d e x . map ( . swap ) . 88
cache ( ) 89
2 v a l ldaModel = new LDA( ) . se tK ( 3 ) . run ( c o r p u s ) 90
3 v a l t o p i c s = ldaModel . t o p i c s M a t r i x 91
Listing 6. A Snippet of MLlib Code for Latent Semantic Analysis
1) Precision—is the fraction of retrieved documents, which 92
are relevant. It is useful to assess the quality of LSA 93
approaches. 94
2) Recall—is the fraction of the relevant documents, which 95
are retrieved. Recall mostly informs about the complete- 96
ness of LSA approaches. 97
3) F-Measure—is often used to combine precision and recall 98
for assessing the accuracy of tests. 99
Listing 6 shows MLlib code to demonstrate the implemen- 100
tation of LDA, where a corpus is created, and documents are 101
clustered based on word distribution. 102
Examples of Construction Research using LDA & LSA: 103
Kandil et al. [79] employed LSA for automated construction 104
document classification. The proposed technique classified two 105
sets of documents: (1) documents with low word variations 106
(claims and legal documents), and (2) documents with high 107
word variations (correspondence and meeting minutes). The 108
evaluation of proposed technique provided satisfactory classi- 109
fication results. Mahfouz et al. [69] employed a hybrid ML- 110
based construction document classification methodology built 111
on top of SVM and LSA. The presented results are relatively 112
better than approaches based on a single ML technique. Salama 113

8
et al. [78] employed LSA-based classifiers for this purpose1
where the documents clauses are automatically classified into2
predefined categories such as environmental, health, etc., be-3
fore rule extraction. The developed method is reported to4
achieve 100% and 96% recall and precision respectively.5
7) More Construction Industry Research using Classi-6
fication: Classification algorithms have been used in con-7
struction for many tasks. In this subsection, we will discuss8
some of the important applications of classification for the9
construction industry. In particular, we will review document10
classification, document analysis, image-based classification,11
the classification for predicting project overrun, and finally, the12
classification for safety analysis. Pointedly, these applications13
need to be revamped with the Big Data technologies, since they14
present similar challenges of high dimensionality, velocity,15
and variety. Besides, these applications also involve classy16
computation while performing domain-specific tasks.17
Document Classification: Different techniques are devised18
to classify automatically documents based on various classifi-19
cation systems such as CSI MasterFormat, CSI UniFormat, and20
UniClass. Caldas et al. [80] used SVM to organise construc-21
tion documents based on the CSI MasterFormat classes. The22
relevance of documents with terms is calculated by Boolean23
weighting, absolute frequency, TF/IDF, and IFC weighting.24
The prototype system is evaluated and found very relevant.25
Rehman et al. [81] classified construction documents into26
two distinct groups of good and bad information-containing27
documents. Three layered ML approach is employed. Decision28
Trees (DT), Naive Bayes, SVM, and KNN algorithms are used29
to check the accuracy of classification. Except for the DT, the30
rest of algorithms have significantly improved the classification31
accuracy. Similarly, Liu et al.[82] presented the process for32
structured document retrieval for engineering based document33
management.34
Document Analysis: Soibelman et al. [83] proposed a35
comprehensive platform to store and analyse unstructured doc-36
uments used within a construction project. The system captures37
the essential attributes of these document types containing38
diverse data about text, web, image, and linking and stores39
it in an analytic-friendly format. These documents are then40
automatically linked to the appropriate binary files (building41
models) using different ML classifiers, which dramatically42
improved the information retrieval and significantly reduced43
overall searching time of project managers.44
Image-Based Classification: Construction site photography45
logs comprise a significant chunk of construction documen-46
tation. A novel ML-based classification system is proposed47
in [84] which uses Whitening Transform (WT), SVM, and48
Biased Discriminant Transform (BDT) algorithms to classify49
and index construction site images. The proposed approach has50
significantly boosted the results of traditional search engines.51
Predicting Overrun Potential: Williams et al. [85] analysed52
highway project bidding data for interested trends informing53
about project overruns. Data exploration revealed that bids54
with higher ratios tend to have significant cost overruns.55
Based on these ratios (as independent variables), an automated 56
ML-based algorithm (Ripple Down Rules) is employed to 57
classify the overrun potential of construction projects into 58
following discrete values of Near, Overrun, BigOverrun. This 59
exploration has revealed interesting rules for assessing the 60
dilemma of project cost overruns. Similarly, Elfaki et al. [86] 61
explored the whole breadth of intelligent systems developed 62
using different ML algorithms for construction project cost 63
estimation. 64
Safety Analysis: Han et al. [87] presented an approach that 65
uses site videos to measure the workers’ behaviour towards 66
safety. The proposed approach analyse the 3D skeleton motion 67
model of the workers to identify their actions. Since safe and 68
unsafe actions are known, so the training data is correctly 69
labelled for safe and unsafe actions, which is exploited by 70
the classifier for learning. As a case study, the motion of 71
worker while climbing the ladder is analysed. It is revealed 72
that classifier can successfully identify the moves that can 73
potentially lead to site injuries. 74
[TABLE 6 about here.] 75
C. Clustering Techniques 76
Clustering is used to find groups that have similarity in their 77
characteristics. Intuitively, clustering is akin to unsupervised 78
classification: while classification in supervised learning as- 79
sumed the availability of a correctly labelled training set, the 80
unsupervised task of clustering seeks to identify the structure 81
of input data directly. Items in one cluster are similar to each 82
other whereas different from the items of other clusters. Some 83
of the examples of clustering algorithms include K-means, O- 84
means, fuzzy K-means, and canopy. Listing 7 shows MLlib 85
code for clustering data using K-Means and evaluating the 86
model using Within Set-Sum-of-Squared-Errors. 87
1 v a l n u m C l u s t e r s = 2 88
2 v a l n u m I t e r a t i o n s = 20 89
3 v a l c l u s t e r s = KMeans . t r a i n ( pa r s edDa ta , numClus te r s , 90
n u m I t e r a t i o n s ) 91
4 v a l WSSSE = c l u s t e r s . computeCos t ( p a r s e d D a t a ) 92
Listing 7. A Snapshot of MLlib Code for K-Means
Examples of Construction Research using Clustering: 93
Ng et al. [88] used clustering to group the facilities based 94
on the deficiency descriptions stored in the facility condition 95
assessment database. The results have shown that facility 96
deficiencies are unique and always a function of location and 97
type of the facility. Fan et al. [89] employed clustering for 98
developing construction case retrieval system to identifying 99
accidents occurred in the past. The goal is to resolve the 100
disputes before provoking litigation and work interruptions. 101
It is noticed that the NLP based approaches performed far 102
better than case-based reasoning techniques, while measuring 103
the similarity of case documents. 104
A hybrid approach is adopted in [90] to group construction 105
project documents automatically. The approach initially uses 106
clustering to generate classes for these documents based on 107
textual similarity measures. Later on text classifier is used 108

9
to classify relevant documents from the construction docu-1
ment information system. This hybrid approach has drastically2
improved the recall and F-measure. Clustering becomes non-3
trivial with massive datasets comprising millions of dimen-4
sions.5
D. Natural Language Processing (NLP)6
The NLP is concerned with creating computational models7
that resemble the linguistic abilities (reading, writing, listening,8
and speaking) of human beings. It provides basic concepts9
and methods for text processing and analysis, such as part10
of speech (POS) tagging, tokenization, sentence splitting,11
named entity recognition, and semantic role labelling, etc. This12
field brings together diverse techniques from computational13
linguistics, speech recognition, and speech synthesis to process14
human languages.15
Examples of Construction Research using NLP: The NLP16
has a broad range of applications for knowledge acquisition17
and retrieval in the construction industry. Al-Qady et al. [91]18
used NLP to develop ontologies from construction contrac-19
tual documents. They employed NLP-based Concept Relation20
Identification using Shallow Parsing (CRISP) for automatically21
extracting the concepts and concept relationships from the text22
of contract documents. The Kappa score and F-measure have23
significantly improved knowledge acquisition, while construct-24
ing legal ontology. The works in [92], [93], [94] proposed25
an NLP-based information extraction system for automated26
compliance checking from construction regulatory documents.27
A set of pattern-matching and conflict resolution rules has been28
developed that employ syntactic (syntax/grammar-related) and29
semantic (meaning/context-related) text features during NLP30
processing. A technique for tagging, separation, and sequenc-31
ing of regulatory document elements is proposed to generate32
high-quality ontology. The proposed algorithm is tested on33
the regulatory documents, retrieved from the International34
Building Code and the results are promising with higher35
precision and recall.36
E. Information Retrieval (IR)37
Web search engines are the most common examples of IR38
systems, where information is typically organised as a collec-39
tion of documents. IR systems deal mainly with unstructured40
textual data (that have no defined schemas). Besides, these41
systems can also handle complex, unstructured data such as42
images. Approximation and ranking are the vital attributes43
of the IR query languages. Queries are specified as search44
terms encapsulated in keywords and logical (AND & OR)45
connectives. These queries are evaluated with approximation46
based relevance ranking, where documents are identified and47
returned based on their relevance to a query.48
Examples of Construction Research using IR: Demian et49
al. [95] developed CoMem-XML system to augment searching50
through granularity and context. The system is enhanced51
for contextual similarity, which is revealed to be of greater52
usefulness and usability to construction professionals. Tserng53
et al. [96] developed IR system called Knowledge Map Model 54
System (KMMS) to facilitate construction professionals for 55
managing and reusing construction knowledge from a va- 56
riety of unstructured documents. Fan et al. [97] proposed 57
a framework for managing unstructured construction project 58
documents where terms dictionaries and dependency textual 59
documents are used. The framework is evaluated, and its 60
usefulness is revealed. 61
Hsu et al. [98] employed context-based text mining for 3D 62
CAD documents exploration. Traditional systems depend on 63
textual naming and require designers to memorise and embed 64
these descriptions within the design documents. To this end, 65
a context-based CAD document retrieval system (CCRS) is 66
developed for extracting the context from CAD documents 67
into the characteristic document (CD), which is exploited 68
by query planner to select the documents. Lin et al. [99] 69
studied the retrieval of technical documents like journal papers, 70
patents, technical reports, or domain handbooks. A concept- 71
based IR system is developed to illustrate the effectiveness of 72
proposed partitioning approach. It is shown that the proposed 73
approach is quite useful for concept-based IR of technical 74
documents. Al-Qasy et al. [100] introduced an electronic doc- 75
ument management system (EDMS) to manage construction 76
project documents. At the crux of this system lies the proposed 77
idea of document discourse, which determines the semantic 78
similarity of documents. A classification algorithm, using 79
document discourse, is implemented for classifying project 80
documents. The system is evaluated by a group of experts. 81
IV. OPPORTUNITIES 82
A. Resource and Waste Optimization 83
Rapid urbanisation has escalated construction activities 84
globally, which triggered construction industry to consume the 85
bulk of natural resources and produce massive construction 86
and demolition (C&D) waste [101]. The adverse impact of 87
construction activities on the environment has serious implica- 88
tions worldwide [102]. Existing waste management approaches 89
are based on Waste Intelligence (WI), which suggests remedial 90
measures to manage waste only after it happens [103]. These 91
systems mostly answer close-ended questions such as projec- 92
t/site wise waste generated, progress towards defined waste 93
targets, and understanding how a particular design strategy 94
produces waste [104]. The end users are provided hindsight 95
with limited insight on waste minimisation. 96
However, data-driven decision-making at the design stage 97
is revealed to bring a revolution for preventing a significant 98
proportion of construction waste [105], [104]. This compels a 99
paradigmatic shift from the static notion of WI to a more pro- 100
gressive idea of Waste Analytics (WA) [106]. Waste minimisa- 101
tion through design is the future of waste management research 102
[101]. WA advocates proactive analyses of disaggregated and 103
massive datasets to uncover non-obvious correlations related to 104
design, procurement, materials, and supply-chain, which could 105
lead to waste during the actual construction stage. It explores 106
waste data in a forward-looking way [104], [106]. Advanced 107
analytical approaches could be employed to forecast waste and 108

10
prescribe the best course of actions to pre-emptively minimise1
waste.2
However, WA depends increasingly on the high-performance3
computation and large-scale data storage. It requires a sig-4
nificant number of diverse data of building design, material5
properties, and construction strategies to successfully carry out6
the process. Storing these datasets, using traditional technolo-7
gies, is not only insurmountable, but the real-time processing8
for underpinning high-dimensional analytical models is highly9
challenging. This calls for the application of Big Data tech-10
nologies for effective construction waste management. Partic-11
ularly, robust waste generation estimation models, BIM-based12
optimal materials selection during design specification, and13
holistic waste minimisation framework are key research areas14
which call for the applications of these Big Data technologies15
to be employed. Table XIV summarises the state of the art and16
potential opportunities for resource and waste optimisation.17
Some of these opportunities are further explained in Section18
V.19
[TABLE 7 about here.]20
B. Value Added Services21
This section discusses a broad range of non-core services,22
which can be benefited from the emerging trend of Big Data23
in the construction industry.24
1) Generative Design: Generative design (GD) is another25
paradigm shift in the construction industry. The idea is to26
generate many designs automatically based on the specified27
design objectives, such as functional requirements, material28
type, manufacturing method, performance criteria, and cost29
restriction, among others. The intended GD tools employ so-30
phisticated algorithms to synthesise design space and generate31
a wide assortment of design solutions that meet the given32
design requirements. These designs are presented to designers33
for evaluation based on their performance. This evaluation34
enables the designers to reiterate designs by adjusting design35
goals and constraints unless a design is produced to their36
satisfaction. Advancements in this field can bring lots of bene-37
fits, particularly for resource optimisation and waste reduction38
through design.39
Attempts are made to verify the adequacy of this idea.40
To this end, Autodesk has come up with the Dreamcatcher41
tool, to facilitate designers, for generating designs based on42
abstract design requirements. However, Dreamcatcher is still43
in its infancy and is far from being a promising tool to be used44
for professional purposes. Many challenges are underlying45
to achieve GD realistically. Particularly, the generation and46
exploration of design space is time-consuming and is massive.47
The tool has to generate and compare a permutation of48
models for single client requirement. This field requires more49
R&D for getting mature to be usable in the enterprise-grade50
applications. These challenges of GD tools are expressly the51
jurisdiction of using Big Data technologies. These technologies52
can undoubtedly bring new levels of usability, accessibility,53
and democratisation in the design exploration and optimisation54
in next generation GD tools. Table XIV summarises the state 55
of the art and potential opportunities for this subdomain. 56
2) Clash Detection and Resolution: The identification of 57
design clashes is an integral part of the building model. Ideally, 58
this phase should be carried out before the start of con- 59
struction stage for effective project management. Traditional 60
paper-based approaches are widely substituted by BIM-enabled 61
automated approaches, which are found relatively inefficient 62
as well as less accurate to identify the majority of design 63
conflicts. However, existing BIM-enabled conflict resolution 64
solutions are still tedious and time-consuming for efficient 65
process automation. There are two aspects of these systems. 66
Firstly, adequate knowledge management is at the crux of 67
these systems to achieve accuracy. Wang et al. [38] proposed 68
a knowledge-based system for acquiring, formulating, and de- 69
ploying knowledge in BIM-enabled MEP design coordination. 70
However, much is required in this direction. Additionally, for 71
the later, design conflicts identification requires non-trivial 72
algorithms for design exploration, which are time-consuming. 73
These aspects are the subject of Big Data technologies, which 74
can augment knowledge representation as well as computation 75
through its well-known distributed and parallel computational 76
capabilities. Table XIV summarises the state of the art and 77
potential opportunities for this subdomain. 78
3) Performance Prediction: Performance prediction models 79
have been wide applicability in various domains of the con- 80
struction industry. Particularly, these models are instrumental 81
for pavement management systems, where system engineers 82
are facilitated to take right decisions while constructing, 83
maintaining, and rehabilitating the pavement structures. These 84
models use a large number of variables and their great combi- 85
nations, in which they influence each other as well as overall 86
model performance, and are developed using simple statistical 87
approach (like linear regression) to computational intelligence 88
techniques (as ANN). Karagah et al. [109] evaluated various 89
prediction models for predicting their accuracy for pavement 90
deterioration trends. Their evaluation shows that these system 91
involve computation-savvy analysis, which is time-consuming 92
and hard for traditional technologies to process at a real 93
time. Moreover, it is highlighted that high dimensionality is 94
inherent to the dataset produced for these applications, where 95
the extremely large number of variables contribute to the model 96
development. To this end, performance prediction field offers 97
opportunities to utilise Big Data technologies. Consequently, 98
Big Data technologies are of immense relevance and can aid in 99
the area regarding real-time computation, reliable model devel- 100
opment, and enhanced visualisation. Table XIV summarises the 101
state of the art and potential opportunities for this subdomain. 102
4) Visual Analytics: Analytical problems are of two kinds: 103
(1) the problems that have clearly defined and logical solutions; 104
and (2) the problems that have approximate heuristic solutions 105
(and no logic-based straightforward solution applies). The 106
former category is handled through automated approaches, 107
whereas the later ones are tackled through visualisation. 108
Human knowledge, creativity, and intuition are pivotal for 109
effective visualisation. Human knowledge works perfectly with 110
11
smaller datasets, but its application in involving high dimen-1
sional larger datasets becomes impractical. The field of Visual2
Analytics (VA) came into existence to combine automated rea-3
soning and visualisation to solve complex analytical problems.4
Such systems are phenomenal to empower analytical abilities5
of users while perceiving, understanding, and reasoning about6
complex and uncertain situations. VA is one of the key domains7
that require Big Data technologies to execute data visualisation8
to provide personal views and interactive exploration of data.9
One of the key reasons behind the widespread adoption10
of BIM lies in its versatile visualisation capabilities. Existing11
software are quite competitive to visualise all dimensions (nD)12
of the design using the right set of tools and techniques.13
In this context, Castronov et al. [110] studied the role of14
visualisation in 4D construction management. Shortcomings of15
existing BIM visualisation are identified, and general guideli-16
nes/ protocols are prescribed for developing 4D visualisation17
in BIM authoring tools. To enable participation of technically18
unskilled BIM users, Zhadanovsky et al. [154] studied the issue19
of generating master plan visualisation. Similarly to promote20
sustainable energy use, Goodwin et al. [111] employed VA21
for classifying energy users. The data of household energy22
consumption along with geo-demographic data is used for23
deeper insights. Classification is reported to enable clusters24
and trends for understanding energy usage. However, state-of-25
the-art approaches of visualisation are needed during clustering26
process and decision making to enable overall comprehension.27
Chuang et al. [112] studied the development of a cloud-enabled28
web-based system for BIM visualisation and manipulation. The29
system improved communication and distribution of relevant30
information among the stakeholders.31
The scope of BIM is widening with more applications32
from construction as well FM stage has started utilising and33
extending it. As BIM data grows, these models get highly34
dimensional, so the visualisation of high-dimensional BIM35
models is challenging. VA is essential to both BIM and36
Big Data and provides sophisticated techniques to improve37
BIM and Big Data visualisation for better comprehension and38
interpretation. Table XIV summarises the state of the art and39
potential opportunities for this subdomain.40
5) Social Networking Services/ Analytics: Majority of con-41
struction industry problems are communication-related [113].42
Social media is another interesting trend that can help the43
industry to improve communication among the project team.44
This trend is slowly penetrating the industry. Social networking45
services to share updated project information along with wider46
practices for communicating the best practices of sustainability47
could be the next application areas.48
Some studies have been carried out in these directions. Jiao49
et al. [113] studied the usage of social media to communicate50
project management data, including schedules, progress mon-51
itoring data, and work assignments. The proposed approach52
facilitates the integration of useful project data with BIM.53
Meadati et al. [114] studied the integration of RFID, BIM, and54
social media to support facility managers in locating data from55
multiple documents. Jiao et al. [115] brought the web3D-based56
AR environment for integration of BIM and business social57
networking services (BSNS) over the cloud-enabled platform. 58
The goal is to enhance the overall comprehension of BIM 59
models. 60
However, a robust framework is required to capture every 61
useful social interaction into the BIM right from the design 62
to end-of-life of the building. Since data of social interactions 63
are likely to be in variety, velocity, and volume, Big Data 64
technologies could be harnessed to develop interesting domain 65
applications for enhancing the productivity of stakeholders. 66
Table XIV summarises the state of the art and potential 67
opportunities for this subdomain. 68
6) Personalized Services: In personalised services, the pri- 69
mary emphasis lies on an adaptation of the given facilities 70
based on the user’ choice. The users are empowered to 71
control the overall usage of services the way they desire. 72
These systems adapt based on various parameters such as user 73
behaviour. The input to such services could be manual as well 74
as automatic. 75
Gao et al. [116] developed SPOT+ system to enable office 76
workers to personalise the indoor thermal comfort. SPOT+ 77
used Predictive Personal Vote (PPV) to automatically adjust in- 78
door thermal comfort that mainly involve heating. The system 79
turns on the heating before the arrival of occupants whereas 80
turns the heating off immediately after their departure. Rabbani 81
et al. [117] proposed an enhanced personalised thermal com- 82
fort system called SPOT* that enables users to adjust lower 83
and upper bounds of indoor temperature as desired, which is 84
automatically regulated accordingly. SPOT* supports heating 85
as well cooling of indoor spaces. The system has significant 86
potential for energy reduction while maintaining the overall 87
comfort at desired level. Panagopoulos et al. [118] proposed 88
the AdaHeat system that uses intelligent agents to regulate 89
the heating for domestic consumption. A novel aspect of this 90
system is that it requires minimal user input. Chen et al. 91
[119] studied the correlation of human behaviour and energy 92
consumption in smart homes. Computational models to predict 93
energy consumption based on user behaviour are developed. 94
These models are used to develop a web-based system that 95
provides user with insights based on behaviour for optimal 96
energy consumption. 97
The applications to enable personalised services always 98
require scanning the surrounding environment for the events 99
of interest using sensing technologies, generating large vol- 100
umes of data. Accumulating such streams of data and then 101
processing it to generate actionable insights at real time for 102
point-in-time adaptation is non-trivial and is the subject of 103
interest for Big Data technologies. To this end, robust Big Data 104
enabled platform is required that provides a unified interface to 105
support the needs of diverse personalisation services, employed 106
in modern buildings. Table XIV summarises the state of the 107
art and potential opportunities for this subdomain. 108
C. Facility Management 109
Facilities management (FM) integrate organisational pro- 110
cesses to maintain the agreed services that support and improve 111
the effectiveness of its primary activities. Operations and man- 112
agement are the central parts of FM and are the longest stage in 113

12
whole building lifecycle. Mostly FM activities (such as assets1
management, preventive maintenance, etc.) are laborious, and2
the efficiency of such tasks can improve by incorporating3
suitable supporting technology. Localization information is4
of great importance to these technology solutions. Today5
these facilities utilise advanced automation and integration to6
measure, monitor, control, and optimise building operations7
and maintenance. They provide adaptive, real-time control over8
an ever-expanding array of building activities in response to a9
wide range of internal and external data streams. As investment10
ramps up and more intelligent systems are brought online,11
more data will enter the energy management platform at faster12
speeds.13
Taneha et al. [120] proposed an approach to determine the14
FM personal location information using localization technolo-15
gies to support FM related activities. The system employs16
three technologies like RFID, Wireless LAN, and Inertial17
measurement units (IMUs) for this localization. To reduce the18
FM cost, Ng et al. [121] applied knowledge discovery and19
data mining over the facilities maintenance databases. Liu et20
al. [122] evaluated the capabilities of BIM to support the FM21
operations. A detailed needs of FM professionals are identified22
to harness BIM to support relevant tasks. The factors affecting23
the maintainability of facilities are mainly considered.24
Motamedi et al. [155] highlighted three challenges faced by25
the majority of FM systems. These include (i) inefficient &26
time-consuming searching interfaces, (ii) no unified interface27
for FM system to exchange information, and (iii) inability to28
store and process large volumes of data generated by these29
systems. These challenges evidently call for the applications30
of Big Data technologies in the development of FM systems.31
Particularly, in the case of predictive maintenance, BDA can32
inform FM managers whenever equipment is likely to break33
or require an upgrade. Consequently, FM organisations could34
benefit from lowered operating expenses, higher profit margins35
and enhanced service availability. Table XIV summarises the36
state of the art and potential opportunities for this subdomain.37
D. Energy Management & Analytics38
Two type of energy software are prevalent. Firstly, building39
energy simulation software to model the energy consumption40
of buildings. Their accuracy depends on the accuracy of41
provided parameters that are fine-tuned by experts. This fine42
tweaking is laborious and time-consuming. Automatic fine43
tweaking involves lots of computations. Sanyal et al. [123]44
studied the automatic generation of accurate input model45
with proposed Autotune workflow for the EnergyPlus energy46
simulation software. Pointedly, it is informed that the software47
operates on raw data of about 270 terabytes, and condenses48
that to approximately 80 terabytes of useful data. Data storage,49
transfer, and processing such datasets is inevitably the subject50
of Big Data technologies.51
Secondly, Building Energy Management Systems (BEMSs)52
are vital for buildings. And as part of their architecture,53
hundreds to thousands of sensors are installed to capture54
data. Linda et al. [124] used computational intelligence based55
anomaly detection to fuse data from multiple heterogeneous56
data sources and to process it for generating actionable in- 57
sights. Despite BEMSs use the state-of-the-art multi-processor 58
infrastructures, the issue of data management and processing 59
is reported to have taxed the boundaries of these systems. 60
Hong et al. [125] proposed a cloud-based storage system to 61
store and process energy data generated from a network of 62
thousands of Zigbee sensors. To persist this data, Singh et al. 63
[126] proposed cloud-based storage and processing architec- 64
ture. Berges et al. [127], [128] proposed novel approach for 65
identifying appliances and their events (on/off or low/high) to 66
measure their electric consumption precisely from the electric 67
influx. It is reportedly revealed that proposed approach requires 68
emerging data management and processing capabilities for real 69
life deployment. Similarly, Goodwin et al. [111] employed 70
visual analytics for energy users classification. It is highlighted 71
that state-of-the-art approaches of visualisation are at the 72
core of clustering process, decision making, and enhanced 73
overall comprehension of energy consumption. Wei et al. [128] 74
proposed an IOT-based framework to monitor and analyse the 75
energy consumption of Smart Buildings. 76
The software as mentioned above perfectly presents the 77
opportunities for Big Data analytics to advance the field. Point- 78
edly, energy-related data is of immense importance for various 79
analytics, which is usually discarded by building owners and 80
utility companies at a time interval. To present this data nicely 81
for advanced analytics is the next frontier of innovation in this 82
field. Table XIV summarises the state of the art and potential 83
opportunities for this subdomain. 84
E. Other Emerging Trends that Triggered Big Data 85
This section presents a few technologies that amplified 86
the advent of Big Data in the construction industry. Their 87
successful deployment to advance the industry is indeed the 88
function of Big Data analytics. 89
1) Big Data with BIM: Building Information Modelling 90
(BIM) is conceived to revolutionise construction industry in 91
many aspects [156], [131]. BIM is empowered with an extra 92
layer of data, captured throughout the whole building lifecycle 93
[131], [132]. This data can be unleashed to develop useful ap- 94
plications for improving the overall building delivery process. 95
Theoretically, BIM is declared as the de facto standard for 96
managing building data, its applications, in practice, across 97
every lifecycle stages of building are yet to develop, however. 98
Preconstruction stages are well-known for widely adopting the 99
BIM, whereas, it is progressively used lesser in the later stages 100
of building lifecycle [5]. Substantial research is made to extend 101
BIM for encapsulating different types of related data. 102
Goedert et al. [133] extended BIM for construction process 103
documentation. Chiang et al. [157] integrated power consump- 104
tion data with BIM models. Isikdag et al. [134] integrated 105
geographic information systems (GIS) data with BIM for 106
developing a fire response system. Yeh et al. [158] employed 107
BIM for onsite building information retrieval using augmented 108
reality. Wang et al. [38] extended BIM for spatial conflict data 109
for MEP models. Yu et al. [135] integrated BIMserver with 110
OpenStudion (a platform for assessing the energy efficiency 111
of building designs). Das et al. [20] tailored BIM for social 112

13
interactions taking place while reviewing and commenting1
on different aspects of the design. Zheng et al. [136] in-2
tegrated BIM with diverse project data sources. Chaung et3
al. [112] exploited BIM for cloud-enabled design exploration4
and manipulation. Jiao et al. [113] sorted out the issues of5
integrating BIM with project schedules, progress monitoring6
data, and work assignments. Meadit et al. [114] integrated7
RFID data into BIM to locate project documents. Volk et al.8
[129] illustrated the automated creation of BIM models for9
existing buildings.10
These illustrate the gradual increase in the size and scope11
of the contents of BIM models, which eventually restricts the12
capabilities of traditional BIM-based storage and processing13
systems. To tackle this, Jiao et al. [6] tailored MapReduce for14
storage and processing BIM. However, there are still many15
use cases which may require sophisticated customizations to16
the way BIM is stored and processed. So in future, we are17
expecting BIM specialised Big Data storage and processing18
platforms. Up until recently, BIM is envisaged to contain data19
of construction industry only; however the emergence of linked20
building data has changed this perception. Despite linking BIM21
data to inter-industry applications, many interesting applica-22
tions can be developed by enabling the integration of BIM with23
Linked Open Data (LOD) datasets, such as weather, flooding,24
population densities, road congestions, and so on [147]. Such25
integration of BIM is undoubtedly resulting in Big BIM data,26
which justifies the emergence of Big Data in the specialised27
area of BIM. Table XIV summarises the state of the art and28
potential opportunities for this subdomain.29
2) Big Data with Cloud Computing: Cloud computing is30
Internet computing paradigm in which on-demand access to a31
shared pool of configurable resources is provided [159]. The32
idea is to outsource data storage and computation to third-party33
datacentres. Multiple users can simultaneously access the cloud34
services without having to purchase individual licenses. Cloud35
computing offers three service models. (i) Infrastructure-as-a-36
service (IaaS): In IaaS, the user is provided with an abstrac-37
tion to manage virtual/physical computers and cloud network38
services. (ii) Platform-as-a-service (PaaS): In PaaS, a user39
is provided with services pertaining to development environ-40
ments such as operating systems, programming languages, or41
databases, among others; (iii) Software-as-a-service (SaaS): In42
SaaS, the user is provided access to enterprise applications via43
the internet such as Revit 360.44
Cloud computing is widely adopted in the construction45
industry since it supports the integration of tasks in BIM-based46
applications. Hong et al. [125] utilised cloud computing for47
building energy management systems using Zigbee sensors.48
Das et al. [20] proposed a cloud-based BIM framework for49
integrating stakeholders interactions with BIM. Zhang et al.50
[136] utilised private clouds to offer BIM services across the51
whole building lifecycle. Klinc et al. [139] proposed SaaS52
platform for the structural analysis applications. Kumar et53
al. [140] employed cloud for SMEs design and construction54
firms. Chuang et al. [112] used cloud computing for BIM55
design exploration and manipulation. Redmond et al. [160]56
employed cloud for interoperability between BIM applications.57
Amarnath et al. [161] deployed Revit Server on the cloud for 58
collaboration and coordination of architectural and structural 59
models. Rawai et al. [162] explored cloud computing for 60
green and sustainable developments. Fathi et al. [142] used 61
the cloud for BIM-based context-aware computing. Beach et 62
al. [143] discussed the issues of enabling Google SketchUp 63
over the Amazon EC2 cloud. Chong et al. [144] evaluated 64
existing cloud computing applications and highlighted Google 65
Apps, Autodesk BIM 360, and Viewpoint, among others, 66
support majority of designers features on the cloud. Grilo et 67
al. [145] used the cloud for creating e-procurement platform— 68
Cloud Marketplaces. Jiao et al. [113] exploited cloud frame- 69
work for integrating project management data with building 70
models. Jiao et al. [115] integrated cloud computing with 71
latest technologies such as AR and business social networking 72
services to create virtual environment to visualise better and 73
understand BIM models. Wong et al. [137] highlighted the 74
legal issues related to cloud-based BIM models, including 75
security, responsibility, liability, and design ownership. 76
Cloud computing has already accelerated the uptake of IT 77
in the construction industry by transforming many domain 78
specific applications as discussed above. And the role of 79
Big Data in this transformation is overwhelming. Table XIV 80
summarises the state of the art and potential opportunities for 81
this subdomain. 82
3) Big Data with Internet of Things (IOT): An exciting 83
fact about Internet is it keeps evolving since its percep- 84
tion. It started with Internet-of-Computers and had evolved 85
into Internet-of-People, and is recently facing new paradigm 86
shift. With fast emerging technologies, the devices are getting 87
smaller and powerful, and the broadband connectivity is get- 88
ting cheaper and ubiquitous. This has led to the proliferation 89
of connected devices on the Internet, eventually resulted in an 90
exciting trend coined as the Internet-of-Things (IOT) [150]. 91
The primary vision behind IOT is to bring together the smart 92
devices and objects the vital parts of Internet. Fusing these 93
exciting physical and digital worlds are creating fascinating 94
opportunities of growth. Some of the popular areas where 95
IOT applications are successfully demonstrated across the 96
industries include logistics, transport, assets tracking, smart 97
homes, smart buildings, to energy, defence and agriculture. 98
Elghamrawy et al. [146] demonstrated RFID usage for 99
construction monitoring and quality control. Meadati et al. 100
[114] integrated RFID with 3D BIM documents of assets 101
for searching and locating objects quickly. Wei et al. [128] 102
proposed an IOT-based framework for building energy mon- 103
itoring. Zanella et al. [148] presented specifications of urban 104
IOT to envision the idea of Smart Cities. Kortuem et al. [163] 105
discussed the technical specifications of the smart object for 106
petrochemical and road construction industries. Curry et al. 107
[147] examined the storage and processing of energy sensors 108
data using cloud-based data management framework. 109
The applications of IOT are non-trivial and often deploy 110
hundreds or even thousands of sensor devices for data collec- 111
tion. Since construction industry presents unlimited use cases 112
for IOT, Big Data is inherently the subject of interest. IOT and 113
Big Data are complementary trends, with former to generate 114

14
large volumes of data and the later to store and analyse1
these data at the real time in construction specific domain2
applications. Table XIV summarises the state of the art and3
potential opportunities for this subdomain.4
4) Big Data for Smart Buildings: Buildings evolved con-5
siderably over time. While providing comfort and security,6
buildings cause adverse environmental impact by consuming7
energy and producing lots of greenhouse gases [159]. Smart8
building technology is a paradigm shift to embrace the integra-9
tion of contemporary technologies with the prevailing building10
systems for striking the trade-off between the comfort maximi-11
sation and energy minimisation [149]. Building systems such12
as building automation, life safety, telecommunications, user13
systems, facility management systems, among others, provide14
actionable insights about different aspects of building and15
allows the users to control their interactions with building16
services better. The smart building incorporates technologies17
into building systems through a unified view. Often, these18
systems generate vast amounts of data and majority of this19
data remain untapped and often discarded. To truly realise20
smart buildings, this data of unprecedented size need to be21
analysed—a task that presents significant data management22
and processing issues. To this end, Big Data analytics is of23
immense importance to optimise total building performance24
via predictive analytics.25
McKinsey [159] highlighted smart buildings amongst the26
top ten emerging technology businesses. Azam et al. [149]27
implemented a prototype software Project Dasher to illustrate28
Smart Buildings. Data of sensors related to motion, CO2,29
temperature, airflow, lighting, and other acoustics properties30
are gathered and analysed. It is reportedly revealed that more31
than 2 billion data entries are accumulated in 3 months that32
reached the limits of legacy relational databases. Stankovic33
et al. [150] developed sensor based fire-fighting systems for34
skyscraper office building with the authorities to detect fires,35
alter fire situations, and aid in evacuation. Bonino et al. [151]36
studied complex event processing in smart buildings. spChain37
framework is proposed to support the real-time processing of38
sensor data. Miller et al. [152] analysed significant energy data39
through proposed DayFilter approach to precisely identify the40
diurnal patterns from the data.41
Despite the fact that sophisticated IT systems are currently42
being used for controlling various building operations via43
sensors with enhanced data collection and analysis capabilities.44
However, these systems are still a long way off the actual45
vision of smart building apps that empower the end user in46
understanding and controlling their interactions with the build-47
ing systems and spaces [164]. This discrepancy is due to the48
following reasons: (i) the services and functionalities currently49
being offered are quite rigid; (ii) the services are isolated50
and robust solutions for vertical and horizontal integration51
are not as yet available; and (iii) the supporting apps and52
APIs are often proprietary and lack standardization in many53
cases. For these reasons, these APIs can only be exploited by54
the BMS software itself, and are not amenable to the third-55
party development of applications, which restricts innovation56
at scale. In the future, Big Data Analytics based standard57
buildings APIs can bridge this technology gap and enable 58
integration of sensors, users, control systems, machinery for 59
providing innovative smart building services that promise com- 60
fort, safety, and energy. Table XIV summarises the potential 61
opportunities for research on the applications of Big Data in 62
Smart Buildings. 63
5) Big Data with Augmented Reality (AR): Augmented 64
reality (AR), which is an offshoot of virtual reality, is the field 65
in which computer-generated virtual objects are superimposed 66
over real-world scenes to produce mix worlds. It enables a 67
semi-immersive environment that accurately aligns real scenes 68
with corresponding virtual world imagery. This mixed overlay 69
enables the users to obtain additional information about the 70
real world. It is an emerging technology for enhancing human 71
perception. 72
Rankohi et al. [165] argued that visualisation and simulation 73
aspects of the construction industry apps can be revamped 74
with AR to enhance their usability. Some of the exciting AR 75
application areas are highlighted such as virtual site visits, 76
proactive schedule dispute identification and resolution, and 77
as-planned vs. as-built comparison. Chi et al. [166] pointed 78
out the following four pillars for wider AR adoption in the 79
construction industry. (i) Localization, the ability to accurately 80
impose virtual object on the real-life scene. (ii) A natural user 81
interface, which provides easy and intuitive user experiences to 82
increase the usability of AP software. (iii) Cloud computing, 83
which enables apps to store and retrieve information seam- 84
lessly everywhere, and (iv) mobile devices, which are getting 85
smaller, cheaper, and powerful and play a vital role in AR 86
environment. William et al. [153] went ahead by bringing 87
BIM, mobile technology and AR together. The BIM aspects of 88
geometry translation, indoor localization, attribute assignment, 89
and registration are explored for integration with mobile AR. 90
The study proposed BIM2MAR, which provides general guide- 91
lines for integrating BIM with mobile AR. It is emphasised 92
robust BIM integration requires new approaches for BIM 93
geometry conversion and indoor localisation of BIM using 94
geo-coordinates. Jiao et al. [115] developed a web3D-based 95
AR environment to integrate BIM, business social networking 96
services (BSNS), and cloud services. 97
AR and Big Data inevitably converge. The complexity 98
associated with Big Data in construction is enormous, which 99
can only be surmounted by advanced methods of visualisation, 100
particularly Augment and Virtual reality technologies. This 101
requires new interactive platforms and methodologies to visu- 102
alise construction related datasets. The aim is to comprehend 103
better and interpret the complicated structures and interconnec- 104
tion buried inside the Big BIM Data for design exploration and 105
optimisation. Table XIV summarises of progress and potential 106
opportunities for AR in the construction industry. 107
V. OPEN RESEARCH ISSUES AND FUTURE WORK 108
There are many interesting open research issues within the 109
construction industry for Big Data. Some of these include (but 110
are not limited to) the following: 111
A. Construction Waste Simulation Tool: 112

15
Construction waste minimisation is the perennial issue of1
the construction industry. Estimating construction waste accu-2
rately, at the early stages of design or as the project proceeds, is3
core to so many exciting project activities. Particularly, waste4
estimation is preliminary to waste minimisation at the early5
stages of design, where it provides insights about how the de-6
sign is generating waste. These insights enable the designers to7
explore further and carry out corrective measures proactively,8
for waste efficiency at the early stages of design. So, construc-9
tion waste estimation has become the key research question10
in construction waste management research. This estimation11
requires thorough design exploration and optimisation from a12
myriad of dimensions. Existing waste estimation models are13
based on very limited, and static project attributes such as14
GFA, project contract sum, etc. [107], [108], [167], [168].15
However, these attributes are incapable of informing about16
the true size of construction waste, hence unable to generate17
a reliable waste estimate, regardless of how much data is18
used during their model development. A comprehensive waste19
estimation model that considers dynamic project attributes of20
deconstruction, standardisation and dimension coordination,21
reuse and recycling, and procurement, among together, needs22
to be developed. The model is also required to consider23
many attributes of construction materials, which heralds the24
development of a comprehensive materials database using25
open and linked data standards. The waste estimation model26
and construction materials database will be bundled into a27
standard and handy simulation tool, where waste estimates are28
visualised onto design elements through analytical dashboard29
alongside necessary prescriptions to minimise it through alter-30
native materials or better design strategies. This tool presents31
a rich application of BDA in construction waste minimisation32
to backstage its storage and computation related workloads.33
B. BDA enabled Linked Building Data Platform:34
Existing interoperability efforts in the construction industry35
are mainly concerned about exchanging the building data36
between domain-specific applications (architectural, structural,37
MEP, energy simulation, etc.) pertaining to the construction38
industry. However, many interesting use cases can be achieved39
from greater integration of BIM data with external data40
sources such as materials, GIS, sensors, geodata, etc. This41
interoperability, at a wider scale, enables the construction42
industry to achieve automation of its business processes, which43
can improve the overall efficiency of the project participants.44
Linked data coupled with the Web of data technologies are45
found phenomenal for this integration. Substantial progress is46
made to develop various enabling artefacts for this integration47
such as ifcOWL ontology [169], [170]. However, much has48
yet to be done. To this end, the development of a robust BDA49
enabled platform that supports the storage and processing of50
these diverse linked data sets pertaining to the building as well51
as other data, is required. This platform can provide the basis52
for the development of interesting applications, particularly for53
energy analytics and smart buildings.54
C. Big Data driven BIM System for Construction Progress55
Monitoring:56
Currently, BIM is prevalent in the design world, with very 57
limited utilisation across the construction and FM stages of 58
the building. The real intent of BIM could never be achieved 59
until it is employed in every stage of the building lifecycle. 60
At present, no such mechanism can facilitate the tracking of 61
progress of various construction sites using automated tools. 62
It is indeed labour-intensive as well impractical (to some 63
extent) to update the BIM model with such minute details 64
pertaining to the daily construction progress. As a result, real- 65
time construction progress monitoring is not an easy task, 66
because managers are required to visit their sites regularly and 67
assess the progress subjectively with the intended schedule, 68
which is less effective and error-prone. Employing Big Data 69
and sensing technologies could move the state of the art in 70
domain of construction progress monitoring to the next level. 71
Using latest imaging technology, the progress of the on-going 72
construction is captured at the real time. Big Data analytics 73
will process the real-time streams of these images to measure 74
the daily change and updated the BIM models and construction 75
schedule accordingly. The project managers are presented with 76
an update to date progress on the schedule, which will, in turn, 77
enable them to see whether they are lagging behind on the 78
project or still follow the schedule. Accordingly, the project 79
managers can proactively respond in case of any delay is 80
reported. This will save them a lot of money due to penalty 81
whenever the deadline is missed, and improve the overall 82
project monitoring and control. This is also aligned with the 83
vision of BIM adoption. In this way, Big Data can help the 84
industry to deliver the projects on time. 85
D. Big Data for Design with Data: 86
Currently, designs are produced solely based on the client 87
requirements and the designers experience. Thus, such designs 88
that suit wider needs of the users, as well as the surrounding 89
environment, are rare. For example, designers rarely consider 90
the data collected by manufacturers on hundred or thousands 91
of their product lines during design specification, which might 92
be quite valuable. Similarly, many other sources of data can 93
be relevant to designs such as users’ sentiments while inter- 94
acting with facilities, weather, flooding, energy consumption, 95
commute pattern in that vicinity, and population densities, 96
to name a few. These datasets could be harnessed to sup- 97
port for example the generation of an optimal construction 98
schedule. And the good thing is that these data are captured 99
using technologies such as the web, sensors, smart meters, 100
mobile phones, etc., and are made available through open 101
data initiative (in most cases). However, the design world 102
is still detached from harnessing these data sources for their 103
purpose. Currently, there is no such tool that can facilitate the 104
designers to leverage these data during their design activities. 105
If this is achieved, this can result in the paradigm shift 106
of Design with Data, where these diverse data sources are 107
integrated within the BIM authoring tools and made available 108
to architects, engineers, contractors, and facility managers at 109
early design stages. Big Data Analytics is indeed the key 110
to this frontier of innovation. This symbiotic integration of 111
diverse data sources with BIM will ultimately lead to the 112
generation of next generation designs that can meet the wider 113
16
requirements of sustainability, users, environment, and even1
broader infrastructures of emerging concept of smart cities.2
VI. PITFALLS OF BIG DATA IN CONSTRUCTION3
INDUSTRY4
Despite the opportunities and benefits accruable from Big5
Data in this industry, some challenging issues remain of6
concern. This section discusses some of these challenges and7
provides suggestions to deal with them for the successful8
implementation and dissemination of Big Data technologies9
across various domain applications of the construction indus-10
try.11
A. Data Security, Privacy and Protection:12
Prominent among these concerns is the issue of data se-13
curity, data ownership, and management issues. To scale the14
hurdles posed by these challenges, several research studies15
have proposed and implemented security measures such as16
access control, intrusion prevention, Denial of Service (DoS)17
prevention, etc. [171], [172], [173]. These issues also require18
more study in the context of BIM-related construction data,19
and the appropriate solutions also need to be adopted in the20
underlying analytics workflows.21
B. Data Quality of Construction Industry Datasets:22
The construction industry is well-known for fragmented data23
management practices. Despite the aggressive promotion of24
BIM, companies using BIM are rare. Null values, misleading25
values, outliers, non-standardised values, among others, are26
some of the essential traits of industry data. And producing27
high-valued analytics is challenging due to poor data manage-28
ment practices. High-quality data is preliminary for successful29
Big Data projects. It is observed that analytics projects usually30
require approximately 80% of time cleaning noisy datasets31
before embarking on analytics. So, Big Data projects in32
construction industry shall also be specially taken care of, for33
data quality related issues. Otherwise, the resulting insights are34
likely to mislead, which in turn will result in unpleasant and35
pessimistic feeling in the industry. Consequently, the industry36
will be reluctant towards adopting such fascinating trends like37
Big Data.38
C. Cost Implications for Big Data in Construction Industry:39
40
Every technology incurs cost so introducing Big Data in41
construction is not for free of charge. Companies are required42
to set up data centres and purchase software licenses, which43
can be an attractive investment. Also, skilled IT personnel44
to keep the entire ecosystem running is another overhead.45
So Big Data has inevitably substantial cost implication. The46
construction business is considered amongst the low-profit-47
margin businesses, and introducing such costly add-ons to48
projects are more likely to be opposed and difficult to be49
defended. However, Big Data has the potential to enhance the50
overall project delivery by optimising processes and reducing51
risks that companies usually bear due to myriad inefficien-52
cies such as delays, litigations, etc. It is highly optimistic53
that construction industry can gain huge revenue from this 54
investment as experienced by other industries, provided the 55
right methodology is used to employ Big Data. The exact cost 56
implication of Big Data is, however, difficult to quantify. More 57
studies on cost-benefit analysis of using Big Data technologies 58
in construction projects are required. 59
D. Internet Connectivity for Big Data Applications: 60
To monitor project site activities at real-time, instant data 61
transmission between project sites (dams, highways, etc.) and 62
centralised Big Data repository should be supported. However, 63
project sites usually have low bandwidth; due to unavailability 64
of sophisticated networking infrastructure in rural, underde- 65
veloped areas. Advanced wireless sensor networks need to be 66
extended to tackle internet connectivity issues in these types of 67
Big Data applications; otherwise, the decisions on stale offline 68
data will not be useful for effective monitoring. 69
E. Exploiting Big Data to its Full Potential: 70
The effectiveness of Big Data cannot be measured just by 71
accumulating large volumes of data; it is more of the use 72
cases or industrial problems that dictate the usefulness of 73
these technologies. It is feared that the construction industry 74
might not extract the full value of accessible Big BIM Data 75
if the conceived use cases are vague. To this end, researchers 76
or domain experts are required to highlight domain-specific 77
problems that are the subject of Big Data. This way Big Data 78
as a technology will not be the driving force rather the industry 79
itself will lead the innovation by applying contemporary tools 80
to solve its topical issues. Additionally, Big Data is not the 81
silver bullet, it merely sets the stage. Skilled professionals 82
and domain experts, empowered with sophisticated analytical 83
workflows, are equally necessary to reap the overall benefits. 84
Without whom, the applications are likely to get into the 85
pitfall of producing too much information that should not be 86
delivering significant insights for the purpose. 87
VII. CONCLUSIONS 88
Although the construction industry generates massive 89
amounts of data throughout the life cycle of a building, 90
the adoption of Big Data technology in this sector lags the 91
progress made in other fields. With the commoditization of 92
the technology necessary for storing, computing, processing, 93
analysing, and visualising Big Data, there is immense interest 94
in leveraging such technologies for improving the efficiency 95
of construction processes. In this exploratory study, we have 96
analysed the extent to which the industry has employed Big 97
Data technologies. Towards this end, we have reviewed not 98
only the latest research but also relevant research articles that 99
have been published over the last few decades in which the 100
precursor to modern Big Data Analytics techniques have been 101
deployed in various domain-specific construction applications. 102
Principal Big Data technology streams are explained to help 103
readers to understand the complicated subject. Concepts of Big 104
Data Engineering and Big Data Analytics are demarcated; the 105
works utilising these technologies across various subdomains 106
of the construction industry are deliberated. 107
17
Through our research, we conclude that while data-driven1
analytics have long been used in the construction industry due2
to the broad applicability of such techniques in many con-3
struction subdomains, the adoption of the recent, much agiler4
and powerful, Big Data technology has been relatively slow.5
Although Big Data trend is gradually creeping in the industry;6
its applicability is amplified further by many other emerging7
trends such as BIM, IOT, cloud computing, smart buildings,8
and augmented reality, which are also slightly elaborated. We9
presented some of the prominent future works along with10
potential pitfalls associated with Big Data while adopting it11
in the industry. To the best of our knowledge, this is the12
first in-depth review of the applications of Big Data related13
techniques in the construction industry. In our work, we have14
identified many potential application areas in which Big Data15
techniques can significantly advance the state-of-the-art in the16
construction industry. This work is of utility and relevance to17
all the construction researchers and practitioners who will like18
to harness the power of Big Data in the construction industry19
for developing exciting business applications.20
REFERENCES21
[1] V. Mayer-Schonberger and K. Cukier, Big Data: A Revolution that Will22
Transform how We Live, Work, and Think. Eamon Dolan/Houghton23
Mifflin Harcourt, 2013.24
[2] E. Siegel, Predictive Analytics: The Power to Predict who Will Click,25
Buy, Lie, Or Die. John Wiley & Sons, 2013.26
[3] “Blog post by Anand Rajaraman on how ‘More Data Usually27
Beats Better Algorithms’ (2013) [Online].” http://anand.typepad.com/28
datawocky/2008/03/more-data-usual.html. Accessed: 2013-09-12.29
[4] C. Anderson, “The end of theory,” Wired Magazine, vol. 16, 2008.30
[5] R. Eadie, M. Browne, H. Odeyinka, C. McKeown, and S. McNiff,31
“BIM implementation throughout the UK construction project lifecy-32
cle: An analysis,” Automation in Construction, vol. 36, pp. 145–151,33
2013.34
[6] Y. Jiao, S. Zhang, Y. Li, Y. Wang, B. Yang, and L. Wang, “An35
augmented Mapreduce framework for building information modeling36
applications,” in Computer Supported Cooperative Work in Design37
(CSCWD), Proceedings of the 2014 IEEE 18th International Confer-38
ence on, pp. 283–288, IEEE, 2014.39
[7] J.-R. Lin, Z.-Z. Hu, J.-P. Zhang, and F.-Q. Yu, “A natural-language-40
based approach to intelligent data retrieval and representation for cloud41
BIM,” Computer-Aided Civil and Infrastructure Engineering, 2015.42
[8] G. Aouad, M. Kagioglou, R. Cooper, J. Hinks, and M. Sexton, “Tech-43
nology management of it in construction: a driver or an enabler?,”44
Logistics Information Management, vol. 12, no. 1/2, pp. 130–137,45
1999.46
[9] F. Provost and T. Fawcett, Data Science for Business: What you need47
to know about data mining and data-analytic thinking. ” O’Reilly48
Media, Inc.”, 2013.49
[10] F. T. Matsunaga, J. D. Brancher, and R. M. Busto, “Data mining50
techniques and tasks for multidisciplinary applications: a system-51
atic review,” Revista Eletronica Argentina-Brasil de Tecnologias da52
Informacao e da Comunicacao, vol. 1, no. 2, 2015.53
[11] D. Singh and C. K. Reddy, “A survey on platforms for big data54
analytics,” Journal of Big Data, vol. 29, no. 9, 2015.55
[12] J. Qadir, N. Ahad, E. Mushtaq, and M. Bilal, “SDNs, clouds, and56
big data: New opportunities,” in Frontiers of Information Technology57
(FIT), 2014 12th International Conference on, pp. 28–33, IEEE, 2014.58
[13] J. Dean and S. Ghemawat, “Mapreduce: simplified data processing on59
large clusters,” Communications of the ACM, vol. 51, no. 1, pp. 107–60
113, 2008.61
[14] V. S. Agneeswaran, Big Data Analytics Beyond Hadoop: Real-Time 62
Applications with Storm, Spark, and More Hadoop Alternatives. FT 63
Press, 2014. 64
[15] H. Karau, A. Konwinski, P. Wendell, and M. Zaharia, Learning Spark: 65
Lightning-Fast Big Data Analysis. ” O’Reilly Media, Inc.”, 2015. 66
[16] C.-Y. Chang and M.-D. Tsai, “Knowledge-based navigation system for 67
building health diagnosis,” Advanced Engineering Informatics, vol. 27, 68
no. 2, pp. 246–260, 2013. 69
[17] T. White, Hadoop: The definitive guide. ” O’Reilly Media, Inc.”, 2012. 70
[18] P. Helland, “If you have too much data, then’good enough’is good 71
enough,” Communications of the ACM, vol. 54, no. 6, pp. 40–47, 2011. 72
[19] M. Gelbmann, “Graph DBMSs are gaining in popularity faster than 73
any other database category,” 2014. 74
[20] M. Das, J. C. Cheng, and S. S. Kumar, “BIMCloud: A distributed 75
cloud-based social BIM framework for project collaboration,” in the 76
15th International Conference on Computing in Civil and Building 77
Engineering (ICCCBE 2014), Florida, United States, 2014. 78
[21] S. Jeong, J. Byun, D. Kim, H. Sohn, I. H. Bae, and K. H. Law, “A 79
data management infrastructure for bridge monitoring,” in SPIE Smart 80
Structures and Materials+ Nondestructive Evaluation and Health 81
Monitoring, pp. 94350P–94350P, International Society for Optics and 82
Photonics, 2015. 83
[22] J. C. Cheng and M. Das, “A cloud computing approach to partial 84
exchange of BIM models,” in Proc. 30th CIB W78 International 85
Conference, pp. 9–12, 2013. 86
[23] L. Goldman, “The origins of British social science: Political economy, 87
natural science and statistics, 1830–1835,” The Historical Journal, 88
vol. 26, no. 03, pp. 587–616, 1983. 89
[24] R. O. Duda, P. E. Hart, et al., Pattern classification and scene analysis, 90
vol. 3. Wiley New York, 1973. 91
[25] S. Owen, R. Anil, T. Dunning, and E. Friedman, Mahout in action. 92
Manning Shelter Island, 2011. 93
[26] R. Ihaka and R. Gentleman, “R: a language for data analysis and 94
graphics,” Journal of computational and graphical statistics, vol. 5, 95
no. 3, pp. 299–314, 1996. 96
[27] R. Yadav, Spark Cookbook. Packt Publishing Ltd, 2015. 97
[28] J. Dean, Big data, data mining, and machine learning: value creation 98
for business leaders and practitioners. John Wiley and Sons, 2014. 99
[29] L. Wasserman, All of statistics: a concise course in statistical infer- 100
ence. Springer Science & Business Media, 2013. 101
[30] D. S. Moore and G. P. McCabe, Introduction to the Practice of 102
Statistics. WH Freeman/Times Books/Henry Holt & Co, 1989. 103
[31] H. Kim, L. Soibelman, and F. Grobler, “Factor selection for delay 104
analysis using knowledge discovery in databases,” Automation in 105
Construction, vol. 17, no. 5, pp. 550–560, 2008. 106
[32] P. Carrillo, J. Harding, and A. Choudhary, “Knowledge discovery 107
from post-project reviews,” Construction Management and Economics, 108
vol. 29, no. 7, pp. 713–723, 2011. 109
[33] T. S. Mahfouz, Construction legal support for differing site conditions 110
(DSC) through statistical modeling and machine learning (ML). PhD 111
thesis, Iowa State University, 2009. 112
[34] X. Jiang and S. Mahadevan, “Bayesian probabilistic inference for 113
nonparametric damage detection of structures,” Journal of engineering 114
mechanics, vol. 134, no. 10, pp. 820–831, 2008. 115
[35] J. Gong, C. H. Caldas, and C. Gordon, “Learning and classifying 116
actions of construction workers and equipment using bag-of-video- 117
feature-words and Bayesian network models,” Advanced Engineering 118
Informatics, vol. 25, no. 4, pp. 771–782, 2011. 119
[36] Y. Huang and J. L. Beck, “Novel sparse Bayesian learning for struc- 120
tural health monitoring using incomplete modal data,” in Proceedings 121
of the 2013 ASCE International Workshop on Computing in Civil 122
Engineering, Los Angeles, 2013. 123
[37] U. Fayyad, G. Piatetsky-Shapiro, and P. Smyth, “From data mining to 124

18
knowledge discovery in databases,” AI magazine, vol. 17, no. 3, p. 37,1
1996.2
[38] L. Wang and F. Leite, “Knowledge discovery of spatial conflict3
resolution philosophies in BIM-enabled mep design coordination using4
data mining techniques: a proof-of-concept,” in Proceedings of the5
ASCE International Workshop on Computing in Civil Engineering6
(WCCE13), pp. 419–426, 2013.7
[39] M. Kantardzic, Data mining: concepts, models, methods, and algo-8
rithms. John Wiley & Sons, 2011.9
[40] M. J. Berry and G. S. Linoff, Data mining techniques: for marketing,10
sales, and customer relationship management. John Wiley & Sons,11
2004.12
[41] T. Rujirayanyong and J. J. Shi, “A project-oriented data warehouse for13
construction,” Automation in Construction, vol. 15, no. 6, pp. 800–807,14
2006.15
[42] X. Wu, X. Zhu, G.-Q. Wu, and W. Ding, “Data mining with big data,”16
Knowledge and Data Engineering, IEEE Transactions on, vol. 26,17
no. 1, pp. 97–107, 2014.18
[43] R. Buchheit, J. Garrett Jr, S. Lee, and R. Brahme, “A knowledge19
discovery case study for the intelligent workplace,” Proc., Computing20
in Civil Engineering, pp. 914–921, 2000.21
[44] L. Soibelman and H. Kim, “Data preparation process for construction22
knowledge generation through knowledge discovery in databases,”23
Journal of Computing in Civil Engineering, 2002.24
[45] C.-W. Liao and Y.-H. Perng, “Data mining for occupational injuries25
in the taiwan construction industry,” Safety Science, vol. 46, no. 7,26
pp. 1091–1102, 2008.27
[46] C.-W. Cheng, S.-S. Leu, Y.-M. Cheng, T.-C. Wu, and C.-C. Lin,28
“Applying data mining techniques to explore factors contributing29
to occupational injuries in taiwan’s construction industry,” Accident30
Analysis & Prevention, vol. 48, pp. 214–222, 2012.31
[47] S.-W. Oh, M.-H. Kim, and Y.-S. Kim, “The application of data ware-32
house for developing construction productivity management system,”33
Korean Journal of Construction Engineering and Management, vol. 7,34
no. 2, pp. 127–137, 2006.35
[48] D. Koonce, L. Huang, and R. Judd, “EQL an express query language,”36
Computers & industrial engineering, vol. 35, no. 1, pp. 271–274, 1998.37
[49] W. Mazairac and J. Beetz, “BIMQL–an open query language for38
building information models,” Advanced Engineering Informatics,39
vol. 27, no. 4, pp. 444–456, 2013.40
[50] L. Soibelman, L. Y. Liu, and J. Wu, “Data fusion and modeling41
for construction management knowledge discovery,” in International42
Conference on Computing in Civil and Building Engineering, Weimar,43
Germany, 2004.44
[51] I. H. Witten and E. Frank, Data Mining: Practical machine learning45
tools and techniques. Morgan Kaufmann, 2005.46
[52] J. E. Diekmann and T. A. Kruppenbacher, “Claims analysis and47
computer reasoning,” Journal of construction engineering and man-48
agement, vol. 110, no. 4, pp. 391–408, 1984.49
[53] D. Arditi, F. E. Oksay, and O. B. Tokdemir, “Predicting the outcome of50
construction litigation using neural networks,” Computer-Aided Civil51
and Infrastructure Engineering, vol. 13, no. 2, pp. 75–81, 1998.52
[54] M. P. Kim, “Us army corps engineers construction contract claims53
guidance system,” in Excellence in the Constructed Project, pp. 203–54
209, ASCE, 1989.55
[55] K. Chau, “Predicting construction litigation outcome using particle56
swarm optimization,” in Innovations in Applied Artificial Intelligence,57
pp. 571–578, Springer, 2005.58
[56] O. B. Tokdemir, “Using case-based reasoning to predict the outcome59
of construction litigation,” Computer-Aided Civil and Infrastructure60
Engineering, vol. 14, no. 6, pp. 385–393, 1999.61
[57] K. Chau, “Prediction of construction litigation outcome–a case-based62
reasoning approach,” in Advances in Applied Artificial Intelligence,63
pp. 548–553, Springer, 2006.64
[58] D. Arditi and T. Pulket, “Predicting the outcome of construction 65
litigation using boosted decision trees,” Journal of Computing in Civil 66
Engineering, vol. 19, no. 4, pp. 387–393, 2005. 67
[59] J.-H. Chen and S. Hsu, “Hybrid ann-cbr model for disputed change 68
orders in construction projects,” Automation in Construction, vol. 17, 69
no. 1, pp. 56–64, 2007. 70
[60] M. Siu, R. Ekyalimpa, M. Lu, and S. Abourizk, “Applying regres- 71
sion analysis to predict and classify construction cycle time,” Proc., 72
Computing in Civil Engineering (2013). 73
[61] A. Aibinu and G. Jagboro, “The effects of construction delays on 74
project delivery in nigerian construction industry,” International jour- 75
nal of project management, vol. 20, no. 8, pp. 593–599, 2002. 76
[62] M. Sambasivan and Y. W. Soon, “Causes and effects of delays 77
in malaysian construction industry,” International Journal of project 78
management, vol. 25, no. 5, pp. 517–526, 2007. 79
[63] S. M. Trost and G. D. Oberlender, “Predicting accuracy of early cost 80
estimates using factor analysis and multivariate regression,” Journal of 81
Construction Engineering and Management, vol. 129, no. 2, pp. 198– 82
204, 2003. 83
[64] A. P. Chan, D. W. Chan, Y. Chiang, B. Tang, E. H. Chan, and K. S. 84
Ho, “Exploring critical success factors for partnering in construction 85
projects,” Journal of Construction Engineering and Management, 86
vol. 130, no. 2, pp. 188–198, 2004. 87
[65] D. Fang, Y. Chen, and L. Wong, “Safety climate in construction indus- 88
try: A case study in hong kong,” Journal of construction engineering 89
and management, 2006. 90
[66] K. Pietrzyk, “A systemic approach to moisture problems in buildings 91
for mould safety modelling,” Building and Environment, vol. 86, 92
pp. 50–60, 2015. 93
[67] V. S. Desai and S. Joshi, “Application of decision tree technique to 94
analyze construction project data,” in Information Systems, Technology 95
and Management, pp. 304–313, Springer, 2010. 96
[68] H.-B. Liu and Y.-B. Jiao, “Application of genetic algorithm-support 97
vector machine (ga-svm) for damage identification of bridge,” Interna- 98
tional Journal of Computational Intelligence and Applications, vol. 10, 99
no. 04, pp. 383–397, 2011. 100
[69] T. Mahfouz, J. Jones, and A. Kandil, “A machine learning approach 101
for automated document classification: A comparison between svm 102
and lsa performances,” International Journal of Engineering Research 103
& Innovation, p. 53, 2010. 104
[70] T. Mahfouz and A. Kandil, “Construction legal decision support using 105
support vector machine (svm),” Proc. of the CRC 2010: Innovation 106
for Reshaping Construction, 2010. 107
[71] D. Dehestani, F. Eftekhari, Y. Guo, S. Ling, S. Su, and H. Nguyen, 108
“Online support vector machine application for model based fault 109
detection and isolation of hvac system,” International Journal of 110
Machine Learning and Computing, vol. 1, no. 1, p. 66, 2011. 111
[72] Q. Chen, Y. Chan, and K. Worden, “Structural fault diagnosis and iso- 112
lation using neural networks based on response-only data,” Computers 113
& structures, vol. 81, no. 22, pp. 2165–2172, 2003. 114
[73] T. Marwala and S. Chakraverty, “Fault classification in structures with 115
incomplete measured data using autoassociative neural networks and 116
genetic algorithm,” Bangalore-Current Science, vol. 90, no. 4, p. 542, 117
2006. 118
[74] X. Fang, H. Luo, and J. Tang, “Structural damage detection using neu- 119
ral network with learning rate improvement,” Computers & structures, 120
vol. 83, no. 25, pp. 2150–2161, 2005. 121
[75] O. Moselhi, T. Hegazy, and P. Fazio, “Neural networks as tools in 122
construction,” Journal of Construction Engineering and Management, 123
1991. 124
[76] Y.-J. Chen, C.-W. Feng, Y.-R. Wang, H.-M. Wu, et al., “Using BIM 125
model and genetic algorithms to optimize the crew assignment for 126
construction project planning,” International Journal of Technology, 127
no. 3, pp. 179–187, 2011. 128
19
[77] H. Moon, H. Kim, L. Kang, and C. Kim, “BIM functions for1
optimized construction management in civil engineering,” Gerontech-2
nology, vol. 11, no. 2, p. 67, 2012.3
[78] D. M. Salama and N. M. El-Gohary, “Semantic text classification for4
supporting automated compliance checking in construction,” Journal5
of Computing in Civil Engineering, p. 04014106, 2013.6
[79] T. Mahfouz, “Unstructured construction document classification model7
through support vector machine (SVM),” pp. 126–133, 2011.8
[80] C. H. Caldas and L. Soibelman, “Automating hierarchical document9
classification for construction management information systems,” Au-10
tomation in Construction, vol. 12, no. 4, pp. 395–406, 2003.11
[81] N. Ur-Rahman and J. A. Harding, “Textual data mining for industrial12
knowledge management and text classification: A business oriented13
approach,” Expert Systems with Applications, vol. 39, no. 5, pp. 4729–14
4739, 2012.15
[82] S. Liu, C. A. McMahon, and S. J. Culley, “A review of structured16
document retrieval (SDR) technology to improve information access17
performance in engineering document management,” Computers in18
Industry, vol. 59, no. 1, pp. 3–16, 2008.19
[83] L. Soibelman, J. Wu, C. Caldas, I. Brilakis, and K.-Y. Lin, “Manage-20
ment and analysis of unstructured construction data types,” Advanced21
Engineering Informatics, vol. 22, no. 1, pp. 15–27, 2008.22
[84] I. Brilakis, Content based integration of construction site images in23
AEC/FM model based systems. PhD thesis, 2005.24
[85] T. P. Williams, “Using classification rules to develop a predictive indi-25
cator of project cost overrun potential from bidding data,” Computing26
in Civil Engineering (2007), p. 35, 2007.27
[86] A. O. Elfaki, S. Alatawi, and E. Abushandi, “Using intelligent28
techniques in construction project cost estimation: 10-year survey,”29
Advances in Civil Engineering, vol. 2014, 2014.30
[87] S. Han, S. Lee, and F. Pena-Mora, “A machine-learning classification31
approach to automatic detection of workers actions for behavior-based32
safety analysis,” in Proceedings of ASCE International Workshop on33
Computing in Civil Engineering, 2012.34
[88] H. Ng, A. Toukourou, and L. Soibelman, “Knowledge discovery in a35
facility condition assessment database using text clustering,” Journal36
of infrastructure systems, vol. 12, no. 1, pp. 50–59, 2006.37
[89] H. Fan and H. Li, “Retrieving similar cases for alternative dispute38
resolution in construction accidents using text mining techniques,”39
Automation in Construction, vol. 34, pp. 85–91, 2013.40
[90] M. Al Qady and A. Kandil, “Automatic clustering of construction41
project documents based on textual similarity,” Automation in Con-42
struction, vol. 42, pp. 36–49, 2014.43
[91] M. Al Qady and A. Kandil, “Concept relation extraction from con-44
struction documents using natural language processing,” Journal of45
Construction Engineering and Management, vol. 136, no. 3, pp. 294–46
302, 2009.47
[92] J. Zhang and N. M. El-Gohary, “Semantic NLP-based information48
extraction from construction regulatory documents for automated49
compliance checking,” Journal of Computing in Civil Engineering,50
2013.51
[93] J. Zhang and N. El-Gohary, “Extraction of construction regulatory re-52
quirements from textual documents using natural language processing53
techniques,” Journal of Computing in Civil Engineering, pp. 453–460,54
2012.55
[94] J. Zhang and N. El-Gohary, “Automated regulatory information extrac-56
tion from building codes leveraging syntactic and semantic informa-57
tion,” in Proc., 2012 ASCE Construction Research Congress (CRC),58
2012.59
[95] P. Demian and P. Balatsoukas, “Information retrieval from civil engi-60
neering repositories: Importance of context and granularity,” Journal61
of Computing in Civil Engineering, vol. 26, no. 6, pp. 727–740, 2012.62
[96] H. P. Tserng, S. Y.-L. Yin, and M.-H. Lee, “The use of knowledge63
map model in construction industry,” Journal of Civil Engineering and64
Management, vol. 16, no. 3, pp. 332–344, 2010.65
[97] H. Fan, F. Xue, and H. Li, “Project-based as-needed information 66
retrieval from unstructured AEC documents,” Journal of Management 67
in Engineering, vol. 31, no. 1, p. A4014012, 2014. 68
[98] J.-y. Hsu et al., “Content-based text mining technique for retrieval of 69
cad documents,” Automation in Construction, vol. 31, pp. 65–74, 2013. 70
[99] H.-T. Lin, N.-W. Chi, and S.-H. Hsieh, “A concept-based information 71
retrieval approach for engineering domain-specific technical docu- 72
ments,” Advanced Engineering Informatics, vol. 26, no. 2, pp. 349– 73
360, 2012. 74
[100] M. Al Qady and A. Kandil, “Document discourse for managing 75
construction project documents,” Journal of Computing in Civil Engi- 76
neering, vol. 27, no. 5, pp. 466–475, 2012. 77
[101] M. Osmani, J. Glass, and A. D. Price, “Architect and contractor 78
attitudes to waste minimisation,” 2006. 79
[102] L. O. Oyedele, M. Regan, J. von Meding, A. Ahmed, O. J. Ebohon, 80
and A. Elnokaly, “Reducing waste to landfill in the UK: identifying 81
impediments and critical solutions,” World Journal of Science, Tech- 82
nology and Sustainable Development, vol. 10, no. 2, pp. 131–142, 83
2013. 84
[103] Z. Wu, T. Ann, L. Shen, and G. Liu, “Quantifying construction and 85
demolition waste: An analytical review,” Waste Management, vol. 34, 86
no. 9, pp. 1683–1692, 2014. 87
[104] W. Lu, H. Yuan, J. Li, J. J. Hao, X. Mi, and Z. Ding, “An empirical 88
investigation of construction and demolition waste generation rates 89
in shenzhen city, south china,” Waste management, vol. 31, no. 4, 90
pp. 680–687, 2011. 91
[105] L. L. Ekanayake and G. Ofori, “Building waste assessment score: 92
design-based tool,” Building and Environment, vol. 39, no. 7, pp. 851– 93
861, 2004. 94
[106] M. Bilal, L. O. Oyedele, O. O. Akinade, S. O. Ajayi, H. A. Alaka, 95
H. A. Owolabi, J. Qadir, M. Pasha, and S. A. Bello, “Big data 96
architecture for construction waste analytics (cwa): A conceptual 97
framework,” Journal of Building Engineering, 2016. 98
[107] W. Lu, X. Chen, Y. Peng, and L. Shen, “Benchmarking construction 99
waste management performance using big data,” Resources, Conser- 100
vation and Recycling, vol. 105, pp. 49–58, 2015. 101
[108] W. Lu, X. Chen, D. C. Ho, and H. Wang, “Analysis of the construction 102
waste management performance in hong kong: the public and private 103
sectors compared using big data,” Journal of Cleaner Production, 104
vol. 112, pp. 521–531, 2016. 105
[109] N. Kargah-Ostadi, “Comparison of machine learning techniques for 106
developing performance prediction models,” in Computing in Civil 107
and Building Engineering (2014), pp. 1222–1229, ASCE. 108
[110] F. Castronovo, S. Lee, D. Nikolic, and J. I. Messner, “Visualization 109
in 4d construction management software: A review of standards and 110
guidelines,” in In: Proceedings of the International Conference on 111
Computing in Civil and Building Engineering. Orlando USA., pp. 315– 112
322, 2014. 113
[111] S. Goodwin and J. Dykes, “Visualising variations in household energy 114
consumption,” in Visual Analytics Science and Technology (VAST), 115
2012 IEEE Conference on, pp. 217–218, IEEE, 2012. 116
[112] T.-H. Chuang, B.-C. Lee, and I.-C. Wu, “Applying cloud computing 117
technology to BIM visualization and manipulation,” in 28th Inter- 118
national Symposium on Automation and Robotics in Construction, 119
vol. 201, pp. 144–149, 2011. 120
[113] Y. Jiao, Y. Wang, S. Zhang, Y. Li, B. Yang, and L. Yuan, “A 121
cloud approach to unified lifecycle data management in architecture, 122
engineering, construction and facilities management: Integrating BIMs 123
and SNS,” Advanced Engineering Informatics, vol. 27, no. 2, pp. 173– 124
188, 2013. 125
[114] P. Meadati, J. Irizarry, and A. K. Akhnoukh, “BIM and RFID 126
integration: a pilot study,” Advancing and Integrating Construction 127
Education, Research and Practice, pp. 570–78, 2010. 128
[115] Y. Jiao, S. Zhang, Y. Li, Y. Wang, and B. Yang, “Towards cloud 129
20
augmented reality for construction application by BIM and SNS1
integration,” Automation in Construction, vol. 33, pp. 37–47, 2013.2
[116] P. X. Gao and S. Keshav, “Optimal personal comfort management3
using spot+,” in Proceedings of the 5th ACM Workshop on Embedded4
Systems For Energy-Efficient Buildings, pp. 1–8, ACM, 2013.5
[117] A. Rabbani and S. Keshav, “The spot* system for flexible personal6
heating and cooling,” in Proceedings of the 2015 ACM Sixth Inter-7
national Conference on Future Energy Systems, pp. 209–210, ACM,8
2015.9
[118] A. A. Panagopoulos, M. Alam, A. Rogers, and N. R. Jennings,10
“Adaheat: A general adaptive intelligent agent for domestic heating11
control,” in Proceedings of the 2015 International Conference on12
Autonomous Agents and Multiagent Systems, pp. 1295–1303, Inter-13
national Foundation for Autonomous Agents and Multiagent Systems,14
2015.15
[119] C. Chen and D. J. Cook, “Behavior-based home energy prediction,” in16
Intelligent Environments (IE), 2012 8th International Conference on,17
pp. 57–63, IEEE, 2012.18
[120] S. Taneja, A. Akcamete, B. Akinci, J. Garrett, L. Soibelman, and E. W.19
East, “Analysis of three indoor localization technologies to support20
facility management field activities,” in Proceedings of the Interna-21
tional Conference on Computing in Civil and Building Engineering,22
Nottingham, UK, 2010.23
[121] H. S. Ng and L. Soibelman, “Knowledge discovery in maintenance24
databases: Enhancing the maintainability in higher education facili-25
ties,” in Proc., 2003 Construction Research Congress, ASCE, Reston,26
Va, 2003.27
[122] R. Liu and R. Issa, “Issues in BIM for facility management from28
industry practitioners perspectives,” Computing in Civil Engineering29
(2013), pp. 411–418, 2013.30
[123] J. Sanyal and J. New, “Simulation and big data challenges in tuning31
building energy models,” in Modeling and Simulation of Cyber-32
Physical Energy Systems (MSCPES), 2013 Workshop on, pp. 1–6,33
IEEE, 2013.34
[124] O. Linda, D. Wijayasekara, M. Manic, and C. Rieger, “Computational35
intelligence based anomaly detection for building energy management36
systems,” in Resilient Control Systems (ISRCS), 2012 5th International37
Symposium on, pp. 77–82, IEEE, 2012.38
[125] I. Hong, J. Byun, and S. Park, “Cloud computing-based building39
energy management system with zigbee sensor network,” in Innovative40
Mobile and Internet Services in Ubiquitous Computing (IMIS), 201241
Sixth International Conference on, pp. 547–551, IEEE, 2012.42
[126] R. P. Singh, S. Keshav, and T. Brecht, “A cloud-based consumer-centric43
architecture for energy data analytics,” in Proceedings of the fourth44
international conference on Future energy systems, pp. 63–74, ACM,45
2013.46
[127] M. Berges, E. Goldman, H. S. Matthews, and L. Soibelman, “Learning47
systems for electric consumption of buildings,” in ASCI international48
workshop on computing in civil engineering, vol. 38, 2009.49
[128] C. Wei and Y. Li, “Design of energy consumption monitoring and50
energy-saving management system of intelligent building based on51
the internet of things,” in Electronics, Communications and Control52
(ICECC), 2011 International Conference on, pp. 3650–3652, IEEE,53
2011.54
[129] R. Volk, J. Stengel, and F. Schultmann, “Building information mod-55
eling (BIM) for existing buildingsliterature review and future needs,”56
Automation in Construction, vol. 38, pp. 109–127, 2014.57
[130] X. Wang, “BIM handbook: A guide to building information modeling58
for owners, managers, designers, engineers and contractors,” Construc-59
tion Economics and Building, vol. 12, no. 3, pp. 101–102, 2012.60
[131] S. Azhar, “Building information modeling (BIM): Trends, benefits,61
risks, and challenges for the AEC industry,” Leadership and Manage-62
ment in Engineering, 2011.63
[132] K. Barlish and K. Sullivan, “How to measure the benefits of BIMa64
case study approach,” Automation in construction, vol. 24, pp. 149– 65
159, 2012. 66
[133] J. D. Goedert and P. Meadati, “Integrating construction process doc- 67
umentation into building information modeling,” Journal of construc- 68
tion engineering and management, vol. 134, no. 7, pp. 509–516, 2008. 69
[134] U. Isikdag, J. Underwood, G. Aouad, and N. Trodd, “Investigating the 70
role of building information models as a part of an integrated data 71
layer: a fire response management case,” Architectural Engineering 72
and Design Management, vol. 3, no. 2, pp. 124–142, 2007. 73
[135] N. Yu, Y. Jiang, L. Luo, S. Lee, A. Jallow, D. Wu, J. I. Messner, 74
R. M. Leicht, and J. Yen, “Integrating BIMserver and openstudio for 75
energy efficient building,” in Proceedings of 2013 ASCE International 76
Workshop on Computing in Civil Engineering, 2013. 77
[136] J. Zhang, Q. Liu, F. Yu, Z. Hu, and W. Zhao, “A framework of cloud- 78
computing-based BIM service for building lifecycle,” Computing in 79
Civil and Building Engineering, pp. 1514–1521, 2014. 80
[137] J. Wong, X. Wang, H. Li, G. Chan, and H. Li, “A review of cloud-based 81
BIM technology in the construction sector,” The Journal of Information 82
Technology in Construction, vol. 19, pp. 281–291, 2014. 83
[138] Y. Hsieh, “Cloud-computing based parameter identification system– 84
with applications in geotechnical engineering,” in Computing in Civil 85
and Building Engineering (2014), pp. 1384–1392, ASCE. 86
[139] R. Klinc, I. Perus, and M. Dolenc, “Re-using engineering tools: 87
Engineering SaaS web application framework,” in Proceedings of the 88
2014 International Conference on Computing in Civil and Building 89
Engineering, pp. 23–25, 2014. 90
[140] B. Kumar, J. C. Cheng, and L. McGibbney, “Cloud computing and its 91
implications for construction it,” in Computing in Civil and Building 92
Engineering, Proceedings of the International Conference, vol. 30, 93
p. 315, 2010. 94
[141] A. Redmond, A. V. Hore, and R. West, “Building support for cloud 95
computing in the Irish construction industry,” 2010. 96
[142] F. Fathi, M. Abedi, S. Rambat, S. Rawai, M. Z. Zakiyudin, et al., 97
“Context-aware cloud computing for construction collaboration,” Jour- 98
nal of Cloud Computing, vol. 2012, pp. 1–11, 2012. 99
[143] T. H. Beach, O. F. Rana, Y. Rezgui, and M. Parashar, “Cloud 100
computing for the architecture, engineering & construction sector: 101
requirements, prototype & experience,” Journal of Cloud Computing, 102
vol. 2, no. 1, pp. 1–16, 2013. 103
[144] H.-Y. Chong, J. S. Wong, and X. Wang, “An explanatory case study on 104
cloud computing applications in the built environment,” Automation in 105
Construction, vol. 44, pp. 152–162, 2014. 106
[145] A. Grilo and R. Jardim-Goncalves, “Cloud-marketplaces: Distributed 107
e-procurement for the AEC sector,” Advanced Engineering Informat- 108
ics, vol. 27, no. 2, pp. 160–172, 2013. 109
[146] T. Elghamrawy and F. Boukamp, “Managing construction informa- 110
tion using rfid-based semantic contexts,” Automation in construction, 111
vol. 19, no. 8, pp. 1056–1066, 2010. 112
[147] E. Curry, J. ODonnell, E. Corry, S. Hasan, M. Keane, and S. ORiain, 113
“Linking building data in the cloud: Integrating cross-domain building 114
data using linked data,” Advanced Engineering Informatics, vol. 27, 115
no. 2, pp. 206–219, 2013. 116
[148] A. Zanella, N. Bui, A. Castellani, L. Vangelista, and M. Zorzi, 117
“Internet of things for smart cities,” Internet of Things Journal, IEEE, 118
vol. 1, no. 1, pp. 22–32, 2014. 119
[149] A. Khan and K. Hornbæk, “Big data from the built environment,” in 120
Proceedings of the 2nd international workshop on Research in the 121
large, pp. 29–32, ACM, 2011. 122
[150] J. Stankovic et al., “Research directions for the internet of things,” 123
Internet of Things Journal, IEEE, vol. 1, no. 1, pp. 3–9, 2014. 124
[151] D. Bonino, F. Corno, and L. De Russis, “Real-time big data processing 125
for domain experts, an application to smart buildings,” Big Data 126
Computing/Rajendra Akerkar; Taylor & Francis Press: London, UK, 127
vol. 1, pp. 415–447, 2013. 128
21
[152] C. Miller, Z. Nagy, and A. Schlueter, “Automated daily pattern filtering1
of measured building performance data,” Automation in Construction,2
vol. 49, pp. 1–17, 2015.3
[153] G. Williams, M. Gheisari, P.-J. Chen, and J. Irizarry, “BIM2MAR: An4
efficient BIM translation to mobile augmented reality applications,”5
Journal of Management in Engineering, 2014.6
[154] B. Zhadanovsky and S. Sinenko, “Visualization of design, organization7
of construction and technological solutions,” in Computing in Civil and8
Building Engineering (2014), pp. 137–142, ASCE.9
[155] A. Motamedi, Improving Facilities Lifecycle Management Using RFID10
Localization And BIM-Based Visual Analytics. PhD thesis, Concordia11
University, 2013.12
[156] N. Gu and K. London, “Understanding and facilitating BIM adoption13
in the AEC industry,” Automation in construction, vol. 19, no. 8,14
pp. 988–999, 2010.15
[157] C. Chiang, T. Ho, and C. Chou, “A BIM-enabled platform for16
power consumption data collection and analysis,” Computing in Civil17
Engineering, pp. 90–98, 2012.18
[158] K.-C. Yeh, M.-H. Tsai, and S.-C. Kang, “On-site building information19
retrieval by using projection-based augmented reality,” Journal of20
Computing in Civil Engineering, 2012.21
[159] J. Bughin, M. Chui, and J. Manyika, “Clouds, big data, and smart as-22
sets: Ten tech-enabled business trends to watch,” McKinsey Quarterly,23
vol. 56, no. 1, pp. 75–86, 2010.24
[160] A. Redmond, A. Hore, M. Alshawi, and R. West, “Exploring how25
information exchanges can be enhanced through cloud BIM,” Automa-26
tion in Construction, vol. 24, pp. 175–183, 2012.27
[161] C. Amarnath, A. Sawhney, and J. U. Maheswari, “Cloud computing28
to enhance collaboration, coordination and communication in the con-29
struction industry,” in Information and Communication Technologies30
(WICT), 2011 World Congress on, pp. 1235–1240, IEEE, 2011.31
[162] N. M. Rawai, M. S. Fathi, M. Abedi, and S. Rambat, “Cloud comput-32
ing for green construction management,” in Intelligent System Design33
and Engineering Applications (ISDEA), 2013 Third International34
Conference on, pp. 432–435, IEEE, 2013.35
[163] G. Kortuem, F. Kawsar, D. Fitton, and V. Sundramoorthy, “Smart ob-36
jects as building blocks for the internet of things,” Internet Computing,37
IEEE, vol. 14, no. 1, pp. 44–51, 2010.38
[164] H.-A. Jacobsen, R. H. Katz, H. Schmeck, and C. Goebel, “Smart build-39
ings and smart grids (dagstuhl seminar 15091),” Dagstuhl Reports,40
vol. 5, no. 2, 2015.41
[165] S. Rankohi and L. Waugh, “Review and analysis of augmented reality42
literature for construction industry,” Visualization in Engineering,43
vol. 1, no. 1, pp. 1–18, 2013.44
[166] H.-L. Chi, S.-C. Kang, and X. Wang, “Research trends and opportu-45
nities of augmented reality applications in architecture, engineering,46
and construction,” Automation in construction, vol. 33, pp. 116–122,47
2013.48
[167] B. Bossink and H. Brouwers, “Construction waste: quantification and49
source evaluation,” Journal of construction engineering and manage-50
ment, vol. 122, no. 1, pp. 55–60, 1996.51
[168] V. W. Tam, C. M. Tam, S. Zeng, and W. C. Ng, “Towards adoption52
of prefabrication in construction,” Building and environment, vol. 42,53
no. 10, pp. 3642–3654, 2007.54
[169] P. Pauwels and W. Terkaj, “Express to owl for construction industry:55
towards a recommendable and usable ifcowl ontology,” Automation in56
Construction, vol. 63, pp. 100–133, 2016.57
[170] J. Beetz, J. Van Leeuwen, and B. De Vries, “Ifcowl: A case of58
transforming express schemas into ontologies,” Artificial Intelligence59
for Engineering Design, Analysis and Manufacturing, vol. 23, no. 01,60
pp. 89–101, 2009.61
[171] R. Wong, “Big data privacy,” Journal of Information Technology and62
Software Engineering, vol. 2, p. e114, 2012.63
[172] A. Cavoukian and J. Jonas, Privacy by design in the age of big data.64
Information and Privacy Commissioner of Ontario, Canada, 2012.65
[173] O. Tene and J. Polonetsky, “Big data for all: Privacy and user control 66
in the age of analytics,” Nw. J. Tech. & Intell. Prop., vol. 11, p. xxvii, 67
2012. 68

22
LIST OF FIGURES1
1 Proposed Review Structure of the Paper . . . . . . . . . . . . . . . . . . . . . . . . . . . . . . . . . . . . . . . . . 232
2 An overview of MapReduce processing [12] . . . . . . . . . . . . . . . . . . . . . . . . . . . . . . . . . . . . . . . 243
3 Apache Spark and Related Technology Stack [15] . . . . . . . . . . . . . . . . . . . . . . . . . . . . . . . . . . . 254
4 Databases Popularity Trend [19] . . . . . . . . . . . . . . . . . . . . . . . . . . . . . . . . . . . . . . . . . . . . . 265
5 Multidisciplinary Nature of Big Data Analytics (Adapted from [28]) . . . . . . . . . . . . . . . . . . . . . . . . . 276

FIGURES 23
Fig. 1. Proposed Review Structure of the Paper

FIGURES 24
Fig. 2. An overview of MapReduce processing [12]

FIGURES 25
Fig. 3. Apache Spark and Related Technology Stack [15]

FIGURES 26
Fig. 4. Databases Popularity Trend [19]

FIGURES 27
Fig. 5. Multidisciplinary Nature of Big Data Analytics (Adapted from [28])
FIGURES 28
LIST OF TABLES1
I Prominent NoSQL Systems and Their Critical Features. . . . . . . . . . . . . . . . . . . . . . . . . . . . . . . . . 28 2339
II Big Data Analytics (BDA) ML Tools . . . . . . . . . . . . . . . . . . . . . . . . . . . . . . . . . . . . . . . . . . 28 2340
III Summary of works with statistical methods . . . . . . . . . . . . . . . . . . . . . . . . . . . . . . . . . . . . . . . 29 2341
IV Summary of Works on Data Mining . . . . . . . . . . . . . . . . . . . . . . . . . . . . . . . . . . . . . . . . . . . 29 2342
V Classification-based works for the construction industry, categorized per classification technique . . . . . . . . . . 30 2343
VI Classification-based Applications in the construction industry . . . . . . . . . . . . . . . . . . . . . . . . . . . . . 31 2344
VII Summary of opportunities within the sub-domain of construction industry . . . . . . . . . . . . . . . . . . . . . . 32 2345
VIII Prominent NoSQL Systems and Their Critical Features. . . . . . . . . . . . . . . . . . . . . . . . . . . . . . . . . 33 2346
IX Big Data Analytics (BDA) ML Tools . . . . . . . . . . . . . . . . . . . . . . . . . . . . . . . . . . . . . . . . . . 34 2347
X Summary of works with statistical methods . . . . . . . . . . . . . . . . . . . . . . . . . . . . . . . . . . . . . . . 35 2348
XI Summary of Works on Data Mining . . . . . . . . . . . . . . . . . . . . . . . . . . . . . . . . . . . . . . . . . . . 36 2349
XII Classification-based works for the construction industry, categorized per classification technique . . . . . . . . . . 37 2350
XIII Classification-based Applications in the construction industry . . . . . . . . . . . . . . . . . . . . . . . . . . . . . 38 2351
XIV Summary of opportunities within the sub-domain of construction industry . . . . . . . . . . . . . . . . . . . . . . 39 2352

TABLES 29
TABLE I. PROMINENT NOSQL SYSTEMS AND THEIR CRITICAL FEATURES.
Product Name ProductDescription Data Model(s) Language Concurrency Storage Key
Features
Cassandra Apache Cassandra is scalable database that provides proven fault-tolerance and tunableconsistency on cluster of commodity servers.
ColumnarKey-Value
Java,Python MVCC Disk,
Hadoop, Plugin
HighAvailability,Partition Tolerance
HBase HBase is distributed data store that extended Google Bigtable to scale on HDFS. Its noveltylies in storing and accessing data with random access. It doesn‘t restrict the kind of databeing stored.
ColumnarKey-Value Java Locks Hadoop Consistent,
Partition Tolerance
HyperTable Hypertable supports data distribution for scalable data management. It offers maximumefficiency and superior performance. However, it lacks data management features such astransaction and join processing.
Columnar C++ MVCC
DiskHadoopGlusterFS,Kosmos File System
Consistent,Partition Tolerance
MongoDB MongoDB is a document-oriented database. It facilitates storage of documents withvariable schemas and is suitable for applications, storing complex types.
DocumentKey-Value C++ Locks Disk,GFS,
PluginConsistent,Partition Tolerance
CouchDB CouchDB is suitable for large scale web and mobile applications. It facilitate data storagethat are queried through web browsers, via HTTP. JavaScript is used to index, integrate,and transform the database.
DocumentKey-Value
Erlang,C MVCC Disk High Availability,
Partition Tolerance
MarkLogic MarkLogic facilitates storing documents efficiently for easy and intuitive search. It issuitable for applications that derive revenue, streamline operations, risk management, andsecurity.
DocumentC,
Java,Python
ACIDGFSHadoopS3, RDF
Consistent,High Availability,Partition Tolerance
Redis Redis is in-memory system that can be used as a database, cache, and message broker.When configured on cluster, it becomes scalable and highly available. It also supportstransaction processing.
Key-Value ANSIC Locks RAM Consistent,
Partition Tolerance
Riak Riak is a distributed database that provides scalability and high availability. It achievesperformance and fault tolerance through built-in distribution and replications.
Key-Value Erlang ACID Disk, Plugin High Availability,Partition Tolerance
BarkeleyDB Berkeley DB is embedded database for key-value dataset. It is written in C but supportsapplication development for C++, PHP, Java, Perl, among others.
Key-Value Java ACID RDFConsistency,Availability,Partition-Tolerance
Neo4J Neo4J is a semantic store for creating, updating, deleting, and retrieving graph data. Itcaptures relationships natively and processes queries as paths through language calledCypher. Neo4J is good option for applications, dealing with connected data.
Graph Java Locks Disk High Availability,Partition Tolerance
OrientDB OrientDB is a system for large-scale and distributed graph management. The core featuresinclude multi-master replication and sharding.
Graph Java ACIDDisk,Plug-inRAM, SSD
Consistent,High Availability,Partition Tolerance
OracleNoSQL Oracle NoSQL is designed specifically to provide highly reliability, scalability, and
maximum availability across the cluster of storage nodes. Data is replicated to surviverapid failure and load balancing for distributed query processing.
ColumnarDocumentKey-Value
Graph
Java ACID Berkeley DBArchitecture, RDF
Consistency,Availability,LimitedPartition-Tolerance
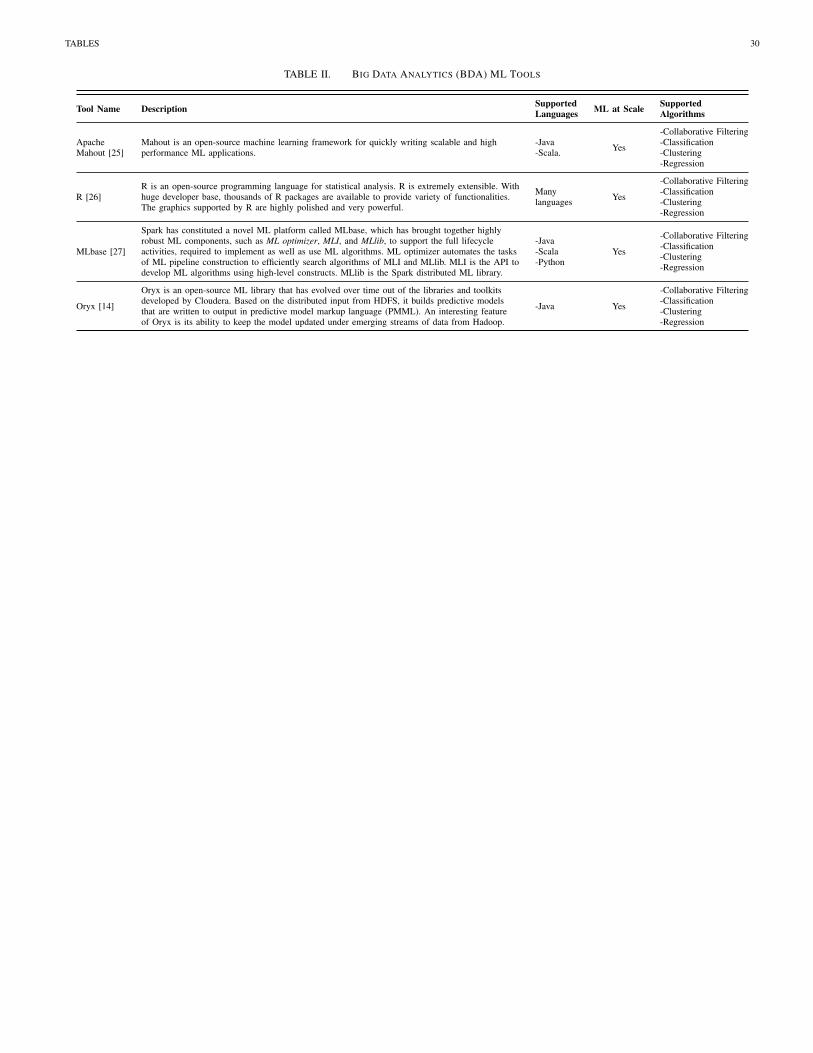
TABLES 30
TABLE II. BIG DATA ANALYTICS (BDA) ML TOOLS
Tool Name Description SupportedLanguages ML at Scale Supported
Algorithms
ApacheMahout [25]
Mahout is an open-source machine learning framework for quickly writing scalable and highperformance ML applications.
-Java-Scala. Yes
-Collaborative Filtering-Classification-Clustering-Regression
R [26]R is an open-source programming language for statistical analysis. R is extremely extensible. Withhuge developer base, thousands of R packages are available to provide variety of functionalities.The graphics supported by R are highly polished and very powerful.
Manylanguages Yes
-Collaborative Filtering-Classification-Clustering-Regression
MLbase [27]
Spark has constituted a novel ML platform called MLbase, which has brought together highlyrobust ML components, such as ML optimizer, MLI, and MLlib, to support the full lifecycleactivities, required to implement as well as use ML algorithms. ML optimizer automates the tasksof ML pipeline construction to efficiently search algorithms of MLI and MLlib. MLI is the API todevelop ML algorithms using high-level constructs. MLlib is the Spark distributed ML library.
-Java-Scala-Python
Yes
-Collaborative Filtering-Classification-Clustering-Regression
Oryx [14]
Oryx is an open-source ML library that has evolved over time out of the libraries and toolkitsdeveloped by Cloudera. Based on the distributed input from HDFS, it builds predictive modelsthat are written to output in predictive model markup language (PMML). An interesting featureof Oryx is its ability to keep the model updated under emerging streams of data from Hadoop.
-Java Yes
-Collaborative Filtering-Classification-Clustering-Regression

TABLES 31
TABLE III. SUMMARY OF WORKS WITH STATISTICAL METHODS
Purpose of use Technique(s) employed References
Identifying the causes ofconstruction delays
-Frequency charts-Correlation matrix-Factor analysis-Bayesian networks
[31]
Learning frompost project reviews (PPRs)
-Link analysis-Dimensional matrix analysis [32]
Decision supportsystems for construction litigation
-Naıve Bayes-Decision trees-Rule inductive
[33]
Structural damagedetection in buildings
-Gaussian distribution-Monte Carlo simulation [34]
Identifying workersand heavy machinery actionstowards site safety
-Gaussian distribution-Naıve Bayes-Bags of video feature
[35], [36]
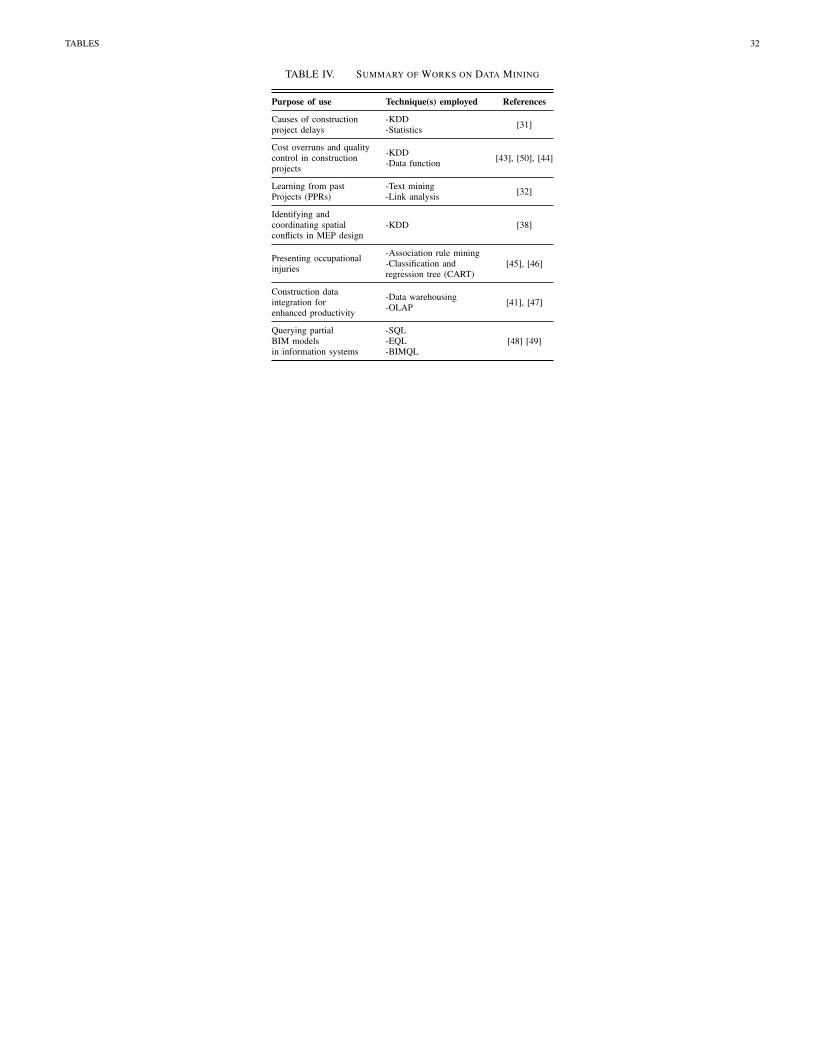
TABLES 32
TABLE IV. SUMMARY OF WORKS ON DATA MINING
Purpose of use Technique(s) employed References
Causes of constructionproject delays
-KDD-Statistics [31]
Cost overruns and qualitycontrol in constructionprojects
-KDD-Data function [43], [50], [44]
Learning from pastProjects (PPRs)
-Text mining-Link analysis [32]
Identifying andcoordinating spatialconflicts in MEP design
-KDD [38]
Presenting occupationalinjuries
-Association rule mining-Classification andregression tree (CART)
[45], [46]
Construction dataintegration forenhanced productivity
-Data warehousing-OLAP [41], [47]
Querying partialBIM modelsin information systems
-SQL-EQL-BIMQL
[48] [49]

TABLES 33
TABLE V. CLASSIFICATION-BASED WORKS FOR THE CONSTRUCTION INDUSTRY, CATEGORIZED PER CLASSIFICATION TECHNIQUE
Purpose of use Technique(s) employed References
Naıve Bayes
Detecting structuraldamages of buildings
-Gaussian distribution-Probability densityfunction
[34]
Complex actionsclassification of workersand heavy machinery
-Bags-of-video-features-Bayesian probability [35]
Stiffness reduction ofstructures, caused byearthquakes
-Bayesianprobability [36]
Decision Trees (DTs)
Assessment of mouldgermination inbuilding structures
-Fault treeanalysis [66]
Construction labourproductivity assessment
-Augmented decisiontree [67]
Support Vector Machine (SVM)
Damage identificationin bridges
-SVM-GA-RDF [68]
Automated constructiondocument classification
-SVM-LSA [69]
Legal decisionsupport system
-SVM-TF-TF/IDF-LTF
[70]
Semi-supervised fault detectionand isolation system for HVAC -SVM [71]
Artificial Neural Networks (ANN)
Structural fault detection,caused by vibration and fatigue
-TransmissibilityFunctions-ANN
[72]
Fault classification system -GA-ANN [73]
Structural damage detection
-Tuneable steepestdescent method-Frequency responsefunction
[74]
Expert system for optimalmarkup estimation -ANN [75]
Genetic Algorithms (GA)
Cost/schedule integratedplanning system foroptimal crew assignment
-GA-Object sequencingmatrix
[76]
Risks imposed by scheduleand workspace conflicts
-GA-Fuzzy logic [77]
Latent Semantic Analysis (LSA)
Automated constructiondocument classification -LSA [69]
Automated regulatory and contractualcompliance system -LSA [78]

TABLES 34
TABLE VI. CLASSIFICATION-BASED APPLICATIONS IN THE CONSTRUCTION INDUSTRY
Purpose of use Technique(s) employed References
Document classification
Document classification basedon CSI MasterFormat
-Boolean weighting-Absolute frequency-TF/IDF-IFC weighting
[80]
Classifying post project reviewdocuments
-SVM-KNN-DT-Naıve Bayes
[81]
Structured document retrievalsystem
-SGML-XML [82]
Document analysis
Unstructured documentanalysis system -ML classifiers [83]
Image-based classification
Indexing constructionsite imagery
-Whitening Transform(WT)-SVM-Biased DiscriminantTransform (BDT)
[84]
Predicting overrun potential
Highway project biddingsystem for overrun prediction - Ripple Down Rules [85]
Construction project estimation -ML algorithms [86]
Safety analysis
Worker behaviourmodelling to predict siteinjury from constructionsite videos
-Bayesian classifier [87]

TABLES 35
TABLE VII. SUMMARY OF OPPORTUNITIES WITHIN THE SUB-DOMAIN OF CONSTRUCTION INDUSTRY
Construction IndustrySub-domains State of the Art Potential Opportunities
Resource andWaste Optimization
-Construction waste generation estimation [105], [107]-Waste generation benchmarking [107]Comparative analysis of waste management performance [108]
-BIM tools to actualize circular economy for sustainability, greensupply chains, and closed-loop supply chains-BIM tools for optimal & auto design specification-BIM integrated materials database using open standards-BIM integrated linked data for waste data management-BIM based waste estimation using predictive analytics-BIM based waste minimisation through deconstruction-BIM based waste minimisation through resource optimisation-BIM based waste minimisation through interactive visualisation
Generative Designs -Autodesk Dreamcatcher—a prototype system to showcasethe feasibility of this idea of generating design from abstract requirements
-Framework to exploit Big Data analytics to parallelize algorithms forreal time GD computation-Big Data algorithms to accurately reduce the design space-Big Data enabled GD tool
Clash Detectionand Resolution
-BIM enabled approaches are developed to resolve conflicts in MEP design,however these approaches are time consuming [38]
-Big Data analytics based MEP design checker that uses prescriptiveanalytics not only to identify conflicts but also describe the bestaction to resolve it.
PerformancePrediction
-Pavement management system using pavement deteriorationprediction [109] -Big Data driven BIM system for pavement deterioration prediction
Visual Analytics -4D BIM Visualisation [110], energy user classification [111], using VA-Cloud-based BIM system for design visualisation and exploration [112]
-Visual analytics driven Big Data framework for BIM modelvisualisation-Visual analytics driven design optimiser for energy reductionand comfort maximisation
Social NetworkingServices/ Analytics
-Integration of project management data using social networking [113]-BIM, RFID, and social data integration [114]-AR based Business social networking services (BSNS) [115]
-BIM framework for social network information modellingusing Big Data
PersonalizedServices
-SPOT+ indoor air personalisation [116], SPOT* for heating/cooling [117]-AdaHeat domestic heat regulator [118], Behavioural energy adaptation [119]
-Personalisation energy monitor that requires less user input toregulate optimal energy consumption
Facility Management -BIM based indoor localisation [120], FM cost reduction through massivedata exploration [121], FM data modelling through BIM [122] -Big Data Analytics based BIM system for FM activities
Energy Management andAnalytics
-Energy simulation software (EnergyPlus) [123], energy management systems[124], Cloud based energy data storage and processing [125], [126]-Appliance event identification using NILM and Wire Spy [127], [128],Energy user classification [111], IOT framework for energy analytics [128]
-Big Data framework for BIM based open energy data persistence-Big Data analytics platform to simulate and optimise energyusage of buildings
Big Data with BIM
-BIM models for building designs [129], [130], [131], [132], BIM models forconstruction process documentation [133], BIM models for GIS data [134],BIM for MEP conflict resolution [38], BIM open platform [135], BIM viacloud [20], [136], [112], BIM and RFID [114], BIM models for projectmanagement data [113], MapReduce savvy BIM data storage and processing [6]
-Big Data enabled IFC-compliant BIM storage system-BIM platform for IOT applications-Open data platform for linking BIM models with external sources-Big Data enabled BIM processing platform to developingapplications
Big Data with CloudComputing
-Cloud based energy data management [125]-Cloud based BIM data management [20]-Cloud enabled BIM design data storage & exploration [112], [137], [136], [138]-SaaS platform for structural MEP analysis [139]-Cloud based BIM system for SMEs [140], [141]-BIM based context-aware computing [142]-Amazon EC2 enabled Google SketchUp [143], [144]-Cloud based e-procurement platform [145]
-A BDA platform to store and process BIM models on cloud fordeveloping domain specific applications.
Big Data with Internetof Things (IOT)
-RFID based construction document retrieval & assetsmanagement system [146], [114]-IOT based energy monitoring and analysis system [128], [147]-Urban IOT, a framework for smart cities [148]
-Big Data driven IOT platform for Smart Buildings
Big Data for SmartBuildings
-Project dasher for measuring and visualising CO2 emission of buildings [149]-A robust firefighting systems for buildings [150]-Complex event processing for smart buildings [151]-DayFilter, for pattern recognition in energy data [152]
-Building Personalisation Services using Big Data-Mobiles apps to exploit building personalisation services
Big Data with AugmentedReality (AR)
-BIM2MAR, a platform to integrate BIM, mobile and AR [153]-Web3D-based AR system for BIM and social networking services (SNS) [115]
-Big BIM Data Visual Exploration System-Big Data and AR based virtual site exploration-Big Data and AR enabled Proactive Dispute Identificationand resolution System-Big Data and AR enabled As-planned vs. As-builtComparison System