Big Data - Frank Rogowski
17
description
Nevada DGS 2013 presentationBig Data by Frank Rogowski
Transcript of Big Data - Frank Rogowski


Foundation & Vision
Big Data Use Case Examples
Big Data’s Core Tenets
A Call to Action

Big Data will transform we live, work, and perceived the world around us.
Big Data will bring quick value, is/will be impactful and be a measurable ROI for organizations.
Big data, data analytics, and human insight are far better together.
Data (potential for insights) will likely be on the balance sheets of corporations as an weighed asset.
Sample statistics are inferior to N=ALL.
Cited Source: Mayer-Schonberger V. & Cukier K. (2013). Big Data: A revolution that will transform how we live, work, and think. NY, NY: Houghton Mifflin Harcourt Publishing Company.
http://www.amazon.com/Big-Data-RevolutionTransformThink/dp/0544002695/ref=sr_1_1?s=books&ie=UTF8&qid=1384295044&sr=11&keywords=big+data+a+revolution+that+will+transform+how+we+live+work+and+think

Horizontal Use Cases
Government Telecom Manufacturing Healthcare
• Drug development
• Scientific research
• Evidence based medicine
• Healthcare outcomes analysis
• Supply chain optimization
• Defect tracking
• RFID Correlation
• Warranty management
• Broadcast monitoring
• Churn prevention
• Advertising optimization
• Law enforcement
• Counter terrorism
• Traffic flow optimization
Finance
• Fraud detection
• Anti-money laundering
• Risk management
Energy
• Weather forecasting
• Natural resource exploration
Big data use cases are business-driven and cut across a wide range of industries & functions
Big Data Use Cases


Google Flu Trends / CDC ◦ H1N1 Flu Breakout
◦ Summary Google Flu Trends uses aggregated Google search data to estimate flu activity.
Identify areas by flu virus using people search criteria.
Predict not just nationally, but state and now city too.
◦ Particulars 500 million mathematical models applied.
Relied on the concept of correlation NOT causality.
Models continuously experimented.
50m common key words searches analyzed.
45 Key word search compared against CDC list of flu outbreaks from 2003-2008.
Google’s model found a strong correlation between their predictions and the official figures nationwide.
◦ Outcomes & Lesson Learned Unlike CDC, Google can predict in near real time not a two or three week lag.
When H1N1crisis struck in 2009, Google’s predication were timely and value to public health officials.
For Google, no mass distribution of mouth swabs or contacting physician offices for case load experience.
Big Data was the mechanism and likely the better tool to combat the next pandemic.
http://www.google.org/flutrends/us/#US-NV

Walmart
◦ JIT Inventory ◦ Summary
Wal-Mart institutes a sophisticated just-in time supply chain model that takes into account both customer sentiment, buying patterns, and externalities for a correlated analysis.
◦ Particulars $450B revenue generator
2m employees
One of the top corporate data repositories globally (PoS and Supply Chain).
Records every product in Retail Link System
Allow merchandise suppliers to monitor volume of sales and inventory
Transparency forces vendor to mange their own inventory
Walmart increasingly does not take ownership of the product until the “point of sale”.
Walmart uses correlations to uncover consumer buying habits
◦ Outcomes & Lesson Learned Reduce risks and cost of inventory ownership to Walmart
Improve shopping experience to the trends, taste, and needs of consumer quickly
Hurricane preparations- Flashlights, pop-tarts (strawberry #1), sugar-breakfast snacks are the top sellers together.

Steve Jobs (Apple CEO) Extending Human Life ◦ Summary
Individual genome sequencing
approached $1000.00 in the US.
Usually, a single specific marker (weakness) is evaluated within a sample
of a persons generic code (small portion).
New marker, new sample of DNA, another $1000.00
◦ Particulars Iconic CEO of Apple
Diagnosed with pancreatic cancer in 2004
Liver transplant in 2009
One of the first persons to have his entire DNA sequenced and of his cancer tumor
Entire genetic code available to his doctors to specialize treatment options that was individualized for Mr. Jobs.
Performing analytics of the entire genetic code of the patient, not just a sample or specific marker.
◦ Outcomes & Lesson Learned Specified therapies mapped to genetic makeup can be effective treatment options. As the disease
changes and mutates, therapies can be tailored to combat the illness.
More research and a hot topic of next-gen of sequencing for bio-researchers is growing with the intent to understand personalized medicine and the promise for better treatments/outcomes.
Big Data is core to that genome sequencing and personalized medicine strategy
Using of the DNA information, Steve Jobs was able to extend life not 1 year, but probably several additional years

New York City ◦ Exploding Manhole Covers 2007-2008 ◦ Summary
Few hundred Iron-cast manhole covers exploded
into the air sometimes several stories high. They weigh 85-300 lbs.
Causing human danger to bodily injury or even potential fatalities
Property damage.
Con-Edison, public utility responsible for maintenance and periodic
inspection.
◦ Particulars Con-Ed turned to Columbia Statistician help to predict which manhole covers would be the most troublesome.
94,000 miles of cables in NYC, 51K in manhole covers, records went far back as Thomas Edison (1880s). One in 3 cables laid before 1930.
38 variants of identifiers of infrastructure commonly just refereed to Service Box (i.e. SB, S.B, S/BX, Serv/Box, etc.) as truly raw and incomplete data set
Data not friendly for a computerized algorithm.
◦ Outcomes & Lesson Learned Statistician used all the data N=all (abundance of data vs. sample/hypothesis)
Big data analysis was more interested in which manhole than why.
Once data cleansed and prepared used 106 predicative indicators of manhole disasters in big data algorithm
Condensed the top 10% problem manhole list using the strongest signals emitting from the data (age of cables/previous problems)
Used correlation versus causality methodology.

More (All) Data is Better (N=All)
Big Data is Messy | Not Exact
Correlation versus Causality
Datafication
Value
Implications

Big Data relies more and more on all the information (as reasonably feasible) ◦ More of the dataset can reveal more detail and provide a clearer perspective typically hidden from
just sampling ◦ Credit card companies are looking at anomalies within the entire transactional dataset for fraud and
abuse (near real-time / real time)
Technology and techniques allow for analyzing more data than just a small sample size
DNA sequencing – Google Flu Predictive models / trends
Information technology advances has unleashed the power to digitizing the big data analysis
Constant changing and tweaking the algorithm models to meet real world dynamics
Private entities and individuals can now have access to vast amounts of data for analysis
Democratization of data and information
Ever-increasing social media churning machine driven by human nature / sentiment - twitter feeds
Machine telemetric / M2M (data / log exhaust) from cellphones, web clicks, and sensor feeds

Using all Data (N=All) does create inexactness ◦ Moving from small data (SD) to big data creates more errors and messiness in the dataset that
is to be expected
◦ Historically, humanity has conquered the world we live in by measuring it (SD).
◦ Renaissance age of astronomy, mathematics and 19th century physics
culminated with a system of precise measurements for
capturing space, time, more for an international
standard (France 19th century).
◦ 1920’s discoveries of quantum mechanics shattered the dream of
◦ comprehensive and precise measurements held as the conventional wisdom.
◦ There is much randomness as we seek out the smallest components that make up matter.
Messiness in Data maybe a positive feature ◦ Trade reliance on a single source (i.e. sensor) for many input sources.
◦ Multiple source and frequency of data reading increases the dataset size for a more aggregated
accuracy even with introducing errors and inexactness.
◦ Big data transforms figures into something that is more probabilistic than precise.

Correlation ◦ Datasets are too big for simple cause and effect.
◦ Departure from past where experts using hypothesis driven by theories
–about how something works or some impending event.
◦ Quantifies the statistical relationship between two values. (if value A ∆, then likely value B ∆)
◦ Correlation is not certain, only probable.
◦ Allows for us to predict to a certain level of likelihood.
◦ Now by using N=ALL (data) we can leverage a data driven analysis –
Less Bias
More accurate
◦ Today’s technology and software/algorithms make correlation with big data possible.
“Predication based on correlation is at the heart of big data”

Is the process of tabulating and extracting data ◦ Organizing data for current use
◦ Potential of future exploitation
◦ Datafication is not digitization (but digital technology turbocharges use cases)
Data has primary and many secondary uses ◦ Data may not be seen as valuable at first glance
◦ By having a corpus of large amounts of data provides the opportunity insights and revelations to be discovered.
◦ Older information and data can turn into immediate benefits in later cycles
Touch sensitive floors Social graphing
Human Behavior / Meta data
Geo-Loco Data Textual Analysis / Kindle Books (Cultromics)
Datafication use cases

Reuse (search terms) ◦ Hitwise
◦ Bank of England
◦ AOL & Amazon
Recombinant (fusing)
◦ Supermarket –PoS Data and Social Media
Extensibility of Data ◦ Retail –Surveillance Cameras
Data Exhaust (clickstream data/machine logs)
◦ Voice recognition, spam filtering, language translation,
Data on Corporate Balance Sheets (near future probability)
◦ As Intangible asset = (book value – market value)
◦ Data-commodity selling, royalties, licensing intellectual property
◦ Abundance of Dark Data
Primary Use
Secondary Use

The Big Data players emerge ◦ Data (abundant) – Those that own the data
◦ Skills (scarce) – Consultants / data scientist / algorithmist / data engineer
◦ Creative-Vision Use/Ideas (gaining adoption)
Data Intermediaries insert themselves ◦ Data may prove to be the most important over the long term.
◦ Entities collect data from multiple sources and deliver innovation from it
◦ Examples: Hitwise, Inrix, Healthcare Care Institute
Risks with Big Data
◦ Surveillance state / individual privacy concerns
◦ Probability, penalizing and punishment
◦ Suspect models / continuously re-evaluate
◦ Over-confidence of big data use / recent history littered with failures Economic forecasts in 2007
New Coke
Soviet economic strength
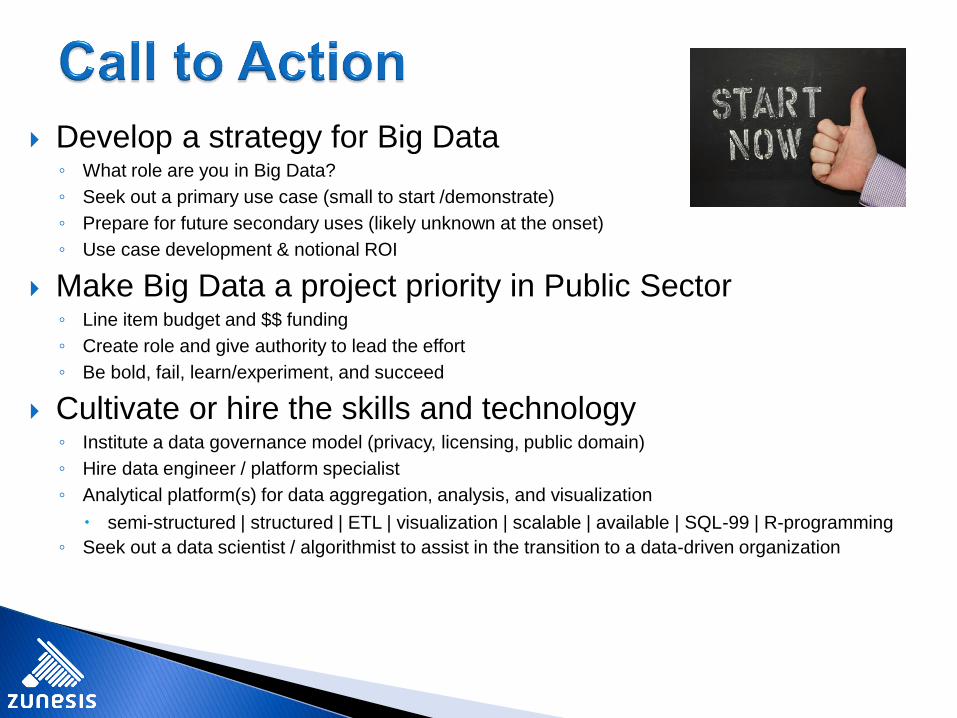
Develop a strategy for Big Data ◦ What role are you in Big Data?
◦ Seek out a primary use case (small to start /demonstrate)
◦ Prepare for future secondary uses (likely unknown at the onset)
◦ Use case development & notional ROI
Make Big Data a project priority in Public Sector ◦ Line item budget and $$ funding
◦ Create role and give authority to lead the effort
◦ Be bold, fail, learn/experiment, and succeed
Cultivate or hire the skills and technology ◦ Institute a data governance model (privacy, licensing, public domain)
◦ Hire data engineer / platform specialist
◦ Analytical platform(s) for data aggregation, analysis, and visualization
semi-structured | structured | ETL | visualization | scalable | available | SQL-99 | R-programming
◦ Seek out a data scientist / algorithmist to assist in the transition to a data-driven organization