Big Data and Advanced Analytics: Are You Behind … · Big Data and Advanced Analytics: Are You...
56
Big Data and Advanced Analytics: Are You Behind the Competition? Chris Stehno Priyanka Srivastava Nov 5, 2014
Transcript of Big Data and Advanced Analytics: Are You Behind … · Big Data and Advanced Analytics: Are You...

Big Data and Advanced Analytics: Are You Behind the Competition?
Chris Stehno
Priyanka Srivastava
Nov 5, 2014

- 2 -
Which of these handsome gentlemen exhibit the best health risks?
Questioning our Traditional Detection of Morbidity/Mortality Risks

3
Big Data on Consumers: what kind of information is available?
Third party companies, aggregate data from a variety of sources to create robust data profiles of consumers
Data is being collected on a daily basis through regular actions such as using a credit card, magazine
subscriptions, prescription drug history, lifestyle habits
Reads two e-books per month
Subscribes to multiple health
magazines
Attends yoga class twice a week
Frequently purchases fruits and
vegetables from grocery store
Collects collectible plates
Likes country music
Listens to books on tape
Subscribes to Diabetes Monthly
magazine
Frequently purchases discounted gift
certificates for fast food from deal-of-
the-day websites
Orders plus-size clothing
Gambles at casinos
Reads about astrology
Owns a video game system
Jane Joe
4
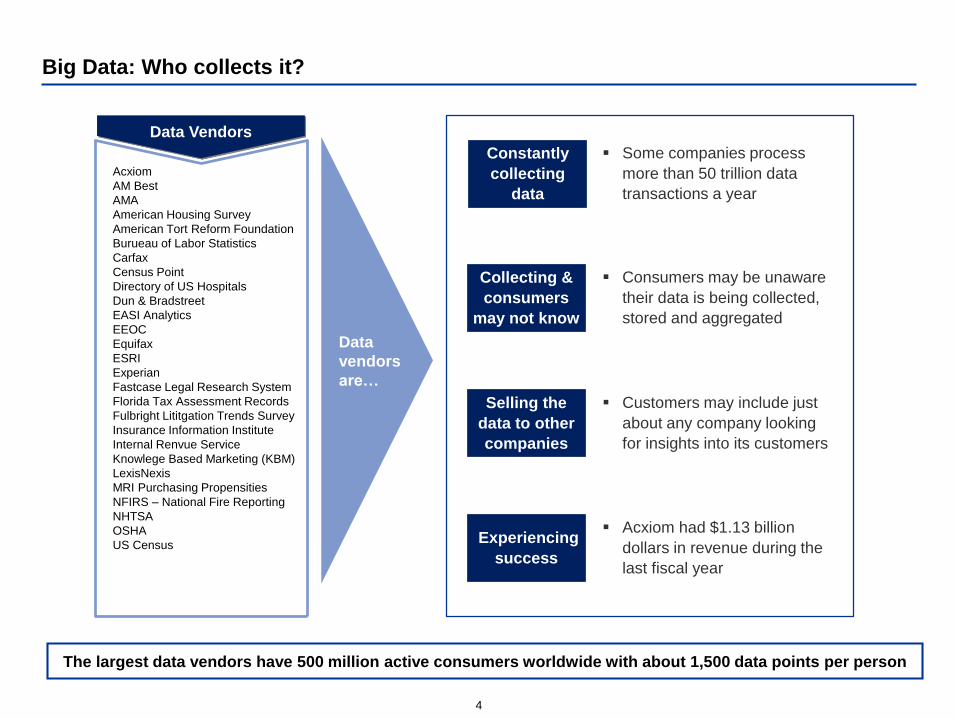
Big Data: Who collects it?
Data Vendors
Acxiom
AM Best
AMA
American Housing Survey
American Tort Reform Foundation
Burueau of Labor Statistics
Carfax
Census Point
Directory of US Hospitals
Dun & Bradstreet
EASI Analytics
EEOC
Equifax
ESRI
Experian
Fastcase Legal Research System
Florida Tax Assessment Records
Fulbright Lititgation Trends Survey
Insurance Information Institute
Internal Renvue Service
Knowlege Based Marketing (KBM)
LexisNexis
MRI Purchasing Propensities
NFIRS – National Fire Reporting
NHTSA
OSHA
US Census
Constantly
collecting
data
Collecting &
consumers
may not know
Selling the
data to other
companies
Experiencing
success
Consumers may be unaware
their data is being collected,
stored and aggregated
Customers may include just
about any company looking
for insights into its customers
Acxiom had $1.13 billion
dollars in revenue during the
last fiscal year
Some companies process
more than 50 trillion data
transactions a year
Data
vendors
are…
The largest data vendors have 500 million active consumers worldwide with about 1,500 data points per person

5
Data Compliance: Impacts of the Fair Credit Reporting Act (FCRA)
Impacts
Places limits on how data can be shared- Consumer reporting agencies may not share data with a party that
lacks permissible purpose
Disclose credit file upon request- Credit reporting agencies must provide the consumer their credit report upon
request and proper identification
Challenge disputed information- Consumers may challenge what they believe to be inaccurate information, and
the credit reporting agency must investigate
Delete outdated information – Negative information that is more than 7 years old must be removed from the
consumers file
Motor Vehicle Report
Medical Information Bureau
Rx drug database
Credit score
FCRA Compliant Data
Transactional data
Census data
Event registration data
Big Data
FCRA non – Compliant Data
FCRA and is subsequent amendments promote the accuracy, fairness and privacy of information in the files of consumer
reporting agencies.

6
How predictive analytics is being used today

7 WB
S11111-P
rez-D
ate
How Analytics is used in other industries
Retail
Retailers utilize predictive analytics to predict life events and send its customers customized
marketing
Analyze consumer buying behavior to inform direct marketing, in-store promotions, cross-selling
Market basket analysis and in-store analytics
Technology
Video streaming website used analytics to determine what actor, director and plot should be
utilized to improve the chances of creating a popular television show (the company accomplished
this goal)
Dating websites analyze stated preferences, behavioral patterns on their website, and
triangulation methods to find compatible matches
Companies like Amazon and Netflix use historical preferences and buying patterns to make
personalized product recommendations to their customers
Banking
Cross-sell and up-sell financial services to maximize Customer Lifetime Value
Identify fraudulent customers and transactions using neural networks, heuristic models and
business rules
Predict risk of delinquency and guide an integrated approach to collections and recoveries
8 WB
S11111-P
rez-D
ate
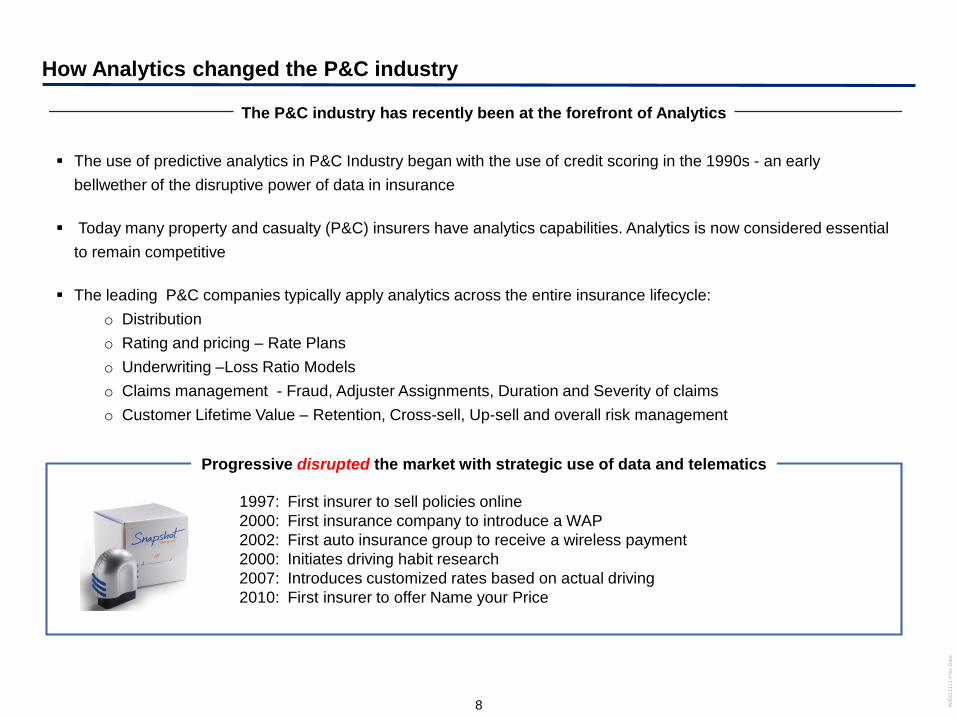
How Analytics changed the P&C industry
The use of predictive analytics in P&C Industry began with the use of credit scoring in the 1990s - an early
bellwether of the disruptive power of data in insurance
Today many property and casualty (P&C) insurers have analytics capabilities. Analytics is now considered essential
to remain competitive
The leading P&C companies typically apply analytics across the entire insurance lifecycle:
o Distribution
o Rating and pricing – Rate Plans
o Underwriting –Loss Ratio Models
o Claims management - Fraud, Adjuster Assignments, Duration and Severity of claims
o Customer Lifetime Value – Retention, Cross-sell, Up-sell and overall risk management
1997: First insurer to sell policies online
2000: First insurance company to introduce a WAP
2002: First auto insurance group to receive a wireless payment
2000: Initiates driving habit research
2007: Introduces customized rates based on actual driving
2010: First insurer to offer Name your Price
The P&C industry has recently been at the forefront of Analytics
Progressive disrupted the market with strategic use of data and telematics

9 WB
S11111-P
rez-D
ate
Today there is increased awareness around analytics
IBM recently reported that nearly three-quarters of
insurance companies believe that big data and analytics will
give them a competitive edge1
The Chartered Institute of Loss Adjusters showed that 82%
of industry professionals believe that organizations which do
not utilize big data will become uncompetitive2
1 http://www-935.ibm.com/services/us/gbs/thoughtleadership/big-data/insurance/
2 http://www.computerweekly.com/feature/Ordnance-Survey--insurance-industry-can-harness-big-data-analytics
Farsighted leaders in a variety of domains are increasingly
aware of the competitive and operational advantages that
analytics can bring

Can analytics be used in the health insurance, life insurance and
retirement industries?
11 WB
S11111-P
rez-D
ate
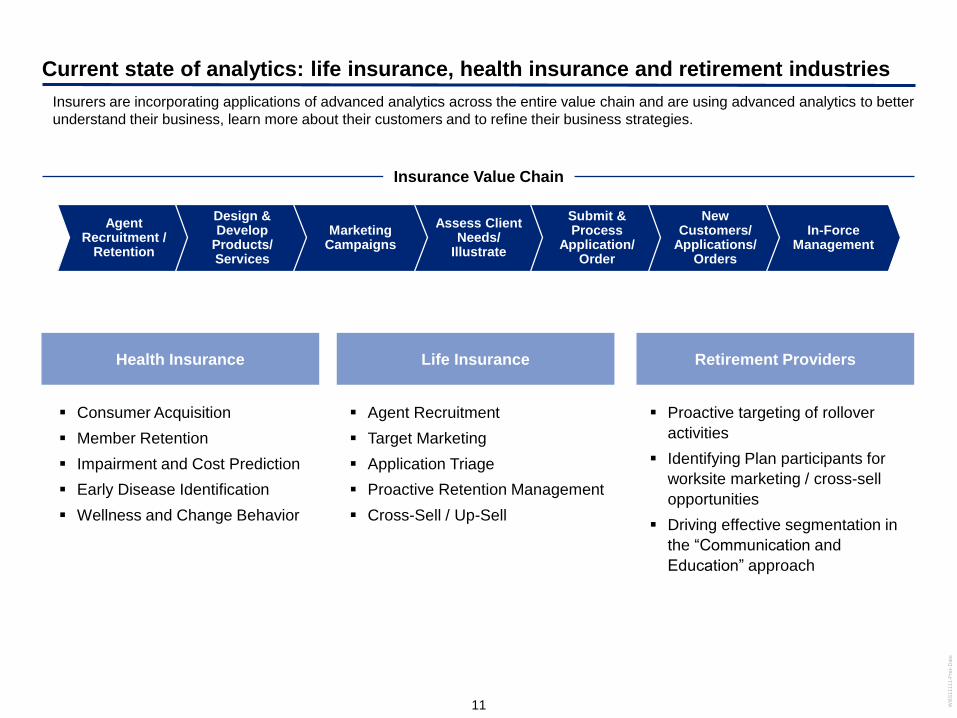
Current state of analytics: life insurance, health insurance and retirement industries
Consumer Acquisition
Member Retention
Impairment and Cost Prediction
Early Disease Identification
Wellness and Change Behavior
Proactive targeting of rollover
activities
Identifying Plan participants for
worksite marketing / cross-sell
opportunities
Driving effective segmentation in
the “Communication and
Education” approach
Agent Recruitment
Target Marketing
Application Triage
Proactive Retention Management
Cross-Sell / Up-Sell
Life InsuranceHealth Insurance Retirement Providers
Insurance Value Chain
Assess Client Needs/
Illustrate
Submit & Process
Application/Order
New Customers/
Applications/ Orders
In-ForceManagement
Agent Recruitment /
Retention
Design & Develop
Products/Services
Marketing Campaigns
Insurers are incorporating applications of advanced analytics across the entire value chain and are using advanced analytics to better
understand their business, learn more about their customers and to refine their business strategies.

Current applications in the health insurance industry
13 WB
S11111-P
rez-D
ate
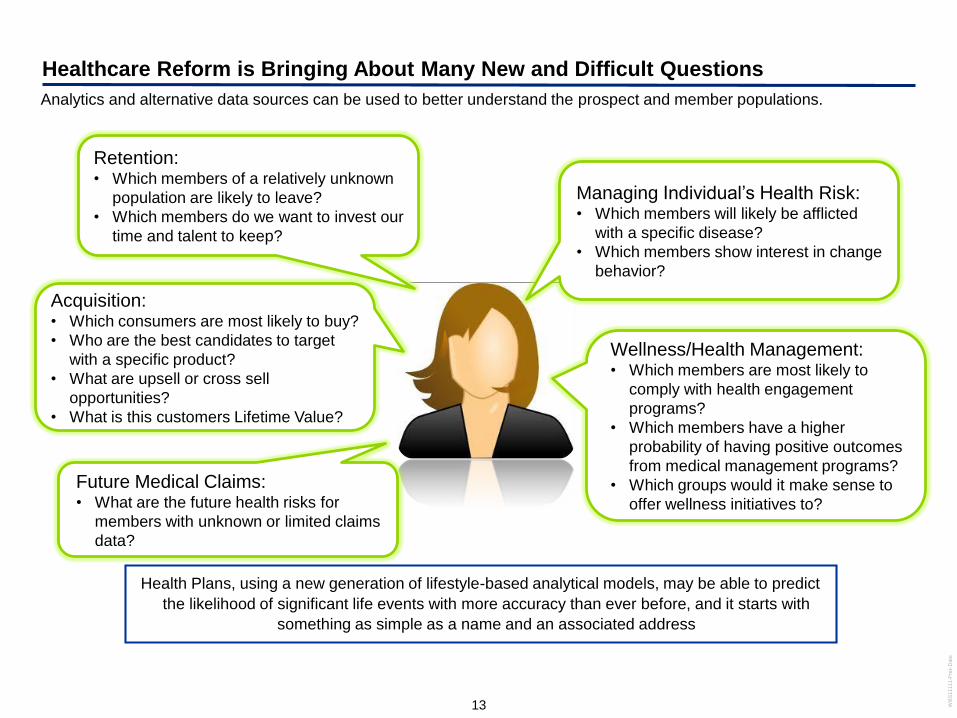
Healthcare Reform is Bringing About Many New and Difficult Questions
Analytics and alternative data sources can be used to better understand the prospect and member populations.
Managing Individual’s Health Risk:• Which members will likely be afflicted
with a specific disease?
• Which members show interest in change
behavior?
Health Plans, using a new generation of lifestyle-based analytical models, may be able to predict
the likelihood of significant life events with more accuracy than ever before, and it starts with
something as simple as a name and an associated address
Retention:• Which members of a relatively unknown
population are likely to leave?
• Which members do we want to invest our
time and talent to keep?
Wellness/Health Management:• Which members are most likely to
comply with health engagement
programs?
• Which members have a higher
probability of having positive outcomes
from medical management programs?
• Which groups would it make sense to
offer wellness initiatives to?
Acquisition:• Which consumers are most likely to buy?
• Who are the best candidates to target
with a specific product?
• What are upsell or cross sell
opportunities?
• What is this customers Lifetime Value?
Future Medical Claims:• What are the future health risks for
members with unknown or limited claims
data?

14 WB
S11111-P
rez-D
ate
Healt
h S
takeh
old
er
& T
ech
no
log
y E
co
syste
m
15 WB
S11111-P
rez-D
ate
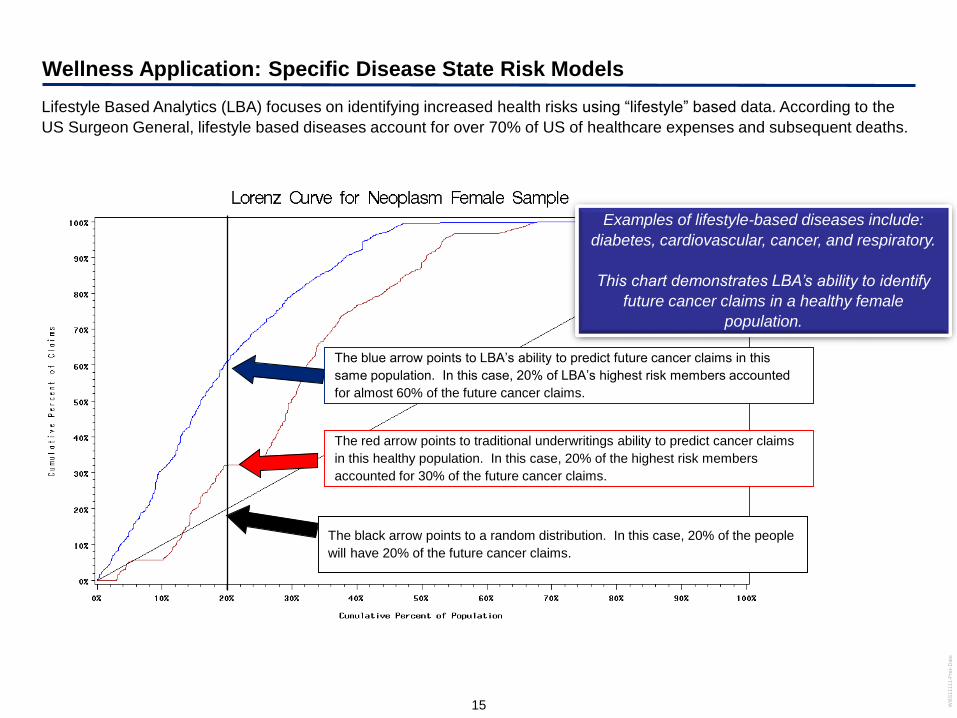
Wellness Application: Specific Disease State Risk Models
Lifestyle Based Analytics (LBA) focuses on identifying increased health risks using “lifestyle” based data. According to the
US Surgeon General, lifestyle based diseases account for over 70% of US of healthcare expenses and subsequent deaths.
The black arrow points to a random distribution. In this case, 20% of the people
will have 20% of the future cancer claims.
The red arrow points to traditional underwritings ability to predict cancer claims
in this healthy population. In this case, 20% of the highest risk members
accounted for 30% of the future cancer claims.
The blue arrow points to LBA’s ability to predict future cancer claims in this
same population. In this case, 20% of LBA’s highest risk members accounted
for almost 60% of the future cancer claims.
Examples of lifestyle-based diseases include:
diabetes, cardiovascular, cancer, and respiratory.
This chart demonstrates LBA’s ability to identify
future cancer claims in a healthy female
population.
16 WB
S11111-P
rez-D
ate
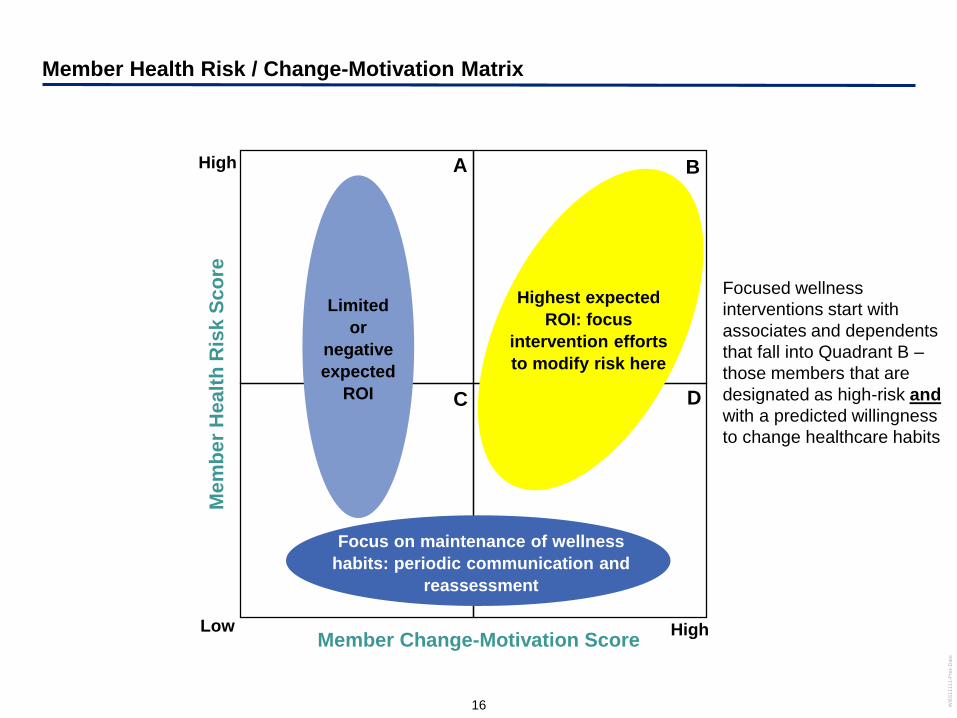
Member Health Risk / Change-Motivation Matrix
Me
mb
er
Hea
lth
Ris
k S
co
re
Member Change-Motivation Score
High
Low High
A B
C D
Limited
or
negative
expected
ROI
Highest expected
ROI: focus
intervention efforts
to modify risk here
Focus on maintenance of wellness
habits: periodic communication and
reassessment
Focused wellness
interventions start with
associates and dependents
that fall into Quadrant B –
those members that are
designated as high-risk and
with a predicted willingness
to change healthcare habits

17 WB
S11111-P
rez-D
ate
-50%
0%
50%
100%
150%
200%
250%
300%
350%
Over 200% more likely to
exhibit positive behavior
Likely to Engage Now
Example of Timing Results for Engagement
Historically attempts to focus on timing have been limited to single life events such as marriage or birth of a new child.
Although these life events do increase the likelihood, they are often over marketed to events and your message can easily
get lost in the others. However, using advanced statistical techniques like CART analysis we can find 100’s of points where
propensities to engage are heightened.
Example A Timing Lift Curve

18 WB
S11111-P
rez-D
ate
Undiagnosed Conditions Represent Billions in Lost Reimbursement
We have the ability to display modeling results in graphic, front-end tools that allow users to select different dimensions for
additional analyses. The exhibit below depicts member risk levels for Cardiovascular Disease for a sample of individuals in
the greater New Jersey area.
MEMBERS

Current applications of analytics in the life insurance industry

20 WB
S11111-P
rez-D
ate
Current scenario in the life insurance industry
A variety of point solutions designed to improve a particular function by utilizing “big data” are being implemented in the
industry today.

21 WB
S11111-P
rez-D
ate
Example: Application Triage
An Application Triage algorithm is used during the new business process after an application is submitted to assist the
underwriter in triaging applications. The underwriter incorporates the algorithm output into its underwriting process. The
output from the algorithm may enable the underwriter to waive medical requirements for certain applications, leading to
faster time-to-issue and reduced underwriting requirements and costs for those policies.
Insurer‘s
Underwriting
Rules
“Full Medical
Underwriting” Required
• Medical tests
required
• Policy issued in 30-
60 days
Expedited Issue in
Preferred Class
• Medical tests not
required
• Policy issue within
hours or days
Algorithm
Algorithm Output
1. Score
2. Reason Code
The result of a predictive
algorithm is one additional
data element considered by
the underwriter
Enables identification of
certain applications which are
likely to be issued at preferred
underwriting classes; allows
underwriter to consider
waiving certain medial tests for
those cases
For a portion of applicants,
time to issue and overall
underwriting costs are
dramatically reduced
Attracts additional new
business from producers who
wish to realize the benefits of
an expedited issue process for
cases which qualify for
preferred underwriting classes
Key Outcomes
Traditional
External Data
Non-Traditional
Advisor Data
Internal Data
Application Data
Algorithm Input

22 WB
S11111-P
rez-D
ate
Application Triage: Key Considerations
Algorithm Development
The objective of the algorithm alone is to independently replicate the underwriting decision on risk class. The intended
use of the algorithm output is to provide the underwriter with additional data to consider in assigning the risk class.
Incremental Data Requirements:
In addition to external third party data, this solution uses application data provided to the insurance company
Technical and Business Implementation Considerations
Due to the objective of the algorithm and large quantity of data inputs used by this application, the technical and
business implementation initiatives and associated considerations are typically relatively high for this application of
predictive analytics.
Agent Production
Agent Tenure
Commission structure
Total household premium
placed with company
Name / Address / Age / Gender
Face Amount
Adverse medical history
Adverse family heath history
Tele-interview results
Advisor DataApplication Data
Disease State Models
Occupation and Net Worth
Type of vehicle owned
Housing
Hobbies
Exercise habits
Non-TraditionalTraditional
Note the specific data fields listed here are illustrative.
Internal DataExternal Data
MIB (# of codes, unique codes
– some positive and some
negative factors)
Motor Vehicle Record [MVR]
(categorized by severity)
Prescription Drug History

23 WB
S11111-P
rez-D
ate
Risk-Based Marketing
Predictive analytics is applied to an inforce block of business to identify potential target customers who are both (a) likely
to buy an additional product and (b) likely to qualify for the product given the company’s underwriting requirements.
Customized sales tactics are employed on the segmented population.
Significantly more effective
than traditional lead generation
tactics for life insurance;
Enables cross-sell efforts to be
targeted at those most likely to
meet underwriting
requirements
Enables full inforce
segmentation, against which
to more effectively apply
sales/marketing efforts
Produces product/policyholder
specific recommendation
based on policyholders with
similar characteristics
Produces customized
estimates for likelihood to
qualify and likelihood to buy
Key Outcomes
Likely to Buy’ Score
Not likely to
BuyLikely to Buy
‘Likely
to
Qualify’
Score
Likely
to
Qualify
Consider
marketing
efforts for
other
products
Deploy
highly
focused
sales effort
Not
Likely
to
Qualify
Do not
target these
individuals
for new
sales
Consider
moderated
marketing
efforts
‘Likely to
Buy’
Algorithm
‘Likely to
Qualify’
Algorithm
Traditional
External Data
Non-Traditional
Internal Data
Policy Data
Algorithm Input
24 WB
S11111-P
rez-D
ate
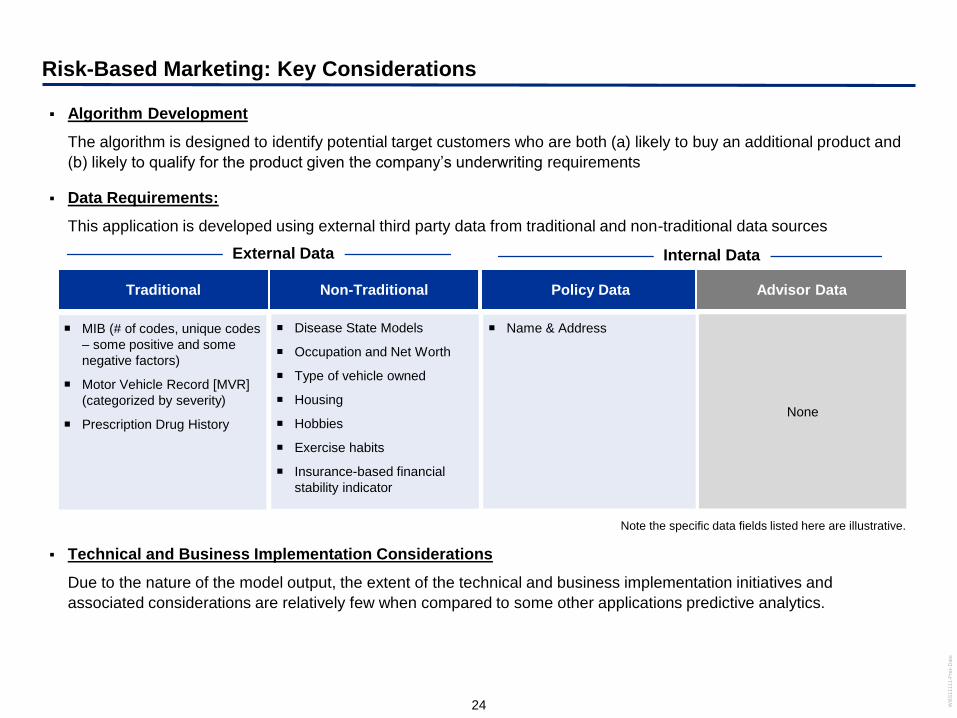
Risk-Based Marketing: Key Considerations
Technical and Business Implementation Considerations
Due to the nature of the model output, the extent of the technical and business implementation initiatives and
associated considerations are relatively few when compared to some other applications predictive analytics.
Algorithm Development
The algorithm is designed to identify potential target customers who are both (a) likely to buy an additional product and
(b) likely to qualify for the product given the company’s underwriting requirements
Data Requirements:
This application is developed using external third party data from traditional and non-traditional data sources
None
Name & Address
Advisor DataPolicy Data
Disease State Models
Occupation and Net Worth
Type of vehicle owned
Housing
Hobbies
Exercise habits
Insurance-based financial
stability indicator
Non-TraditionalTraditional
Note the specific data fields listed here are illustrative.
Internal DataExternal Data
MIB (# of codes, unique codes
– some positive and some
negative factors)
Motor Vehicle Record [MVR]
(categorized by severity)
Prescription Drug History

Current applications in the retirement industry

26 WB
S11111-P
rez-D
ate
Example: Driving More Proactive and Effective Targeting of Rollover Opportunities
Pressure to Target More Rollovers
to Increase Retention of Assets
Identification and modeling of the
key variables that help signal a
rollover out of the plan
Revenue opportunities and
efficiencies from more proactive,
timely identification of potential
value
Provider Challenge Role of Predictive Analytics Business Value / Outcomes
Traditional
External Data
Non Traditional
Internal Data
Policy Data
Algorithm Input Analysis Output
Illustration
Likely to Rollover Score
Likely to
Rollover
Unlikely to
Lapse
Send out
communication
Take no
action
Analytics to
find key
indicators and
potential
buyers

27 WB
S11111-P
rez-D
ate
Example: Driving Effective Segmentation in the Communication and Education
Approach
Algorithm Input
Analytics to find
correlations
between campaign
type, delivery
channel and
success
Analysis Output
Plan Sponsor Demand for Improved
Plan and Participant Outcomes
Correlations between various
Communication and Education
tactics and delivery channels to
driving lift in plan participation
More targeted, effective
Communication and Education
strategies driving Increased Plan
effectiveness, greater satisfaction
and increased revenue
Provider Challenge Role of Predictive Analytics Business Value / Outcomes
Illustration
Group Participants
Group A Group B
Prefers electronic
information in small
pieces
Prefers mailings
with thorough
descriptions
Traditional
External Data
Non Traditional
Internal Data
Policy Data
28 years old
Reads e-
books
Owns a tablet
65 years old
Book club
member
Collects stamps
Sam Meredith

Imagine the Future
29 WB
S11111-P
rez-D
ate
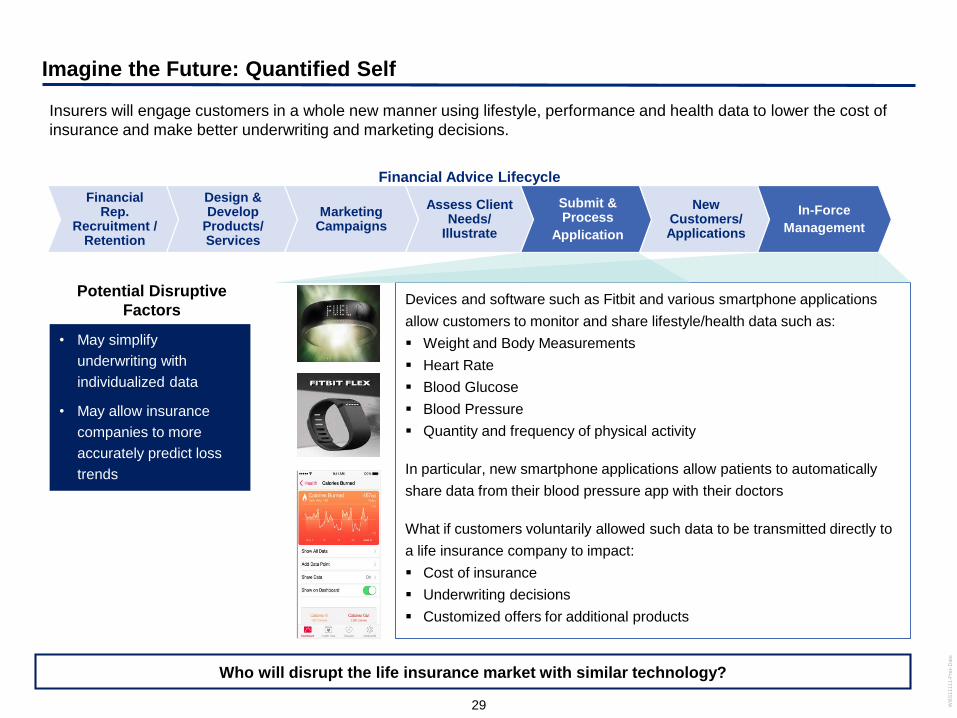
Imagine the Future: Quantified Self
Insurers will engage customers in a whole new manner using lifestyle, performance and health data to lower the cost of
insurance and make better underwriting and marketing decisions.
Devices and software such as Fitbit and various smartphone applications
allow customers to monitor and share lifestyle/health data such as:
Weight and Body Measurements
Heart Rate
Blood Glucose
Blood Pressure
Quantity and frequency of physical activity
In particular, new smartphone applications allow patients to automatically
share data from their blood pressure app with their doctors
What if customers voluntarily allowed such data to be transmitted directly to
a life insurance company to impact:
Cost of insurance
Underwriting decisions
Customized offers for additional products
• May simplify
underwriting with
individualized data
• May allow insurance
companies to more
accurately predict loss
trends
Financial Advice Lifecycle
Assess Client Needs/
Illustrate
Submit & Process
Application
New Customers/ Applications
In-Force
Management
Financial Rep.
Recruitment / Retention
Design & Develop
Products/Services
Marketing Campaigns
Who will disrupt the life insurance market with similar technology?
Potential Disruptive
Factors
30 WB
S11111-P
rez-D
ate
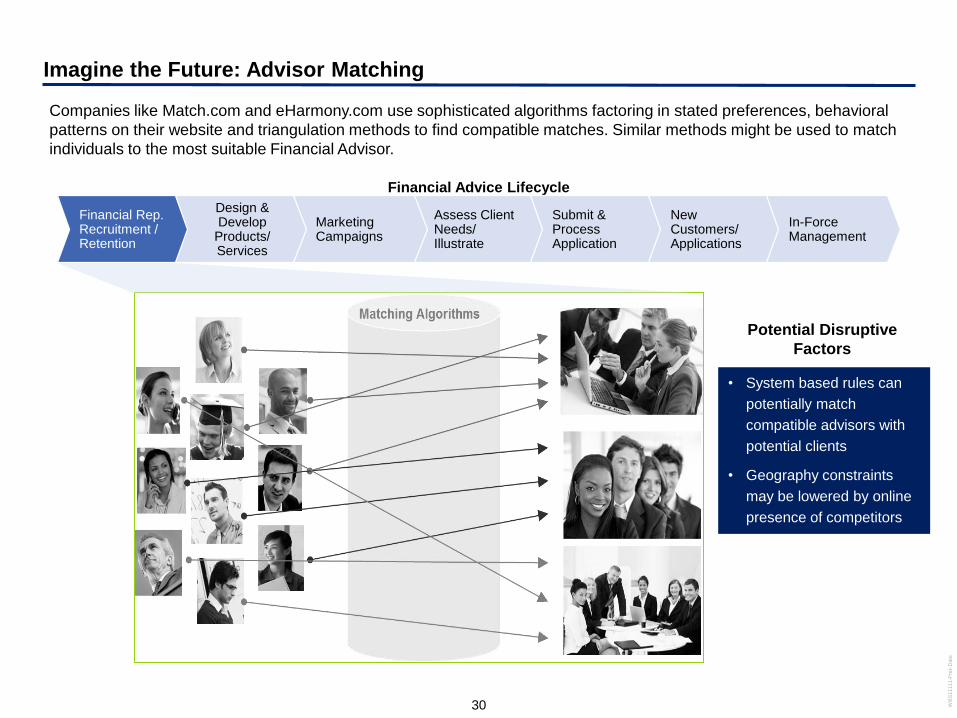
Imagine the Future: Advisor Matching
• System based rules can
potentially match
compatible advisors with
potential clients
• Geography constraints
may be lowered by online
presence of competitors
Financial Advice Lifecycle
Assess Client Needs/ Illustrate
Submit & ProcessApplication
New Customers/ Applications
In-ForceManagement
Financial Rep. Recruitment / Retention
Design & Develop
Products/Services
Marketing Campaigns
Companies like Match.com and eHarmony.com use sophisticated algorithms factoring in stated preferences, behavioral
patterns on their website and triangulation methods to find compatible matches. Similar methods might be used to match
individuals to the most suitable Financial Advisor.
Potential Disruptive
Factors
31
Additional resources on Big Data
Big Data: Who Collects Consumer
Data and Why?
Why “Big Data” Is a Big
Deal
Mapping, and Sharing the Consumer
Genome
How ‘Big Data’ Is
Different

32
Priyanka Srivastava
Manager
Deloitte Consulting LLP
25 Broadway
New York, NY 10004
USA
212-618- 4081 Office
347-324-6714 Mobile
www.deloitte.com
Chris Stehno
Director
Deloitte Consulting LLP
111 S. Wacker
Chicago, IL 60606
USA
312-486-4421 Office
313-486-1469 Fax
312-206-4024 Mobile
www.deloitte.com
Deloitte refers to one or more of Deloitte Touche Tohmatsu Limited, a UK private company limited by guarantee, and its network of member firms, each of which is a legally separate and independent entity. Please see www.deloitte.com/about for a detailed description of the legal structure of Deloitte Touche Tohmatsu Limited and its member firms. Please see www.deloitte.com/us/about for a detailed description of the legal structure of Deloitte LLP and its subsidiaries.
This presentation contains general information only and Deloitte is not, by means of this presentation, rendering accounting, business, financial, investment, legal, tax, or other professional advice or services. This presentation is not a substitute for such professional advice or services, nor should it be used as a basis for any decision or action that may affect your business. Before making any decision or taking any action that may affect your business, you should consult a qualified professional advisor. Deloitte shall not be responsible for any loss sustained by any person who relies on this presentation.
Copyright © 2014 Deloitte Consulting LLP. All rights reserved

Big Data and Advanced Analytics: Are
You Behind the Competition?David Moore, FSA, MAAA
November 5, 2014
Why is “Big Data” important to the
insurance industry?

• There is no consensus in the marketplace as to how to define “big data”
• Big Data exceeds the capability of commonly used hardware environments and software
tools to capture, manage, and process it within a tolerable elapsed time for its user
population
• 4 V’s of Big Data
– Volume
– Variety
– Velocity
– Veracity
Sources: “Taming the Big Data Tidal Wave”, Bill Franks, 2012
36
Defining “Big Data”
November 5th, 2014

• 1774 – Richard Price ran the first experience study for the ‘Society for Equitable
Assurances on Lives and Survivorship’
37
A Brief History of Big Data and Analytics in Insurance
November 5th, 2014

• 1774 – Richard Price ran the first experience study for the ‘Society for Equitable
Assurances on Lives and Survivorship’
• 1990’s – P&C insurers adopt credit score in pricing personal lines
• 2000’s – P&C models incorporate additional data sources to segment risks in personal
and commercial lines
• 2010’s – Use of telematics becomes prevalent in P&C
– According to 2013 survey by Earnix, 82% of P&C companies use predictive
modeling; only 17% of large P&C companies and 7% of small companies are
currently using Big Data
– Life Insurance companies are behind, but looking to catch up
– In a 2012 SoA survey of Life Insurance companies, upwards of 40% of
respondents indicated they were currently using or considering using predictive
modeling to enhance sales and marketing practices or strategies
A Very Brief History of Big Data and Analytics in Insurance
38
Sources: “2013 Insurance Predictive Modeling Survey”, Earnix Inc. and Insurance Services Office, Inc , 2013
“Report of the Society of Actuaries Predictive Modeling Survey Subcommittee”, Society of Actuaries, 2012
November 5th, 2014

• Predictive Modeling has developed in the wake of the success in P&C insurance, looking
to additional data sources to help do a better job selecting risks as well as understand
customer behavior
• In 2000’s, the introduction of automated underwriting engines enable the use of the
increasing number of data sources and helped expedite the underwriting process
• The initial pilot projects in Predictive Modeling leveraged these ‘rules engines’ but added
on a ‘predictive’ score based on a GLM developed from data not traditionally used in Life
Insurance
• In 2010, the SoA awarded prizes for a call for papers on the topic “Predictive Modeling for
Life Insurers”
• Today, there is increased awareness and numerous articles being published, but the
discipline is still maturing
39
Adoption of Predictive Modeling in Life & Annuity
November 5th, 2014
Advanced analytics for life and
annuities

• Sales and Marketing
– Customer response modeling –
propensity to buy or renew
– Agent recruiting
• Pricing / Product Development
– Price optimization
• Risk Selection / Scoring
– Predictive underwriting
– UW triage
– Risk segmentation
• Experience Analysis
– True multivariate approach
– Efficient use of data
41
Predictive analytics across the insurance lifecycle
November 5th, 2014
• In-force Policy Management
– Customer retention / lifetime value
models
– Reserving
• Claims Management
– Improve fraud detection
– Improve exposure analysis
• Financial Forecasting

42
Predictive modeling techniques used in insurance
November 5th, 2014
Supervised Learning
(The target is known)
Unsupervised Learning
(The target is unknown)
Parametric
(Statistical)
• Linear Regression
• Time Series
• Generalized Linear Models
• Hazard Models
• Mixed Effect Models
•Cluster Analysis
(i.e. K-means)
•Principal Components
Analysis
Non-parametric • Neural Networks
• CART (Classification and
Regression Trees)
• Random Forests
• MARS (Multivariate Adaptive
Regression Splines)
•Neural Networks

43
GLMs have become the most common tool for model development in life
insurance as a result of their ability to accommodate forms other than normal,
and for being relatively easy to explain
Common GLM Applications
Technique Link Function Distribution Application
Classical Regression (Ordinary Least Squares)
Identity: g(µ)=µ Normal General Scoring Models
Logistical Regression Logit: g(µ)= log[µ/(1-µ)] Binomial Binary Target Applications(i.e. Retention)
Frequency Modeling Log: g(µ)=log(µ) PoissonNegative Binomial
Count Target VariableFrequency Modelnig
Severity Modeling Inverse: g(µ)=(-1/µ) Gamma Size of claim modeling
Severity Modeling Inverse Squared: g(µ)=(-1/µ^2))
Inverse Gaussian Size of claim modeling
Generalized linear models
November 5th, 2014
44
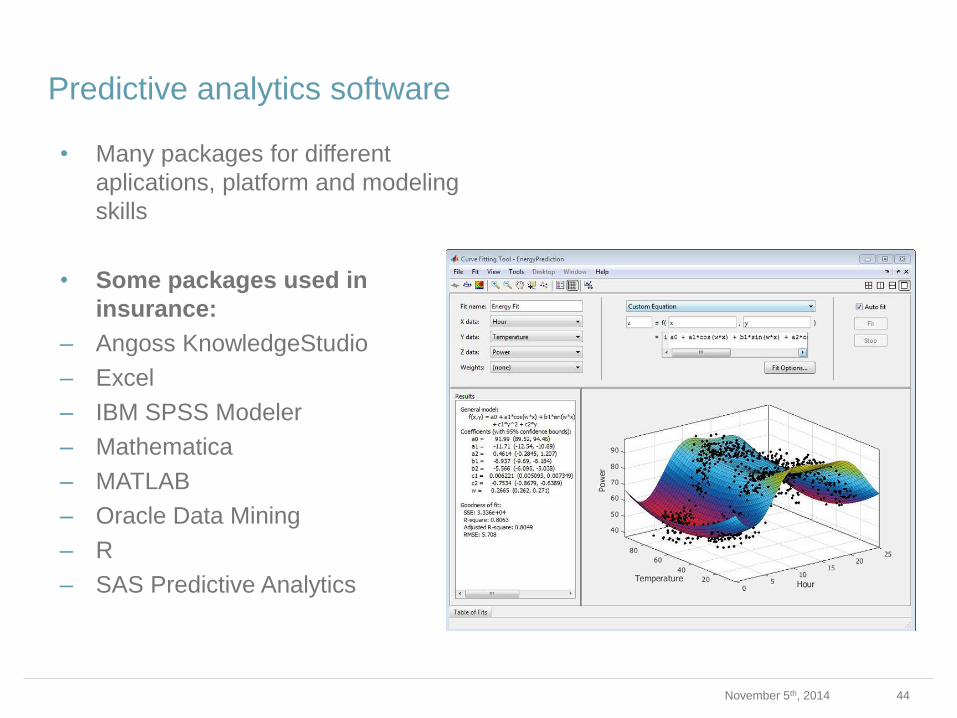
Predictive analytics software
• Many packages for different
aplications, platform and modeling
skills
• Some packages used in
insurance:
– Angoss KnowledgeStudio
– Excel
– IBM SPSS Modeler
– Mathematica
– MATLAB
– Oracle Data Mining
– R
– SAS Predictive Analytics
November 5th, 2014

Predictive modeling development and validation
Train Data • Algorithm development is an iterative process – “train data” is run
through numerous modeling techniques and potentially hundreds of
algorithms to determine the optimal model
Test Data • This dataset is an unbiased sample to help select the best predictive
model
Validation Data • This represents a hold out sample which is not used to either develop or
test the model. Once the final model is selected, this data is used to
validate the results on a blind sample and to confirm that there is no over
fitting
• When developing a model, it is important to use an accepted validation methodology to
evaluate the model. This improves the likelihood the model will produce accurate
feedback going forward
Train~30%
Test~30%
Validation~40%
Modeling DataIterative model building
Model
Implementation
Model
Validation
Ongoing
Performance
Monitoring
45November 5th, 2014
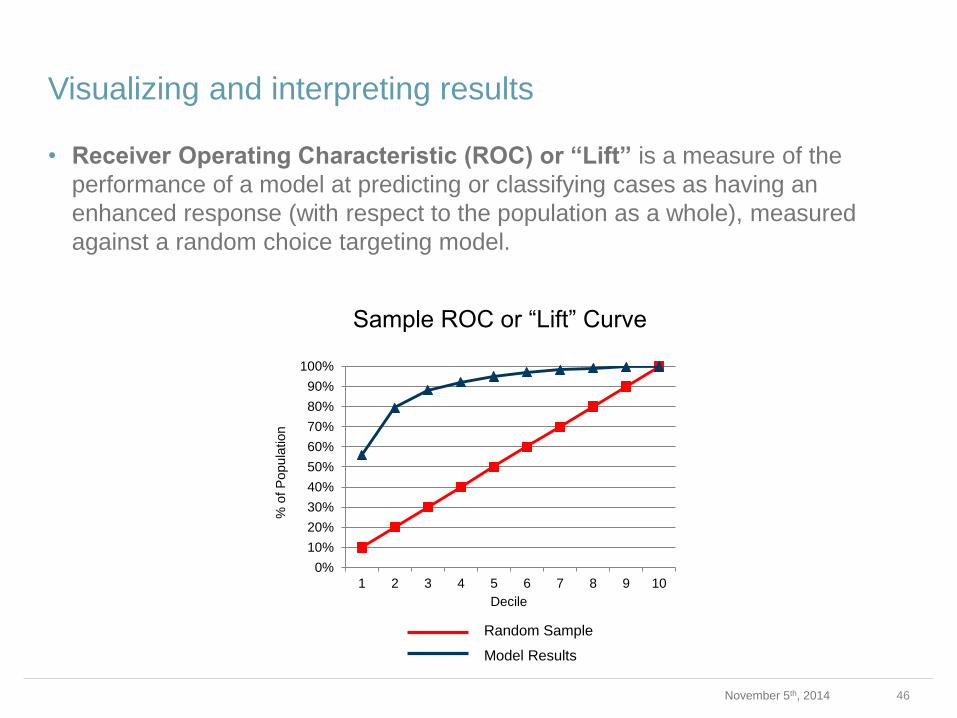
• Receiver Operating Characteristic (ROC) or “Lift” is a measure of the
performance of a model at predicting or classifying cases as having an
enhanced response (with respect to the population as a whole), measured
against a random choice targeting model.
46
Sample ROC or “Lift” Curve
0%
10%
20%
30%
40%
50%
60%
70%
80%
90%
100%
1 2 3 4 5 6 7 8 9 10
Decile
% o
f P
opula
tion
Random Sample
Model Results
Visualizing and interpreting results
November 5th, 2014
The future of “Big Data” in
insurance

• More Data
– More brokers of structured data
– Increased ability to capture and use unstructured data
• Geospatial
• Clickstream
• Social Media
• More tools
– Today companies are embracing R and SAS to develop predictive models
– Enterprise Data Warehouses need to grow and adapt to new data sources and
technology
– Simulation software is growing in use
– Companies need to have proficiency in MapReduce programs
– Tomorrow’s Big Data software solution has not been designed yet
48
How will Big Data change the industry?
November 5th, 2014

• What is the net worth of an individual customer?
Their lifetime value? Their propensity to buy?
49
How do you view the value of a customer?
November 5th, 2014
• Instead, what if business decisions are based on
the “value” of individual’s network?

Future applications may not be bound by the traditional limits of life insurance and annuity
products, and disruptions may occur from outside the industry.
Life Insurance
Policy Issued
Predictive
Model
Determines
UW class
Application
completed
The future of Life Insurance Products?
November 5th, 2014 50
Future applications may not be bound by the traditional limits of life insurance and annuity
products, and disruptions may occur from outside the industry.
Life Insurance
Policy Issued
Health /Lifestyle
feedback
Provided to p/h
Predictive Model
run annually on
all policies
Policyholder
Chooses to
incorporate
feedback
Premium Adjusted
/ Lapse Decision
Policyholder
incentive to
reduce risk
Reduce tail risk with
adjustable premium
Identify lifestyle
based risks after
policy underwritten
and issued
Predictive
Model
Determines
UW class
Application
completed
Integrate
with Health/LTC
coverageInput to
Pricing other Lines
of Business
Social Media
Data Geospatial
Data
Positive
feedback/coaching
included in contract
Disruption From
Non-Traditional
Insurance
Providers
The future of Life Insurance Products?
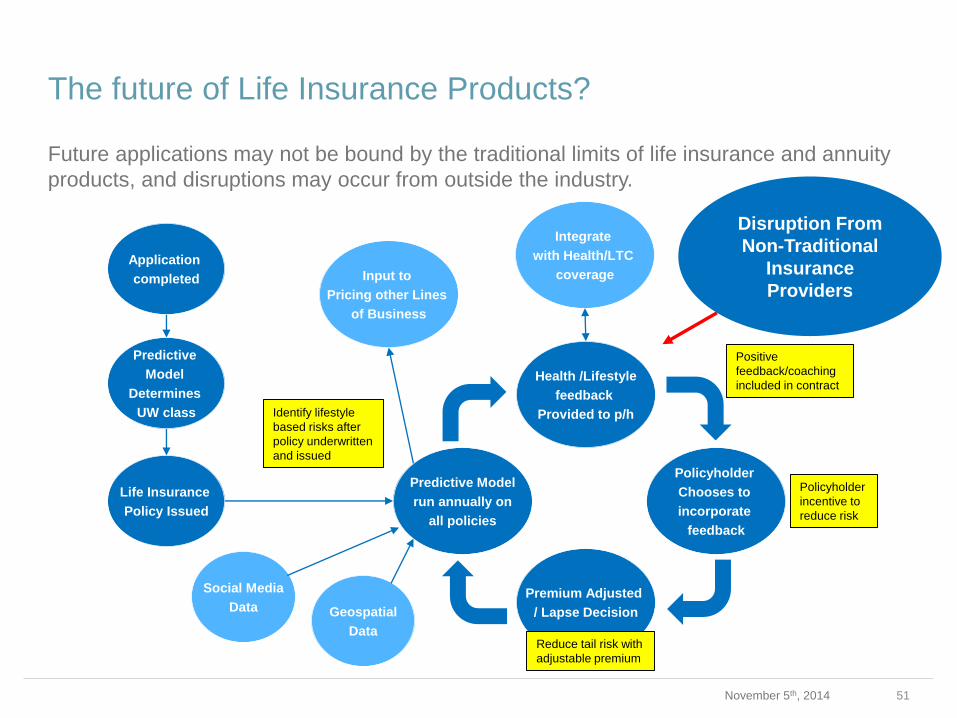
November 5th, 2014 51

Future applications may not be bound by the traditional limits of life insurance and annuity
products, and disruptions may occur from outside the industry.
Life Insurance
Policy Issued
Health /Lifestyle
feedback
Provided to p/h
Predictive Model
run annually on
all policies
Policyholder
Chooses to
incorporate
feedback
Premium Adjusted
/ Lapse Decision
Policyholder
incentive to
reduce risk
Reduce tail risk with
adjustable premium
Identify lifestyle
based risks after
policy underwritten
and issued
Predictive
Model
Determines
UW class
Application
completed
Integrate
with Health/LTC
coverageInput to
Pricing other Lines
of Business
Social Media
Data Geospatial
Data
Positive
feedback/coaching
included in contract
The future of Life Insurance Products?
November 5th, 2014 52

Are you behind the competition?

Considerations for developing an analytics program
Tools
• Does your organization have the tools in place to capture, store, and analyze
the expanding universe of data?
Human Resources
• Do you have people with appropriate business and technical skills to design,
build, and implement advanced analytical solutions?
“Big” Data
• Do you have a plan in place to deal with “Big Data”?
Patience
• Developing predictive analytics and modeling capabilities within an
organization can take time and requires a long term vision and plan
54November 5th, 2014

#ReadingList
55November 5th, 2014
References:
Frees, E.W., Derrig, R.A., & Meyers G. (2014) . Predictive Modeling Applications in Actuarial Science: Volume 1, Predictive Modeling Techniques
Franks, Bill (2012). Taming the Big Data Tidal Wave : Finding Opportunities in Huge Data Streams with Advanced Analytics
Rudder, Christian (2014). Dataclysm: Who We Are (When We Think No One's Looking)

• Predictive Modeling and the use of Big Data is still in the early stages of
maturity in the Life and Annuity space, although the level of interest in
developing and using predictive modeling continues to grow
rapidly…act now or fall behind!
• To harness the power of “Big Data”, more storage and computing power
are not enough. Developing an analytics team requires people with
both a knowledge of your business and of statistical modeling
techniques in order to apply their knowledge to the increasing volumes
of data
56
Takeaways
November 5th, 2014