Big data analytics for policy making - Joinup.eu · to grow, moving big data analytics gradually...
122
Big data analytics for policy making Report A study prepared for the European Commission DG INFORMATICS (DG DIGIT)
Transcript of Big data analytics for policy making - Joinup.eu · to grow, moving big data analytics gradually...

Big data analytics for policy making
ReportA study prepared for the European Commission DG INFORMATICS (DG DIGIT)

This study was carried out for the European Commission by
Authors:
Martina BarberoJo CoutuerRégy JackersKarim MoueddeneEls RendersWim StevensYves ToninatoSebastiaan van der PeijlDimitry Versteele
Word of appreciationThe study team would like to express their gratitude towards the organisations and people interviewed. We thank them for the time they freed up for participating in the interviews and the valuable insights that they have shared with us. Our thankfulness also goes out to DG DIGIT, for providing insightful and timely feedback during the whole process of executing this study.
Disclaimer
By the European Commission, Directorate-General for Informatics
The information and views set out in this publication are those of the author(s) and do not necessarily reflect the official opinion of the Commission. The Commission does not guarantee the accuracy of the data included in this study. Neither the Commission nor any person acting on the Commission’s behalf may be held responsible for the use which may be made of the information contained therein.
© European Union, 2016. All rights reserved. Certain parts are licensed under conditions to the EU. Reproduction is authorized provided the source is acknowledged.

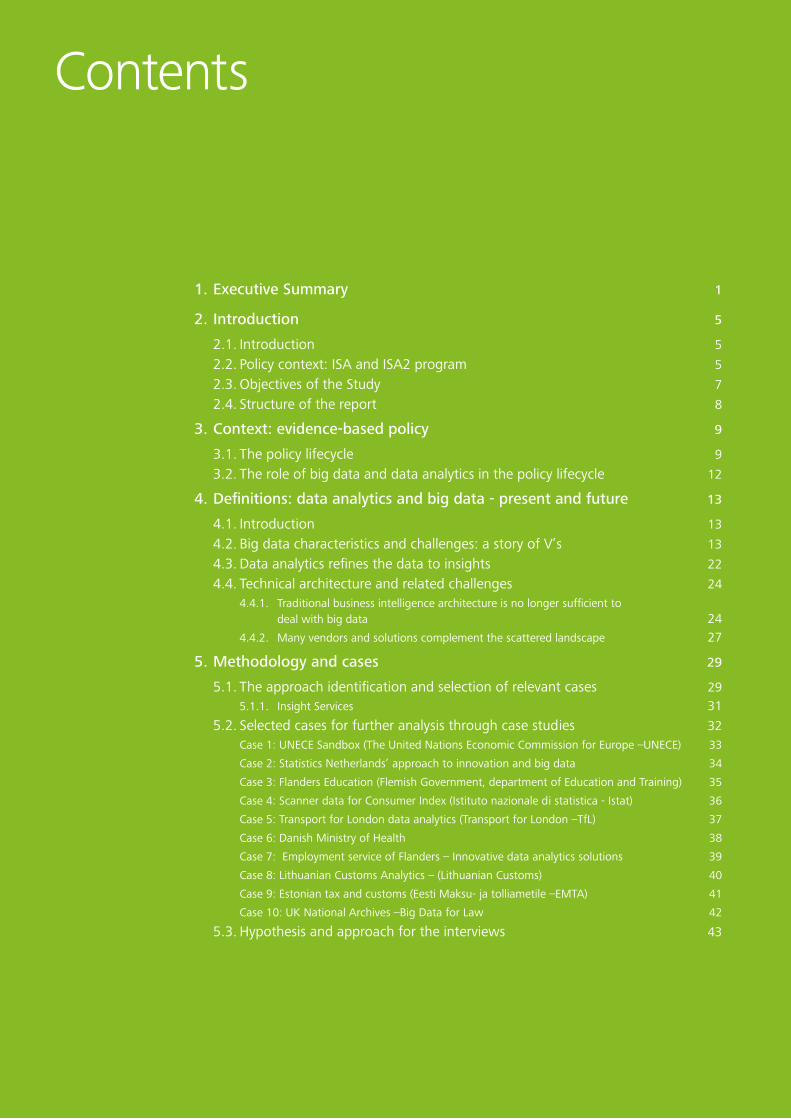
Contents
1. Executive Summary 1
2. Introduction 5
2.1. Introduction 5
2.2. Policy context: ISA and ISA2 program 5
2.3. Objectives of the Study 7
2.4. Structure of the report 8
3. Context: evidence-based policy 9
3.1. The policy lifecycle 9
3.2. The role of big data and data analytics in the policy lifecycle 12
4. Definitions: data analytics and big data - present and future 13
4.1. Introduction 13
4.2. Big data characteristics and challenges: a story of V’s 13
4.3. Data analytics refines the data to insights 22
4.4. Technical architecture and related challenges 244.4.1. Traditional business intelligence architecture is no longer sufficient to deal with big data 244.4.2. Many vendors and solutions complement the scattered landscape 27
5. Methodology and cases 29
5.1. The approach identification and selection of relevant cases 295.1.1. Insight Services 31
5.2. Selected cases for further analysis through case studies 32Case 1: UNECE Sandbox (The United Nations Economic Commission for Europe –UNECE) 33
Case 2: Statistics Netherlands’ approach to innovation and big data 34
Case 3: Flanders Education (Flemish Government, department of Education and Training) 35
Case 4: Scanner data for Consumer Index (Istituto nazionale di statistica - Istat) 36
Case 5: Transport for London data analytics (Transport for London –TfL) 37
Case 6: Danish Ministry of Health 38
Case 7: Employment service of Flanders – Innovative data analytics solutions 39
Case 8: Lithuanian Customs Analytics – (Lithuanian Customs) 40
Case 9: Estonian tax and customs (Eesti Maksu- ja tolliametile –EMTA) 41
Case 10: UK National Archives –Big Data for Law 42
5.3. Hypothesis and approach for the interviews 43

6. Best practices and lessons learnt 45
6.1. The art of the possible: how (big) data analytics can support the policy life cycle 46
6.1.1. Providing macro insights for the benefit of policy making 476.1.2. Equip partners and stakeholders with performance benchmark opportunities 496.1.3. Deliver data driven services to citizens 496.1.4. Implement clever law enforcement 516.1.5. Conclusion 51
6.2. How to deliver the art of the possible: approaches to using (big) data analytics 52
6.2.1. Using new data sources and improving existing ones 536.2.2. Using analytical techniques for better insights 556.2.3. Providing insights quicker or near real time 556.2.4. Enlarging the target audience for analytical solutions 566.2.5. Designing new data driven public services 57
6.3. Best practices and lessons learnt 586.3.1. Strategy 596.3.2. People and skills 626.3.3. Processes 716.3.4. Data 756.3.5. Technology 82
7. Recommendations 91
7.1. An insight driven public organisation in the era of big data analytics 917.1.1. Always keep a strong focus on what truly matters 917.1.2. Treat data as crown jewels 937.1.3. No one can whistle a symphony, it takes an orchestra to play it. 947.1.4. The technology you use, impresses no one, the experience you create with it, is everything. 957.1.5. It’s not a destination, it’s a journey. 96
7.2. Interoperability challenges 97
7.3. Governments as an eco-system of insight driven organisations providing each other relevant data and services 98
7.3.1. An increased need to share data across organisations 987.3.2. Governments as service providers in a solution economy focused on insights. 99
Annex 1 – List of cases gathered by desk research 103
Annex 2 – Statistics on cases 109
Annex 3 – Bibliography and web sources 113

f
1. Executive Summary
Data analytics inspired by the expanded possibilities of big data can help organisations in both public and private sectors to make better, quicker, and more efficient decisions based on evidence and insights. The landscape is continuously evolving as more and more data are constantly being created and analytical solutions professionalise in many ways. The momentum continues to grow, moving big data analytics gradually into the mainstream of business decision-making worldwide.
The present study investigates big data and data analytics initiatives launched by public authorities in Europe in order to provide insights. First, the study analyses the potential or added value of big data analytics to help public administrations at all levels of government and in different domains to reach their goals. Secondly, it captures valuable lessons learnt and best practices of mature public organisations to inspire peers and help them along the journey to use big data analytics and become more insight driven.
As this study illustrates, these rapidly evolving technologies and tools provide unprecedented opportunities for data-driven insights to efficiently and effectively deal with complex policy issues. Big data represents a change in the quality, quantity and type of data public administrations dispose of; which has potential impacts throughout the entire policy lifecycle. Data analytics constitutes a new way of looking at data and deepening our understanding of policy issues. Big data and data analytics can provide added value for public authorities willing to expand their horizons and innovate in their policy making techniques.
Through desk research and contact with a range of organisations, this research gathered evidence of more than 100 cases where public administrations mine big data or use data analytics to gain better insights and increase their impact. These cases cover many different policy domains and different ways of impacting challenges at different stages of the policy lifecycle (from policy planning and design to implementation, evaluation and revision). These cases illustrate the wealth of possibilities based on the use of various data sources (such as administrative data, sensor data, social media etc) and analytical techniques (predictive, descriptive, visualisation etc).
Ten cases were selected, covering a range of different data sources and types of analytics as well as policy domains and level of government, to conduct more in-depth case studies and to gather key lessons learnt from the use of big data and data analytics within these public organisations. These case studies provide insights on potential value, relevant approaches and lessons learnt. The latter have been clustered in five key areas that emerged as key elements to consider when embarking on the journey of implementing big data/data analytics initiatives, being: strategy, people and skills, processes, data and technology.
Linked to the efforts to grow as an insight driven organisation, it emerged from the cases that a relevant strategy builds on a favourable context or traditional strengths of the organisation. It focusses on the importance to obtain alignment between stakeholders. It directs towards a common goal for big data analytics and expresses the desired outcomes or benefits. Organisations that reflect on big data analytics to optimize their way of working, redefine their role or actions and consider the disrupting nature of technology changes, investigate the topic at large and can find benefits in all steps of the policy lifecycle.
In terms of people and skills, multiple technical and business skills are essential for carrying out impactful data analytics and big data initiatives. Public authorities need to build the required skillsets with a focus on people that combine these skills. All of them have built them internally or opted to source from other organisations such as universities, private sector companies or other public bodies. An optimal organisational model needs to provide a close link between data scientists and subject matter experts while nurturing collaboration.
Organisations see recurrent tasks in this domain and design processes to create repetitive value. A lot of the interviewed public authorities have foreseen a process to foster innovation and experiments in big data analytics. Also prioritisation processes, stakeholder management and appropriate project management must be in place to ensure a relevant outcome.
1
It is evident that data is essential for successful cases. The different nature of big data leads to an important fact that data must be trusted to be good enough for purpose. Governments need to lead by example where it concerns security and privacy concerns. Some have tried the wealth of private sector data and experienced the benefits of external data brokers. The growing landscape of data sources within governments requires the definition of a well designed framework of documentation to ensure data can be reused cross the organisation and even cross domain or cross border.
Finally the vast amount of different technology vendors, both open source and proprietary, brings a lot of public organisations in the challenge to build a relevant IT architecture. Most of them value a discovery or sandbox environment that caters for experiments but point out to the challenge of total cost of ownership. The study examined several initiatives of organisations sharing such a sandbox environment. As multiple type of users or stakeholders define an optimal user experience with big data technology differently, organisations need to balance and construct integrated landscapes of best of breed solutions or well-chosen cross infrastructure vendors.
Based on all lessons learnt and best practices, the present study developed several recommendations addressed to any public organisation willing to work with data analytics and big data. Some of the recommendations concern challenges internal to a public organisation while others relate to the benefits of collaboration and places public bodies within an ecosystem of insight driven public organisations.
A public sector organisation seeking to obtain value from big data analytics should carefully plan a journey in which they spread their attention to the following domains: 1. Before starting, public organisations need to think
about, discuss and align with key stakeholders about the potential optimising, redefining or disrupting value of any (big) data analytics initiative. Also,
they need to build supported hypothesis on what could be achieved by improving insights for various stakeholders. This focus on benefits and insights should run like a thread through the entire initiative.
2. It is crucial to invest in capturing knowledge about structuring and documenting their data assets. They have to build stakeholder trust by solid data management procedures respecting related laws and ethical principles and communicate on why data is good enough for purpose.
3. There is a clear need to involve business and technical skills to confront the multi-faced challenges linked to big data analytics. They can complement their own capabilities with strengths of partners and suppliers to obtain quick wins while building own abilities.
4. To address the needs of multi-disciplinary stakeholders in a varied landscape of technical solutions it is key to design blended, scalable and flexible IT architectures. Public organisations need to prepare for change as technology is continuously evolving.
5. Maturity in this domain should be considered as a journey with multiple challenges and the design of a detailed roadmap is important to confront these in a holistic and balanced approach. Failure is a good teacher and it should be considered as such.
In addition to these ‘internal’ recommendations, public authorities should also consider themselves as part of a wider ecosystem of insight driven organisations. In doing so, public organisations need to:6. Understand that information management and
qualitative meta-data is not only important for internal challenges. Data exchange with other public bodies can lead to multiple new domains where data can bring value. The semantic interoperability challenge of this will only grow with the fast pace of big data sources being created. To deal with technical, privacy and security challenges, the creation of common secured technology environments and proper governance frameworks will be relevant to exchange big data files.
2

7. Consider big data analytics as a relevant domain in which governments have increasingly higher stakes and benefits to collaborate with public and private partners. Collaboration in this area can be achieved in multiple ways and can be provided in the form of providing insights on the benefits possibilities of big data analytics (insight services), guidance and concrete advice on the use of big data analytics (advisory services), key tools, data and resources (e.g. technology, funding, people and skills) for big data analytics (enabling services) and/or providing readymade solutions or conducting data analytics for others (production services).
The domain of big data and data analytics opens a myriad of possibilities for public sector organisations. To build relevant business cases and setup initiatives, they can find inspiration in the experiences of others creating value with analytics on internal and external data. This study conveys strategic recommendations to deal with related challenges based on lessons learnt and best practices of ten European public sector organisations. It supports the approach of collaboration both cross domain and cross border to have a maximum impact and create multiple societal benefits in an ethical way.
In order to foster such collaboration a number of challenges were identified related to the interoperability levels as defined by the European Interoperability Framework (EIF). These include: ■ Legal interoperability: differences concerning what
public authorities can do with data, the ease of access and the issues related to sharing data across countries concerning data privacy and sec urity can lead to legal challenges. There is generally a lack of common rules on data privacy and security requirements lack of a sufficient legal framework, as current data protection and privacy legislation is not up-to-speed with big data analytics.
■ Organisational interoperability: the various ways for organisations to collaborate push towards a need for a framework of cooperation agreements to decide
how governments work together to reach a common goal, such as a working model on how to allow experts to work across organisational boundaries;
■ Semantic interoperability: data is underlined by most of the analysed cases as a challenge, in particular in relation to the challenge to provide their data scientists with relevant metadata on the expanding landscape of data assets and the need for documentation, overviews and definitions that is expanding at a similar pace as the size of data is growing;
■ Technical interoperability: with a large variety of big data analytics technologies available, even within organisations, there is a need to integrate various solutions to accommodate the experience of various stakeholders and types of users. The fast evolving landscape of big data analytics solutions will continue to pose technical interoperability challenges.
3

4
This chapter provides an introduction to the study, the relevant policy context, its objectives and structure of this report.
2.1. IntroductionData analytics helps all types of organisations in both public and private sector to make better, quicker, and more efficient decisions based on evidence and insights. The data analytics landscape is continuously evolving, more and more data is becoming available and the momentum continues to grow, moving squarely into the mainstream of business decision-making worldwide.
This study aims to investigate big data and analytics initiatives launched by public authorities. The study gives special attention to the potential impact on various processes linked to the policy life cycle and insights needed at its different stages. There is much to be learned from what is already happening around Europe in this area. Sharing insights on how (big) data analytics is used in the public sector and how organisations tackle the challenges they are faced with along the way to gain value from data.
2.2. Policy context: ISA and ISA2 programThis study is carried out in the context of the 2010- 2015 ISA (Interoperability solutions for European public administrations) programme, a 160 million euro program whose mission is to facilitate cross border and cross sector transactions, making administrative procedures quicker, simpler and cheaper for all parties involved.1 In particular this study is conducted in support of the ISA Action (1-22) on “Big Data and Open Knowledge for Public Administrations” that aims to identify “the challenges and opportunities that Member States and the Commission face in the context of big data and open knowledge [and] to create synergies and cooperation between the Commission and Member States, leading to more effective and informed actions by public administrations”.2
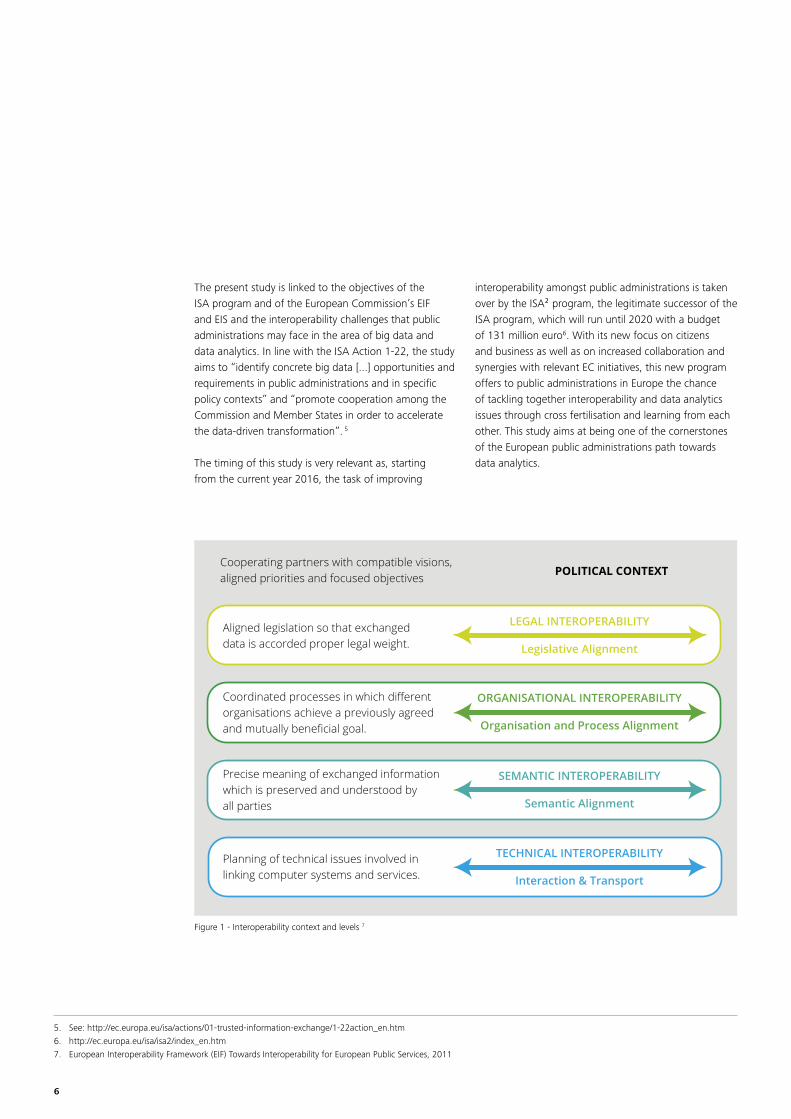
As defined by the European Interoperability Framework (EIF), there are four layers of interoperability that need to be addressed to achieve “the practical implementation of the conceptual model for cross-border/cross-sectoral services” of the European public administrations within the relevant political context as illustrated in the picture below.3
These four layers are: ■ Legal interoperability, meaning alignment of
legislation allowing data to be exchanged according to commonly recognised rules and with a commonly agreed legal weight.
■ Organisational interoperability, defined as alignment of organisations and processes allowing to achieve the common goals of the cooperating organisation.
■ Semantic interoperability, concerns the precise meaning of exchanged information as well as common definitions which are preserved and understood by all parties.
■ Technical interoperability, concerns the alignment on technical elements involved in linking systems and services allowing data to be safely exchanged.
All these four elements are duly considered by the EIF and the European Interoperability Strategy (EIS) adopted by the European Commission in 2010 following the Communication Towards interoperability for European public services.4
Moreover, the European Interoperability Framework of the European Commission takes into account the political context in which these layers enter into play, defined as the alignments of objectives and strategies between cooperating partners.
2. Introduction
1. See: http://ec.europa.eu/isa/about-isa/index_en.htm2. See: http://ec.europa.eu/isa/actions/01-trusted-information-exchange/1-22action_en.htm3. European Interoperability Framework (EIF) Towards Interoperability for European Public Services, 20114. http://ec.europa.eu/isa/documents/isa_iop_communication_en.pdf
5
The present study is linked to the objectives of the ISA program and of the European Commission’s EIF and EIS and the interoperability challenges that public administrations may face in the area of big data and data analytics. In line with the ISA Action 1-22, the study aims to “identify concrete big data [...] opportunities and requirements in public administrations and in specific policy contexts” and “promote cooperation among the Commission and Member States in order to accelerate the data-driven transformation”. 5
The timing of this study is very relevant as, starting from the current year 2016, the task of improving
Cooperating partners with compatible visions, aligned priorities and focused objectives
Aligned legislation so that exchanged data is accorded proper legal weight.
Coordinated processes in which different organisations achieve a previously agreed and mutually beneficial goal.
Precise meaning of exchanged information which is preserved and understood by all parties
Planning of technical issues involved in linking computer systems and services.
POLITICAL CONTEXT
LEGAL INTEROPERABILITY
Legislative Alignment
ORGANISATIONAL INTEROPERABILITY
Organisation and Process Alignment
SEMANTIC INTEROPERABILITY
Semantic Alignment
TECHNICAL INTEROPERABILITY
Interaction & Transport
Figure 1 - Interoperability context and levels 7
interoperability amongst public administrations is taken over by the ISA² program, the legitimate successor of the ISA program, which will run until 2020 with a budget of 131 million euro6. With its new focus on citizens and business as well as on increased collaboration and synergies with relevant EC initiatives, this new program offers to public administrations in Europe the chance of tackling together interoperability and data analytics issues through cross fertilisation and learning from each other. This study aims at being one of the cornerstones of the European public administrations path towards data analytics.
5. See: http://ec.europa.eu/isa/actions/01-trusted-information-exchange/1-22action_en.htm6. http://ec.europa.eu/isa/isa2/index_en.htm7. European Interoperability Framework (EIF) Towards Interoperability for European Public Services, 2011
6
2.3. Objectives of the StudyThe overall objective of this study is to gather and share insights on how public organisations are getting value out of big data technologies and analytics. More specifically, the study aims to examine the impact and benefits along the policy-making lifecycle. The information should help to raise awareness on what public administrations can do with big data and data analytics and what is their role in fostering the adoption of this new technology within the public sector. The study should support those who want to embark on a similar journey and provide insights on best practices and lessons learnt.
As the technology and tools involved become more diverse and complex in the case of big data and advanced analytics, the study puts a special focus on the challenges in terms of technology and skills.
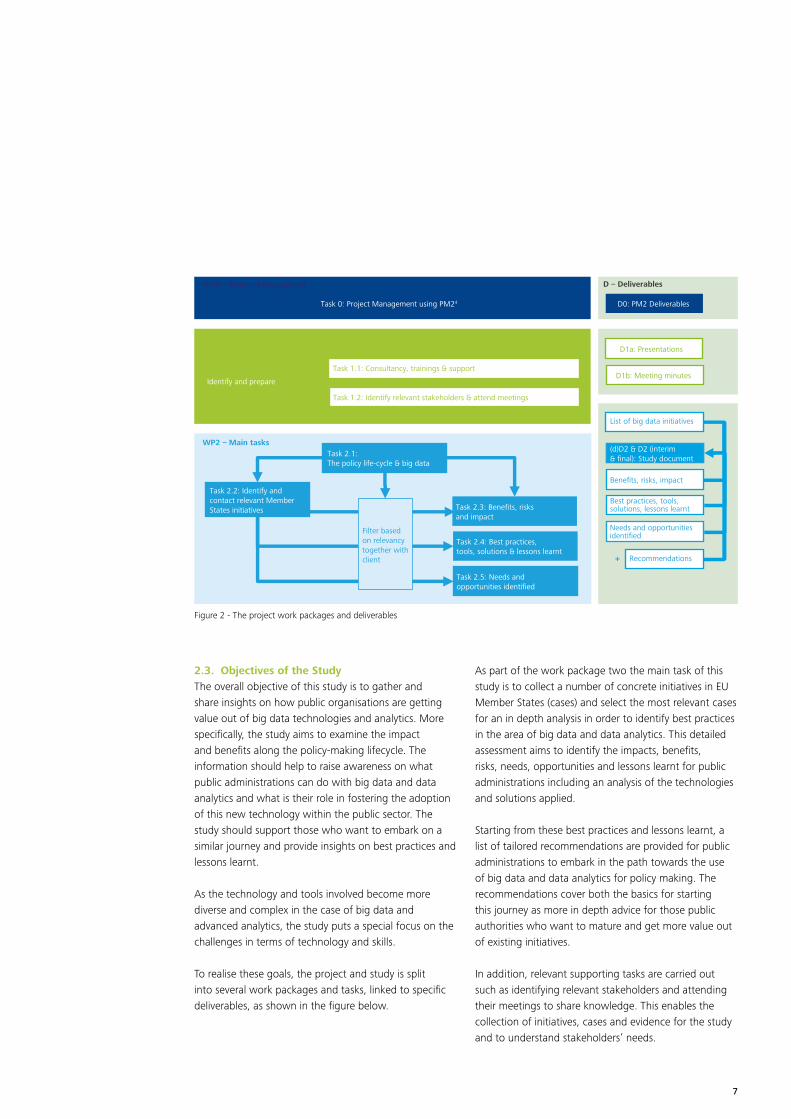
To realise these goals, the project and study is split into several work packages and tasks, linked to specific deliverables, as shown in the figure below.
As part of the work package two the main task of this study is to collect a number of concrete initiatives in EU Member States (cases) and select the most relevant cases for an in depth analysis in order to identify best practices in the area of big data and data analytics. This detailed assessment aims to identify the impacts, benefits, risks, needs, opportunities and lessons learnt for public administrations including an analysis of the technologies and solutions applied.
Starting from these best practices and lessons learnt, a list of tailored recommendations are provided for public administrations to embark in the path towards the use of big data and data analytics for policy making. The recommendations cover both the basics for starting this journey as more in depth advice for those public authorities who want to mature and get more value out of existing initiatives.
In addition, relevant supporting tasks are carried out such as identifying relevant stakeholders and attending their meetings to share knowledge. This enables the collection of initiatives, cases and evidence for the study and to understand stakeholders’ needs.
Figure 2 - The project work packages and deliverables
7

2.4. Structure of the reportThis report constitutes the final deliverable for the study on big data and open knowledge for public administrations.
The report contains six chapters, structured according to the approach to the study, each chapter detailing the main findings and forming the basis for the next steps and chapters: ■ Chapter 1: Executive Summary ■ Chapter 2: Introduction ■ Chapter 3: Context: evidence-based policy
■ Chapter 4: Definitions: data analytics and big data– present and future
■ Chapter 5: Methodology and cases ■ Chapter 6: Best practices and lessons learnt ■ Chapter 7: Recommendations
In addition to these chapters, there are a number of annexes: ■ Annex 1 – List of cases gathered by desk research ■ Annex 2 – Statistics on cases ■ Annex 3 – Bibliography and web sources
8
3. Context: evidence-based policy
This chapter provides a definition of the Policy Life Cycle and the potential use of data as an evidence base along the different stages. The use of data to gain key insights for policy is not new. However, recent trends in big data and data analytics bring a number of opportunities for leveraging data for effective policy.
considered beyond reach. The private sector is rapidly adopting data strategies for decision making while governments are more slowly embracing the latest tools and technologies.
These rapidly evolving technologies and tools provide unprecedented opportunities for data-driven insights to efficiently and effectively deal with complex policy issues. It represents a change in the quality, quantity and type of data public administrations dispose of; which has potential impacts throughout the entire policy lifecycle.
3.1. The policy lifecycleFrom the origins, policy analysis has been tightly connected with a perspective that considers the policy process as evolving through a sequence of discrete stages or phases9. Political theory has operationalised these different stages into a policy lifecycle that explains how we go from a notional starting point where a policy issue or a need emerge to a notional end where this need has been addressed and the cycle starts again.
The policy cycle theory provides a way of decoding a complex political dynamic that goes from the identification of the problem to the implementation of the desired solution. The policy cycle applies to any policy measure (from legislation to programmes) and all public authorities (from local to supranational levels); it also applies both to internal decisions (for instance rules about internal organisation and processes) as well as external ones (decisions that have an impact on external recipients: policies, programmes, implementing acts, etc.).
Despite the fact that several different and concurrent definitions of the policy lifecycle are available, for the purpose of this study we align with the approach adopted by the European Commission in the Better Regulation Guidelines.
Since the early post war period public authorities are looking for solutions able to address the growing complexities in society and base policies on the best available evidence. Public administrations throughout the world have adopted the notion that policy decisions should be based on sound evidence. It is widely accepted that evidence-based policy making leads to better, more impactful policies. Evidence-based policy represents “a systematic approach that helps people make well informed decisions about policies, programs and projects by putting the best available evidence from research at the heart of policy development and implementation”.8
Evidence empowers policymakers to base their decisions on a clear assessment of problems and policy options and the (expected) impact of the public intervention at the different stages of the policy cycle. It enhances policy learning and increases accountability of public administrations.
Methods for evidence-based policy making can take a variety of formats, mostly depending on the policy domain at hand. The methods can range from peer-reviewed scientific research and random controlled trials, to social or econometric data and statistics, frequently complemented by survey results and consultation documents.
The rise of new technologies and trends in sharing data, such as open data, big data and data analytics, gave birth to a renaissance of evidence-based policy making practices. This is due to the availability of brand new techniques and technologies that leverage today’s available computing power to enable the processing of vast amounts and varieties of data into relevant information and insights through statistical analysis and modelling. New techniques are thus an opportunity to find insights in new and emerging types of data and content and to answer questions that were previously
8. See: Philip Davies, PT 2004, Is Evidence-Based Government Possible?9. “Handbook of Public Policy Analysis. Theory, Politics and Methods”, edited by Frank Fischer, Gerald Miller and Mara Sidney.
9

The Better Regulation Toolbox10 of the European Commission defines seven steps that constitute the policy lifecycle and that correspond to the different phases public administrations go through:
1. Planning: once a policy need emerges (either through informal/formal consultation with the stakeholders or an unforeseen event), the policy makers have to define and formulate the desired actions. Policy planning is the development of effective and acceptable courses of action for addressing what has been placed on the policy agenda. At this stage, the policy actions are sketched at a macro level without sorting out all the details related to them.
2. Adoption: Once the planning phase comes to an end, the policy makers are often confronted with the choice between different kind of actions, different intensity or different levels of intervention. The preliminary Impact Assessments at the EU level for instance test various policy scenarios available. Policy makers then need to adopt one approach among those formulated through the planning phase, based on stakeholders’ preferences and expected impact.
3. Design: Following the adoption of one specific policy measure or approach, policy makers have to refine it and design it in detail. At this stage, the policy actions are discussed in all their elements and the policy makers take decisions on all the specific measures
and components. The product of this phase is a policy measure ready to be implemented.
4. Implementation/Application: the policy implementation takes place once the policy measure is completely designed. Policy implementation should translate the policy or action from the paper to the reality, for example by adopting supporting measures that are needed to enable legislation or enforce it (application) or the implementation of a programme.
5. Evaluation: this step consists in establishing policy performance checks and intermediate and final tests to attest the quality of the implemented action against its results. This step of the policy cycle has gained more and more weight in the last decades and this provoked a nourished debate around indicators and evaluation methodologies. Evaluation is needed for the final step of the policy cycle, revision.
6. Revision: at the end of the intervention and following the evaluation results, policy makers may decide to stop the policy, keep it running without modifications or review it to address its weaknesses. Feedback may be provided by stakeholders or policy beneficiaries or even citizens in general. The revision may lead to the adoption of a new legal act or the withdrawal or modification of the current one. This closing phase therefore naturally leads to beginning a new cycle.
10. Better Regulation “Toolbox”, complementing Better Regulation Guidelines presented in in SWD(2015) 111
10
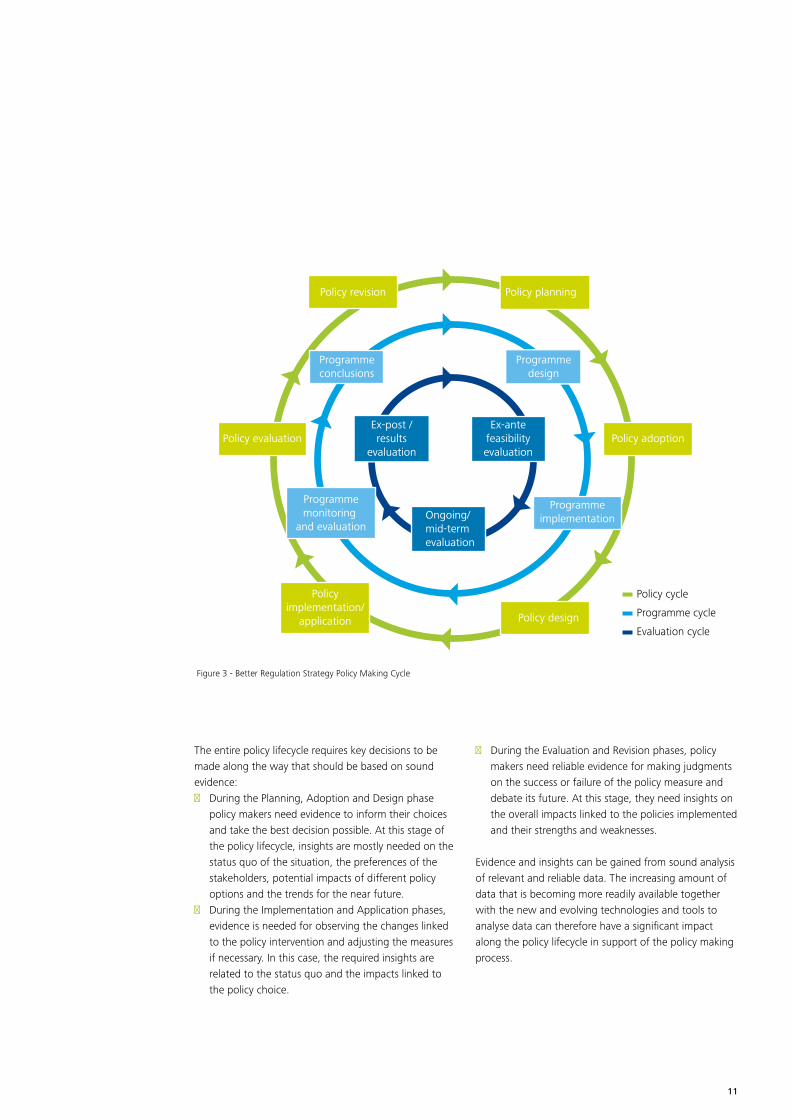
The entire policy lifecycle requires key decisions to be made along the way that should be based on sound evidence: ■ During the Planning, Adoption and Design phase
policy makers need evidence to inform their choices and take the best decision possible. At this stage of the policy lifecycle, insights are mostly needed on the status quo of the situation, the preferences of the stakeholders, potential impacts of different policy options and the trends for the near future.
■ During the Implementation and Application phases, evidence is needed for observing the changes linked to the policy intervention and adjusting the measures if necessary. In this case, the required insights are related to the status quo and the impacts linked to the policy choice.
■ During the Evaluation and Revision phases, policy makers need reliable evidence for making judgments on the success or failure of the policy measure and debate its future. At this stage, they need insights on the overall impacts linked to the policies implemented and their strengths and weaknesses.
Evidence and insights can be gained from sound analysis of relevant and reliable data. The increasing amount of data that is becoming more readily available together with the new and evolving technologies and tools to analyse data can therefore have a significant impact along the policy lifecycle in support of the policy making process.
Policy revision
Programmeconclusions
Policy evaluation
Programmemonitoring
and evaluation
Ex-post /results
evaluation
Ongoing/mid-termevaluation
Policyimplementation/
application Policy design
Programmeimplementation
Policy adoptionEx-ante
feasibilityevaluation
Programmedesign
Policy planning
Policy cycle
Programme cycle
Evaluation cycle
Figure 3 - Better Regulation Strategy Policy Making Cycle
11
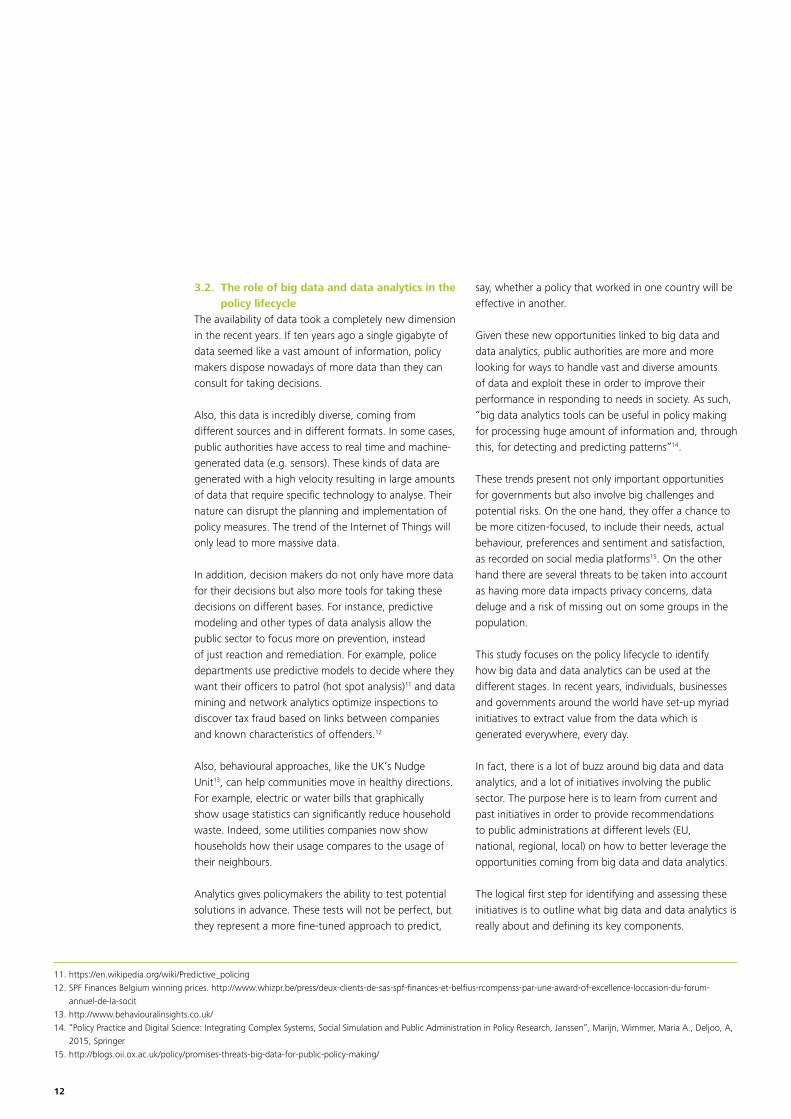
3.2. The role of big data and data analytics in the policy lifecycle
The availability of data took a completely new dimension in the recent years. If ten years ago a single gigabyte of data seemed like a vast amount of information, policy makers dispose nowadays of more data than they can consult for taking decisions.
Also, this data is incredibly diverse, coming from different sources and in different formats. In some cases, public authorities have access to real time and machine-generated data (e.g. sensors). These kinds of data are generated with a high velocity resulting in large amounts of data that require specific technology to analyse. Their nature can disrupt the planning and implementation of policy measures. The trend of the Internet of Things will only lead to more massive data.
In addition, decision makers do not only have more data for their decisions but also more tools for taking these decisions on different bases. For instance, predictive modeling and other types of data analysis allow the public sector to focus more on prevention, instead of just reaction and remediation. For example, police departments use predictive models to decide where they want their officers to patrol (hot spot analysis)11 and data mining and network analytics optimize inspections to discover tax fraud based on links between companies and known characteristics of offenders.12
Also, behavioural approaches, like the UK’s Nudge Unit13, can help communities move in healthy directions. For example, electric or water bills that graphically show usage statistics can significantly reduce household waste. Indeed, some utilities companies now show households how their usage compares to the usage of their neighbours.
Analytics gives policymakers the ability to test potential solutions in advance. These tests will not be perfect, but they represent a more fine-tuned approach to predict,
say, whether a policy that worked in one country will be effective in another.
Given these new opportunities linked to big data and data analytics, public authorities are more and more looking for ways to handle vast and diverse amounts of data and exploit these in order to improve their performance in responding to needs in society. As such, “big data analytics tools can be useful in policy making for processing huge amount of information and, through this, for detecting and predicting patterns”14.
These trends present not only important opportunities for governments but also involve big challenges and potential risks. On the one hand, they offer a chance to be more citizen-focused, to include their needs, actual behaviour, preferences and sentiment and satisfaction, as recorded on social media platforms15. On the other hand there are several threats to be taken into account as having more data impacts privacy concerns, data deluge and a risk of missing out on some groups in the population.
This study focuses on the policy lifecycle to identify how big data and data analytics can be used at the different stages. In recent years, individuals, businesses and governments around the world have set-up myriad initiatives to extract value from the data which is generated everywhere, every day.
In fact, there is a lot of buzz around big data and data analytics, and a lot of initiatives involving the public sector. The purpose here is to learn from current and past initiatives in order to provide recommendations to public administrations at different levels (EU, national, regional, local) on how to better leverage the opportunities coming from big data and data analytics.
The logical first step for identifying and assessing these initiatives is to outline what big data and data analytics is really about and defining its key components.
11. https://en.wikipedia.org/wiki/Predictive_policing12. SPF Finances Belgium winning prices. http://www.whizpr.be/press/deux-clients-de-sas-spf-finances-et-belfius-rcompenss-par-une-award-of-excellence-loccasion-du-forum-
annuel-de-la-socit13. http://www.behaviouralinsights.co.uk/ 14. “Policy Practice and Digital Science: Integrating Complex Systems, Social Simulation and Public Administration in Policy Research, Janssen”, Marijn, Wimmer, Maria A., Deljoo, A,
2015, Springer15. http://blogs.oii.ox.ac.uk/policy/promises-threats-big-data-for-public-policy-making/
12
4. Definitions: data analytics and big data - present and future
This chapter summarizes some current trends and definitions on big data and data analytics. It combines information from various thought leadership on potential future developments.
They describe big data in the context of “the deluge of data in today’s networked, digitized, sensor-laden, and information-driven world” to an extent that “the avail-ability of these vast data resources carries the potential to answer questions previously out of reach”. According to the publication, big data consist of “extensive datasets primarily in the characteristics of volume, variety, velocity, and/or variability that require a scalable architecture for efficient storage, manipulation, and analysis.”When summarizing the various definitions mentioned in their report from Gartner, Techtarget, Oxford English Dictionary, IDC, McKinsey and numerous thought leaders, one notices different pillars that refer to:
■ the nature of the data in terms of volume and variety; ■ the velocity by which they are being generated; ■ the challenges and innovative solutions needed for
storage, manipulation and analysis; ■ the cultural shift needed to trust the insights created
with these data and adapt to a more intelligent evidence based decision making;
■ and the potential they have in adding better or new insights to questions.
Mike Gualtieri, a Forrester analyst, describes a pragmatic vision on big data. He describes it as the “frontier of a firm’s ability to store, process, and access all the data it needs to operate effectively, make decisions, reduce risks, and serve customers.”17
The last one is particularly interesting in the course of this study as it links to its objective to understand how European public sector organisations deal with this frontier and the strategies or actions they develop to pass them.To provide more detail in the various elements of all these definitions, the following subsections use a set of commonly used v-words: velocity, volume and variety, veracity, viability and value.
4.1. IntroductionAs mentioned in the previous chapter, the amount of data available for decision making in public sector has been growing over time and has never been considered this big. The specific nature of big data however leads to typical challenges to make good use of them.
This chapter sets out the key characteristics of big data. It provides a typology of different data types and an overview on potential sources. It explains the various types of analytical processing that can be used to obtain insights. And finally this chapter provides information on a related landscape of technology and solutions. It provides an overview of the typical components that are common in a big data analytics technical architecture.
The purpose of this chapter is to set the scene and lead to a common understanding of the wealth of big data analytics, based on available sources and literature. It provides with the insights to prepare the detailed methodology for selecting, interviewing and in-depth analysis of final selected case studies (as presented in chapter 5).
4.2. 1.1 Big data characteristics and challenges: a story of V’s
When comparing existing definitions of big data created by various thought leaders, academia, media and tech-nology vendors, one notices similarities but also different approaches to describe the concept. The National Institute of Standards and Technology, part of the US Department of Commerce, has founded the Big Data Public Working Group (NBD-PWG) with members from industry, academia and government from around the world. The working group has developed a big data Interoperability Framework containing a special publication listing and comparing various big data definitions.16
16. http://nvlpubs.nist.gov/nistpubs/SpecialPublications/NIST.SP.1500-1.pdf17. http://blogs.forrester.com/mike_gualtieri/12-12-05-the_pragmatic_definition_of_big_data
13

Figure 5 - Big data Volume
Volume The growth of world data
what is a
zettabyte
1 terabyte holds the equivalent ofroughly 210 single sided DVDs.
1,000,000,000,000 gigabytes
1,000,000,000 terabytes
1,000,000 petabytes
1,000 exabytes
1 zettabyte 0
5
10
15
20
25
30
35
2005 2010 2015 2020
VelocityThe first characteristic of big data is the fact that some big data is generated and available at a higher velocity. This refers to the speed at which new data is generated and the speed at which data moves around. Estimates predict that every minute 300 hours of video are uploaded to YouTub18, Google processes on average 2.4 million search queries19 and 4.17 million posts are liked on Facebook.20 By the time this report is published these numbers might be outdated again.
Technology needs to deal with the challenge of analysing such high frequency data while it is being generated, without having the burden to plan typical loading processes into structured databases which was often the case in traditional datawarehouse solutions. Near real-time solutions allow to create insights using very recent data inputs. The faster the insights, the more organisations can react on recent developments requesting urgent interventions.
Figure 4 - Big data Velocity
Velocity Frequency of data generation
300 hours 4,170,000posts liked
2,400,000search queriesof video uploaded to
YouTube every minute (estimate)
per minute on Google on Facebook per minute
VolumeA second challenge is linked to the exponential growth and thus the volume of data. Where a gigabyte was a large amount of information to process a decade ago, governments might be faced with terabytes, petabytes and even zettabytes21 of data to analyse.
Relational database management systems, desktop statistics and visualization packages often have difficulty handling big data. The work instead requires “massively parallel software running on tens, hundreds, or even thousands of servers”. What is considered “big data” varies depending on the capabilities of the users and their tools. Expanding capabilities make big data a moving target. For some organizations, facing hundreds of gigabytes of data for the first time may trigger a need to reconsider data management options. For others, it may take tens or hundreds of terabytes before data size becomes a significant consideration.22
In 1999, it took Google one month to crawl and build an index of about 50 million pages. In 2012, the same task was accomplished in less than one minute.2318. http://www.statista.com/statistics/195140/new-user-generated-content-uploaded-by-users-per-minute/
19. http://www.internetlivestats.com/google-search-statistics/20. http://www.statista.com/statistics/195140/new-user-generated-content-uploaded-by-users-per-minute/21. https://en.wikipedia.org/wiki/Zettabyte22. https://en.wikipedia.org/wiki/Big_data23. Mitchell, Jon. “How Google Search Really Works.” Readwrite. February 29, 2012.
14
Variety Structured and unstructured data - types of Big Data
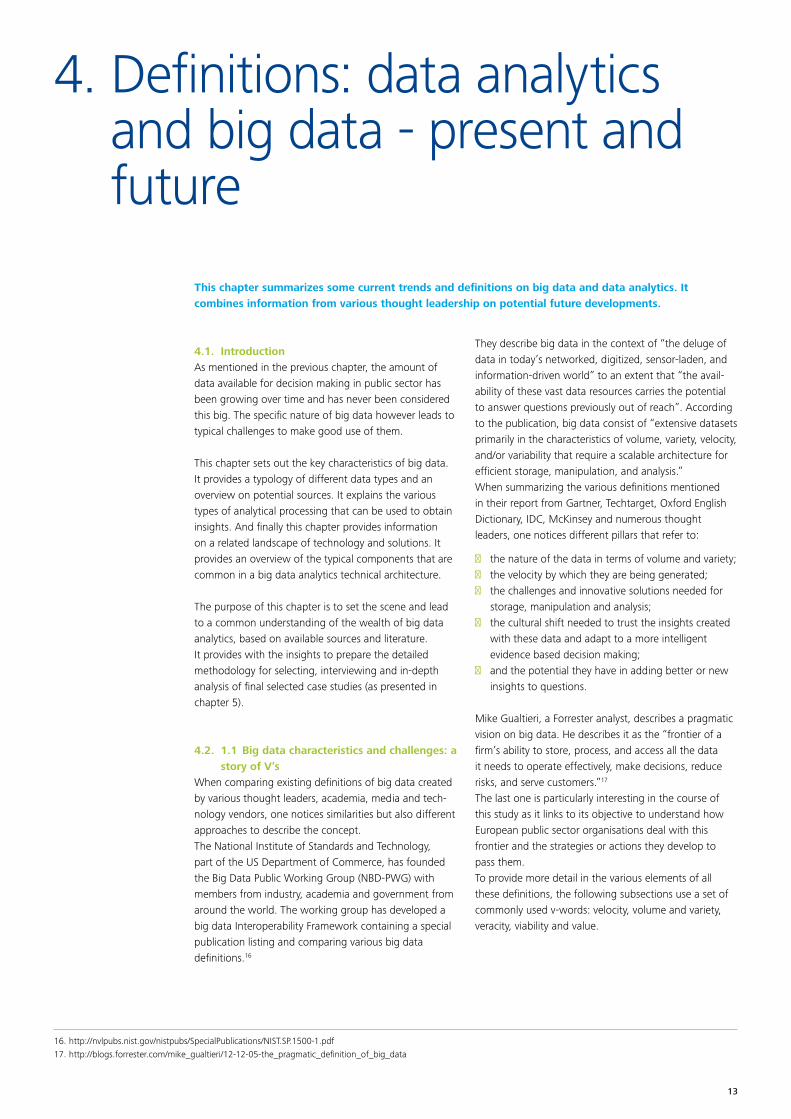
Web and social mediaData includes clickstream and interaction data from social media such as Facebook, Twitter, LinkedIn and blogs.
Machine to machineData includes readings from sensors, meters, and other devices as part of the so-called “internet of things”.
Big transaction dataData includes healthcare claims, telecommunications call detail records (CDRs), and utility billing records that are increasingly available in semi-structured and unstructured formats.
BiometricData includes fingerprints, genetics, handwriting, retinal scans and similar types of data.
Human-generatedData includes vast quantities of unstructured and semi-structured data such as call centre agents’ notes, voice recordings, email, paper documents, surveys, and electronic medical records.
VarietyThe third challenge lies in the variety of data. It refers to the different type of data we can now use. In the past people could only analyse structured data that neatly fitted into tables or relational databases. However, eighty percent of the world’s data is now unstructured – think of photos, video sequences or social media updates. People want to uplift the quality of insights by combining structured and unstructured data from various sources in one analysis. This requires various complex techniques. Big data technology can harness different types of unstructured data and bring them together with more traditional, structured data.
Figure 6 - Big data variety
24. http://www.academia.edu/5697494/Veracity_Roadmap_Is_Big_Data_Objective_Truthful_and_Credible
15
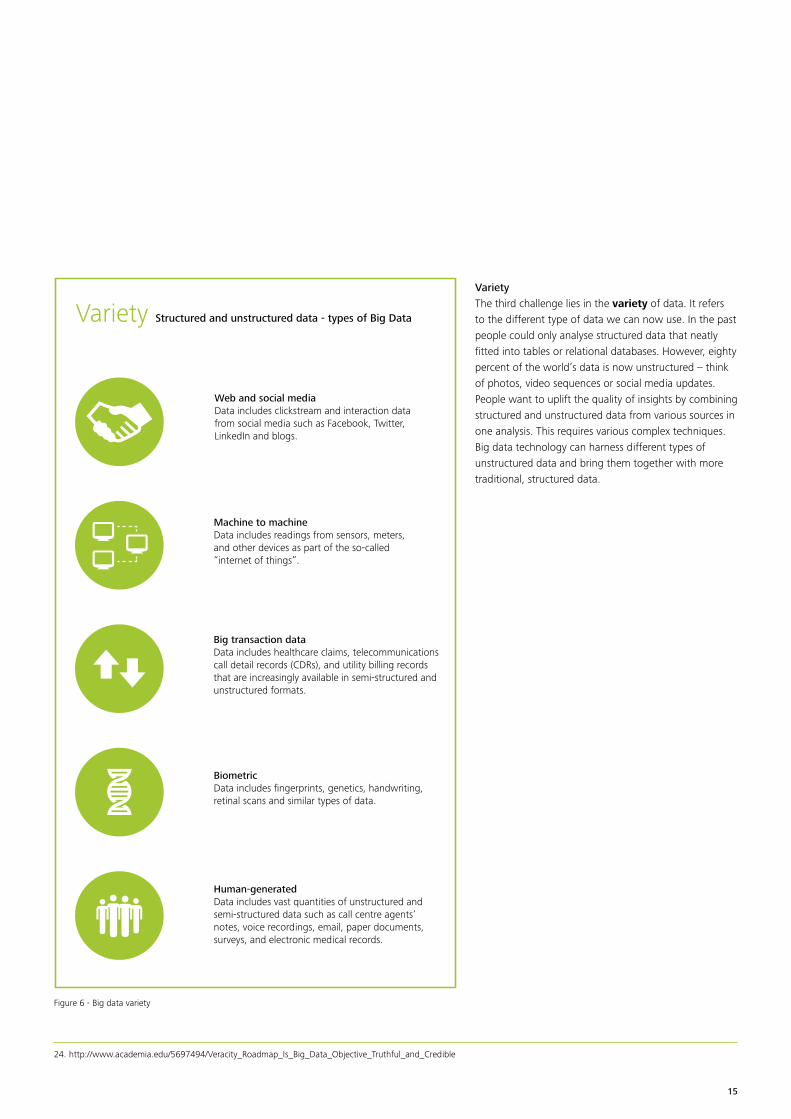
ViabilityViability of the data is also a key element. It has to do with the selection of what people can do and where they should the start. The first place they start is to look in the metadata of known data sources. People want to carefully select the attributes and factors that are most likely to provide insights and predict outcomes that matter the most. Taking every source of information and every attribute into account can lead to long and intensive analysis work. Selecting and filtering factors and sources is a challenge to any organisation making use of various sources and big data.
A first task is therefore to assess the viability of data as people want to quickly and cost-effectively test and confirm a particular variable’s relevance. And, like virtually all scientific disciplines, that process begins with a simple hypothesis.
Figure 8 - Big data Viability
Viability
HypothesisLong-termValidation to determine
if the data will have a meaningful impact rewards and better
outcomes from hidden relationships in data
“Can we use mobile phone data
to monitor cross-border
tourism?”
Relevance and feasibility
Figure 7 - Big data Veracity
Veracity Establishing trust in data
1 in 3 Uncertainty
business leaders don’t trust the information they use
due to inconsistency, ambiguity, latency and approximation
VeracityA fourth challenge of big data is linked to the veracity of data. This refers to the trustworthiness of the data24 Data might not be trusted as it is less controllable to manage quality and accuracy. An example often mentioned is the fact that social media data only taking into account a part of the population that is rapidly expanding causing time series issues. Machine data might be missing data due to technical failures. Human generated data relies on the quality of entry. With some types of big data, quality and accuracy are less controllable.
Analysis on big data needs to take this into account. Sometimes the mere volume makes up for the lack of quality or accuracy. For instance, social media is able to provide more data and more regular data than survey could provide.
A recent study suggest that executives confronted with too much information can be overwhelmed and trust gut and a more innate approach to decision-making.25
25. https://www.gyro.com/onlyhuman/ - Only human: the emotional logic of business decisions (2014)
16

ValueLast but not least deriving value out of big data is what matters most. Big data is generated more frequently, in increasingly larger amounts and stored in many different types of source systems. Deriving valuable insights from the selection of most relevant data sources is essential for governments to leverage this data in various steps of the policy lifecycle.
The effect however is limited if all of this does not contribute to the way people generate ideas, make decisions and follow-up on them.
Public organizations motivated to get insights using the possibilities of big data will be confronted with these challenges.
VelocityFrequency of data generation
Value Return on investment
Velocity + + + + =Volume Variety Veracity Viability Value
Volume The growth ofworld data
VarietyStructured andunstructured data -types of Big Data
Veracity Establishing trust
in data
300 hours
4,170,000posts liked
2,400,000search queries
of video uploaded to YouTube every minute (estimate)
per minute on Google
on Facebook per minute
what is a
zettabyte1,000,000,000,000 gigabytes
1,000,000,000 terabytes
1,000,000 petabytes
1,000 exabytes
0
5
10
15
20
25
30
35
2005 2010 2015 2020
1 in 3
Uncertainty
business leaders don’t trust the information they use
due to inconsistency, ambiguity, latency and approximation
Risk of simply creating Big Costs without creating the value
Viability Relevance and feasibility
Hypothesis
Long-term
Validation to determine if the data will have a meaningful impact
rewards and better outcomes from hidden relationships in data
“Can we use mobile phone
data to monitor
cross-border tourism?”
1 terabyte holds the equivalent of roughly 210 single sided DVDs.
Web andsocial media
Machine tomachine
Big transactiondata
Biometric
Human-generated
CostsSophisticated queries, counterintuitive insights and unique learning
Insights
Figure 9 – Getting value out of big data
17

Types of data and data sources
The drawing above describes different types of big data in terms of variety: web and social media, machine to machine, big transaction data, biometric, human-generated.
The big data landscape is however evolving continuously and technology in this field advances rapidly. As a result there have been many attempts to categorise in a comprehensive way the various sources and types of big data. The United Nations Economic Commission for Europe (UNECE)26 statistical division is coordinating some work of statistical offices with respect to big data and has introduced a task team on big data. The UNECE big data task team has put forward three main categories of big data27:
■ Social Networks (human-sourced information): “this information is the record of human experiences, previously recorded in books and works of art, and later in photographs, audio and video”. Today, this “human sourced data” is almost entirely digitised and stored everywhere from personal computers to social networks. The main characteristic of this type of data is that it is ungoverned and very loosely structured. This category includes: social networks, blogs and comments, personal documents, pictures, videos, internet searches, mobile content (e.g. text messages), emails, etc.
■ Traditional Business systems (process-mediated data): Processes record and monitor business
events of interest, such as registering a customer, manufacturing a product, taking an order, etc. This process-mediated data includes mostly traditional business data (generated and processed through the use of IT solutions in both operational and business intelligence (BI) systems). This data is highly structured and includes transactions, reference tables and relationships, as well as the metadata that sets its context. This type of data is generally stored in relational databases, often as administrative data. This category includes data produced by businesses (commercial transactions, banking/stock records, e-commerce, etc.) and public agencies (e.g. medical records)
■ Internet of Things (machine-generated data): this emerging type of big data is linked to the phenomenal growth in the number of sensors and machines used to measure and record the events and situations in the physical world. This machine generated data is well structured, rapid (often real time) and large in volume. With the proliferation of sensors this is becoming an increasingly important component of the information stored and processed by many organisations and suitable for computer processing. Examples of machine generated data include data from sensors, both fixed (e.g. home automation, weather/pollution sensors, traffic sensors/webcam, scientific sensors, security/surveillance videos/images) and mobile (mobile phone location, cars, satellite images), as well as data from computer systems (logs and web logs).
26. We have used this organisation as one of the case studies in this report.27. http://www1.unece.org/stat/platform/display/bigdata/Classification+of+Types+of+Big+Data
18
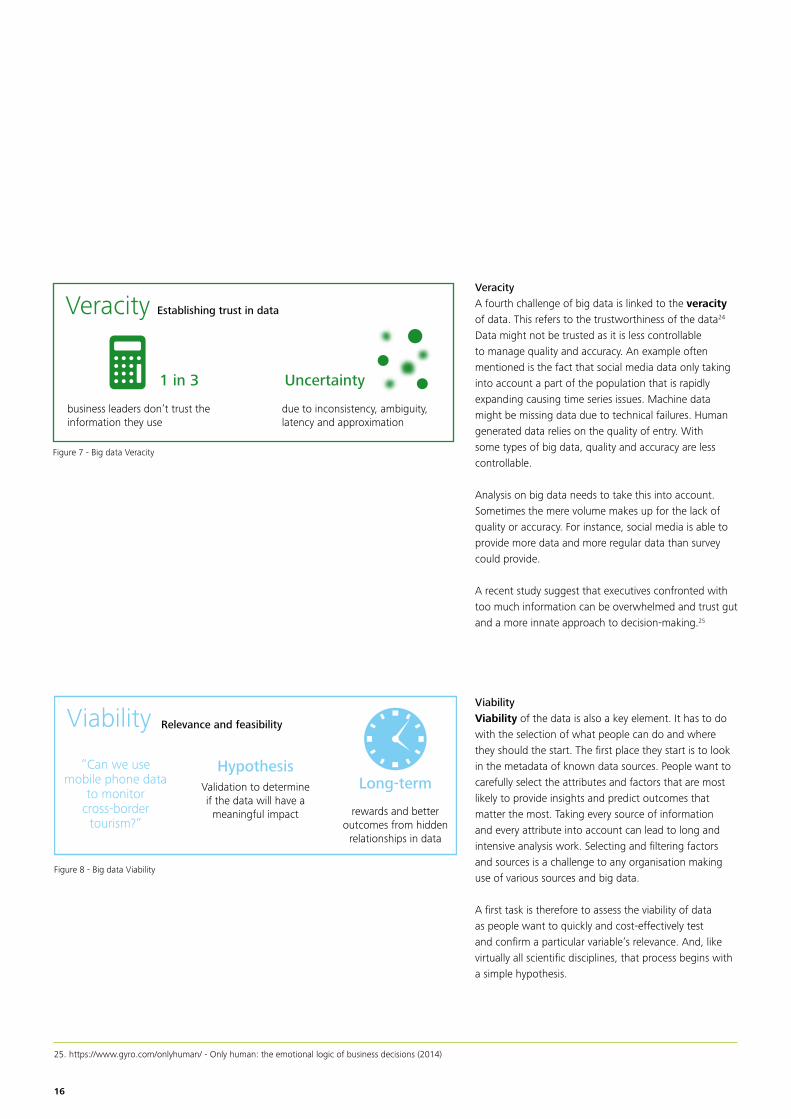
In addition, the UNECE big data quality task team has put forward a framework for the quality of big data including a taxonomy that distinguishes: sensors/meters and activity records from electronic devices, social interactions, business transactions, electronic files and broadcasting28.
EUROSTAT is also working on big data and taxonomies. This fits into the work of the European Statistical System (ESS)29 on how big data can transform the work and the role of statistical offices around the world. The ESS members signed a memorandum where they: ■ Acknowledge that big data represents new
opportunities and challenges for official statistics;
■ Encourage the European Statistical System and its partners to effectively examine the potential of big data sources;
■ Agree on the importance of following up the implementation of this memorandum by adopting an ESS action plan and roadmap by mid-201430.
The roadmap includes a reflection on the key data sources for statistical offices and how to explore the possibilities linked to them. Based on the macro categories of sources, pilots were developed on specific types of data. The roadmap defines data sources into five main categories (as shown in Figure 6).31
Figure 10 – EUROSTAT Big data pilots: sources of big data32
28. A Suggested Framework for the Quality of big data (2014), UNECE Big Data Quality Task Team. See: http://www1.unece.org/stat/platform/download/attachments/108102944/Big%20Data%20Quality%20Framework%20-%20final-%20Jan08-2015.pdf?version=1&modificationDate=1420725063663&api=v2
29. The ESS is the partnership between the Statistical authority of the Union, which is the Commission (Eurostat), and the national statistical institutes (NSIs) and other national authorities responsible in each Member State for the development, production and dissemination of European statistics
30. Scheveningen Memorandum on “Big Data and Official Statistics” adopted by the ESSC (2013). See: http://www.cros-portal.eu/news/scheveningen-memorandum-big-data-and-official-statistics-adopted-essc .
31. Official Statistics in the Age of Big Data, SaS forum Benelux 2014, Michail Skaliotis and Albrecht Wirthmann. See: http://www.sas.com/content/dam/SAS/en_be/doc/other2/sas-forum-belux-2014/Eurostat.pdf
32. http://www.sas.com/content/dam/SAS/en_be/doc/other2/sas-forum-belux-2014/Eurostat.pdf
19
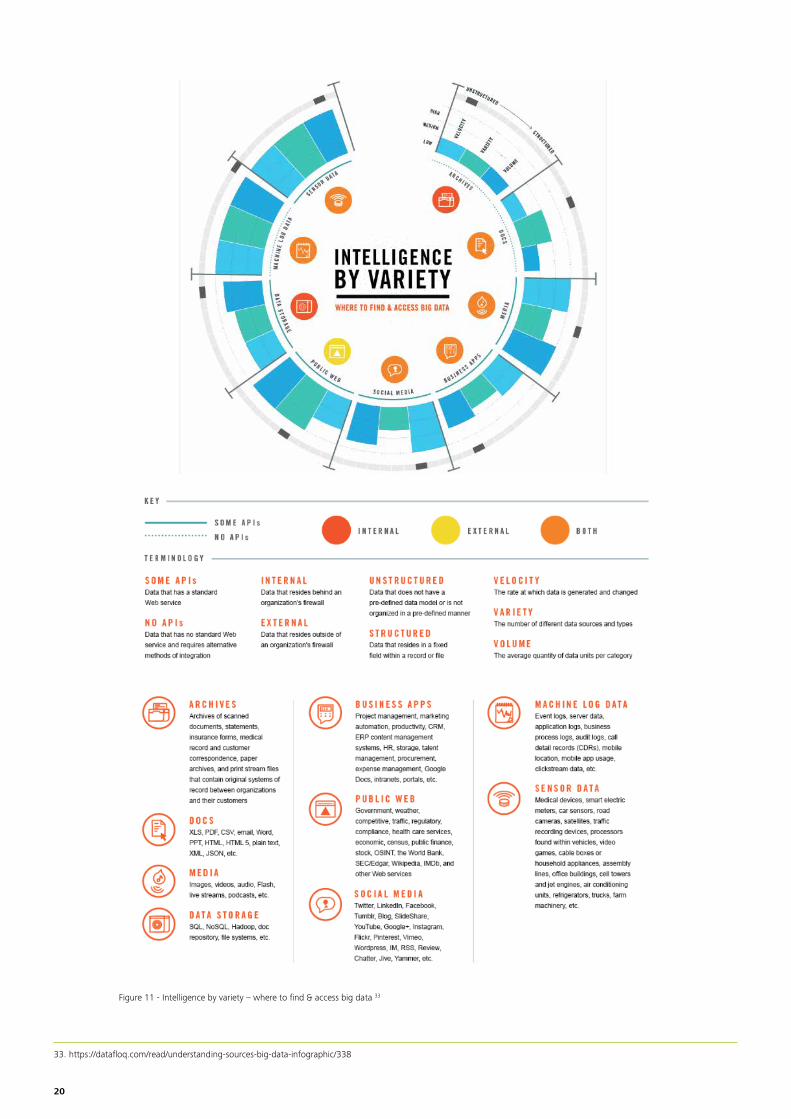
Figure 11 - Intelligence by variety – where to find & access big data 33
33. https://datafloq.com/read/understanding-sources-big-data-infographic/338
20
Various categorisations and definitions show commonalities in terms of the sources and types of data. However, some differences remain in the number of macro categories and the way they are grouped.
An interesting drawing of Datafloq34 brings together a lot of the big data concepts in one overview. It is presented in Figure 6 en 7 below and combines several relevant axes to classify: ■ Who typically owns this type of data? Do
organisations have to look for this type of data within their own assets (internal), externally or both?
■ To what extent different types are characterized by high velocity, big variety or high volume?
■ Is this data often structured or unstructured?
■ Will it be possible to find relevant application programming interfaces (API) or web services to integrate the data or not?
■ To which of the following categories data links the most: human generated (public web, social media), machine generated (machine log or sensor data) or process-generated types (business apps)?
■ In which formats or systems can data be stored: archives, docs, media, and data storage systems?
Overall the multiple categorisations of types of big data, detailed above, provide a framework for understanding and grouping public sector initiatives in this area. They help in fine-tuning and motivating the selection of case studies and the creation of a semi-structured interview questionnaire for further analysis.
21
4.3. Data analytics refines the data to insights All types of data can provide valuable insights for public authorities provided they are analysed in the correct way, making use of solid analytical processes for the type of data, hypothesis and questions at hand. Due to the nature of big data described above, relevant technology is an important element to process the data and discover insights.
Analytics techniques facilitate the creation of insights in data and content. These techniques need to be able to answer increasingly complex questions. At a high level of abstraction such data analytics techniques are split into four main types: ■ Descriptive analytics: uses business
intelligence and basic statistics to ask “What has happened?” This kind of analysis describes the past using aggregated or detailed data. Tables and graphs visualisations can add to the speed of comprehension;
■ Diagnostic analytics: tries to analyse any phenomenon from various perspectives using data mining and correlation techniques to understand why things have happened. It places facts in a
context and tries to discover differences or evolution according to the context. Visualization is used to spot variances, outliers and changes over time;
■ Predictive analytics: uses statistical models and forecasting techniques to ask: “What will happen?” Predictive analytics uses calculations to predict future trends or events based on historical patterns in the data and estimates the likelihood;
■ Prescriptive analytics impacts actions by using various techniques, optimisation algorithms and simulation exercises to ask: “What should we do?” Prescriptive analytics embeds predictive models into operational solutions and decisions to enable decision support. It helps people (decision support) or systems (decision automation) to decide on the next best action.
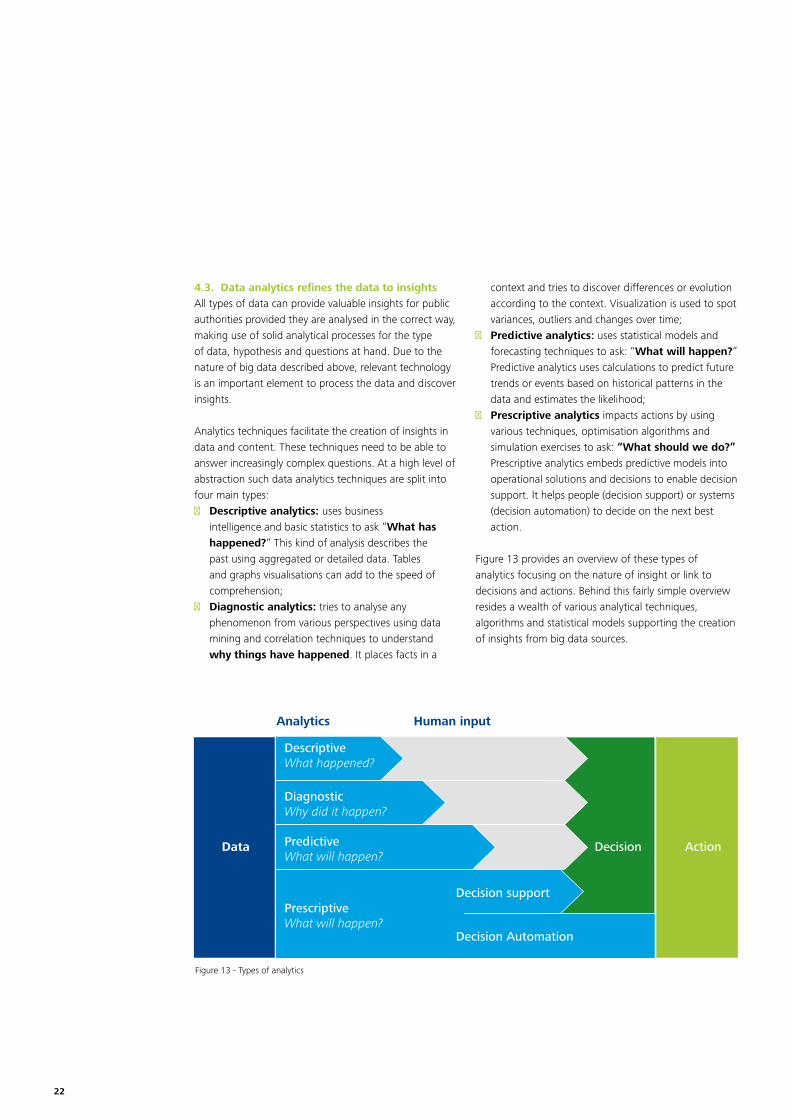
Figure 13 provides an overview of these types of analytics focusing on the nature of insight or link to decisions and actions. Behind this fairly simple overview resides a wealth of various analytical techniques, algorithms and statistical models supporting the creation of insights from big data sources.
Analytics
Data
DescriptiveWhat happened?
DiagnosticWhy did it happen?
PredictiveWhat will happen?
Decision support
Decision Action
Decision Automation
Human input
PrescriptiveWhat will happen?
Figure 13 - Types of analytics
22
In the course of this study it is impossible to explain and list all analytical possibilities due to the wide variety and complexity of some. Moreover, this is an area where scientific research is continuously evolving. It is however relevant to describe some of the linked research domains as they are feeding different possibilities in big data analytics: ■ Statistics is the study of how to collect, organize,
analyse and interpret numerical information from data. Traditionally it is concerned with analysing primary data that have been collected to check specific hypotheses (ideas). The subdiscipline of descriptive statistics involves methods of organizing, summarizing and picturing information from data. It deals with the study of uncertainty and with the study of decision making in the face of uncertainty.
■ Data mining is a discipline based on the computational process to discover previously unknown, interesting patterns in large data sets such as groups of similar data records (clusters), unusual records (anomaly detection), and dependencies (association). The goal is to extract information from a data set and transform it into an understandable structure. It is typically concerned with analysing secondary data that have been collected for other reasons. Not only structured data can be analysed, similar techniques are used for unstructured data. Text mining is a well-known technique in this area. Datamining procedures could be either unsupervised
(we do not know the answer and try to discover it) or supervised (we know the answer and see if we can predict it
■ Machine learning is about solutions that give computers the ability to learn without being explicitly programmed. It is about algorithms that can extract information automatically without online human guidance. The algorithms allow to learn from and make predictions on data. The emphasis is often on prototyping those algorithms for production mode and the design of systems that update themselves automatically.
■ Artificial intelligence is linked to machines using cutting-edge techniques to competently perform or mimic cognitive functions that we intuitively associate with human minds, such as reasoning, knowledge, planning, learning, natural language processing and problem solving.
Typically data scientists possess the skills to select one or a combination of relevant techniques from all these disciplines according to the desired insights and the nature of the data. Technology vendors are specializing in certain areas of expertise or trying to overcome the complexity by providing solutions that guide the user in selecting the most appropriate model or the possibility to test and combine various models to provide enriched insights.
23
4.4. Technical architecture and related challengesConfronted with the challenges of big data and related analytics, organisations need multiple technical solutions and deciding on the combination and best ones to use is becoming increasingly complex. Governments need to develop strategies on how to address the options and related challenges.
4.4.1. Traditional business intelligence architecture is no longer sufficient to deal with big data
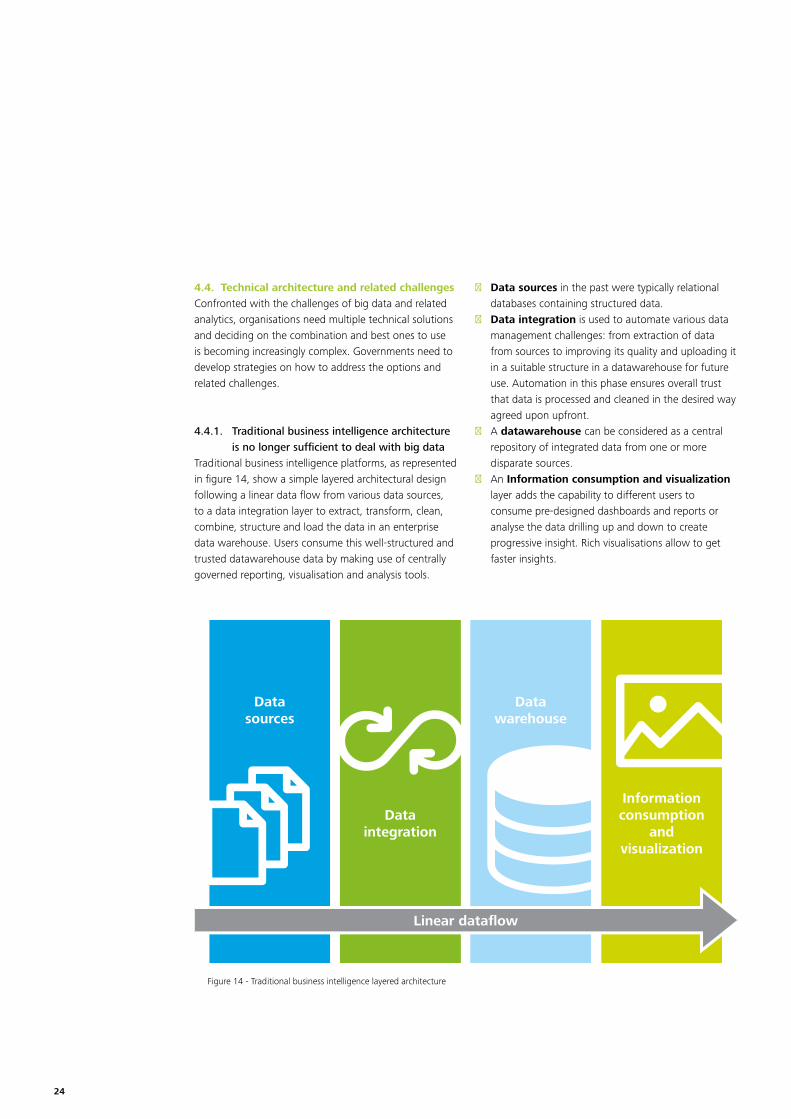
Traditional business intelligence platforms, as represented in figure 14, show a simple layered architectural design following a linear data flow from various data sources, to a data integration layer to extract, transform, clean, combine, structure and load the data in an enterprise data warehouse. Users consume this well-structured and trusted datawarehouse data by making use of centrally governed reporting, visualisation and analysis tools.
■ Data sources in the past were typically relational databases containing structured data.
■ Data integration is used to automate various data management challenges: from extraction of data from sources to improving its quality and uploading it in a suitable structure in a datawarehouse for future use. Automation in this phase ensures overall trust that data is processed and cleaned in the desired way agreed upon upfront.
■ A datawarehouse can be considered as a central repository of integrated data from one or more disparate sources.
■ An Information consumption and visualization layer adds the capability to different users to consume pre-designed dashboards and reports or analyse the data drilling up and down to create progressive insight. Rich visualisations allow to get faster insights.
Figure 14 - Traditional business intelligence layered architecture
Datasources
Dataintegration
Datawarehouse
Linear dataflow
Informationconsumption
andvisualization
24
This model is no longer feasible when confronted with big data. A conceptual big data analytics architecture as shown in figure 12 has to cope with the challenges linked to the different characteristics of big data: velocity, volume, variety, veracity, viability and value. To reply to these various needs a conceptual architecture with a bit more zones is emerging. ■ It still has a zone for data sources. In a big data era
this contains a wider picture of various internal and external sources as described in the previous chapter.
■ The mere volume and size of data sources is too big to invest in pre-structuring and organizing all relevant data. Data is enhanced and enriched only when needed for specific analysis. One needs to be able to store potential relevant data in a landing zone in order not to lose anything. This landing zone does not require data to be pre-structured. It just allows to store data that might be relevant to use in a near future.
■ At some point, organisations might want to optimize the cost for historical data that is no longer of use but that needs to be kept for various reasons as compliance etc. Cheap storage is the only thing that matters here in an archiving zone.
■ Due to the viability, big data analytics environments need a discovery or sandbox zone. This is the playground for data scientists where they support business to find value in the big pool of available data, allowing early prototyping and testing. Due to
the variety it calls for different analysis tools for both structured and unstructured data.
■ To industrialize or create permanent value with analytics, data engineers will setup structural processes to process data on a regular base into models or analysis defined by data analysts and scientists. It relates to the process of data integration resulting in a traditional business intelligence datawarehouse. The purpose is linked to a level of governance and the need to structure information for standard users.
■ To deal with streaming and high velocity data, a zone for event processing needs to be added to boost analytics capabilities at a time when real time insight is at a premium.
■ And last but not least the conceptual architecture needs a governed consumption zone for data science, visualisation and analytical solutions. Today an analytical process starts with discovery, and data science then materialises the analytics and optimally visualises it in solutions for business. Acting upon insights and impacting decisions requires the availability of information to and involvement of various users. They need to trust the data while the type of processing is less intuitive. They might need input from data scientists to read and interpret any results. This often results in an integration challenge to incorporate advanced analytical insights in user-friendly and intuitive solutions or apps.
25

An architecture for big data analytics needs to be imagined from the viewpoint of a few new concerns: ■ Analysis and investigation is inspired, informed and
enabled by a vast and ever-evolving ecosystem of internal, openly available and third-party data and the demands and expectations of senior leadership are being driven by these capabilities.
■ Linear data movements are no longer enough. Predictive models are developed based on a blend of structured and unstructured feeds and these then need to flow into the wider organisation to support front-end applications or to drive analytics and reporting.
■ Traditional reporting architectures retain the confidence derived from tight control of enterprise data, but lack the ready flexibility required to meet these emerging expectations.
Looking at the different challenges and nature of big data, the following characteristics are key in building a solid big data analytics technical architecture: ■ Core strength lies in the availability of consistent
sources of reliable data that is governed, secured and structured in balance with the expected value of data management efforts;
■ Responsive: the architecture needs to support a complex network of internal and external data flows of which some might require real time processing
■ Scalable: solutions need to allow deep-dive analytics across large, divers and rapidly expanding data sets resulting in a need for available computing power and storage;
■ Flexible: It needs to be capable to evolve with changing needs, available data, improving technology and relevancy of insights.
Datasources Data
landing
Archiving
Event processing
IntegratedDWH
Discoveryplatform
Informationconsumptiondata mining,visualisation,
analyticaltools and
apps
Figure 15 - Conceptual big data architecture
26
4.4.2. Many vendors and solutions complement the scattered landscape
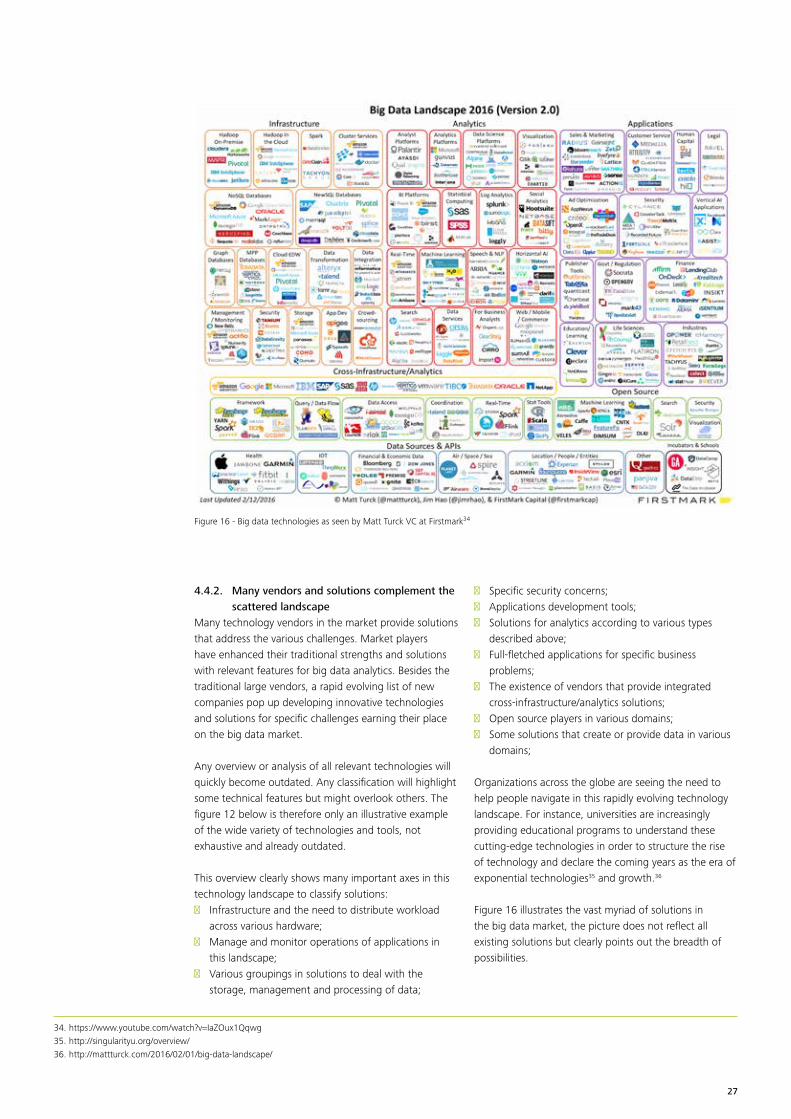
Many technology vendors in the market provide solutions that address the various challenges. Market players have enhanced their traditional strengths and solutions with relevant features for big data analytics. Besides the traditional large vendors, a rapid evolving list of new companies pop up developing innovative technologies and solutions for specific challenges earning their place on the big data market.
Any overview or analysis of all relevant technologies will quickly become outdated. Any classification will highlight some technical features but might overlook others. The figure 12 below is therefore only an illustrative example of the wide variety of technologies and tools, not exhaustive and already outdated.
This overview clearly shows many important axes in this technology landscape to classify solutions: ■ Infrastructure and the need to distribute workload
across various hardware; ■ Manage and monitor operations of applications in
this landscape; ■ Various groupings in solutions to deal with the
storage, management and processing of data;
■ Specific security concerns; ■ Applications development tools; ■ Solutions for analytics according to various types
described above; ■ Full-fletched applications for specific business
problems; ■ The existence of vendors that provide integrated
cross-infrastructure/analytics solutions; ■ Open source players in various domains; ■ Some solutions that create or provide data in various
domains;
Organizations across the globe are seeing the need to help people navigate in this rapidly evolving technology landscape. For instance, universities are increasingly providing educational programs to understand these cutting-edge technologies in order to structure the rise of technology and declare the coming years as the era of exponential technologies35 and growth.36
Figure 16 illustrates the vast myriad of solutions in the big data market, the picture does not reflect all existing solutions but clearly points out the breadth of possibilities.
Figure 16 - Big data technologies as seen by Matt Turck VC at Firstmark34
34. https://www.youtube.com/watch?v=IaZOux1Qqwg35. http://singularityu.org/overview/ 36. http://mattturck.com/2016/02/01/big-data-landscape/
27

28
5. Methodology and cases
Data collection ShortlistPreliminaryassessment
More than 100identified cases
20 selectedcases
20 selectedcases
10 backupcases
Secondaryassessment
Selected casesfor in-depth
analysis
Figure 17: Data collection and selection approach
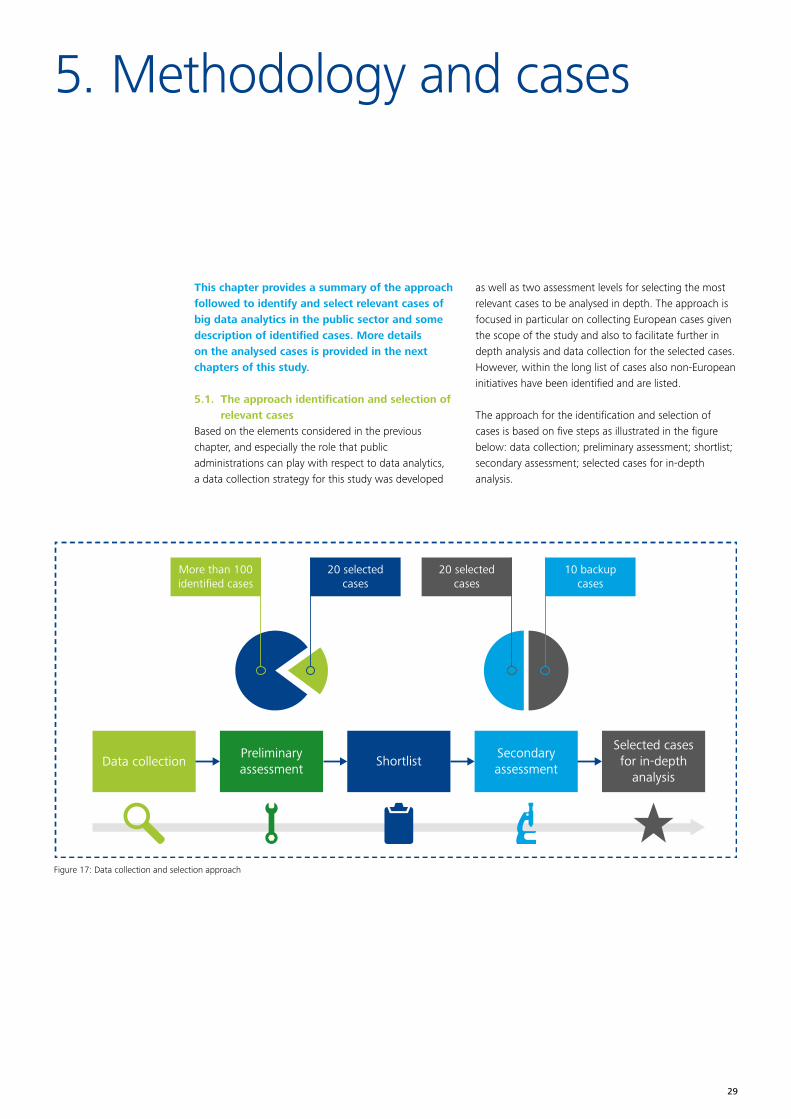
This chapter provides a summary of the approach followed to identify and select relevant cases of big data analytics in the public sector and some description of identified cases. More details on the analysed cases is provided in the next chapters of this study.
5.1. The approach identification and selection of relevant cases
Based on the elements considered in the previous chapter, and especially the role that public administrations can play with respect to data analytics, a data collection strategy for this study was developed
as well as two assessment levels for selecting the most relevant cases to be analysed in depth. The approach is focused in particular on collecting European cases given the scope of the study and also to facilitate further in depth analysis and data collection for the selected cases. However, within the long list of cases also non-European initiatives have been identified and are listed.
The approach for the identification and selection of cases is based on five steps as illustrated in the figure below: data collection; preliminary assessment; shortlist; secondary assessment; selected cases for in-depth analysis.
29
At the data collection stage more than 100 cases were identified in a long list37. The long list is added to the report in Annex 1. The long list includes a wide variety of cases, covering different stages of the policy lifecycle, at different levels of government, across different policy domains38. A couple of statistics on these cases can be found in annex 2.
From this, a shortlist of cases is identified including the most interesting initiatives that are candidates for further assessment. The final result is the top ten of cases to analyse in-depth through interviews and further desk research, as well as a number of “back up” cases if only limited data can be gathered for a specific case. The selected backup cases have similar characteristics as the ones on the short list but may differ in terms of their level of experience and maturity in the use of data analytics.
This five steps approach allows filtering out the most interesting cases that can bring an added value to the core questions of this assignment. The two-step approach aims to ensure a sufficient spread across geographical scope and other key characteristics (including level of government, domain and types of data and analytics).
The tailored data collection strategy is based on the most effective tools for reaching out to key stakeholders in the public sector as well as the identification of key sources of information in order to obtain the largest amount of cases possible. For this the use of existing networks, direct contact with key stakeholders and multipliers (including vendors and existing initiatives), desk research and ongoing studies allow for triangulation of different sources that resulted in the identification of over 100 cases.
The second step consists of a preliminary assessment of all cases to identify those that are most relevant for the purpose of this study. The long list of cases includes five main categories of initiatives: more general eGovernment initiatives, studies (university research and feasibility studies), open data portals, applied cases and training. The focus for this study is on the cases where data analytics has actually been applied as well as training within this domain given their practical relevance to the use of data analytics by public administrations. In addition, the selection of the most relevant cases among the applied cases and trainings ones is based on the five criteria aimed at ensuring sufficient coverage of the following key elements: ■ Policy domain: focusing on different policy domains
including social policies, transport, research policies, security policies, justice and home affairs, health etc.;
■ Level of government: focusing on supranational (e.g. European, United Nations, OECD), national, regional and local initiatives;
■ Country: focusing on a geographical spread of European countries;
■ Type of data sources: focusing on different types of data business apps, public web, social media, machine log, sensor;
■ Type of analytics: focusing on different types of analytics including descriptive, predictive or prescriptive.39
The principle applied for selection across these five criteria is to have a balanced selection across each of them. Based on this, a short list of cases is identified for further investigation.
37. We identified 103 cases in total38. See Annex 2 for statistics on the characteristics of the cases39. Not all online information of the gathered cases allowed to distinguish between the various types of analytics used. We however tried to select cases in a way to have a variety
in this matter. Information on the techniques used allows to select with the gaol of lessons learnt in different challenges.
30

These shortlisted cases are subjected to a secondary assessment based on a typology of services public authorities might need or can offer each other in a greater government network. As this study fits within the ISA program and links to interoperability, it is important to include cases that can provide interesting information on different types of collaboration. This principle of collaboration also counts within organisations where different departments work together and help each other. The following types of services have been used in this secondary assessment: insight, advisory, enabling and production services
5.1.1. Insight Services The first data analytics service a governmental agency or department can provide or receive is showing the benefits and possibilities of data analytics. Because of the new and innovative nature of this topic the goal is to provide insights on effective value and inspiration to other organizations, thus motivating them to embark on their analytics journey.
Within organisations this is quite often done by means of proof of concepts or pilots. They test the possibility to provide actionable insights, they inspire. The more governments share their real life cases or experiences in their innovation campaigns, the more they provide insights to others
Advisory ServicesA second role that can be played is an advisory one. These services include the communication of standards and guidelines to provide best practices to different stakeholders for the delivery of analysis. Providing a central pool of analytics experts into business areas to support more complex data analysis.
The goals of these service is to give advice and guidance to organisations that are unsure about how to take the next steps in their analytics journey
Enabling ServicesThe following service is all about enabling organisations that want to concretise their data analytics plans but do not have the means to do so. They can reach out to governmental organisations which could provide
Insight ServicesShowing benefits and possibilities of Data analytics
to other institutions and bodies.
The art of the possible.
Advisory ServicesProviding guidance and fostering collaboration.
We tell you how.
Enabling ServicesProviding key tools and resources for
Data Analytics.
We provide you with the means.
Production ServicesProducing Data Analytics on behalf of other
institutions and bodies.
We do it for you.
them with funding, skilled people, relevant data and appropriate technology tools and infrastructure.
Production services The last service that an organisation can provide in this typology is a production one. Executing this role public organisations deliver and support ready-made solutions others can benefit from.
The purpose of this study is to offer public administrations best practices and lessons learnt on various challenges related to big data analytics. The methodology applied considers the collaboration between governmental agencies and within public authorities relevant and has foreseen to include a services model in the selection of cases.
Finally, the final selection of cases is based on an assessment of the accuracy of information available (e.g. quality and completeness of information) and maturity (e.g. in terms of years of experience and type/level of analytics applied) for each case as shown in the figure below.
31
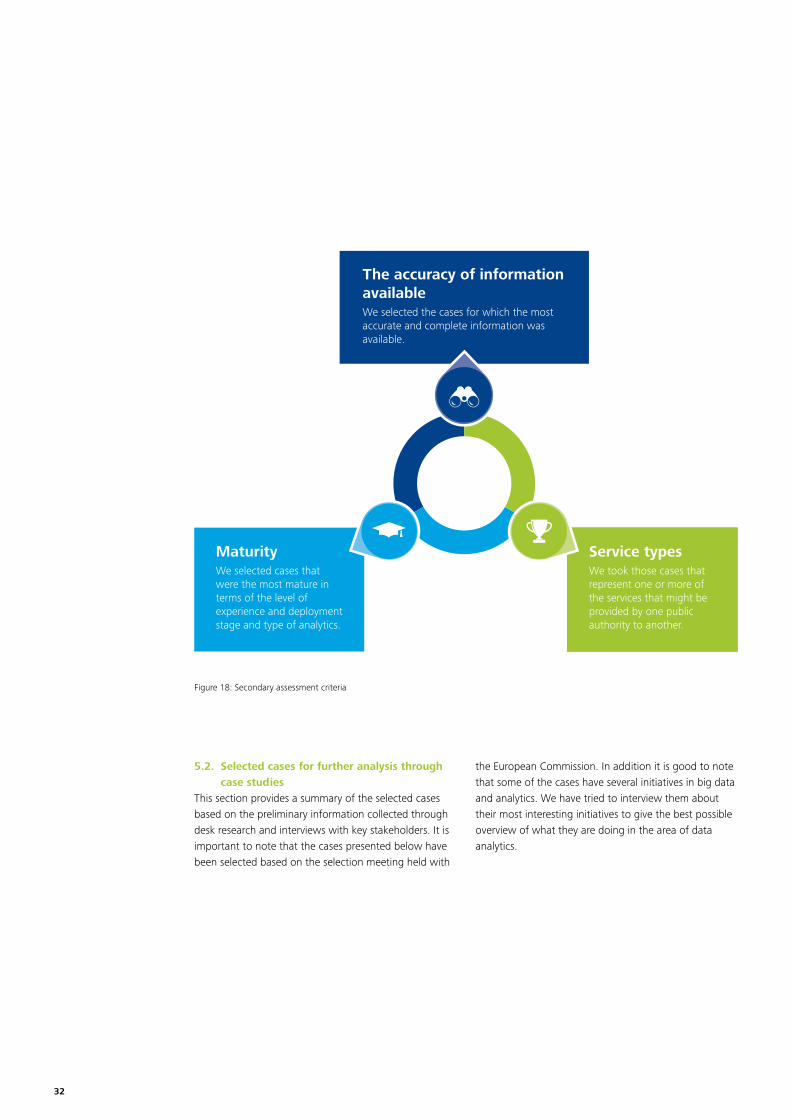
MaturityWe selected cases that were the most mature in terms of the level of experience and deployment stage and type of analytics.
Service typesWe took those cases that represent one or more of the services that might be provided by one public authority to another.
The accuracy of informationavailableWe selected the cases for which the most accurate and complete information was available.
Figure 18: Secondary assessment criteria
5.2. Selected cases for further analysis through case studies
This section provides a summary of the selected cases based on the preliminary information collected through desk research and interviews with key stakeholders. It is important to note that the cases presented below have been selected based on the selection meeting held with
the European Commission. In addition it is good to note that some of the cases have several initiatives in big data and analytics. We have tried to interview them about their most interesting initiatives to give the best possible overview of what they are doing in the area of data analytics.
32
Case 1: UNECE Sandbox (The United Nations Economic Commission for Europe –UNECE)
The purpose of UNECE
The United Nations Economic Commission for Europe (UNECE) was set up in 1947 by ECOSOC. Its aim is to promote pan-European economic integration. To do so, it brings together 56 countries located in the European Union, non-EU Western and Eastern Europe, South-East Europe and Commonwealth of Independent States (CIS) and North America. All these countries dialogue and cooperate under the aegis of UNECE on economic and sectoral issues40.
As a multilateral platform, UNECE facilitates greater economic integration and cooperation among its member countries and promotes sustainable development and economic prosperity through:
■ Policy dialogue; ■Negotiation of international legal instruments; ■Development of regulations and norms; ■ Exchange and application of best practices as well as economic and technical expertise; ■ Technical cooperation for countries with economies in transition41.
The Big data Sandbox
One of UNECE’s activities within the framework of the exchange and application of best practices as well as economic and technical expertise is the working group on “Modernisation of Statistical Offices”. The High Level Group on MOS is responsible for deciding on the annual flagship international collaboration projects undertaken within the UNECE statistical modernization programme, as well as overseeing and providing strategic direction to the work programmes of its four member countries.
One of this collaboration project (Working Package 2 of the 2014 Working Programme) involved the creation of a big data sandbox developed in partnership with the Irish Central Statistical Office and the Irish Centre for High-End computing (ICHEC). The Sandbox involves more than 40 people from 20 countries. It also includes supranational organisations such as EUROSTAT, OECD, UNECE, and United Nation Statistics Division.
The following use cases were identified for the Sandbox: ■ Running experiments and pilots (eg. on Wikipedia, administrative trade data, social media
and web scraping data) ■ Testing ■ Training ■ Supporting the implementation of the Common Statistical Production Architecture ■Data hub
Until 2015 the funding model was based on a combination of voluntary financial contributions from organisations (CSO funding ICHEC for hardware), volunteering from partners (ICHEC staff working on the project) and project funding (UNECE paying consultancies for facilitation). From 2015 onwards a subscription based model will be adopted. More information on their research related to big data can be found online http://www1.unece.org/stat/platform/display/bigdata
40. http://www.unece.org/mission.html 41. Ibidem
33
Case 2: Statistics Netherlands’ approach to innovation and big data (Centraal Bureau voor Statistiek – CBS)
The purpose of CBS
Statistics Netherlands (CBS) is responsible for collecting and processing data in order to publish statistics to be used in practice, by policymakers and for scientific research. In addition to its responsibility for (official) national statistics, Statistics Netherlands also has the task of producing European (community) statistics42. CBS also participates in other supranational collaborative experiences such as the UNECE Sandbox.
The mission of Statistics Netherlands is to publish reliable and coherent statistical information that meets the needs of society. In view of this mission, the quality of the statistical information must be guaranteed43.
The information Statistics Netherlands publishes incorporates a multitude of societal aspects, from macro-economic indicators such as economic growth and consumer prices, to the incomes of individual people and households44. Since 2004, Statistics Netherlands is an autonomous agency with legal personality.
Statistics Netherlands’ approach to innovation and big data
In January 2012, Statistics Netherlands formally started its Innovation programme in order to accelerate innovation and thus facilitate dealing with trends such as, the high volatility of information and the increasing need for rapid, to-the-point and easily accessible information, the shift to mobile devices and the increasing importance of internet45.
Their innovation program is loosely organised in five priority areas: Data Collection Innovation, Efficient Processes, Output Innovation, Big Data, and IT Innovation.
In the last years CBS has been experimenting with the following Big data sources: ■ • Mobile phone data for mobility; ■ • Scanner data for consumer price index; ■ • Social Media (twitter) for sentiment analysis; ■ • Traffic loops data for traffic intensity statistics;
In order to prioritize well and focus on value, they have developed a phased approach. The innovation program foresees three phases: idea generation, proof of concept to test the value and implementation if previous processes have given enough proof of value.
Through this innovation program CBS gained a lot of experience in experimenting with alternative (big data) data sources and in assessing the value of these for statistical production purposes.
42. http://www.cbs.nl/en-GB/menu/organisatie/default.htm 43. http://www.cbs.nl/en-GB/menu/organisatie/kwaliteitsverklaring/default.htm 44. Ibidem45. Innovation at Statistics Netherlands, Barteld Braaksma, Nico Heerschap, Marco Roos and Marleen Verbruggen, 2012
34
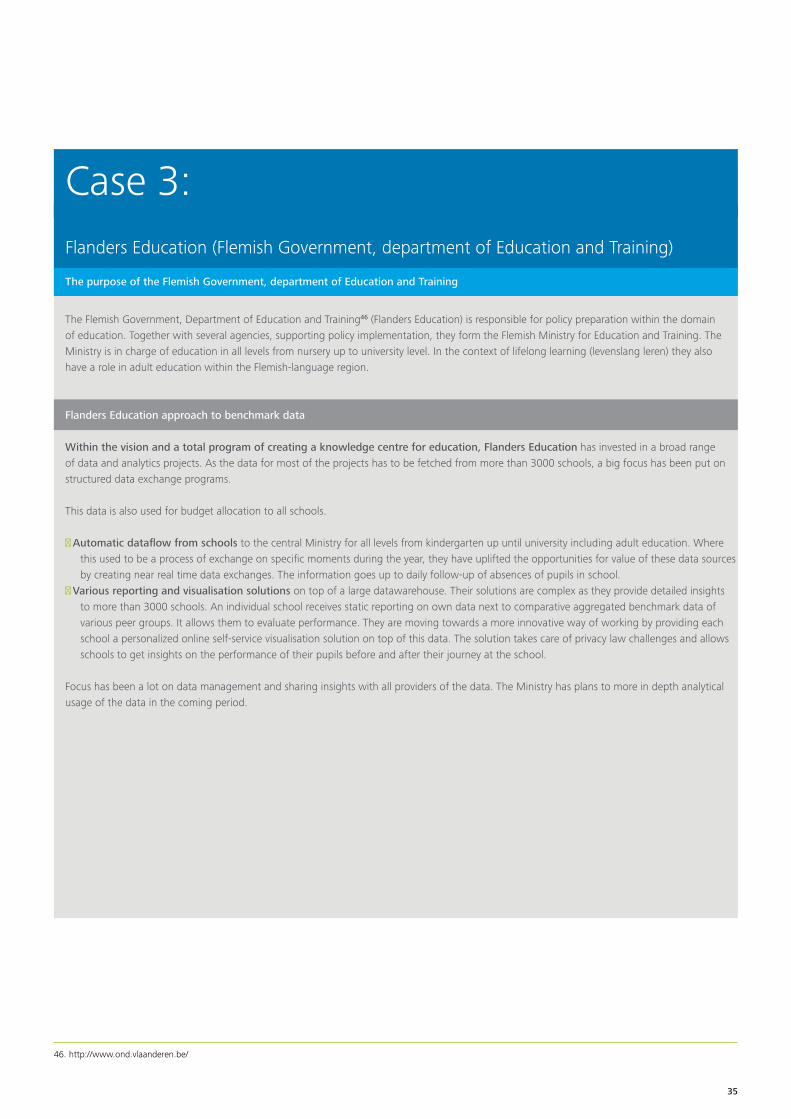
Case 3: Flanders Education (Flemish Government, department of Education and Training)
The purpose of the Flemish Government, department of Education and Training
The Flemish Government, Department of Education and Training46 (Flanders Education) is responsible for policy preparation within the domain of education. Together with several agencies, supporting policy implementation, they form the Flemish Ministry for Education and Training. The Ministry is in charge of education in all levels from nursery up to university level. In the context of lifelong learning (levenslang leren) they also have a role in adult education within the Flemish-language region.
Flanders Education approach to benchmark data
Within the vision and a total program of creating a knowledge centre for education, Flanders Education has invested in a broad range of data and analytics projects. As the data for most of the projects has to be fetched from more than 3000 schools, a big focus has been put on structured data exchange programs.
This data is also used for budget allocation to all schools.
■Automatic dataflow from schools to the central Ministry for all levels from kindergarten up until university including adult education. Where this used to be a process of exchange on specific moments during the year, they have uplifted the opportunities for value of these data sources by creating near real time data exchanges. The information goes up to daily follow-up of absences of pupils in school.
■Various reporting and visualisation solutions on top of a large datawarehouse. Their solutions are complex as they provide detailed insights to more than 3000 schools. An individual school receives static reporting on own data next to comparative aggregated benchmark data of various peer groups. It allows them to evaluate performance. They are moving towards a more innovative way of working by providing each school a personalized online self-service visualisation solution on top of this data. The solution takes care of privacy law challenges and allows schools to get insights on the performance of their pupils before and after their journey at the school.
Focus has been a lot on data management and sharing insights with all providers of the data. The Ministry has plans to more in depth analytical usage of the data in the coming period.
46. http://www.ond.vlaanderen.be/
35

Case 4: Scanner data for Consumer Index (Istituto nazionale di statistica - Istat)
The purpose of Istat
The Italian National Institute of Statistics is a public research organisation. It has been present in Italy since 1926, and is the main producer of official statistics in the service of citizens and policy-makers. It operates in complete independence and continuous interaction with the academic and scientific communities47.
The mission of the Italian National Institute of Statistics is to serve the community by producing and communicating high-quality statistical information, analyses and forecasts in complete independence and in accordance with the strictest ethical and professional principles and most up-to-date scientific standards, in order to develop detailed knowledge of Italy’s environmental, economic and social dimensions at various levels of geographical detail and to assist all members of society (citizens, administrators, etc.) in decision-making processes48.Istat is also part of the European Statistical System and the organisation participates to many international collaborative projects concerning modernisation of statistical offices.
Scanner data for Producing Consumer Price Statistics
Istat is working on a way of integrating scanner data in the production of Consumer Price Index. For producing CPI statistics data are normally collected through two surveys: the first one covers more than three quarters of the product basket and it is conducted by Municipal Offices of Statistics; the second one, relating to a little less than a quarter of the product basket, is carried out directly by Istat.
The objective of this project is to: use of scanner data from large retailers for replacing the traditional survey data collection.
In 2014 Istat reached an agreement with supermarkets and distribution chains for getting the scanner data needed for the production of statistics. The agreement includes a role for a data broker who collects the data and share it with Istat. The project went through a testing phase in 2015 and it will move to production phase in the current year.
47. http://www.istat.it/en/about-istat 48. Ibidem
36
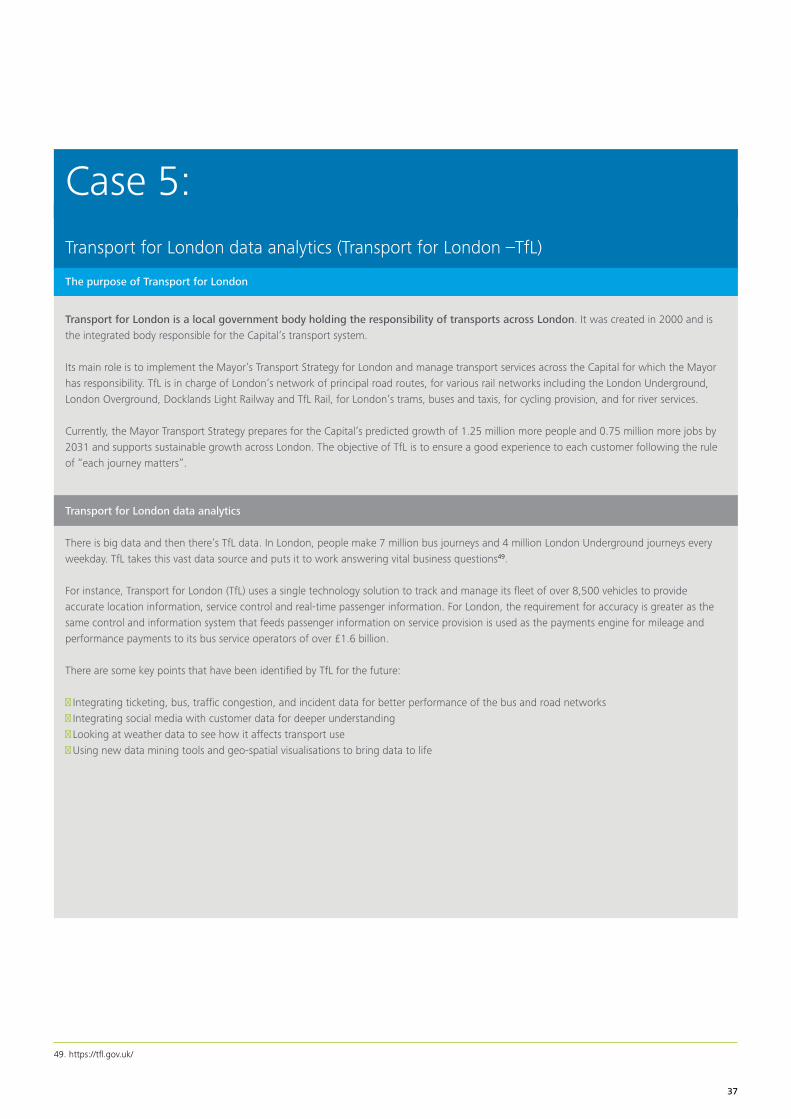
Case 5: Transport for London data analytics (Transport for London –TfL)
The purpose of Transport for London
Transport for London is a local government body holding the responsibility of transports across London. It was created in 2000 and is the integrated body responsible for the Capital’s transport system.
Its main role is to implement the Mayor’s Transport Strategy for London and manage transport services across the Capital for which the Mayor has responsibility. TfL is in charge of London’s network of principal road routes, for various rail networks including the London Underground, London Overground, Docklands Light Railway and TfL Rail, for London’s trams, buses and taxis, for cycling provision, and for river services.
Currently, the Mayor Transport Strategy prepares for the Capital’s predicted growth of 1.25 million more people and 0.75 million more jobs by 2031 and supports sustainable growth across London. The objective of TfL is to ensure a good experience to each customer following the rule of “each journey matters”.
Transport for London data analytics
There is big data and then there’s TfL data. In London, people make 7 million bus journeys and 4 million London Underground journeys every weekday. TfL takes this vast data source and puts it to work answering vital business questions49.
For instance, Transport for London (TfL) uses a single technology solution to track and manage its fleet of over 8,500 vehicles to provide accurate location information, service control and real-time passenger information. For London, the requirement for accuracy is greater as the same control and information system that feeds passenger information on service provision is used as the payments engine for mileage and performance payments to its bus service operators of over £1.6 billion.
There are some key points that have been identified by TfL for the future:
■ Integrating ticketing, bus, traffic congestion, and incident data for better performance of the bus and road networks ■ Integrating social media with customer data for deeper understanding ■ Looking at weather data to see how it affects transport use ■Using new data mining tools and geo-spatial visualisations to bring data to life
49. https://tfl.gov.uk/
37
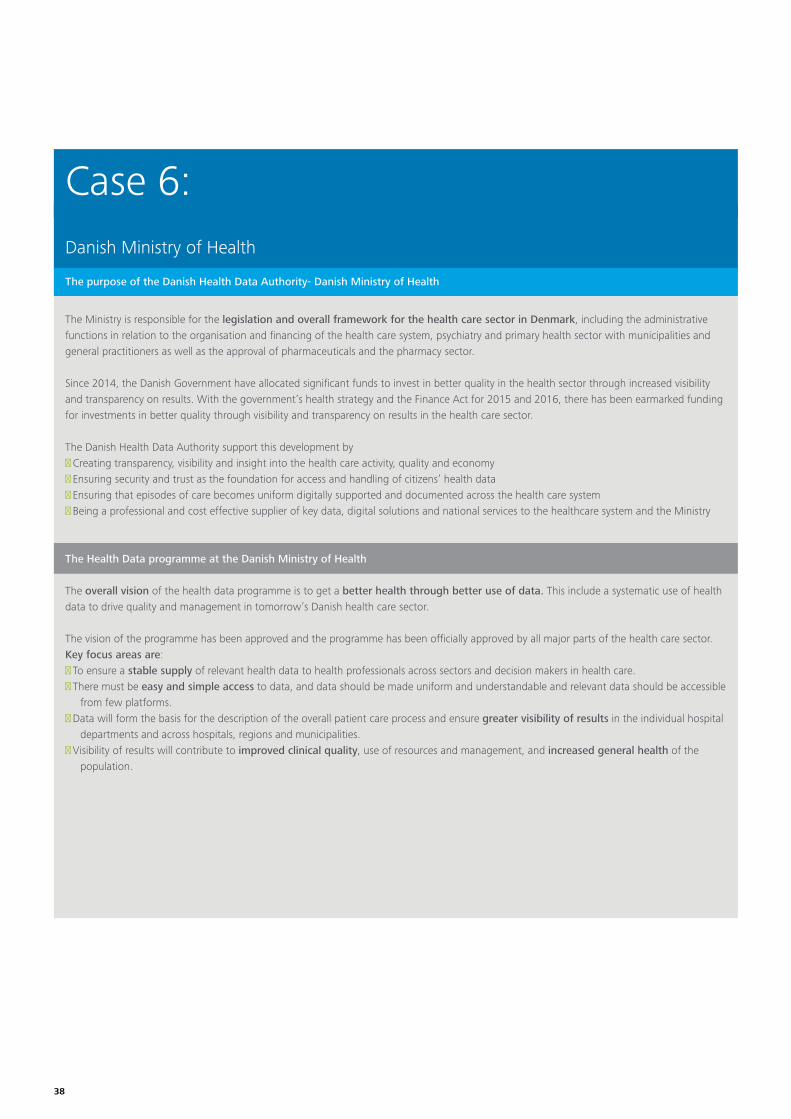
Case 6: Danish Ministry of Health
The purpose of the Danish Health Data Authority- Danish Ministry of Health
The Ministry is responsible for the legislation and overall framework for the health care sector in Denmark, including the administrative functions in relation to the organisation and financing of the health care system, psychiatry and primary health sector with municipalities and general practitioners as well as the approval of pharmaceuticals and the pharmacy sector.
Since 2014, the Danish Government have allocated significant funds to invest in better quality in the health sector through increased visibility and transparency on results. With the government’s health strategy and the Finance Act for 2015 and 2016, there has been earmarked funding for investments in better quality through visibility and transparency on results in the health care sector.
The Danish Health Data Authority support this development by ■Creating transparency, visibility and insight into the health care activity, quality and economy ■ Ensuring security and trust as the foundation for access and handling of citizens’ health data ■ Ensuring that episodes of care becomes uniform digitally supported and documented across the health care system ■ Being a professional and cost effective supplier of key data, digital solutions and national services to the healthcare system and the Ministry
The Health Data programme at the Danish Ministry of Health
The overall vision of the health data programme is to get a better health through better use of data. This include a systematic use of health data to drive quality and management in tomorrow’s Danish health care sector.
The vision of the programme has been approved and the programme has been officially approved by all major parts of the health care sector. Key focus areas are: ■ To ensure a stable supply of relevant health data to health professionals across sectors and decision makers in health care. ■ There must be easy and simple access to data, and data should be made uniform and understandable and relevant data should be accessible
from few platforms. ■Data will form the basis for the description of the overall patient care process and ensure greater visibility of results in the individual hospital
departments and across hospitals, regions and municipalities. ■Visibility of results will contribute to improved clinical quality, use of resources and management, and increased general health of the
population.
38
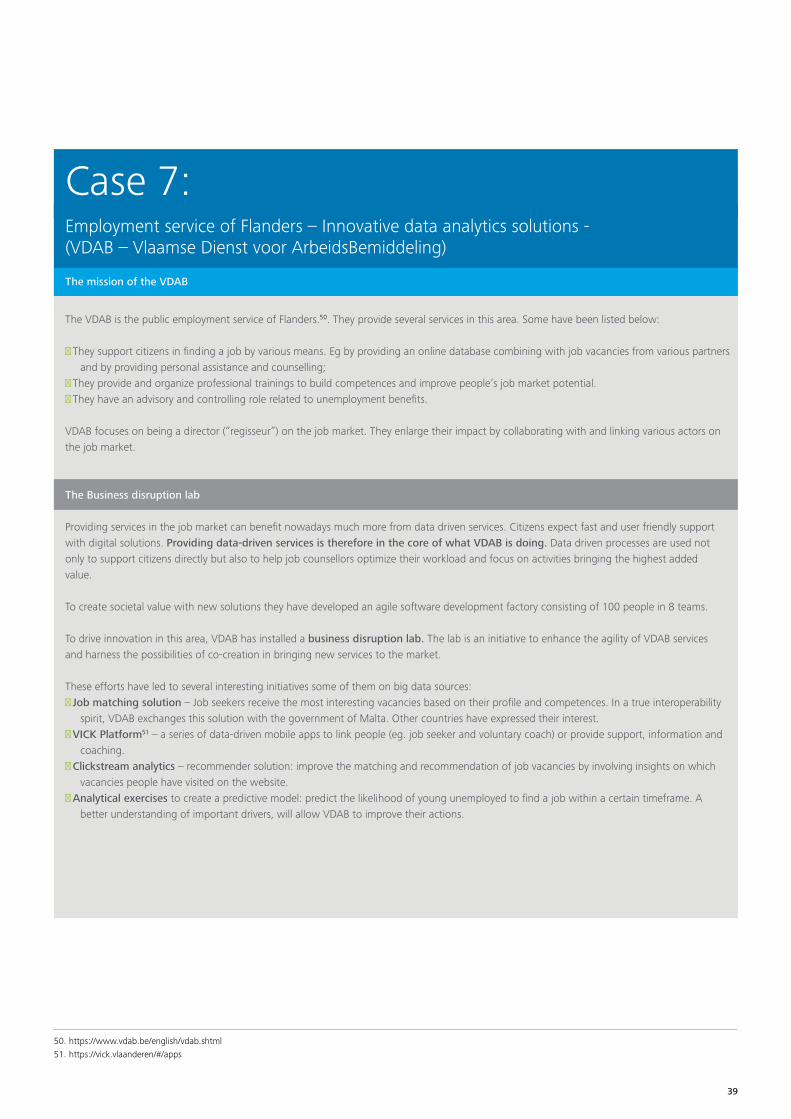
Case 7: Employment service of Flanders – Innovative data analytics solutions - (VDAB – Vlaamse Dienst voor ArbeidsBemiddeling)
The mission of the VDAB
The VDAB is the public employment service of Flanders.50. They provide several services in this area. Some have been listed below:
■ They support citizens in finding a job by various means. Eg by providing an online database combining with job vacancies from various partners and by providing personal assistance and counselling;
■ They provide and organize professional trainings to build competences and improve people’s job market potential. ■ They have an advisory and controlling role related to unemployment benefits.
VDAB focuses on being a director (“regisseur”) on the job market. They enlarge their impact by collaborating with and linking various actors on the job market.
The Business disruption lab
Providing services in the job market can benefit nowadays much more from data driven services. Citizens expect fast and user friendly support with digital solutions. Providing data-driven services is therefore in the core of what VDAB is doing. Data driven processes are used not only to support citizens directly but also to help job counsellors optimize their workload and focus on activities bringing the highest added value.
To create societal value with new solutions they have developed an agile software development factory consisting of 100 people in 8 teams.
To drive innovation in this area, VDAB has installed a business disruption lab. The lab is an initiative to enhance the agility of VDAB services and harness the possibilities of co-creation in bringing new services to the market.
These efforts have led to several interesting initiatives some of them on big data sources: ■ Job matching solution – Job seekers receive the most interesting vacancies based on their profile and competences. In a true interoperability
spirit, VDAB exchanges this solution with the government of Malta. Other countries have expressed their interest. ■VICK Platform51 – a series of data-driven mobile apps to link people (eg. job seeker and voluntary coach) or provide support, information and
coaching. ■Clickstream analytics – recommender solution: improve the matching and recommendation of job vacancies by involving insights on which
vacancies people have visited on the website. ■Analytical exercises to create a predictive model: predict the likelihood of young unemployed to find a job within a certain timeframe. A
better understanding of important drivers, will allow VDAB to improve their actions.
50. https://www.vdab.be/english/vdab.shtml51. https://vick.vlaanderen/#/apps
39
Case 8: Lithuanian Customs Analytics – (Lithuanian Customs)
The purpose of Lithuanian Customs
The Customs System of the Republic of Lithuania comprises the Customs Department under the Ministry of Finance of the Republic of Lithuania, Customs Criminal Service, Customs Training Centre, Customs Laboratory, Customs Information System Centre and three territorial Customs offices (Vilnius, Kaunas, and Klaipėda).
The mission of the Lithuanian Customs is to protect the society, market, environment and financial interests of Lithuania and the European Union (EU) from damage done by illegal international trafficking by creating favourable conditions for legal trade52.
On performing the surveillance of the Community international trade, the Lithuanian Customs contributes to ensuring the promotion of honest and open trade, protection of the internal market of the Republic of Lithuania, security of all supply chain53.
Fraud Analytics at Lithuanian Customs
The Criminal department of the Lithuanian Customs deployed an advanced analytics solution that uses highly accurate prediction models to sort through enormous volumes of customs-related data and profile which types of activities have the greatest probability of corresponding with illegal or fraudulent operations. For instance, having established specific criteria associated with cross-border contraband shipments, the solution provides customs officials with timely intelligence they can use to determine whether to search a truck’s cargo.
There is a strong international collaboration linked to this project. The Criminal department of Lithuanian Customs considered very useful to organise an affinity group with the purpose to exchange successful experience in detecting of violation by using data mining, to discuss in detail new models, solved issues, possible joint activities with intention to create a permanent international dataminers work group.
This group has 14 participant Member States plus honoured guests from DG TAXUD, JRC-Ispra, VU MIF, OLAF, and Europol. The group was funded partially by DG TAXUD.
52. http://www.cust.lt/web/guest/apiemus/lm#en 53. Ibidem
40
Case 9: Estonian tax and customs (Eesti Maksu- ja tolliametile –EMTA)
The purpose of the Estonian tax and customs board
EMTA (Eesti Maksu- ja tolliametile) is the Estonian Tax and Customs Board. The area of activity of the Estonian Tax and Customs Board includes administration of state revenues, implementation of national taxation and customs policies and protection of the society and legal economic activities54. The journey towards data analytics started back in 2004 on Management requests. Starting with a pilot, now they optimised their work through data analytics and achieved significant results in terms of costs reduction. The use of data analytics within EMTA is now also driven by the Estonian Government strategy on this matter which promotes further and further big data take up across administrations.
At European level, EMTA is collaborating on customs subjects with the European Commission within the framework of customs working groups, one of them being the one created by the Lithuanian Customs Authority on data analytics.
The Estonian customs analytics project
EMTA uses big data and data analytics technology for fraud detection and evaluation purposes. Through data analytics they redefined their strategy towards identification of cases to verify. They moved from an unstructured approach to this case selection towards a data based methods driven by an algorithm identifying risk coefficient for each case with the overall objective of increasing tax compliance and prevent fraud. For this purpose EMTA analyses a large amount of structured data coming from government sources mainly such as business register and tax declarations.
EMTA management is nowadays also taking decisions on the organisation’s activities based on big data mainly.
54. http://www.emta.ee/eng/contacts-and-about-us/structure-tasks-strategy-board/introduction-and-structure
41
Case 10: UK National Archives –Big Data for Law
The purpose of The National Archives
The National Archives is the official archive and publisher for the UK government55. They are a centre of expertise in every aspect of creating, storing, using and managing official information. They are a non-ministerial department of the Department for Culture, Media and Sport. As the official government archive for England, Wales and the United Kingdom, they hold over 1,000 years of the nation’s records for everyone to discover and use. They work with 250 government and public sector bodies, helping them to manage and use information more effectively.
The Big Data for Law project
The National Archives has received ‘big data’ funding from the Arts and Humanities Research Council (AHRC) to deliver the ‘Big Data for Law’ project. Just over £550,000 will enable the project to transform how we understand and use current legislation, delivering a new service – legislation.gov.uk56.
All users of legislation are confronted by the volume of legislation, its piecemeal structure, frequent amendments, and the interaction of the statute book with common law and European law. Not surprisingly, many find the law difficult to understand and comply with. The vision for this project is to address that gap by providing a new Legislation Data Research Infrastructure Specifically tailored to researchers’ needs. There are three main areas the project has focussed on: ■Understanding researchers’ needs: to ensure the service is based on evidenced need, capabilities and limitations, putting big data
technologies in the hands of non-technical researchers for the first time. ■Deriving new open data from closed data: by transforming data that could primarily not be made available. ■ Pattern language for legislation: to find new ways of codifying and modelling the architecture of the statute book to make it easier to
research its entirety using big data technologies. This might lead to a common vocabulary between the users of legislation and legislative drafters, to identifying useful and effective drafting practices and solutions that deliver good law.
55. http://media.nationalarchives.gov.uk/index.php/big-ideas-big-data-for-law/56. http://www.legislation.gov.uk/
42
5.3. Hypothesis and approach for the interviewsIn a next step of the study, a data collection tool for in-depth analysis of the selected cases was developed. A two steps approach was chosen consisting of first a more detailed desk research to prepare for the second step of in-depth interviews with key stakeholders.
As said to prepare for interviews, in a first step, publicly available information of the selected cases was gathered and compiled into preparatory notes. The sources used in this phase have been added in Annex 3 and throughout the report as footnotes. The information collected through the additional desk research served both as input for the report as well as for preparing more customised questions for the interviews. This desk research helped to identify the relevant contacts to interview and further investigate the different cases.
During the second part interviews by phone or in person were planned with the key contacts previously identified. The interviews were conducted in a semi-structured way, meaning that there was a logic structure and sequence of subjects to cover. But the methodology offers the flexibility to follow the stream of thought of the interviewee to discuss the various topics and allows to zoom into topics not taken into account in the initial structure. The preparatory notes from desk research proved to be valuable input allowing to question more in depth on certain topics.
Building on Deloitte thought leadership and the desk research executed at the beginning of the project, five main subjects were included in the interview preparation. In each of them the topics on best practices and challenges were discussed:
■ Strategy: the strategy part of the interview guideline concerned the vision of the organisations in terms of data analytics, their vision for the future as well as the initial purpose linked to their data analytics initiatives;
■ People: this section of the interview relates to the type of skills organisations need and can dispose of in terms of data analytics, it emphasises on how people are combined in teams or organisational structures to obtain success as well as experiences in training and sourcing relevant skills.
■ Processes: this part of the interview guideline focuses on organisational processes that have put in place to improve the adoption of data analytics as well as the quality of related projects. It questions the way data analytics impacts their daily work or structural processes of the organisation.
■ Data: this part of the interview structure focuses on the kind of data that organisations have available or used for analytics. It gathers information on data acquisition or all types of data management
■ Technology: this section of the interview guideline concerns the different types of technology used and any lessons learnt related to technology acquisition or use.
We will present in the next chapter the best practices and lessons learnt following the same and above mentioned high level structure.
43

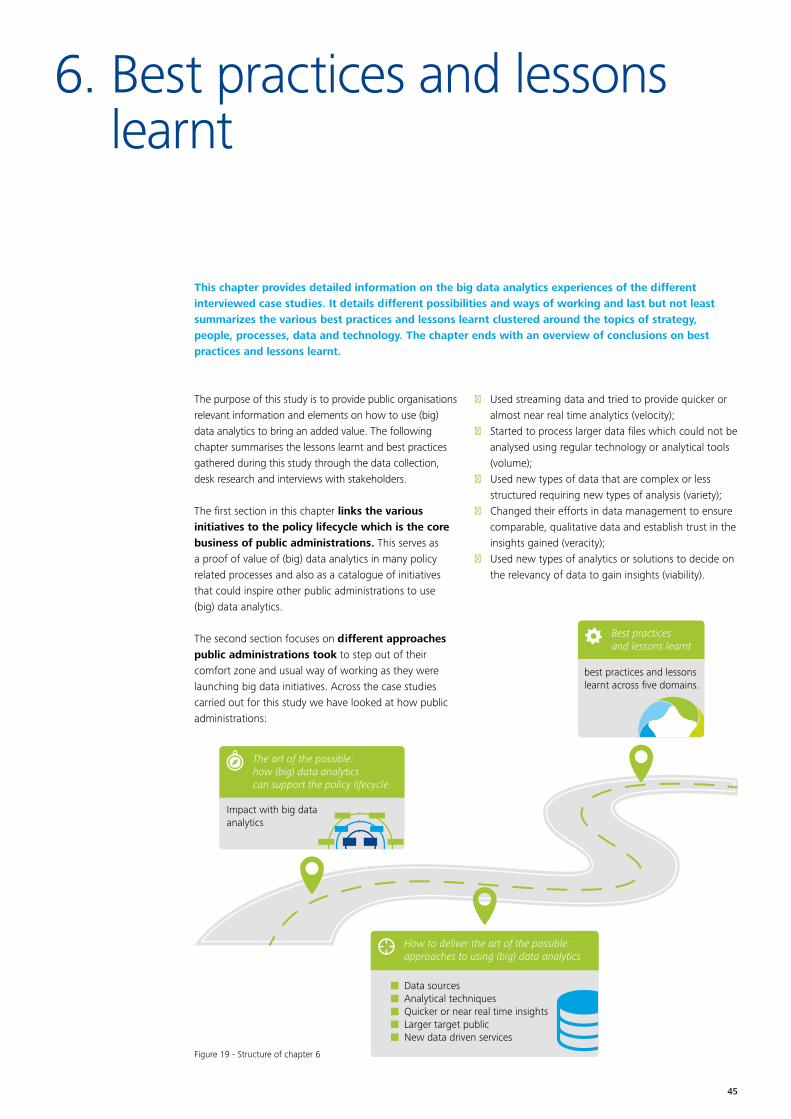
How to deliver the art of the possible:approaches to using (big) data analytics
Data sourcesAnalytical techniquesQuicker or near real time insightsLarger target publicNew data driven services
The art of the possible:how (big) data analyticscan support the policy lifecycle.
Impact with big data analytics
Best practicesand lessons learnt
best practices and lessonslearnt across five domains.
6. Best practices and lessons learnt
This chapter provides detailed information on the big data analytics experiences of the different interviewed case studies. It details different possibilities and ways of working and last but not least summarizes the various best practices and lessons learnt clustered around the topics of strategy, people, processes, data and technology. The chapter ends with an overview of conclusions on best practices and lessons learnt.
The purpose of this study is to provide public organisations relevant information and elements on how to use (big) data analytics to bring an added value. The following chapter summarises the lessons learnt and best practices gathered during this study through the data collection, desk research and interviews with stakeholders.
The first section in this chapter links the various initiatives to the policy lifecycle which is the core business of public administrations. This serves as a proof of value of (big) data analytics in many policy related processes and also as a catalogue of initiatives that could inspire other public administrations to use (big) data analytics.
The second section focuses on different approaches public administrations took to step out of their comfort zone and usual way of working as they were launching big data initiatives. Across the case studies carried out for this study we have looked at how public administrations:
■ Used streaming data and tried to provide quicker or almost near real time analytics (velocity);
■ Started to process larger data files which could not be analysed using regular technology or analytical tools (volume);
■ Used new types of data that are complex or less structured requiring new types of analysis (variety);
■ Changed their efforts in data management to ensure comparable, qualitative data and establish trust in the insights gained (veracity);
■ Used new types of analytics or solutions to decide on the relevancy of data to gain insights (viability).
Figure 19 - Structure of chapter 6
45
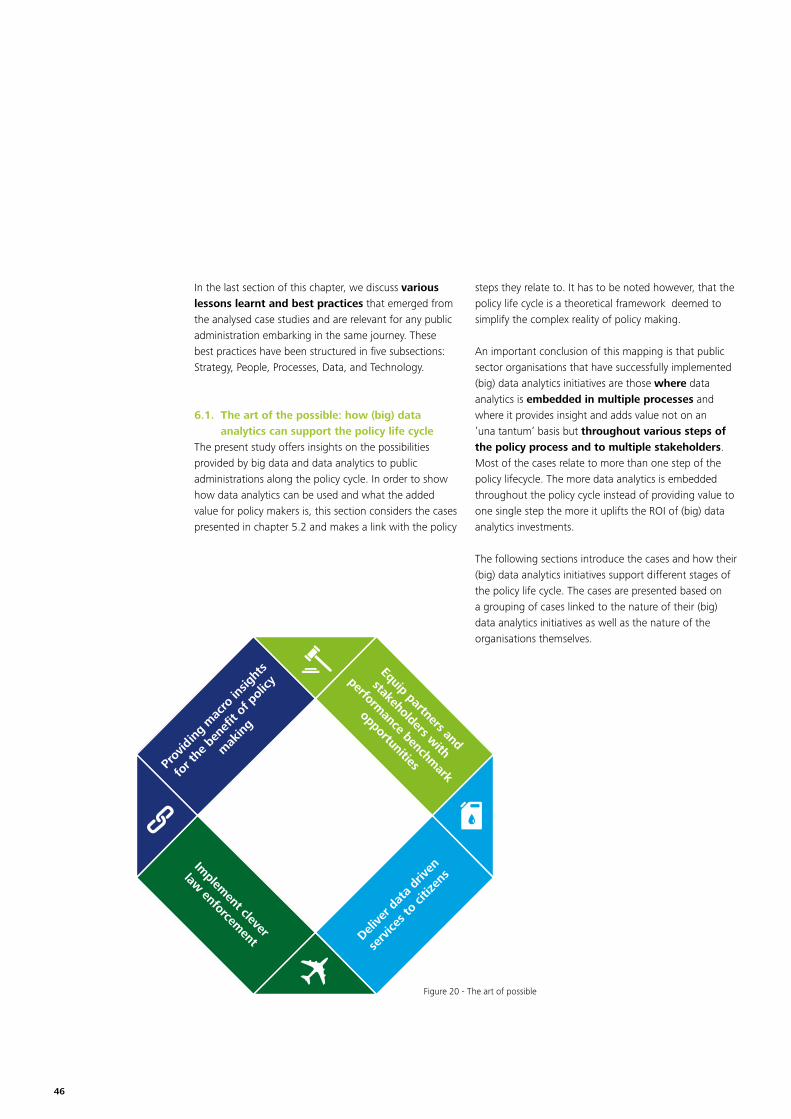
In the last section of this chapter, we discuss various lessons learnt and best practices that emerged from the analysed case studies and are relevant for any public administration embarking in the same journey. These best practices have been structured in five subsections: Strategy, People, Processes, Data, and Technology.
6.1. The art of the possible: how (big) data analytics can support the policy life cycle
The present study offers insights on the possibilities provided by big data and data analytics to public administrations along the policy cycle. In order to show how data analytics can be used and what the added value for policy makers is, this section considers the cases presented in chapter 5.2 and makes a link with the policy
Equip partners and
stakeholders with
performance benchm
ark
opportunitiesProv
idin
g m
acro
insig
hts
for t
he b
enefi
t of p
olicy
mak
ing
Implem
ent clever
law enforcem
ent Delive
r dat
a dr
iven
serv
ices t
o cit
izens
Figure 20 - The art of possible
steps they relate to. It has to be noted however, that the policy life cycle is a theoretical framework deemed to simplify the complex reality of policy making.
An important conclusion of this mapping is that public sector organisations that have successfully implemented (big) data analytics initiatives are those where data analytics is embedded in multiple processes and where it provides insight and adds value not on an ’una tantum‘ basis but throughout various steps of the policy process and to multiple stakeholders. Most of the cases relate to more than one step of the policy lifecycle. The more data analytics is embedded throughout the policy cycle instead of providing value to one single step the more it uplifts the ROI of (big) data analytics investments.
The following sections introduce the cases and how their (big) data analytics initiatives support different stages of the policy life cycle. The cases are presented based on a grouping of cases linked to the nature of their (big) data analytics initiatives as well as the nature of the organisations themselves.
46
6.1.1. Providing macro insights for the benefit of policy making
Three of the cases concern the use of (big) data analytics by statistical offices: CBS, Istat and UNECE. Statistical offices are traditionally important laboratories for data collection and analysis as these activities lie at the heart of their mission and rationale. They also have historically a strong link with all steps of the policy making cycle. Indeed, statistical offices provide to policy makers data that can feed into: ■ Policy planning: by providing an overview of the
current situation with respect to a policy area; ■ Policy adoption and design: by offering evidence on
the available options and the likely scenarios that can result from public intervention;
■ Policy implementation and application: by allowing to monitor the impact of policy intervention;
■ Policy evaluation and revision: by feeding into the final assessment of policies and their possible modifications.
This role of statistical offices as ‘data providers’ to policy makers can be strengthened by (big) data analytics techniques. Overall statistical offices are more and more using data analytics and big data to enhance their data analysis capacity and try new sources of data.
Istat for instance is working on investigating how big data and new sources of data can complement their official production of statistics. In particular, they started a project on the usage of scanner data for producing consumer price index statistics (CPI)57. The classical way of collecting data for creating CPI is through surveys at the local and central level. However, scanned data from large retailers can complement and substitute partially these traditional sources58. For this purpose Istat signed an agreement with the Association of Modern Distribution, the main representative of large scale retailers, that authorized a data broker (Nielsen) for the provision of price data. This new system of production
of consumer price index was tested in 2015 and 2016 and will be officially used from the beginning of 2017. . This enhanced way of producing statistics can provide policy makers with more and diverse data for planning, implementing and evaluating economic policies.
CBS is also experimenting with new sources of data and new ways of producing statistics. CBS clearly had the goal to gather the same societal data without impacting too much the government stakeholders like companies and citizens. The use of innovative big data sources can lower the red tape or administrative burden. They are particularly working on four areas related to big data: ■ Phone data for mobility: CBS has an agreement
with phone operator for the provision of phone data (through an intermediary company). This data is used to produce mobility statistics.
■ Consumer price index: similarly to Istat, CBS produces CPI statistics based on scanner data from large retailers. They are also investigating how to couple this with web scraping techniques for on line prices.
■ Social media consumer sentiment analysis: CBS is researching on how to use social media data, provided by a broker, for producing reliable consumer sentiment analysis.
■ Traffic intensity statistics: produced through traffic loop data.
As this list shows, there are many statistical domains in which big data and data analytics opportunities exist. Using new big data sources in this area however poses some threats for reliability and continuity of data series but can provide new evidence on certain or new phenomena. In all these cases, information coming from new sources serves policy makers by increasing the evidence they can rely on during the policy making process.
57. http://www1.unece.org/stat/platform/display/BDI/Italy+(Istat)+-+Use+of+scanner+data+for+consumer+price+index58. http://www.Istat.it/en/archive/36098#3
47
As part of the international collaboration between statistical offices, UNECE launched the big data sandbox initiative that provides a platform open for statistical offices to experiment with new techniques and data sources outside their regular production environment. The platform disposes of a storage environment where data from statistical offices can be uploaded59
and provides a selection of data analytics tools that statisticians can use. This sandbox fosters international cooperation resulting in an accelerated learning process. Each year the Sandbox participants select pilots to carry out. For 2015, these were the selected topics: ■ Wikistats - Wikipedia hourly page views: use of an
alternative data source; ■ Twitter - Social media data: compare experiences in
the collection and analysis of tweets; ■ Enterprise websites: the Web as data source - web
scraping and business registers; ■ Comtrade - UN global trade data: use of big data
tools on a traditional data source60
The results of these experiments are published to increase the knowledge of the statistical community on the potential of big data in these areas. The sandbox is not directly linked with the policy making cycle of the various domains as it does not provide immediate inputs for it. However, it does enhance the capacity of statistical offices to respond to policy makers’ needs through the take up of data analytics technologies. In this sense, the sandbox experiment, as for the experiences of CBS and Istat, encompasses more than one step of the policy life cycle. Moreover, those experiences could impact policies on big data.
The above described national statistical offices provide insights into a wealth of topics and have experimented with big data and data analytics. The National Archives of the UK have followed a similar path. They are the official archive and publisher for the UK government
and a centre of expertise in every aspect of creating, storing, using and managing official information. Their mission is to share data to the widest audience possible so creating an analytical solution on their big legislative archive database serves this purpose. Researchers or legislators wanting to analyse their vast legislative database, typically lack the possibility to access the raw data, do not have the right tools or know-how to undertake analysis across the whole dataset. Therefore they have created solutions to providing intelligent search and content analytics tailored to their audience61. For example, the potentially personally identifiable data about users and usage of legislation.gov.uk cannot be made available as open data but is perfect for processing using existing big data tools; eg to identify clusters in legislation or “recommendations” datasets of “people who read Act A or B also looked at Act Y or Z”.
They have invested in the concept of pattern languages A pattern language is a way to structure text in a certain format. The concept was created in the world of software development. As legislation often follows a similar structure, which allows to use the concept in the creation and analysis of legal texts. Applied to legislation, this might lead to a common vocabulary between the users of legislation and legislative drafters, to identifying useful and effective drafting practices and solutions that deliver good law.
This perfectly fits in the scope of policy design. At the same time, the analysis of UK legislation patterns also relates to policy evaluation and revision as it nourishes the debate on what is valuable and what has to be changed in a piece of legislation. Starting bottom up from a service to store and open non-privacy sensitive data, data analytics can uplift overall transparency and insights and feed the policy life cycle.
59. The Sandbox is not considered as a safe environment therefore no sensitive data are stored in it, also because of privacy rules that can vary from country to country. 60. http://www1.unece.org/stat/platform/display/bigdata/2015+project61. http://www.legislation.gov.uk/projects/big-data-for-law
48

6.1.2. Equip partners and stakeholders with performance benchmark opportunities
Flanders Education and the Danish Ministry of Health both provide benchmark services to a large community of stakeholders through data analytics solutions which are then used to feed insights in different steps of the policy life cycle.
In Flanders, a recent regional policy on education reinforces the principle of self-management by schools as a means to ensure quality of education62. The Flemish Ministry of Education supports this by providing self-service benchmark solutions to more than 3000 schools. This shows how data analytics applications support the overall policy objectives for qualitative education and the policy orientation is based on the availability of these. An initial project more than five years ago aimed at automating an operational process of preparing school inspector evaluations. After a multi-year program to reinforce a Flemish knowledge center on Education, it has led to the provision of self-service analysis tools serving policy design. In addition, Flanders Education uses the same data gathering process to support the practical process to allocate budgets to schools.
Flanders Education started back then with an optimisation of school evaluations (policy monitoring and evaluation) but the value of this extensive program has enlarged to policy planning, design and implementation.
A concrete topic where the knowledge center program is providing value is the problem of early school leavers63 which is high on the policy agenda.64/65 Previously carried out based on yearly macro research reports, today Flanders Education can monitor the topic closer. This monitor informs policy planning as an input for targeted interventions. This opportunity was a step up on the already available data in their data warehouse.
The ministry of Health in Denmark has a very similar experience as they built on the data from local and regional healthcare institutes to scale them up for decision making and to help with various policy steps. The Danish Minitry of Health collects and disseminates data on the Danish population’s health status and data on activity, economy and quality in health care. The basic idea behind the organization is “value chain” for changing data into information and to avoid silos66. Data is first shared back with the stakeholders who contributed to the collection and further with policy makers.
The Danish Ministry of Health uses these data to drive changes in healthcare treatment practices and defines policy options according to the available evidence67. As part of the Danish national transparency reform an agreement between government and regions was established to use healthcare data in a more active way for policy planning. This was a trigger for the health data programme of the Ministry of Health.
Both Flanders Education and the Danish Ministry of Health are examples of how collecting data for different purposes (monitoring and evaluation for instance) and then sharing them with both stakeholders and decision makers can help embeding data analytics in other policy processes.
6.1.3. Deliver data driven services to citizensWhat the analysed stories of Transport for London (TfL) and the public employment service of Flanders (VDAB) have in common is the fact that they provide data driven services directly to citizens. In these cases, they started bottom-up from core service delivery. Embedding analytics in core services or designing new data driven services allows to have an impact the actual behaviour and customer experience of citizens allowing them to
62. See: http://www.vlaanderen.be/nl/publicaties/detail/beleidsnota-2014-2019-onderwijs 63. Early school leaving is linked to unemployment, social exclusion, and poverty. There are many reasons why some young people give up education and training prematurely (no
longer obliged to attend school due to age and without a diploma of secondary education.64. http://www.ond.vlaanderen.be/secundair/Actieplan_Vroegtijdig_Schoolverlaten_def.pdf The EU2020 goal aims to lower the number of early school leavers to drop below 10%.
Flanders is aiming higher as they want to halve their current percentage meaning 4, 3% in 2020. 65. See: http://onderwijs.vlaanderen.be/nl/vroegtijdig-schoolverlaten-in-het-vlaams-secundair-onderwijs 66. http://www.cbs.dk/files/cbs.dk/report_workshop_29_november_aspects_of_big_data.pdf67. http://www.cbs.dk/files/cbs.dk/report_workshop_29_november_aspects_of_big_data.pdf
49
participate actively in policy implementation. Above that these solutions create data about actual behaviour and hold key information for decision makers at a higher level. Both cases provide value to multiple steps of the policy cycle.
Transport for London (TfL) has different teams for data analytics working each on different parts of TfL’s service delivery. There is a data analytics team for customer experience and one for operational maintenance of their infrastructure.
A couple of the services provided have to do with tailored communication (real time travel updates through various channels), optimization of schedules and transfer points, fixing solutions for unexpected events and delays, identify and solve major needs68. They even engage in revenue collection improvement as they allow automatic refunds if people have paid too much due to human or technical errors.
Even though TfL might have started with very practical purposes in mind (at the micro level serving single customers), they can provide input for overall new policy interventions at a higher strategic level like an optimization of the entire network or pricing policies69. Therefore, data used to improve the service to customers can be analysed to feed policy decisions on transport in London.
In Flanders, the Flemish public employment service (VDAB) launched several services to their target audience for which they use intelligent use of big data and analytics.70 ■ Job matching solution71 – The matching engine is
itself a rule-based solution with provides competence-oriented matching in a way it brings job seekers and job providers closer. This big data solutions is an in-memory database of 3 million search objects allowing up to 50 matching requests per second with
a response time of 17 to 20 milliseconds/matching search. The government of Malta is the first using the matching solution of VDAB and other countries are considering to do the same.
■ VDAB is also investing in analytics of website log data (clickstream) to use insights on online behaviour to improve the communication with their customers similar to the recommender systems behind commercial websites as Amazon or proactively inform employers with a previous search behaviour for certain profiles whenever people register with these skills.
■ In a recent collaboration, they investigated the potential of analytical models to predict the likelihood of young unemployed to find a job within a certain timeframe. Insights on these chances could help their organisation to tailor services. This project uses multiple data sources and analytics like text mining and survival analysis to browse through the unstructured reports written by job counsellors.
■ To provide data driven apps for young digital natives they have created the VICK Platform72 – this platform contains several data-driven apps to provide coaching and information via mobile apps to job seekers.
VDAB launched these projects to provide new services to its customers and to increase their satisfaction. However, by doing so, VDAB also collected many data on the labour market in Belgium, data that can be used as evidence for policy makers’ choices. VDAB also offers these data driven services to the government of Malta allowing to optimize the benefits of their investments in a solution for matching job vacancies and job seekers.
The experience of these cases underlines that data analytics experience started as initiatives for providing new or better services to citizens also have the potential to scale up and provide input into the policy life cycle overall.73
68. See: http://data.london.gov.uk/blog/improved-public-transport-for-london-thanks-to-big-data-and-the-internet-of-things/ 69. See for example, measurement of exit data based on Oyster card: http://2015.data-forum.eu/sites/default/files/1600-1640%20Weinstein_SEC.pdf 70. http://wapes.org/en/system/files/dotting_the_is_in_it_1.pdf71. https://www.vdab.be/doc/arbeidsmarkt_en.pdf72. https://vick.vlaanderen/#/apps73. See: https://www.vdab.be/doc/arbeidsmarkt_en.pdf Declaration of VDAB to a European Commissioner for Employment, Social Affairs, Skills and Labour Mobility
50
6.1.4. Implement clever law enforcement The Estonian and Lithuanian customs authorities are very good examples of data analytics techniques applied to the policy implementation phase. In these cases, data analytics is used for monitoring and to optimize the detection of frauds according to the rules adopted by policy makers. This is a daily activity of the competent authorities that is facilitated and enhanced by the use of data analytics, as it allows to control a well-chosen target group of cases providing an equal or even better result with a smaller amount of human and economic resources.
The Criminal department of the Lithuanian Customs for instance deployed an advanced analytics solution that uses highly accurate prediction models to sort through enormous volumes of customs-related data and profile which types of activities have the greatest probability of corresponding with illegal or fraudulent operations. For instance, having established specific criteria associated with cross-border contraband shipments, the solution provides customs officials with timely intelligence they can use to determine whether to search a truck’s cargo.
The Estonian customs work in a very similar way, by deploying data analytics solutions for the identification of likely fraud cases. The recourse to data analytics in Estonia is also due to a political decision to foster its take up across public administrations. Thanks to this data analytics initiative the Estonian Tax & Customs authority have reduced the number of people in the organisation substantially as they were able to optimize their working processes by involving innovative technology solutions.
There is a strong international collaboration linked to these projects. Both Lithuanian and Estonian customs support the practice to organize affinity groups with the goal to exchange successful experiences in datamining to detect law violations and to discuss in detail new analytical models.
They have the intention to create permanent international data miners work group. Moreover, cross-border criminal behaviour also motivates the collaboration on data level.
Fraud analytics is a very concrete application of big data analytics which offers huge opportunities for the efficiency and cost optimization of fraud detection in various domains: customs, taxations, social policies. Indeed, fraud analytics is a way of enhancing policy implementation.
6.1.5. ConclusionTo conclude, data analytics and big data not only fit perfectly into several steps of the policy making process but also have clear added value for the policy makers, especially when they are not an una tantum exercise but more a shift in approach towards a data analytics based policy making. To extract this added value however, some basic elements need to be in place. This is the subject of the next section.
51
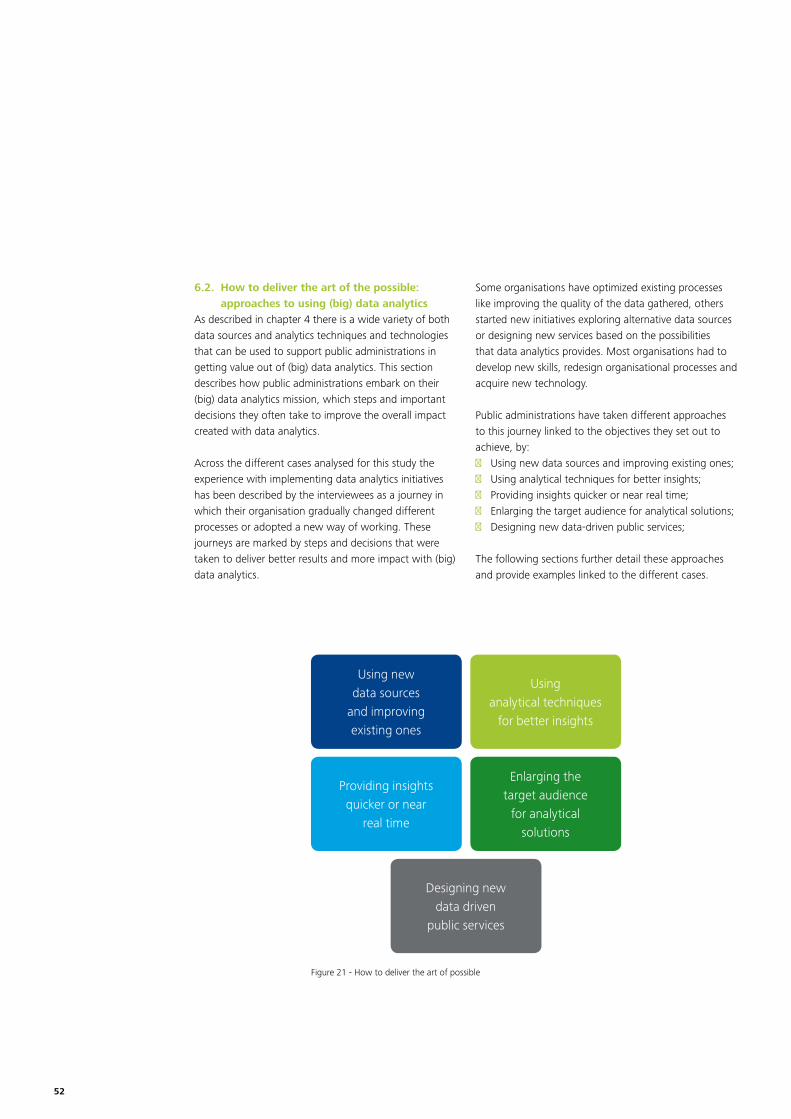
6.2. How to deliver the art of the possible: approaches to using (big) data analytics
As described in chapter 4 there is a wide variety of both data sources and analytics techniques and technologies that can be used to support public administrations in getting value out of (big) data analytics. This section describes how public administrations embark on their (big) data analytics mission, which steps and important decisions they often take to improve the overall impact created with data analytics.
Across the different cases analysed for this study the experience with implementing data analytics initiatives has been described by the interviewees as a journey in which their organisation gradually changed different processes or adopted a new way of working. These journeys are marked by steps and decisions that were taken to deliver better results and more impact with (big) data analytics.
Some organisations have optimized existing processes like improving the quality of the data gathered, others started new initiatives exploring alternative data sources or designing new services based on the possibilities that data analytics provides. Most organisations had to develop new skills, redesign organisational processes and acquire new technology.
Public administrations have taken different approaches to this journey linked to the objectives they set out to achieve, by: ■ Using new data sources and improving existing ones; ■ Using analytical techniques for better insights; ■ Providing insights quicker or near real time; ■ Enlarging the target audience for analytical solutions; ■ Designing new data-driven public services;
The following sections further detail these approaches and provide examples linked to the different cases.
Figure 21 - How to deliver the art of possible
Using new data sources
and improving existing ones
Providing insights quicker or near
real time
Using analytical techniques
for better insights
Enlarging the target audience
for analytical solutions
Designing new data driven
public services
52

6.2.1. Using new data sources and improving existing ones
All cases analysed, have used either entirely new data sources or have found ways to improve existing ones by optimizing the data gathered or combining multiple sources. In the cases, there are different examples of how new data sources have been used.
In some cases, external data is available or continuously being generated online. Such as in the pilot experiments carried out by UNECE on the use of Wikipedia data. They have tried to find a correlation between Wikipedia page views and tourism activity linked to UNESCO World Heritage Sites or Wiki-pages on cities and beaches. Similarly, the pilot on social media data used Twitter data to collect geo-located messages for mobility analysis to provide insights into e.g. domestic tourism (detection of origin of visitors), border mobility patterns, use of road networks and analysis of urban-rural systems. In addition, the pilot on data scraped from websites of enterprises aimed to create statistics on job vacancies. The CBS has also experimented with social media twitter data for sentiment analysis. This shows that there is value for public sector organisations in data being generated online and that they can be used for many purposes.
Automatically generated data may also come from other sources like sensors. The CBS, for example, is using traffic loops data in order to produce traffic intensity statistics.
Similarly, organisations may have a wealth of machine generated information available internally. TfL for example is using its own data collected from the use of the Oyster contactless card by travellers to gain insights into travel patterns for capacity planning, refunding customers automatically and provide key information on for example estimations of impacted travellers due to road/bridge closure. The VDAB tested its internal machine log data (clickstream generated by the log files of their website) to improve the recommendation of job vacancies by involving insights of page visits of people on their website.
Internal administrative information may also be used, as in the case of the Lithuanian customs that uses enormous volumes of customs-related data to detect illegal or fraudulent operations, as well as the pilot of UNECE that used customs declarations (part of administrative data) to analyse and visualize regional global value chains (focusing on trade in intermediate goods).
Such administrative data may also be found in other organisations and can be brought together and combined to gain new insights. The Danish Health Data Authority refers to the benefit of data that can be found across a number of unique registries (including the Civil Registration System, Danish National Registry of Patients, Danish Medical Birth Registry, Danish Cancer Registry, Danish Registry of Causes of Death, National Pathology Registry, Medicinal Product Statistics register, Healthcare cost database) that is now available centrally and can be combined for further analysis. Flanders Education is also capitalising on the wealth of information from over 3000 schools and has implemented structured data exchange programs to gather information across all levels of education. The Estonian customs also gets data from multiple sources such as business registers and tax administrations for fraud detection and evaluation purposes. Fraud investigators from both Estonia and Lithuania, also started exchanging data with other governments in their attempts to fight fraud.
In other cases, data may exist but is not readily available and more deliberate efforts need to be made in order to capture new data. This is the case for example for CBS who was able to negotiate with a private mobile phone operator to gain access to their mobile phone data for mobility and with supermarkets for their scanner data as a new data source for calculating the Consumer Price Index (CPI). Istat is also using scanner data from large retailers for its CPI statistics. Making agreements with external parties (including in some cases social media companies) is therefore another way to gain access to additional data that can bring an added value. In some initiatives public organisations work with intermediate data brokers like CBS did for mobile phone data and social media data and Istat for scanner data. In other cases they work directly with the parties creating the data like CBS did for supermarket data.
53
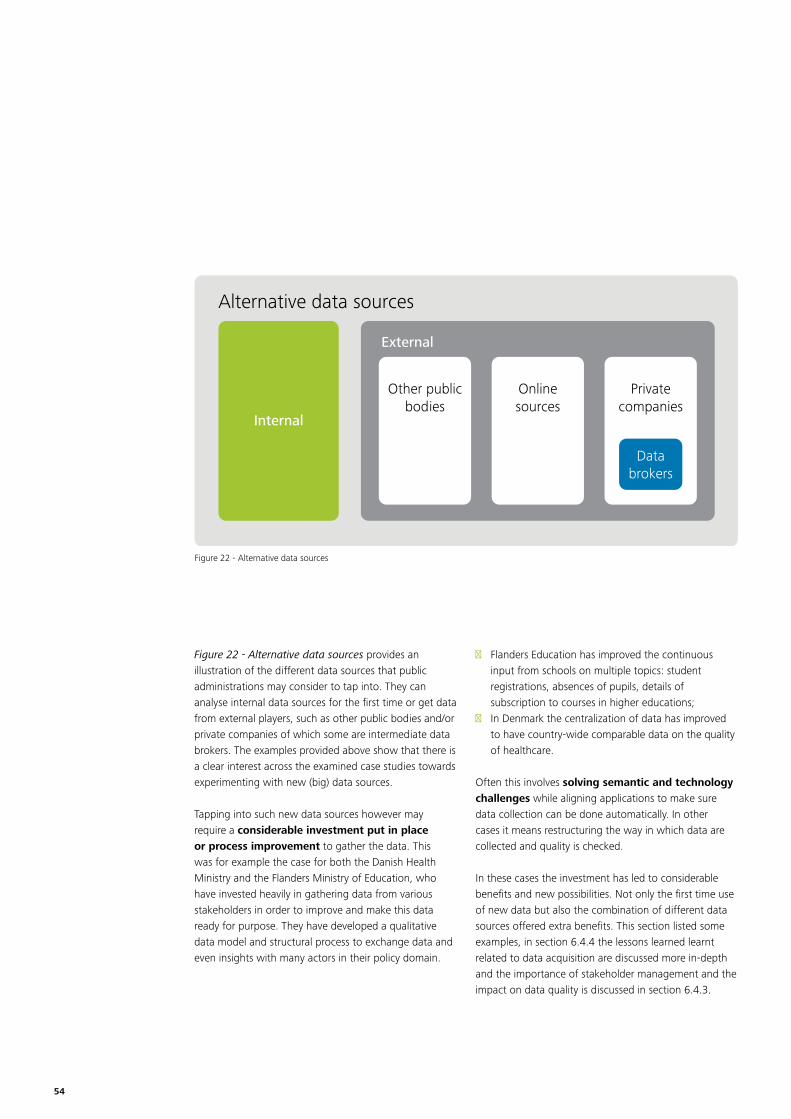
Alternative data sources
Internal
External
Other publicbodies
Onlinesources
Privatecompanies
Databrokers
Figure 22 - Alternative data sources provides an illustration of the different data sources that public administrations may consider to tap into. They can analyse internal data sources for the first time or get data from external players, such as other public bodies and/or private companies of which some are intermediate data brokers. The examples provided above show that there is a clear interest across the examined case studies towards experimenting with new (big) data sources.
Tapping into such new data sources however may require a considerable investment put in place or process improvement to gather the data. This was for example the case for both the Danish Health Ministry and the Flanders Ministry of Education, who have invested heavily in gathering data from various stakeholders in order to improve and make this data ready for purpose. They have developed a qualitative data model and structural process to exchange data and even insights with many actors in their policy domain.
■ Flanders Education has improved the continuous input from schools on multiple topics: student registrations, absences of pupils, details of subscription to courses in higher educations;
■ In Denmark the centralization of data has improved to have country-wide comparable data on the quality of healthcare.
Often this involves solving semantic and technology challenges while aligning applications to make sure data collection can be done automatically. In other cases it means restructuring the way in which data are collected and quality is checked.
In these cases the investment has led to considerable benefits and new possibilities. Not only the first time use of new data but also the combination of different data sources offered extra benefits. This section listed some examples, in section 6.4.4 the lessons learned learnt related to data acquisition are discussed more in-depth and the importance of stakeholder management and the impact on data quality is discussed in section 6.4.3.
Figure 22 - Alternative data sources
54

6.2.2. Using analytical techniques for better insightsGovernments dealing with new data and discovering new analytical techniques move up from descriptive and diagnostic analysis towards more predictive and prescriptive analysis.
Section 4.4 describes four main types of analytical techniques as descriptive statistics, diagnostic analytics, predictive and prescriptive analytics.
The interviewed organisations provided many examples of different techniques that can be used.
Flanders Education and the Danish Ministry of Health for instance use both descriptive and diagnostic analytics to describe actual subscriptions in schools or healthcare services provided. They provide benchmark capabilities respectively between schools and regions, put data in context or present information with insightful visualisations.
Flanders is using an analytical technique to cope with privacy concerns. They use an algorithm in their descriptive analytics to prevent showing results for too small groups of students. If an analysis results in a group of students that is smaller than five persons, the results are not shown.
The National Archives in the UK have built an extensive database of UK legislation. Using advanced text mining techniques, they are revealing interesting patterns. Their project allows to transform how one can understand and use existing legislation by providing a new analytical service to researchers and legal specialists. One of the UNECE 2015 experiments also concerns text mining techniques applied to social media sources and notably on Twitter. Within the UNECE framework, many statistical offices such as for instance CBS and Istat are working on text mining. Predictive analytics allow custom offices of Estonia and Lithuania to predict
the likelihood of fraudulent operations in individual cases. In Lithuania they have established specific criteria associated with cross-border contraband shipments. VDAB also uses prescriptive analysis to recommend vacancies to individual job seeker. In another innovation project they were using survival analysis to analyse the likelihood and timing of young unemployed people to find a job.
TfL uses many techniques amongst which there are geospatial analysis and pattern analysis. Geospatial analysis on transport data allows TfL to analyse transfers between various transport systems or several operating transport lines. It gives more insight in an optimal alignment between various transport lines. Pattern analysis on the other hand helps TfL in finding unexpected patterns in revenue collection data due to human or machine error.
Public organisations therefore use different techniques (a single one or combinations of them) in many different ways to get to better insights on their work.
6.2.3. Providing insights quicker or near real timeNew technology has improved the possibilities to treat massive amounts of data in a small amount of time. In some areas the possibility to act upon certain events immediately is crucial for success. Multiple cases have been identified where organisations have embedded data analytics in operational processes.
TfL has developed ways of informing its customers in real time on the traffic situation through data analytics. For instance, congestion analysis allows Transport for London to inform passengers on issues or traffic on their way and to take alternative routes. In this cases and linked to the services offered by TfL, real-time data can provide more value than an analysis on historical data.
55
Similar consideration apply for VDAB service offering. At VDAB job seekers visiting the online portals are provided by recommended job vacancies filtered based on profile, competences or recently visited pages. Using near real team data on the individual thus enhance the quality of the service offered.
Another option linked to real time or near real time data is predictive asset maintenance analysis. Sensor data and machine generated data can be used to predict the likelihood of future machine failure. By predicting this to happen or by continuous monitoring of systems, governments are trying to ensure perfect functioning of underlying transport systems.
Flanders Education also uses near real time data on daily basis. Daily data on student absences in schools allows the government to quickly act upon compulsory attendance at school. Before this system was put in place, the time for reacting to the absence of a pupil was longer and therefore the intervention later.
Real time or near real time data are also used for fraud analytics. Auditors and criminal intelligence services of the Lithuanian customs use models and algorithms in their daily work. The department deployed an advanced analytics solution that uses highly accurate prediction models to sort through enormous volumes of customs-related data and profile which types of activities have the greatest probability of corresponding with illegal or fraudulent operations. For instance, having established specific criteria associated with cross-border contraband shipments, the solution provides customs officials with timely intelligence they can use to determine whether to search a truck’s cargo74. Data analytical models therefore drive every day processes and prioritize audits.
Real data or near real data are nowadays used by public administrations for, amongst others, accelerating their operations, reacting quicker to events and improving their customer services.
6.2.4. Enlarging the target audience for analytical solutions
In the area of big data, a common challenge is popping up whenever solutions need to be able to deliver insights to a larger group of internal and external people. This often requires technology that can cope with many concurrent users accessing reports, dashboards and underlying data as they need it.
This means enlarging the target audience of analytical solutions and provide them an easier access to insights as this might lead to more people impacting the results by making better decisions.75
According to the type of user, their physical location and experience with the application or data provided, Online or offline solutions need to present insights in a highly visual and easy to understand solution.
The more people benefit in an easy way of insights the more impactful results can be obtained. Flanders Education for instance sends out yearly personalized benchmark reports to all individual schools in Flanders and has evolved to the provision of self-service visualisation solutions.76 This helps school to understand their strengths and weaknesses and act upon them.
Transport tor London, as already mentioned in the previous section, uses different communication channels for reaching out customers and users to offer insights, alternatives and feedback on services provided. This increases the amount of insights customers disposes of to plan their route. Flemish VDAB also offers immediate insights to web users searching for a job or online self-service researchers wanting to have insights on the unemployment market.77 This empowers the users of the service. The Danish Ministry of Health also empowers citizens by providing data platforms where they can choose hospitals based on performance criteria as the measured waiting times. And citizens have access to their own health data. At the same time, they also provide hospitals with benchmarking solutions so they can use these insights for performance analysis.
74. http://www-03.ibm.com/software/businesscasestudies/au/en/corp?synkey=X941543K55207M80 75. http://onderwijs.vlaanderen.be/nl/wegwijs-in-mijn-onderwijs76. Movie presenting this solution http://data-onderwijs.vlaanderen.be/extra/dataloep/77. https://arvastat.vdab.be/
56
Finally, enlarging the target public, was one of the main goal of the UK National Archives initiative on big data. The big data for law project of the UK National Archives in fact opens up new possibilities and transforms the study of UK Law by providing analytical solutions to legal researchers, policy making and any interested individual without analytical background.
As these examples show, enlarging the target public is both a driver and an opportunity provided by data analytics techniques.
6.2.5. Designing new data driven public servicesAs organisations mature in data analytics, they have a complete vision and plan for more than only on time big data analytics case studies.
Trying out for the first time a new analytical approach or big dataset, can be challenging, but it is a lot more complex to provide solutions that add value on a permanent basis. Industrializing big data solutions to the benefits of multiple people, ensuring trusted data along the way, means a lot of automation to keep it sustainable and efficient.
Business intelligence solutions automating the process of providing insights were a response to a similar goal. With the rise of big data, both the potential but also the complexity of analytical solutions have been enlarged.
A lot of the interviewed people have argued that the true value of big data analytics lies in the process of automating the benefits in day to day operations
They design and develop big data analytics solutions as continuous processes. In designing them they answer the following questions: ■ Who should change or will be willing to change his/
her behaviour based on insights? ■ How can these insights be created? Can we provide
them in order to affect a shared goal? ■ How will this person decide on the next best action?
What information is needed to change his or her behaviour? Can we provide suggestions or decent alternatives?
■ What is the most appropriate timing to provide these insights?
■ How can it be delivered in a way that we maximize the user experience of the receiver and minimize efforts to analyse or make a decision?
57
Government organisations uplift the value of big data analytics when they focus on the total impact and decision process of the people involved. The return on investment is bigger as soon as decisions and behaviour of a larger group of people is impacted and improved.
Mature organisations make sure they provide complex analytics in an easy to understand solution while educating users on how to interpret or correctly use. When this happens governments are often creating complete new data driven services to their stakeholders. They are redefining their role.
Many of the organisations interviewed, have used data analytics to redefine their role and provide new services to their stakeholders.
Some of the organisations interviewed, such as for instance VDAB, The National Archives and TfL have foreseen open data as a first step to allow other people to create value with their data. This, sometimes also combined with providing analytical solutions to external stakeholders is another example of delivering new services. This is the option chosen by UK National Archives for instance as described in the previous section.
TfL also tries to affect citizen satisfaction by working on automatic refunding of transport fares to cover for human or technical errors. They provide automated tailored information on congestion and pricing to provide people the flexibility to decide on a next best action suggesting alternative routes. Following a similar logic, VDAB has created a “tinder-like” mentor app to hook-up job seekers with regular citizens volunteering to coach. This is a way of crowd-sourcing for coaching job seekers.
At the same time, Flanders Education is trying to use better data analytics using internal and external government data to simplify and automate the process of school grants78. Linking various databases they can change towards automatic grants instead of approvals or requests by the public. This way they can help less informed people within benefits they are entitled to. Above that they optimize the current labour-intensive evaluation process.
Organisations trying to find the budget or evaluating the business case and expected ROI for big data analytics should consider how the value of solutions can be uplifted by completely redesigning their services and embedding the value of data and analytics in daily operational processes.
6.3. Best practices and lessons learntThe main aim of the present study was to gather insights, best practices and lessons learnt on how public administrations in Europe use data analytics. These experiences and advice can indeed help similar organisations willing to launch or improve initiatives in the area of (big) data analytics.
The current chapter illustrates all the findings linked to best practices and challenges emerged during our analysis through the data collection. The findings are structures according to the categories used for the reporting tools and notably: strategy, people and skills, processes, data and technology. These are the main components of big data initiatives contributing to their success.
The purpose of this chapter is therefore to offer a collection of best practices and lessons learnt to public administrations of all territorial levels willing to work or already working on big data.
78. Automatic calculation of parents allowed to get school grants (Dutch: vangnet studietoelagen)
58
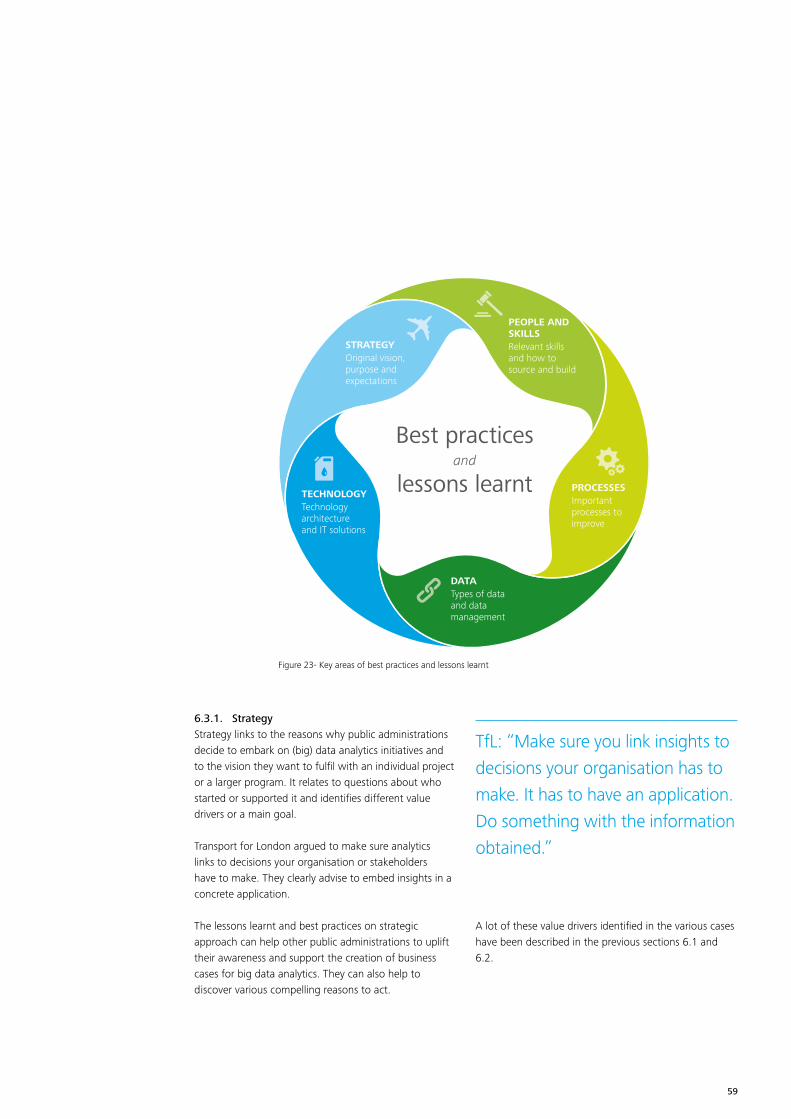
6.3.1. Strategy Strategy links to the reasons why public administrations decide to embark on (big) data analytics initiatives and to the vision they want to fulfil with an individual project or a larger program. It relates to questions about who started or supported it and identifies different value drivers or a main goal.
Transport for London argued to make sure analytics links to decisions your organisation or stakeholders have to make. They clearly advise to embed insights in a concrete application.
The lessons learnt and best practices on strategic approach can help other public administrations to uplift their awareness and support the creation of business cases for big data analytics. They can also help to discover various compelling reasons to act.
A lot of these value drivers identified in the various cases have been described in the previous sections 6.1 and 6.2.
PEOPLE AND SKILLSRelevant skills and how to source and build
PROCESSESImportant processes to improve
DATATypes of data and data management
STRATEGYOriginal vision, purpose and expectations
TECHNOLOGYTechnology architectureand IT solutions
Best practicesand
lessons learnt
Figure 23- Key areas of best practices and lessons learnt
TfL: “Make sure you link insights to decisions your organisation has to make. It has to have an application. Do something with the information obtained.”
59
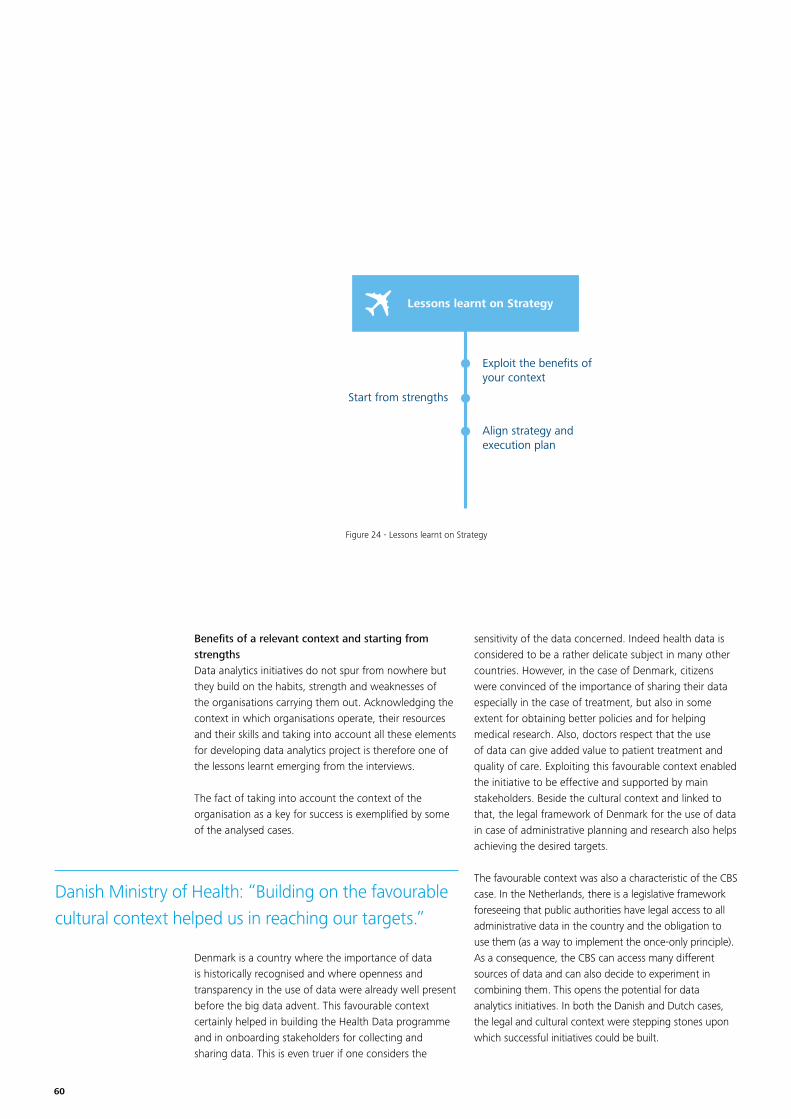
Benefits of a relevant context and starting from strengthsData analytics initiatives do not spur from nowhere but they build on the habits, strength and weaknesses of the organisations carrying them out. Acknowledging the context in which organisations operate, their resources and their skills and taking into account all these elements for developing data analytics project is therefore one of the lessons learnt emerging from the interviews.
The fact of taking into account the context of the organisation as a key for success is exemplified by some of the analysed cases.
Denmark is a country where the importance of data is historically recognised and where openness and transparency in the use of data were already well present before the big data advent. This favourable context certainly helped in building the Health Data programme and in onboarding stakeholders for collecting and sharing data. This is even truer if one considers the
sensitivity of the data concerned. Indeed health data is considered to be a rather delicate subject in many other countries. However, in the case of Denmark, citizens were convinced of the importance of sharing their data especially in the case of treatment, but also in some extent for obtaining better policies and for helping medical research. Also, doctors respect that the use of data can give added value to patient treatment and quality of care. Exploiting this favourable context enabled the initiative to be effective and supported by main stakeholders. Beside the cultural context and linked to that, the legal framework of Denmark for the use of data in case of administrative planning and research also helps achieving the desired targets.
The favourable context was also a characteristic of the CBS case. In the Netherlands, there is a legislative framework foreseeing that public authorities have legal access to all administrative data in the country and the obligation to use them (as a way to implement the once-only principle). As a consequence, the CBS can access many different sources of data and can also decide to experiment in combining them. This opens the potential for data analytics initiatives. In both the Danish and Dutch cases, the legal and cultural context were stepping stones upon which successful initiatives could be built.
Lessons learnt on Strategy
Exploit the benefits of your context
Align strategy and execution plan
Start from strengths
Figure 24 - Lessons learnt on Strategy
Danish Ministry of Health: “Building on the favourable cultural context helped us in reaching our targets.”
60
This is also linked to the idea of starting from strategic strengths and assets to develop initial cases. If the country context is important, so is considering the strengths of the organisation and starting from them. This is illustrated by the case of the customs authorities. Indeed, in Estonia for instance, the entire data analytics program started from the work on a single case of fraud which was very well known within the organisation. This allowed to test the system and making it trusted by the main stakeholders. Starting with what they knew well allowed them to develop a predictive model relatively easily and quickly before venturing into other cases.
Transport for London provides a very similar example. They started from the data coming from revenue collection, which is one of the highest quality dataset of the organisation. Again, this allowed them to test their hypothesis and skills before trying less known and reliable sources for their analytics.
Overall, successful cases often managed to take the opportunities linked to their national context and to build on organisation strengths. Mapping those two elements before embarking in the data analytics journey can therefore be valuable.
Alignment on strategy and execution planGovernmental organisations can have multiple performance areas, value drivers and ultimately many different sectorial strategies. These can be conflicting. For example the initial costs for a technical infrastructure might compete with the internal need to cut costs on the short term. Also, changes in the political majorities and competing political parties at different levels can produce contradicting decisions on priorities. A lot of organisations suffer from these conflicting value drivers. The conflict in fact impacts their decision to start, limits their ability to explore and build valuable business cases and can ultimately impact the success of an initiative.
This is the reason why many interviewees have stressed the importance of overall strategic alignment in this
area. For instance at VDAB particular attention is paid to the overall alignment between the IT strategy and business strategy. They have a forum designed to follow up on alignment and priorities in which both business and IT representatives take place.
In Denmark, elections took place during the implementation phase of the data analytics project. This raised some concerns in terms of continuity of the initiative. However, the new political majority also supported the project and this ensured even more alignment across the main stakeholders. This also proofs that alignment is not a “una tantum” exercise but more a continuous processes that deserves attention.
Alignment also concerns concrete roadmaps or execution plans focusing on all domains necessary for the initiative such as skills, trusted data, qualitative processes and appropriate technology. Concerning roadmaps and execution plans there are two aspects to take into account: on the one hand, the discussion and adoption of such documents should be as participated as possible in order to ensure alignment with stakeholders. On the other, decisions must be taken effectively and timely for the initiative to fully develop. These are the reasons why organisations with a strong strategic and operational decision process are better equipped for the many decisions to be made.
In order to find the right balance between participation in the decisions and efficiency of the decision making process, the Danish government has created a steering committee including various key stakeholders to align on prioritization and management of initiatives. This steering committee is chaired by the Ministry of Health but it involves all relevant interlocutors from different domains and at different levels. In fact, besides public authorities, the steering committee also involves organisations such as The Danish Cancer Society and Danish Patients,
Estonian customs: “We started from a case we knew well to make us comfortable with the opportunities provided by data analytics.”
“VDAB: “IT Strategy should be part of the business strategy. The CIO and CEO should have a common strategy.”
61

professional organisations such as medical and clinical companies, public research and universities and private research and the pharmaceutical industry. The Flemish Ministry of Education has also installed a similar steering committee to prioritize data analytics and reporting projects and manage assignments of relevant resources.
The UNECE experience is also particularly interesting in this domain as it combines the challenges linked to aligning strategies overall with the ones of building consensus amongst many different organisations from different countries. The first year of this initiative was particularly challenging in this respect as the sandbox environment was ready very quickly but then it took some time for the participant organisation to learn how to use it and how to take decisions all together. The major decisions are taken by the participants voting by majority and according to financial availability of resources. This collaborative model, after a trial period, has proven to work very well.
As these cases show, alignment of strategies and alignment with stakeholders are key for succeeding. However, success is not the only option; in fact, not all initiatives or explorations in the area of big data analytics will immediately lead to the desired outcome or success. Failure is part of the game and organisations should be able to fail without bearing too
burdensome consequences. For this reason, trying new things with big data should be facilitated within certain frameworks. The innovation ad experiments process is discussed in chapter 6.3.3.
6.3.2. People and skillsIn order to successfully implement a (big) data analytics initiative having available the people with the right skillsets is an essential precondition. At the beginning of a project or initiative it is difficult to have a clear definition of what skills are needed. This chapter lists the mix of skills and competences that were mentioned as instrumental to successful development and deployment of the data analytics initiatives by the different cases. Overall, the required skills can split in two parts: the more business and organisational skills on the one hand and more technical skills on the other.
The organisations in charge of the different initiatives as part of the cases have developed strategies to source and build the required skills as well as how to embed people and their skills in the organisational structure.
“Be prepared to fail. Failure is a good teacher.”
62
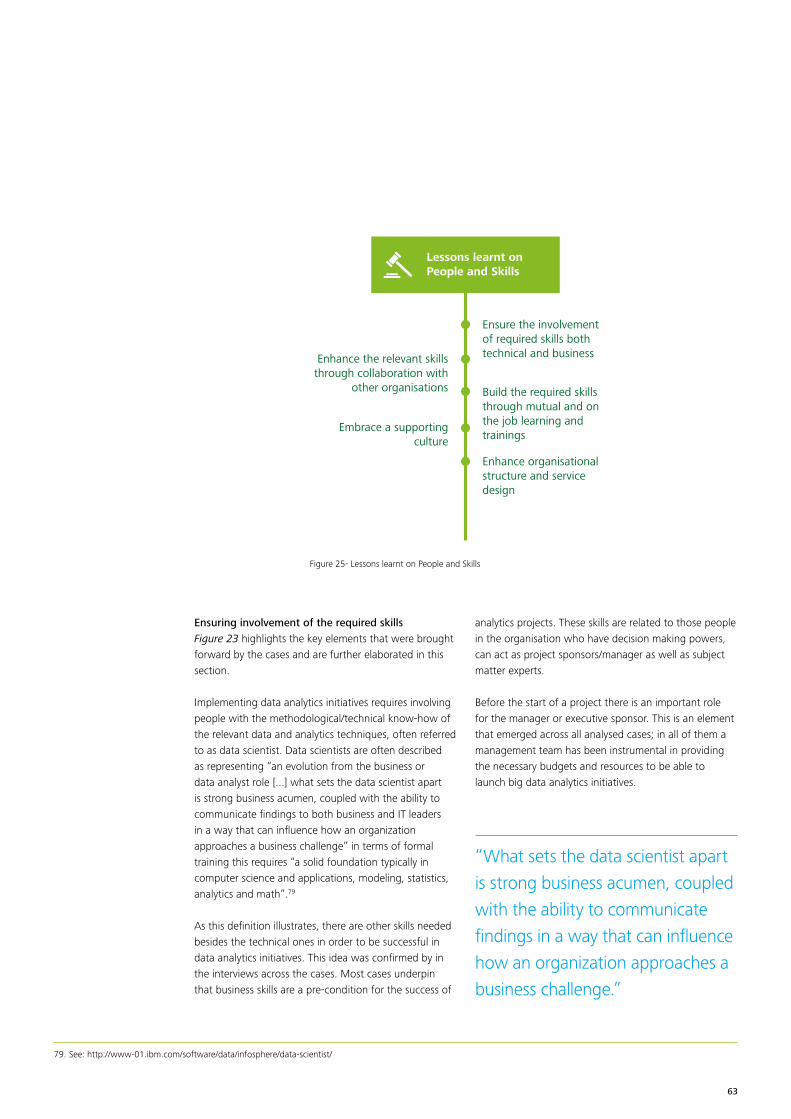
Ensuring involvement of the required skillsFigure 23 highlights the key elements that were brought forward by the cases and are further elaborated in this section.
Implementing data analytics initiatives requires involving people with the methodological/technical know-how of the relevant data and analytics techniques, often referred to as data scientist. Data scientists are often described as representing “an evolution from the business or data analyst role [...] what sets the data scientist apart is strong business acumen, coupled with the ability to communicate findings to both business and IT leaders in a way that can influence how an organization approaches a business challenge” in terms of formal training this requires “a solid foundation typically in computer science and applications, modeling, statistics, analytics and math”.79
As this definition illustrates, there are other skills needed besides the technical ones in order to be successful in data analytics initiatives. This idea was confirmed by in the interviews across the cases. Most cases underpin that business skills are a pre-condition for the success of
“What sets the data scientist apart is strong business acumen, coupled with the ability to communicate findings in a way that can influence how an organization approaches a business challenge.”
Ensure the involvement of required skills both technical and business
Build the required skills through mutual and on the job learning and trainings
Enhance the relevant skills through collaboration with
other organisations
Embrace a supporting culture
Enhance organisational structure and service design
Lessons learnt onPeople and Skills
Figure 25- Lessons learnt on People and Skills
analytics projects. These skills are related to those people in the organisation who have decision making powers, can act as project sponsors/manager as well as subject matter experts.
Before the start of a project there is an important role for the manager or executive sponsor. This is an element that emerged across all analysed cases; in all of them a management team has been instrumental in providing the necessary budgets and resources to be able to launch big data analytics initiatives.
79. See: http://www-01.ibm.com/software/data/infosphere/data-scientist/
63

The role of the initiative sponsor cannot be underestimated. Sponsors are expected to be able to make decisions, have a macro-view on the organisation and be instrumental in prioritising value creation initiatives. However, the value of data analytics initiatives may not be visible ex ante and people might be very wary of the risks (such as the waste of resources in case
of failure). It is therefore essential, in order to be able to start a project, to count on an executive sponsor with the right vision willing to take the risk and see future advantages and not only the present threats. In the case of CBS the presence of an executive sponsor is even a requirement for testing the idea in their innovation lab. This is due to two considerations: first persuading a sponsor of the quality of an idea already helps to structure it; second, the sponsor’s role is essential for bringing the idea to the management and having it sustained. At VDAB top-level management sponsors the innovation lab.
Innovation is all about daring to try out new things. People should have the confidence that even failure in this process is important. Leaders need to have the spirit to try things out, allow their organisation to fail and make sure that, if failure is about to happen, the organisation discovers it as early in the process as possible. This is one of the key learnings emerging from the selected case studies.
Related to this, having the political buy-in for the project was essential. This element has to be taken into account as in some cases political elections led to a slowdown or temporary stop of a data analytics project. Across the cases, buy-in of the political level has ensured several key elements: ■ Security of funding for multiannual programs; ■ Managerial support, as managers felt reassured on
their ability to support; ■ Quicker deployment as different stakeholders and the
entire organisation have to follow political decisions.
Therefore, decision makers are also directly involved in the most successful initiatives beside innovation-minded managers.
The third main category of people that is indispensable is subject matter experts. As mentioned by all cases, involving people with significant knowledge of the subject domain is key for the success of the initiative. They know what to look for and have an idea of available data sources. With a good overview on what matters, they can spot data quality issues quicker, interpret data and translate it into meaningful insights. They are also capable to suggest appropriate actions to act upon with the obtained insights. All cases insisted particularly on this category of persons in order to explain their success. This is especially the case for some initiatives where they consider subject matter expertise to be even more important than technical skills. As one interviewee from the Estonian customs argued that they “tried to involve people with very strong math and statistical background but without any experience in the domain of fraud and discovered that they find it difficult
to imagine how fraudsters think. For fraud identification, we needed data-savvy subject matter experts to understand who is breaking the rules. That is why we figured out that it is easier to teach fraud experts to work with big data than the other way around”.
Fraud analytics is not the only domain in which subject matter knowledge has an important role. People in statistical offices need to focus on content knowledge in order to ensure that data analytics fits into methodologically sound statistical processes. As argued by both CBS and Istat, content experts need to work along with data scientists from a very early stage in order to make sure that statistical methodologies are respected and that the data is treated according to the international standards. Therefore, data scientists alone are not enough as they need to be taught statisticians’
Estonian customs: “It is easier to teach fraud experts to work with big data than the other way around.”
CBS: “The role of internal sponsors is essential for our innovation framework.”
64
system of values. Although in the area of big data, the importance of various technical skills has grown, multiple cases discovered that subject matter expertise is extremely meaningful in order to pick the right business question, present insights in a compelling way and act upon these insights in a way that it brings value to the organisation or various stakeholders. To conclude, there are other essential roles to be considered in data analytics team besides the required technical skills.
In terms of technical skills specifically for the use of data analytics, big data has broadened the scope of technical skills that are important to succeed in analytics. Due to the variety, scale and complexity of big data, new solutions, frameworks and techniques are needed to deal with the challenges at hand. Often this requires data-savvy people in public organisations to change their way of working which is not always easy to accomplish.
First of all, data management skills are required. The different challenges in data management are addressed in section 6.3.4. In essence, an organisation needs data architects with a skillset to master different data flows that open up various trusted data sources in a secure way to people who need to analyse them. They support automation when actions to pre-process and treat data are repetitive and they carefully make choices in this to ensure long time value to the organisation. Many of the organisations interviewed describe these skills as important.
TfL for instance had to build, recruit and on-board software developers, visualisation and design experts in the last few years. In most of the organisations, similar skills were developed before the big data era. They had to uplift these skills to learn how to work with solutions fit for big data and new concepts as streaming data among others. Apart from the skills to treat the data, organisations need an overview of available data assets with information on relevant characteristics. One could consider this overview to be an informative menu card or user-friendly classification system of data assets. This has become important to help data scientists navigate and
pick the right data for analytics.
In addition, data algorithm specialists are required to benefit from the value of techniques and methods like statistics, optimisation algorithms and machine learning. They help in providing insights and discovering patterns in large chunks of data that go beyond simple calculations. These specialists have to select the right method according to the nature of the data and business question and interpret the typically less intuitive results. Some of the algorithms mentioned during the interviews are social media analytics, predictive models, clustering, sentiment analysis, network analytics, survival analysis and machine learning among others.
The landscape of big data solutions is very complex and growing rapidly. To navigate in this maze of various solutions, some organisations have defended the need to build the capability of an overall technical understanding of typical features, various possibilities and challenges at hand. To be able to make the right technology choices, organisations benefit from IT architects that are informed about the reliability and integration possibilities of relevant products or services. It is important to estimate the organisational effort needed both by key powerusers and application management teams to create sustainable value with the chosen IT architecture.
While discussing some of the technology challenges (see chapter 6.3.5), people have mentioned the importance to build these skills within the organisation. Although, others warned not to spend too much time on pre-purchase tool evaluations as they realise that it will be required to change anyway due to the rapid evolution of technology developments. Both CBS and VDAB pointed out this last point.
Big data analytics often requires to link and integrate different new and existing solutions. Visualisation solutions need to present data from big data streams
TfL: “We had to build, recruit [and] onboard software developers, visualisation and design experts”
CBS: “Data scientists alone are not enough as they need to be taught by content experts the statisticians’ system of values.”
65

and traditional Business Intelligence (BI) datawarehouse. For effective insights, analytical models often combine the data from different internal and external sources. Insights from analytical models need to be disclosed in a transparent way to decision makers helping them to decide on the next best action. For this reason most cases argue that basic technology integration skills are becoming important to embed insights in ready-made solutions tailored to each stakeholder. Big data architects need to design this ecosystem and the complex architecture involved.
Due to the bigger complexity and related legislation, data security specialists need to ensure that this architecture provides the right level of processes and solutions to deal with privacy and security concerns.
Most of the cases have mentioned that the challenges related to privacy and security of data have grown in recent years. While data being sourced from sources such as digital applications, sensors and mobile phone data have increased the possibilities, they have also resulted in challenges to translate every use of privacy
sensitive data into the appropriate technology solutions, procedures or guidelines. Governments have to set the example and define the appropriate ethical behaviour. Their talents involved in data analytics need to be guided, monitored and coached to act ethically.
All these skills may be present in some very highly skilled individuals but this is not always the case or they are limited in number. For that, organisations investing in data analytics clearly understand the importance of organising their initiatives by involving mixed team with complementary skills.
Sourcing the required skillsAs illustrated in the previous sections, business and technical skills need to be mixed to make data analytics
initiatives work. However, not in all cases these competences were sufficiently available within the own organisation at the very start of their initiative.
In many cases the difficulties of attracting and retaining the right talents or developing the necessary skills within the public sector bodies were discussed. One might need to free up people from other tasks and invest in extensive training. In the context of a government forced to cut costs this has not always been easy. Hiring experienced data scientists is problematic for governments in a labour market with less supply than demand. Governments need to compete with less flexibility to propose appropriate salaries. As one of the interviewees argued, it results in problems to both attract and retain the right talents.
Figure 24 below shows the key elements that were brought forward by the cases and are further elaborated in this section.
Quite often, public administrations spent budget from innovation campaigns or new investment initiatives to hire external experts to execute some of the tasks involved and complement the organisation with the missing skills. They work with external experts from universities or services companies to add missing - often in the first place technical skills - to their internal teams.
In some cases, organisations opted for a close cooperation with universities. While graduate students or PhD’s are developing new skills or improving the thought leadership of their institutes, they were working on their data and specific analytical challenges of their agency providing value to both. CBS, Transport for London and the Lithuanian customs for instance work with universities. The Lithuanian customs consider this link with universities as a good way to affect the likelihood to hire young data scientists for their fraud analytics team.
CBS: “We would love to have more people with the right skills but it is not easy [...] it is challenging to train and change habits of employees [and] we sometimes loose the battle for talent due to competitiveness of our salaries.”
UNECE: “Our sandbox had to be hosted by an organisation that really understands the technology and processes. Some other organisations have tried to host sandboxes in their regions but they have failed.”
66
In other cases public administrations hired external consultants to do the job, to complement missing skills or support and train their own staff. The Estonian tax and customs for instance engaged external people to provide software training. These external experts sometimes helped in doing analysis on aggregated data. However, they were limited in collaboration because the Estonian customs cannot easily share or give access to data to externals.
In particular, experience of the cases shows two lessons learnt in the value of external expertise. The first insight
has to do with the benefits of hiring service providers that have a good understanding and experience in the typical business challenges of their organisation. They internalize some of the important business skills and can provide people with mixed skills. Public procurement however does not allow organisations to continue to work with the same external parties that have developed
a deeper understanding of the organisation and its data. The second insight has to do with the existence of internal people understanding the typical challenges and benefits of the activities subcontracted to external people. It provides extra value in the communication on requirements and allows a better understanding in the typical challenge of working in mixed teams.
Some of the cases decided to complement their skills by establishing a tight collaboration with other public institutions to build working groups that can share knowledge and knowhow. An example is the international collaboration as the UNECE Sandbox initiative. Indeed, within the UNECE Sandbox project, no participating statistical office across the countries had all relevant skills in house. The exchange of best practices and the collaboration allowed them to learn faster and to complement missing skills by bringing together people with complementing skillsets. The Lithuanian and Estonian custom administrations have also established a European collaboration with other countries with the purpose to create a permanent international dataminers working group.
Amongst these three options for sourcing additional skills, the third one is interesting for public administrations as it has benefits going beyond the skills shortage and covering learning on all other aspects of data analytics projects.
UNECE: “The added value is working together and sharing knowledge. No Statistical Office has all the skills needed. The different statistical offices can specialize in one domain and exchange best practices with others. Everybody gains in terms of knowledge.”
67

Building the relevant skillsEven when some skills are sourced from elsewhere, successful organisations incorporate some of the knowledge within the organisation for the sake of continuity or an improved collaboration in mixed teams of internal and external experts.
Overall, the most mature cases avoid to look at the domain of skills as a “to have or have not” situation. They have implemented various ways to develop skills, collaborate or source temporarily to coach their organisation on this journey. They have discovered that providing learning experiences is even an additional pull factor in the war for talent. This happens mainly through mutual learning and structured classical trainings. In both cases, a well-planned investment is needed.
In order to embed a (big) data analytics exercise within the organisation and achieve awareness and cross-fertilisation many cases have setup balanced projects by staffing multiple people with a different skill level and from different parts of the organisation. Such collaboration across the organisation enables people to learn from each other and add different insights and benefits to maximise project success. This approach also addresses the need of having mixed technical and business skills which entails cross fertilisation and mutual learning for all persons involved.
Within mixed teams, it is important to develop a common understanding and language with respect to data analytics. Technical people need to be able to understand subject matter experts and vice versa. Often logical models and frameworks help. This takes time to build but provides benefits to work in more effective way while it accelerates the learning process.
Collaboration within the organisation is one way to build mixed teams. In addition, colleagues from other (international) organisations working on the same domain can share relevant insights. Governments building or delivering services to the same stakeholders might be
willing to invest in common services. Several of the cases encouraged people to exchange not only within their team but also with colleagues in other organisations cross domain, cross level as well as cross border, Estonian and Lithuanian customs being two of them.
In addition, specialized training in the data analytics domain is essential as it allows them to spread the knowledge of the possibilities of this new technology therefore enhancing its deployment. For this reason, most cases have structured training strategies in place to speed up the learning process. Training for instance is part of the UNECE big data project, as one of the use cases identified by the project coordinators. The Education Department of the Flemish government has invested in both technical as training on logical concepts and methodologies.
With respect to traditional training, several lessons learnt emerged from the cases. It is considered important to carefully consider which skills are the hardest to build and the long term benefits some trained people can have on the organisation.
Often courses on big data technology typically consider IT experts as the target audience. When people without an IT background are among the target audience, it may be required to significantly tailor data analytics trainings to the specificities of the audience or to avoid taking a one size fits all approach for big data trainings. At Istat they have realised this principle. They had to customize communication and learning experiences for their analysts. It may also be relevant to consider building online training or customised training material to continue to capture value from the initial investment, by employing the train the trainer principle.
Lithuanian customs: “One of the goals of the international collaboration was to improve skills of people by sharing.”
Istat: “We have realized that big data trainings focus on an IT target audience. We had to change a lot the way we present things to typical analysts without an IT background.”
68
This also implies that documenting key insights is key to continuously build a knowledge repository. It is important to build a culture of knowledge management and sharing to allow new people to learn quickly and keep certain knowhow within the organisation.
The challenge to uplift the skills within a data analytics team strongly link to both mutual learning and traditional courses. However, organisations might still experience difficulties to realise the ultimate benefits of training as they encounter challenges related to changing actual behaviour. Teaching someone how to use analytics techniques is not enough if the person is resistant to change or keeps certain habits in his or her way of working. This is why the next chapter is dedicated to challenges linked to change management.
Embracing a supporting cultureAs an organisation looks to implement and embed big data analytics in operational, tactical or strategical decisions or wants to start providing new data driven services to stakeholders, it might result in a fundamental change of the current way of working and operating model. That is why a big part of the challenge is linked to the willingness of stakeholders to embrace this change. This might have to do with the mere fact of launching the activity in favour of other areas of investment (Why?) or link to the way it is organised (How?).
Many of the cases acknowledged the fact that big data analytics has in some ways been a cultural revolution. Consequently fixing the underlying issues of quality and access to data are only part of the challenge; changing deep seeded perceptions is just as important in realising the benefits of improved insight. Change management is therefore an essential part of the people challenges and has to be taken into account when launching projects.
One approach to change management in particular has proven to be very effective across the cases. In order for stakeholders to change their behaviour, it is necessary that they see the value that data analytics and new ways of working will bring to them. It should be the responsibility of the project team within the organisation to advocate and communicate this value to the different stakeholders involved. The burden of proof is hence on the shoulders of those proposing new processes
and tools. This has to be very clear and it is important to spend time illustrating clearly and effectively the advantages of data analytics to all employees. Experiments to convince others about the true value and stakeholder management are both important to avoid resistance to change.
In the case of the Lithuanian customs, one of the main value drivers of data analytics they pointed to while trying to change people habits, was the cost efficiency of the new method. Indeed, they were able to show the cost reduction due to the take up of this initiative. However, sometimes the advantages may be difficult to measure, such as in the cases of advantages in terms of customer satisfaction for example, as in the case of TfL, or opening up new directions for policy making (as for Flanders Education).
In any case, the benefits of data analytics must be clearly explained to every stakeholder in order to be sure that the change is supported. In fact, ultimately people will most likely need to change their way of working and they have to see the benefits of doing so. This means, from the very beginning of the project, it is key to not develop (big) data analytics initiatives in isolation but to consider a clear communication strategy for all relevant stakeholders. Where this was done among the cases, the take up of the data analytics opportunity has been quicker and most effective.
Besides the challenge to convince people of the benefits to experiment or launch initiatives, organisations also have to invest in governance to make sure people follow
Istat: “We had to teach people that pulling all the data first on their PC is no longer feasible. They need to understand the importance of a client-server model way of working. We had to set boundaries to make sure our network and hardware gets optimally used.”
69
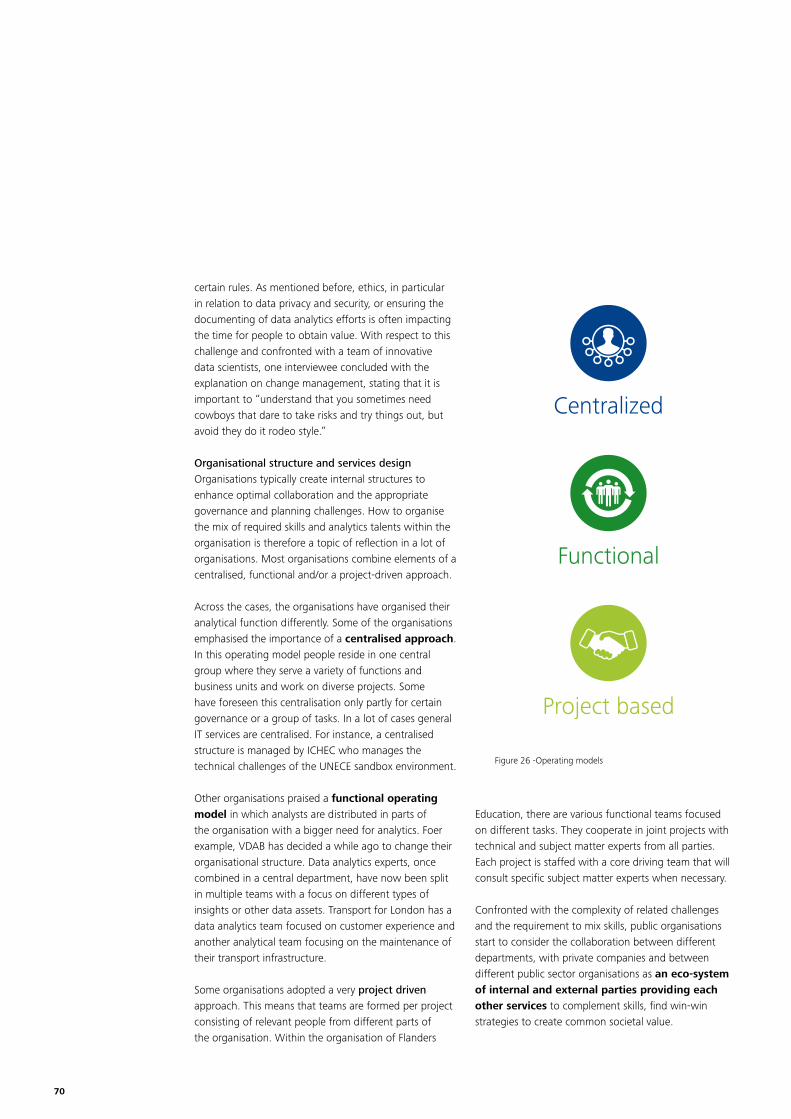
certain rules. As mentioned before, ethics, in particular in relation to data privacy and security, or ensuring the documenting of data analytics efforts is often impacting the time for people to obtain value. With respect to this challenge and confronted with a team of innovative data scientists, one interviewee concluded with the explanation on change management, stating that it is important to “understand that you sometimes need cowboys that dare to take risks and try things out, but avoid they do it rodeo style.”
Organisational structure and services designOrganisations typically create internal structures to enhance optimal collaboration and the appropriate governance and planning challenges. How to organise the mix of required skills and analytics talents within the organisation is therefore a topic of reflection in a lot of organisations. Most organisations combine elements of a centralised, functional and/or a project-driven approach.
Across the cases, the organisations have organised their analytical function differently. Some of the organisations emphasised the importance of a centralised approach. In this operating model people reside in one central group where they serve a variety of functions and business units and work on diverse projects. Some have foreseen this centralisation only partly for certain governance or a group of tasks. In a lot of cases general IT services are centralised. For instance, a centralised structure is managed by ICHEC who manages the technical challenges of the UNECE sandbox environment.
Other organisations praised a functional operating model in which analysts are distributed in parts of the organisation with a bigger need for analytics. Foer example, VDAB has decided a while ago to change their organisational structure. Data analytics experts, once combined in a central department, have now been split in multiple teams with a focus on different types of insights or other data assets. Transport for London has a data analytics team focused on customer experience and another analytical team focusing on the maintenance of their transport infrastructure.
Some organisations adopted a very project driven approach. This means that teams are formed per project consisting of relevant people from different parts of the organisation. Within the organisation of Flanders
Figure 26 -Operating models
Centralized
Functional
Project based
Education, there are various functional teams focused on different tasks. They cooperate in joint projects with technical and subject matter experts from all parties. Each project is staffed with a core driving team that will consult specific subject matter experts when necessary.
Confronted with the complexity of related challenges and the requirement to mix skills, public organisations start to consider the collaboration between different departments, with private companies and between different public sector organisations as an eco-system of internal and external parties providing each other services to complement skills, find win-win strategies to create common societal value.
70
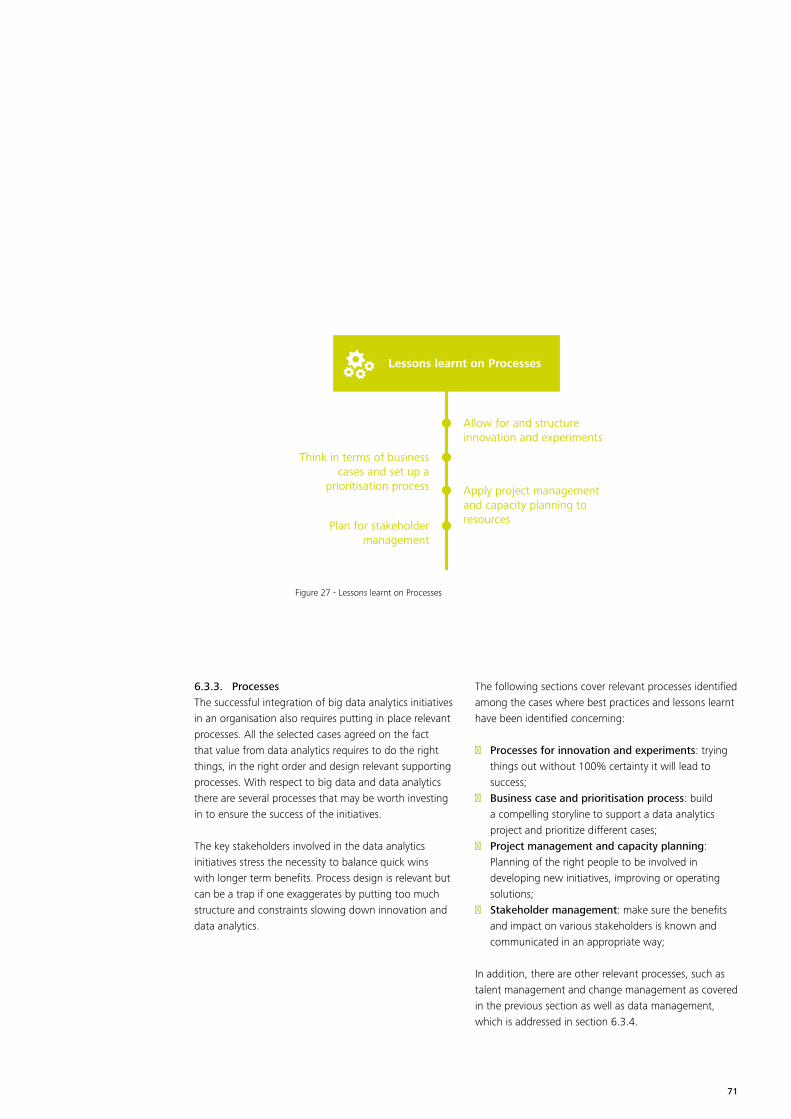
6.3.3. ProcessesThe successful integration of big data analytics initiatives in an organisation also requires putting in place relevant processes. All the selected cases agreed on the fact that value from data analytics requires to do the right things, in the right order and design relevant supporting processes. With respect to big data and data analytics there are several processes that may be worth investing in to ensure the success of the initiatives.
The key stakeholders involved in the data analytics initiatives stress the necessity to balance quick wins with longer term benefits. Process design is relevant but can be a trap if one exaggerates by putting too much structure and constraints slowing down innovation and data analytics.
Figure 27 - Lessons learnt on Processes
Lessons learnt on Processes
Allow for and structure innovation and experiments
Apply project management and capacity planning to resources
Think in terms of business cases and set up a
prioritisation process
Plan for stakeholder management
The following sections cover relevant processes identified among the cases where best practices and lessons learnt have been identified concerning:
■ Processes for innovation and experiments: trying things out without 100% certainty it will lead to success;
■ Business case and prioritisation process: build a compelling storyline to support a data analytics project and prioritize different cases;
■ Project management and capacity planning: Planning of the right people to be involved in developing new initiatives, improving or operating solutions;
■ Stakeholder management: make sure the benefits and impact on various stakeholders is known and communicated in an appropriate way;
In addition, there are other relevant processes, such as talent management and change management as covered in the previous section as well as data management, which is addressed in section 6.3.4.
71
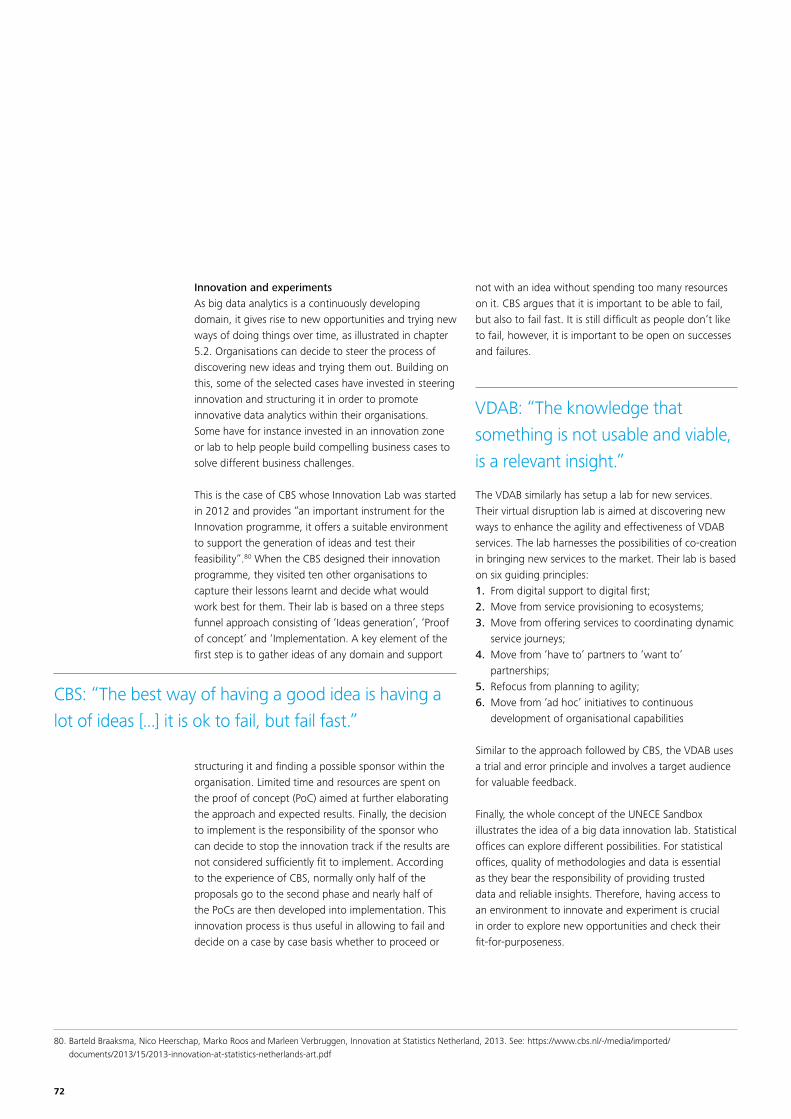
Innovation and experimentsAs big data analytics is a continuously developing domain, it gives rise to new opportunities and trying new ways of doing things over time, as illustrated in chapter 5.2. Organisations can decide to steer the process of discovering new ideas and trying them out. Building on this, some of the selected cases have invested in steering innovation and structuring it in order to promote innovative data analytics within their organisations. Some have for instance invested in an innovation zone or lab to help people build compelling business cases to solve different business challenges.
This is the case of CBS whose Innovation Lab was started in 2012 and provides “an important instrument for the Innovation programme, it offers a suitable environment to support the generation of ideas and test their feasibility”.80 When the CBS designed their innovation programme, they visited ten other organisations to capture their lessons learnt and decide what would work best for them. Their lab is based on a three steps funnel approach consisting of ‘Ideas generation’, ‘Proof of concept’ and ‘Implementation. A key element of the first step is to gather ideas of any domain and support
structuring it and finding a possible sponsor within the organisation. Limited time and resources are spent on the proof of concept (PoC) aimed at further elaborating the approach and expected results. Finally, the decision to implement is the responsibility of the sponsor who can decide to stop the innovation track if the results are not considered sufficiently fit to implement. According to the experience of CBS, normally only half of the proposals go to the second phase and nearly half of the PoCs are then developed into implementation. This innovation process is thus useful in allowing to fail and decide on a case by case basis whether to proceed or
not with an idea without spending too many resources on it. CBS argues that it is important to be able to fail, but also to fail fast. It is still difficult as people don’t like to fail, however, it is important to be open on successes and failures.
The VDAB similarly has setup a lab for new services. Their virtual disruption lab is aimed at discovering new ways to enhance the agility and effectiveness of VDAB services. The lab harnesses the possibilities of co-creation in bringing new services to the market. Their lab is based on six guiding principles:1. From digital support to digital first;2. Move from service provisioning to ecosystems;3. Move from offering services to coordinating dynamic
service journeys;4. Move from ‘have to’ partners to ‘want to’
partnerships;5. Refocus from planning to agility;6. Move from ‘ad hoc’ initiatives to continuous
development of organisational capabilities
Similar to the approach followed by CBS, the VDAB uses a trial and error principle and involves a target audience for valuable feedback.
Finally, the whole concept of the UNECE Sandbox illustrates the idea of a big data innovation lab. Statistical offices can explore different possibilities. For statistical offices, quality of methodologies and data is essential as they bear the responsibility of providing trusted data and reliable insights. Therefore, having access to an environment to innovate and experiment is crucial in order to explore new opportunities and check their fit-for-purposeness.
CBS: “The best way of having a good idea is having a lot of ideas [...] it is ok to fail, but fail fast.”
VDAB: “The knowledge that something is not usable and viable, is a relevant insight.”
80. Barteld Braaksma, Nico Heerschap, Marko Roos and Marleen Verbruggen, Innovation at Statistics Netherland, 2013. See: https://www.cbs.nl/-/media/imported/documents/2013/15/2013-innovation-at-statistics-netherlands-art.pdf
72

Business case and prioritisation processBesides the technique to try things out using lab experiments, organisations have formal processes to decide on priorities in (big) data analytics. Given limitations in the availability of financial and human resources, public organisations need to decide where to invest. Most cases have a process in place for this, although they differ in how they have designed a formal or less formal process.
Within Statistics Netherlands, the process of prioritisation is included in their innovation programme and it involves formalised structured steps.
The VDAB has foreseen prioritisation processes to decide on priorities related to the development of new solutions and new ways of working. Their entire software factory works in an agile way with quarterly formal coordinated planning processes across various teams. At Flanders Education a steering committee governs a formal yearly planning process and important related ad-hoc decisions.
Transport for London adopted a prioritisation process based on business benefits and value, with the aim to design solutions that bring significant benefits for stakeholders and make sure this benefit is explained clearly. In addition the UNECE sandbox initiative has put in place a steerco board to decide on priorities.
As these examples show, prioritisation is important and a clear process, and in many cases clear criteria, are put in place for prioritising initiatives.
Project management and capacity planningGiven the need to involve multiple skills and mixed teams for successful implementation of big data analytics initiatives, managing diverse teams and skilled people is important. This process requires organisations to reflect on how to manage diversity efficiently, decide on
optimal governance and an appropriate organisational structure.
In many cases the people possessing the demanded skills are high in demand and low in supply even within bigger organisations. Therefore, managing their time carefully in order not to overload them is part of the success of data analytics projects.
This is confirmed by the experience of Flanders Education. They clearly plan involvement in data analytics projects. They formally assign project managers to projects and often opt for combined project management to weigh priorities of different teams within the organisation.
The experience of the UNECE Sandbox initiative is also relevant in this sense. In fact, the project coordinators acknowledged the labour intensive character of working with mixed team. Beside the need for “translators” (e.g. people able to understand both the technology and the business side) there is also a need for a tight governance and follow up of these mixed teams to make sure the focus on sharing of knowledge is maintained.
The Danish Health initiative adopted a national model on how to structure IT Programs. To assure good delivery of projects, they adopt an intensive risk management process and assess carefully the potential costs.
Therefore, processes must be in place to allocate human resources efficiently and ensure the follow up of the project team in terms of risks, budget consumption and value creation in order for the data analytics initiatives to deliver the expected results. It is important to balance these requirements in typical innovation programs as process management can kill creativity in various stages.
TfL: “We have a prioritisation process based on business benefits and value.”
Flanders Education: “We carefully plan our data analytics projects and often assign a team of two project managers to weigh priorities of different teams.”
73
Stakeholder management As mentioned previously, stakeholder management is another important process to take into account for a successful delivery. Key stakeholders need to be on-board from an early stage and convinced of the feasibility or value of the initiative. In order to deliver real value, these initiatives must be embedded in real production processes where they will be impacted by the willingness of all persons involved.
Several lessons learnt on this topic emerged clearly from the interviews in relation to involvement at an early stage, consideration of benefits and impact for all people involved and regular communication on progress and results.
First, it is key to consult stakeholders and make the data analytics solution very tangible for them in an early stage. In addition, one needs to explain benefits for multiple stakeholders focusing on impact for them and use easy to grasp results. The UK National Archives for instance, before launching its project, made a research on stakeholders’ needs and expectations with respect to a possible big data solution on UK legislation. They discovered in this way that the main stakeholders (the
researchers) were very excited and found such a tool very promising but they were lacking the technical skills to deal with it. This early finding allowed the team to work on a very simple and user centric end user solution. Anticipation therefore ensured for the UK National Archives a successful take up and deployment.
The Danish Health initiative has invested a lot in stakeholder management. From general communications at the beginning, they changed to specific communication for each stakeholder group. For example, given that data entry is time consuming, they need to focus and communicate as much as possible on automatic collection and processes to allow general practitioners to have more time for patients.
Additionally, it is important to provide quick wins and to provide stakeholders insight into progress from time to time. For multi-annual initiatives, this approach, adopted for instance by Flanders Education and the Danish Ministry of Health, consists of splitting the initiative into separate projects to keep stakeholders satisfied with the progression and provide them with tangible results all along the way.
What is also important is to clearly communicate the results and added value of the data analytics initiative. The Lithuanian customs for instance are keeping track of the fraud identified through the data analytics system and consequently of the money recovered. These indicators are shared with the rest of the organisation. Communicating the successes is important as it helps in bringing stakeholders on board and gaining more leverage. Therefore, good communication plans are also part of the best practices identified.
CBS: “Good communication is crucial. You need to involve stakeholders in innovation. Everybody will be thrilled with the results of innovation in small projects. When it needs to be embedded in regular operations you can expect some resistance.”
UK National Archives: “We realised that our main stakeholders might lack the technical skills to deal with complex tools. Therefore, we worked on a very simple and user centric solution.”
74
6.3.4. DataUsing appropriate, trusted and qualitative data is essential for successful data analytics initiatives. All cases provided insights on how their organisations perceive and tackle some of the related challenges. Careful data management is considered fundamental, although the focus differs according to the purpose and type of sources and data used.
Most of the public organisations active in big data analytics have previous experiences in traditional data management, reporting or analysis. Some of them created approaches to systematically capture their analytical data in an enterprise data warehouse containing well-structured and cleaned data.
In a big data era, the management of all relevant and available sources in a qualitative way pushes towards new methods and alternative approaches as the traditional way of working is no longer possible. Organisations need to change their way of storing, managing and securing their data. This includes the need to design data flows to store raw data in a landing zone accessible for future use, to decide to what extent it is relevant to store historical data with limited business benefits in a low cost archiving zone and to balance the value of and efforts invested in traditional data governance (quality, integration, security, privacy ...) for each of their data assets.
At the Ministry of Flanders an extensive datawarehouse has been created to maximize the possibilities to link and analyse data cross different source systems providing as much as possible a 360° view on education in Flanders. The effort of carefully adding all available data to this structured datawarehouse needs to be balanced. They might have to invest in alternative ways to first test and analyse some raw data sources allowing to identify new insights and decide which data elements are relevant to add to this existing datawarehouse. Overall, big data creates a more complex landscape of data governance and data management efforts.
The lessons learnt in this section are clustered around the typical areas of data governance including data quality, data privacy and security, metadata management and the challenges of acquiring the right data.
Flanders Education: “It is important to decide if we integrate every new data element in our datawarehouse. As there is a cost associated to this, we first need to test the value of the data for insights.”
75
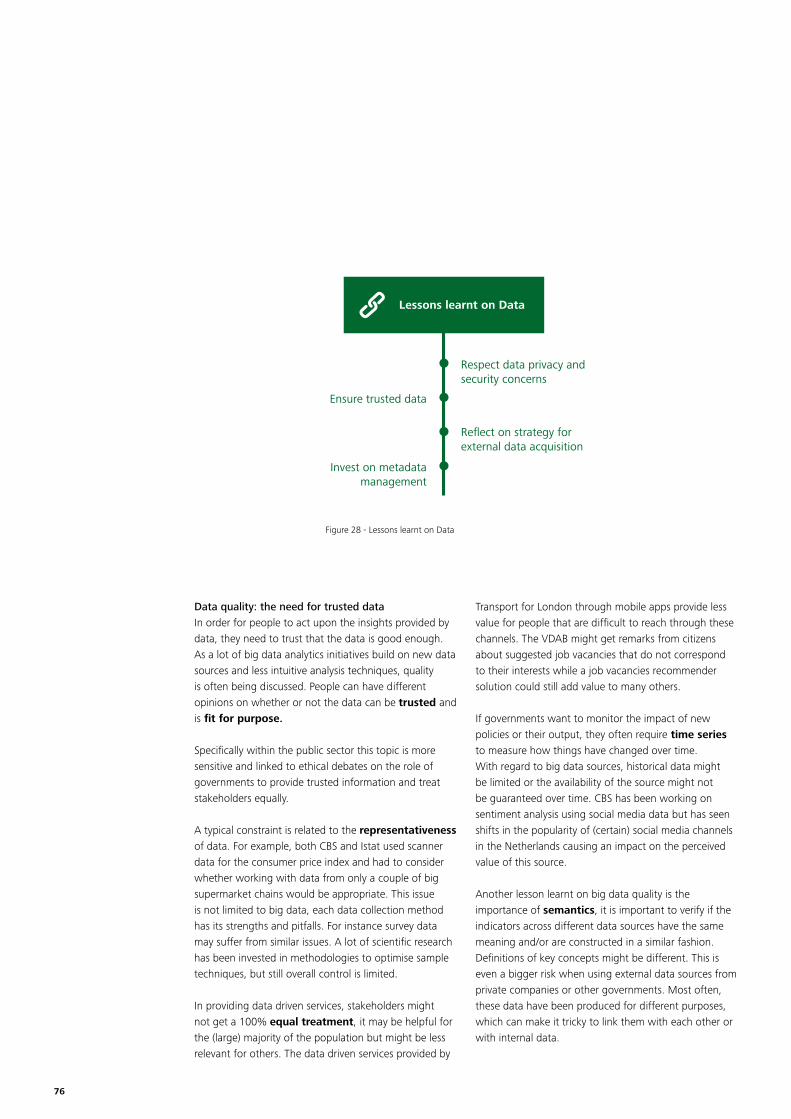
Data quality: the need for trusted dataIn order for people to act upon the insights provided by data, they need to trust that the data is good enough. As a lot of big data analytics initiatives build on new data sources and less intuitive analysis techniques, quality is often being discussed. People can have different opinions on whether or not the data can be trusted and is fit for purpose.
Specifically within the public sector this topic is more sensitive and linked to ethical debates on the role of governments to provide trusted information and treat stakeholders equally.
A typical constraint is related to the representativeness of data. For example, both CBS and Istat used scanner data for the consumer price index and had to consider whether working with data from only a couple of big supermarket chains would be appropriate. This issue is not limited to big data, each data collection method has its strengths and pitfalls. For instance survey data may suffer from similar issues. A lot of scientific research has been invested in methodologies to optimise sample techniques, but still overall control is limited.
In providing data driven services, stakeholders might not get a 100% equal treatment, it may be helpful for the (large) majority of the population but might be less relevant for others. The data driven services provided by
Transport for London through mobile apps provide less value for people that are difficult to reach through these channels. The VDAB might get remarks from citizens about suggested job vacancies that do not correspond to their interests while a job vacancies recommender solution could still add value to many others.
If governments want to monitor the impact of new policies or their output, they often require time series to measure how things have changed over time. With regard to big data sources, historical data might be limited or the availability of the source might not be guaranteed over time. CBS has been working on sentiment analysis using social media data but has seen shifts in the popularity of (certain) social media channels in the Netherlands causing an impact on the perceived value of this source.
Another lesson learnt on big data quality is the importance of semantics, it is important to verify if the indicators across different data sources have the same meaning and/or are constructed in a similar fashion. Definitions of key concepts might be different. This is even a bigger risk when using external data sources from private companies or other governments. Most often, these data have been produced for different purposes, which can make it tricky to link them with each other or with internal data.
Figure 28 - Lessons learnt on Data
Lessons learnt on Data
Respect data privacy and security concerns
Reflect on strategy for external data acquisition
Ensure trusted data
Invest on metadata management
76

The Lithuanian Customs for instance, have to deal with unstructured and sometimes uncomplete data coming from other registries. Also, in the case of Denmark Health a new data model was created to combine data from different registries in order to harmonize the total dataset. The Danish Ministry of Health indicated that aligning data with the EU standards is still a big challenge regardless of their data management processes as definitions are different. This is typically a semantic interoperability challenge.
The experience of the UNECE Sandbox project has revealed that the typical requirements of statistical offices in terms of data quality are traditionally high. They publish official figures created with a transparent methodology and based on high quality data sources. New data sources in the area of big data might not be able to live by these strict requirements. The UNECE initiatives on big data have invested in creating a set of rules for effective quality management of big data.
In order to deal with various domains of data quality issues, public organisations need to assess the purpose for which data are used, examine data quality in this context and decide on feasible corrective actions. When providing insights or publishing official reports, they need to inform on data quality efforts and create transparency on limitations. It is important to consider the probability that insights would change significantly with better data quality (which may not always be the case depending on the purpose and results).
Many of the cases confirmed that addressing data quality is time consuming and resources intensive. The Estonian customs, for instance, try to solve the risk of human errors by prefilling questionnaires with available data before sending them for completion to companies. This is a big help in reducing mistakes but represents a bigger operational cost and sending information back and forth to correct takes time. They balance efforts and focus on the most manifest issues.
Data quality of machine collected data (such as passenger data from Oyster cards at TfL) is impacted by machine failures and human errors. Machine failure can cause gaps in the streaming of data. Especially for revenue collection they need to invest in keeping systems running to ensure data quality.
Knowing and evaluating your data assets is important. It means getting the most out of them by being able to play on their strengths, minimise the impact of potential issues but balance the effort of uplifting quality with expectations for improved insights.
Whatever the source of data is, experienced public organisations recommend to invest a well-considered effort in data quality issues addressing them with reasonable effort. Reasonable effort means that the intended purpose, effort and expected benefits are being carefully considered. After all nobody wants to invest in creating insights or services that are not trusted due a lack of trust in the underlying data. Executing a first assessment and visualisation of the data is relevant to decide on further actions.
Another lesson learnt with respect to data quality is linked to the importance of stakeholders if they have an important role in creating, collecting and trusting the insights provided. This aspect was clearly explained by the cases of Flanders Education and Danish healthcare.
In the latter, the Danish Ministry of Health depends on the input of healthcare stakeholders to ensure data quality. This pushes them to follow two general rules. First of all they balance each idea for more detailed or new data with the investment to change underlying systems and with the extra workload for data entry.
VDAB: “We always have to consider the possible effects of small amounts of bad data”
Danish Health: “Match data quality to purpose in order to decide what is necessary.”
Danish HealthCare: “Changing one element of our data model has a huge impact on all parties involved.”
77
More workload and frequent changes to requirements will have an effect on the overall data quality level to be expected. Secondly, they try to provide each stakeholder with relevant benefits as an incentive to provide high quality data by providing information and reports to the parties involved.
The Ministry of Education of Flanders has a similar experience. In their case most of the data entry is done by schools. By offering analysis and benchmark information, they want to affect the benefits for and involvement of each school(s). In some cases they ask schools to formally sign-off a feedback data report to ensure it is trusted by all parties. As some of their data is used for financial grants, this uplifts the overall data quality.
Both organisations recommend giving something back to stakeholders who can impact data quality. They carefully consider stakeholder and data quality have an effect on before they decide to enlarge the scope of the data requested and the workload for people involved.
Transport for London even uses data analytics to improve the trustworthiness of their data and provide a better customer experience. By searching within their revenue collection data – traditionally already of good quality – for network, machine or human errors, they are able to boost customer satisfaction by arranging automatic refunds where appropriate.
Data privacy and securityPublic administrations face many constraints when it comes to data privacy and security and, as some stakeholders suggest, many more than in the private sector. Also, it is commonly argued that privacy legislation is not completely adequate for the big data analytics era.
A first data privacy and security concern has to do with the limitation of using public cloud solutions for privacy related data. The mere volume of data pushes towards flexible and scalable solutions, which makes the cloud model a practical option. Many stakeholders indicated regretting the fact that, regardless of the investment of vendors in security of cloud solutions, the perception on cloud is still biased. In this sense, one of the interviewees clearly stated that many modern cloud
solutions are safer than in-house solutions because of the number of security engineers involved and the sometimes lack of specialists in public administrations.
In order to share infrastructure costs and facilitate the sharing of data, governments can collaborate in private shared infrastructures. The challenge of privacy and security remains as explained by UNECE participants. Statistical offices cannot always easily share all data on a supranational level; different national privacy laws might limit them. In the case of the UNECE initiative, the statistical offices have opted to include only non-sensitive or open data. This limited the infrastructure challenge and offered a more open way to share insights.
This element is also underlined by the Lithuanian customs. With regard to fraud analytics in particular, cross-border exchange of data is proven very useful. However, due to privacy constraints, this exchange is currently not happening to the desired extent.
Data security and privacy are important obstacles to overcome for public administrations carrying out big data analytics. Where often in the past a detailed level of data was not kept for storage reasons, big data technologies allow to store, treat and analyse bigger chunks of data. Therefore, with big data the challenges even become bigger as providing large information files to others has infrastructure challenges for processing the data effectively over a secured data network.
As these examples show, data security can be a drawback for any big data analytics initiative, especially when these entail cross-organisation, -domain or -border exchange of data. Nevertheless, the question on security and privacy exists on all levels and is affected by public opinion as stakeholders are more and more concerned about how their data are used and how this might affect privacy concerns.
A one size fits all solution for this challenge has not been identified. To overcome this challenge some cases created clear processes to handle data security concerns. TfL for instance, does privacy effect
Istat: “The paradox is that Google knows everything about us. However, when governments want to access similar data they face many constraints.”
78
assessments and a case by case analysis of the required level of detailed information for each analytics initiative. Also, they work very closely with the Information Commission of the UK that provides them guidance and information.
A similar approach is taken by the Danish Health Ministry. They have developed a governance model for dealing with data security matters which involves many different stakeholders and which is able to take decisions on the adequate level of detailed information for each case. The involvement of stakeholders ensures that there is ownership in terms of sensitive decisions concerning data.
At the level of the Flemish Government, a body was created to govern all aspects of electronic data exchange.81 Departments or agencies process their requests for specific cases through this decision body. Flanders Education has adopted very detailed calculation mechanisms in automated reports to avoid showing data containing only a limited number of students. This in order to avoid that the information provided might lead to identification of individuals. This mechanism has created an extra complexity on top of their solutions.
Expectations for governments are that they lead by example. Structured processes and stakeholder involvement at least provide evidence for the attention given to the topic. At the same time however, technology vendors are providing better and more solutions in this area to manage the issue to the maximum extent possible.
Metadata management: to document or notAs mentioned in section 6.3.2, data scientists are short in supply and high in demand allowing them to switch jobs as they see fit. Governments might need to adapt to a more flexible workforce. They need to make sure that a new experienced data scientist entering the organisation can quickly catch up to work with the typical data assets of the organisation.
As the number and size of available data sources in governments is growing at a fast pace, people involved in analytics (data scientists) are spending more time in navigating through this landscape, finding and
understanding the value of each data element and getting it ready for analysis.
This is why most of the cases insisted on the need to document information about data assets to facilitate the work of data scientists and avoid the risk losing their knowledge and insights within the organisation if they would decide to leave.
This may seem obvious. However, the activity of writing down semantics and definitions, documenting programs and data quality insights, is not what skilled data scientists tend to prefer to do. Often documentation is only relevant for future use or colleagues. Personally they sometimes do not see the need to document as they might have the information from the top of their head. This is a risk given the need for multi-disciplinary teams that need to share information, the expected potential for mobility of human resources and the huge impact a lack of documentation might have on the performance or quality of the work of data scientists.
In addition, when organisations share data, they should be sharing metadata together with the raw data provided. As with data quality the art is again in balancing efforts with benefits. Transport for London puts considerable effort into documentation and sharing knowledge between developers. They want to make sure that whatever they do on improving data or analysing its usefulness is documented so that they can reuse it at a later stage. In this sense, they work with very clear documentation and they get developers to review each other’s work.
TfL: “We have learned that documenting our data assets, logic within data, intelligence on data quality, insights on how data can be used is very important to benefit from past work.”
81. http://www.vlaamsetoezichtcommissie.be/
79
On the other hand, it also happens that in many cases experienced data experts have become “walking metadata libraries”, making them a crucial asset for the organisation but causing an overload in their daily tasks as they are the only way to help colleagues navigate their data landscape.
To conclude, documentation may seem a task taken for granted but it has nonetheless a clear added value when done properly. Therefore public authorities should invest and manage to do it consistently over time notwithstanding any change in team and data.
Data acquisition: using data owned by othersThe use of external data has emerged as one of the possibilities for public administrations to gain new insights and analyse policy topics from a different perspective. Some cases shared lessons learnt on acquisition and usage of external data with respect to both cost, data brokers, feasibility and privacy.
The first question public administrations have to address when envisaging to use external data sources is whether they are willing to pay for them or not. CBS for
instance made a clear decision by opting for not paying for data in order to prevent vendor lock-in and due to cost considerations. CBS does contemplate paying for limited services of data aggregation or cleaning but not for the data itself. In the case of social media data they in fact compensate an intermediate data broker
company for the work to prepare the data for efficient and secure use by CBS. Istat took a similar approach for supermarket scanner data. Indeed, they‘ve paid for the data associated costs and not for the data themselves.
This cost element prevents public administrations from widely using relevant external sources. For instance, in the domain of social media, Twitter reorganised in 2015 the market for usage of their data when they acquired Gnip to establish a direct relationship with their data customers and get more direct control over this commercial market. Different national laws can also add to the complexity of this domain describing whether or not the government can get access grants to data they did not create themselves.
Besides the question of the costs for the acquisition of data, some lessons learnt concern the effort of preparing external data to make them suitable for analysis. Indeed, if one takes for instance data gathered through web scraping, it may require high costs to develop a stable scraping solution. Public administrations have to anticipate the implicit costs associated with that.
Finally, aside of the costs and effort of acquiring external data, the question on data quality remains pertinent concerning the reliability and sustainability/stability of external data sources.
CBS: “We do not pay for external data. We cannot afford to have a vendor lock-in. We can consider small payments for services around the data but not for the data itself.”
UNECE: “When you start, you think that big data means a lot of available free data that are immediately usable. But this is not always true.”
80
Some of the lessons learnt in frequently discussed external data are listed below: ■ Social media data, besides the potential cost or
effort to require them, might not be able to provide stable or international comparative information over time. Some very famous social media that were widely used a few years ago are not anymore. Also, there are quite some cultural differences in the use of social media and in their spread. Therefore, there might be issues of comparability of data even within the European Union. If one overcomes these drawbacks, social media showed in the past few years a quite good reliability in some areas where they were used such as consumer confidence, touristic statistics and other domains;
■ Mobile phone data provide good and reliable sources in certain areas like for tracking (cross-border) mobility of people or analysing the nature of social networks. Getting the data from telecom operators is difficult due to privacy laws and commercial risks involved. CBS was able to solve this by getting aggregated data through an intermediate data broker, which obtains anonymised data from the telecom operator;
■ Wikipedia stats provide information of the web usage of Wikipedia pages. The reliability of this information declined as more and more mobile phones are used to access and this mobile phone use is not counted in the provided statistics;
■ Supermarket scanner data have provided good insights to both CBS and Istat. They have obtained the data directly from a supermarket chain or through a private information broker. It is important for governments to avoid disclosing information that might affect the competitive position of each supermarket. Partnerships on data need to include a solid description on potential risks for the private companies involved.82
As all these examples prove, there are definitely some challenges linked to the use of external data sources by public administrations. However, several case studies use external data successfully.
As described previously there are also many initiatives that share data cross organisations. However, it should be pointed out that linking several databases is not always allowed for privacy reasons. The more information is clustered the bigger risk it can lead to identification.
As the data of governments is growing, there is a bigger potential to share and create societal value in many ways. In the context of big data sharing is complex for both technical and legal reasons. An important overall lesson learnt is the importance of good partnerships in the sharing economy of data.
CBS has recommended to find relevant win-win strategies. This entails that governments could provide information back to private companies or colleagues by sharing their insights and algorithms on how to mine their data. Moreover, governments can be relevant trusted third parties in providing market benchmarks to the benefits of multiple parties. It is however important to establish trust on how the data will be used on what the mutual or societal benefits in each case will be and to acknowledge the sensitivity when insights might impact the position of the other party. As a recent report of a working group of the United Nations Statistics Division on big data partnerships mentions: “Governments should collaborate rather than compete with the private sector, in order to advance the potential of data. At the same time, they should remain impartial and independent, and invest in communicating the advantages of exploiting the wealth of available digital data to the benefit of the people. Building public trust will be the key to success.”
UNSTATS: “Governments should collaborate rather than compete with the private sector. [...] Building public trust will be key to success.”
82. http://unstats.un.org/unsd/trade/events/2015/abudhabi/gwg/GWG%202015%20-%20item%202%20(ii)%20-%20Good%20practices%20for%20data%20access%20and%20partnerships.pdf
81

6.3.5. TechnologyAs explained in chapter 4.5, the vendor landscape of big data and analytics solutions is complex and growing rapidly. Navigating this to select the right solutions and components and to integrate them in an optimal analytical platform is difficult. Moreover, the dynamics of the open source community and the specific nature of big data make the challenge to build an optimal infrastructure even more complex.
The model of a traditional reporting platforms is increasingly becoming out-dated due to the advent
of disruptive technologies and new big data vendor offerings.
When asked about their technology solutions and data architecture, the selected case studies referred to one or more of the challenges mentioned in chapter 4.5.183. They have provided some key advices on how to navigate the extensive solution landscape and make optimal choices. These are discussed in the following subsections.
Figure 29 - Lessons learnt on Technology
Lessons learnt on Technology
Provide sandboxes or discovery possibilities
Take into account the requirements of multiple stakeholders
Share technology and infrastructure where appropriate
Weigh pros and cons of open source and
proprietary technology
Build competences to acquire the right technology
Build solution in components that can be
shared or reused
83. As for the study only a limited set of cases was interviewed, this report does not have the goal of bringing representative evaluations of particular technology solutions. The report will not discuss the quality of different solutions.
82
Discovery and sandboxQuite a lot of the case studies expressed the need to be able to experiment with big data. They have created and experienced the benefits of analytical sandboxes, or innovation labs to provide a platform for agile development whilst enabling to safeguard properly regulated production environments.
Sandboxes encourage the use of new tools, techniques and exploratory activities such as the ability to modify and enrich existing data models and usage patterns, and do away with the organisation rigour around data cleansing, mapping and business rules.
This can be a collection of virtual or physical environments and workspaces that empower data scientists to innovate and build prototypes in their preferred or most appropriate software environments.
The following examples of such environments were identified during the interviews. Their test labs have been used to try out new technology, discover the value of new data and/or new analytical approaches. ■ The UNECE sandbox is clearly a positive example in
this area. Both Istat and Statistics Netherlands have used this environment and underlined its benefits during the interviews. As they put it, it is key to have a protected environment outside their production, one where to experiment freely. This accelerates innovation and mutual learning.
■ In addition to the UNECE Sandbox, CBS also has its internal innovation lab. Here the statisticians can work on computers without the restrictions imposed by their closed internal IT network. This makes it easier to test new methods, try out non-standard software and simulate alternative statistical processes. The lab is an inspiring physical environment offering also a suitable location for brainstorm sessions, workshops and informal presentations.
■ A similar example of an innovation lab is the VDAB virtual “business disruption lab” for which the solutions are not embedded within the organisations production systems to reserve the agility and the flexibility required to freely experiment.
■ The UK National Archives also made progress by testing their analysis on a sandbox. It gave them clear
insights on the performance for some types of data queries. Through this environment they realised the importance of finding a good balance between the requirement to provide detailed granular results to a wide public and still be able to keep the solution performant enough. The creation of such sandbox was also linked to the concern to avoid using the production environment of their legislation databases for testing purposes.
The people involved in the innovation labs or sandboxes pointed out to several lessons learnt related to sandboxes and in particular the following: flexibility in tooling, the benefits of collaboration models or insight-as-service and the final challenge to incorporate sandbox tests in regular daily operations and solutions.
The number of big data solutions is rapidly growing and most of them follow a steep curve for new developments. It is therefore important to make sure sandboxes are flexible and allow to test new solutions as they become interesting. To incorporate new features and product releases it is important to keep a certain flexibility. Organisations however, want to limit the total cost of ownership in an experimental phase. People from the UNECE initiative and from Istat referred to this flexibility by mentioning the work at hand for the team managing this sandbox.
To split upfront investments, it can be worthwhile to engage in collaboration models. Some public organisations, like the UNECE initiative, have decided to start a joint sandbox initiative which provided them extra benefits. Another way organisations have dealt with the need for discovery is by engaging third parties to execute studies or do -analysis for them bringing “insights-as-a-service”. Consulting companies, research centres or universities might be able to provide services by using their own infrastructure to experiment and test business value. Transport for London mentioned a collaboration with MIT and UK universities. Flanders Education has requested in some cases analysis from specific research institutes84. VDAB is collaborating with universities and private companies in their business disruption lab.
84. http://www2.vlaanderen.be/weten/steunpunten/steunpuntenG3/ssl.htm
83
After successful lab experiments, organisations might be willing to incorporate them in regular daily operations and solutions. The challenges to “industrialize” solutions and make them up for repetitive value requests a more robust, resilient, performant and reliable infrastructure. Assumptions about the possibility to use the same technology for experiments and production systems might lead to bad choices on both sides. Some cases, like the Lithuanian customs, started to develop analytical models using already available tools. They invested in new tooling when appropriate to uplift the performance of the related solutions. The analysis to consider changing technology as one moves from a test to a production environment could be perceived as a slowdown in this process but should be a deliberate choice focusing on what matters at each moment of the lifecycle.
To conclude, in an area of big data analytics, a sandbox zone for rapid discovery, testing technology and first visualization of available data is an important asset. As organisations mature, they discover the permanent and repetitive need for this. The capability for experimenting is permanently embedded within their overall IT architecture. Government organisations that collaborate in this discovery zone get extra value from sharing learning experiences, economy of scale and potential reuse of open data. However, technology for production solutions might require different application management requirements.
Open source or proprietary sofwareDifferent open source software and frameworks -like Hadoop powered solutions, NoSQL databases or machine learning analytics solutions - are emerging rapidly and provide suitable solutions to the technology challenges linked to big data and analytics.
UNECE: “It was clear from the start that we needed open source technology. We wanted to test the value. We have learnt that a lot of these solutions change very rapidly with new releases in short amounts of time.”
84
concerning technology adoption but it is rather a case by case decision that has to be taken after considering, and trying, available options.
Consider multiple stakeholdersMature organisations understand that big data involves multiple challenges and needs to cater for various types of users with various skills. This means in most cases that solutions need to be integrated for optimal collaboration but need also to empower users with the right features according to their skill level.
Selecting the right software tools considering all specialists involved and designing optimal end user applications are important challenges for big data technology investments.
Like stated by the people from the UK National Archives, through stakeholder management they have discovered about the typical skills of their intended users and realised they had to take this audience in the back of their mind when designing their solution.
When discussing about their technology choices, a lot of the interviewed people have referred to requirements of specific stakeholders. Organisations need to balance the individual perception and preferences for technology to execute personal tasks, the total cost of ownership and the need to avoid double work in different tools.
Istat argued, for instance, that they have adopted a hybrid architecture using both their existing relational Oracle database and a Hadoop cluster. They store the data in Hadoop and keep the data of the current year in Oracle. This is because the skills to work with Oracle are more available in the organisation.
In addressing the needs of various user groups, the
UK National Archives: “While building our architecture and solution we keep the end-user in mind.”
Progressively proprietary technology vendors like IBM, SAS, and Google are investing in integration with some open source projects which clearly points out their value. For the UNECE sandbox, it was clear from the beginning that they needed open source technology. They wanted at least to test the value. They have discovered that some of these solutions tend to change very rapidly providing new releases in short amounts of time.
In overall the interviews provided insights on the benefits and potential issues linked to some open source software: ■ Stability vs. frequent updates: Open source
software is evolving more rapidly because of the sharing that takes place among developers. It might be good to include new features and analysis possibilities but this could also impact the robust nature and operational cost of maintaining the infrastructure. The extent to which solutions are business critical needs to be taken into account when opting for a scenario in which one rapidly needs to upgrade software.
■ Support for potential issues: For open source technology there might not be a full service support or guaranteed fixes for potential bugs. The capacity of the network or community using the open source solution is therefore important. Some interviewees have advised not to count only on documentation of solutions as it is often outdated or does not exist at all. To deal with potential issues, organisations need skilled and versatile people here that can navigate through information from communities and solve issues as encountered.
■ Some of the solutions in this space lack proper management tools. Some proprietary software vendors are tapping into this as they provide management modules on top of common frameworks as Hadoop.
■ What people value the most is the “try before you buy” nature of open source technology. It allows them to experiment freely where proprietary software requires upfront investments.
There are therefore pros and cons of both open source and proprietary software. What emerged from the study is that there is no one-fits-all answer to the question
85

interviewed case have been providing a list of typical features requested by part of their team. It provides a guideline for important capabilities to consider.
■ IT, technical and data management experts appreciate the importance of performance, automation and integration to limit efforts in repetitive tasks. The administration and configuration of solutions needs to offer simplicity. Data from various sources need to be accessible and systems need to be integrated. The solutions need to allow monitoring and be resilient, redundant, performant and scalable. Both the Danish healthcare Ministry as the people of the Ministry of Education in Flanders have invested in automation for data gathering and quality. They value the automation capabilities of visualisation and reporting solutions to avoid individual customization and personalization of reports for large stakeholder groups. Flanders Education seriously tested this capability to roll-out self-service analytical solutions to all schools. Estonia confirmed technical challenges to build stable solutions for daily data exchange with partners. They perceive setting up a system for automation to be cumbersome.
■ Analytical specialists mention the importance of transparency about and richness of underlying analytical and statistical algorithms offered by the software at hand. Solutions which provide a wide list of relevant algorithms and cater for the ability to select the most optimal ones are often high on their wish list. This can be about breadth of the analytical models (different approaches provided) or about the depth of the techniques (algorithmic sophistication providing greater accuracy and precision). The people interviewed from the Lithuanian Custom Department underpinned the importance of this richness. The National Archives in the UK have created a custom made analysis solution to mine their legal historical data given the specific nature of their data.
■ Not all business analysts have the ability and time to interpret difficult statistical output. They value a solution when it is intuitive and user friendly. They like powerful visualizations and interactive integrated solutions. They want to navigate within various information sources of interest to them and
start from a high level overview allowing personalised drill-down to more detailed data and to a certain extent value customized information where needed. Flanders Education has understood this need and invested in a flexible visualisation solution providing an optimal user experience to school directors and local authorities. VDAB provides the general public an online navigation portal for job market information85. They find it important not to overload people with information and want to keep it simple adding context information for a better understanding of the statistics provided. The UK National Archives have invested a lot to understand how researchers and legislators will use their solution. People might have complicated questions but if they lack the ability to work with the sophisticated tools provided, this is not bringing the right value, according to them. They had to solve this by creating a more polished end user tool.
■ Decision makers need to be able to get information at the precise moment when it is of value to them. They prefer information in appealing mobile apps or embedded in daily operational applications. Solutions facilitate their decisions by providing information on potential consequences or impact of each alternative. Simulations help to lower the level of uncertainty on what might happen. It they are able to affect some of the underlying conditions and drivers behind a simulation, without going back and forth to a data scientist team, the solution brings them even more value. Transport for London embeds congestion and network information in newsletters and mobile apps to reach the relevant target public right on time. By providing alternative routes and information on price benefits they can impact actual decisions and behaviour. In order to provide temporarily solutions and find suitable alternatives during infrastructure works, TfL uses simulations based on historical data. VDAB creates mobile apps to allow job seekers to interact with virtual coaches and access relevant information in an optimal way. They can personalize the behaviour of this virtual coach to their own flavour. VDAB organizes innovation workshops with target customers to ask their advice when designing these solutions.
Organizations should focus more on how they can
85. https://arvastat.vdab.be/
86

integrate different solutions in the best way possible and avoid double work than on pushing all user groups to work with the same technology. Existing skills and user friendliness of technology for a group of people can have a bigger impact on the end result than the potential of double technology costs might have on the overall ROI. Transport for London has only recently investigated a more common centralized approach on technology. They strongly believe that the organisation should allow flexibility to continue to realize quick wins and keep a strong focus on business benefits and value.
Technology acquisition challengesSome of the cases recently went through the process of acquiring new proprietary solutions (software or hardware). They shared some best practices and lessons learnt on how to handle this process as efficiently as possible. This resulted in the following list of general things to consider in technology acquisition. ■ One important advice is not to solely rely only on
the input of technology vendors. Consider the fact that the best technology for your organisation might not have the fanciest features. Embedding and integrating new solutions in an existing infrastructure is important to uplift the benefits. Transport for London for instance mentioned the need to build internal competences able to evaluate different possibilities. It is important to understand well what is at stake. Having to rely on external input only is a risk as they might value features and capabilities differently than your own user public
■ Another important lesson is to get informed, as far as possible, on relevant features and decision criteria and make sure you rank the importance of these capabilities within the organisation. As described in the subsection above, one should consider the requirements of multiple user groups in this process. It is important that they understand the key drivers of technology decisions to obtain their buy-in and acceptance. To give an example, Flanders Education recently bought a visualization technology and, for doing so, they have organised a governed purchase process balancing various requirements.
■ Another tip that emerged during the analysis is to try to assess how costs might change over time if the solution needs to grow. It helps to establish easy to understand comparative elements between vendors. Transport for London for instance used price per terabyte as a comparison criteria in its acquisition
strategy. ■ A fourth lesson learnt concerns the potential
challenge of vendor lock in. As technology changes a lot and the market is rapidly growing, you might be willing to change over time or add extra components. It is important to avoid vendor lock-in and include open standards and integration possibilities in the assessment. This was defended by the Danish case interviewed.
■ Finally a fifth criterion was mentioned by the Estonian government in the decision on software tools for advanced analytics. They have checked the local availability of providers or consulting organisations able to provide the setup and configuration of the solution and support the organisation in their first steps.
Public bodies have extra strengths they can use when bargaining for the best price and deals related to software and hardware.
By collaborating in sandbox environments or building solutions open to a large stakeholder group, they provide technology vendors a nice visibility in a larger market. Some of the people interviewed have used this bargaining power in the negotiation for pricing.
Statistics Netherlands and participants of the UNECE sandbox warned however for the typical challenges related to public procurement rules. The official process can slow you down. In a landscape of rapidly changing technology and multiple vendors this is an extra challenge. Open source technology or good solutions from small companies not engaging in the tendering process might not be taken into account due to this tender process. They stated that following official procurement laws, it is easier to procure an expensive server than to subscribe in a joined cost model of a common government platform.
Danish Ministry of Health: “Make sure you are not bound to one technology in particular.”
87

Sharing technology and infrastructureIn the beginning of this technology section in best practices, the possibility of sharing sandbox environments and to the challenges related to data privacy and security that derive from it were pointed out.
Common benefits, sensitivity of the data, privacy legislation and technical capabilities impact the decisions to work on shared infrastructure. The UK National Archives use cloud based solutions in their big data for law initiative. As their legislative data is not sensitive they can benefit from this scalable and relatively cheap solution.
Besides sandbox and cloud solutions, some of the organisations interviewed work on shared production environments. Public organisations decide to build a multi-tenant solution architecture and share technology environments for business intelligence, big data and analytical purposes. Flanders Education for instance has been using a shared environment for business intelligence with other departments of the Flemish government. They recently decided to build a separate visualization solution on a less shared environment.
The Danish Ministry of Health explained that they are considering the setup of a sandbox for research purposes. This way they can allow researchers to make better use of the data on their in-house solution. It allowed them to collaborate in a more transparent way with researchers while executing relevant governance processes on how the data is used.
More internationally, VDAB optimizes the use of their IT infrastructure to match job vacancies to job seekers by providing similar data driven services to the government of Malta.The choice of collaborative approaches to technology as the ones described above is justified by several benefits: ■ Better bargaining power with technology vendors; ■ Cost-splitting for infrastructure, setup and operations
to keep the environment up and running; ■ Facilitation of the exchange of data in a secure way; ■ Impact on skills through exchange of insights and
knowhow on technology or data;
While common initiatives clearly add value, they sometimes struggle through the impact of big data and advanced analytics. The overall cost structure of the environment can change more heavily over time which often results in an unclear cost model and challenges to distribute related cost cross tenants; Below a couple of examples are listed that create challenges in the shared use of infrastructure: ■ Computing power and storage can be consumed
differently by each tenant. This results in planning across organisations or the need to resize the overall architecture. CBS carefully plans the usage of certain servers to optimize bigger workloads. Flanders Education had to do the same on their shared BI infrastructure.
■ Requirements to add new or upgrade existing technology might differ for various parties involved. This results in questions on how to split related operational costs or challenges to avoid effects
88
on the production environment of other tenants. Flanders Education using a shared BI environment could not always impact an ideal window of opportunity for software upgrades.
■ Not all software licensing models might be flexible to provide an easy split cross tenants;
■ Participants contributing financially might leave when their requirements do not longer match. This results in bigger and reassignment of costs to other tenants.
The UNECE Sandbox has started from 2015 with a subscription fee per participant allowing each participant to get a seat in a strategic advisory board. They have decided to stick for the time being to one single sandbox that is not used as a production environment. They foresee future potential changes enlarging the number of sandboxes for specific participants groups or adding the possibility to use part of the infrastructure as a production environment.
To overcome this our interviewees stretched the importance of three main guidelines.
First, it is important to have a central government or party to provide a starting budget for cost components that are difficult to distribute or to handle common challenges both on the technical level as on a more general management level.
Secondly, the infrastructure should be flexible in a way that various components can upscale separately including flexible contracts for technology and services. This offers an easy way to foster growth when needed.
And finally, a transparent cost model allows to calculate who is using what and how costs can be optimally spread according to various criteria. Some often used are number of users, breadth of technology used, consumption of computing power or data volume and requested services from a central operational team.
API EconomyBesides the possibilities to share a common infrastructure, governments can collaborate with multiple parties on another level. They see the benefits of sharing solution components with third parties allowing them to integrate these components in their applications.
Governments more and more release open data API’s to be used in innovative solutions by others. Over 5,000 developers have registered for the open data of Transport for London, consisting of around 30 feeds and APIs focussed on enabling provision of high-quality travel applications, tools and services. Developers have created hundreds of applications, reaching millions of active users. TfL is very much encouraging the use of their open data platform.
Besides providing data, governments are creating data driven solutions that can be reused. VDAB has created a solution to link job seekers with vacancies based on a rich set of competences. It is offered to the government of Malta.
Developing the API economy further in the public sector will require executive-level leadership and governance. CIOs and digital officers will need to champion API initiatives in order to overcome natural organizational resistance. When you discover a winning solution, spread the word to others in your ecosystem to help build interest and momentum.
UNECE: “We are moving towards a more formal governance structure. Strong coordination is crucial in a joint initiative.”
89

90
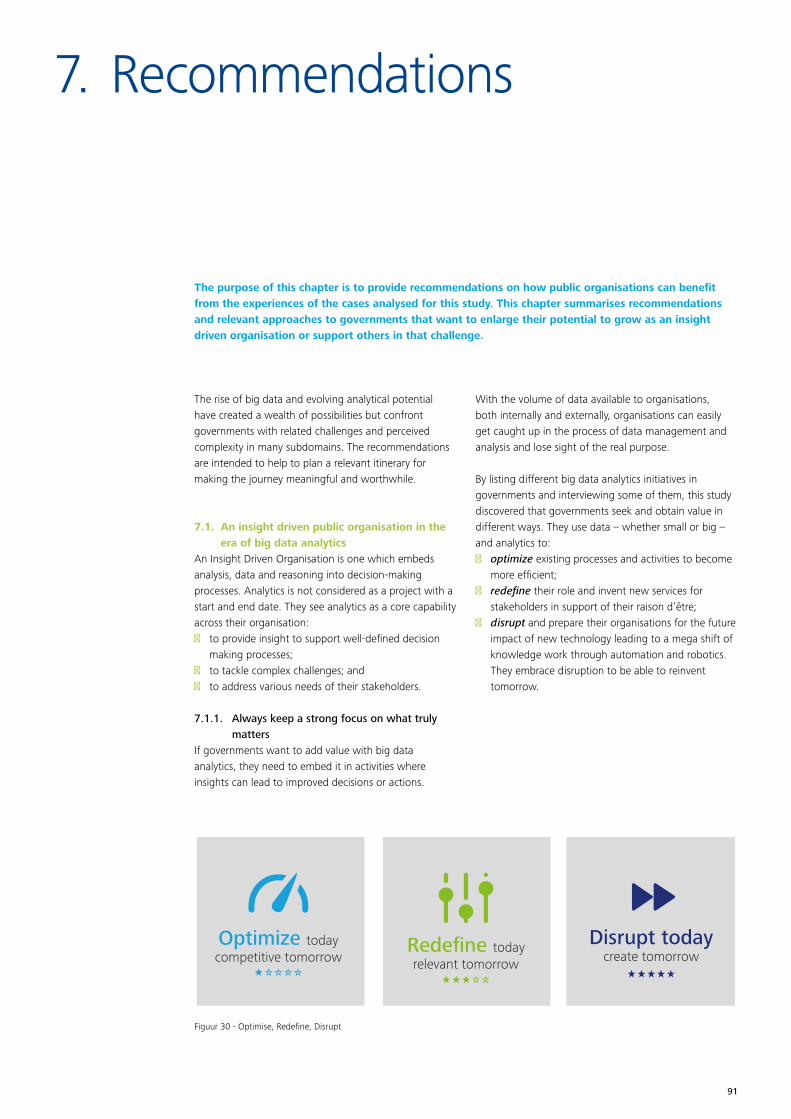
7. Recommendations
The rise of big data and evolving analytical potential have created a wealth of possibilities but confront governments with related challenges and perceived complexity in many subdomains. The recommendations are intended to help to plan a relevant itinerary for making the journey meaningful and worthwhile.
7.1. An insight driven public organisation in the era of big data analytics
An Insight Driven Organisation is one which embeds analysis, data and reasoning into decision-making processes. Analytics is not considered as a project with a start and end date. They see analytics as a core capability across their organisation: ■ to provide insight to support well-defined decision
making processes; ■ to tackle complex challenges; and ■ to address various needs of their stakeholders.
7.1.1. Always keep a strong focus on what truly matters
If governments want to add value with big data analytics, they need to embed it in activities where insights can lead to improved decisions or actions.
With the volume of data available to organisations, both internally and externally, organisations can easily get caught up in the process of data management and analysis and lose sight of the real purpose.
By listing different big data analytics initiatives in governments and interviewing some of them, this study discovered that governments seek and obtain value in different ways. They use data – whether small or big – and analytics to: ■ optimize existing processes and activities to become
more efficient; ■ redefine their role and invent new services for
stakeholders in support of their raison d’être; ■ disrupt and prepare their organisations for the future
impact of new technology leading to a mega shift of knowledge work through automation and robotics. They embrace disruption to be able to reinvent tomorrow.
Figuur 30 - Optimise, Redefine, Disrupt
Optimize todaycompetitive tomorrow
Redefine todayrelevant tomorrow
Disrupt todaycreate tomorrow
The purpose of this chapter is to provide recommendations on how public organisations can benefit from the experiences of the cases analysed for this study. This chapter summarises recommendations and relevant approaches to governments that want to enlarge their potential to grow as an insight driven organisation or support others in that challenge.
91
One of the main findings is that governments achieve better results with (big) data analytics the more they put effort to think thoroughly about different possibilities to optimize, redefine and optimize. They do not consider analytics as a snapshot at a certain moment in time. They try to investigate the value of data in all steps of the policy lifecycle while building solutions that bring long-term value. The more they invest in important decisions both in terms of complexity and repetitive value, the more they deliver societal value with big data analytics.
As they discuss about value and priorities, they repeatedly ask themselves the following questions: ■ What are our key objectives? What is our purpose and
how can better insights from analytics help to get us there or help others to support our goal?
■ How can we use better insights and available data
to innovate and improve the services we provide to certain stakeholders?
■ If we expect that new technology or societal trends will change the expectations of our stakeholders, how can we make sure our organisation is ready to adapt in order to stay relevant? What do we need to explore to discover our potential leverage or role?
A strong focus on value and what truly matters helps in convincing key sponsors and decision makers to invest in this domain. It leads to meaningful conversations in prioritising efforts and cases. It helps project teams to involve relevant stakeholders to explain and ensure value and benefits for them.
Governments should share these value stories among each other and even with private companies to foster the potential big data analytics can bring.
RECOMMENDATION n° 1Think about, discuss and align with key stakeholders about the potential optimizing, redefining or disrupting value of any (big) data analytics initiative. Build supported hypothesis on what could be achieved by improving insights for various stakeholders. List important or regular decisions to be made and formulate them in crunchy questions for which data analytics should provide strategically and operationally meaningful answers. Share your value stories to inspire others.
92
7.1.2. Treat data as crown jewelsOften big data sources have not been created with the intention of analysis. Recurrently, this results in quite some efforts to qualify, clean, improve, enrich, structure and join various data sources for optimal analytical use. Even organisations with quite a lot of experience in traditional data management and analytics are being challenged in the world of big data and more advanced analytics.
The mere velocity, volume and variety of the data pushes them towards building new skills with various technologies both for data management and analytics. Next to that it requires redefined internal procedures to prioritise management and improve data assets.
Structuring all relevant data in an optimal way for future use is no longer feasible as the potential use cases of certain data can be more complex than one could imagine at any given moment in time.
Interviewed organisations recommend to invest at least in good overviews and documentation of
the quality, nature and value of data assets once used to enhance future reuse. They consider trusted data as data good enough for purpose, and avoid data management efforts if the future benefit is not yet clear.
The more governments will act upon data and insights, the more they will have to convince stakeholders about the quality of their data management efforts to establish trust.
Governments need to set an example in embedding data security and privacy by involving the right technology and procedures respecting legislation and underlying ethical principles.
Public sector organisations should consider both internal and external data sources to create value and participate in the sharing of secured open data for societal value. They might even play an important role in this matter as an impartial data broker to combine data from various private companies in a way it delivers benefits for all parties involved.
RECOMMENDATION n° 2Invest in knowledge and knowhow on data and information management in a big data era. Establish stakeholder trust by solid data management procedures respecting related laws and ethical principles. Communicate on why data is good enough for purpose. Do not underestimate how documentation and a good overview of qualitative data assets is becoming an essential instrument for data scientists to navigate and uplift their performance. Share insights on data sources and discover both internal and external, cross domain or cross border data as relevant sources to enhance insights.
93

7.1.3. No one can whistle a symphony, it takes an orchestra to play it.
In many interviews the topics of relevant competences, the availability of people that master them and strategies to source and build missing skills were covered. Mature organisations have discovered how people with mixed skills or at least mixed project teams are important to obtain the desired results.
People tend to speak about two families of skills: the more technical skills (red) on the one hand and more business skills (blue) on the other hand. They have been discussed more in depth in 6.3.2.
Purple people are those who master or at least understand enough of both red and blue skills. They are an important liaison and enabling factor for success in (big) data analytics initiatives.
Mature organisations decide on how they setup their organisation, design project and recurrent processes so multiple competences and skills can meet. They carefully assess own capabilities and decide how to collaborate with other governments, private companies and universities to complement missing competences.
Moreover, they consider collaboration as a particular way to share technology or data in a secure way and create inspiring workplaces for enthusiastic data scientists or purple people.
More recommendations on the potential of collaboration have been described in 7.2
To attract the right talents, public agencies need to understand that it is important to design and present their organization as an interesting learning environment, open for data driven innovation and new ways of working.
Data scientist has been nominated the sexiest job of the 21st century86. As governments traditionally have a wealth of data and a huge potential to uplift societal value with data analytics, they should be a magnet to attract youngsters with the key talents of becoming purple.
Besides the challenge to hire new people, they take care of what big data could do with their existing workforce. It might involve a cultural revolution for the people involved.
RECOMMENDATION n° 3Involve business and technical skills (purple teams) to confront the multi-faced challenges linked to big data analytics. Complement own capabilities with strengths of partners and suppliers to obtain quick wins while building own abilities. Share your lessons learnt with each other. Value the long-term benefits of any initiative in this domain. They help in presenting your organisation as an attractive working place for future purple talents. The war for these youngsters will only grow in the future. Do not underestimate the change management challenge of people involved that need to change their daily habits and old way of working.
86. Harvard Business Review, Thomas H. Davenport, D.J. Patil, October 2012 - https://hbr.org/2012/10/data-scientist-the-sexiest-job-of-the-21st-century/
94
7.1.4. The technology you use, impresses no one, the experience you create with it, is everything.
As so many vendors and open source projects are investing in solutions for big data analytics, organisations struggle with the challenge of navigating through this complex landscape and the process of discovering and prioritising differentiating product features.
Important to grasp is the fact that user experience is key. However, multiple stakeholders and users often start from different concerns when evaluating software solutions. Do not assume power users understand exactly how key decision makers or stakeholders will be able to process any input and act upon insights provided to them. Do not underestimate how efficient security and application management by IT administrators will eventually impact the user experience of power users.
As data volume and variety will further grow, it is relevant to invest in a solution architecture that can scale on various components and that provides good performance and user experience.
Step away from the one size fits all philosophy and shift towards integrated landscapes blending the needs of various stakeholders and related challenges. Most vendors have understood this need for open standards and seamless integrations. Integration, flexibility and future scalability features are higher on their development agenda.
Sandbox and lab environments, whether or not shared between different organisations, have been valuable to investigate the benefits of specific big data cases or test the technical possibilities of certain tools. As such, they provide value in justifying technology investments based on business value and in adding extra insights in the software buying process.
RECOMMENDATION n° 4Design blended, scalable and flexible IT architectures to address the needs of multi-disciplinary stakeholders. Be prepared to change as technology is continuously evolving. Construct sandboxes to provide value both in building compelling business cases to justify investments as in adding extra insights in technology purchase decisions. Use both open source and proprietary software depending on the challenge at hand.
95
7.1.5. It’s not a destination, it’s a journey.When interviewing the cases, it emerged that they all share the same idea of a data analytics journey.
They all describe their experiences as a journey in which they gradually solved different organizational challenges in data management and analytics often referring to historical strengths and investments.
Milestones in their journey had to do with strategic programs or decisions, investments in people, new data sources or optimized technology. They all have designed organisational processes to get repetitive value from investments in this area.
In chapter 6, best practices and lessons learnt were grouped in separate categories: strategy, people and skills, processes, data and technology. In planning each step along the way, mature organisations make sure to dedicate enough time and attention to each of them. Often initial investments do not pay off or journeys end because one or more of these domains have been neglected and not taken into account.
A wealth of opportunities but limited resources forces organisations to pick their battles at any moment in time. Those that approach this journey - towards more impact with data - as a well-balanced program or long-term roadmap, have the best trump cards to win. They make sure to start small with first initiatives building on historical organisational strengths or good enough data. They carefully plan projects as bit-size pieces to make it concrete and obtain quick wins.
If a project fails, they trust that failure is a great teacher and focus on lessons learnt repeating what worked.
Although organisations might have achieved quite a lot, they continue to see remaining challenges and future opportunities: to upscale initial experiments to long term value for their organisation, to continue to attract relevant talent to advance on their journey, to balance providing insights with underlying data management and to uplift the overall value by impacting the benefits for more stakeholders.
RECOMMENDATION n° 5Consider maturity in this domain to be a journey with multiple challenges. Design a roadmap to confront them in a holistic and balanced approach. Understand that success is impacted by attention to all of the following topics: alignment on a strategy and concrete roadmap, skilled multi-disciplinary people, solid processes, trusted data and technology to ensure actionable insights. Dare to fail, as failure is a good teacher. Aligning on a concrete roadmap helps organisations to focus, link various initiatives and build long-term value.
96

7.2. Interoperability challengesIt is clear from the cases that collaboration in the area of big data analytics had many benefits and many organisations are already working together internationally. In addition, sourcing data not only internally from different data sources but also externally from the web, other public organisations and private sector is more and more commonplace. Across the cases several key elements were point out that may form blocking factors working together and bringing together the different valuable sources. As defined by the European Interoperability Framework, interoperability “is the ability of disparate and diverse organisations to interact towards mutually beneficial and agreed common goals, involving the sharing of information and knowledge between the organisations, through the business processes they support, by means of the exchange of data between their respective ICT systems”.87
In the context of this study, interoperability is therefore all about creating the right conditions for sharing and reusing (big) data and collaborate across borders, domains and between public authorities, private companies or universities. The benefits of collaboration in the domain of big data have been strongly recommended by some of the interviewed cases. When discussing these collaborations, the study came across challenges that typically relate to the European Interoperability Framework and across the different levels of interoperability. ■ Data privacy and security: in practice the cases have
shown that there are differences concerning what public authorities can do with data, the ease of access and the issues related to sharing data across countries. There is generally a lack of common rules on data privacy and security requirements. This issue was also highlighted by a recent study from ENISA on Privacy by design in big data stating that “regarding access control policies, purpose limitation, data subject’s consent and location of data [...] interoperability is a critical issue in this respect, in order to allow for the technical implementation (enforcement) of such policies”.88 According to some interviewees this is a legal interoperability issue due to the lack of a sufficient legal framework, as current data protection and privacy
legislation is not up-to-speed with big data analytics. This also points to organisational interoperability issues, given that organisation work differently with such data or have in place different policies and principles. The cases have shown that this limits the extent to which data can be used and shared.
■ Effective collaboration: across the cases there are quite some ways for organisations to collaborate offering each other different services like insights into the possibilities, advisory on how to launch and plan big data analytics initiatives and a related roadmap, providing means (enablement) even produce solutions to be used by others. VDAB for example offers production services to the government of Malta in competence-based matching of job seekers and vacancies. All these services push towards a need for a framework of cooperation agreements and thus organisational interoperability challenges. Governments need to decide how they work together to reach a common goal. This could have to do with a working model on how to allow experts to work across organisational boundaries;
■ Semantics: semantic interoperability of data is underlined by most of the analysed cases as a challenge. The wealth of various big data sources and their size also implies that the challenge to make sure data is internationally comparable is larger. Many of the organisations interviewed recognise the challenge to provide their internal data scientists with relevant metadata on the expanding landscape of their own data assets. The need for documentation, overview and definitions is expanding at a similar pace as the size of data is growing. Multiple cases underlined the added value of sharing datasets across borders or domains, for which ensuring semantic interoperability is essential;
■ Technology: with a large variety of big data analytics technologies available, even within organisations, there is a need to integrate various solutions to accommodate the experience of various stakeholders and types of users. Vendors of proprietary software are investing more in integration with different solutions and even open source solutions. However, the fast evolving landscape of big data analytics solutions will continue to pose technical interoperability challenges.
87. European Interoperability Framework (EIF) Towards Interoperability for European Public Services (2011). See: http://ec.europa.eu/isa/documents/eif_brochure_2011.pdf 88. Privacy by design in big data (Dec 2015). See: https://www.enisa.europa.eu/publications/big-data-protection
97
7.3. Government as an eco-system of insight driven organisations providing each other relevant data and services
The potential of big data and analytics has been uplifted significantly with trends like digital and mobile services, smart cities and the internet of things. Technology provides the possibility to share data from various internal and external sources in almost near real time and exploit it for effective case management and analytics.
Increased collaboration in this area both cross-domain and cross border is resulting in a bigger awareness of the benefits but also a more repetitive investment to cope with interoperability challenges.
As governments are confronted with a need to develop skills and make technology investments, they consider collaborations with external parties and other governments. Some try to redesign their role in this eco-system providing services to others in order to uplift the common maturity level. It allows them to increase the societal benefits from their own investments and broadens their raison d’être.
7.3.1. An increased need to share data across organisations
Governments have always been dealing with societal challenges surpassing domains or country borders. Exchanging data with other governments and private companies allows them to get a better 360° view on stakeholders or certain trends. In a big data world this is more complex for various reasons. The number of data sources is growing and some interesting ones might not be well known. Exchanging privacy-sensitive big
data volumes in a secured way is a complex technical interoperability challenge. Next to that, different legal frameworks might be governing the security and privacy of data, which makes it even harder to find a suitable way of working. For example, with big data some traditional techniques of anonymising for privacy are no longer valid due to the nature of certain data types (eg. unstructured data) and the fact that a large combination of timestamped data points might lead to identification anyway.
Governments need to ensure that shared data is properly used and insights are evaluated against the quality of the provided data. Because of this, governments will increasingly have to provide relevant metadata on their data assets like quality, structure, precise definition of content and insights obtained that could improve potential future reuse. They need to get the semantics of their data right.
It is expected that more governments will invest in shared technology setups and landscapes to deal with the requirement for all kinds of data and information exchange flows. In some cases, governmental agencies or departments with a cross-domain or cross-border responsibility in technology or IT infrastructure will be requested to advise on or provide centralized and secured solutions for data sharing in a cost-efficient way.
If the cost for this environment needs to be split among different stakeholders, they need an easy to comprehend cost model that caters for typical scalability requirements while realizes to predict budgetary impact for all parties involved.
RECOMMENDATION n° 6Understand that data and information management and the creation of qualitative meta-data on your data assets is no longer only important for your own organisation. It might have to be exchanged with partners who will use it to enrich their analysis and in overall provide better services. The semantic interoperability challenge of this will only grow with the fast pace of data sources being created. To deal with technical and legal challenges the creation of common secured technology environments will be relevant to exchange big data files and implement a proper governance framework to deal with security and privacy concerns.
98
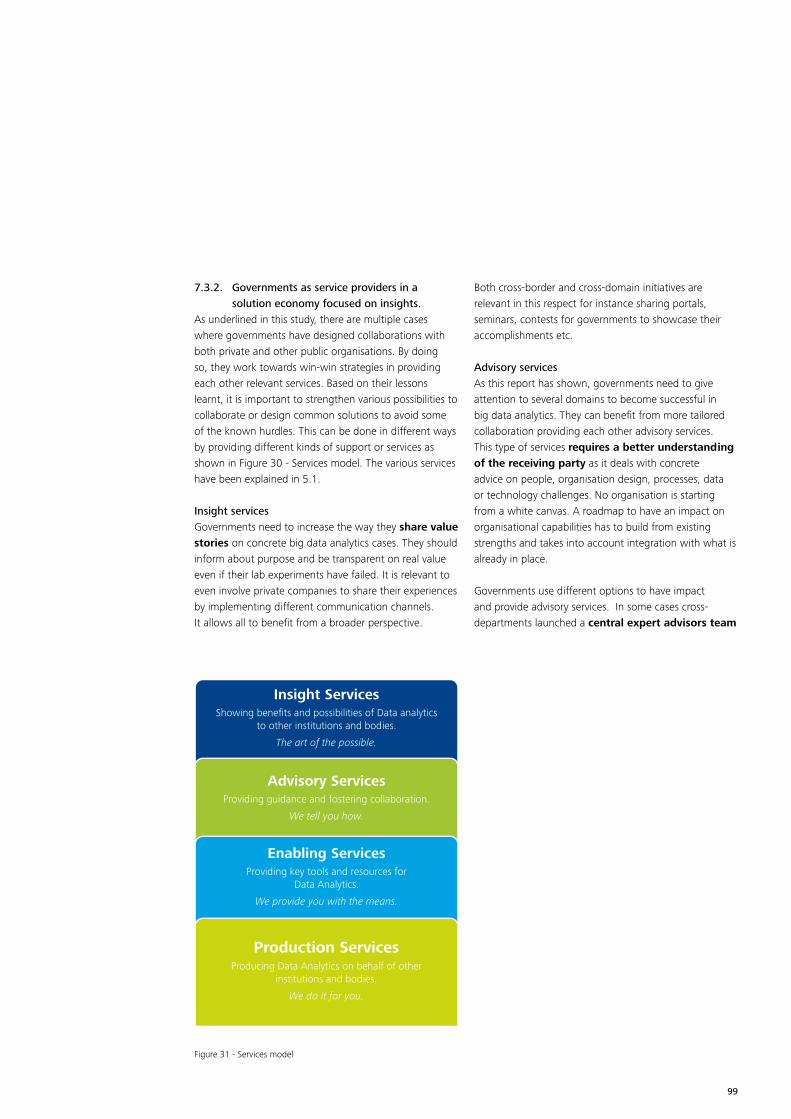
7.3.2. Governments as service providers in a solution economy focused on insights.
As underlined in this study, there are multiple cases where governments have designed collaborations with both private and other public organisations. By doing so, they work towards win-win strategies in providing each other relevant services. Based on their lessons learnt, it is important to strengthen various possibilities to collaborate or design common solutions to avoid some of the known hurdles. This can be done in different ways by providing different kinds of support or services as shown in Figure 30 - Services model. The various services have been explained in 5.1.
Insight servicesGovernments need to increase the way they share value stories on concrete big data analytics cases. They should inform about purpose and be transparent on real value even if their lab experiments have failed. It is relevant to even involve private companies to share their experiences by implementing different communication channels. It allows all to benefit from a broader perspective.
Both cross-border and cross-domain initiatives are relevant in this respect for instance sharing portals, seminars, contests for governments to showcase their accomplishments etc.
Advisory servicesAs this report has shown, governments need to give attention to several domains to become successful in big data analytics. They can benefit from more tailored collaboration providing each other advisory services. This type of services requires a better understanding of the receiving party as it deals with concrete advice on people, organisation design, processes, data or technology challenges. No organisation is starting from a white canvas. A roadmap to have an impact on organisational capabilities has to build from existing strengths and takes into account integration with what is already in place.
Governments use different options to have impact and provide advisory services. In some cases cross-departments launched a central expert advisors team
Insight ServicesShowing benefits and possibilities of Data analytics
to other institutions and bodies.
The art of the possible.
Advisory ServicesProviding guidance and fostering collaboration.
We tell you how.
Enabling ServicesProviding key tools and resources for
Data Analytics.
We provide you with the means.
Production ServicesProducing Data Analytics on behalf of other
institutions and bodies.
We do it for you.
Figure 31 - Services model
99
employed in a consultant way and flexibly allocated to individual projects of other departments. Common multi-year framework contracts with external advisory partners have the same purpose. They solve the burden of individual investment in public tendering to insource tailored strategy or roadmap guidance and advice.
Enabling servicesAn even more concrete step to collaborate is by actually providing enabling services. This type of services helps in very concrete big data initiatives by adding specific resources. It is recommended to think of enabling services on the following topics: the provision of appropriate funding, the sharing of relevant data, the availability of skilled resources and the enablement of providing technology infrastructure.
In some governments innovation campaigns are used to fund initiatives. Innovative employees from different departments can submit interesting ideas for big data analytics. In a second step cases are selected based on value and feasibility. Finally, the government or a central body can enable by supporting the chosen cases with relevant funding.
A well-known application of enabling services relates to data exchange with governments providing open data. By providing open data governmental organisations enable others to create value using this data for various purposes. More and more central governments have recognised the need to bring transparency in the overload of different open data portals. A lot has been invested to uplift the overall quality of open data initiatives. The European Data Portal89 is an example of such an enablement service.
As governments are discovering the value of data from private companies or data brokers, they need to start building solid data acquisition contracts that foster a win-win strategy for both parties while respecting the government’s impartial position. Template contracts or tender guidelines can be very relevant in order to speed up negotiation in this area.
Sharing more privacy sensitive data within governments will benefit the most from common legislation and governance processes to assign the privacy and security risks involved. Ultimately the political will to create a bigger impact in this area is important.
In the hunt for big data analytical skills, governments often need to involve human services from external parties like other governments, universities, data brokers or private companies. They try to source people with the right skills to execute part of the work. By doing so, they expand their talent networks to include “partnership talent” (employees who are part of joint ventures), “borrowed talent” (employees of contractors), “freelance talent” (independent, individual contractors) and “open-source talent” (people who don’t work for you at all, but are part of your value chain and services). This represents a shift from a closed model to an open, more inclusive one and redefines the term “workforce”.90
To cope with the talent challenge of big data analytics, public sector organisations could invest themselves in sharing and combining their workforce with other public organisations in cross-domain or cross-border initiatives. Data scientists from multiple organisations with skills in various subdisciplines might complement each other lowering the need for one employer to hire all skills on a permanent basis. Besides that offering international or cross-domain project-based work might have a positive impact on the challenge to hire. It enriches the multi-disciplinary knowledge of data scientists who could prefer this model above linear pathways dedicated to a single career. The growth of peer-to-peer arrangements can lead to the rise of “first jobs”, “second jobs” and “Wednesday jobs.” In the domain of big data analytics, governments could get value from embracing such a consulting staffing model. Teams with internal and external civil servants form and dissolve as needed, allowing them to focus on specific project outcomes rather than ongoing operations. To make sure governments can grow the number of experts in big data analytics, investment in training of purple people competences can be very
89. http://www.europeandataportal.eu/90. http://government-2020.dupress.com/trend/governments-join-open-talent-economy/
100

worthwhile. Especially if these trainings are tailored to each specific audience. Governments can enable others by setting up a way in which these trainings can easily be shared.
And finally, governments can benefit from enabling services in the area of technology. From common and well negotiated framework contracts with multiple vendors up until the development of shared infrastructure. Governments with similar requirements could align and create more bargaining power with vendors. Transparent cost sharing models that allow to predict cost and cater for both scalability and changes in the group of participants have an important impact on this. A central management - by cross, central or more mature organisations - is important to steer and manage such contracts and collaboration while catering for initial investments that are hard to split.
Production servicesIt also emerged during this study that government agencies engage in production services. They literally process the data or create analytical environments for other parties to provide actionable insights for operational and strategical decisions. The study found many of these services. On the one hand in cross level initiatives or on the other hand where governmental agencies create data driven solutions to have an impact on the behaviour of individual citizens.
In the provision of such data driven solutions, governmental agencies are using the production services of others as they reuse solution building blocks. Some well-known examples in this area are solutions to deal with e-identification, e-signature or e-translation.91 One example of production services is to build API’s (Application Programming Interfaces) that allow software components to communicate.
Among the cases, various examples were identified of governments creating ready-made analytical solutions for partners or peers. By doing so they establish a clear role and increase the return on investment of solutions.
In this eco-system governments should consider how they build internal solutions in a way so that parts of the solution or the knowhow can be shared. By engaging in public-private partnerships, government’s role could pivot from chief provider and administrator of services to enabler or “orchestrator”. Successful governments build open platforms, hold partners accountable for targeted outcomes, open up services to choice and manage crowdsourced campaigns and competitions.
Border agnostic marketplaces emerge in healthcare, education, job training and other categories of public service. Some governments start outsourcing service delivery to nations or multinational companies with strong brands and track records. Governments with best-in-class systems in specific areas help other governments
91. For some more information some examples can be found here https://ec.europa.eu/cefdigital/wiki/display/CEFDIGITAL/CEF+Digital+Home
101
implement their models. Citizens also search for superior service, engaging in “medical tourism” and educational travel across the globe.
Physical and online innovation spaces allow government workers, private employees and social entrepreneurs to work side-by-side, collaborating to create new solutions. These incubators further blur the boundaries between sectors. In the book the Solution Economy92,
a collection of articles explores how, in today’s new “solution economy,” solving social problems is becoming a multidisciplinary exercise that challenges businesses, governments, philanthropists, and social enterprises to think holistically about their role and their relation to others—not as competitors fighting over an ever-shrinking pie, but as potential collaborators looking to bake something fresh that serves as many stakeholders as possible.
RECOMMENDATION n° 7Consider big data analytics as a relevant domain in which governments have increasingly higher benefits to collaborate with both other governments and private companies. They need to improve relevant sharing of secured data and find mutual benefits to collaborate on technology challenges. Collaboration can be designed in multiple formats from providing insights on possibilities to concrete advices, enablement or the provision of readymade solutions to others.
92. http://dupress.com/articles/introduction-the-age-of-the-solution-economy/
102

N° Title Organisation Country Link
1 Riigiraha Ministry of Economic Affairs and Communications (MKM)
Estonia http://riigiraha.fin.ee
2 DataKindUK DataKindUK UK http://www.datakind.org
3 OpenCoesione Ministero dello sviluppo e della coesione economica
Italy www.opencoesione.it
4 Supervizor Commission for the prevention of corruption
Slovenia http://supervizor.kpk-rs.si
5 Regia Centre for Registers Lithuania http://www.regia.lt
6 Using big data for the evaluation of R&D grants in the ICT sector
Secretary of State for Telecommunications and for the Information Society
Spain http://www.data4policy.eu/#!appendixc/c6to
7 SimTD - Secure Intelligent Mobility
Federal Ministry for Economic Affairs and Energy (BMWi)• Federal Ministry of Education and Research (BMBF)• German Association of the Automotive Industry (VDA)
Germany http://www.simtd.de
8 Price efficient, participatory measurement of quality attributes in bicycle traffic through smart phone applications
Technical University of Dresden Germany http://www.data4policy.eu/#!appendixc/c6to
9 Smart Data for Mobility (SD4M)
Research consortium EU http://www.data4policy.eu/#!appendixc/c6to
10 Tender Tracking (Közpénzkeresö)
Corruption Research Center Budapest
Hungary http://www.tendertracking.eu
11 Webcrawl The Dutch Ministry of Interior and Kingdom Relations
Netherlands http://www.data4policy.eu/#!appendixc/c6to
12 Austrian Register Census Austrian Register Census Austria http://www.statistik.at/web_de/statistiken/bevoelkerung/volkszaehlungen_registerzaehlungen
13 Digital Delta • Ministry of Infrastructure & Environment• Local Water Authority Delfland• Applied Science Institute Deltares• University of Delft• IBM
Netherlands http://www.digitaledelta.nl/en
14 Traffic Intensity statistics Statistics Netherlands Netherlands http://www.data4policy.eu/#!appendixc/c6to
15 Internal training for statistics officials
Statistics Netherlands Netherlands https://www.cbs.nl/en-gb
16 Consumer Price Index Statistics Netherlands Netherlands http://www.cbs.nl/nl-NL/menu/themas/prijzen/methoden/dataverzameling/korte-onderzoeksbeschrijvingen/2006-cpi-art.htm
Annex 1 – List of cases gathered by desk research
This annex contains the 103 cases of (big) data analytics in public sector gathered by this study.
103
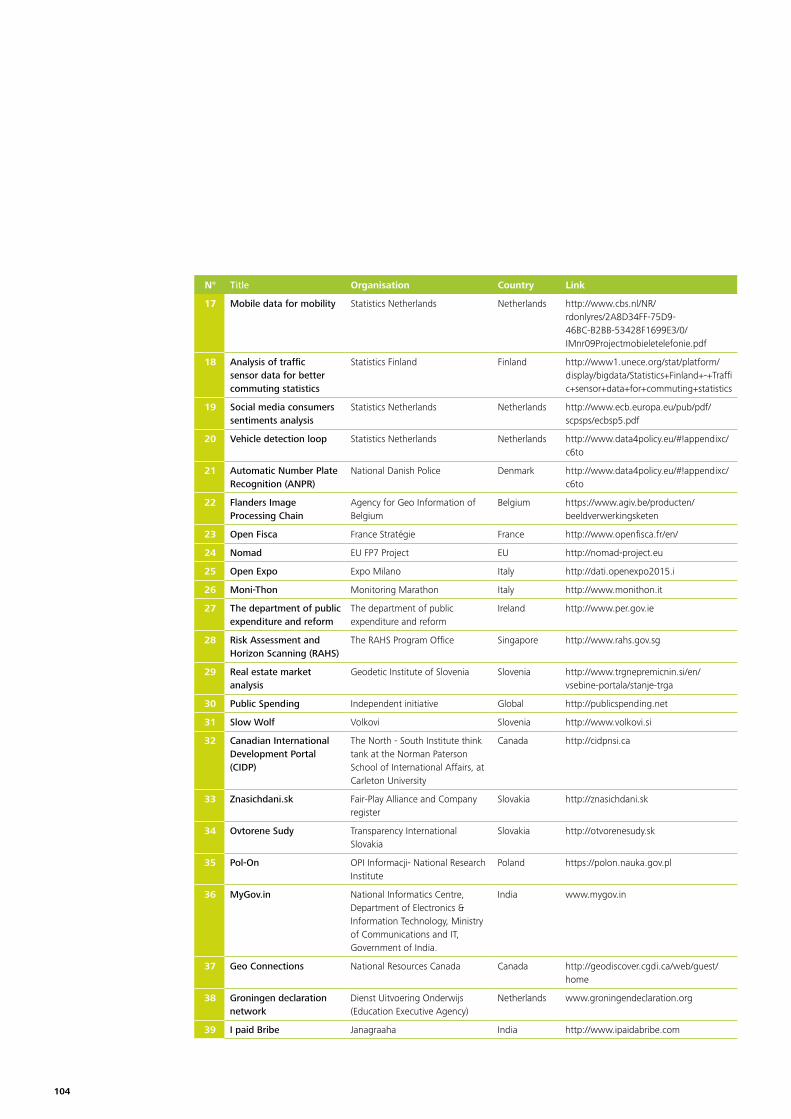
N° Title Organisation Country Link
17 Mobile data for mobility Statistics Netherlands Netherlands http://www.cbs.nl/NR/rdonlyres/2A8D34FF-75D9-46BC-B2BB-53428F1699E3/0/IMnr09Projectmobieletelefonie.pdf
18 Analysis of traffic sensor data for better commuting statistics
Statistics Finland Finland http://www1.unece.org/stat/platform/display/bigdata/Statistics+Finland+-+Traffic+sensor+data+for+commuting+statistics
19 Social media consumers sentiments analysis
Statistics Netherlands Netherlands http://www.ecb.europa.eu/pub/pdf/scpsps/ecbsp5.pdf
20 Vehicle detection loop Statistics Netherlands Netherlands http://www.data4policy.eu/#!appendixc/c6to
21 Automatic Number Plate Recognition (ANPR)
National Danish Police Denmark http://www.data4policy.eu/#!appendixc/c6to
22 Flanders Image Processing Chain
Agency for Geo Information of Belgium
Belgium https://www.agiv.be/producten/beeldverwerkingsketen
23 Open Fisca France Stratégie France http://www.openfisca.fr/en/
24 Nomad EU FP7 Project EU http://nomad-project.eu
25 Open Expo Expo Milano Italy http://dati.openexpo2015.i
26 Moni-Thon Monitoring Marathon Italy http://www.monithon.it
27 The department of public expenditure and reform
The department of public expenditure and reform
Ireland http://www.per.gov.ie
28 Risk Assessment and Horizon Scanning (RAHS)
The RAHS Program Office Singapore http://www.rahs.gov.sg
29 Real estate market analysis
Geodetic Institute of Slovenia Slovenia http://www.trgnepremicnin.si/en/vsebine-portala/stanje-trga
30 Public Spending Independent initiative Global http://publicspending.net
31 Slow Wolf Volkovi Slovenia http://www.volkovi.si
32 Canadian International Development Portal (CIDP)
The North - South Institute think tank at the Norman Paterson School of International Affairs, at Carleton University
Canada http://cidpnsi.ca
33 Znasichdani.sk Fair-Play Alliance and Company register
Slovakia http://znasichdani.sk
34 Ovtorene Sudy Transparency International Slovakia
Slovakia http://otvorenesudy.sk
35 Pol-On OPI Informacji- National Research Institute
Poland https://polon.nauka.gov.pl
36 MyGov.in National Informatics Centre, Department of Electronics & Information Technology, Ministry of Communications and IT, Government of India.
India www.mygov.in
37 Geo Connections National Resources Canada Canada http://geodiscover.cgdi.ca/web/guest/home
38 Groningen declaration network
Dienst Uitvoering Onderwijs (Education Executive Agency)
Netherlands www.groningendeclaration.org
39 I paid Bribe Janagraaha India http://www.ipaidabribe.com
104
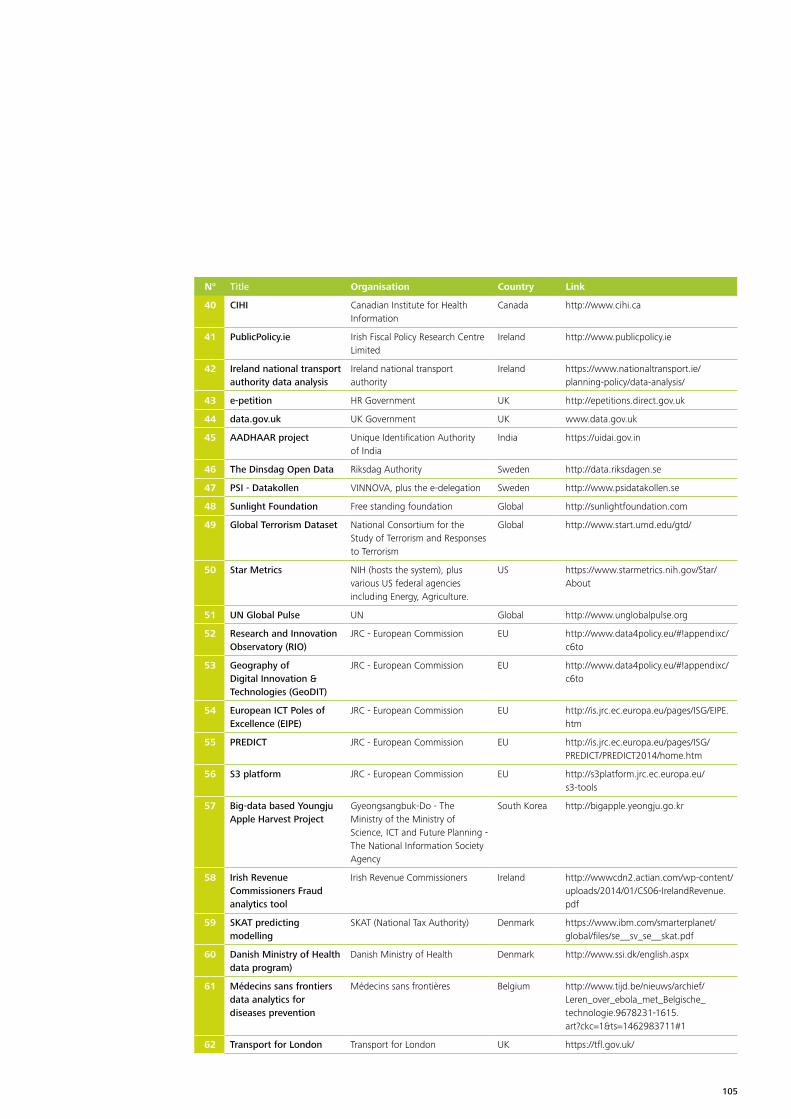
N° Title Organisation Country Link
40 CIHI Canadian Institute for Health Information
Canada http://www.cihi.ca
41 PublicPolicy.ie Irish Fiscal Policy Research Centre Limited
Ireland http://www.publicpolicy.ie
42 Ireland national transport authority data analysis
Ireland national transport authority
Ireland https://www.nationaltransport.ie/planning-policy/data-analysis/
43 e-petition HR Government UK http://epetitions.direct.gov.uk
44 data.gov.uk UK Government UK www.data.gov.uk
45 AADHAAR project Unique Identification Authority of India
India https://uidai.gov.in
46 The Dinsdag Open Data Riksdag Authority Sweden http://data.riksdagen.se
47 PSI - Datakollen VINNOVA, plus the e-delegation Sweden http://www.psidatakollen.se
48 Sunlight Foundation Free standing foundation Global http://sunlightfoundation.com
49 Global Terrorism Dataset National Consortium for the Study of Terrorism and Responses to Terrorism
Global http://www.start.umd.edu/gtd/
50 Star Metrics NIH (hosts the system), plus various US federal agencies including Energy, Agriculture.
US https://www.starmetrics.nih.gov/Star/About
51 UN Global Pulse UN Global http://www.unglobalpulse.org
52 Research and Innovation Observatory (RIO)
JRC - European Commission EU http://www.data4policy.eu/#!appendixc/c6to
53 Geography of Digital Innovation & Technologies (GeoDIT)
JRC - European Commission EU http://www.data4policy.eu/#!appendixc/c6to
54 European ICT Poles of Excellence (EIPE)
JRC - European Commission EU http://is.jrc.ec.europa.eu/pages/ISG/EIPE.htm
55 PREDICT JRC - European Commission EU http://is.jrc.ec.europa.eu/pages/ISG/PREDICT/PREDICT2014/home.htm
56 S3 platform JRC - European Commission EU http://s3platform.jrc.ec.europa.eu/s3-tools
57 Big-data based Youngju Apple Harvest Project
Gyeongsangbuk-Do - The Ministry of the Ministry of Science, ICT and Future Planning - The National Information Society Agency
South Korea http://bigapple.yeongju.go.kr
58 Irish Revenue Commissioners Fraud analytics tool
Irish Revenue Commissioners Ireland http://wwwcdn2.actian.com/wp-content/uploads/2014/01/CS06-IrelandRevenue.pdf
59 SKAT predicting modelling
SKAT (National Tax Authority) Denmark https://www.ibm.com/smarterplanet/global/files/se__sv_se__skat.pdf
60 Danish Ministry of Health data program)
Danish Ministry of Health Denmark http://www.ssi.dk/english.aspx
61 Médecins sans frontiers data analytics for diseases prevention
Médecins sans frontières Belgium http://www.tijd.be/nieuws/archief/Leren_over_ebola_met_Belgische_technologie.9678231-1615.art?ckc=1&ts=1462983711#1
62 Transport for London Transport for London UK https://tfl.gov.uk/
105
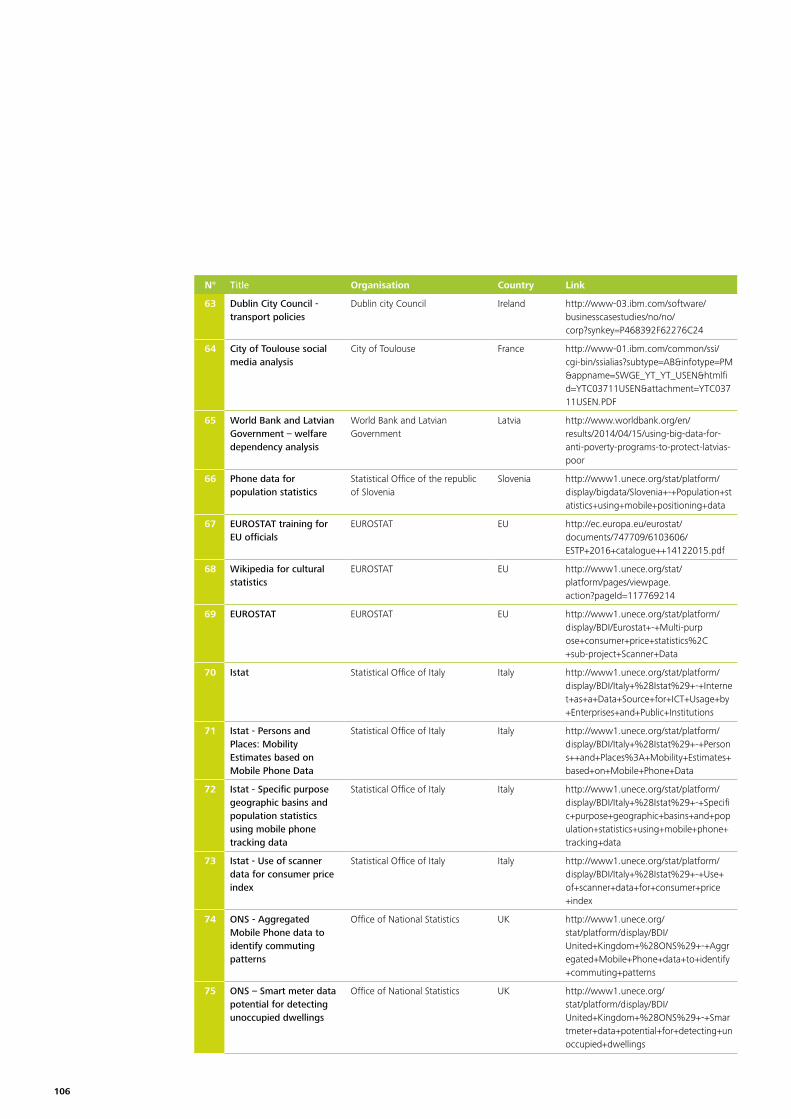
N° Title Organisation Country Link
63 Dublin City Council - transport policies
Dublin city Council Ireland http://www-03.ibm.com/software/businesscasestudies/no/no/corp?synkey=P468392F62276C24
64 City of Toulouse social media analysis
City of Toulouse France http://www-01.ibm.com/common/ssi/cgi-bin/ssialias?subtype=AB&infotype=PM&appname=SWGE_YT_YT_USEN&htmlfid=YTC03711USEN&attachment=YTC03711USEN.PDF
65 World Bank and Latvian Government – welfare dependency analysis
World Bank and Latvian Government
Latvia http://www.worldbank.org/en/results/2014/04/15/using-big-data-for-anti-poverty-programs-to-protect-latvias-poor
66 Phone data for population statistics
Statistical Office of the republic of Slovenia
Slovenia http://www1.unece.org/stat/platform/display/bigdata/Slovenia+-+Population+statistics+using+mobile+positioning+data
67 EUROSTAT training for EU officials
EUROSTAT EU http://ec.europa.eu/eurostat/documents/747709/6103606/ESTP+2016+catalogue++14122015.pdf
68 Wikipedia for cultural statistics
EUROSTAT EU http://www1.unece.org/stat/platform/pages/viewpage.action?pageId=117769214
69 EUROSTAT EUROSTAT EU http://www1.unece.org/stat/platform/display/BDI/Eurostat+-+Multi-purpose+consumer+price+statistics%2C+sub-project+Scanner+Data
70 Istat Statistical Office of Italy Italy http://www1.unece.org/stat/platform/display/BDI/Italy+%28Istat%29+-+Internet+as+a+Data+Source+for+ICT+Usage+by+Enterprises+and+Public+Institutions
71 Istat - Persons and Places: Mobility Estimates based on Mobile Phone Data
Statistical Office of Italy Italy http://www1.unece.org/stat/platform/display/BDI/Italy+%28Istat%29+-+Persons++and+Places%3A+Mobility+Estimates+based+on+Mobile+Phone+Data
72 Istat - Specific purpose geographic basins and population statistics using mobile phone tracking data
Statistical Office of Italy Italy http://www1.unece.org/stat/platform/display/BDI/Italy+%28Istat%29+-+Specific+purpose+geographic+basins+and+population+statistics+using+mobile+phone+tracking+data
73 Istat - Use of scanner data for consumer price index
Statistical Office of Italy Italy http://www1.unece.org/stat/platform/display/BDI/Italy+%28Istat%29+-+Use+of+scanner+data+for+consumer+price+index
74 ONS - Aggregated Mobile Phone data to identify commuting patterns
Office of National Statistics UK http://www1.unece.org/stat/platform/display/BDI/United+Kingdom+%28ONS%29+-+Aggregated+Mobile+Phone+data+to+identify+commuting+patterns
75 ONS – Smart meter data potential for detecting unoccupied dwellings
Office of National Statistics UK http://www1.unece.org/stat/platform/display/BDI/United+Kingdom+%28ONS%29+-+Smartmeter+data+potential+for+detecting+unoccupied+dwellings
106
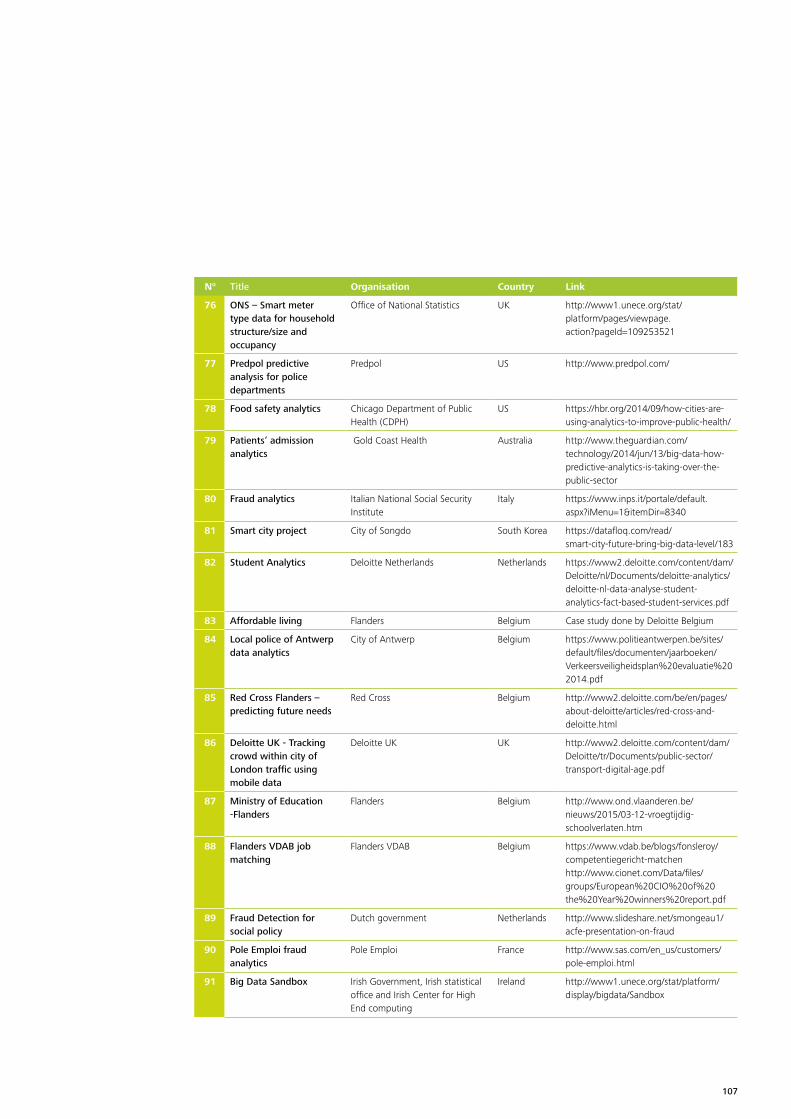
N° Title Organisation Country Link
76 ONS – Smart meter type data for household structure/size and occupancy
Office of National Statistics UK http://www1.unece.org/stat/platform/pages/viewpage.action?pageId=109253521
77 Predpol predictive analysis for police departments
Predpol US http://www.predpol.com/
78 Food safety analytics Chicago Department of Public Health (CDPH)
US https://hbr.org/2014/09/how-cities-are-using-analytics-to-improve-public-health/
79 Patients’ admission analytics
Gold Coast Health Australia http://www.theguardian.com/technology/2014/jun/13/big-data-how-predictive-analytics-is-taking-over-the-public-sector
80 Fraud analytics Italian National Social Security Institute
Italy https://www.inps.it/portale/default.aspx?iMenu=1&itemDir=8340
81 Smart city project City of Songdo South Korea https://datafloq.com/read/smart-city-future-bring-big-data-level/183
82 Student Analytics Deloitte Netherlands Netherlands https://www2.deloitte.com/content/dam/Deloitte/nl/Documents/deloitte-analytics/deloitte-nl-data-analyse-student-analytics-fact-based-student-services.pdf
83 Affordable living Flanders Belgium Case study done by Deloitte Belgium
84 Local police of Antwerp data analytics
City of Antwerp Belgium https://www.politieantwerpen.be/sites/default/files/documenten/jaarboeken/Verkeersveiligheidsplan%20evaluatie%202014.pdf
85 Red Cross Flanders – predicting future needs
Red Cross Belgium http://www2.deloitte.com/be/en/pages/about-deloitte/articles/red-cross-and-deloitte.html
86 Deloitte UK - Tracking crowd within city of London traffic using mobile data
Deloitte UK UK http://www2.deloitte.com/content/dam/Deloitte/tr/Documents/public-sector/transport-digital-age.pdf
87 Ministry of Education -Flanders
Flanders Belgium http://www.ond.vlaanderen.be/nieuws/2015/03-12-vroegtijdig-schoolverlaten.htm
88 Flanders VDAB job matching
Flanders VDAB Belgium https://www.vdab.be/blogs/fonsleroy/competentiegericht-matchenhttp://www.cionet.com/Data/files/groups/European%20CIO%20of%20the%20Year%20winners%20report.pdf
89 Fraud Detection for social policy
Dutch government Netherlands http://www.slideshare.net/smongeau1/acfe-presentation-on-fraud
90 Pole Emploi fraud analytics
Pole Emploi France http://www.sas.com/en_us/customers/pole-emploi.html
91 Big Data Sandbox Irish Government, Irish statistical office and Irish Center for High End computing
Ireland http://www1.unece.org/stat/platform/display/bigdata/Sandbox
107
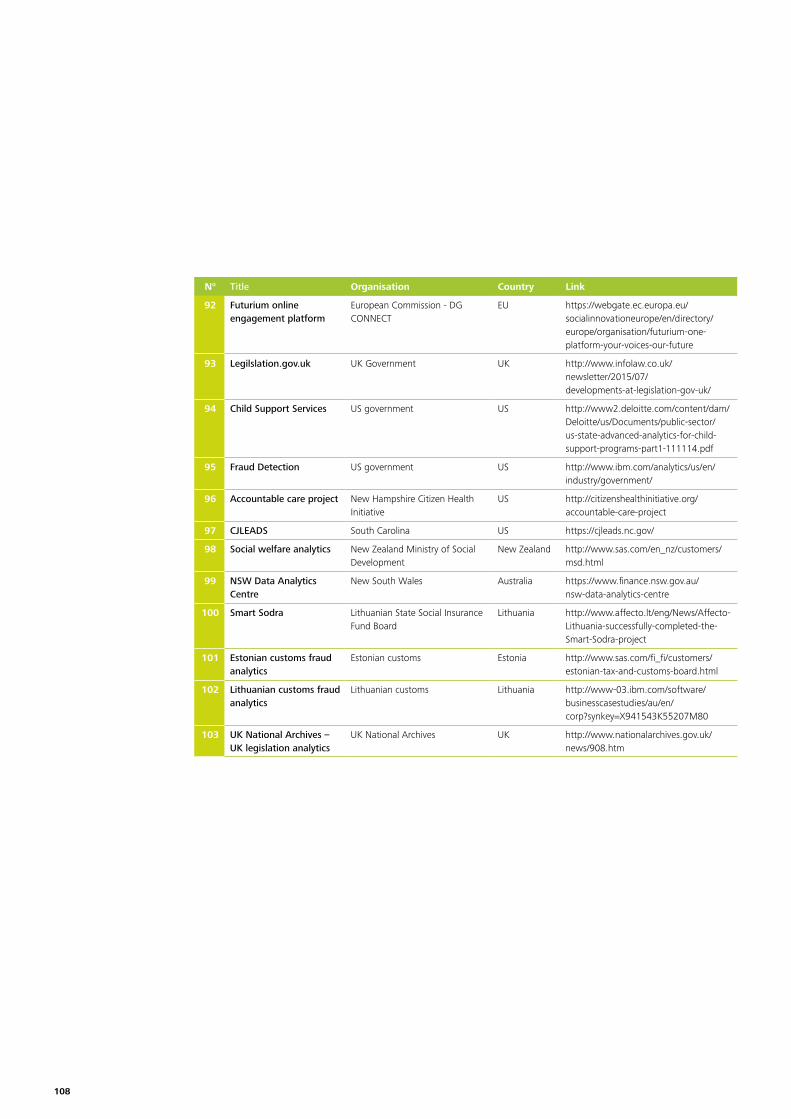
N° Title Organisation Country Link
92 Futurium online engagement platform
European Commission - DG CONNECT
EU https://webgate.ec.europa.eu/socialinnovationeurope/en/directory/europe/organisation/futurium-one-platform-your-voices-our-future
93 Legilslation.gov.uk UK Government UK http://www.infolaw.co.uk/newsletter/2015/07/developments-at-legislation-gov-uk/
94 Child Support Services US government US http://www2.deloitte.com/content/dam/Deloitte/us/Documents/public-sector/us-state-advanced-analytics-for-child-support-programs-part1-111114.pdf
95 Fraud Detection US government US http://www.ibm.com/analytics/us/en/industry/government/
96 Accountable care project New Hampshire Citizen Health Initiative
US http://citizenshealthinitiative.org/accountable-care-project
97 CJLEADS South Carolina US https://cjleads.nc.gov/
98 Social welfare analytics New Zealand Ministry of Social Development
New Zealand http://www.sas.com/en_nz/customers/msd.html
99 NSW Data Analytics Centre
New South Wales Australia https://www.finance.nsw.gov.au/nsw-data-analytics-centre
100 Smart Sodra Lithuanian State Social Insurance Fund Board
Lithuania http://www.affecto.lt/eng/News/Affecto-Lithuania-successfully-completed-the-Smart-Sodra-project
101 Estonian customs fraud analytics
Estonian customs Estonia http://www.sas.com/fi_fi/customers/estonian-tax-and-customs-board.html
102 Lithuanian customs fraud analytics
Lithuanian customs Lithuania http://www-03.ibm.com/software/businesscasestudies/au/en/corp?synkey=X941543K55207M80
103 UK National Archives – UK legislation analytics
UK National Archives UK http://www.nationalarchives.gov.uk/news/908.htm
108
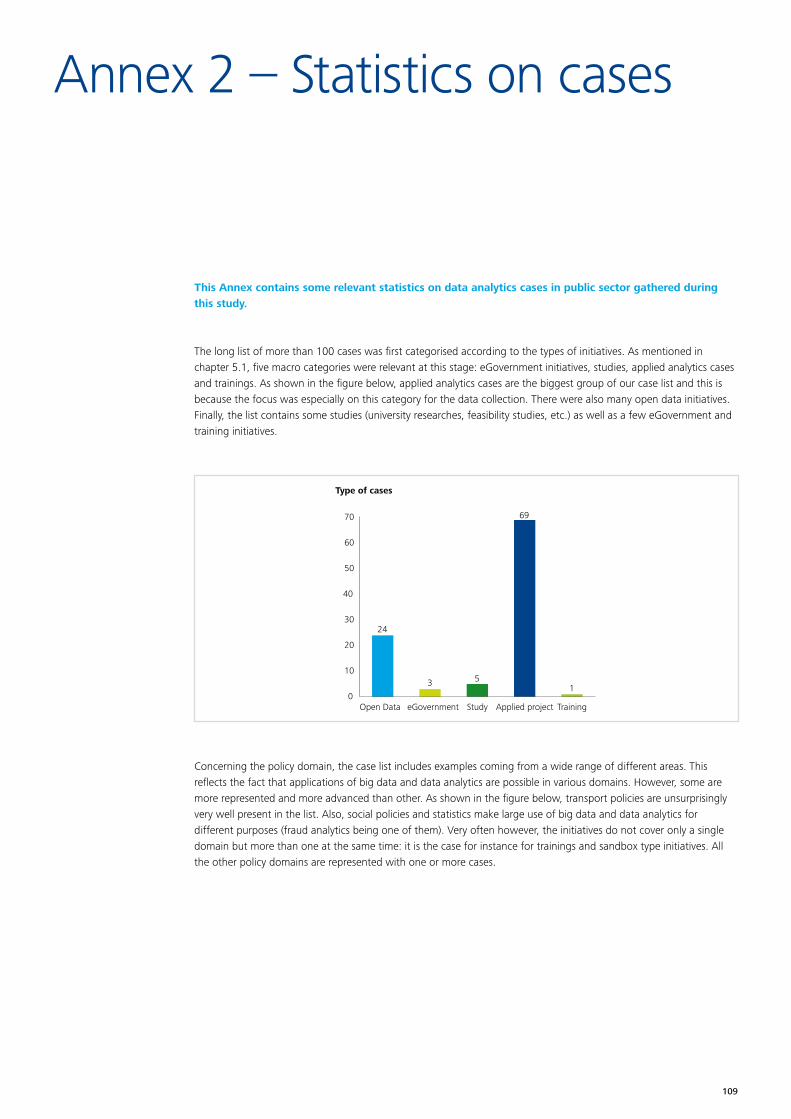
Annex 2 – Statistics on cases
This Annex contains some relevant statistics on data analytics cases in public sector gathered during this study.
The long list of more than 100 cases was first categorised according to the types of initiatives. As mentioned in chapter 5.1, five macro categories were relevant at this stage: eGovernment initiatives, studies, applied analytics cases and trainings. As shown in the figure below, applied analytics cases are the biggest group of our case list and this is because the focus was especially on this category for the data collection. There were also many open data initiatives. Finally, the list contains some studies (university researches, feasibility studies, etc.) as well as a few eGovernment and training initiatives.
Concerning the policy domain, the case list includes examples coming from a wide range of different areas. This reflects the fact that applications of big data and data analytics are possible in various domains. However, some are more represented and more advanced than other. As shown in the figure below, transport policies are unsurprisingly very well present in the list. Also, social policies and statistics make large use of big data and data analytics for different purposes (fraud analytics being one of them). Very often however, the initiatives do not cover only a single domain but more than one at the same time: it is the case for instance for trainings and sandbox type initiatives. All the other policy domains are represented with one or more cases.
Type of cases
0
10
20
30
40
50
60
70
TrainingApplied projectStudyeGovernmentOpen Data
24
3 5
69
1
109
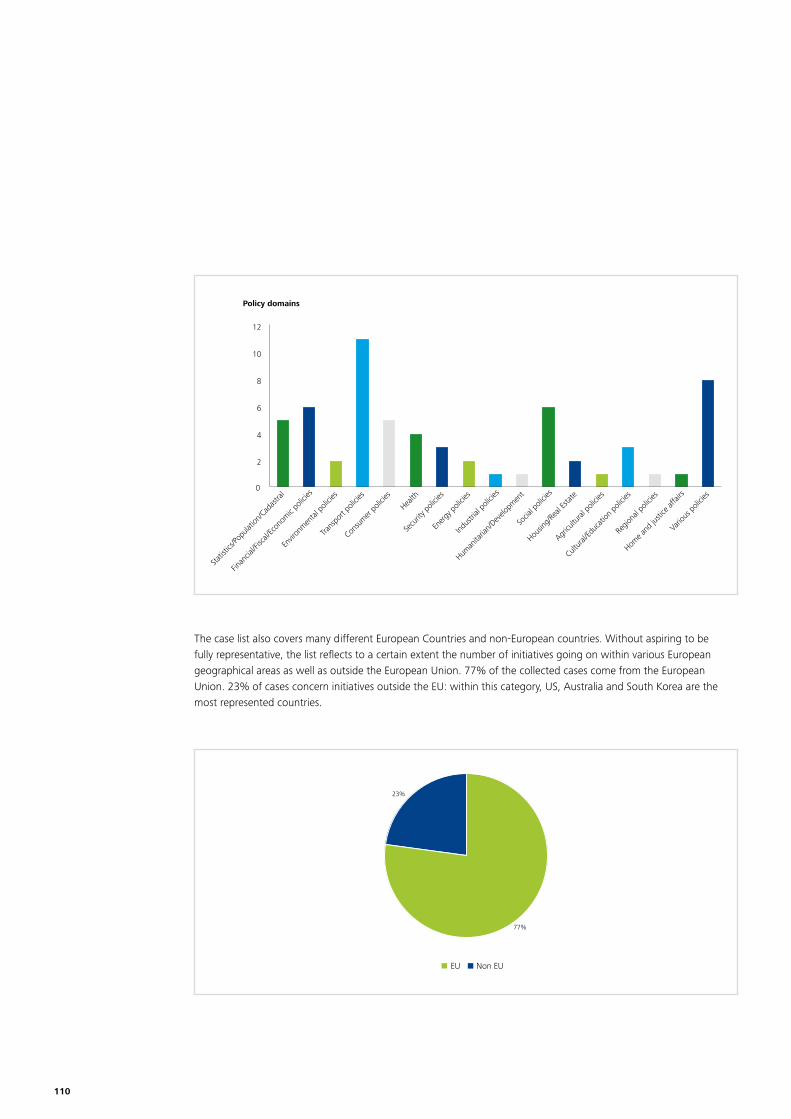
The case list also covers many different European Countries and non-European countries. Without aspiring to be fully representative, the list reflects to a certain extent the number of initiatives going on within various European geographical areas as well as outside the European Union. 77% of the collected cases come from the European Union. 23% of cases concern initiatives outside the EU: within this category, US, Australia and South Korea are the most represented countries.
Policy domains
0
2
4
6
8
10
12
Vario
us po
licies
Home a
nd ju
stice
affai
rs
Regio
nal p
olicie
s
Cultur
al/Ed
ucati
on po
licies
Agricu
ltural
polic
ies
Housin
g/Re
al Es
tate
Socia
l poli
cies
Human
itaria
n/Dev
elopm
ent
Indus
trial
polic
ies
Energ
y poli
cies
Secu
rity p
olicie
s
Health
Consu
mer po
licies
Trans
port
polic
ies
Envir
onmen
tal po
licies
Finan
cial/F
iscal/
Econ
omic
polic
ies
Statis
tics/P
opula
tion/
Cadas
tral
Non EUEU
77%
23%
110
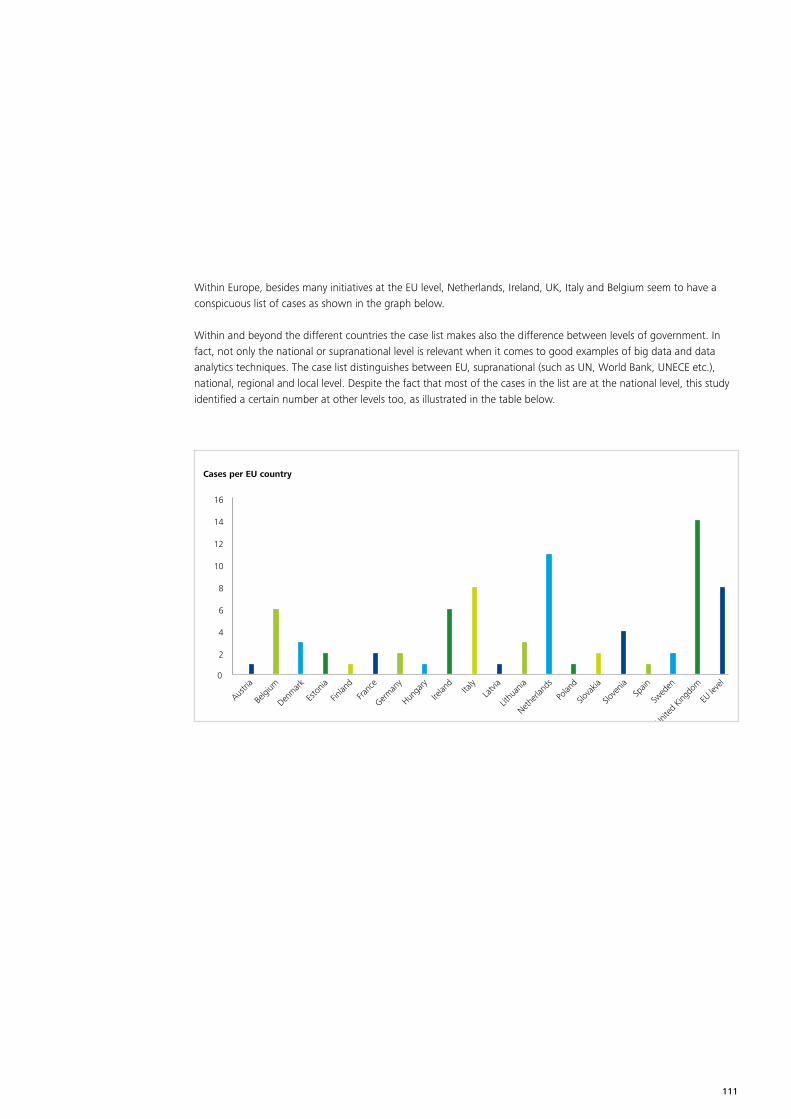
Within Europe, besides many initiatives at the EU level, Netherlands, Ireland, UK, Italy and Belgium seem to have a conspicuous list of cases as shown in the graph below.
Within and beyond the different countries the case list makes also the difference between levels of government. In fact, not only the national or supranational level is relevant when it comes to good examples of big data and data analytics techniques. The case list distinguishes between EU, supranational (such as UN, World Bank, UNECE etc.), national, regional and local level. Despite the fact that most of the cases in the list are at the national level, this study identified a certain number at other levels too, as illustrated in the table below.
0
2
4
6
8
10
12
14
16
Cases per EU country
Austri
a
Belgi
um
Denmark
EU le
vel
Esto
nia
Finlan
d
Franc
e
German
y
Hunga
ry
Irelan
dIta
lyLa
tvia
Lithu
ania
Netherl
ands
Polan
d
Slova
kia
Slove
niaSp
ain
Swed
en
United
King
dom
111
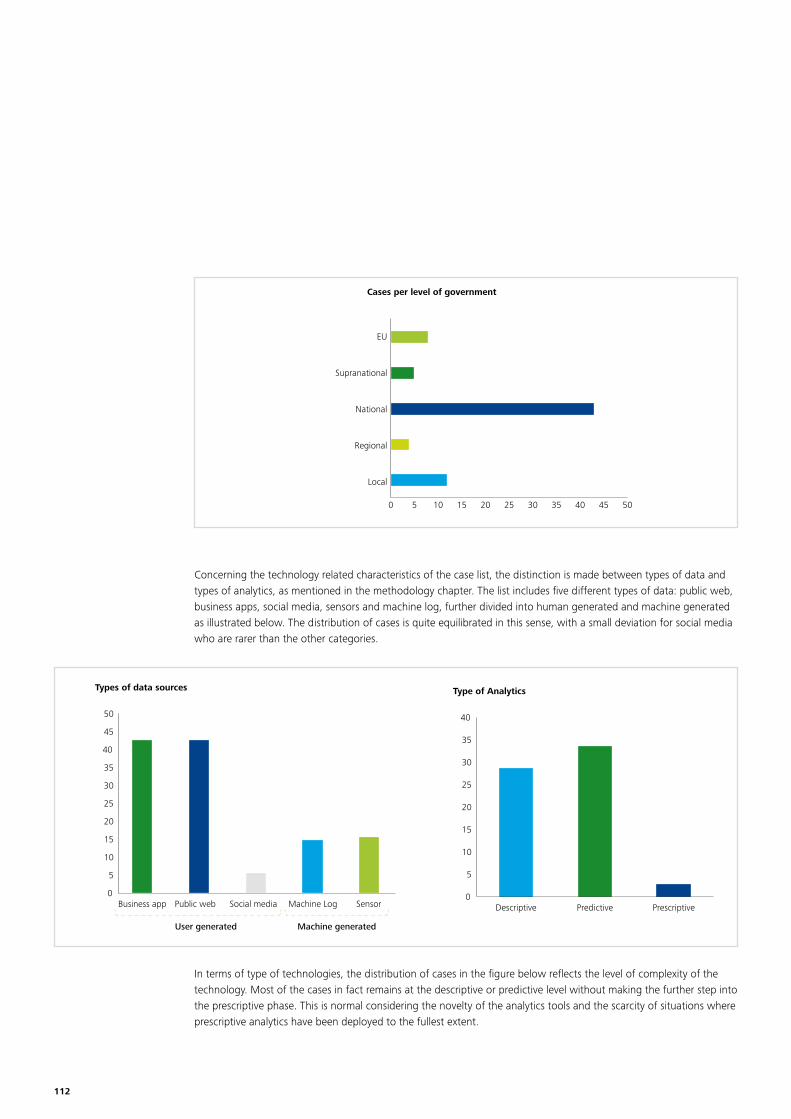
Concerning the technology related characteristics of the case list, the distinction is made between types of data and types of analytics, as mentioned in the methodology chapter. The list includes five different types of data: public web, business apps, social media, sensors and machine log, further divided into human generated and machine generated as illustrated below. The distribution of cases is quite equilibrated in this sense, with a small deviation for social media who are rarer than the other categories.
Types of data sources
0
5
10
15
20
25
30
35
40
45
50
SensorMachine LogSocial mediaPublic webBusiness app
hier kon ik de
data niet
achterhalen uit
de Word
User generated Machine generated
Type of Analytics
0
5
10
15
20
25
30
35
40
PrescriptivePredictiveDescriptive
Cases per level of government
Local
Regional
National
Supranational
EU
0 5 10 15 20 25 30 35 40 45 50
In terms of type of technologies, the distribution of cases in the figure below reflects the level of complexity of the technology. Most of the cases in fact remains at the descriptive or predictive level without making the further step into the prescriptive phase. This is normal considering the novelty of the analytics tools and the scarcity of situations where prescriptive analytics have been deployed to the fullest extent.
112
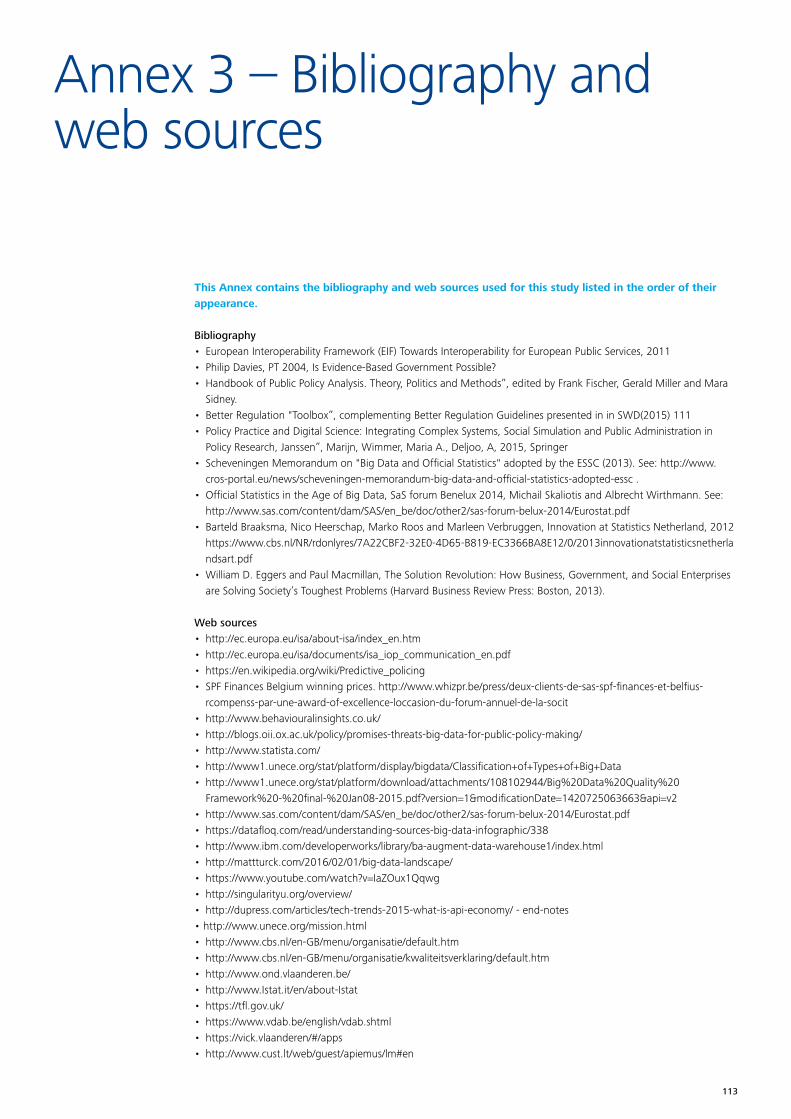
Annex 3 – Bibliography and web sources
This Annex contains the bibliography and web sources used for this study listed in the order of their appearance.
Bibliography• European Interoperability Framework (EIF) Towards Interoperability for European Public Services, 2011• Philip Davies, PT 2004, Is Evidence-Based Government Possible?• Handbook of Public Policy Analysis. Theory, Politics and Methods”, edited by Frank Fischer, Gerald Miller and Mara
Sidney. • Better Regulation "Toolbox”, complementing Better Regulation Guidelines presented in in SWD(2015) 111 • Policy Practice and Digital Science: Integrating Complex Systems, Social Simulation and Public Administration in
Policy Research, Janssen”, Marijn, Wimmer, Maria A., Deljoo, A, 2015, Springer• Scheveningen Memorandum on "Big Data and Official Statistics" adopted by the ESSC (2013). See: http://www.
cros-portal.eu/news/scheveningen-memorandum-big-data-and-official-statistics-adopted-essc .• Official Statistics in the Age of Big Data, SaS forum Benelux 2014, Michail Skaliotis and Albrecht Wirthmann. See:
http://www.sas.com/content/dam/SAS/en_be/doc/other2/sas-forum-belux-2014/Eurostat.pdf• Barteld Braaksma, Nico Heerschap, Marko Roos and Marleen Verbruggen, Innovation at Statistics Netherland, 2012
https://www.cbs.nl/NR/rdonlyres/7A22CBF2-32E0-4D65-B819-EC3366BA8E12/0/2013innovationatstatisticsnetherlandsart.pdf
• William D. Eggers and Paul Macmillan, The Solution Revolution: How Business, Government, and Social Enterprises are Solving Society’s Toughest Problems (Harvard Business Review Press: Boston, 2013).
Web sources• http://ec.europa.eu/isa/about-isa/index_en.htm • http://ec.europa.eu/isa/documents/isa_iop_communication_en.pdf• https://en.wikipedia.org/wiki/Predictive_policing• SPF Finances Belgium winning prices. http://www.whizpr.be/press/deux-clients-de-sas-spf-finances-et-belfius-
rcompenss-par-une-award-of-excellence-loccasion-du-forum-annuel-de-la-socit• http://www.behaviouralinsights.co.uk/• http://blogs.oii.ox.ac.uk/policy/promises-threats-big-data-for-public-policy-making/• http://www.statista.com/• http://www1.unece.org/stat/platform/display/bigdata/Classification+of+Types+of+Big+Data• http://www1.unece.org/stat/platform/download/attachments/108102944/Big%20Data%20Quality%20
Framework%20-%20final-%20Jan08-2015.pdf?version=1&modificationDate=1420725063663&api=v2 • http://www.sas.com/content/dam/SAS/en_be/doc/other2/sas-forum-belux-2014/Eurostat.pdf• https://datafloq.com/read/understanding-sources-big-data-infographic/338• http://www.ibm.com/developerworks/library/ba-augment-data-warehouse1/index.html• http://mattturck.com/2016/02/01/big-data-landscape/• https://www.youtube.com/watch?v=IaZOux1Qqwg• http://singularityu.org/overview/• http://dupress.com/articles/tech-trends-2015-what-is-api-economy/ - end-notes• http://www.unece.org/mission.html• http://www.cbs.nl/en-GB/menu/organisatie/default.htm • http://www.cbs.nl/en-GB/menu/organisatie/kwaliteitsverklaring/default.htm • http://www.ond.vlaanderen.be/• http://www.Istat.it/en/about-Istat • https://tfl.gov.uk/• https://www.vdab.be/english/vdab.shtml• https://vick.vlaanderen/#/apps• http://www.cust.lt/web/guest/apiemus/lm#en
113
• http://www.emta.ee/eng/contacts-and-about-us/structure-tasks-strategy-board/introduction-and-structure• http://media.nationalarchives.gov.uk/index.php/big-ideas-big-data-for-law/• http://www.legislation.gov.uk/• http://bigdata-madesimple.com/what-is-a-data-scientist-14-definitions-of-a-data-scientist/#sthash.n0EHMw2Z.dpuf• http://www.flowminder.org/practice-areas/precision-epidemiology• https://en.wikipedia.org/wiki/Right_to_be_forgotten• http://www.vlaamsetoezichtcommissie.be• https://arvastat.vdab.be• https://www.vdab.be/blogs/fonsleroy• http://dupress.com/articles/introduction-the-age-of-the-solution-economy/?coll=6283• https://open-data.europa.eu/nl/data• http://www.europeandataportal.eu• http://government-2020.dupress.com
114

115