BIDM Group Project - Galit Shmueli · BIDM Group Project: ... Chaitanya Indukuri Mansi Sarma Mohini...
14
BIDM Grou Predicting Appro on Mobile Purch “Khulja Sim Sim” Abhinav Mahadevan Chaitanya Indukuri Mansi Sarma Mohini Jain Neha Vairaragade up Project: opriate Service Provider hase Patterns based
Transcript of BIDM Group Project - Galit Shmueli · BIDM Group Project: ... Chaitanya Indukuri Mansi Sarma Mohini...

BIDM Group Project:Predicting Appropriate Service Provider based
on Mobile Purchase Patterns“Khulja Sim Sim”
Abhinav Mahadevan
Chaitanya Indukuri
Mansi Sarma
Mohini Jain
Neha Vairaragade
BIDM Group Project: Predicting Appropriate Service Provider based
on Mobile Purchase Patterns
Predicting Appropriate Service Provider based

BIDM Group Project
Abhinav Mahadevan - Chaitanya Indukuri - Mansi Sarma - Mohini Jain - Neha Vairagade
December 27, 2011 Page 1
Table of Contents Executive Summary: ...................................................................................................................................... 2
Problem Description: .................................................................................................................................... 2
Brief Description of Data: .............................................................................................................................. 3
Data Analysis: ................................................................................................................................................ 3
Choosing the right predictors: .................................................................................................................. 4
Data Cleaning: ........................................................................................................................................... 4
Results: .......................................................................................................................................................... 4
Conclusion: .................................................................................................................................................... 5
Appendix ....................................................................................................................................................... 6
Exhibit 1: ................................................................................................................................................... 6
Exhibit 2: ................................................................................................................................................... 9
Exhibit 3: ................................................................................................................................................. 10
Results from Classification Tree: ......................................................................................................... 10
Results from Naïve Bayes: ................................................................................................................... 11
Results from K-NN: .............................................................................................................................. 12
Results from the ensemble of all Classification methods: .................................................................. 13
\

BIDM Group Project
Abhinav Mahadevan - Chaitanya Indukuri - Mansi Sarma - Mohini Jain - Neha Vairagade
December 27, 2011 Page 2
Executive Summary:
Our Group project involves data mining on mobile users’ survey data generated as part of Prof
Sudhir Voleti’s Marketing Research course. Goal of this Data mining exercise was to predict the
Mobile carrier preference of a customer based on mobile survey data. The purpose of this
prediction is to enable the Retail store to use a predictive model to offer a mobile carrier service
to the Customer along with his phone purchase. We have used myriad classification methods
such as K-NN, Naïve Bayes and Classification Tree for the purpose of predicting the mobile
carrier service. Our error rate was between 50-60% in the Validation and Test data. Such error
rate in a prediction is obviously not acceptable for offering the service to the customer. In order
to improve the performance of data mining application, we used an ensemble method, which
actually gave us much better success by improving the model’s predictive ability. Ensemble
method uses the outputs of all the classification methods and then does a majority vote among
the predictions of each model to arrive upon the most common prediction. Surprisingly, the
predictive accuracy substantially improved from 55% to 43-44% with this method. Although,
this accuracy would still not be sufficient to deploy this model to predict the mobile carrier
service desired by Customer, a more representative sample would have ensure higher predictive
ability. In conclusion, we found that, along with the classification methods such as Naïve Bayes,
Ensemble method is strong tool for improving the predictive accuracy of model used for business
forecasting.
Problem Description:
Retail stores such as Reliance Digital frequently provide bundled product/service offerings to
their customers for increasing sales. One such Bundled product/service offering is a Mobile
phone with a mobile carrier service. Mobile phone is the primary driver in such a transaction. So,
we would let the Customer choose the mobile phone as per his or her preference, however, for
offering a bundled service of mobile carrier along with the phone, we need to be able to predict
the customer’s preference of mobile carrier based on the Customer’s profile. Such a business
problem would currently be handled either by offering standardized bundle to all customers or by
using the sales person’s intuition to recommend a service to the customer. Either of these

BIDM Group Project
Abhinav Mahadevan - Chaitanya Indukuri - Mansi Sarma - Mohini Jain - Neha Vairagade
December 27, 2011 Page 3
approaches would most likely be sub-optimal for both the Customer and the Retail store.
However, a predictive capability that would enable the Retail store to offer customized solutions
would keep the customers happy and would help drive sales for the Retail store. As part of this
project, we endeavor to build such a predictive model that can be used for this purpose.
Brief Description of Data:
For this project, we used the Mobile Survey data that was generated as part of the Prof Sudhir
Voleti’s Marketing Research course taught at ISB. The survey was performed using a
snowballing technique where the existing relationships with various mobile users were leveraged
to generate the survey responses. The survey is possibly biased towards representing more urban
users than rural users and towards younger users than older ones. However, Dataset is good
enough to be used for predictive purposes since the data is just three months old and have
significant representation from all parts of the country having more than 3000 records.
Mobile Survey data contained mostly categorical data having the following data items:
1) Customer’s profile such age, location, usage etc
2) Customer’s perceptions regarding Mobiles phones and Mobile carriers
3) Customer’s preferences regarding phone usage and consumption patterns of media such
as TV etc.
Data Analysis:
Analysis of the Mobile survey data has shown some interesting relationships in the data that can
be used for predictive purposes. For instance, as Exhibit 1.b suggests, Customers having a tablet
phone have a strong preference for Vodafone service. Similarly as Exhibit 1.c suggests, Lava
mobile users have a strong preference for Airtel service, whereas Karbonn mobile users have a
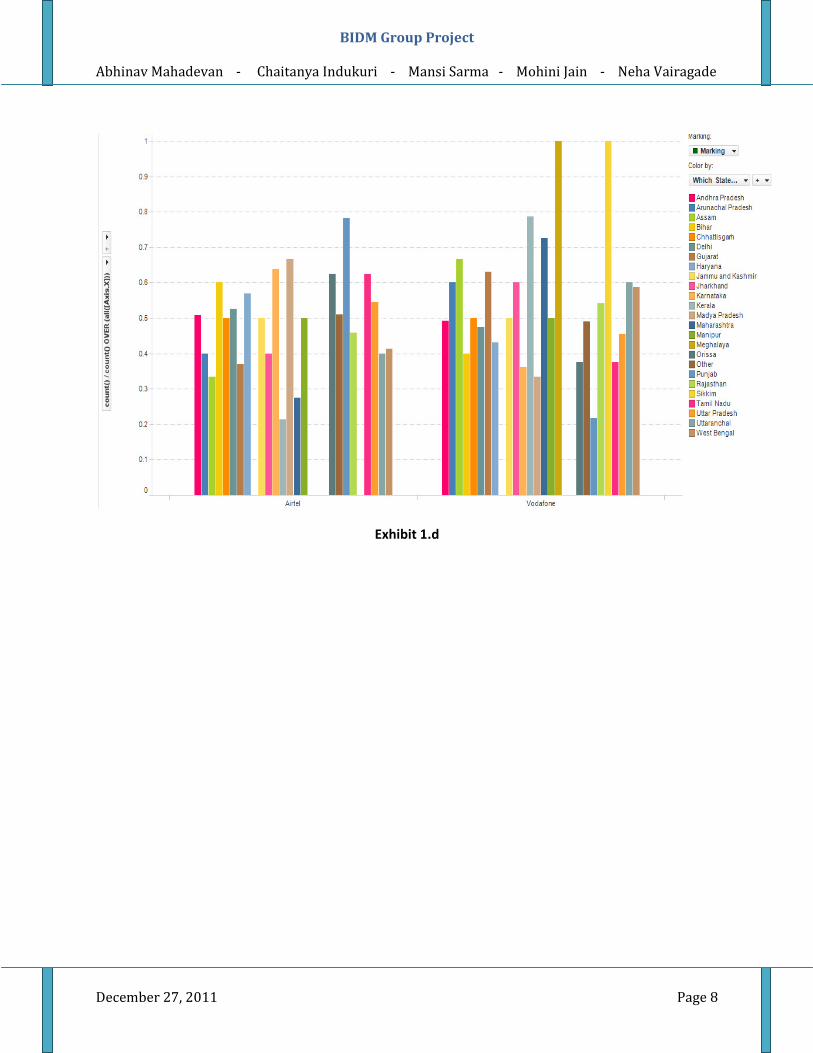
strong preference for Vodafone service. Also, the state in which the customer is present is a
strong predictor for the kind of mobile carrier the customer would prefer. This data makes sense
because the market share and network performance of each carrier widely varies from state to

BIDM Group Project
Abhinav Mahadevan - Chaitanya Indukuri - Mansi Sarma - Mohini Jain - Neha Vairagade
December 27, 2011 Page 4
state since originally all the mobile carriers operated from one or two states and subsequently
expanded.
Choosing the right predictors:
Even though we could have treated the data mining model as a black box and used for prediction
purposes, we have performed significant data analysis and have also used our domain knowledge
to search for the right predictors. In addition, while choosing the predictors, care was taken to
choose only those predictors which can be reliably got from the customer during his or her
purchase. Also, the number of inputs from the Customer should not be more since this may turn
off the customer.
Finally, after doing keen analysis and generating graphs on most of the variables, the final set of
predictors with most relevance were identified. While choosing the final predictors, care is also
taken to keep the model parsimonious since the predictive ability will not enhance by adding too
many irrelevant variables which only marginally supplement the predictive performance. Using
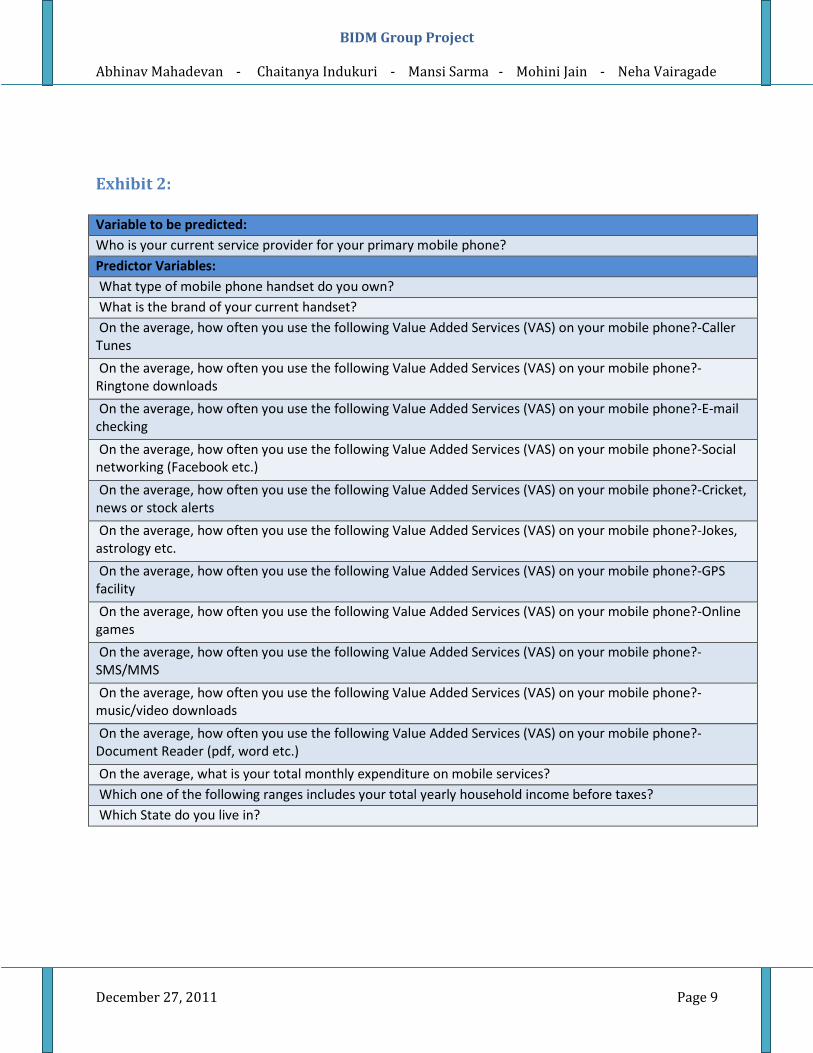
lesser but more relevant predictors makes the model more robust. The full set of predictors that
we have used for the modeling is shown in Exhibit 2.
Data Cleaning:
Care was taken to ensure that even when the survey data was filtered as necessary and missing
values were handled appropriately, the overall results still did not get skewed.
Results:
To predict the mobile carrier preference of a customer, we ran various classification methods
such as K-Nearest Neighbors, Naïve Bayes and Classification tree. Although the dataset had
some predictors which seem to have had strong causal relationship with customer’s mobile
carrier, the results from the Predictive models were not very promising. The error rate for all the
classification methods was close to 50-55% in the sample dataset. Even though the techniques
that we have used for choosing the predictors and for cleaning the data were in line with the best
practices, we strongly believe that the lack of representative sample data is causing such high
error rates. Results of the classification methods are giving in Exhibit 3 in Appendix. One data
mining method - Classification tree - showed promise in its predictive ability by having only 2%

BIDM Group Project
Abhinav Mahadevan - Chaitanya Indukuri - Mansi Sarma - Mohini Jain - Neha Vairagade
December 27, 2011 Page 5
error rate in training data, but, unfortunately, the error rates in validation and test datasets were
higher than 50%.
In order to improve the predictive accuracy, we have used a novel method suggested by Prof
Galit Shmueli. This method is an ensemble approach where all the prediction results of all the
classification methods are combined and the majority vote among all the methods is taken as
final prediction for the customer. Surprisingly, the predictive performance increased from having
error rate of 50-50% to 44-45%. The results for this approach are tabulated in Exhibit 3.d.
Conclusion:
Although the results of this predictive exercise have not been very promising, one important take
away from this exercise is that ensemble method, which has significantly improved the
predictive accuracy in this case, can used broadly used as a method for increasing predictive
accuracy. We strongly believe that a more representative dataset would have definitely helped in
improving the predictive accuracy such that this model can be deployed in real-time to provide
better customer service in retail stores. Since currently this kind of application using data mining
to provide better customer service is not being followed in India, there holds a significant
promise to implement such kind of data-mining applications to improve customer service not just
in electronics retail stores, but across other industries as well. Finally, usage of ensemble method
should be considered as a good option to further improve the predictive accuracy in applications
where wrong predictions can be very costly.

BIDM Group Project
Abhinav Mahadevan - Chaitanya Indukuri - Mansi Sarma - Mohini Jain - Neha Vairagade
December 27, 2011 Page 6
Appendix
Exhibit 1:
Exhibit 1.a

BIDM Group Project
Abhinav Mahadevan - Chaitanya Indukuri - Mansi Sarma - Mohini Jain - Neha Vairagade
December 27, 2011 Page 7
Exhibit 1.b
Exhibit 1.c
BIDM Group Project
Abhinav Mahadevan - Chaitanya Indukuri - Mansi Sarma - Mohini Jain - Neha Vairagade
December 27, 2011 Page 8
Exhibit 1.d
BIDM Group Project
Abhinav Mahadevan - Chaitanya Indukuri - Mansi Sarma - Mohini Jain - Neha Vairagade
December 27, 2011 Page 9
Exhibit 2:
Variable to be predicted:
Who is your current service provider for your primary mobile phone?
Predictor Variables:
What type of mobile phone handset do you own?
What is the brand of your current handset?
On the average, how often you use the following Value Added Services (VAS) on your mobile phone?-Caller
Tunes
On the average, how often you use the following Value Added Services (VAS) on your mobile phone?-
Ringtone downloads
On the average, how often you use the following Value Added Services (VAS) on your mobile phone?-E-mail
checking
On the average, how often you use the following Value Added Services (VAS) on your mobile phone?-Social
networking (Facebook etc.)
On the average, how often you use the following Value Added Services (VAS) on your mobile phone?-Cricket,
news or stock alerts
On the average, how often you use the following Value Added Services (VAS) on your mobile phone?-Jokes,
astrology etc.
On the average, how often you use the following Value Added Services (VAS) on your mobile phone?-GPS
facility
On the average, how often you use the following Value Added Services (VAS) on your mobile phone?-Online
games
On the average, how often you use the following Value Added Services (VAS) on your mobile phone?-
SMS/MMS
On the average, how often you use the following Value Added Services (VAS) on your mobile phone?-
music/video downloads
On the average, how often you use the following Value Added Services (VAS) on your mobile phone?-
Document Reader (pdf, word etc.)
On the average, what is your total monthly expenditure on mobile services?
Which one of the following ranges includes your total yearly household income before taxes?
Which State do you live in?

BIDM Group Project
Abhinav Mahadevan - Chaitanya Indukuri - Mansi Sarma - Mohini Jain - Neha Vairagade
December 27, 2011 Page 10
Exhibit 3:
Results from Classification Tree:
Exhibit 3.a

BIDM Group Project
Abhinav Mahadevan - Chaitanya Indukuri - Mansi Sarma - Mohini Jain - Neha Vairagade
December 27, 2011 Page 11
Results from Naïve Bayes:
Exhibit 3.b

BIDM Group Project
Abhinav Mahadevan - Chaitanya Indukuri - Mansi Sarma - Mohini Jain - Neha Vairagade
December 27, 2011 Page 12
Results from K-NN:
Exhibit 3.c

BIDM Group Project
Abhinav Mahadevan - Chaitanya Indukuri - Mansi Sarma - Mohini Jain - Neha Vairagade
December 27, 2011 Page 13
Results from the ensemble of all Classification methods:
ENSEMBLE CONFUSION MATRIX Training Validation Test
Correct 1167 236 230
Incorrect 212 190 195
Error % 16% 44.6% 45.88%
Exhibit 3.d


![Periodic Table e - Royal Society of Chemistry...e 58 140. c 89 [227] Group 3 Group 1 Group 4 Group 5 Group 6 Group 7 Group 8 Group 9 Group 10 Group 11 Group 12 e 75 186. m 62 150.](https://static.fdocuments.in/doc/165x107/5e250e7ea1cea764a555c1d8/periodic-table-e-royal-society-of-chemistry-e-58-140-c-89-227-group-3-group.jpg)