Bidirectional Control of Social Hierarchy by Synaptic Efficacy in Medial Prefrontal Cortex
6
DOI: 10.1126/science.1209951 , 693 (2011); 334 Science , et al. Fei Wang Medial Prefrontal Cortex Bidirectional Control of Social Hierarchy by Synaptic Efficacy in This copy is for your personal, non-commercial use only. clicking here. colleagues, clients, or customers by , you can order high-quality copies for your If you wish to distribute this article to others here. following the guidelines can be obtained by Permission to republish or repurpose articles or portions of articles ): November 6, 2011 www.sciencemag.org (this infomation is current as of The following resources related to this article are available online at http://www.sciencemag.org/content/334/6056/693.full.html version of this article at: including high-resolution figures, can be found in the online Updated information and services, http://www.sciencemag.org/content/suppl/2011/09/28/science.1209951.DC1.html can be found at: Supporting Online Material http://www.sciencemag.org/content/334/6056/693.full.html#related found at: can be related to this article A list of selected additional articles on the Science Web sites http://www.sciencemag.org/content/334/6056/693.full.html#ref-list-1 , 8 of which can be accessed free: cites 33 articles This article http://www.sciencemag.org/content/334/6056/693.full.html#related-urls 1 articles hosted by HighWire Press; see: cited by This article has been http://www.sciencemag.org/cgi/collection/neuroscience Neuroscience subject collections: This article appears in the following registered trademark of AAAS. is a Science 2011 by the American Association for the Advancement of Science; all rights reserved. The title Copyright American Association for the Advancement of Science, 1200 New York Avenue NW, Washington, DC 20005. (print ISSN 0036-8075; online ISSN 1095-9203) is published weekly, except the last week in December, by the Science on November 6, 2011 www.sciencemag.org Downloaded from
-
Upload
padhu-pattabiraman -
Category
Documents
-
view
223 -
download
2
description
Dominance hierarchy has a profound impact on animals’ survival, health, and reproductive success, but its neural circuit mechanism is virtually unknown. We found that dominance ranking in mice is transitive, relatively stable, and highly correlates among multiple behavior measures. Recording from layer V pyramidal neurons of the medial prefrontal cortex (mPFC) showed higher strengthof excitatory synaptic inputs in mice with higher ranking, as compared with their subordinate cage mates. Furthermore, molecular manipulations that resulted in an increase and decrease in the synaptic efficacy in dorsal mPFC neurons caused an upward and downward movement in the social rank, respectively. These results provide direct evidence for mPFC’s involvement in social hierarchy and suggest that social rank is plastic and can be tuned by altering synaptic strength in mPFC pyramidal cells.
Transcript of Bidirectional Control of Social Hierarchy by Synaptic Efficacy in Medial Prefrontal Cortex
DOI: 10.1126/science.1209951, 693 (2011);334 Science
, et al.Fei WangMedial Prefrontal CortexBidirectional Control of Social Hierarchy by Synaptic Efficacy in
This copy is for your personal, non-commercial use only.
clicking here.colleagues, clients, or customers by , you can order high-quality copies for yourIf you wish to distribute this article to others
here.following the guidelines
can be obtained byPermission to republish or repurpose articles or portions of articles
): November 6, 2011 www.sciencemag.org (this infomation is current as of
The following resources related to this article are available online at
http://www.sciencemag.org/content/334/6056/693.full.htmlversion of this article at:
including high-resolution figures, can be found in the onlineUpdated information and services,
http://www.sciencemag.org/content/suppl/2011/09/28/science.1209951.DC1.html can be found at: Supporting Online Material
http://www.sciencemag.org/content/334/6056/693.full.html#relatedfound at:
can berelated to this article A list of selected additional articles on the Science Web sites
http://www.sciencemag.org/content/334/6056/693.full.html#ref-list-1, 8 of which can be accessed free:cites 33 articlesThis article
http://www.sciencemag.org/content/334/6056/693.full.html#related-urls1 articles hosted by HighWire Press; see:cited by This article has been
http://www.sciencemag.org/cgi/collection/neuroscienceNeuroscience
subject collections:This article appears in the following
registered trademark of AAAS. is aScience2011 by the American Association for the Advancement of Science; all rights reserved. The title
CopyrightAmerican Association for the Advancement of Science, 1200 New York Avenue NW, Washington, DC 20005. (print ISSN 0036-8075; online ISSN 1095-9203) is published weekly, except the last week in December, by theScience
on
Nov
embe
r 6,
201
1w
ww
.sci
ence
mag
.org
Dow
nloa
ded
from

improve cerebellar phenotypes. It is encouragingthat exercise and the accompanying increase inneuronal activity and metabolic demands do notseem to exacerbate the disease process in vul-nerable neuronal populations, which may be im-portant in a variety of neurodegenerative disorders.
References and Notes1. H. T. Orr et al., Nat. Genet. 4, 221 (1993).2. H. Y. Zoghbi, H. T. Orr, J. Biol. Chem. 284, 7425 (2009).3. C. W. Cotman, N. C. Berchtold, L.-A. Christie,
Trends Neurosci. 30, 464 (2007).4. A. Chiò, G. Benzi, M. Dossena, R. Mutani, G. Mora,
Brain 128, 472 (2005).5. D. J. Mahoney, C. Rodriguez, M. Devries, N. Yasuda,
M. A. Tarnopolsky, Muscle Nerve 29, 656 (2004).6. K. Watase et al., Neuron 34, 905 (2002).7. S. Astigarraga et al., EMBO J. 26, 668 (2007).
8. Y. C. Lam et al., Cell 127, 1335 (2006).9. J. Crespo-Barreto, J. D. Fryer, C. A. Shaw, H. T. Orr,
H. Y. Zoghbi, PLoS Genet. 6, e1001021 (2010).10. M. Kawamura-Saito et al., Hum. Mol. Genet. 15, 2125
(2006).11. J. Lim et al., Nature 452, 713 (2008).12. P. S. Thomas Jr. et al., Hum. Mol. Genet. 15, 2225 (2006).13. J. M. Van Raamsdonk et al., Hum. Mol. Genet. 14, 1379
(2005).14. D. V. Vaz et al., Clin. Rehabil. 22, 234 (2008).15. W. Ilg et al., Neurology 73, 1823 (2009).Acknowledgments: J.D.F. and H.Y.Z. conceived of the study
and designed experiments. J.D.F., C.M.B., A.N.C., andY.G. performed behavioral assays and provided inputon analysis. J.D.F. and J.C.-B. performed molecularwork and analysis. P.Y., H.K., and C.S. analyzedmicroarray data. J.D.F. and H.Y.Z. wrote the manuscriptwith input from J.C.-.B, A.F., and H.T.O. We aregrateful to G. Schuster for the generation of mutant
mice and the members of the H.Y.Z. laboratory forcomments and discussions on the manuscript. Thisresearch was supported by NIH grants NS27699,NS27699-20S1–ARRA, and HD24064 (Baylor Collegeof Medicine–Intellectual and Developmental DisabilitiesResearch Center) to H.Y.Z.; 1F32NS055545 to J.D.F.;and NS022920 and NS045667 to H.T.O. H.Y.Z. is aninvestigator with the Howard Hughes Medical Institute,holds a patent on SCA1 diagnostic testing, and is on thescientific advisory board of Pfizer Neuroscience Program.
Supporting Online Materialwww.sciencemag.org/cgi/content/full/334/6056/690/DC1Materials and MethodsFigs. S1 to S3Tables S1 to S4References (16–18)
15 August 2011; accepted 21 September 201110.1126/science.1212673
Bidirectional Control of SocialHierarchy by Synaptic Efficacy inMedial Prefrontal CortexFei Wang,1,2 Jun Zhu,1 Hong Zhu,1,2 Qi Zhang,1 Zhanmin Lin,1 Hailan Hu1*
Dominance hierarchy has a profound impact on animals’ survival, health, and reproductive success,but its neural circuit mechanism is virtually unknown. We found that dominance ranking in miceis transitive, relatively stable, and highly correlates among multiple behavior measures. Recordingfrom layer V pyramidal neurons of the medial prefrontal cortex (mPFC) showed higher strengthof excitatory synaptic inputs in mice with higher ranking, as compared with their subordinate cagemates. Furthermore, molecular manipulations that resulted in an increase and decrease in thesynaptic efficacy in dorsal mPFC neurons caused an upward and downward movement in the socialrank, respectively. These results provide direct evidence for mPFC’s involvement in social hierarchyand suggest that social rank is plastic and can be tuned by altering synaptic strength in mPFCpyramidal cells.
Dominance hierarchy is a fundamentalorganizing mechanism for most animalsocieties (1). The dominance status deter-
mines access to resources and profoundly affectssurvival, health, reproductive success, and mul-tiple behaviors (2–4). Once established, the hier-archy rank is relatively stable and can minimizeintense fights among group members (5). Dom-inance hierarchy emerges early in developmentand is present in children as young as 2 years old(6). Moreover, dominance has been linked toheritable traits in animals (7, 8) and humans (9).The ubiquitous, inheritable nature and the earlydevelopmental emergence suggest that dominancehierarchy is encoded by innate neural mechanism(10). Yet, current understanding of the neuralmechanisms associated with social hierarchy—theneural circuits underlying status-related behav-ioral differences and the mechanism for initiatingchanges in social status—is surprisingly limited.
To investigate the neural mechanisms under-lying social hierarchy, a robust and reliable be-havioral assay is essential. The tube test, in whichonemouse forces its opponent out backward froma narrow tube—developed to measure the domi-nance tendency of mice (11) (Fig. 1A)—was pre-viously used mostly for comparison betweenmice of different strains (11) or genotypes (12).To measure the hierarchical relation of animalswithin the same social group, we applied the tubetest to cage groups of four male C57/BL6 mice,living together for at least 2 weeks. Mice weretested pair-wise using a round robin design, andthe social rank was assessed on the basis of win-ning against the other three cage mates (Fig. 1,A and D). We validated the tube test to be a reli-able measure of dominance ranking by the fol-lowing three criteria:
1) Transitivity—whenmouse A is more dom-inant over B and B more dominant over C,then A should be dominant over C (Fig. 1B). Weanalyzed the relation of any three mice from acage group; rank was transitive in 95% (251 outof 264) cases (Fig. 1B). Consistent with this hightransitivity, in 89% (78 out of 88) of the trials, afour-mouse group adopted a linear social diagramamong the four possible combinations (Fig. 1C).
2) Stability over time (2). For stability eval-uation, rank was measured daily for 7 days (Fig.1, D and E).Mice adopted the same rank positionas the previous day in 59% (127 out of 216) ofthe comparisons. Having a reward for taking thetube test (seeMethods) did not affect the linearityor stability of the rank (Fig. 1C and fig. S1A). Itwas noteworthy that the time spent in the tubewas significantly shorter when the mouse of thelowest rank (rank-4) was involved or as rank dis-tance increased (Fig. 1F). Moreover, rank did notcorrelate with either the weight (when weightdifference is below 15%) (P = 0.96, one-wayanalysis of variance) (fig. S1B) or the locomotiveactivity in the open field (P = 0.41) (fig. S1C).
3) Consistency with results of other domi-nance measures. To rule out factors unrelated todominance, e.g., sensorimotor capacity, learningability, and persistence, we compared the tubetest results with those obtained by five addition-al dominance assays. First, in the visible burrowsystem (VBS), where food and water are relative-ly difficult to access and weight change reflectsdominance (13), the tube-test ranks correlatedlinearly with weight changes (Fig. 2A and fig.S2A). Second, tube-test ranks also linearly corre-lated with the ranks by the agonistic behaviortest, in which dominance is determined by scoringagonistic behaviors in a novel context (Fig. 2Band fig. S2B). Third, in the barber assay wherethe most dominant mouse barbers the whiskersof its cage mates (“Dalila effect”) (12, 14), thebarber mouse was ranked first by the tube test insix of seven cages (Fig. 2C). Fourth, in the urine-marking assay, where dominant mice mark largerterritories than subordinate ones (15), we found71% (30 out of 42) consistency with the tube-testresult (Fig. 2D). Finally, in the test of ultrasonicvocalization toward females in which dominantmales emit more 50- to 70-kHz ultrasonic court-ship songs (16), we found rank-1mice in the tubetest emitted markedly more ultrasounds towarda female than mice of lower ranks in 9 out of 10cages (Fig. 2E and fig. S2C). In addition, dom-inance ranking significantly correlated amongthese five tests themselves (fig. S2). Althoughthe reliability and validity of each assay in mea-suring the dominance behavior may be debatable
1Institute of Neuroscience and State Key Laboratory of Neu-roscience, Shanghai Institutes for Biological Sciences, ChineseAcademy of Sciences, Shanghai 200031, China. 2GraduateSchool of Chinese Academy of Sciences, Shanghai 200031,China.
*To whom correspondence should be addressed. E-mail:[email protected]
www.sciencemag.org SCIENCE VOL 334 4 NOVEMBER 2011 693
REPORTS
on
Nov
embe
r 6,
201
1w
ww
.sci
ence
mag
.org
Dow
nloa
ded
from
or context-dependent (5, 17), the high consisten-cy of ranking results from these multiple assaysstrongly supports the notion that dominance isa common dependable variable underlying a va-
riety of behaviors that use different sensorimotorskills (fig. S3).
Where and how is the hierarchical infor-mation encoded in the brain? Functional brain
imaging studies in humans have implicated thedorsolateral prefrontal cortex (dlPFC) and medialprefrontal cortex (mPFC) in dominance hierarchy–related behaviors (18, 19). The functional homo-
A B C
F
Transitive
95%
Non-transitive
5%
A
B C
D E
Linear
A
B C
0
2
4
6
1--2 2--3 1--3 3--4 2--4 1--4
** **
* ** *** ****
* *
Rank pairing
Tim
e in
the
tube
(nor
m)
1 2 3 4 5 6
1
2
3
4
n=1
3
2
1
0
Test trial
Tube
test
ran
k
Win
ning
tim
es
1 2 3 4 5 6
n=21
1
2
3
4
Test trial
Tube
test
ran
k
100
0
50
Reward (n=38)
No reward (n=88)
Tria
l per
cent
age
Linea
r
Non-L
-1
Non-L
-2
Non-L
-3Non-L-1 Non-L-2 Non-L-3
A B C D
A
B
C D D
B
CA
C D
A B
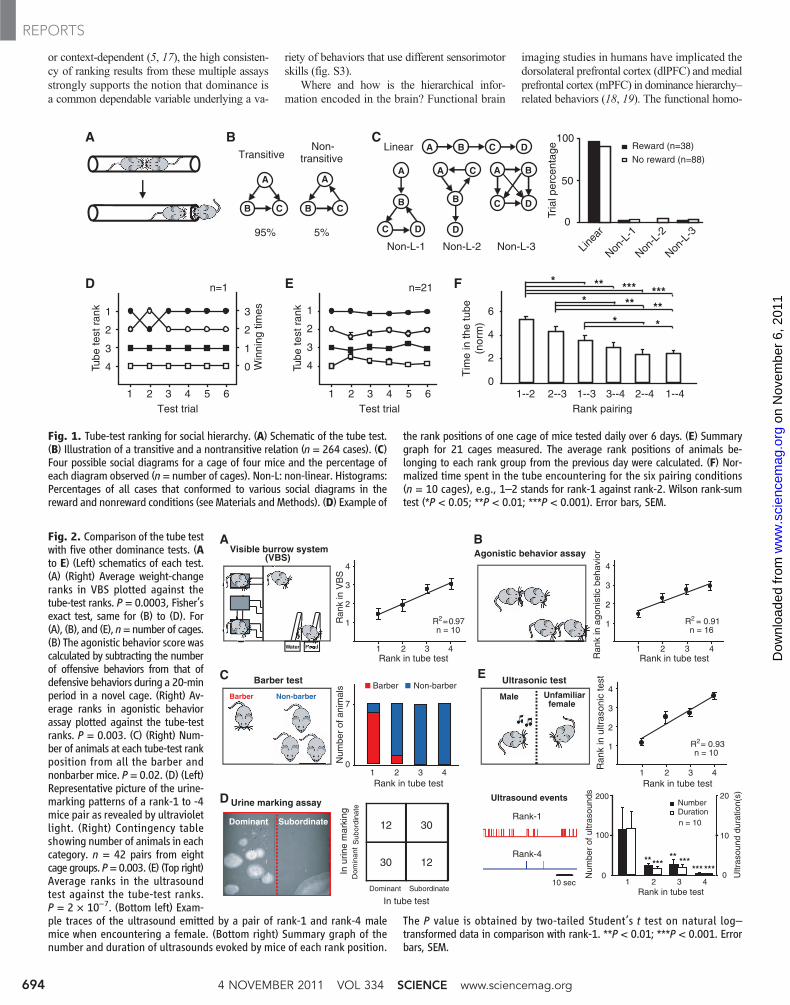
Fig. 1. Tube-test ranking for social hierarchy. (A) Schematic of the tube test.(B) Illustration of a transitive and a nontransitive relation (n = 264 cases). (C)Four possible social diagrams for a cage of four mice and the percentage ofeach diagram observed (n = number of cages). Non-L: non-linear. Histograms:Percentages of all cases that conformed to various social diagrams in thereward and nonreward conditions (see Materials and Methods). (D) Example of
the rank positions of one cage of mice tested daily over 6 days. (E) Summarygraph for 21 cages measured. The average rank positions of animals be-longing to each rank group from the previous day were calculated. (F) Nor-malized time spent in the tube encountering for the six pairing conditions(n = 10 cages), e.g., 1–2 stands for rank-1 against rank-2. Wilson rank-sumtest (*P < 0.05; **P < 0.01; ***P < 0.001). Error bars, SEM.
Fig. 2. Comparison of the tube testwith five other dominance tests. (Ato E) (Left) schematics of each test.(A) (Right) Average weight-changeranks in VBS plotted against thetube-test ranks. P = 0.0003, Fisher’sexact test, same for (B) to (D). For(A), (B), and (E), n=number of cages.(B) The agonistic behavior score wascalculated by subtracting the numberof offensive behaviors from that ofdefensive behaviors during a 20-minperiod in a novel cage. (Right) Av-erage ranks in agonistic behaviorassay plotted against the tube-testranks. P = 0.003. (C) (Right) Num-ber of animals at each tube-test rankposition from all the barber andnonbarber mice. P = 0.02. (D) (Left)Representative picture of the urine-marking patterns of a rank-1 to -4mice pair as revealed by ultravioletlight. (Right) Contingency tableshowing number of animals in eachcategory. n = 42 pairs from eightcage groups. P=0.003. (E) (Top right)Average ranks in the ultrasoundtest against the tube-test ranks.P = 2 × 10⁻⁷. (Bottom left) Exam-ple traces of the ultrasound emitted by a pair of rank-1 and rank-4 malemice when encountering a female. (Bottom right) Summary graph of thenumber and duration of ultrasounds evoked by mice of each rank position.
The P value is obtained by two-tailed Student’s t test on natural log–transformed data in comparison with rank-1. **P < 0.01; ***P < 0.001. Errorbars, SEM.
Visible burrow system(VBS)
Barber test
Barber
Agonistic behavior assay A B
C
Non-barber
Urine marking assay
E
Dominant Subordinate ............
............
1
2
3
4
1 2 3 4
D
Dominant Subordinate
In tube test
Rank in tube test
n = 10
12 30
30 12
Rank-1
Rank-4
10 sec
0
7
tnanimo
D
Ultrasonic test
Male Unfamiliar female
1 2 3 4Rank in tube test
2R =0.97
1
2
3
4
2R = 0.93
1 2 3 4Rank in tube test
n = 10
etanidrobuS
Ran
k in
VB
SN
umbe
r of
ani
mal
sIn
urin
e m
arki
ng
1
2
3
4
2R
1 2 3 4Rank in tube test
n = 16= 0.91
Ran
k in
ago
nist
ic b
ehav
ior
Ran
k in
ultr
ason
ic te
st
*** **** *** *** * *
n = 10
1 2 3 4Rank in tube test
*
NumberDuration
Num
ber
of u
ltras
ound
s
Ultr
asou
nd d
urat
ion(
s)200
100
0
20
10
0
Barber Non-barber
Ultrasound events
Water Food
4 NOVEMBER 2011 VOL 334 SCIENCE www.sciencemag.org694
REPORTS
on
Nov
embe
r 6,
201
1w
ww
.sci
ence
mag
.org
Dow
nloa
ded
from

log of these regions in rodents is the dorsalmPFC, including the anterior cingulate cortex(AC) and the prelimbic cortex (PL) (Fig. 3A)(20). Moreover, mPFC lesion lowered the socialrank in rats (21). Therefore, we investigated po-tential differences in the synaptic properties inthis region between dominant and subordinatemice. Acute brain slices containing mPFC weremade from rank-1 and rank-4 mice, and mini-ature excitatory synaptic currents (mEPSCs)mediated by the a-amino-3-hydroxy-5-methyl-4-isoxazolepropionic acid (AMPA) subtype ofglutamate receptors weremeasured bywhole-cellrecording from layer V pyramidal neurons, theprimary mPFC output neurons (Fig. 3B). Theamplitudes, but not the frequency, of mEPSCs
were significantly larger in rank-1 than rank-4miceof the same cage group (P< 0.0001, Kolmogorov-Smirnov two-sample test) (Fig. 3, C and D). Thedifference was significant for each of the fivepairs of mice recorded (Fig. 3E). These resultsindicate dominant mice have a higher excitatorysynaptic strength in layer V pyramidal neuronsthan their subordinates, which could result instronger output of these excitatory neurons toother brain regions. Consistently, dominant miceexhibited significantly higher number of c-Fos–positive neurons in the PL region of mPFC afterthe tube test (Fig. 3, F and G).
To determine whether the difference inmPFC synaptic efficacy could contribute to therank status, we manipulated the function of ex-
citatory synapses in dorsal mPFC using a Sindbisvirus–based in vivo recombinant DNA–deliverytechnique (22–24) (Fig. 4A). Small guanosinetriphosphatases Ras and Rap potentiate anddepress AMPA receptor–mediated transmission,respectively, in the hippocampus by regulatingsynaptic trafficking of AMPA receptors (25).We verified these effects in the mPFC neuronsin vivo by localized mPFC injection of Ras- orRap-expressing Sindbis viruses and whole-cellrecording of injected neurons (Fig. 4B). Sindbisvirus preferentially infects pyramidal neurons (fig.S4), and the basic electrophysiological proper-ties of infected neurons, including the input re-sistance and leak current, were indistinguishablefrom those of uninfected neurons within 48hours of infection (fig. S4, see also SOM textnote 1). At 12 to 24 hours postinfection, neuronsinfected with Ras virus had higher amplitudes ofAMPA receptor–mediated EPSCs (179 T 24% ofcontrols, P = 0.0093, Wilcoxon signed rank test),in comparison with neighboring uninfected con-trol cells (Fig. 4, B and E, and fig. S5A), whereasRap-expressing neurons had lower EPSC ampli-tudes (Fig. 4E and fig. S5B, 71 T 9% of controls,P = 0.025). The behavioral consequences ofthese synaptic manipulations were further as-sessed by bilateral high-titer viral injection intothe dorsal mPFC of one mouse from each cagegroup with stable ranks (persisting for at leastfour continuous daily trials before the injection)(fig. S7). Mice infected with Ras virus movedupward in the rank, starting as early as 12 hoursafter viral injection (Fig. 4, F and G, and fig.S8A). In contrast, mice infected with Rap virusmoved downward in the rank (Fig. 4, F and G,and fig. S8B). Infection of virus expressinggreen fluorescent protein (GFP) alone did notresult in any rank shift (Fig. 4, F and G, andfig. S8E).
As the synaptic effect of Ras may involveboth pre- and postsynaptic changes (25, 26) andRas-induced synaptic potentiation was relativelytransient (<3 days) (fig. S6), we thenmanipulatedthe AMPA receptor–mediated transmission morespecifically by using constructs that express eitherthe AMPA receptor subunit GluR4, which under-goes synaptic delivery and increases synaptic trans-mission under basal conditions (27, 28) (see alsoSOM text note 2), or the C terminus of GluR4(R4Ct), which can block synaptic trafficking ofAMPA receptors (27) (see also SOM text note 3).Recording in acutemPFCslices fromvirus-infectedmice revealed that viral expression of GluR4potentiated (173 T 22% of controls, P = 0.01),whereas R4Ct depressed (24 T 2%of controls,P=0.0006), AMPA-EPSCs in mPFC (Fig. 4, C to E,and fig. S5). Correspondingly, GluR4 increased,whereas R4Ct decreased the tube-test rank ofinjected animals (Fig. 4, F to G, and fig. S8).Analysis of the viral infection sites reveals thatthe rank change correlated best with the infec-tion rates in the PL region (fig. S7). Injectionof the same amount of R4Ct virus into the M1motor cortex had no effect on the rank (Fig. 4G
A B
PL
IL
AC
Rank-1
2 s
20 p
A
Rank-4
8
10
12
14
Rank-1 Rank-4
*
mE
PS
C a
mpl
itude
(pA
)
Bregma +1.94 mm
C D
E
0
50
100
Pair1 2 3 4 5
Rank-1Rank-4
p<0.001 p<0.01 p<0.01 p<0.001 p<0.001
Cum
ulat
ive
%
0 20 40 0 20 40 0 20 400 20 40 600 10 20 30
p=0.231p<0.0001
mEPSC amplitude (pA) Inter-event-interval (s)
0
50
100
0
50
100
0 40 80 120
Cum
ulat
ive
perc
enta
ge
Cum
ulat
ive
perc
enta
ge
0 20 40 60
Rank-1
Rank-4
Rank-1
Rank-4
AC PL IL
c-F
os p
ositi
ve c
ells
ControlWinnerLoser
F GWinner Loser *
n=5
200 µm0
50
100
1 mm
Fig. 3. Dominant mice have larger synaptic strength than the subordinate ones. (A) Schematic di-agram of mPFC, as outlined by the red dashed lines. The smaller red box indicates the positions of therecordings made, mostly in AC and PL. (B) (Left) Representative traces of mEPSCs from mPFC layer Vpyramidal neurons of a pair of rank-1 and rank-4 mice. (Right) Summary of the results from 60 neuronsof five pairs of mice (12 neurons from each animal). The P value is obtained by two-tailed Student’s t teston log-transformed data. (C) Cumulative distribution of mEPSC amplitudes of all 60 neurons. (D) Cumu-lative distribution of mEPSC inter event intervals (equal to 1 per frequency). (E) Cumulative distribution ofmEPSC amplitudes from the 12 neurons of each individual pair of animals. (F) Representative images ofPL slices from a winner and loser mouse stained for c-Fos 120 min after 5 rounds of tube test. (G) Averagec-Fos–positive cell counts per 30-mm-thick slice. Two-tailed Student’s t test. *P < 0.05. Error bars, SEM.
www.sciencemag.org SCIENCE VOL 334 4 NOVEMBER 2011 695
REPORTS
on
Nov
embe
r 6,
201
1w
ww
.sci
ence
mag
.org
Dow
nloa
ded
from

and fig. S9), which indicated that the effect ismPFC-specific.
To confirm that viral manipulations in mPFCaffected dominance instead of other variables thatcould alter tube-test behavior (fig. S3), we per-formed an additional dominance measure, theultrasonic vocalization test. When tested for ultra-sound vocalizations toward a female, low-rankmice injected with GluR4-expressing virus dis-played a significant increase, whereas high-rankmice injected with R4Ct-expressing virus showed
a marked decrease in both the frequency and du-ration of ultrasound production at 36 to 60 hoursafter viral injection (Fig. 4H and fig. S10), re-sulting in a bidirectional shift in ultrasonic testrank (Fig. 4I and fig. S10).
Here, we established that the tube test is asimple and reliable method that provides hierar-chical ranking of social groups in mice. Usingthis and other dominance measures, we identifiedthemPFC circuitry, in particular the dorsalmPFC,as a neural substrate for dominance hierarchy.
The bidirectional modulation suggests that theeffect of mPFC synaptic efficacy on dominanceis specific and unlikely to be due to secondaryeffects.
How could mPFC contribute to the determi-nation of social status? Social hierarchy behav-ior depends on a collection of cognitive traitsinvolving recognition of social status, learning ofsocial norms, and detection of violation of socialnorms (10). mPFC has been explicitly implicatedin social cognition (29). Through its projections
BA
CtrlInfected
C* GluR4
Ctrl
R4CtCtrl
***
D
GluR4
4321
4321
R4Ct
EP
SC
(%
)
0
50
100
150
0
100
200
12 24 36 48 60 72-36 -24 -12
12 24 36 48 60 72-36 -24 -12
Bilateral viralinjection in mPFC
Pair recording of mPFClayer V neurons
V
II/III
Before After injection (hr)
F
-1
1
*
*
*** * ** ****
** *
* *
H I
100
50
0
50
100
0
3
6*
*
AfterBefore
*
GluR4(n=8)
R4Ct(n=9)
0
G*
****
**
100
50
0
50
100
Ras(n=5)
GluR4(n=9)
Rap(n=7)
R4Ct(n=13)
GFP(n=6)
R4Ct(n=4)
E
Before After injection (hr) -36 -24 -12 12 24 36 48 60 72
10 µm
500 µm
100 µm
Virus injection
IAMPA
INMDAIAMPA
INMDA
InjectedUninjected
EP
SC
(%
)A
vera
ge
chan
ge
in r
ank
po
siti
on
% a
nim
als
sho
win
g r
ank
chan
ge
% a
nim
als
sho
win
g r
ank
chan
ge
Ln
(U
ltra
sou
nd
nu
mb
er +
1)
Ran
k in
tu
be
test
Ran
k in
tu
be
test
Ras
RapGluR4
R4CtGFP
R4CtGluR4
mPFCmotorcortex
I
VI
40 ms
-60 mV
+40 mV
Ras
RapGluR4
R4CtGFP
0
100
200
300
% E
PS
C IA
MP
A
*
****
**
n=19 n=12 n=12 n=16 n=13
Ctrl
Bregma +2.22 mm
50 µm
20 p
A
Fig. 4. Modulations of mPFC synaptic efficacy caused bidirectional shift ofhierarchical rank. (A) Example of GFP-GluR4 virus injection sites (counter-stained with Hoechst). White dashed lines outline the mPFC. (B) Simultaneouswhole-cell recording of EPSCs from a pair of layer V pyramidal neurons whilelayer II/III was stimulated. (Top left) Illustration of the recording configuration.(Top right) Patching of a pair of infected (by GFP-Ras) and uninfected mPFCneurons under transmitted and fluorescent light microscopy. (Bottom) Exam-ple of evoked EPSC recorded at –60 and +40 mV from a neuron pair. Stimu-lation artifacts are marked by filled circles. (C and D) Effects of virus expressingGFP-GluR4 (C) and red FP (RFP)–R4Ct (D) on the AMPA receptor– and N-methyl-D-aspartate (NMDA) receptor–mediated EPSCs (left) and the tube-testrank dynamics of a four-mouse group (right). Arrowhead indicates the injectionat 0 hours time point. (E and F) Summary of effects on AMPA receptor–
mediated EPSCs (E) and tube-test rank (F) as induced by injection of eachviral construct. n in (F) is the same as in (G). (G) Summary of percentage ofanimals showing rank increase (left upward column) or decrease (right down-ward column) in the tube test. (H) Natural log–transformed number of ultra-sonic vocalization events toward a female before and after viral injection.Natural log transformation was taken to normalize the data and reduce thedata span. Each line represents data from one mouse. (I) Summary of per-centage of mice showing rank increase or decrease in ultrasound test inducedby GluR4 and R4Ct viruses. (C) to (F) and (I) Wilcoxon signed rank test, incomparison with neighboring noninjected control neurons (C) to (E) or withrank change of animals injected with GFP-expressing virus (F) or noninjectedanimals (I). (G) Fisher’s exact test, compared with GFP-injected animals. *P <0.05; **P < 0.01; ***P < 0.001. Error bars, SEM.
4 NOVEMBER 2011 VOL 334 SCIENCE www.sciencemag.org696
REPORTS
on
Nov
embe
r 6,
201
1w
ww
.sci
ence
mag
.org
Dow
nloa
ded
from
to regions such as dorsal raphe, ventral tegmentalarea, hypothalamus, and amygdala, mPFC exertstop-down controls on serotonin and dopaminerelease, endocrine function, and fear response.All of these could contribute to key features ofthe dominance behaviors, including aggressive-ness, stress responsiveness, and fearfulness. Itwill be of interest to determine which of thesemPFC downstream circuits are specifically in-volved in setting the dominance hierarchy andto investigate how the dominance rank is ini-tiated and maintained by differential neuronalactivities in these circuits. Likewise, it will alsobe important to understand how the behavioralspecificity of mPFC is generated by distinct up-stream inputs, given the multiple functions thatmPFC has been implicated in [reviewed by (30)and, recently, (31–34)]. The identification of aneural substrate of dominance hierarchy shouldprovide new insights into the coding of a funda-mental social behavior in the mammalian ner-vous system.
References and Notes1. E. O. Wilson, Sociobiology: The New Synthesis (Harvard
Univ. Press, Cambridge, MA, 1975).2. I. S. Bernstein, Behav. Brain Sci. 4, 419 (1981).3. R. M. Sapolsky, Science 308, 648 (2005).4. S. R. Yeh, R. A. Fricke, D. H. Edwards, Science 271, 366
(1996).5. C. Drews, Behaviour 125, 283 (1993).
6. D. G. Frankel, T. Arbel, Int. J. Behav. Dev. 3, 287(1980).
7. J. Masur, M. A. Benedito, Nature 249, 284 (1974).8. D. A. Dewsbury, Anim. Behav. 39, 284 (1990).9. A. Mehrabian, Curr. Psychol. 14, 261 (1996).10. D. D. Cummins, Synthese 122, 3 (2000).11. G. Lindzey, H. Winston, M. Manosevitz, Nature 191, 474
(1961).12. A. S. Garfield et al., Nature 469, 534 (2011).13. H. Arakawa, D. C. Blanchard, R. J. Blanchard, Behav.
Brain Res. 176, 27 (2007).14. S. Y. Long, Anim. Behav. 20, 10 (1972).15. L. C. Drickamer, Behav. Processes 53, 113 (2001).16. J. Nyby, G. A. Dizinno, G. Whitney, Behav. Biol. 18, 285
(1976).17. D. Benton, J. C. Dalrymplealford, P. F. Brain, Anim.
Behav. 28, 1274 (1980).18. C. F. Zink et al., Neuron 58, 273 (2008).19. J. Y. Chiao, Curr. Opin. Neurobiol. 20, 803 (2010).20. H. B. Uylings, H. J. Groenewegen, B. Kolb, Behav. Brain
Res. 146, 3 (2003).21. R. R. Holson, Physiol. Behav. 37, 239 (1986).22. H. Marie, W. Morishita, X. Yu, N. Calakos, R. C. Malenka,
Neuron 45, 741 (2005).23. S. G. McCormack, R. L. Stornetta, J. J. Zhu, Neuron 50,
75 (2006).24. H. L. Hu et al., J. Neurosci. 28, 7847 (2008).25. J. J. Zhu, Y. Qin, M. Zhao, L. Van Aelst, R. Malinow,
Cell 110, 443 (2002).26. S. A. Kushner et al., J. Neurosci. 25, 9721 (2005).27. J. J. Zhu, J. A. Esteban, Y. Hayashi, R. Malinow,
Nat. Neurosci. 3, 1098 (2000).28. J. J. Zhu, J. Neurosci. 29, 6320 (2009).29. D. M. Amodio, C. D. Frith, Nat. Rev. Neurosci. 7, 268
(2006).30. R. P. Vertes, Synapse 51, 32 (2004).
31. H. E. Covington 3rd et al., J. Neurosci. 30, 16082(2010).
32. O. Yizhar et al., Nature 477, 171 (2011).33. K. Guillem et al., Science 333, 888 (2011).34. D. Tse et al., Science 333, 891 (2011).Acknowledgments: We thank J. Zhu for the gifts of
pSindbis GluR4 and R4Ct constructs and discussion onGluR4; R. Malinow for support of the initial exploration ofthe tube test in his laboratory; M. Poo, H. Kessels,J. Feldman, and R. Sapolsky for discussion and criticalreading of the manuscript; J. Yan for help withstatistics; B. Lu for the idea of agonistic behaviortest; B. Zhang, K. Zhang, and M. Streets for technicalhelp; Y. Yanagawa for the Gad67-GFP mouse;and X. Yu for ultrasound equipment. The work wassupported by Chinese 973 Program (2011CBA00400),Projects of the Scientific Research Foundation, theHundreds of Talents Program, and the ShanghaiPujiang Talent Program to H.H. Author contributions:F.W. performed most experiments. J.Z. participatedin the behavioral and viral injection experiments.F.W., J.Z., and H.H. analyzed data and preparedthe figures. H.Z, Q.Z., and Z.L. assisted inexperiments. H.H. designed the study and wrote themanuscript.
Supporting Online Materialwww.sciencemag.org/cgi/content/full/science.1209951/DC1Materials and MethodsSOM TextFigs. S1 to S10References
17 June 2011; accepted 9 September 2011Published online 29 September 2011;10.1126/science.1209951
Social Network Size Affects NeuralCircuits in MacaquesJ. Sallet,1,2*† R. B. Mars,1,2* M. P. Noonan,1,2* J. L. Andersson,2 J. X. O’Reilly,2 S. Jbabdi,2
P. L. Croxson,1,3 M. Jenkinson,2 K. L. Miller,2 M. F. S. Rushworth1,2
It has been suggested that variation in brain structure correlates with the sizes of individuals’social networks. Whether variation in social network size causes variation in brain structure,however, is unknown. To address this question, we neuroimaged 23 monkeys that had beenliving in social groups set to different sizes. Subject comparison revealed that living inlarger groups caused increases in gray matter in mid-superior temporal sulcus and rostralprefrontal cortex and increased coupling of activity in frontal and temporal cortex. Socialnetwork size, therefore, contributes to changes both in brain structure and function. The changeshave potential implications for an animal’s success in a social context; gray matterdifferences in similar areas were also correlated with each animal’s dominance within itssocial network.
The evolution of primate brains is thoughtto be associated with the demands of liv-ing in a complex social environment (1).
Recent evidence shows that differences in brainstructure correlate with variation in individuals’social network size (2); some brain structures are
larger in people in regular contact with a largernumber of relatives, friends, and colleagues.However, the direction of cause and effectunderlying this phenomenon is unknown. Al-though this issue has not been directly inves-tigated, sensorimotor experience is known tolead to brain structural changes even duringadulthood (3, 4). For instance, learning to use atool increases gray matter density in the intra-parietal sulcus (IPS), caudal superior temporalsulcus (STS), and somatosensory cortex in therhesus macaque (Macaca mulatta) (3). Here,we exploit the pseudo-randomized assign-ment of individual animals to social groups
in a research colony (5) to demonstrate thatvariation in young adult rhesus macaques’ so-cial environments changes structure and func-tion in a distributed neural circuit centered onmid-STS, anterior cingulate cortex (ACC), androstral prefrontal cortex (rPFC).
First, we conducted a deformation-basedmorphometric (DBM) analysis (6) of magneticresonance imaging (MRI) scans of brain struc-ture from 23 young adult [4.33 T 0.52 years(mean T SD)] monkeys (14 males) (5). Scannedanimals were drawn from 34 animals from dif-ferent groups within a research colony. The ani-mals were housed in groups of between one andseven individuals. We considered the number ofhousemates of each monkey as a measure ofsocial network size.
The organization of monkeys into groupswas not randomized in a conventional sense butinstead depended on factors that were indepen-dent of social characteristics; these included therequirements of independent programs of neuro-scientific research and veterinary considerations[full details of housing arrangements are pro-vided (5)]. A true randomization of animals wouldhave been virtually impossible given numerousconsiderations, including the constraints imposedby the licensing of experimental procedures, thecost of such a project, and the potential for dis-ruption to other research programs. While someunobserved variables might have contributed tothe outcomes we report, group assignment wasnot carried out on the basis of social character-
1Department of Experimental Psychology, University of Ox-ford, Oxford OX1 3UD, UK. 2Oxford Centre for FunctionalMagnetic Resonance Imaging of the Brain (FMRIB), Universityof Oxford, Oxford OX1 3UD, UK. 3Icahn Medical Institute,Mount Sinai School of Medicine, New York, NY 10029, USA.
*These authors contributed equally to this work.†To whom correspondence should be addressed. E-mail:[email protected]
www.sciencemag.org SCIENCE VOL 334 4 NOVEMBER 2011 697
REPORTS
on
Nov
embe
r 6,
201
1w
ww
.sci
ence
mag
.org
Dow
nloa
ded
from