Biases in irish health service statistics w behan 2014
76
Biases in Irish Health Service Statistics William Behan June 2014
-
Upload
drwilliambehan -
Category
Healthcare
-
view
279 -
download
0
Transcript of Biases in irish health service statistics w behan 2014

Biases in Irish Health Service Statistics
William BehanJune 2014

How are Irish GPs Presented?
High annual payment per public patient High private fees Low workload due to significant financial barrier to
GP attendance High payment per public consultation Under supply of GPs => Best paid doctors in Europe Only moderate national over 65 years old influenza
immunisation rate


High annual payment per public patient
Includes GMS Superannuation
2008/09 Missing GPVC patients

• Consumer Price Index increased by 24% 2002-2014• Average pay increase in the public health service 2002-2013 = 50%. • Junior nurses and administrators starting in 2002 who have not
been promoted now earn over 60% more than their starting salary.• 2013 4th FEMPI reduction of 7.5% “fair and reasonable”
High annual payment per public patient

How are Irish GPs Presented?
High annual payment per public patient
High private fees
Low workload due to significant financial barrier to GP attendance
High payment per public consultation
Under supply of GPs => Best paid doctors in Europe
Only moderate national over 65 years old influenza immunisation rate
Based on under reflection of GMS patient numbers and overstatement of GMS income by the PCRS (adding in non-GMS payments such as Mother and Child Scheme, Primary Immunisations, Heartwatch and Methadone payments)

How are Irish GPs Presented?
High annual payment per public patient High private fees / significant financial barriers Low workload High payment per public consultation Shortage of GPs => Best paid doctors in Europe Only moderate national over 65 years old influenza
immunisation rate

High private fees
The financial cost to patients of visiting a GP in Ireland: a cross-sectional survey, S O’Connell, W Cullen. Ir J Med Sci. 2001 Jan-Mar;170(1):45-8.•4 survey centres Summer 2000: Dublin suburban, Dublin south city, Dublin north city and Rural town centre•384 surveyed, 319 had seen their GP in the previous 12 months and 79% usually paid for their visits to the doctor. •They paid between IEP12 and IEP40 on their last visit to the GP. Median and mode IEP20, mean IEP21.79.

Private patients pay a fee-for-service, and the average fee in 2002 was €33 (Indecon Economic Consultants, 2003).

“with the full consultation fee perhaps being between €60 and €80.”
High private fees
Health Systems in TransitionIreland:
Health System Review 2009
European Observatory on Health Systems and Policies.

High private fees
National Consumer Agency Doctors and Dentists Survey May 2010•123 practices nationally. •The average price, across all survey locations, for a routine examination is €51. •At national level the range is significant, from €35 to €70.

High private fees
thejournal.ie 2013
“GP fees in Dublin are the most expensive in the country
Aug 22 5:57 PM 10,070 Views 81 Comments
THE AVERAGE NATIONAL cost of going to see the doctor is €46.26, according to a new survey by Laya Healthcare.
The online research poll of 501 parents with children under 18 who hold private health insurance found that Dublin has the most expensive GP visit costs, with an average consultation fee of €53.29. People in the west and northwest are paying the lowest GP costs at an average of €45.61.”

High private fees
The strength of primary care in Europe: an international comparative studyBJGP November 1, 2013 vol. 63 no. 616 e742-e750
“The highest (formal) payments in the public system exist in Ireland, where patients without a medical card (about 70% of the population) pay €60 to €80 for each general practice visit, with no reimbursement. ”

High private fees/ Quality of GP
Country
The structure of primary care
Primary care
governance
Economic conditions of primary
care
Primary care
workforce development
Ireland Weak Weak Strong
Country
The service-delivery process of primary careOverall primary
care system strength
Access to primary
care
Continuity of primary
care
Coordination of primary
care
Comprehensiveness of primary
care
Ireland Weak Strong Weak Medium Weak
The strength of primary care in Europe: an international comparative studyBJGP November 1, 2013 vol. 63 no. 616 e742-e750


High private fees/Accessibility
Unmet care needs for medical examination by income level, European countries, 2011


Increase in life expectancy 1997-2007 and potential gains in 2007 through greater efficiency

GDPHE: GDP Health Expenditure compared to clinical outputs
William Behan, 06/16/2014
Life expectancy in Ireland has greatly increased since 2005 (even though offical figures were subjected to a change in calculation methodology which reduce recent life expectancy figure by 0.5 - 1 year. GDP HE rose 2005-2009 and has been reducing since - 2005 7.6%, 2009 10%, 2012 8.9%

The Competition Authority


W Behan, 2014

2001 CSO attendance rate GMS 8.9; Private 3.46 and All patients 52013 IMJ attendance rate GMS 7.72; Private 3.35 and All patients 5.17

How are Irish GPs Presented?
High annual payment per public patientHigh private fees / significant financial barriers
Low workload
High payment per public consultation
Shortage of GPs => Best paid doctors in Europe
Only moderate national over 65 years old influenza immunisation rate
International perception of high private fees is driven by the 2009 Health Systems in Transition Ireland: Health System Review
fee of €60-80 per consultation and references to “standard fees” rather than the OECD working paper recommendation of average of
high, low & no fees which does not occur in Ireland.OECD Health at a Glance 2013 clearly indicates that Irish GPs are
among of the most accessible in EuropeFrench/Belgian GPs have opportunities for extra income/charges on
top of their standard feesIn the case of Belgian GPS – they receive an annual payment to
support their practice so private fees are really just a top up on their annual income

How are Irish GPs Presented?
High annual payment per public patient High private fees / significant financial barriers Low workload High payment per public consultation Shortage of GPs => Best paid doctors in Europe Only moderate national over 65 years old influenza
immunisation rate

Low consultation rate: TCA

Low consultation rate: Budget Perspectives 2012, ESRI
William Behan, 06/25/2014
Error is made by dividing the number of consultations NOT by the number of GPs in the country but by the number of non-consultant doctors on registrar (whether working or not)

Low consultation rate: OECD
HEALTH CARE ACTIVITIESDoctors consultations, Number per capita
2006 2007 2008 2009 2010 2011 2012 2011 (or nearest year)
Australia 6.1 6.3 6.4 6.6 6.6 6.7 6.9 6.7 Austria 6.7 6.8 6.9 6.9 6.9 6.9 .. 6.9 Belgium 7.1 7.2 7.5 7.6 7.4 7.4 .. 7.4 Canada 7.6 7.7 7.8 7.7 7.4 .. .. 7.4 Germany 7.9 8.1 8.6 9.2 9.9 9.7 .. 9.7
Ireland .. 3.3 .. .. 3.8 .. .. 3.8 Netherlands 5.6 5.7 5.9 5.7 6.6 6.6 .. 6.6 United Kingdom 5.1 5.0 5.9 5.0 .. .. .. 5.0 United States
3.8 4.0 3.9 4.1 .. .. .. 4.1 OECD AVERAGE 6.6
Source: OECD Health Statistics 2013
http://stats.oecd.org/Index.aspx?DataSetCode=HEALTH_PROC
William Behan, 06/25/2014
Conveniently missing 2001 CSO data

Central Statistics Office Surveys
CSO 2001 Survey = 19.5 m consults pa GP CSO 2007 Survey = 12.2 m consults pa GP CSO 2010 Survey = 14.6 m consults pa GP
? Could this be right in a situation of rising population, more elderly, rising doctor numbers, more demanding patient population.

Are Irish adult general practice consultation rates
as low as official records suggest?A cross sectional study of 6 general practices. IMJ Nov/Dec 2013
Behan W, Molony D, Beame C and Cullen W.
Study period Oct 2012-13 Reviewed 27,080 files, 20,706 >18 Pop comparable to national Practices 4 corners of Ireland All using CompleteGP and appointments Direct contact pt/dr—surgery, hse, phone OOH & Phone – one practice Rural, Mixed, Town, City

Work not included
Repeat prescriptions Forms filling Giving laboratory results Secretarial support work Organising appointments with ancillary Reports, PMAs, the “GOOD letter”
Could be as much work again for which the GP is responsible

Counterintuitive 2007 and 2010 CSO GMS attendance rates
W Behan, 2014
William Behan, 06/25/2014
Do people really attend less as they get older?
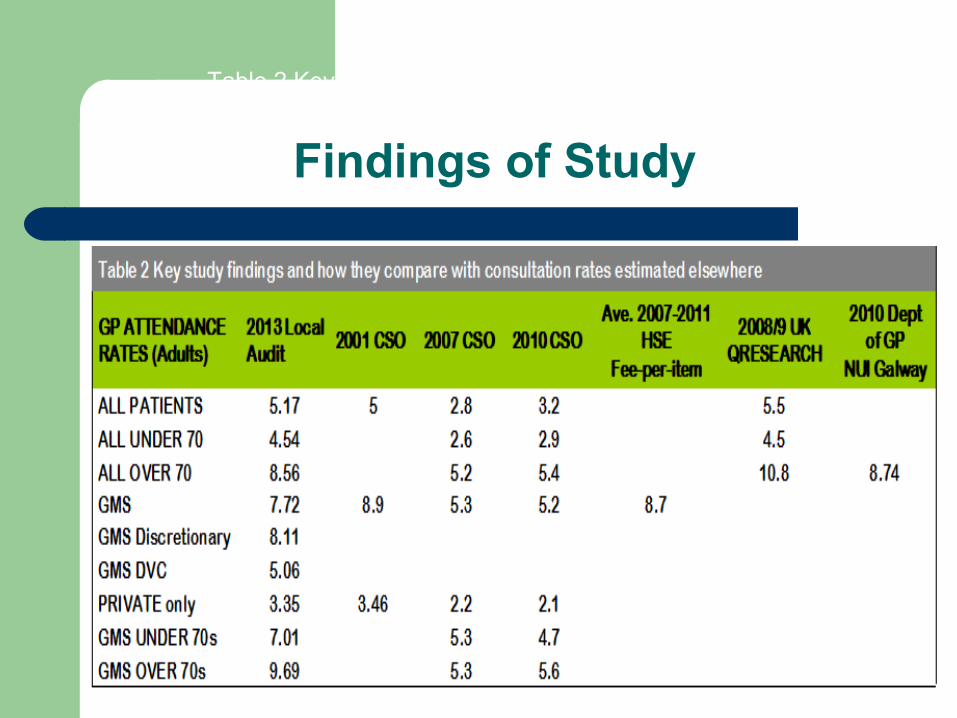
Findings of Study
Table 2 Key study findings and

Counterintuitive 2007 and 2010 CSO GMS attendance rates
W Behan, 2014

ALL PATIENTS 1
ALL UNDER 70 2
ALL OVER 70 3
GMS 4
GMS Discretionary 5
GMS DVC 6
PRIVATE only 7
GMS UNDER 70s 8
GMS OVER 70s 9
Counterintuitive 2007 and 2010 CSO GMS attendance rates
W Behan, 2014
William Behan, 06/16/2014
LIIS 2001 markers are hidden under 2007 and 2010 CSO GMS

ALL PATIENTS 1
PRIVATE only 2
GMS 3
ALL UNDER 70 4
ALL OVER 70 5
GMS UNDER 70s 6
GMS OVER 70s 7
GMS Discretionary 8
GMS DVC 9
GP Attendance Rates
W Behan, 2014
William Behan, 06/16/2014
2007 and 2010 CSO GMS are removed to reveal TILDA 2011 and LIIS 2001

ALL PATIENTS 1
PRIVATE only 2
GMS 3
ALL UNDER 70 4
ALL OVER 70 5
GMS UNDER 70s 6
GMS OVER 70s 7
GMS Discretionary 8
GMS DVC 9
GP Attendance Rates
W Behan, 2014
William Behan, 06/16/2014
2010 CSO GMS reintroduced

ALL PATIENTS 1PRIVATE only 2GMS 3ALL UNDER 70 4ALL OVER 70 5
GMS UNDER 70s 6GMS OVER 70s 7
GMS Discretionary 8GMS DVC 9
GP Attendance Rates
W Behan, 2014
William Behan, 06/16/2014
2007 and 2010 CSO GMS are both reintroduced to fully cover TILDA 2011 and LIIS 2001

Counterintuitive 2007 and 2010 CSO GMS attendance rates
W Behan, 2014

Survey of 249 Patients Recollection of GP Attendance WONCA 2013
Patients < 65 yrs estimated attendance rates accurately
Patients 65-74 yrs under estimated their attendance rates by 20%
Patients 75+ yrs under estimated their attendance rates by 30%
This results in a total under estimation of consultation rates (Public & Private) by 18%
This study shows a clear degradation of recollection of consultations which predominantly affects those
patients 70 years and older.
Younger patients come less often and remember more and older patients come more
often and remember less!

Difference in GP attendance rates can be explained by study methodology
1 year recollection surveys are the 2001 Living in Ireland Survey (sample size 6,521), 2007 (sample 21,253) & 2010 (sample 15,673) CSO surveys.
Audit of patient records are produced by the PCRS fee-per-item consultation rates (7 GPs), 2008/9 QRESEARCH (4.3 million patients) and IMJ Nov 2013 audit of 6 practices (20,706 adults)
2 weeks recollection survey is based on 2001 CSO (44,844)
Survey Audit Records/1 Year Recall 2 Week recall
ALL PATIENTS 3.1 5.2GMS 5.3 8.4PRIVATE only 2.2 3.4
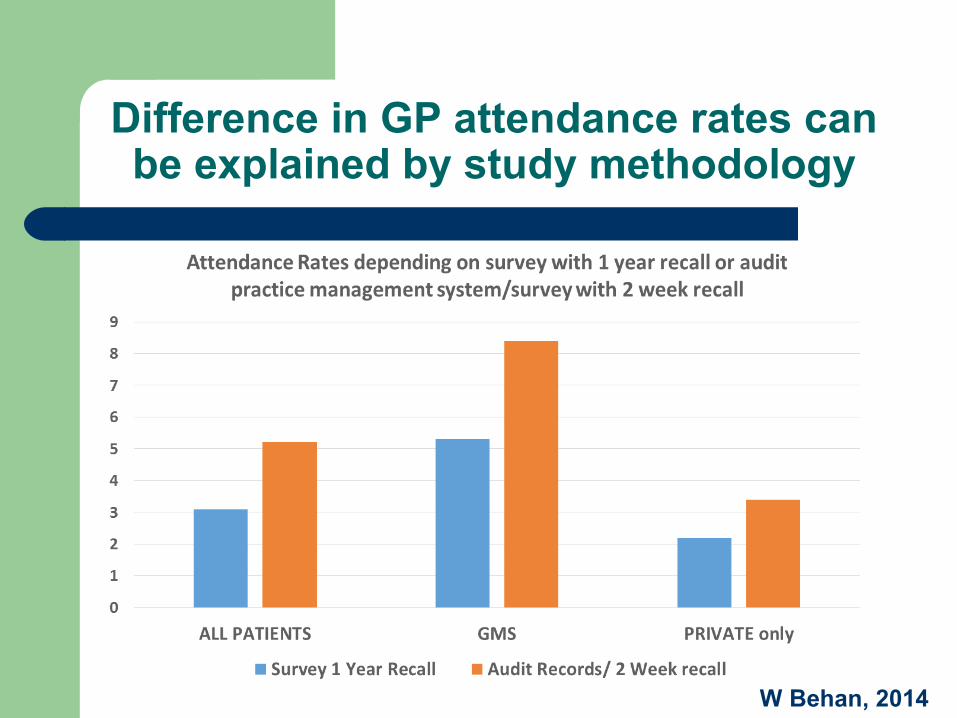
Difference in GP attendance rates can be explained by study methodology
W Behan, 2014

Does eliminating fees at point of access affect Irish General Practice attendance rates in the under 6 years old population?
A cross sectional study at six general practicesIMJ April 2014. Behan W, Molony D, Beame C, Cullen W.
Population-27,080 ; 1931 <6; 5,814 consultations,
750,000 predicted extra visits PA or 230 consults/ WTE GP before extra unnecessary work demanded in contract.
Sony, 06/13/2014
“Current use of GP services by young children” by Dervla Kelly, Alan Kelly and Tom O’Dowd.“Slide 10Since <baby> was born, how many times have you seen, or talked on the telephone with any of the following about <baby’s> physical health? (exclude at time of birth)GPpublic health nurse or practice nurse “

How are Irish GPs Presented?
High annual payment per public patient
High private fees / significant financial barriersLow workload
High payment per public consultation
Best paid doctors in Europe
Shortage of GPs promotes higher individual income
Only moderate national over 65 years old influenza immunisation rate
• Utilising 1 year recollection, asking the wrong question and sometimes utilising proxy respondents which are well established methods of under-reflecting GP attendance rates by about 40%.
• Clear consistency between 2001 LIIS, 2007 & 2010 CSO surveys which all demand 1 year recollection vs 2001 CSO 2 week survey, Qresearch 2009 audit, NUI Galway 2010 audit and IMJ 2013 Adult & 2014 under 6 audits which all closely correlate with each other and are re very dissimilar to 1 year recollection surveys.

The OECD HEALTH COMMITTEE: Health Accounts Experts 2009 and Health Working Papers 2010 directly quotes Charles F. Cannell's work stating (health survey methodology) :
“non-sampling biases can be large”1. The number of events forgotten increases proportionately
with the length of the recall period (upwards of 30-50%).
2. Events with less salience or impact on the individual are more likely to be forgotten.
3. Proxy respondents tend to report 20% fewer events.
NB: If the question is unclear or does not reflect the subject being studied, it will deliver an unreliable result
Why was the 2001 CSO methodology requiring 2 week recollection changes to 1 year recollection for the 2007
and 2010 surveys when 2006 Eurostat EHIS protocol was to require recollection over 4 weeks?

How are Irish GPs Presented?
High annual payment per public patient High private fees / significant financial barriers Low workload High payment per public consultation Shortage of GPs => Best paid doctors in Europe Only moderate national over 65 years old influenza
immunisation rate


TCA and ESRI 2009/10 Reports / Conference
GP visit €50-55 for private patients 2005 CSO data: doctors fees averaged €193 per
household and GP fees account for 70% overall doctors fees.
2000-2009 CPI rose 30% but GP fees rose 87% In 2008, GPs received €65 for every visit made by a
public patient (private patients €51 in 2010) => Irish GPs more highly remunerated for seeing public patients than private patients
2011 conference: GPs received €120 for every new over 70s visit (€640 capitation 2007/5.3 visits p.a.CSO 2007)

Average GP fee calculation
Total GP income for all GP consultations
Total number of consultations in GP
Average standard GP consultation fee
Total GP income for all consultations
Number of clinical consultations with GP only, not including nurse and telephone clinical consultations
W Behan, 2014
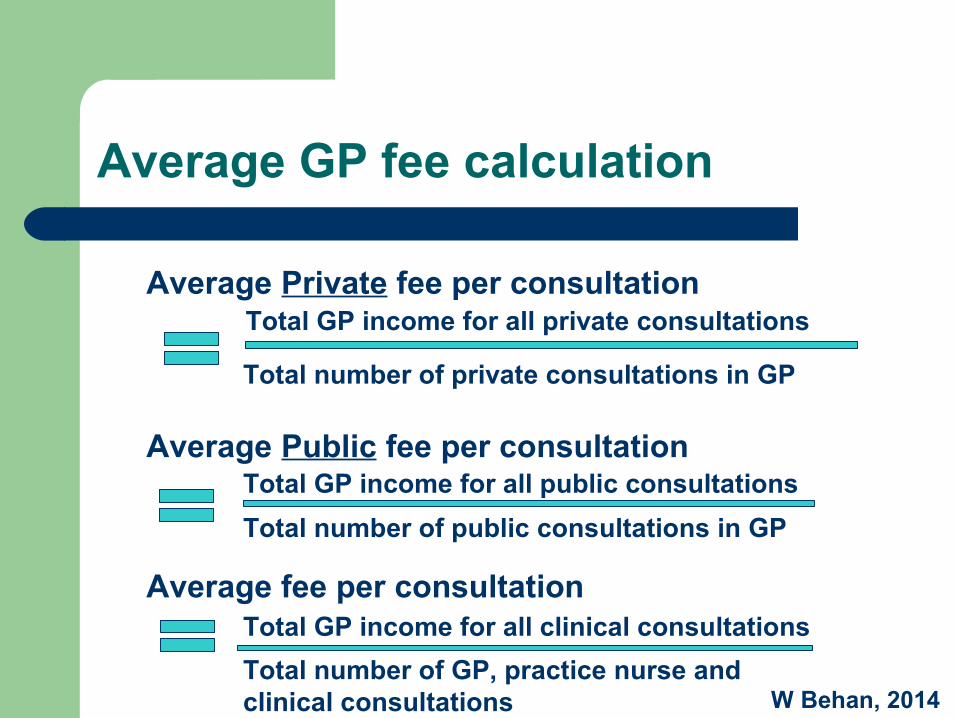
Average GP fee calculation
Total GP income for all private consultations
Total number of private consultations in GP
Total GP income for all public consultations
Total number of public consultations in GP
Average fee per consultation
Average Private fee per consultation
Average Public fee per consultation
Total GP income for all clinical consultations
Total number of GP, practice nurse and clinical consultations W Behan, 2014

How are Irish GPs Presented?
High annual payment per public patient
High private fees / significant financial barriers
Low workloadHigh payment per public consultation
Shortage of GPs => Best paid doctors in Europe
Only moderate national over 65 years old influenza immunisation rate
Exaggerated total GMS payments and under-reflection GMS attendance rates and numbers
IMJ 2013 Audit accurately predicted subsequently published 2012 fee-per-item and N.I. consultation rates (assuming all R.of I. private patients attend at GPVC rates)

How are Irish GPs Presented?
High annual payment per public patient High private fees / significant financial barriers Low workload High payment per public consultation Shortage of GPs => Best paid doctors in Europe Only moderate national over 65 years old influenza
immunisation rate
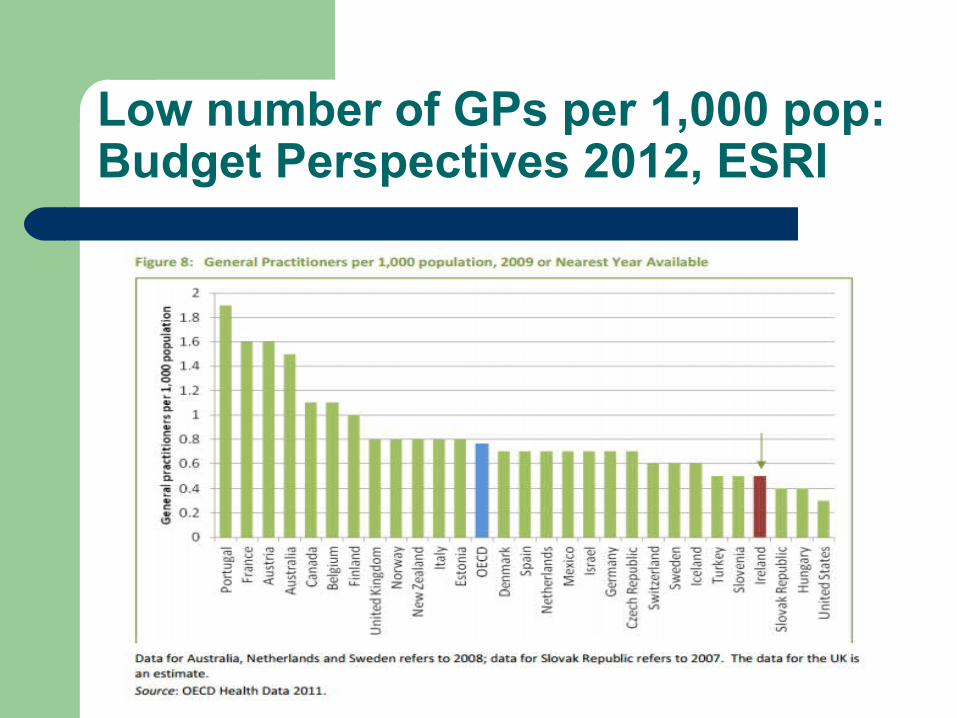
Low number of GPs per 1,000 pop: Budget Perspectives 2012, ESRI

Low consultation rate: Budget Perspectives 2012, ESRI

Low consultation rate: TCA

Shortage of doctors promotes higher individual income
W Behan, 2014

“Best Paid Doctors in Europe”

“Best Paid Doctors in Europe”
1. The European Observatory Report (2012)
2. GPs and the Irish primary care system: towards Universal Primary Care? (2014) Oireachtas Library
and Research Service
“there are approximately 14 million visits to GPs annually”“cited Irish costs as about €60 to €80
per visit with no reimbursement…overstatement”
“OECD figures suggest there is considerable scope for a reduction in GP income in Ireland”
”

“Best Paid Doctors in Europe” – D. Molony version Payments 2,400 GMS GPs 2011 (including subsidies) was €447,750,479 or €186,563 per GP (best paid doctors in Europe)
Excluding Nurse and Secretary subsidies to 2400 full Time GMS GPs
in 2011 – 361,682,940 (not all nurse and secretary hours are subsidised) Approx 800 GPs employed by the GMS GPs --average cost of €100,000 per
year per GP. – €80,000,000
Leaves €281,682,940 for 2,400 GMS GPs or €117,367.89 per GP in 2011
FEMPI 2012 – Minus 10% or €105,631.10 per GMS GP FEMPI 2013 – Minus 7.5% or €97,708.77 per GMS GP
This 2.27 times the Average Industrial Wage (The average industrial wage is €43,101.76 Feb 2013).
While this does not include private income it is before costs of Rent, Rates, IT, Phone, Heating, Electricity, Broadband, Insurance, stationary, required training, cost of Coops, none-subsidised staff.
“Best Paid Doctors in Europe”
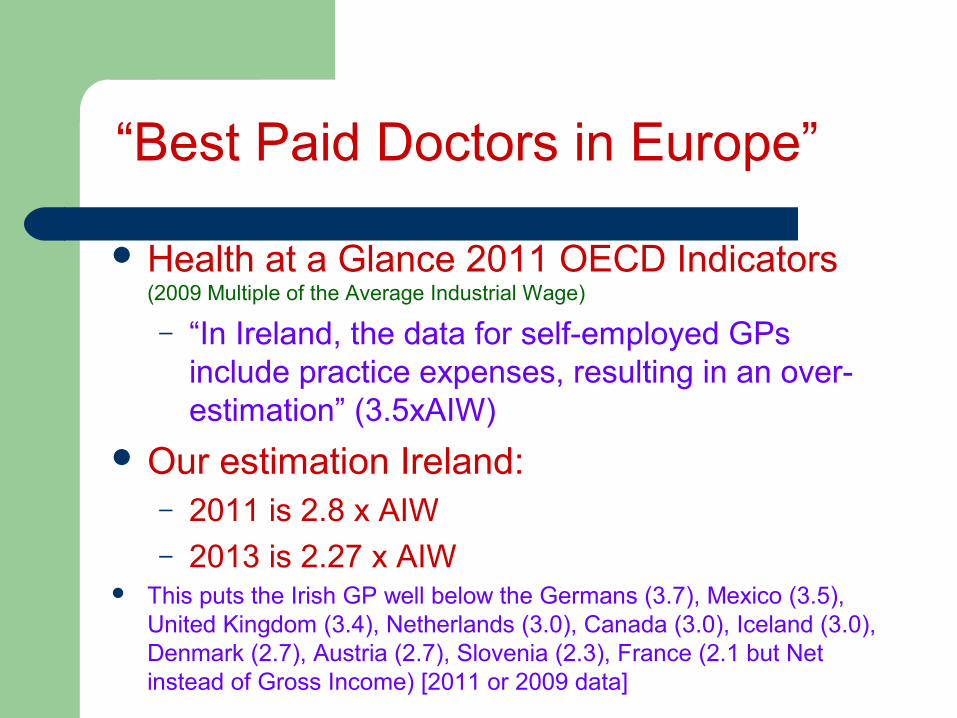
Health at a Glance 2011 OECD Indicators (2009 Multiple of the Average Industrial Wage)
– “In Ireland, the data for self-employed GPs include practice expenses, resulting in an over-estimation” (3.5xAIW)
Our estimation Ireland:– 2011 is 2.8 x AIW– 2013 is 2.27 x AIW
This puts the Irish GP well below the Germans (3.7), Mexico (3.5), United Kingdom (3.4), Netherlands (3.0), Canada (3.0), Iceland (3.0), Denmark (2.7), Austria (2.7), Slovenia (2.3), France (2.1 but Net instead of Gross Income) [2011 or 2009 data]

How are Irish GPs Presented?
High annual payment per public patient High private fees High payment per public consultation Low workload / significant financial barriers Shortage of GPs => Best paid doctors in Europe Only moderate national over 65 years old
influenza immunisation rate

Only moderate national over 65 years old influenza immunisation rate
2011/ 2010/ 2009/ 2008/ 2007/2012 2011 2010 2009 2008
Epi-Insight/ OECD 63.8 53.8 70.1 61.7
HSE Media Office 56.5 60.1 51.6 58.2 57.2
W Behan, 2014

How are Irish GPs Presented?
High annual payment per public patient High private fees High payment per public consultation Low workload / significant financial barriers Shortage of GPs => Best paid doctors in Europe Only moderate national over 65 years old influenza
immunisation rate More recent reporting on Irish General Practice

More recent reporting on Irish General Practice
“‘Ghost’ medical card bill costs us €210m”
“Between 2010 and 2013 GP numbers have increased by 570”
“Extending Universal General Practice to the state will cost an extra €320 million.”Currently (2014) €440 m. is spent on GP p.a. including non-GMS, add €320 m. => total spend c. €750 m.HSE spend €13 billion = 67% total health spend of c.€19b.750/19,000 = 4% total health budgetUK GPs are given £10 b. not including pensions and ooh out of NHS budget of £108.5 b + £27b. Private (7.3% total health budget) to provide 330 million consultations and are seeking 11% = £33 per consultationUniversal GP = 28 m. consultations = €26.80 per con.

More recent reporting on Irish General Practice
“‘Ghost’ medical card bill costs us €210m”2012 PWC Medical Card Report figure was based on information being submitted by the PCRS to PWC that appears to have been heavily biased.This €210 figure took attention away from the PWC Report claims that the PCRS did not have the IT systems in place prior to centralisation of medical card applications and local offices were not processing medical card applications for many months prior to centralisation in an apparent unofficial work to rule.
“Between 2010 and 2013 GP numbers have increased by 570”Many older GPs were entitled to be on the register, but did not apply, are now retiring and being replaced by younger GPs. Younger GPs automatically joint the specialist register on qualification.US data indicates that younger GPS work less than their older colleagues independent of the increase feminisation of GP

How do state representatives present Irish GPs?
High annual payment per public patient High private fees vs France/Belgium High payment per public consultation Low workload / significant financial barriers Shortage of GPs => Best paid doctors in Europe Only moderate national over 65 years old influenza
immunisation rate
WHO BENEFITS FROM THE CULTIVATION OF ERRONEOUS HEALTH STATISTICS?
FIGURES INFORMING CHANGE MUST BE RELIABLE AND CONVINCING

Future Problems
EHIS Ireland 2014-2015

Research bias
Research bias, also called experimenter bias, is a process where the scientists performing the research influence the results, in order to portray a certain outcome.

Will eliminating fees at point of access affect Irish General Practice attendance rates in the under 6 years old population?
Irish Government figures disagree with April 2014 IMJ audit and UK Under 6s GP attendance figures
.
W Behan, 2014
Sony, 06/13/2014
“Current use of GP services by young children” by Dervla Kelly, Alan Kelly and Tom O’Dowd.“Slide 10Since <baby> was born, how many times have you seen, or talked on the telephone with any of the following about <baby’s> physical health? (exclude at time of birth)GPpublic health nurse or practice nurse “

Will eliminating fees at point of access affect Irish General Practice attendance rates in the under 6 years old population?
Irish Government figures disagree with April 2014 IMJ audit, Lifeways 2006 and UK 2009 Under 6s GP attendance figures
.
W Behan, 2014
Sony, 06/13/2014
“Current use of GP services by young children” by Dervla Kelly, Alan Kelly and Tom O’Dowd.“Slide 10Since <baby> was born, how many times have you seen, or talked on the telephone with any of the following about <baby’s> physical health? (exclude at time of birth)GPpublic health nurse or practice nurse “

Irish public health expenditure is falling as a proportion of total expenditure on health

Irish expenditure on health fell dramatically between 1980 and 2000 while the rest of the world increased its
expenditure as a proportion of GDP

W Behan, 2014