Bias in market R&D portfolios - New York University Stern...
15
ELSEVIER International Journal of Industrial Organization 12 (1994) 533-547 International Journal of Industrial Organization Bias in market R&D portfolios Luis Cabral Faculdade de Economia, Universidade Nova de Lisboa, Tr. Est&riio Pinto, 1000 Lisboa, Portugal Final version received April 1993 Abstract Based on a simple ‘contest’ model of product innovation, we find that, in accordance with conventional wisdom, and contrary to much of the previous theoretical literature, market competition implies an equilibrium level of risk which is too low from society’s standpoint. The intuition is that the divergence between private and social marginal benefits from R&D is greater the greater the probability of discovery by the rival firms; and this probability is higher for lower risk projects. Key words: R&D competition; Oligopoly JEL clussificar~on: L13; 031 1. Introduction Most of the economics literature on Research and Development (R&D) has focused on the total amount spent on R&D, regardless of its composition.’ However, the heading of ‘R&D expenditures’ comprises a variety of quite heterogeneous components: basic research, applied re- search, and development; process innovations and product innovations; improvements to existing products and discovery of new products; short- term and long-term projects. To quote from Mansfield (1981, p. 614): ‘Economists must recognize that, for many purposes, the composition of R&D expenditures may be as important as their total size’. I See, for example, the survey papers by Reinganum (1989) and Cohen and Levin (1989). 0167-7187194/$07.00 0 1994 Elsevier Science B.V. All rights reserved SSDZ 0167-7187(93)00434-P
Transcript of Bias in market R&D portfolios - New York University Stern...

ELSEVIER
International Journal of Industrial Organization 12 (1994) 533-547
International Journal of
Industrial Organization
Bias in market R&D portfolios
Luis Cabral
Faculdade de Economia, Universidade Nova de Lisboa, Tr. Est&riio Pinto, 1000 Lisboa, Portugal
Final version received April 1993
Abstract
Based on a simple ‘contest’ model of product innovation, we find that, in accordance with conventional wisdom, and contrary to much of the previous theoretical literature, market competition implies an equilibrium level of risk which is too low from society’s standpoint. The intuition is that the divergence between private and social marginal benefits from R&D is greater the greater the probability of discovery by the rival firms; and this probability is higher for lower risk projects.
Key words: R&D competition; Oligopoly
JEL clussificar~on: L13; 031
1. Introduction
Most of the economics literature on Research and Development (R&D) has focused on the total amount spent on R&D, regardless of its composition.’ However, the heading of ‘R&D expenditures’ comprises a variety of quite heterogeneous components: basic research, applied re- search, and development; process innovations and product innovations; improvements to existing products and discovery of new products; short- term and long-term projects. To quote from Mansfield (1981, p. 614): ‘Economists must recognize that, for many purposes, the composition of R&D expenditures may be as important as their total size’.
I See, for example, the survey papers by Reinganum (1989) and Cohen and Levin (1989).
0167-7187194/$07.00 0 1994 Elsevier Science B.V. All rights reserved SSDZ 0167-7187(93)00434-P
534 L. Cabral I Inl. J. Ind. Organ. 12 (1994) S333-547
As an exception to the main trend in the literature, a series of recent papers has looked at the issue of allocating R&D resources across projects with different degrees of risk. This includes Klette and deMeza (1986), Bhattacharya and Mookherjee (1986), and Dasgupta and Maskin (1982).’ In the models presented in these papers, firms are engaged in a ‘winner-takes- all’ patent race.’ A basic project consists of a mean probability distribution over discovery dates. A riskier project is one with higher probability of very early and very late discovery dates. The main conclusion is that the market is generally biased in favor of relatively more risky R&D projects. The idea is that the private marginal benefit of an increase in risk exceeds the social marginal benefit. From the firm’s point of view, expected payoff improves with an increase in risk because the expected date of the first discovery decreases and the probability of being the first to discover increases. However, from society’s point of view only the first component matters.
In many industries, however, competition is quite different from the ‘winner-takes-all’ game assumed in the papers cited above. A prominent example is that of the pharmaceutical industry. The process of getting a new drug into the market consists essentially of two stages: first, to discover and
to patent the new drug; and second, to get it approved for marketing by the regulatory agency (in the United States, the Food and Drug Administration, FDA). Given the relatively narrow scope of protection offered by drug patents and the approval system, it often happens that several companies holding different patents have to compete in the product market.4 The issue of timing is thus relatively secondary. In fact, it is not uncommon that a drug with a later patent is the first to be approved for marketing.
Accordingly, we consider a timeless model of product innovation (what Reinganum, 1989, calls a “contest” model) in which there can be more than one winner. The model is calibrated in such a way that under monopoly there is no bias in the private optimal portfolio. In this way. departures from the social optimum are wholly accounted for by the effects of competition.
‘There is also an empirical literature focusing on the composition of R&D expenditures.
Mansfield (1981) finds that larger firms seem to carry out a disproportionately larger share of
the basic research, but that the same is not true for risky R&D or R&D aimed at entirely new
products and processes. Link (1985) estimates that an aggressive strategy and the existence of a
centralized R&D lab have a positive effect on the share of basic and long-term research. Furthermore, he finds that producer goods industries tend to allocate relatively more funds to process innovations rather than product innovations. See also Link (1982) and Scott and Pascoe
(1987). ’ However, Dasgupta and Maskin (1987) also consider in their Section 111.2 the possibility of
market sharing. See Section 3 below. ’ For example, Genentech, Beecham. Wellcome and Hoechst all holds patents for anti-heart-
attack medicines. According to The Economist (15 October 19X8, p. 89). ‘Nobody really knows yet which drug does the job best’. The most likely outcome is that all firms will share the
market.
L. Cabral I Int. .I. Ind. Organ. 12 (1994) 533-S47 535
The bias under competition is shown to be a function of a parameter which describes competition in the product market. Different models of product market competition indicate that there is, in general, a bias against risky R&D projects, although the opposite bias is also possible. The intuition for this result consists of two steps: (i) part of the private marginal benefit from R&D investment corresponds to a transfer from rival firms, an externality which is normally associated with the excess of market R&D with respect to the social optimum; (ii) this externality is especially relevant in projects with a high probability of success, which, in equilibrium, are the less risky projects.
In a parallel research effort, Bagwell and Staiger (1990) also consider a (timeless) duopoly model in which firms choose risky investments which determine their cost or quality level and then compete on price. They show that a given firm’s profit is a convex function of its cost or quality level as well as its rival’s cost or quality level. In addition, they show that consumer surplus is also a convex function of the firms’ cost or quality level. As a result, there are two positive externalities to risk-increasing R&D invest- ment, which implies that the equilibrium level of risk is lower than the socially optimum level of risk.
Our model differs from Bagwell and Staiger’s in a number of ways. First, we consider a somewhat less drastic departure from the previous literature by assuming that firms must succeed in discovering a new product in order to compete in the product market (the departure being the possibility of more than one firm competing in the product market). By contrast, Bagwell and Staiger assume that R&D only determines the quality or cost level of an existing product and that profits are always positive. Second, our results are presented in terms of a simple necessary and sufficient condition which characterizes the nature of competition in the product market, a condition which may be easily checked against several possible models. Finally, our model is calibrated in a way that isolates the effects of competition on the bias with respect to risk in R&D.
2. The basic model
Since the main focus of this paper is on the composition of R&D portfolios, we will assume throughout that each firm has a fixed R&D budget, which we normalize to be equal to 1. We will consider each firm’s decision of allocating its R&D budget between two different product- innovation projects (in two different markets), and denote by x the amount allocated to the first project (1 - x is thus allocated to the second project). By investing x in the first project, a firm has a probability f(x) of discovering a new product in the first market. Its payoff, conditional on successful

536 L. Cabral I ht. J. Ind. Organ. 12 (1994) 533-547
innovation, depends on the number of innovations in the same market and is given by pk, where k is the number of firms with successful innovations in that market (k = 1, 2). The second project is a mean-preserving spread of the first one. The probability of successful innovation is given by f( 1 - x)/y and payoffs (conditional on successful innovation) are given by ypk, y > 1. Therefore, given the probability of success by the rival, the expected value of the two projects is equal. The model of R&D competition consists of two firms simultaneously choosing values x, to allocate to the first project (i = 1,
2). We are especially concerned with the impact of competition on the
equilibrium composition of R&D portfolios. Therefore, it is useful to make the assumption that there is a constant proportion between profits and social surplus across projects. Accordingly, we assume that social surplus is given by sk in the first market and ysys, in the second one.’ In fact, as we shall see, this implies that the monopoly and the social optimum values of x are equal, i.e. xM =x*. It would be easy to find reasons why the private optimum does not coincide with the social optimum value of x. For example, the first project might be research leading to an ‘orphan drug’, i.e. a drug for which the proportion between consumer’s and producer’s surplus is very large. Assuming a constant proportion between profits and social surplus implies that, when we consider competition between two different firms, any divergence between x* and the equilibrium value of x is attributable to distortions implied by R&D rivalry.
Although we make no explicit assumptions regarding the model which generates the values of pk and sk, our results will be given with reference to a parameter which relates the different values of pk and sk. Define
1+ P*lP, P= szls, .
Our main result is the following, where S denotes expected surplus (all proofs may be found in the appendix).
Proposition 1. At an interior symmetric equilibrium with both firms choosing x=i-, dSldx<O iffp>l.
In other words, Proposition 1 implies that, starting from any symmetric equilibrium solution and assuming that p > 1 (resp. p < l), a small increase
’ The following example satisfies this assumption. Let the demands for the first and second product innovations be given by P = 1 - Q and P = 1 - Q/y, respectively. Assume that the
oligopoly solution (Bertrand, Cournot, etc.) is the same in both markets. Then, profits and
social welfare differ between markets by a factor of y.

L. Cabral I ht. J. Ind. Organ. 12 (1994) 533-547 537
in x (a decrease in the riskiness of the portfolio) leads to a decrease (resp. increase) in social surplus. Therefore, if p > 1 (resp. p < l), then the market is biased against (resp. in favor of) the riskier R&D project.
The intuition for the result can be understood with reference to Fig. 1, which plots the private and the social marginal benefit from R&D invest- ment in a given project as a function of the rival’s probability of discovery in that project (f3). For simplicity, the figure is drawn under the assumption that y is close to 1 (otherwise, we would have to consider different marginal benefit functions for each project). In addition, the curves are consistent with the assumption that p > 1. Therefore, we will provide the intuition for the market solution to be biased against the riskier R&D project.
There are two things to notice in the figure. First, if the rival’s probability of discovery is high, then the private marginal benefit is greater than the social marginal benefit. This is the reason why the equilibrium rate of R&D would likely be greater than the social optimum rate (cf. Loury, 1979; Mankiw and Whinston: 1986). Second, and most important, the social marginal benefit falls to zero more rapidly than the private marginal benefit.
Now take two different projects with two different values of 0, 8, and 0,. Although the private marginal benefit exceeds the social marginal benefit in both cases, the distortion is greater for the project with a probability of success closer to 1 (c/d is greater than a/b). This in turn explains why the privately optimal R&D portfolio would put too much weight on the project with a greater probability of success (c/d > a/b implies c/a > d/b). Finally, it can be shown - indeed, it is an important step in the proof of Proposition
II’, S’
Fig. 1. Private (II ‘) and social (S’) marginal benefit from investing in R&D as rival’s probability of success.
6 e2 a function of the

538 L. Cabral I Int. J. Ind. Organ. 12 (1994) 533-547
1 -that the less risky project is the one with a greater probability of success, and thus that the privately optimal R&D portfolio puts too much weight on the less risky project.
2.1. Factors determining the value of p
As we mentioned before, our results require no specific assumptions regarding the model of market competition. Instead, the results are presented in terms of the value of p. We will now argue that the crucial condition p > 1 corresponds roughly to the idea that duopoly competition is relatively inefficient, either due to the absence price competition or because there is a lot of wasteful non-price competition. To do so, we consider several possible models of product market competition.
(a) To begin, consider the case when the products discovered by each firm are independent. In this case, we have p1 = p2 and s, = 2s,, which yields p = 1. As we would expect - given the way the model is calibrated - there is no bias in the equilibrium solution (because there really is no competition).
(b) Now suppose that the firms’ products are perfect substitutes and that the demand and the cost functions are linear. It can be shown that the collusive, the Cournot, and the Bertrand solutions imply p = 1.5, p = 39132, and p = 0.75, respectively.
(c) A stylized model of the new drug approval process in the United States is that when two drugs with the same therapeutic use apply for FDA approval, only one of them is approved in a ‘reasonable’ length of time.’ In the case of an extremely ‘strong’ approval regime, only one of the two drugs is approved, each with probability 50%. The value of p is then 1.5. In fact, s, = sz and p, = 2p,.
More generally, the same value of p applies when (i) the novelty requirement is strong (cf. Scotchmer and Green, 1990) or the breadth of patent protection is wide (Klemperer, 1990; Gilbert and Shapiro, 1990), such that one product only is chosen; and (ii) the process by which a particular product gets chosen involves some degree of ex-ante uncertainty.’
(d) Finally, we should consider the possibility of some kind of non-price competition when evaluating the values of pk and sk. Many authors argue that much of the advertising and promotion budget in pharmaceutical firms
‘For example, Wellcome’s AZT, and AIDS drug, was approved in a record four months
after submission. However, other applications for similar drugs were not given the same
priority (cf. The Economist, 30 January 1988).
’ Instead of FDA approval, the source of uncertainty may be patent litigation. Examples include the dispute between the Sankyo and Merck regarding an anticholesterol drug. and that
between Genentech and Wellcome regarding the artificial production of t-PA.

L. Cabral I ht. J. Ind. Organ. 12 (1994) 533-547 539
Table 1
Values of p under different models of product market competition (in all cases, demand and
cost functions are assumed to be linear)
Assumption P
Independent products
Homogeneous product Collusion
Cournot
Bertrand
‘Strong’ approval system
Rent-seeking
1.00
1.50
1.22
0.75
1.50
3.00
takes the form of rent-seeking activities.* In the extreme case when monopoly profits are competed away by means of (socially wasteful) rent- seeking activities, we get, for linear demand and cost functions, a value of p equal to 3. In fact, we would have pz = 0 and s2 = s,/3 (note that S, is consumer surplus under monopoly plus monopoly profits; s2 is consumer surplus only, since profits are competed away by wasteful rent-seeking).
The different possible values of p (listed in Table 1) illustrate the idea that the condition p > 1 corresponds to the assumption that duopoly competition is relatively inefficient, either due to the absence of price competition or because there is a lot of wasteful non-price competition. When this is the case, that is, when the value of p is very high, the distance between private and social benefits, depicted in Fig. 1, is very large; and so is the bias in the market R&D portfolio.
3. Extensions
In this section we consider three possible one allowing for different types of equilibria structure of the model itself.
3.1. Asymmetric equilibria
extensions of the basic model, and two others that change the
The first extension considers the possibility of asymmetric equilibrium solutions. Let X and x (X)x) be the equilibrium values of x. -
’ According to The Economist (27 January 1990, p. 75), Glaxo’s Zantac, an anti-ulcer drug,
‘was only a slight improvement on Tagamet, an earlier hit drug from Smith-Kline Beckman’.
However, by means of an expensive advertising campaign, sales of Zantac reached $2.4 billion
in 1989, while Tagamet’s sales were only $1 billion.

540 L. Cabral I Int. J. Ind. Organ. 12 (1994) 533-S47
Proposition 2. At an interior equilibrium (X, g), kSl?& < 0 iff p > 1.
In other words, the firm that invests more in the risky project invests too little in that project, from a social point of view. No similar general statement can be made about the rival firm, however.
3.2. Product improvements
The second extension we consider consists of changing the structure of the model itself. So far, we have assumed the two projects available to each firm to be independent.(apart from the fact they draw from a common budget). However, it is often the case that firms have to choose among alternative projects leading to similar ends. For example, having the pharmaceutical industry in mind, Grabowski and Vernon (1987) consider two qualitatively different types of R&D, ‘pioneering’ and ‘imitative’ R&D. In terms of our model, we may consider the low- and the high-risk projects as projects leading to small and to large product improvements, respectively (or ‘development’ and ‘research’ projects, respectively). Formally, the change to be introduced consists of the assumption that if some large improvement is achieved, then the payoff to any small improvement is zero (regardless of the firm who obtained such improvement). The following result extends Proposition 1.
Proposition 3. Consider the modified basic model presented above. If y is sufficiently large, then, at an interior symmetric equilibrium with both firms choosing x = i, &!?lax < 0 iff p > 1.
A similar result, although one based on a very different model, was obtained by Aghion and Howitt (1992, p. 323), who argue that ‘business stealing . . . makes [vertical] innovations too small [from a social welfare point of view]‘.
3.3. Correlated probabilities of success
As we saw in the preceding section, the intuition for Proposition 1 is that there is a bias in the direction of the project for which the rival has a higher probability of discovery. This suggests that the result may actually have a wider applicability than the bias against risk in R&D portfolios. In particular, a similar result should apply with regards to the bias in the direction of more correlated R&D projects.”
Consider the following simple extension. Both projects have the same
‘) I am grateful to a referee for pointing this out.

L. Cabral I ht. J. Ind. Organ. 12 (1994) 533-547 541
unconditional probability of success and y = 1. However, success in the first project is positively correlated across firms, whereas success in the second project is, as before, independent across firms. Specifically, suppose that the first project can either be a ‘good’ one or a ‘bad’ one. In the first case, the probability of success is given by f(x)(l + c$), whereas in the second the probability is given by f(x)(l - c$), C$ > 0.” Assuming that a project is equally good or bad for both firms, and that firms do not know ex ante which is the case, we have the desired positive correlation of probabilities of success. We also assume that the probability the project is good or bad is equal, so that the unconditional probability of success is given by f(x)(l + ~$)/2 +f(nc)(l + $)/2 =f(x). We then have the following result.
Proposition 4. Consider the modified basic model presented above. At an interior symmetric equilibrium with both Jirms choosing x = i’, &Ylax < 0 iff p > 1.
In other words, firms invest too much, from a social point of view, in the project that is positively correlated. (In fact, Z is less that l/2; that is, firms invest less in the project with positive correlation, but not to the extent that it would be optimal from a social point of view.)
Dasgupta and Maskin (1987, Section 111.2) consider the case of two-point distributions (success, no success) and show that there is too much correla- tion in equilibrium.” Their assumptions about pi and s, are that p2 >pl and s2 = si. This implies that p > 1, so their Proposition 3 is consistent with our Proposition 4.
4. Final remarks
The results in this paper suggest, contrary to most of the previous
theoretical literature and in accordance with conventional wisdom, that competition may induce a bias against risk-taking in R&D. Policy measures which favor long-term, relatively more risky R&D projects, may therefore have a role to play.
In fact, going back to the case of the pharmaceutical industry, one may argue that this was precisely one of the (few) merits of the 1962 US drug amendments. In substance, the 1962 Kefauver Act requires proof of
“’ In order for probabilities to be well defined, we assume that f( l)( 1 + 4) < 1.
” They also observe that this result is consistent with the high frequency of ‘multiples’. that
is, simultaneous scientific advances made by several individuals and research teams working independently of one another. See Merton (1973, Ch. 16-17).

542 L. Cabral I ht. J. Ind. Organ. 12 (1994) 533-547
improved efficacy in addition to testing for toxicity; that is, increased stringency and delay times for FDA approval of new drugs. The facts are that, since 1962, there has been a drastic decrease in the number of New Chemical entities (NCEs) introduced in the U.S. market despite the fact that real R&D expenditures have steadily increased in the same period.” Some authors claim that although the total number of new drugs has decreased since 1962, the number of new drugs providing significant improvements in efficacy has not decreased. To quote from Simmons (1974, p. 102): ‘the major change that has occurred . . . is that the percentage of significant drugs approved has increased . . . while the number of “me-too” drugs, i.e. drugs similar to and with no advantage over those already available, has declined’.’ ’ This is consistent with, although it does not imply, the interpretation that the 1962 amendments have improved the allocation of resources between ‘large improvement’ and ‘small improvement’ projects. In fact, one can show, based on Proposition 3, that by raising a uniform tax on all projects the equilibrium value of x decreases towards a socially better level, assuming that p > 1.”
Another point which comes out of the analysis in this paper is that policies which affect the product market also have an effect on the choice of R&D portfolios (through changes in the value of p). Specifically, policies which make product market competition ‘tougher’ have the effect of lowering the bias against risky projects (assuming that we start from a value of p greater than 1). In fact, this may help to explain the differences between the United States, Japan and Europe in terms of the typical research portfolios that one finds in each part of the world.‘” The conventional wisdom is that (a) Japanese firms tend to invest relatively more in development than their European and American counterparts; ” (ii) antitrust policy is generally more lenient in Japan than it is in Europe and in the United States (Hadley, 1970). Assuming that ‘tougher’ anti-trust policies imply lower values of p, as
” See, for example, Fig. 1 in Thomas (1990).
rZThis is by no means the only or the main interpretation. See Peltzman (1973) and Baily (1983) for the most popular views.
“Obviously, this is not to say that raising a uniform tax is the best policy. In fact, the
informal ‘improvement rule’ currently used by the FDA is an example of how something better
can be done. According to this rule, new drugs which are seen to imply greater improvements
with respect to existing therapy tend to be approved in shorter periods of time. The FDA currently classifies drugs in four categories, AA, A. B and C. by decreasing order of
importance. In the period 1985-88, the average approval lags were 12, 25, 29 and 36 months,
respectively (personal communication from John Wolleben. Pfizer Pharmaceuticals). See also
Dranove and Meltzer (1992). ” I am grateful to Miguel Villas-Boas for suggesting this interpretation.
““‘Japanese engineers easily flow to superficial applications’, said Dazuyuki Aihara. an associate professor of electronic engineering at Tokyo Denki University” (New York Times, 27 January 1993).
L. Cabral I ht. J. Ind. Organ. 12 (1994) 533-547 543
the analysis above suggests, then the observed differences between Japan and the United States (and Europe, to some extent) seem consistent with the effects underlying Proposition 1.
There are several possible extensions of the model presented in this paper besides the ones developed in Section 3. These include the case of an n-firm oligopoly; R&D portfolios comprising more than two projects; projects with a continuum of outcomes (as opposed to success/no success). We believe, however, that the basic intuitions would extend to these cases as well.
Appendix
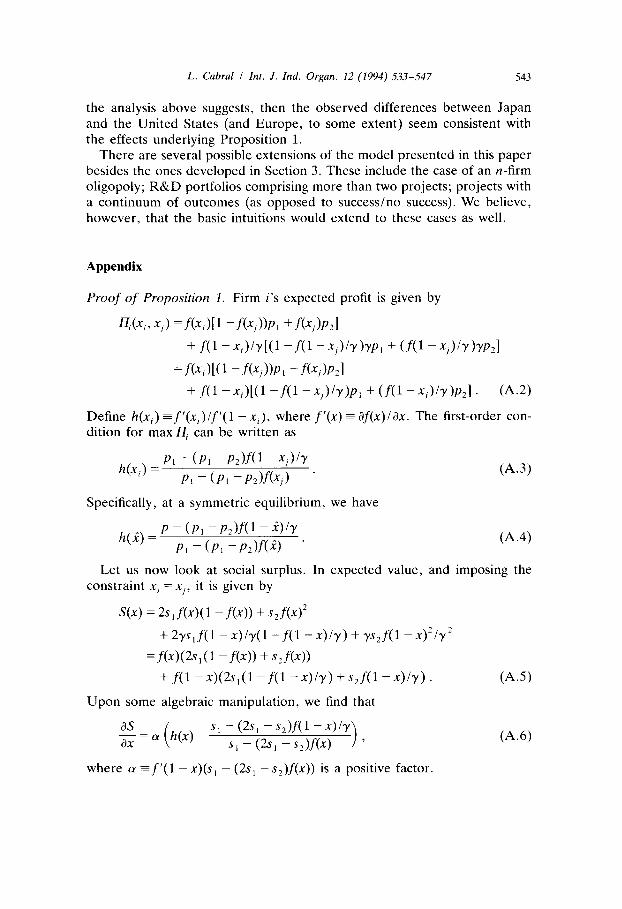
Proof of Proposition 1. Firm i’s expected profit is given by
R;(xi7 xj> =f(‘i)[l -f(‘j))PI +f(xj)P21
+ f(l - x;)lr[(l -f(l - x,)b)YPI + (f(l -x,>wYP,l
=f(x,)[(l -f(‘j))PI -f(xj)P*l
+ f(l -x;)[(l -f(l -x,)lY)P1 + (f(l -xj)‘Y)P21 ’ 64.2)
Define h(x;) = f ‘(x, ) lf ‘( 1 - x,), where f’(x) = 8f(x) / dx. The first-order con- dition for max ni can be written as
h(x_) = PI - (PI -PZ)f(l -‘j)/Y 1
Pl - (PI -P2)f(‘j)
Specifically, at a symmetric equilibrium, we have
h(i) = P - (PI - P,)f(l - -;)b
PI - (PI -P,)f(i)
(A.3)
(A.4)
Let us now look at social surplus. In expected value, and imposing the constraint x, = xj, it is given by
S(x) = h,f(x)(l -f(x)) + szf(x)’
+2ys,f(1-x)/y(1-f(1-x)/y)+ys,f(1-x)*/y2
=f(x)&,(l -f(x)) + s*f(x))
+ f(l-x)(2s,(l-f(l-x)/y)+s,f(l-x)/y).
Upon some algebraic manipulation, we find that
%=a h(x)- ( s1 - (2s, - s*)f(l -x)/y Sl - (2, -s*)f(x) ’
where (Y -f’(l -x)(s, - (2s, - s2)f(x)) is a positive factor.
(A.5)
(A@

544 L. Cabral I Int. J. Ind. Organ. 12 (1994) 533-547
Therefore, &S/&K < 0 if and only if the term inside parentheses in (A.6) is negative. At the symmetric equilibrium level of X, h(x) is given by (A.4). Therefore. the condition for aSlax < 0 at x = i becomes
Pl - (P, -P*lf(l - 4/Y Sl - (2, - sz)f(l - -9/Y PI - (PI -P*)f(4 < Sl - (2, -h>f(4 ’ (A.7)
which can be simplified to yield
[f(i) -f(l - 4blb,Ps, -s2> -sI(PI -P2)1>0. (A.81 Now, from (A.2) we can conclude that, in equilibrium, f(i) >f’(l - 2)/y;
that is, the probability of discovery is bigger in the low-risk project. In fact, if that were not the case, then firm i could increase its profits by choosing xi = 1 - x,. Therefore, the condition for &S/&t < 0 at x = E becomes
P1(2S, -sz)-s,(P, -P*)>O. (A.9)
which can be shown to be equivalent to p > 1. 0
Proof of Proposition 2. The proof proceeds in a way very similar to that of Proposition 1. From the low x firm’s first-order condition, we get
h(x) = PI - (PI - P,)f(l -x)/Y _
PI - (PI - P2)f(X) (A.lO)
Writing social surplus as a function of x, X, taking the derivative with respect to the first argument, and simplifying, yields
$=a h(g) - i
s, - (2s, - Sz)f(l -x)/r
Sl - @I -%)f(X) 1 ’ _ (A.ll)
where CY -f’(l -x)(si - (2s, - s*)f(X)) is a positive factor. The proof now proceeds in the same way as that of Proposition 1. Notice
that the argument for f(i) > f(1 - i)ly can be extended to x_ in the case of an asymmetric solution, but not to X-hence Proposition 2 only applies to x. 0
Proof of Proposition 3. Firm i’s expected profit is given by
~~(x;,x,)=(l-f(l-x,)‘Y)(l-f(l-xj)iY)
’ f(x,)[(l -f(x,))P1 +f(xj)P?l
+ f(l -x,)iY[(l -f(’ -x,)iY)YPI + (f(’ -xj)‘Y)YPZl 3
= (1 -f(l -x,)b)(l -f(l -x#r)
’ f(x,)[(l -f(xj))P1 +f(x,)P21

L. Cabral I Int. J. Ind. Organ. 12 (1994) 533-547 545
+ f(l -x,)[(l -f(l - x,Vrh +.f(1 -qh+2 . (A. 12)
Solving the first-order conditions and imposing the symmetry condition xi = xi = i’, one gets
Pl - (PI -Pzlf(l - -;>lr h(i-) = (1 -f(l - 4W2[P, - (P, -P,>f(-;)l
(1 -f(l - 4bIf(%%(Pl -P,V(l - 41/r _
(1 -f(l- W>‘h -(P, -PJf(41 (A.13)
Social welfare is given by
w = (1 -f(l -w92Pkf(4(1 -f(x)> + ~2f(4*1
+2ys,f(l-X)/y(l-f(l-X)ly)+ys,f(l-X)21y’
=f(x)(2s,(l -f(x)) + s2f(x))
x f(l -X)[2S,(l -f(l -x)Iy) +s,f(l -X)/r].
After some algebraic manipulation, we find that
(A.1 )
h(x) - s, - (2s, - s2)f(l - 2.)/y
(1 -f(l - WY)*]S, - (2, -s2>f(41
+ (1 -“f-(1 - 4lr>f(4b, - (2s, - s*l.f(l - -;>lb
(1 -f(l - 4W2h - (a, -s2lf(41 ’ (A. 15)
where (Y -f’(l -x)(1 -f(l - i)lr)*[~, - (2s, -s2)f(.?)] is a positive factor. For high values of y, (A.15) is approximately equivalent to (A.6), and the
proof proceeds in a way similar to that of Proposition 1. Cl
Proof of Proposition 4. Computation establishes that, at a symmetric equilibrium, we have
h(i) = PI - (PI -P*lf(l - 4
PI - (PI -P*lf(4(1+ 4’) ’ (A. 16)
whereas the derivative of social welfare with respect to x is given by
$1 -(b, -s*lf(l -x>
31 - (2, -s2V(x)(l- 4’) ’ (A.17)
where (Y -f’(l - x)(sl - (2s, - s2)f(x)) is a positive factor. The proof now proceeds in a way similar to that of Proposition 1. 0

546 L. Cabral I ht. J. Ind. Organ. 12 (1994) 533-547
Acknowledgments
Research on this paper was started and completed during two visits to the Center for Economic Policy Research, Stanford University. Financial support was provided by a grant from Pfizer Pharmaceuticals to CEPR. I am grateful to both institutions for their support. I am also grateful to Lanny Arvan, Manfredi LaManna, Ching-to Albert Ma, Carmen Matutes, Mike Riordan, Pankaj Tandon, seminar participants at the University of Illinois (Urbana-Champaign) and Boston University, and especially to Miguel Villas-Boas and two referees for useful comments and suggestions. The usual disclaimers apply.
References
Aghion, Phillipe and Peter Howitt. 1992, A model of growth through creative destruction,
Econometrica 60, 323-351.
Bagwell, Kyle and Robert W. Staiger, 1990. Risky R&D in ohgopolistic product markets,
Discussion paper no. 872, CMSEMS, Northwestern University, January.
Baily, Martin, 1983, Research and development costs and returns: The U.S. pharmaceutical
industry, Managerial and Decision Economics 4, 107-121.
Bhattacharya, Sudipto and Dilip Mookherjee, 1986, Portfolio choice in research and develop-
ment, Rand Journal of Economics 17, 594-605.
Cohen, Wesley M. and Richard C. Levin, 1989, Empirical studies in innovation and market
structure. in: R. Schmalensee and R.D. Willig, eds., Handbook of industrial organization
(North-Holland, Amsterdam) 1059-1107.
Dasgupta. Partha and Eric Maskin, 1987, The simple economics of research portfolios,
Economic Journal 97, 581-595.
Dranove, David and David Meltzer, 1992, Do important drugs reach the market sooner?.
mimeo.. Northwestern University and University of Chicago, June.
Gilbert, Richard and Carl Shapiro, 1990, Optimal patent length and breadth, Rand Journal of
Economics 21, 106-112.
Grabowski, Henry and John Vernon, 1987, Pioneers, imitators, and generics, A simulation
model of Schumpeterian competition, Quarterly Journal of Economics 102, 491-525.
Hadley, Eleanor, 1970, Antitrust in Japan (Princeton University Press, Princeton).
Klemperer, Paul, 1990, How broad should the scope of patent protection be?. Rand Journal of
Economics 21, 113-130.
Klette, Tor and David deMeza, 1986, Is the market biased against risky R&D?. Rand Journal
of Economics 17, 133-139.
Link, Albert N., 1982, An analysis of the composition of R&D spending, Southern Economic
Journal 49, 342-349. Link, Albert N.. 1985. The changing composition of R&D. Managerial and Decision
Economics 6, 1255128. Loury, Glemm C., 1979, Market structure and innovation, Quarterly Journal of Economics, 93,
395-410. Mankiw, N. Gregory and Michael D. Whinston, lY86, Free entry and social inefficiency, Rand
Journal of Economics 17, 48-58.
L. Cabral i Int. J. Ind. Organ. 12 (1994) 5335.547 547
Mansfield, Edwin, 1981, Composition of R&D expenditures: Relationship to size of firm,
concentration, and innovative output, Review of Economics and Statistics 63, 610-614.
Merton, Robert K., 1973, in: N. Stover, ed., The sociology of science: Theoretical and
empirical investigations (University of Chicago Press, Chicago) Chapters 16-17.
Peltzman. Sam, 1973, An evaluation of consumer protection legislation: The 1962 drug
amendments, Journal of Political Economy 81, 1049-1091. Reinganum, Jennifer F., 1989, The timing of innovation: Research, development, and
diffusion, in: R. Schmalensee and R.D. Wilhg, eds., Handbook of industrial organization
(North-Holland, Amsterdam) 849-908.
Scotchmer, Suzanne and Jerry Green, 1990, Novelty and disclosure in patent law, Rand Journal
of Economics 21, 131-146.
Scott, John T. and George Pascoe, 1987, Purposive diversification of R&D in manufacturing,
Journal of Industrial Economics 36, 193-205.
Simmons, Henry E., 1974. The drug regulatory system of the United States food and drug
administration: A defense of current requirements for safety and efficacy, International
Journal of Health Services 4, 95-107. Thomas, Lacy Glenn. 1990, Regulation and firm size: FDA impacts on innovation, Rand
Journal of Economics 21, 497-517.