Bias Due to Sampling Groundwater and Surface Water for...
30
BIAS DUE TO SAMPLING GROUNDWATER AND SURFACE WATER FOR TRACE ORGANIC CONTAMINANTS MOE Research Project # 449G
Transcript of Bias Due to Sampling Groundwater and Surface Water for...

BIAS DUE TO SAMPLING
GROUNDWATER
AND SURFACE WATER
FOR TRACE ORGANIC
CONTAMINANTS
MOE Research Project # 449G


ISBN 0-7729-9346-7
BIAS DUE TO SAMPLING GROUNDWATER
AND SURFACE WATER
FOR TRACE ORGANIC CONTAMINANTS
MOE Research Project # 449G
Report prepared for:
Water Resources Branch
Ontario Ministry of the Environment
Report prepared by:
Waterloo Centre For Groundwater Research
University of Waterloo
MARCH 1992
Cette publication technique nest disponible qu'en anglais. Copyright: Queen's
printer for Ontario, 1992
This publication may be reproduced for non-commercial purposes with
appropriate attribution.
PIBS 1855


BIAS DUE TO SAMPLING GROUNDWATER
AND SURFACE WATER
FOR TRACE ORGANIC CONTAMINANTS
Final Report
MOE Research Project 449G
Report Prepared By:
J.T. Hoff, C. Arthur, D. Baerg
J.F. Barker and R.W. Gillham
Waterloo Centre For Groundwater Research
University of Waterloo
Waterloo, Ontario N2L 3G1


ACKNOWLEDGEMENT AND DISCLAIMER
This report was prepared for the Ontario Ministry of the Environment as part of a Ministry
funded project. The views and ideas expressed in this report are those of the author and
do not necessarily reflect the views and policies of the Ministry of the Environment, nor
does mention of trade names or commercial products constitute endorsement or
recommendation for use. The Ministry, however, encourages the distribution of
information and strongly supports technology transfer and diffusion.
Any person who wishes to republish part or all of this report should apply for permission
to do so to the Research and Technology Branch, Ontario Ministry of the Environment,
135 St. Clair Avenue West, Toronto, Ontario, M4V 1P5, Canada.


PART 1. LOSSES DUE TO VOLATILIZATION
INTRODUCTION
Contamination of surface and groundwater by synthetic organic compounds is a majorenvironmental concern in Ontario and most industrialized areas. In sampling natural waters fororganic contaminants, two main sources of negative bias are recognized, loss of volatilecompounds by partitioning into the atmosphere and loss of hydrophobic compounds by sorptiononto synthetic polymers used in the construction of wells and samplers. Considerable researchhas been conducted at the Waterloo Centre for Groundwater Research and by numerous otherresearch groups into the magnitude and the means to minimize these biases.
It is generally recognized that compounds with Henry's law constants greater than 0.001(atm/mol) have the potential to be volatilized if the solution is exposed to the atmosphere duringsampling and analysis. Most common organic groundwater contaminants fall into this category,and evaluating the potential for volatilization loss has been the object of several groundwatersampling studies. Barker and coworkers [1,2] evaluated the potential for volatilization andsorption losses when using multilevel piezometers and several other sampling devices. Ho [3]studied the effects of transport line material, pumping rate and sample lift height on therecovery of volatile organics in water with a peristaltic pump. Barcelona et al [4] tested a largenumber of samplers in an attempt to evaluate the effectiveness of various samplingmechanisms. Pearsall and Eckhardt [5] evaluated several common samplers and the effects ofvariations in sampling procedures and details of set-up. These studies have demonstrated that:1) the potential for significant negative biases exists with common sampling devices, 2) thebiases appear to be caused by volatilization (and by sorption in some cases), and 3) someconsistency among studies has been found in the relative effectiveness of various samplers andsampling mechanisms.
Recently, particular emphasis has been placed on the problem of sampling gas-chargedgroundwater such as can be encountered in landfill leachate plumes and natural gas associatedformations, for example. Pankow [6] provided a theoretical basis for estimating the artifacts dueto bubble formation during sampling. Barker and Dickhout [2] tested the effectiveness of apositive displacement pump, an inertial lift pump and a peristaltic pump in sampling gas-chargedwater for volatile organics. Their finding that the peristaltic pump induced the greatest negativebias qualitatively agrees with theory; however, a consistent correlation between relative loss andHenry's constant was not observed, although only a narrow range of volatilities wererepresented by the compounds used.
It is evident that further research is required to realize the goal of quantitative estimationof sampling bias due to volatilization. The present study incorporates several improvements indesign over the previous study by Barker and Dickhout [2]. Larger Henry's constant values arerepresented by the organic contaminants, and methane was included. Dissolved carbon dioxide
2

concentrations were measured in order to establish a link with theory. In addition, theexperimental well was constructed of stainless steel instead of PVC, eliminating the possibilitysorption losses in the well; the well contained a sampling port at the bottom for obtainingrepresentative control samples. Finally, six samplers were evaluated at two concentration levels,making this a more comprehensive study.
METHODS
An artificial well was installed in a stairway at the Waterloo Centre for GroundwaterResearch. The well essentially consisted of a 6 " diameter stainless steel pipe, 32' in height witha sampling port located near the bottom. The well was filled and drained at the bottom with anair-driven pump connected to a stainless steel reservoir. Gas-laden artificial groundwater,approximating that in an aquifer contaminated by low-level organics, was made as follows. A90 litre volume of tap water containing 3.4 g/L sodium bicarbonate was prepared in the reservoirand its pH was adjusted to 9.0 with 1 N NaOH. The water in the reservoir was spiked with: 1)a saturated solution of methane in water, and 2) a methanolic stock solution containing benzene(366.5 mg/L), toluene (723.3 mg/L), trichloroethene (610.7 mg/L), trans-1,2-dichloroethene(262.l mg/L), and 1,1-dichloroethene (254.0 mg/L). The spiking volumes that were used in theexperiments are given below.
Experiment Conc. LevelVolume (mL)
Methanolic Stock Methane Water1-2 high 9.00 40001-1 low 0.45 4152-2 high 9.00 40002-1 low 0.45 4153-2 high 9.00 40003-1 low 0.90 10004 high 9.00 4000
After stirring, the solution in the reservoir was pumped through a port in the bottom ofthe well along with 2 L of a 10 % HCl solution, thus converting the bicarbonate ions to carbondioxide. Since the bicarbonate and HCl solutions were proportionally mixed as they entered thebottom of the well, some of the carbon dioxide was liberated, but most was kept in solution byhydrostatic pressure in the well.
The following sampling systems were evaluated: a double check-valve stainless steelbailer (BAIL), a peristaltic pump (PER), a WaTerra inertial pump (WAT), an IEA syringe sampler(SYR), a Well Wizard bladder pump (WIZ), and a Solinst double-valve purge/sample pump(SOL). In each experiment, the high capacity foot-valve WaTerra (model D-32) and one or twoother samplers were tested, and the water was sampled using the control port at the bottom ofthe well. In experiment 4, the high capacity WaTerra was compared with the smaller WaTerra
3

(model D-16). Approximately the same well depth was sampled by all of the samplers. Fivereplicate samples were taken with each sampler and from the control port. Upon collecting asample, two 60 mL hypovials were immediately filled to overflowing and capped withteflon-faced septa. The hypovials were stored underwater at approximately 4 C and the contentswere analyzed within five days. The organic contaminants (benzene, toluene, TCE, 1,2-DCE,1,1-DCE) were determined using one of the hypovials from each pair, and the other was usedfor determining the methane and carbon dioxide concentrations. The organic contaminants weredetermined in the headspace created in the hypovials when 15 mL of sample was replaced withan equal volume of laboratory air. After equilibration, the headspace was injected directly intoa gas chromatograph fitted with a photoionization detector. Methane and carbon dioxide werealso determined by static headspace gas chromatography with FID and TCD detectors. Therelative standard deviations for five replicate determinations of the gases and the organiccontaminants ranged from 4 to 8 %.
RESULTS
The data are summarized by experiment in Table 1, which gives the averageconcentrations for each group of five replicate samples. Percentage losses were calculated fromthe data of Table 1 by the formula
Loss (i,j,k) = - 100 x (Sampler (i,j,k) - Control (i,j)) / Control (i,j)
Sampler (i,j,k) is the mean concentration for compound i, concentration level j, andsampler k. Similarly, Control (i,j) is the mean concentration for the appropriate control sample.The percentage losses have been analyzed by the box plot technique [7]. In making statisticalcomparisons, a significance level of 0.05 was used throughout. Figure 1 depicts the percentagelosses obtained by one-way classification according to compound, sampler and concentrationlevel. Significantly positive biases are notably absent in all three categories. The difference inbias between the high and the low concentration levels is barely significant, with the highconcentration bias being about 6% more negative than the low concentration bias. Thepercentage loss incurred at the low level is not significantly different from zero. The percentageof compound lost by volatilization should not be affected by the concentration of the compound[6].
Considering next the box plots for the organic compounds, methane shows the greatestmedian loss, and this is significantly greater than the medians for the other compounds.Methane also shows a significantly greater variance. The methane losses are significantlycorrelated with the CO2 losses (Figure 2), which suggests that volatilization is responsible for themethane losses. The other compounds are not significantly correlated with CO2, and this isconsistent with the fact the Henry's constant for methane is larger than those for the othercompounds. The Henry's constants (atm m3 / mol) for the compounds are [6]: methane, 0.676;
4

1,1-dichloroethene, 0.19; t-1,2-dichloroethene, 0.067; trichloroethene, 0.0091; toluene,0.0067; benzene, 0.0055. The order of increasing loss among the compounds approximatelyparallels the order of increasing Henry's constant. Most of the variability among compounds isdue to the contrast between methane and the other compounds. The 95% confidence intervals(indicated by parentheses in the box plots) for the other compounds overlap extensively; forthree of the compounds, the median biases are not significantly different from zero.
The variability associated with sampler bias, expressed as the standard deviation of themedians, is 4.3%. This is comparable to the analytical variability for replicate analyses of thesame sample. The sampling losses increase in the order: BAIL, SOL, WIZ, SYR, PER, WAT. The95% confidence intervals overlap extensively, so the order is not well-defined. The losses forthe SYR, PER and WAT samplers are significantly different from zero, while those for the BAIL,SOL and WIZ samplers are not significantly different from zero or from each other. The lossesfor the large and small WAT samplers are indistinguishable from each other and are significantlygreater than those for the BAIL, SOL, WIZ, and SYR samplers.
5

Table 1. Mean concentrations (N-5) for each experiment. Concentrations are given in 104
g/L except for CO2 which is given in g/L.
Expt. SamplerCompound
BEN TOL TCE 1,2-DCE 1,1-DCE METH CO2
1-2 CONT 16.8 33.6 26.5 10.8 10.4 408 1.24WAT 16.3 31.2 24.0 10.0 9.6 260 0.96BAIL 16.0 31.8 25.2 10.5 10.5 292 1.10PER 15.8 29.6 23.1 10.1 9.1 153 1.05
1-2 CONT 0.93 1.84 1.39 0.48 0.35 36.5 1.11WAT 0.91 2.10 1.42 0.47 0.32 14.6 0.97BAIL 0.91 2.14 1.50 0.52 0.42 33.6 0.81PER 0.91 1.58 1.42 0.45 0.34 8.6 1.01
2-2 CONT 21.7 42.6 35.3 14.4 13.3 232 1.24WAT 19.1 35.3 27.0 11.5 8.8 152 1.06WIZ 21.1 39.9 33.1 13.6 11.7 215 1.30
2-1 CONT 1.1 2.13 1.95 0.63 0.45 32.5 1.43WAT 0.99 1.98 1.60 0.56 0.37 16.0 1.13WIZ 1.1 1.83 1.95 0.55 0.35 31.3 1.35
3-2 CONT 19.4 39.4 29.1 13.6 12.4 426 1.97WAT 18.7 33.5 24.6 10.8 9.6 198 1.51SOL 20.3 36.6 29.7 12.1 11.2 347 1.90
3-1 CONT 2.13 3.60 3.19 1.09 0.76 95.0 1.94WAT 2.14 3.96 2.97 1.11 0.82 38.9 1.19SOL 2.11 3.99 3.07 1.04 0.72 64.3 1.66SYR 2.0 3.2 3.0 0.92 0.46 86.8 1.96
4 CONT 21.3 38.7 36.3 13.1 11.0 382 1.96LG.WAT 20.5 30.2 27.4 10.6 8.85 247 1.59SM.WAT 22.7 32.5 30.2 12.0 9.54 248 1.76SYR 20.4 36.1 33.9 12.7 10.1 338 1.82
6

Figure 1. Box plots of percentage loss (N = 108).
7

Figure 2. Scatterplot of percentage loss, methane versus carbon dioxide.
The box plots provide a robust (nonparametric) one-way analysis of variance. A two-wayanova is more powerful, because the error mean square is reduced by taking into account thevariance due to the other factor, but the experimental data violate the homogeneity of varianceassumption. As mentioned previously, methane shows a larger variance. The simpler methodof analysis (box plots) was used, because it is less prone to type II error (concluding that asignificant difference exists when it does not). The methane data appear as outliers in the boxplots for the samplers, thus exerting little influence on the medians and on the 95 % confidenceintervals. This was verified by comparing the box plots in Figure 1 with those obtained when themethane data was deleted. The sampler losses depicted in Figure 1 are therefore representativefor compounds having Henry's law constants smaller than 0.2 atm m3/ mol.
The losses for methane indicate a somewhat different sequence for the samplers fromthat indicated by the other compounds. In order of increasing methane loss, the samplersequence is SOL, SYR, BAIL, WIZ, WAT, PER. However, a one-way analysis of variance indicatesthat the sampler means are indistinguishable. Because the degrees of freedom for the test issmall, it is not possible to discriminate small differences between sampler means for individualcompounds. More replication would be necessary to test hypotheses concerning the relativeeffectiveness of the sampling devices for particular compounds. This provides some justificationfor pooling the compounds in the test for sampler effects, and further justification is providedby the fact that biases are not significantly correlated among the compounds, i.e. theassumption of independent errors is not violated.
8
The percentage losses computed from the data of Table 1 were also used to estimate therandom variability associated with sampling. The sampling variability, expressed as a standarddeviation, was computed for each compound by taking the square root of the mean square errorof a one-way analysis of variance for sampler effects. The high and low concentration data werepooled, yielding 12 degrees of freedom for the estimate. The variabilities for benzene andmethane are 4% and 33%, respectively, and the middle compounds fall into the range of 11 to17%. The sampling variabilities tend to increase as the Henry's law constants increase. Becauseeach datum is the mean of five replicate samples taken with a given sampler in a single day'sexperiment, the variability for single samples is greater. Assuming that the variability forsamples taken on a single day is the same as that for samples taken on different days, thesampling variability for single samples is estimated to be in the range of 20 to 40% for themiddle compounds. Therefore, the systematic variability associated with the samplers (4.3%)is small relative to the random variability associated with taking replicate samples with a givensampler. It is also worth noting that the sampling device may introduce less bias than thelaboratory performing the analysis. This is demonstrated by the results of a recent inter-laboratory comparison for the analysis of low molecular weight aromatic compounds, e.g.benzene, toluene, etc. (R. Dickhout, unpublished data). A relative standard deviation of 28%was obtained for the 10 participating commercial laboratories, and this is considerably largerthan the 4.3% RSD obtained for the seven sampler medians.
DISCUSSION
The question of whether or not volatilization is the mechanism responsible for theobserved losses of organic compounds can now be discussed. The fact that methane showed thegreatest percentage losses is consistent with the relative magnitudes of the Henry's constants.Most of the variation in the biases for the compounds and in the Henry's constants is due to thecontrast between methane and the other compounds. The fact that the methane losses aresignificantly correlated with the CO2 losses (Table 1) strongly suggests that methane bias is dueto volatilization. Recent sampling studies carried out in this laboratory (R. Dickhout, unpublisheddata), have revealed that substantial losses occur during the well filling procedure, apparentlycaused by the effervescence produced when the sodium bicarbonate and HCl solutions aremixed.
Substantial amounts of carbon dioxide were lost during the sampling process. From themedian percentage loss (15 %, Figure 2) and the typical concentration for CO2 in the controlsamples (1 g/L, Table 1), it is estimated that about 0.07 mL of carbon dioxide gas was lost tothe atmosphere per mL of solution. Pankow [6] has derived equations to predict sampling lossesdue to spontaneous bubble formation in gas-charged waters. Assuming that carbon dioxide gasbubbles were produced during sampling, Pankow's eq 11 predicts percentage losses rangingfrom 1.6% for benzene to 86% for methane. The predicted losses are, on average, about afactor of 2 greater than the observed percentage losses (Figure 1). However, gas stripping of
9

volatile compounds is not likely to be the mechanism responsible for the observed losses. Theestimated in situ gas pressure (fugacity) for dissolved carbon dioxide in the well is 0.68 atm.Spontaneous formation of gas bubbles cannot occur unless the ambient pressure is reduced toa value smaller than the in situ gas pressure plus the vapour pressure of water. The peristalticpump is the only sampler which could cause a substantial reduction in the ambient pressure. Itis therefore postulated that the volatile compounds were lost by mass transfer at the air-waterinterface. The lack of an exact correlation between percentage loss and Henry's constant valuemay be due to the possible non-equilibrium nature of the postulated mechanism or due to thefact that the losses were small relative to experimental error.
Because it is a gas at room temperature and pressure, methane has a much greaterpotential for volatilization than for sorption by synthetic polymers. The other compounds wouldhave greater potential for sorption relative to methane because they are liquids. Interestingly,the order of increasing Henry's constant is similar to the order of decreasing solubility in waterfor the compounds. A compound's solubility in water is correlated with its polymer-waterpartition coefficient, so the tendency for sorption losses would be expected to approximatelyparallel that for volatilization losses among compounds having a narrow range of boilingtemperature, which is the case for the liquids used in the experiments. Some of the samplersused in this study expose the sample to synthetic polymers. For example, plastic transfer linetubing was used with the WAT, WIZ, PER and SOL samplers. Exposure to polymeric materialsis thought to be minimal for the BAIL and SYR samplers. The order of bias among the samplersdoes not appear to be correlated with the degree of exposure to organic polymers, however.
The relative performance of the samplers seems to be consistent with the results ofprevious studies [2,4,5] which show that sampler bias tends to increase in the order: grabsamplers, positive displacements pumps, suction pumps (PER). The inertial lift pump (WAT) hasnot often been included in previous studies. The one published evaluation [2], indicated that theWAT sampler performed as well as the WIZ sampler and better than the peristaltic pump. In thepresent study, the WAT sampler did not perform as well as the other samplers. This apparentdiscrepancy may reflect differences in the way the samplers were used in the two studies, sinceit was previously shown [3,5] that factors such as rate of pumping and sample lift height caninfluence bias.
The present study has shown that the random variability associated with taking replicatesamples is large relative to the variability associated with the different sampling devices. Thismeans that large numbers of independent sampling events are needed to discriminatedifferences in sampler performance. The previous studies of sampler bias have not in generalprovided a firm statistical basis for discriminating differences in sampler performance, and theresults of the present study are circumscribed by the kind and degree of replication employedand other details of the experimental design. The relative and absolute biases associated withsampling devices in such studies may be influenced by implicit conditions that will requireconsiderably more effort to elucidate.
10

REFERENCES
[1] Barker, J. F.; Patrick, G. C.; Lemon, L.; Travis, G. M.. Ground Water Monitor. Rev., 1987,Spring, pp. 48-54.
[2] Barker, J. F.; Dickhout, R.. Ground Water Monitor. Rev., 1988, Fall, pp.112-120.
[3] Ho, J. S-Y. Jour. Amer. Water Works Assoc., 1983, Nov., pp.583-586.
[4] Barcelona, M. J.; Helfrich, E. E.; Garske, J. A.; Gibb, J. P.. Ground Water Monitor. Rev.,1984, Spring, pp. 32-41.
[5] Pearsall, K. A.; Eckhardt, A. V.. Ground Water Monitor. Rev., 1987, Spring, pp. 64-73.
[6] Pankow, J. R.. Anal. Chem., 1986, 58, pp. 1822-1826.
[7] Tukey, J. W.. Exploratory Data Analysis, Addison-Wesley, Reading, Mass., 1977.
11
PART II. LOSSES DUE TO SORPTION
INTRODUCTION
Synthetic polymers are almost ubiquitous in ground and surface water samplingequipment. They have the ability to sorb organic contaminants as evidenced by their use aschromatographic packings and as solid phase extractants. This suggest that a knowledge of thesorptive properties of synthetic polymers would be useful for the design and effective use ofequipment for sampling organic contaminants.
Sorption of organic compounds by synthetic polymers has been thoroughly studied fromthe point of view of protection of water supplies (1) and for various other applications (2), butthe implications for water sampling are not fully appreciated. Recently, we reported studies (3,4)in which sorption rate constants were measured for low molecular weight halogenated andaromatic hydrocarbons with a number of polymers. The mechanism of sorption was shown tobe diffusion in the matrix of the polymer. The halocarbons were also depleted by three metals,including stainless steel, and it was thought that reductive hydrogenolysis reactions wereresponsible. It was observed that the sorption rates were dependent on the flexibility of thepolymer, the water solubility of the compound, the contact area and the temperature, but thatthe rates were independent of solution concentration. A mathematical model was applied toexplain the concentration histories observed in the batch sorption experiments and therebyobtain values for the sorption rate constant, K2D, for each polymer-compound combination. HereK (dimensionless) is the polymer-water partition coefficient and D (cm2/s) is the diffusivity ofthe compound in the polymer.
It was possible to obtain the values of K and D separately for polyethylene, and thesewere found to be consistent with literature data. The studies demonstrate that syntheticpolymers have the potential to cause sampling bias for these common organic contaminants.The trends in the sorption rates suggest that sorption bias would be problematic for flexiblepolymers and compounds with large KOW (octanol-water partition coefficient) values. However,a more quantitative understanding is needed to enable sorption bias to be usefully predicted.The present studies focus on higher KOW compounds and on the prediction of sampling bias whenpolymeric tubing is used in conjunction with a pump to convey water samples to theircontainers. The sorption rates were measured by batch sorption experiments, similar to thoseemployed in the previous studies, and by inverse chromatography, in which the analyticalcolumn of a gas chromatograph was replaced by a length of polymeric tubing. Thechromatographic experiments were carried out to verify a model for predicting sorption bias inpolymeric transfer line tubing.
12

METHODS
Four materials, polyethylene, poly(tetrafluorethylene) (teflon), rigid polyvinyl chloride)(PVC) and stainless steel, were tested in the batch sorption experiments. The latter threematerials are commonly used in sampling surface and ground water for organic contaminants.Polyethylene was included to serve as a reference for comparing with literature data. Thecompounds included chlorobenzene (1-Ben), m-dichlorobenzene (2-Ben), 1,2,4-trichlorobenzene(3-Ben), 1,2,4,5- tetrachlorobenzene (4-Ben), hexachlorobenzene (6-Ben), 2,4-dichlorobiphenyl(2-Pcb), 2,2',5-trichlorobiphenyl (3-Pcb), 2,2',4,4'-tetrachlorobiphenyl (4-Pcb), and2,2',3,4,5'pentachlorobiphenyl (5-Pcb). These compounds were chosen for the range ofoctanol-water partition coefficient they represent, 2.8 < log KOW < 6.5, and because they arecommon organic contaminants. The range of log KOW investigated in the previous experimentswas approximately 2.1 to 3.4.
The method used for measuring the sorption rate constants is similar to that usedpreviously (3,4). Briefly, the material was cut into small, uniform-sized pieces which weredistributed equally among 160 mL glass hypovials. After weighing 100 mL aliquots of spikedwater into the hypovials, they were immediately capped with teflon-faced silicone rubber septaand placed in a 400 rpm rotary shaker. Three hypovials containing the material being tested andan additional control hypovial, containing only the spiked water, were sampled at each offourteen logarithmically-spaced sampling times. The maximum exposure time was 24 hours; inthe previous experiments, maximum exposure times of 5 to 8 weeks were used. To determinethe solution concentration, the material was removed from the hypovial and the water in thehypovial was extracted with 2 mL of iso-octane. An aliquot of the iso-octane was analyzed bygas chromatography using an RP 5890A with splitless injection, a 60 m x 0.32 mm, 25 µm DB-5fused silica capillary column, and an electron capture detector. To ensure that the sorption rateconstants would be adequately determined for most of the compounds, the number of piecesof material placed in each hypovial was adjusted, by calculation or by trial and error, so that thecompounds in the middle of the log KOW range were depleted by about 50% in 30 minutes. Thisresulted in solution volume to polymer surface area ratios ranging from 0.286 cm (PVC) to 9.35cm (polyethylene); the ratio for stainless steel was 0.470 cm. The shapes of the materialsvaried: for teflon and PVC, 1 cm x 7 cm pieces were cut from sheet 0.159 cm stock; forpolyethylene and stainless steel, 3.175 cm lengths were cut from 0.635 cm O.D. tubing. Theinitial concentrations of the compounds were chosen to be about 1/100 of their water solubilitiesto avoid non-Fickian diffusion in the polymers.
The inverse chromatography experiments were carried out with various lengths andinternal diameters of teflon and polyethylene tubing installed in an HP 5890A gas chromatographin place of the analytical column. The compounds investigated include benzene, toluene andethyl benzene. A square pulse of organic vapour was introduced into the nitrogen carrier gasstream by means of a 25 mL sample loop installed in a gas sampling valve. The loop wasconstructed from ¼" O.D. glass tubing and ¼" x 1/16" Swagelock fittings. The sample loop was
13

filled with an organic vapour at a partial pressure of about 0.01 atm with a 50 mL glass syringe.The shapes of the frontal breakthrough curves were monitored by recording area slice files sentfrom an HP 3392A integrator to an IBM PC computer. The response of the flame ionizationdetector was calibrated by recording the area of the pulse when a ¼" glass column replaced thepolymeric tubing.
RESULTS
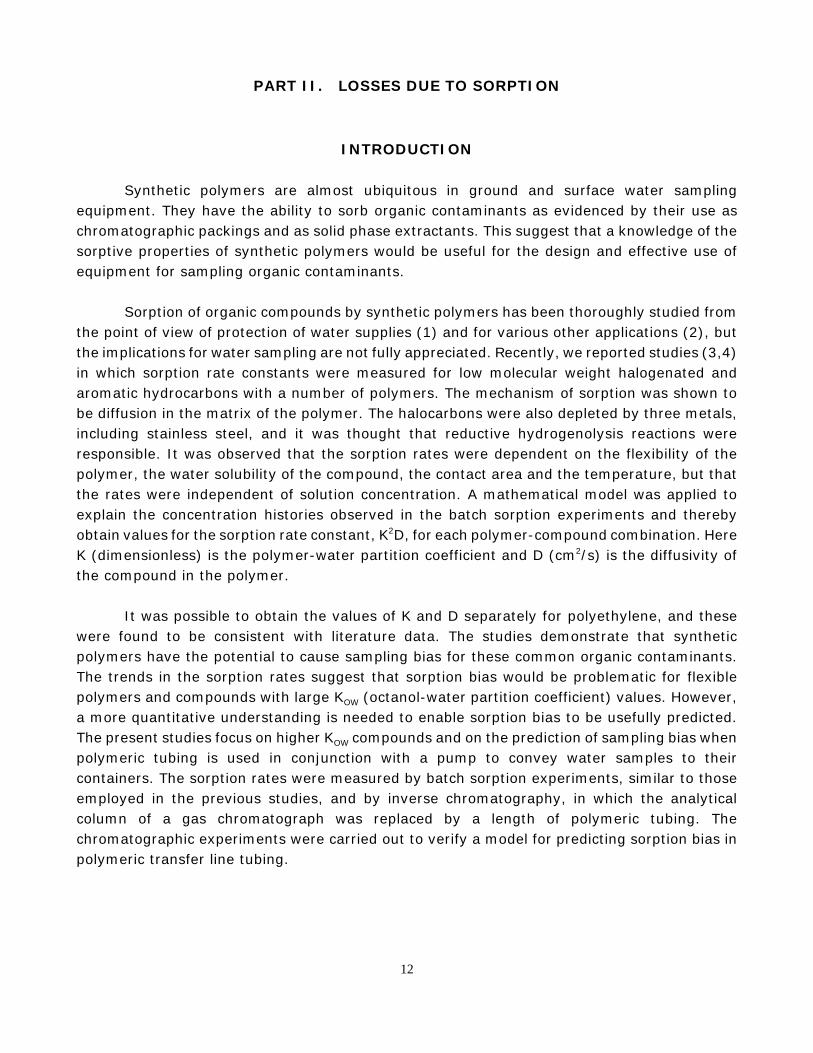
Plots of relative concentration, C(t)/C(t =0), versus log(t) (minutes) for the four materialsare shown in Figure 1. The sigmoid shape of the curves for the polymers is similar to thatobserved in the previous experiments. However, the curves for stainless steel do not appear tobe sigmoid-shaped. As was observed in the previous experiments, the rate of sorption bypolymers increases as the solubility of the compound in water decreases, or as the octanol-waterpartition coefficient increases. The data for the experiments with stainless steel also showgreater losses for compounds with lower solubilities.
Values of the sorption rate constant, K2D (cm2/s), were obtained by fitting the C/Co datato the static model by methods similar to those described previously [4]. Log K2D is related tothe time at which 50 % of the compound is lost from solution, t½ (s), by the formula:
log (K2D) = - 0.233 + 2 log a - log (t ½) (1)
where a (cm) is the ratio of the solution volume to the polymer surface area. The log t ½ valueswere obtained by visually fitting theoretical curves to the experimental data. The relationshipbetween log K2D and the solubility of the compound in water, log C S (mol/m3), for the threepolymers is shown in Figure 2. The data for the previous measurements are also plotted forcomparison. The three sets of measurements are labelled chronologically: Series 1 refers to thelow molecular weight halocarbons, Series 2 refers to the low molecular weight aromatichydrocarbons, and Series 3 refers to the chlorobenzenes and PCB's. A linear relationshipbetween log K2D and log CS is evident for the Series 3 compounds in all three polymers; theregression lines are indicated. Although an overall trend exists, the three data sets do notappear to be completely consistent; a discontinuity between the Series 3 data and the other twoseries is apparent. Figure 2 also shows that the sorption rate constants are considerably greaterfor polyethylene than for teflon or PVC.
The dynamic model selected for describing the loss of organic solutes from a fluid flowingthrough a polymeric tubing was adapted from a heat exchange model [5] and a model fordiffusion into the rock matrix of a parallel fissure [6]. The assumptions are similar to thoseemployed in the static model (e.g. planar geometry), and inversion of the model yields asorption rate constant similar to that obtained for the batch sorption experiments.
14
Figure 1. Variation of relative concentration, C/Co with time for the batch sorptionexperiments.
15

The model equations and their solution are given below.
Equations:
Mc/Mt = D (M2c / Mz2) (2)
(a / KD) ((MC/ Mt) + U(MC / Mx)) = (Mc/ Mz) (3)
Boundary and Initial Conditions (4)
Solution:
C / Co = erfc (tR K2D)½ / 2a (t -tR)
½) (5)
The fluid is flowing at velocity, U (cm/s), in the positive x direction between two parallel,semi-infinite polymer slabs separated by a distance 2a. The solute, at concentration, C (mol/m3)in the fluid, diffuses perpendicularly into the slabs (z direction), at concentration, c (mol/cm3).D (cm2/s) is the diffusivity of the solute in the polymer, and K (dimensionless) is thepolymer-water partition coefficient (or polymer-air partition coefficient when the fluid is a gas).It is assumed that diffusion in the polymer is rate limiting and that no mixing or diffusion occursin the direction of flow. C/Co is the concentration of solute in the fluid at time, t (s), anddistance, x (cm), along the fissure divided by the concentration at t = 0, x = 0; tR (s) is theresidence time of the fluid in the fissure, and erfc denotes the error function complement. Sometheoretical breakthrough curves are shown in Figure 3.
In preliminary gas chromatography experiments, the carrier gas flowrate was varied,several lengths and internal diameters of teflon tubing were tried, and several aromatichydrocarbon vapours were injected. It was observed that the breakthrough curves behavedqualitatively in the manner predicted by the model. The curves flattened when the flowratedecreased, the tubing length increased, the tubing diameter decreased, and the boilingtemperature of the compound increased. It was also observed that the shapes of thebreakthrough curves were adequately described by the model; a representative parity plot isshown in Figure 4. K2D values were obtained by visually comparing the experimentalbreakthrough curves with a series of calculated curves differing by 0.1 units in log K2D. The K2D(polymer-air) values were converted to K2D (polymer-water) values by means of thedimensionless Henry's law constant for partitioning in water [7]. The correspondence betweenthe log K2D values obtained from the GC experiments and those obtained by batch sorptionexperiments is shown in Table 1.
16

Figure 2. Log K2D versus log Cs plots for polyethylene, teflon, and rigid PVC. Series 1 and2 data are for the low molecular weight halogenated and aromatic hydrocarbons,respectively. Series 3 data are for the chlorobenzenes and PCBs presentlyinvestigated. The regression lines for Series 3 data are also indicated.
17

Table 1. A comparison of log K2D (cm2/s) values obtained by the GC experiments and thoseobtained by the batch sorption experiments.
Polymer/CompoundMethod
Inverse GC Batch Sorption
polyethylene/benzene -5.2 -5.1
teflon/benzene -7.2 -7.5
teflon/toluene -6.3 -6.9
teflon/ethyl benzene -5.9 -6.5
18
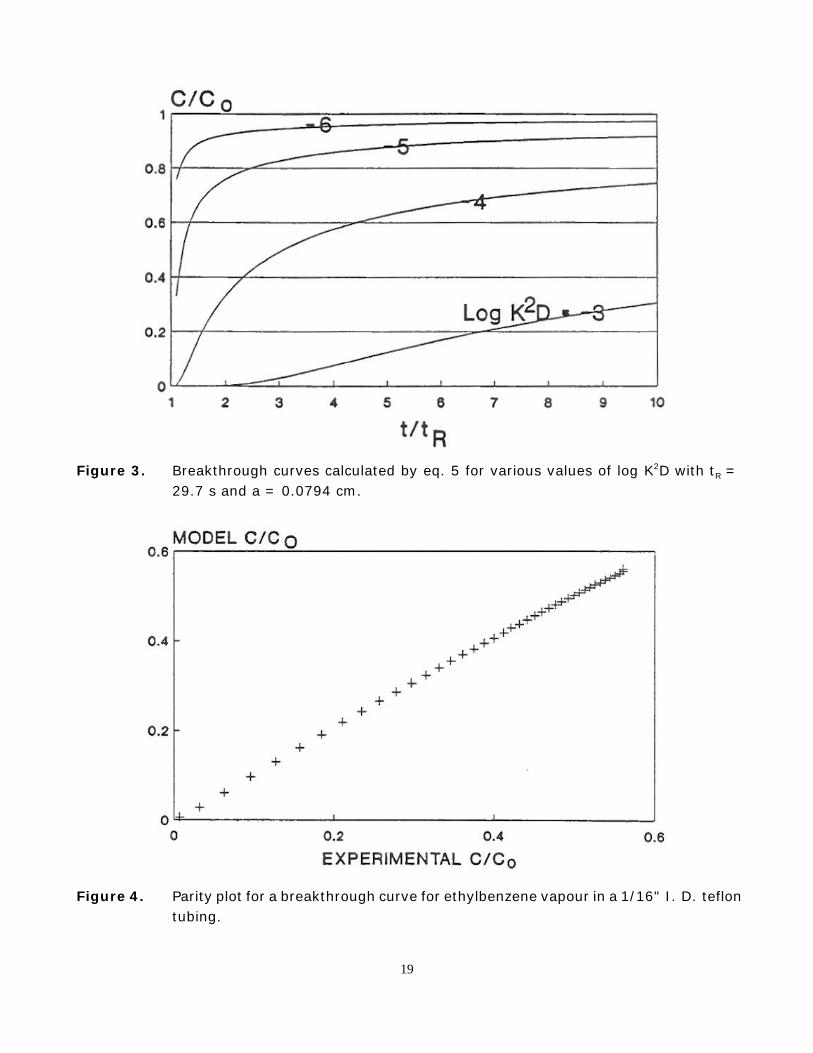
Figure 3. Breakthrough curves calculated by eq. 5 for various values of log K2D with tR =29.7 s and a = 0.0794 cm.
Figure 4. Parity plot for a breakthrough curve for ethylbenzene vapour in a 1/16" I. D. teflontubing.
19

DISCUSSION
Several difficulties were encountered in measuring the log K2D values for chlorobenzenesand PCB's in the polymers by batch sorption experiments. Because the chlorobenzenes andPCB's were much more rapidly absorbed than the previously studied compounds, it wasnecessary to reduce the exposure period and increase the sampling frequency accordingly. Thefirst few hypovials were sampled within a period of five minutes. In the case of polyethylene,it was also necessary to increase the solution volume to polymer surface area ratio, a, to about9 from the previous 0.3 cm. In the previous experiments, a tipping shaker was used at 2cycles/minute. whereas in the present experiments the hypovials were shaken much morevigorously (400 rpm on a rotary shaker).
In comparing the two methods of shaking, it was observed that the log K2D values for theseries 3 compounds in polyethylene were on average about one order of magnitude larger whenthe hypovials were shaken vigorously, implying that diffusion in the liquid phase contributessignificantly to the overall mass transfer resistance. The diffusion model that was used tointerpret the results, however, does not take this into account. Some bias may therefore existin the measured log K2D values. The bias should be largest for compounds having the largestKOW values. This fact and the previously found consistency between the literature and theexperimentally determined values for K and D [4] suggests that the bias is not severe for theSeries 1 and 2 compounds. Mass transfer resistance in the liquid phase may be responsible forthe discontinuity between the Series 3 and the Series 1 and 2 data sets seen in Figure 2. It mayalso be responsible for the poorly resolved sorption curves (C/Co vs log t) for the higher KOW
compounds in polyethylene (Figure 1).
The evidence supporting the diffusion model interpretation of the batch sorptionexperiments for the low molecular weight halogenated and aromatic hydrocarbons has beenpreviously discussed [4]. The sorption curves for the chlorobenzenes and PCB's generallyconform to the shape predicted by the diffusion model. However, due to the very wide range ofwater solubilities represented by the experimental compounds, many of the sorption curves arenot well determined experimentally, i.e. only the beginning or the ending portions aredetermined. In preliminary experiments with teflon, the value of a was varied between 2.4 and0.24 while the maximum exposure time was kept constant at 24 hours; the resulting values oflog K2D were self-consistent.
The approximate solution to the differential equations for sorption that was utilized tocalculate the log K2D values [4] is based on the assumption that the equilibrium concentrationis small relative to the initial concentration. The curves should thus be superimposable whenshifted on the log axis. The apparent lack of superimposability of the curves for polyethylene andfor PVC may be due to the fact that some of the curves apparently attain non-zero equilibriumC/Co values. The existence of linear relationships between log K2D and log CS for the
20

chlorobenzenes and PCB's in the three polymers (Figure 2) is consistent with the diffusion modeland with the trends in the Series 1 and 2 data [4]. For example, when log K and log D for thechlorobenzenes and PCB's in polyethylene are estimated from the boiling temperatures andmolar volumes using the empirical relationships derived from the Series 1 and 2 data, theresulting log K2D values are generally within 0.4 units of the experimentally determined ones.The linear relationships can be used to predict log K2D values for previously unmeasuredcompounds.
The appropriateness of the model used in this study to describe the effects of sorptionon the concentration of a vapour moving through a polymeric tubing is supported by thefollowing observations: the response of the breakthrough curve to changes in compound andpolymer identity, tubing length and diameter, and carrier gas velocity was correctly predicted;the shape of the breakthrough curve was adequately described; limited agreement was observedbetween K2D values obtained from several GC experiments and those obtained from the batchsorption experiments. The K2D value for ethyl benzene obtained from the GC method wasappreciably larger than that from the batch sorption experiment (Table 1). The reason for thisdiscrepancy is not known, but it may be related to the fact that the shape of the square pulsewas distorted for the higher boiling temperature compounds relative to the lower when thepolymer tubing was replaced by glass for calibration purposes. An expanded effort would berequired to fully evaluate the inverse chromatography technique for determining values of K2D.Further studies should include using a liquid chromatograph in conjunction with a gaschromatograph to test the assumption that mass transfer resistance in the fluid phase can beneglected. However, the present evidence provides justification for applying the dynamic modelto predict the effects of sorption on the concentration of trace organic compounds in watersampled with a length of polymeric tubing.
It was shown in a previous paper [3] that the static sorption model can be used to predictthe maximum time that a sample should be exposed to the well material, i.e. the time intervalbetween purging and sampling the well, based on the assumption that a 10% sampling error isthe largest that can be tolerated. In a typical monitoring situation, the well is 1 inch in diameter,is constructed of rigid PVC, and the compounds being determined have water solubilities greaterthan 0.1 mol/m3 (e.g. low molecular weight halogenated or aromatic hydrocarbons). Themaximum exposure time for this situation is about 10 hours. Occasionally however, compoundshaving considerably lower solubilities are determined; the compounds used in the present studyfor example have log Cs values as small as -5. The maximum exposure time for this situationis 3.8 seconds, a difficult requirement to satisfy. Similar predictions can be made for samplingsurface water with a grab sampler.
For example, if a 5 L PVC Niskin bottle is used to sample the chlorobenzenes and PCB's,the maximum exposure time, i.e. the time interval between capturing the sample and removingit from the Niskin, is 84 seconds. The following assumptions have been made in applying thestatic sorption model to predict maximum exposure times: the water in the well does notexchange with that outside after the well is purged; the water in the well or grab sampler is well
21

mixed; there is no prior exposure of the polymer to the water containing the compounds beingdetermined. If any of the assumptions are not realized, the maximum exposure time will beover-estimated. Note that the static model is not appropriate for predicting leaching ordesorption of compounds from the polymer into the water sample. Also, the assumption ofplanar geometry leads to some ambiguity when applying the model to cylinders; here, as in thebatch sorption experiments, the parameter, a, has been taken as the water volume to polymersurface area ratio, which is equal to ½ the radius of the cylinder.
Can sampling tubing be equilibrated with the water to be sampled, thus negating thissorption sampling bias? The same kind of reasoning can be applied to predicting the minimumflushing time required to obtain a sufficiently representative sample of water flowing from apolymer transfer line tubing. Figure 3 shows the results of a simulation for a typical applicationfor a common groundwater sampling system which is often used in research, the Waterloomultilevel piezometer system). Here, water flows through a 5 m length of 1/16 " ID teflon tubingat 20 mL/min; the residence time of the water in the tubing, tR, is approximately 30 seconds.It is obvious from the figure that as the value of log K2D increases from - 6 to -3, thebreakthrough curve flattens dramatically. For convenience, the minimum flushing time can bedefined as the time required for C/Co to attain an instantaneous value of 0.9. This criterionensures that the solute concentration in a finite sample will be at least 90% of Co. Figure 2shows a maximum value of -3 for log K2D. Inverting eq 5 for C/Co = 0.9 then yields a value fort of 5 hr. This calculation suggests that it may be impractical to use a small diameter teflontubing to sample very hydrophobic organic compounds.
Another typical situation would be a 5 m length of ½" ID polyethylene tubing and aflowrate of 5 L/min (e.g. the WaTerra sampler). Figure 2 indicates a maximum value of -1 forlog K2D, and eq 5 indicates a minimum flushing time of 30 minutes. This is probably a longertime period than would normally be allowed. If mass transfer resistance in the liquid phase isimportant, the minimum flushing times will be over-estimated. These calculations suggest thatsorption can be problematic for sampling moderately hydrophobic organic compounds withsystems utilizing small diameter plastic tubing if insufficient attention is given to allowingadequate flushing times for equilibrating the transfer line tubing with the water sample.
22
REFERENCES
(1) Berens, A.R.. Jour. Amer. Water Works Assoc., 1985, Nov., pp. 57-64.
(2) Rogers, C.E. In Polymer Permeability, Comyn, J., (ed.), Elsevier, New York, 1984, Ch. 2.
(3) Gillham, R.W., O'Hannesin, S.F.. in Ground Water and Vadose Zone Monitoring, ASTMSTP 1053, Nielsen, D.M. & Johnson, A.I. (eds.), Amer. Soc. for Testing andMaterials, Phila., 1990, pp. 108-122.
(4) Reynolds, G.W., Hoff, J.T., Gillham, R.W.. Environ. Sci. Technol., 1990, v. 24, pp.135-141.
(5) Carslaw, H.S., Jaeger, J.C.. Conduction of Heat in Solids, Clarendon, Oxford, UK, 1959,p. 396.
(6) Neretnieks, I.J.. Jour. Geophys. Research, 1980, v. 85, pp. 4379-4397.
(7) Mackay, D. and Shiu, W.Y.. Jour. Phys. Chem. Ref. Data, 1981, v. 10, pp. 1175-1199.
23