sas bi training | sas bi online training | sas bi e-learning | sas bi course
Bi-annual Report December 2011In Partnership with the Government of the Netherlands
GSMA Green Power for MobileBi-annual Report December 2011
Contents
2
Welcome 3
Meet the Team 4
Key Trends for Success Within Green Power for Mobile
1. Case Study: TeliaSonera – Green Power Feasibility Study 6
2. Vodafone’s New Site Solution Innovation Centre 12
3. Greenfield Communications in Cambodia 16
4. Flow Battery Technology for the Telecoms Industry 19
5. Biannual Report – Fuel Cell Deep Dive Study 23
Innovation from the Indian Subcontinent
6. Renewable Resource Availability in India 29
7. Energy for the Telecom Towers – India Market Sizing 32 and Forecasting
8. Introduction to the Indian Vendor Landscape 36
Community Power from Mobile
9. Diesel Theft: The Elephant in the Room 40
10. First Things First: Establishing Data Collection for 45 Benchmarking and Measuring Impact
11. Entrepreneurship for Africa’s Phone Charging 49
12. Financial Barriers to Community Power from Mobile 53
13. Case Study: Grameenphone Energises Paharpur: 57 Lessons Learnt One year On
Glossary 63
Resources 64

GSMA Green Power for MobileBi-annual Report December 2011
The GSMA Development Fund launched the Green Power for Mobile Programme in September 2008 to ‘extend mobile beyond the grid’ through the promotion of renewable energy technologies and energy efficient base stations. More recently, the Development Fund launched Community Power from Mobile (CPM) which supports mobile network operators (MNOs) and tower-sharing companies in developing countries to provide access to energy services to local, off-grid communities. Both programmes are supported by the International Finance Corporation (IFC).
This report is divided into three key sections:
Key Trends for Success Within Green Power for Mobile
This sections highlights successes on a global level. It opens with a three country case study conducted by one of our field implementation consultants with Telia Sonara. We then move on to talk about Greenfield, a technology provider who have over the years been quite a success in Cambodia. Following on this we discuss the different types of flow battery and the advantages and disadvantages of each. We conclude this section with a case study on Vodafone and their six star rated innovation centre which is due for launch early next year.
Innovation from the Indian Subcontinent
India and it’s subcontinent has become the epicentre for innovation in green mobile networks. It hosts the largest number of sites on our Green Deployment Tracker with 2921 live deployments. We analyse India’s resource allocation and how different renewable energies can be capitalised across the country. We have also included a market sizing and forecasting summary but for the full versions on these reports, please visit our website. This section is concluded with a vendor landscaping which amalgamates the various technology solutions available on the Indian Market today.
Community Power from Mobile
The final section of this report focuses on our newer programme which over the last 12 months has grown from strength to strength. We discuss the challenges operators face with regards to diesel theft, tackle the opportunity for building a scorecard allowing us to measure the impact of CPM projects and review the landscape of off-grid handset charging microbusiness. Also included in this section is an article on overcoming obstacles in securing funding for rural energy service companies and a case study conducted over the summer in conjunction with Grameenphone and the University of Oslo.
As mentioned previously, our Working Group has moved away from being global, to being more regionally focussed. Since our last report, we have hosted a South East Asian Working Group in Bali hosted by XL, an India subcontinent one in Delhi hosted by Bharti Infratel and most recently, we have come back from an African Working Group in Cape Town which was hosted by Vodafone and Vodacom. This last session raised some good questions which we hope to address as our programme develops over the next few months. In April 2012, the GPM will be going to Doha for the Third African Working Group which will be hosted by QTEL. If you are an operator and interested in attending, please get in touch with one of our team at [email protected].
The GPM team look forward to continued collaborations with all our Working Group members and the industry to ensure that our work is relevant to stakeholder requirements, actionable and aids advancing this emerging section within the telecommunications industry. I trust you will find this fifth edition of our biannual report educational and informative and we look forward to working with you all over the next few periods to establish a future work plan.
Areef KassamGSMA Programme Manager – Green Power for Mobile
Welcome 3
WelcomeContents 2
Welcome 3
Meet the Team 4
Key Trends for Success Within Green Power for Mobile
1. Case Study: TeliaSonera – 6 Green Power Feasibility Study
2. Vodafone’s New Site Solution 12 Innovation Centre
3. Greenfield Communications in Cambodia 16
4. Flow Battery Technology for the 19 Telecoms Industry
5. Biannual Report – 23 Fuel Cell Deep Dive Study
Innovation from the Indian Subcontinent
6. Renewable Resource Availability in India 29
7. Energy for the Telecom Towers – 32 India Market Sizing and Forecasting
8. Introduction to the Indian 36 Vendor Landscape
Community Power from Mobile
9. Diesel Theft: The Elephant in the Room 40
10. First Things First: Establishing Data 45 Collection for Benchmarking and Measuring Impact
11. Entrepreneurship for Africa’s 49 Phone Charging
12. Financial Barriers to Community Power 53 from Mobile
13. Case Study: Grameenphone Energises 57 Paharpur: Lessons Learnt One year On
Glossary 63
Resources 64

GSMA Green Power for MobileBi-annual Report December 2011
Who’s who in GPM and CPM
Areef Kassam
Programme Manager
Areef is the Green Power for Mobile Programme Manager. In this role he is responsible for developing and delivering the programme products and services that are tailored to support operators in the decision-making process around deploying renewable energy. Areef also works directly with our vendor partners to understand their products, services and provide visibility to the mobile operators.
Abirami Birrell
Programme Coordinator
Abi is the Green Power for Mobile Programme Coordinator. She provides the team with ongoing project management support for all GPM work streams; Renewable Energy Networks, off-grid Handset Charging Initiative and Community Power from Mobile. Abi is particularly involved with organising the GPM Working Groups which are held quarterly around Asia and Africa.
Meet the Team 4
Michael Nique
Strategy Analyst
Michael Nique joined the GSMA as a Strategy Analyst for the Green Power for Mobile programme. In this role, he is monitoring key innovations in renewable energy applied to the mobile industry and services to the end users. Michael also provide insights on data analysis for the mobile and development markets.
Ferdous Mottakin
Field Implementation Consultant
Ferdous is the Field Implementation Consultant for the Green Power for Mobile Programme. Within GPM he is responsible for Green Power Feasibility Studies and the associated project management. Ferdous has completed successful projects in Burundi and Bangladesh.
Meet the TeamContents 2
Welcome 3
Meet the Team 4
Key Trends for Success Within Green Power for Mobile
1. Case Study: TeliaSonera – 6 Green Power Feasibility Study
2. Vodafone’s New Site Solution 12 Innovation Centre
3. Greenfield Communications in Cambodia 16
4. Flow Battery Technology for the 19 Telecoms Industry
5. Biannual Report – 23 Fuel Cell Deep Dive Study
Innovation from the Indian Subcontinent
6. Renewable Resource Availability in India 29
7. Energy for the Telecom Towers – 32 India Market Sizing and Forecasting
8. Introduction to the Indian 36 Vendor Landscape
Community Power from Mobile
9. Diesel Theft: The Elephant in the Room 40
10. First Things First: Establishing Data 45 Collection for Benchmarking and Measuring Impact
11. Entrepreneurship for Africa’s 49 Phone Charging
12. Financial Barriers to Community Power 53 from Mobile
13. Case Study: Grameenphone Energises 57 Paharpur: Lessons Learnt One year On
Glossary 63
Resources 64

GSMA Green Power for MobileBi-annual Report December 2011
Mina Zaki
Field Implementation Consultant
Mina Zaki is a Field Implementation Consultant for the Green Power for Mobile Programme. Mina has worked in Telecoms for many years in Africa, USA and the Middle East with both vendors and MNOs. Recently he has completed a multi-country Feasibility Study for a Central Asian Operator.
Satish Kumar
Field Implementation Consultant
Satish is a Field Implementation Consultant for the Green Power for Mobile programme. Within GPM he is responsible for conducting Green Power Feasibility studies and is associated with Community Power from Mobile activities in the East African region. He has varied experience working with government bodies and organisations across telecoms, renewable energies and rural enterprises. He holds a Bachelors degree from IIT Kanpur and an MBA from IIM Bangalore.
Meet the Team
Mary Roach
Community Power from Mobile Business Development Manager
Mary Roach joined the GSMA in 2011 as an advisor for the Community Power from Mobile Programme. Prior to joining the GSMA she spent two years working on rural energy solutions in sub-Saharan Africa and five years working with GE Power Generation as a project and operations manager. She holds a MBA from Oxford University and a Bachelors in Chemical Engineering from McGill University.
Charlotte Ward
Community Power from Mobile Programme Manager
Charlotte is a financial consultant based in Nairobi working on the Community Power for Mobile program. She previously consulted government and corporates on carbon and energy projects in East Africa. She is a Masters in Applied Environmental Science from Sydney University. She has eight years investment banking experience with Deutsche Bank in Europe, Asia and Australia.
5
Contents 2
Welcome 3
Meet the Team 4
Key Trends for Success Within Green Power for Mobile
1. Case Study: TeliaSonera – 6 Green Power Feasibility Study
2. Vodafone’s New Site Solution 12 Innovation Centre
3. Greenfield Communications in Cambodia 16
4. Flow Battery Technology for the 19 Telecoms Industry
5. Biannual Report – 23 Fuel Cell Deep Dive Study
Innovation from the Indian Subcontinent
6. Renewable Resource Availability in India 29
7. Energy for the Telecom Towers – 32 India Market Sizing and Forecasting
8. Introduction to the Indian 36 Vendor Landscape
Community Power from Mobile
9. Diesel Theft: The Elephant in the Room 40
10. First Things First: Establishing Data 45 Collection for Benchmarking and Measuring Impact
11. Entrepreneurship for Africa’s 49 Phone Charging
12. Financial Barriers to Community Power 53 from Mobile
13. Case Study: Grameenphone Energises 57 Paharpur: Lessons Learnt One year On
Glossary 63
Resources 64
GSMA Green Power for MobileBi-annual Report December 2011
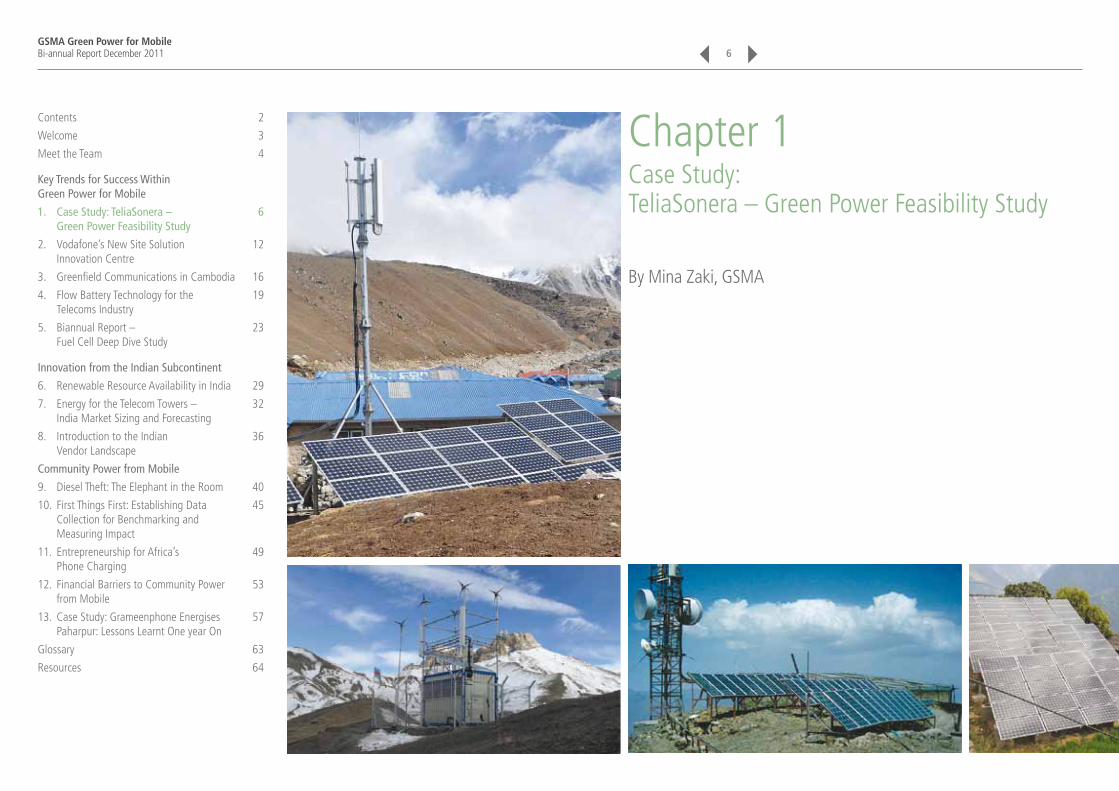
Chapter 1Case Study: TeliaSonera – Green Power Feasibility Study
By Mina Zaki, GSMA
6
Contents 2
Welcome 3
Meet the Team 4
Key Trends for Success Within Green Power for Mobile
1. Case Study: TeliaSonera – 6 Green Power Feasibility Study
2. Vodafone’s New Site Solution 12 Innovation Centre
3. Greenfield Communications in Cambodia 16
4. Flow Battery Technology for the 19 Telecoms Industry
5. Biannual Report – 23 Fuel Cell Deep Dive Study
Innovation from the Indian Subcontinent
6. Renewable Resource Availability in India 29
7. Energy for the Telecom Towers – 32 India Market Sizing and Forecasting
8. Introduction to the Indian 36 Vendor Landscape
Community Power from Mobile
9. Diesel Theft: The Elephant in the Room 40
10. First Things First: Establishing Data 45 Collection for Benchmarking and Measuring Impact
11. Entrepreneurship for Africa’s 49 Phone Charging
12. Financial Barriers to Community Power 53 from Mobile
13. Case Study: Grameenphone Energises 57 Paharpur: Lessons Learnt One year On
Glossary 63
Resources 64

GSMA Green Power for MobileBi-annual Report December 2011 7
In March 2011, Swedish telecom major Teliasonera Eurasia signed an agreement with the GSMA for a Feasibility Study to be conducted by the Green Power for Mobile (GPM) team. The Feasibility Studies were conducted with NCell (Nepal), TCell (Tajikistan) and Azercell (Azerbaijan) and included an analysis of over 4000 telecom sites.
The primary objectives were to assess the potential for renewable energy in the networks and maximise Return on Investment (ROI) in renewable energy implementations.
Additional objectives of the project were:i. Provide recommendations on alternative energy technology,
equipment sizes, new technologies, equipment trial possibilities, forecast CAPEX, forecast ROI and forecast NPV for base stations
ii. To support establishment of a Centre of Excellence within TELIA SONERA through the provision of training materials and a training curriculum from GSMA Green Power for Mobile
iii. To provide a monitoring and evaluation framework (Key Performance Indicators) for assessing the technical and financial performance of the sites.
Teliasonera – In Brief
Founded in the 1850’s Teliasonera are the pioneers of the telecom industry and are one of the most reputable group of GSM operators world-wide. Starting from local operators they developed to be the fifth largest telecom operator in Europe – in less than 20 years.
From Norway to Nepal, Teliasonera operates in Azerbaijan, Belarus, Denmark, Estonia, Finland, Georgia, Kazakhstan, Latvia, Lithuania, Moldova, Nepal, Norway, Russia, Spain, Sweden, Tajikistan, Turkey, Ukraine, and Uzbekistan. Their subscriber base exceeds 159 million and with EBITDA of SEK 36,897 million (about $5.86 billion). http://www.teliasonera.com/
Chapter 1
Approach to Financial Analysis and Site Modeling
The financial analysis or business case for renewable energy deployment in operational telecommunication networks aims to compare existing CAPEX and OPEX vs. renewable CAPEX and OPEX. Additionally, if a network experiences severe site outages due to grid power unavailability, the mobile network suffers losses in all the following:
■ Revenue: Outgoing Calls and SMS ■ Revenue: Incoming Calls and SMS interconnection charges ■ Revenue: VAS Services ■ Revenue: Subscriber Churn ■ Brand Image: Subscriber dissatisfaction.
This lost revenue from severe site outages would not be incurred if correctly dimensioned renewable energy systems were deployed on these sites. For networks with severe site outages – primarily due to power unavailability – the business cases for renewable deployment have to include a value for the lost revenue e.g. comparing existing CAPEX, OPEX and lost revenue to renewable CAPEX and OPEX. Since the primary source of revenue for most mobile networks comes from outgoing calls and SMS, only this will be taken into account while calculating revenue loss for a mobile network.
In order to come up with a value for the lost revenue, a dollar value for a minute of outgoing voice traffic and SMS on that network needs to be computed. For that purpose, the following was explored:
■ Actual Outage Time of Sites ■ Actual Traffic Volumes of Sites ■ Calling Charging Rates ■ Estimate revenue model for Sites throughout project life.
Ultimately, of the networks examined, the value of lost revenues was only calculated for NCell and TCell using a 15 year lifetime for the renewable energy project. The Azercell network was not considered as they suffer from minimal network outages.
Contents 2
Welcome 3
Meet the Team 4
Key Trends for Success Within Green Power for Mobile
1. Case Study: TeliaSonera – 6 Green Power Feasibility Study
2. Vodafone’s New Site Solution 12 Innovation Centre
3. Greenfield Communications in Cambodia 16
4. Flow Battery Technology for the 19 Telecoms Industry
5. Biannual Report – 23 Fuel Cell Deep Dive Study
Innovation from the Indian Subcontinent
6. Renewable Resource Availability in India 29
7. Energy for the Telecom Towers – 32 India Market Sizing and Forecasting
8. Introduction to the Indian 36 Vendor Landscape
Community Power from Mobile
9. Diesel Theft: The Elephant in the Room 40
10. First Things First: Establishing Data 45 Collection for Benchmarking and Measuring Impact
11. Entrepreneurship for Africa’s 49 Phone Charging
12. Financial Barriers to Community Power 53 from Mobile
13. Case Study: Grameenphone Energises 57 Paharpur: Lessons Learnt One year On
Glossary 63
Resources 64
GSMA Green Power for MobileBi-annual Report December 2011 8
Whilst doing the dimensioning of renewable systems, the following was taken into account:
■ A Free Cooling Unit (FCU) or DC Fan should be used for each indoor site to compensate the need for air conditioning. Therefore an additional loading of about 300W was considered whilst modelling indoor sites, and the price for the unit was considered in the business cases
■ A battery cooler should be used in indoor sites to maintain the batteries in good condition (extending/doubling its lifetime) and reduce heat dissipation in the room/shelter
■ Additional New Batteries were included as CAPEX for all sites ■ Additional new rectifier or expansion of existing rectifiers were
included as CAPEX for all sites ■ Average Transportation and Warehousing Costs were considered
in all business cases (Airport to W/H + W/H to reachable site).
Site Analysis Performed
More than 4000 sites among Ncell, Tcell, and Azercell were analysed in the scope of this Feasibility Study. The sites that could not have renewable power systems implemented for them – either due to space limitations or co-existence in government/official locations – were excluded at the start of the analysis.
The remaining sites were analysed in terms of average annual (and hence daily) grid power outages and current OPEX. The sites connected to a stable or fairly stable grid were then also excluded from the analysis.
The remaining off-grid sites and sites with highly unstable grid power were first optimised in terms of the systems consuming power on-site, and recommendations were made to reduce the requirement of power. Then the sites were grouped into models based on the following criteria: 1) grid power outage 2) DG availability on site and DG type 3) average power consumption of the site.
Upon grouping the sites, a technical design/simulation was done for each model of sites to come up with a design for the renewable system that would provide for the power requirement of the site.
Finally, a business case was done for each of the models that included current OPEX and CAPEX incurred by the mobile operators, as well as the OPEX and CAPEX that will be incurred if the operator chooses to go for renewable energy and green systems. The business cases also outline the financial measures needed to set guidelines on whether the investment was worth it or not – that included payback period, ROI, NPV, IRR, and Capital Expenditure.
Priority Assignment and Financial Analysis
The decision to implement renewable energy as a means of reducing OPEX by a mobile network is best done by prioritising which sites the operator wishes to start with. Same as in rolling out a network, the operator may choose to expand coverage in rural areas, or focus on increasing capacity in highly urbanised cities.
An operator may choose to prioritise their renewable rollout based on one or more variables. GSMA presented different variables to Teliasonera’s management, to allow them to ultimately come up with an informed decision on the way forward for renewable implementation.
Chapter 1
Contents 2
Welcome 3
Meet the Team 4
Key Trends for Success Within Green Power for Mobile
1. Case Study: TeliaSonera – 6 Green Power Feasibility Study
2. Vodafone’s New Site Solution 12 Innovation Centre
3. Greenfield Communications in Cambodia 16
4. Flow Battery Technology for the 19 Telecoms Industry
5. Biannual Report – 23 Fuel Cell Deep Dive Study
Innovation from the Indian Subcontinent
6. Renewable Resource Availability in India 29
7. Energy for the Telecom Towers – 32 India Market Sizing and Forecasting
8. Introduction to the Indian 36 Vendor Landscape
Community Power from Mobile
9. Diesel Theft: The Elephant in the Room 40
10. First Things First: Establishing Data 45 Collection for Benchmarking and Measuring Impact
11. Entrepreneurship for Africa’s 49 Phone Charging
12. Financial Barriers to Community Power 53 from Mobile
13. Case Study: Grameenphone Energises 57 Paharpur: Lessons Learnt One year On
Glossary 63
Resources 64
GSMA Green Power for MobileBi-annual Report December 2011 9
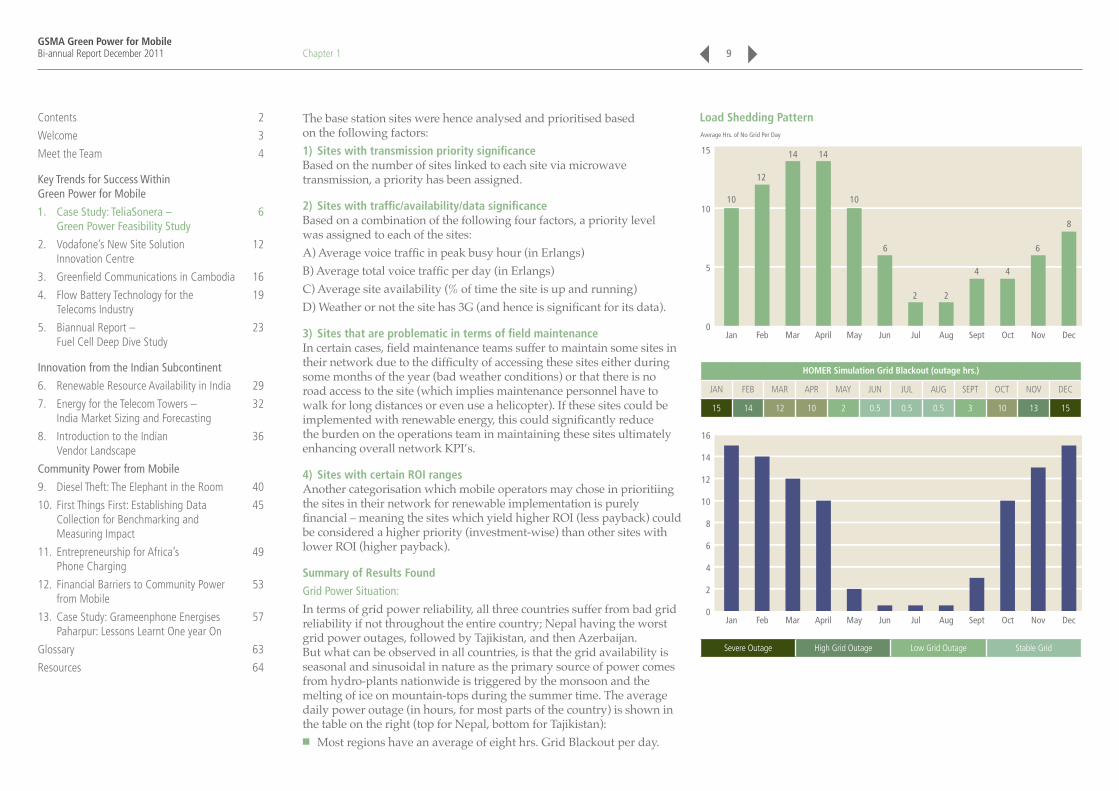
The base station sites were hence analysed and prioritised based on the following factors:1) Sites with transmission priority significance Based on the number of sites linked to each site via microwave transmission, a priority has been assigned.
2) Sites with traffic/availability/data significanceBased on a combination of the following four factors, a priority level was assigned to each of the sites: A) Average voice traffic in peak busy hour (in Erlangs)B) Average total voice traffic per day (in Erlangs)C) Average site availability (% of time the site is up and running)D) Weather or not the site has 3G (and hence is significant for its data).
3) Sites that are problematic in terms of field maintenanceIn certain cases, field maintenance teams suffer to maintain some sites in their network due to the difficulty of accessing these sites either during some months of the year (bad weather conditions) or that there is no road access to the site (which implies maintenance personnel have to walk for long distances or even use a helicopter). If these sites could be implemented with renewable energy, this could significantly reduce the burden on the operations team in maintaining these sites ultimately enhancing overall network KPI’s.
4) Sites with certain ROI rangesAnother categorisation which mobile operators may chose in prioritiing the sites in their network for renewable implementation is purely financial – meaning the sites which yield higher ROI (less payback) could be considered a higher priority (investment-wise) than other sites with lower ROI (higher payback). Summary of Results Found
Grid Power Situation:
In terms of grid power reliability, all three countries suffer from bad grid reliability if not throughout the entire country; Nepal having the worst grid power outages, followed by Tajikistan, and then Azerbaijan. But what can be observed in all countries, is that the grid availability is seasonal and sinusoidal in nature as the primary source of power comes from hydro-plants nationwide is triggered by the monsoon and the melting of ice on mountain-tops during the summer time. The average daily power outage (in hours, for most parts of the country) is shown in the table on the right (top for Nepal, bottom for Tajikistan):
■ Most regions have an average of eight hrs. Grid Blackout per day.
Load Shedding Pattern
0
5
10
15
10 10
6
8
6
2 2
4 4
12
Jan Feb Mar April May Jun Jul Aug Sept Oct Nov Dec
14 14
Average Hrs. of No Grid Per Day
HOMER Simulation Grid Blackout (outage hrs.)
JAN FEB MAR APR MAY JUN JUL AUG SEPT OCT NOV DEC
15 14 12 10 2 0.5 0.5 0.5 3 10 13 15
0
2
4
6
8
10
12
14
16
Jan Feb Mar April May Jun Jul Aug Sept Oct Nov Dec
Severe Outage High Grid Outage Low Grid Outage Stable Grid
Chapter 1
Contents 2
Welcome 3
Meet the Team 4
Key Trends for Success Within Green Power for Mobile
1. Case Study: TeliaSonera – 6 Green Power Feasibility Study
2. Vodafone’s New Site Solution 12 Innovation Centre
3. Greenfield Communications in Cambodia 16
4. Flow Battery Technology for the 19 Telecoms Industry
5. Biannual Report – 23 Fuel Cell Deep Dive Study
Innovation from the Indian Subcontinent
6. Renewable Resource Availability in India 29
7. Energy for the Telecom Towers – 32 India Market Sizing and Forecasting
8. Introduction to the Indian 36 Vendor Landscape
Community Power from Mobile
9. Diesel Theft: The Elephant in the Room 40
10. First Things First: Establishing Data 45 Collection for Benchmarking and Measuring Impact
11. Entrepreneurship for Africa’s 49 Phone Charging
12. Financial Barriers to Community Power 53 from Mobile
13. Case Study: Grameenphone Energises 57 Paharpur: Lessons Learnt One year On
Glossary 63
Resources 64

GSMA Green Power for MobileBi-annual Report December 2011 10
Renewable Sources:
In Nepal, solar radiation intensities are quite high year-round and therefore it is the best choice for renewable energy for Ncell. This was already experienced practically by Ncell as they have 17 sites; some running 100% on solar power and some hybrid between solar and grid/Diesel Generator.
In Tajikistan and Azerbaijan solar intensity is seasonal, and during the winter months when the grid power is at its worst, the solar radiation intensity is also at its worst levels and may not be sufficient to power up the site unless a large-scale solar system was put in place. That would of course mean a larger investment, and ultimately a higher payback period and lower ROI. Wind power in many parts of these countries may pose as a better source of renewable energy. Wind speeds in some areas are extremely good throughout the year, and a renewable design of only wind energy could in many cases be the best option, and in other cases a hybrid design between solar and wind was found to be the most reliable and cost-efficient.
Solar ■ Solar patterns do not vary much within a few square kilometers ■ Solar Insulation is low during the months where Grid power is
unreliable Oct-Mar ■ Solar Insulation is high during Apr-Sept (excellent for sites not connected
to Grid).
Monthly Averaged Insulation Incident on a Horizontal Surface (kWh/m2/day)
Lat 40.209Lon 69.666
JAN FEB MAR APR MAY JUN JUL AUG SEPT OCT NOV DEC
22-year Average
1.98 2.85 3.90 5.26 6.64 7.78 7.76 6.90 5.49 3.86 2.40 1.73
Wind ■ Wind patterns vary incredibly within a few meters – especially due to
the mountainous and hilly terrain that is 93% of the land ■ Wind speeds must be measured and/or surveyed prior to deploying
wind turbines for any site – as it may either be 100% beneficial or 100% loss if the location of the set-up was wrongly chosen.
Monthly Averaged Wind Speed at 50m Above the Surface of the Earth (m/s) Vegetation type: Rough Glacial Snow/ice
Lat 37.23Lon 71.484
JAN FEB MAR APR MAY JUN JUL AUG SEPT OCT NOV DEC Annual average
50m 7.86 7.43 7.50 7.21 6.67 6.02 6.33 6.50 6.72 7.48 7.77 7.54 7.08
Business Case Results:
From the business cases, one can deduce that renewable systems can be retro-fitted in existing sites at Ncell and Tcell operations and would yield good financial returns and payback periods less than six years and in most cases in Ncell less than three years.
As for Azercell operation, the current OPEX being incurred on the operational sites is very low, due to the mature managed services model they are operating, and hence renewable energy systems would only be cost beneficial to be implemented in new site deployments in off-grid locations.
Over the past 24 months, GPM has completed 20 Feasibility Studies with different operators across Africa, the Pacific, and South Asia. The experience and learnings from implementing across a wide number of sites and geographies has given Green Power for Mobile world class understanding of the methodology to design and implement alternative energy base stations.
Chapter 1
Contents 2
Welcome 3
Meet the Team 4
Key Trends for Success Within Green Power for Mobile
1. Case Study: TeliaSonera – 6 Green Power Feasibility Study
2. Vodafone’s New Site Solution 12 Innovation Centre
3. Greenfield Communications in Cambodia 16
4. Flow Battery Technology for the 19 Telecoms Industry
5. Biannual Report – 23 Fuel Cell Deep Dive Study
Innovation from the Indian Subcontinent
6. Renewable Resource Availability in India 29
7. Energy for the Telecom Towers – 32 India Market Sizing and Forecasting
8. Introduction to the Indian 36 Vendor Landscape
Community Power from Mobile
9. Diesel Theft: The Elephant in the Room 40
10. First Things First: Establishing Data 45 Collection for Benchmarking and Measuring Impact
11. Entrepreneurship for Africa’s 49 Phone Charging
12. Financial Barriers to Community Power 53 from Mobile
13. Case Study: Grameenphone Energises 57 Paharpur: Lessons Learnt One year On
Glossary 63
Resources 64

GSMA Green Power for MobileBi-annual Report December 2011
GSMA has identified a critical value proposition in the offering of these Feasibility Study services to operators. Green Power for Mobile is now offering a Feasibility Study service for operators. This service analyses an operator’s entire country network of base stations, identifies those that are most suitable for green power solutions, dimensions the equipment required and forecasts CAPEX and ROI. Our primary goal is to maximise the ROI for operators and provide training on the Green Power for Mobile Methodology. The service also assists operators with RFP design and interpretation of responses from vendors specific to the use of alternative energy.
For more information on Feasibility Studies please contact [email protected].
Chapter 1 11
Contents 2
Welcome 3
Meet the Team 4
Key Trends for Success Within Green Power for Mobile
1. Case Study: TeliaSonera – 6 Green Power Feasibility Study
2. Vodafone’s New Site Solution 12 Innovation Centre
3. Greenfield Communications in Cambodia 16
4. Flow Battery Technology for the 19 Telecoms Industry
5. Biannual Report – 23 Fuel Cell Deep Dive Study
Innovation from the Indian Subcontinent
6. Renewable Resource Availability in India 29
7. Energy for the Telecom Towers – 32 India Market Sizing and Forecasting
8. Introduction to the Indian 36 Vendor Landscape
Community Power from Mobile
9. Diesel Theft: The Elephant in the Room 40
10. First Things First: Establishing Data 45 Collection for Benchmarking and Measuring Impact
11. Entrepreneurship for Africa’s 49 Phone Charging
12. Financial Barriers to Community Power 53 from Mobile
13. Case Study: Grameenphone Energises 57 Paharpur: Lessons Learnt One year On
Glossary 63
Resources 64
GSMA Green Power for MobileBi-annual Report December 2011
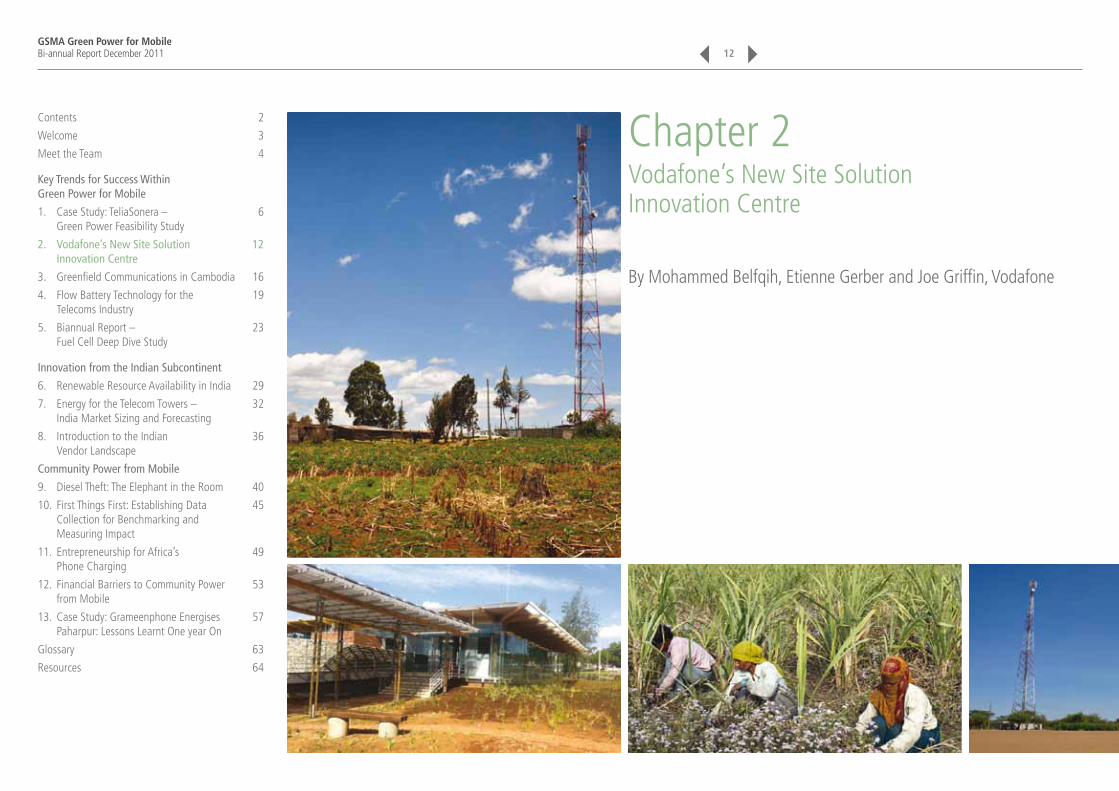
Chapter 2Vodafone’s New Site Solution Innovation Centre
By Mohammed Belfqih, Etienne Gerber and Joe Griffin, Vodafone
12
Contents 2
Welcome 3
Meet the Team 4
Key Trends for Success Within Green Power for Mobile
1. Case Study: TeliaSonera – 6 Green Power Feasibility Study
2. Vodafone’s New Site Solution 12 Innovation Centre
3. Greenfield Communications in Cambodia 16
4. Flow Battery Technology for the 19 Telecoms Industry
5. Biannual Report – 23 Fuel Cell Deep Dive Study
Innovation from the Indian Subcontinent
6. Renewable Resource Availability in India 29
7. Energy for the Telecom Towers – 32 India Market Sizing and Forecasting
8. Introduction to the Indian 36 Vendor Landscape
Community Power from Mobile
9. Diesel Theft: The Elephant in the Room 40
10. First Things First: Establishing Data 45 Collection for Benchmarking and Measuring Impact
11. Entrepreneurship for Africa’s 49 Phone Charging
12. Financial Barriers to Community Power 53 from Mobile
13. Case Study: Grameenphone Energises 57 Paharpur: Lessons Learnt One year On
Glossary 63
Resources 64

GSMA Green Power for MobileBi-annual Report December 2011
In December 2010, Vodafone Group Technology and Vodacom agreed to a joint initiative to establish a Site Solution Innovation Centre in South Africa.
Vodacom, and its parent company Vodafone, have broken new ground in South Africa by achieving the first ever 6-star Green Star SA rating for the Vodafone Innovation Centre building in Midrand, Johannesburg.
The innovation centre is expected to open in the first quarter of 2012 and will house a team of experts who will focus on developing energy efficient and sustainable network solutions that can be deployed anywhere in the world. These innovations will help address economic, social and environmental challenges.
This is the first time that a South African building has achieved this rating. 6-Star Green Star is equivalent to ‘World Leadership’ in environmentally sustainable design and/or construction.
The Vodafone Innovation Centre will be carbon neutral and powered by renewable energy. Once complete, the Centre will house a team of experts tasked with creating energy efficiency solutions that are expected to significantly reduce Vodafone’s global emissions. According to the World Green Building Council, the built environment is one of the main contributors to climate change.
Pieter Uys, Vodacom CEO says: “We are delighted that our building has achieved this accolade. Over the last few years, we have worked hard to reduce the Group’s impact on the environment; it is a core strategic priority for both Vodafone and Vodacom. The Innovation Centre, as the hub of our creative thinking around a low-carbon future, will play a critical role in the reduction of carbon emissions across the Group.”
In developing markets such as South Africa, base stations sometimes need to be situated in remote areas with limited or no access to grid power in order to connect isolated communities. Renewable energy from solar panels and wind turbines can offer an alternative to diesel generators in such off-grid sites.
Steve Pusey, Vodafone Group Chief Technology Officer said: “We want to explore how solar and wind power can help to connect isolated communities, reduce carbon emissions and reduce energy costs. As well as being a beacon for environmental construction, this innovation centre will help us to develop even more efficient networks.”
Scope of the Site Solution Innovation Centre: ■ Accelerate time-to-market for innovative base station site technology
with better operational efficiencies, easy maintenance and a strong future road map
■ Focus on: Compact base station site solutions, easily improved transport and logistics for equipment, simplified installation and operation, enhanced reliability and sustainability as well as health and safety
■ Evaluate the use of innovative base station site solutions to drive community benefits such as the provision of power for local communities.
Equipment and Design
Compact Site Solutions
Transport and Logistics
Installation and Operation
Reliability and Sustainability
Health and Safety
Scope of the Site Solution Innovation Centre, Vodafone
Chapter 2 13
Contents 2
Welcome 3
Meet the Team 4
Key Trends for Success Within Green Power for Mobile
1. Case Study: TeliaSonera – 6 Green Power Feasibility Study
2. Vodafone’s New Site Solution 12 Innovation Centre
3. Greenfield Communications in Cambodia 16
4. Flow Battery Technology for the 19 Telecoms Industry
5. Biannual Report – 23 Fuel Cell Deep Dive Study
Innovation from the Indian Subcontinent
6. Renewable Resource Availability in India 29
7. Energy for the Telecom Towers – 32 India Market Sizing and Forecasting
8. Introduction to the Indian 36 Vendor Landscape
Community Power from Mobile
9. Diesel Theft: The Elephant in the Room 40
10. First Things First: Establishing Data 45 Collection for Benchmarking and Measuring Impact
11. Entrepreneurship for Africa’s 49 Phone Charging
12. Financial Barriers to Community Power 53 from Mobile
13. Case Study: Grameenphone Energises 57 Paharpur: Lessons Learnt One year On
Glossary 63
Resources 64

GSMA Green Power for MobileBi-annual Report December 2011
Example of Innovation: Power Cube
Our latest innovation, the Power Cube provides an emergency power supply to base station sites on a 24/7 basis with a 40% diesel efficiency compared with traditional diesel hybrid solutions in off-grid applications.
Vodafone and its partners developed the Power Cube: All in one box (safe, easy to install and maintain).
Key features include smart energy controller, cycling batteries, DC cooling and diesel generator including 1000 L tank.
Picture from the Trial in India at VF-Essar Network. (Trial started in April 2011.)
The key benefits of the Power Cube solution compared to traditional Diesel Battery Hybrid solution include significant reduction in diesel consumption and CO2. (Figures from the recent performed Pilot at Vodafone Essar Site with 1,5 KW Load.)
Off-grid CaseCO2 Emissions in Tonnes / Year
40.00
35.00
30.00
25.00
20.00
15.00
10.00
5.00
0.00
16,000.00
14,000.00
12,000.00
10,000.00
8,000.00
6,000.00
4,000.00
2,000.00
0,00Traditional Hybrid Power CubeTraditional Diesel
Yearly Consumption (Ltrs) CO2 Emissions in Tonnes CO2
Further advantages of the Power Cube include: ■ Plug and Play deployment ■ Reduction in fuel usage (refilling every two months) ■ Reduction in maintenance activities ■ Reduction in space requirements ■ Improved protection against diesel theft.
Supporting Community with Innovative Green Solutions:
Experts from Vodafone Group and Vodacom have joined forces to assess the power needs of selected rural communities in South Africa that are off-grid without access to power. The team began with an initial assessment at the village of Emfihlweni in the North of Kwa-Zulu Natal, South Africa. They identified several basic needs for electricity in the village including: lighting, refrigerators for vaccine storage and power for medical equipment, power for borehole pumps to access fresh water, power for the computer centre to drive education programmes and power to charge mobile phones to stay connected.
A petrol generator is currently being used to power the water pumps at the schools. Villagers also require electricity to power a much-needed medical clinic as well as computers in the secondary school for education.
It would cost the village more than 2.5million South African Rand to bring grid power to the village, rendering it unaffordable.
The Vodafone Group and Vodacom team is now exploring whether they can supply some of the village’s power needs through an existing base station site that currently runs on a diesel generator close to the village. Experts are investigating enabling the base station site with renewable energy – effectively over supplying the base station – while permitting the villagers to use the excess power.
Chapter 2 14
Contents 2
Welcome 3
Meet the Team 4
Key Trends for Success Within Green Power for Mobile
1. Case Study: TeliaSonera – 6 Green Power Feasibility Study
2. Vodafone’s New Site Solution 12 Innovation Centre
3. Greenfield Communications in Cambodia 16
4. Flow Battery Technology for the 19 Telecoms Industry
5. Biannual Report – 23 Fuel Cell Deep Dive Study
Innovation from the Indian Subcontinent
6. Renewable Resource Availability in India 29
7. Energy for the Telecom Towers – 32 India Market Sizing and Forecasting
8. Introduction to the Indian 36 Vendor Landscape
Community Power from Mobile
9. Diesel Theft: The Elephant in the Room 40
10. First Things First: Establishing Data 45 Collection for Benchmarking and Measuring Impact
11. Entrepreneurship for Africa’s 49 Phone Charging
12. Financial Barriers to Community Power 53 from Mobile
13. Case Study: Grameenphone Energises 57 Paharpur: Lessons Learnt One year On
Glossary 63
Resources 64
GSMA Green Power for MobileBi-annual Report December 2011
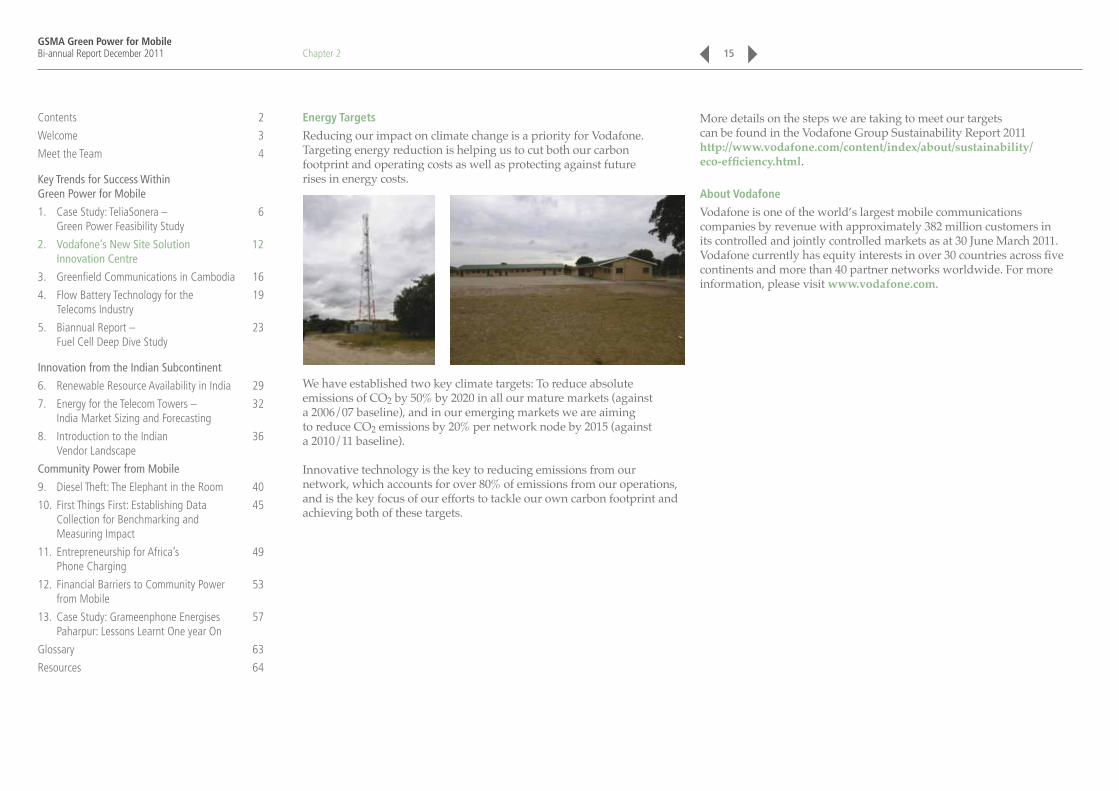
Energy Targets
Reducing our impact on climate change is a priority for Vodafone. Targeting energy reduction is helping us to cut both our carbon footprint and operating costs as well as protecting against future rises in energy costs.
We have established two key climate targets: To reduce absolute emissions of CO2 by 50% by 2020 in all our mature markets (against a 2006/07 baseline), and in our emerging markets we are aiming to reduce CO2 emissions by 20% per network node by 2015 (against a 2010/11 baseline).
Innovative technology is the key to reducing emissions from our network, which accounts for over 80% of emissions from our operations, and is the key focus of our efforts to tackle our own carbon footprint and achieving both of these targets.
More details on the steps we are taking to meet our targets can be found in the Vodafone Group Sustainability Report 2011 http://www.vodafone.com/content/index/about/sustainability/ eco-efficiency.html.
About Vodafone
Vodafone is one of the world’s largest mobile communications companies by revenue with approximately 382 million customers in its controlled and jointly controlled markets as at 30 June March 2011. Vodafone currently has equity interests in over 30 countries across five continents and more than 40 partner networks worldwide. For more information, please visit www.vodafone.com.
Chapter 2 15
Contents 2
Welcome 3
Meet the Team 4
Key Trends for Success Within Green Power for Mobile
1. Case Study: TeliaSonera – 6 Green Power Feasibility Study
2. Vodafone’s New Site Solution 12 Innovation Centre
3. Greenfield Communications in Cambodia 16
4. Flow Battery Technology for the 19 Telecoms Industry
5. Biannual Report – 23 Fuel Cell Deep Dive Study
Innovation from the Indian Subcontinent
6. Renewable Resource Availability in India 29
7. Energy for the Telecom Towers – 32 India Market Sizing and Forecasting
8. Introduction to the Indian 36 Vendor Landscape
Community Power from Mobile
9. Diesel Theft: The Elephant in the Room 40
10. First Things First: Establishing Data 45 Collection for Benchmarking and Measuring Impact
11. Entrepreneurship for Africa’s 49 Phone Charging
12. Financial Barriers to Community Power 53 from Mobile
13. Case Study: Grameenphone Energises 57 Paharpur: Lessons Learnt One year On
Glossary 63
Resources 64
GSMA Green Power for MobileBi-annual Report December 2011
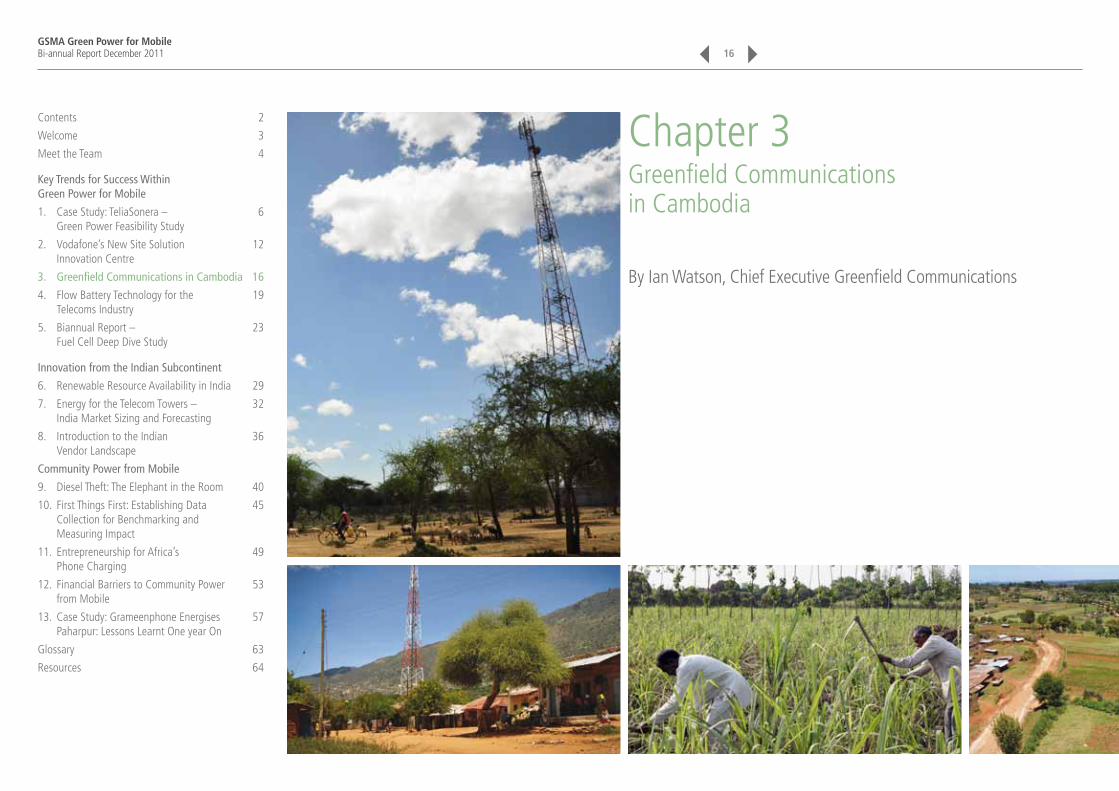
Chapter 3Greenfield Communications in Cambodia
By Ian Watson, Chief Executive Greenfield Communications
16
Contents 2
Welcome 3
Meet the Team 4
Key Trends for Success Within Green Power for Mobile
1. Case Study: TeliaSonera – 6 Green Power Feasibility Study
2. Vodafone’s New Site Solution 12 Innovation Centre
3. Greenfield Communications in Cambodia 16
4. Flow Battery Technology for the 19 Telecoms Industry
5. Biannual Report – 23 Fuel Cell Deep Dive Study
Innovation from the Indian Subcontinent
6. Renewable Resource Availability in India 29
7. Energy for the Telecom Towers – 32 India Market Sizing and Forecasting
8. Introduction to the Indian 36 Vendor Landscape
Community Power from Mobile
9. Diesel Theft: The Elephant in the Room 40
10. First Things First: Establishing Data 45 Collection for Benchmarking and Measuring Impact
11. Entrepreneurship for Africa’s 49 Phone Charging
12. Financial Barriers to Community Power 53 from Mobile
13. Case Study: Grameenphone Energises 57 Paharpur: Lessons Learnt One year On
Glossary 63
Resources 64
GSMA Green Power for MobileBi-annual Report December 2011
The Cambodian Mobile Market
Cambodia has managed a remarkable transition in building a vibrant telecom market. Despite the country’s status as one of the least developed nations in the world, Cambodia’s efforts to expand and upgrade its telecom infrastructure have certainly been positive. Cambodia has bypassed rebuilding the fixed-line market and quickly launched into alternative technologies, jump-starting its telecommunications infrastructure with digital technology. Not surprisingly, mobile services have completely overwhelmed the market. By early 2007 there were seven mobile operators vigorously competing for market share. Mobile telephone services continue to completely dominate the overall telecom market in Cambodia; more than 99% of the total number of telephone services in the country.
The subscriber base is predominantly prepaid (99%) as in most emerging markets, but the MNOs challenge in Cambodia differs from many emerging markets in that there is a migration of people from towns and cities to rural areas. Approximately three million people have moved away from urban areas to outlying villages. This increased the demand and necessity for telecom operators to expand coverage into non-electrified rural areas.
Local Issues Facing Operators
There are many issues facing telecom operators in Cambodia to build and develop the market, especially in rural areas. The issues facing mobile operators in Cambodia were manifold. Some of these challenges include underdeveloped transport infrastructure. Once out of the major cities and towns, the transport infrastructure deteriorates quickly to near non-existence in some areas. A similar situation exists with the grid power availability where it is virtually always offline outside of the major cities and towns.
Access to remote sites in some cases borders on the impossible. Monsoons eradicate existing dirt tracks and mountainous terrain also poses additional problems for the building, associated delivery and installation of network infrastructure. This issue for mobile operators is not just for the initial build of a site but ongoing maintenance and fuel supply too.
Chapter 3
In major cities, mains power supply is intermittent and costly. Away from cities the supply of power is increasingly rare and the cost of actually connecting a base station to the grid system is a barrier in itself, due to the huge figures charged by local electrical suppliers. The connection cost is in addition to the per Kilowatt hour charges that in some instances are 300% more expensive than paid-for electric power in major towns and cities.
Location is No Longer a Problem
A leading mobile network operator (MNO) in Cambodia, at the time of installing Greenfield’s solution, had over one million customers; the defined market leader with over 60% of the mobile market and the biggest mobile footprint in the country. They had already connected over 40% of their current network to be powered by a solar and wind hybrid solution and as a result of the continued expansion they wished to review both their strategic direction and choice of vendor in relation to the provision, supply and installation of the next phase of solar hybrid. Greenfield’s client had encountered several issues with the initial development and introduction of the first stage of solar hybrid. Whilst the system worked well and delivered cost savings, it was felt by the network that the level of service and ongoing support from companies which were not situated in country was insufficient. Greenfield was in the ideal situation in relation to supporting the operator on both an international level to deliver increased operational procurement efficiencies as well as on a local level to ensure the highest level of ongoing support and development was provided.
Through an existing partnership Greenfield established a full country network for support and maintenance of many of the existing solar sites in addition to the networks legacy sites. Throughout the whole process of the alternative power procurement, Greenfield worked closely with this operator to develop the correct specification and location for the additional 270 sites. Greenfield managed a full solution from procurement right through to the commissioning of the sites. From the initial training of staff through to the installation of sites and final commissioning, both the operator’s and Greenfield’s teams worked closely in tandem to ensure successful integration into the network without affecting the quality of service. Greenfield’s aim is to manage, where possible, all elements of operational and implementation control internally, to ensure that key processes are delivered to the best standards of service.
17
Contents 2
Welcome 3
Meet the Team 4
Key Trends for Success Within Green Power for Mobile
1. Case Study: TeliaSonera – 6 Green Power Feasibility Study
2. Vodafone’s New Site Solution 12 Innovation Centre
3. Greenfield Communications in Cambodia 16
4. Flow Battery Technology for the 19 Telecoms Industry
5. Biannual Report – 23 Fuel Cell Deep Dive Study
Innovation from the Indian Subcontinent
6. Renewable Resource Availability in India 29
7. Energy for the Telecom Towers – 32 India Market Sizing and Forecasting
8. Introduction to the Indian 36 Vendor Landscape
Community Power from Mobile
9. Diesel Theft: The Elephant in the Room 40
10. First Things First: Establishing Data 45 Collection for Benchmarking and Measuring Impact
11. Entrepreneurship for Africa’s 49 Phone Charging
12. Financial Barriers to Community Power 53 from Mobile
13. Case Study: Grameenphone Energises 57 Paharpur: Lessons Learnt One year On
Glossary 63
Resources 64
GSMA Green Power for MobileBi-annual Report December 2011
The solution deployed gave the operator flexibility in terms of building a complete solution to meet each site’s individual needs. Given the challenging environment of Cambodia one of the key components of the solutions deployed was the Solar Controller. The robustness of the controller gave the operator and Greenfield real time information on all aspects of performance in relation to power including customisation into local languages for all reporting modules. In terms of other components, Greenfield spends a great deal of time in research and development for the solar solutions. Greenfield’s development team works closely with the procurement team and component suppliers to constantly introduce the latest technology across their platforms whilst delivering the best commercial terms for supply. Greenfield’s principle is not to outsource any elements of the procurement process to third parties but to control all aspects of purchasing and logistics internally. This gives clients greater confidence as they feel safe in the knowledge that Greenfield controls all elements of the solution.
The whole project with the Cambodian operator was a resounding success in terms of both parties meeting expectations and working closely together to deliver the best solar hybrid solutions to power base stations in remote and rural site locations.
Lessons Learned
1. Conviction of a Mobile Operator to Believe in Solar
It is now becoming widely recognised across mobile network operators that alternative power solutions should become the normal and accepted way in which networks should be powered in rural and remote environments where there is unreliable or no power infrastructure. Greenfield’s client operator has shown remarkable foresight for the manner in which they have invested heavily into hybrid solar solutions. The first was deployed nearly 10 years ago and now over 50% of their total network sites are powered by Solar Hybrid. There is now accepted data that solar powered networks can substantially reduce operational expenditure (OPEX) and simultaneously have a much lower environmental impact.
2. Solar – a Cost Effective Solution
From the site deployment in Cambodia, Greenfield have established one of the most detailed performance matrices in relation to operational functionality of solar solutions over the past three years, and has been able to demonstrate that all elements of current deployments across client’s sites deliver operational KPI’s in excess of client’s requirements, in addition to operational savings on fuel and maintenance cost.
3. Close Interface and Cooperation Between Client and Vendor
One of the key success factors is the interface between the customer and supplier. Transparency at all levels is paramount to share information and to build a complete specification of all requirements. In addition, it is imperative that the vendor ensures full local presence from initial contact through to rollout. Post installation a dedicated maintenance team is situated in country to compliment the detailed interface and cooperation from initial planning stage to implementation. This is key to a successful rollout of the solar solution.
About Greenfield
Greenfield Communications provides MNOs with a realistic and practical approach to solar hybrid power management and generation. Greenfield’s experience and range of power solutions perfected in live working environments allow it to build the most effective and reliable solution for each of our customers. Their team of industry experts will engage and integrate across client’s functional departments to build and deliver the most cost effective solution based on client’s individual needs. The unique BOOT finance concept allows clients to implement solar solutions without any capital expenditure exposure (CAPEX).
Chapter 3 18
Contents 2
Welcome 3
Meet the Team 4
Key Trends for Success Within Green Power for Mobile
1. Case Study: TeliaSonera – 6 Green Power Feasibility Study
2. Vodafone’s New Site Solution 12 Innovation Centre
3. Greenfield Communications in Cambodia 16
4. Flow Battery Technology for the 19 Telecoms Industry
5. Biannual Report – 23 Fuel Cell Deep Dive Study
Innovation from the Indian Subcontinent
6. Renewable Resource Availability in India 29
7. Energy for the Telecom Towers – 32 India Market Sizing and Forecasting
8. Introduction to the Indian 36 Vendor Landscape
Community Power from Mobile
9. Diesel Theft: The Elephant in the Room 40
10. First Things First: Establishing Data 45 Collection for Benchmarking and Measuring Impact
11. Entrepreneurship for Africa’s 49 Phone Charging
12. Financial Barriers to Community Power 53 from Mobile
13. Case Study: Grameenphone Energises 57 Paharpur: Lessons Learnt One year On
Glossary 63
Resources 64

GSMA Green Power for MobileBi-annual Report December 2011
Chapter 4Flow Battery Technology for the Telecoms Industry
By Michael Nique, GSMA
19
Contents 2
Welcome 3
Meet the Team 4
Key Trends for Success Within Green Power for Mobile
1. Case Study: TeliaSonera – 6 Green Power Feasibility Study
2. Vodafone’s New Site Solution 12 Innovation Centre
3. Greenfield Communications in Cambodia 16
4. Flow Battery Technology for the 19 Telecoms Industry
5. Biannual Report – 23 Fuel Cell Deep Dive Study
Innovation from the Indian Subcontinent
6. Renewable Resource Availability in India 29
7. Energy for the Telecom Towers – 32 India Market Sizing and Forecasting
8. Introduction to the Indian 36 Vendor Landscape
Community Power from Mobile
9. Diesel Theft: The Elephant in the Room 40
10. First Things First: Establishing Data 45 Collection for Benchmarking and Measuring Impact
11. Entrepreneurship for Africa’s 49 Phone Charging
12. Financial Barriers to Community Power 53 from Mobile
13. Case Study: Grameenphone Energises 57 Paharpur: Lessons Learnt One year On
Glossary 63
Resources 64
GSMA Green Power for MobileBi-annual Report December 2011 20Chapter 4
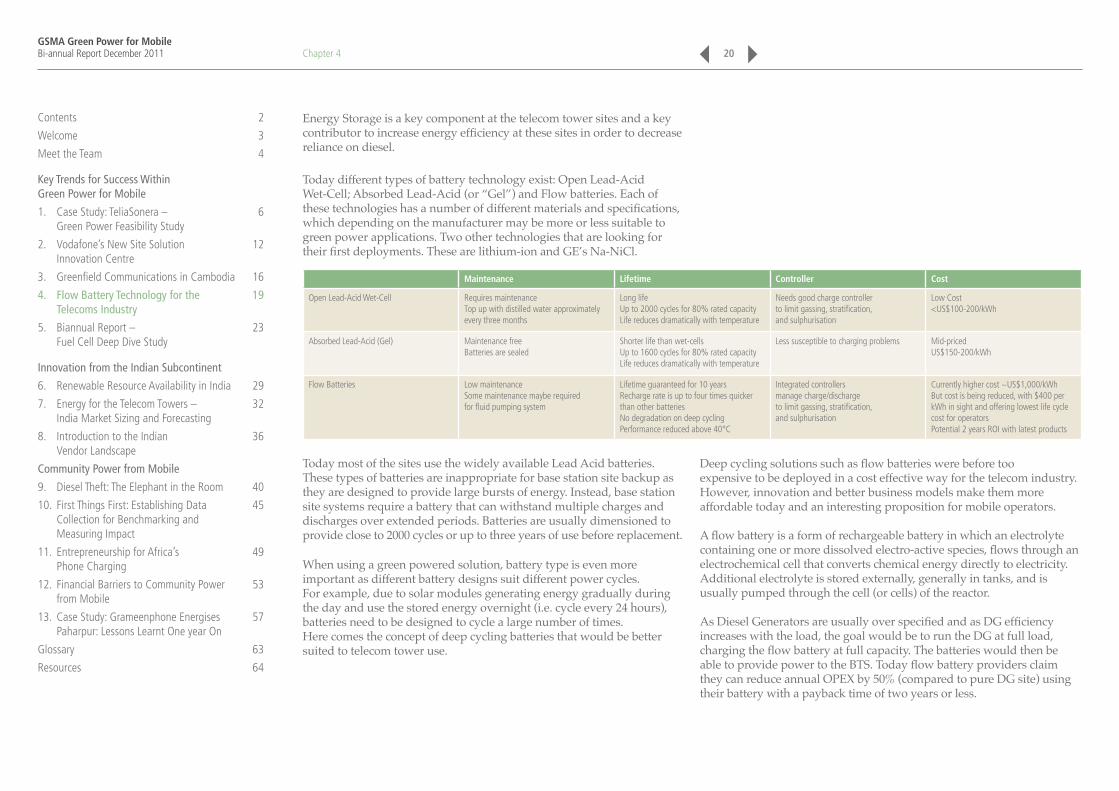
Energy Storage is a key component at the telecom tower sites and a key contributor to increase energy efficiency at these sites in order to decrease reliance on diesel.
Today different types of battery technology exist: Open Lead-Acid Wet-Cell; Absorbed Lead-Acid (or “Gel”) and Flow batteries. Each of these technologies has a number of different materials and specifications, which depending on the manufacturer may be more or less suitable to green power applications. Two other technologies that are looking for their first deployments. These are lithium-ion and GE’s Na-NiCl.
Maintenance Lifetime Controller Cost
Open Lead-Acid Wet-Cell Requires maintenance Top up with distilled water approximately every three months
Long life Up to 2000 cycles for 80% rated capacity Life reduces dramatically with temperature
Needs good charge controller to limit gassing, stratification, and sulphurisation
Low Cost <US$100-200/kWh
Absorbed Lead-Acid (Gel) Maintenance free Batteries are sealed
Shorter life than wet-cells Up to 1600 cycles for 80% rated capacity Life reduces dramatically with temperature
Less susceptible to charging problems Mid-priced US$150-200/kWh
Flow Batteries Low maintenance Some maintenance maybe required for fluid pumping system
Lifetime guaranteed for 10 years Recharge rate is up to four times quicker than other batteries No degradation on deep cycling Performance reduced above 40°C
Integrated controllers manage charge/discharge to limit gassing, stratification, and sulphurisation
Currently higher cost ~US$1,000/kWh But cost is being reduced, with $400 per kWh in sight and offering lowest life cycle cost for operators Potential 2 years ROI with latest products
Today most of the sites use the widely available Lead Acid batteries. These types of batteries are inappropriate for base station site backup as they are designed to provide large bursts of energy. Instead, base station site systems require a battery that can withstand multiple charges and discharges over extended periods. Batteries are usually dimensioned to provide close to 2000 cycles or up to three years of use before replacement.
When using a green powered solution, battery type is even more important as different battery designs suit different power cycles. For example, due to solar modules generating energy gradually during the day and use the stored energy overnight (i.e. cycle every 24 hours), batteries need to be designed to cycle a large number of times. Here comes the concept of deep cycling batteries that would be better suited to telecom tower use.
Deep cycling solutions such as flow batteries were before too expensive to be deployed in a cost effective way for the telecom industry. However, innovation and better business models make them more affordable today and an interesting proposition for mobile operators.
A flow battery is a form of rechargeable battery in which an electrolyte containing one or more dissolved electro-active species, flows through an electrochemical cell that converts chemical energy directly to electricity. Additional electrolyte is stored externally, generally in tanks, and is usually pumped through the cell (or cells) of the reactor.
As Diesel Generators are usually over specified and as DG efficiency increases with the load, the goal would be to run the DG at full load, charging the flow battery at full capacity. The batteries would then be able to provide power to the BTS. Today flow battery providers claim they can reduce annual OPEX by 50% (compared to pure DG site) using their battery with a payback time of two years or less.
Contents 2
Welcome 3
Meet the Team 4
Key Trends for Success Within Green Power for Mobile
1. Case Study: TeliaSonera – 6 Green Power Feasibility Study
2. Vodafone’s New Site Solution 12 Innovation Centre
3. Greenfield Communications in Cambodia 16
4. Flow Battery Technology for the 19 Telecoms Industry
5. Biannual Report – 23 Fuel Cell Deep Dive Study
Innovation from the Indian Subcontinent
6. Renewable Resource Availability in India 29
7. Energy for the Telecom Towers – 32 India Market Sizing and Forecasting
8. Introduction to the Indian 36 Vendor Landscape
Community Power from Mobile
9. Diesel Theft: The Elephant in the Room 40
10. First Things First: Establishing Data 45 Collection for Benchmarking and Measuring Impact
11. Entrepreneurship for Africa’s 49 Phone Charging
12. Financial Barriers to Community Power 53 from Mobile
13. Case Study: Grameenphone Energises 57 Paharpur: Lessons Learnt One year On
Glossary 63
Resources 64

GSMA Green Power for MobileBi-annual Report December 2011
The advantages of such solutions are: ■ A flow battery rapidly charges and discharges when electrolytic
liquids pass across a conductive membrane ■ Recharge rate is manifold quicker than other batteries (~4 times) ■ No degradation on deep cycling – capable of 100% discharge
every cycle for up to five years ■ Long Life (10+ years) ■ Energy (electricity) is stored in liquid form at room temperature ■ Low maintenance – possibility of remote monitoring ■ Closed loop therefore no emissions – clean technology and no
disposal issues.
These solutions can be cost effectively used in intermittent renewable energy generating systems. By increasing the electrolyte amount, the energy storage capacity will also increase. Also engine module power can increase with the cell stack modularity option enabling faster charge and discharge.
Chapter 4
Technical evolution that will impact flow batteries within the mobile industry is the improvement (in speed) of the charging/discharging cycles, the ability of modular increase of battery power (needed for colocation sites) and attractiveness of the business case – a one year payback time.
Various classes of flow batteries exist including the redox (reduction-oxidation) flow battery. In redox flow batteries, energy storage is made in electrolyte solution and energy storage amount is related to the amount of electrolyte solution.
Below are two examples of flow batteries from the vendors Prudent Energy and RedFlow.
Prudent Energy
Prudent Energy is providing a vanadium redox (and redox flow) battery. Tom Tipple, Vice President of kW Class Systems at Prudent Energy, gave us more details about their products.
Prudent Energy VRB Product for Telecom Sites
Electrolyte
—
Electrolyte
——
Power Source/Load
Concept of a Redox Flow Battery System
ElectrolyteTank
ElectrodeNon-selective
Membrane
Pump
RegenerativeFuel Cell
ElectrolyteTank
Pump
Source: Prudent Energy
21
Source: Prudent Energy
Contents 2
Welcome 3
Meet the Team 4
Key Trends for Success Within Green Power for Mobile
1. Case Study: TeliaSonera – 6 Green Power Feasibility Study
2. Vodafone’s New Site Solution 12 Innovation Centre
3. Greenfield Communications in Cambodia 16
4. Flow Battery Technology for the 19 Telecoms Industry
5. Biannual Report – 23 Fuel Cell Deep Dive Study
Innovation from the Indian Subcontinent
6. Renewable Resource Availability in India 29
7. Energy for the Telecom Towers – 32 India Market Sizing and Forecasting
8. Introduction to the Indian 36 Vendor Landscape
Community Power from Mobile
9. Diesel Theft: The Elephant in the Room 40
10. First Things First: Establishing Data 45 Collection for Benchmarking and Measuring Impact
11. Entrepreneurship for Africa’s 49 Phone Charging
12. Financial Barriers to Community Power 53 from Mobile
13. Case Study: Grameenphone Energises 57 Paharpur: Lessons Learnt One year On
Glossary 63
Resources 64
GSMA Green Power for MobileBi-annual Report December 2011
Prudent Energy has two main strategic activities around its storage solutions using the flow technology or Vanadium redox technology:
■ mW Class which represents 60-70% of Prudent’s revenue ■ kW Class which targets off-grid telecom sites (among other activities).
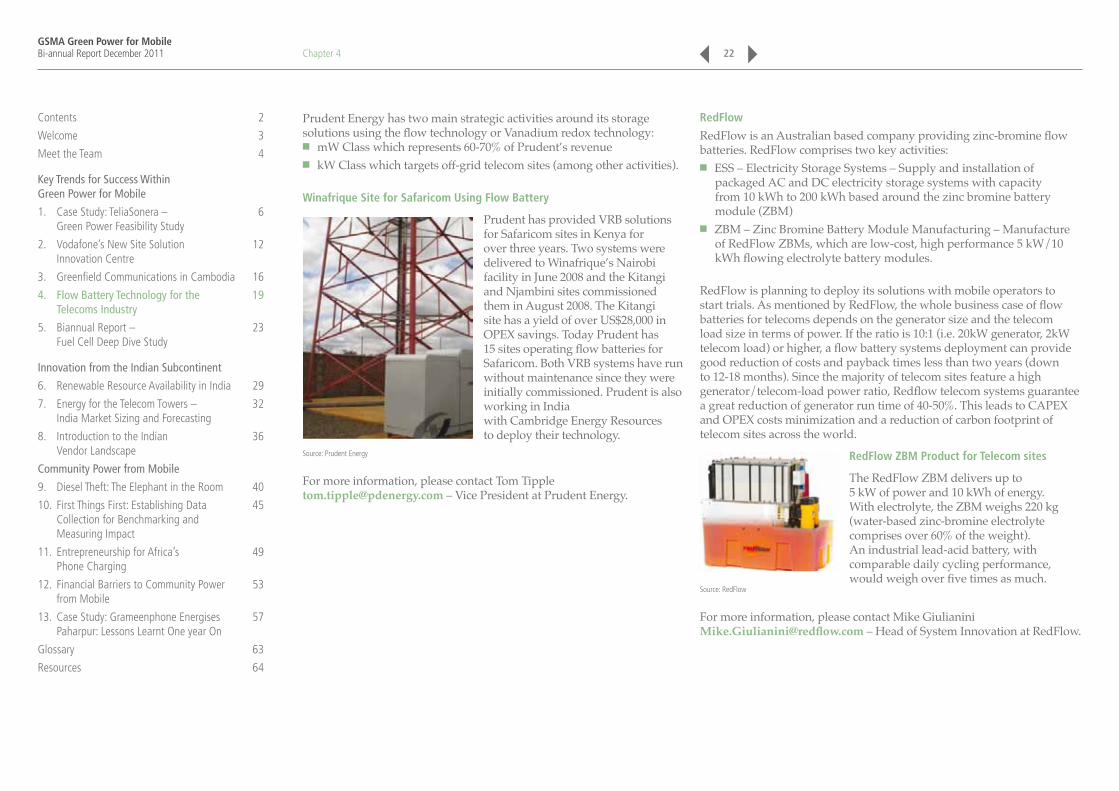
Winafrique Site for Safaricom Using Flow Battery
Prudent has provided VRB solutions for Safaricom sites in Kenya for over three years. Two systems were delivered to Winafrique’s Nairobi facility in June 2008 and the Kitangi and Njambini sites commissioned them in August 2008. The Kitangi site has a yield of over US$28,000 in OPEX savings. Today Prudent has 15 sites operating flow batteries for Safaricom. Both VRB systems have run without maintenance since they were initially commissioned. Prudent is also working in India with Cambridge Energy Resources to deploy their technology.
Source: Prudent Energy
For more information, please contact Tom Tipple [email protected] – Vice President at Prudent Energy.
Chapter 4
RedFlow
RedFlow is an Australian based company providing zinc-bromine flow batteries. RedFlow comprises two key activities:
■ ESS – Electricity Storage Systems – Supply and installation of packaged AC and DC electricity storage systems with capacity from 10 kWh to 200 kWh based around the zinc bromine battery module (ZBM)
■ ZBM – Zinc Bromine Battery Module Manufacturing – Manufacture of RedFlow ZBMs, which are low-cost, high performance 5 kW/10 kWh flowing electrolyte battery modules.
RedFlow is planning to deploy its solutions with mobile operators to start trials. As mentioned by RedFlow, the whole business case of flow batteries for telecoms depends on the generator size and the telecom load size in terms of power. If the ratio is 10:1 (i.e. 20kW generator, 2kW telecom load) or higher, a flow battery systems deployment can provide good reduction of costs and payback times less than two years (down to 12-18 months). Since the majority of telecom sites feature a high generator/telecom-load power ratio, Redflow telecom systems guarantee a great reduction of generator run time of 40-50%. This leads to CAPEX and OPEX costs minimization and a reduction of carbon footprint of telecom sites across the world.
RedFlow ZBM Product for Telecom sites
The RedFlow ZBM delivers up to 5 kW of power and 10 kWh of energy. With electrolyte, the ZBM weighs 220 kg (water-based zinc-bromine electrolyte comprises over 60% of the weight). An industrial lead-acid battery, with comparable daily cycling performance, would weigh over five times as much.
Source: RedFlow
For more information, please contact Mike Giulianini [email protected] – Head of System Innovation at RedFlow.
22
Contents 2
Welcome 3
Meet the Team 4
Key Trends for Success Within Green Power for Mobile
1. Case Study: TeliaSonera – 6 Green Power Feasibility Study
2. Vodafone’s New Site Solution 12 Innovation Centre
3. Greenfield Communications in Cambodia 16
4. Flow Battery Technology for the 19 Telecoms Industry
5. Biannual Report – 23 Fuel Cell Deep Dive Study
Innovation from the Indian Subcontinent
6. Renewable Resource Availability in India 29
7. Energy for the Telecom Towers – 32 India Market Sizing and Forecasting
8. Introduction to the Indian 36 Vendor Landscape
Community Power from Mobile
9. Diesel Theft: The Elephant in the Room 40
10. First Things First: Establishing Data 45 Collection for Benchmarking and Measuring Impact
11. Entrepreneurship for Africa’s 49 Phone Charging
12. Financial Barriers to Community Power 53 from Mobile
13. Case Study: Grameenphone Energises 57 Paharpur: Lessons Learnt One year On
Glossary 63
Resources 64

GSMA Green Power for MobileBi-annual Report December 2011 23
Chapter 5Biannual Report – Fuel Cell Deep Dive Study
By Mark Crouch, GSMA
Contents 2
Welcome 3
Meet the Team 4
Key Trends for Success Within Green Power for Mobile
1. Case Study: TeliaSonera – 6 Green Power Feasibility Study
2. Vodafone’s New Site Solution 12 Innovation Centre
3. Greenfield Communications in Cambodia 16
4. Flow Battery Technology for the 19 Telecoms Industry
5. Biannual Report – 23 Fuel Cell Deep Dive Study
Innovation from the Indian Subcontinent
6. Renewable Resource Availability in India 29
7. Energy for the Telecom Towers – 32 India Market Sizing and Forecasting
8. Introduction to the Indian 36 Vendor Landscape
Community Power from Mobile
9. Diesel Theft: The Elephant in the Room 40
10. First Things First: Establishing Data 45 Collection for Benchmarking and Measuring Impact
11. Entrepreneurship for Africa’s 49 Phone Charging
12. Financial Barriers to Community Power 53 from Mobile
13. Case Study: Grameenphone Energises 57 Paharpur: Lessons Learnt One year On
Glossary 63
Resources 64
GSMA Green Power for MobileBi-annual Report December 2011
Green Power for Mobile have been conducting a deep-dive study into the use of Fuel cells to power base stations and will shortly be publishing a White Paper on the findings.
Introduction and Motivation for the Study
Fuel cell systems have long been considered suitable for remote stationary power applications with a high cost of downtime, including mobile base stations. Fuel cell design and manufacturing improvements combined with increased volumes being produced have seen the costs come down while technical performance, reliability and longevity have been improving. This has seen the technology transition from field trials at base stations to commercial deployments over the last 2-3 years.
However misconceptions around fuel cells are common in the mobile industry for a variety of reasons, including the rate of technology development. Also, the term fuel cell is used to cover a broad family of technologies suitable for different applications which can also run on a variety of fuels, each with their own advantages and disadvantages. Base station energy needs also vary from site to site and region to region, meaning that finding the right solution is not always obvious.
The study attempts to condense the current technology status and outlook into a digestible form for GSMA members, considering technical, economic and environmental performance. This article serves as an introduction to the forthcoming White Paper, which will give a more detailed account of the study and its findings.
Methodology
The study included: ■ Extensive review of published literature ■ Interviews with a range of industry experts. These included fuel
cell manufacturers, vendors, academic researchers, fuel providers, network operators with user experience and system integrators
■ A dedicated fuel cell session at the South East Asian Green Power for Mobile Working Group in July 2011
■ A detailed case study carried out on fuel cell systems deployed in Indonesia since 2009
■ Technical and economic simulations completed comparing fuel cell systems to traditional alternatives.
Introduction to Fuel Cells ■ Fuel cells are energy conversion devices producing DC electrical
current and commonly run on hydrogen ■ They operate electrochemically like batteries but have an external
source of fuel like an engine ■ Individual cells are combined to form a fuel cell stack to provide
the required voltage ■ Fuel cell stacks are then integrated into a system with
other components.
There are various types of fuel cells suited to different applications including powering portable devices, vehicles, domestic heat and power and small power stations. The suitability of a type of fuel cell to a particular application depends upon cost and technical performance. The most common and most versatile type of fuel cell is the Proton Exchange Membrane Fuel Cell (PEM-FC).1 This is the type currently used in telecoms applications, although other types may come into use in the future.
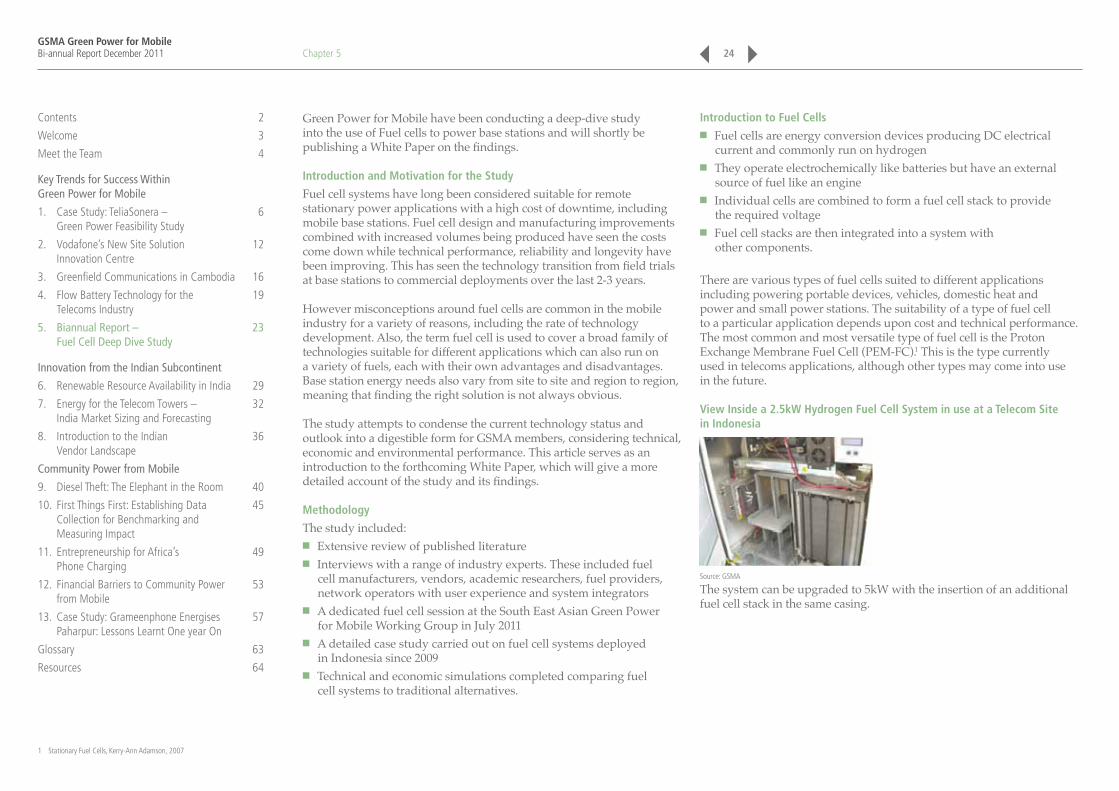
View Inside a 2.5kW Hydrogen Fuel Cell System in use at a Telecom Site in Indonesia
Source: GSMA
The system can be upgraded to 5kW with the insertion of an additional fuel cell stack in the same casing.
Chapter 5 24
1 Stationary Fuel Cells, Kerry-Ann Adamson, 2007
Contents 2
Welcome 3
Meet the Team 4
Key Trends for Success Within Green Power for Mobile
1. Case Study: TeliaSonera – 6 Green Power Feasibility Study
2. Vodafone’s New Site Solution 12 Innovation Centre
3. Greenfield Communications in Cambodia 16
4. Flow Battery Technology for the 19 Telecoms Industry
5. Biannual Report – 23 Fuel Cell Deep Dive Study
Innovation from the Indian Subcontinent
6. Renewable Resource Availability in India 29
7. Energy for the Telecom Towers – 32 India Market Sizing and Forecasting
8. Introduction to the Indian 36 Vendor Landscape
Community Power from Mobile
9. Diesel Theft: The Elephant in the Room 40
10. First Things First: Establishing Data 45 Collection for Benchmarking and Measuring Impact
11. Entrepreneurship for Africa’s 49 Phone Charging
12. Financial Barriers to Community Power 53 from Mobile
13. Case Study: Grameenphone Energises 57 Paharpur: Lessons Learnt One year On
Glossary 63
Resources 64
GSMA Green Power for MobileBi-annual Report December 2011
How are Fuel Cells Used in Telecoms?
Fuel cells can be used in the role played by diesel generators or batteries; to provide back up to an unreliable power source or in a limited number of cases as the sole power source. Market research has shown that where fuel cells are being deployed, they are currently displacing diesel generators in most cases rather than batteries. Fuel cell systems may rely upon refuelling or may be rechargeable depending upon the system type.
Fuel cells are most cost competitive at sites with low electrical loads, as these are the sites where diesel generators are least efficient. The greatest benefit will be achieved if efficiency measures to minimise power needs are also undertaken.
Deployments to Date
For now fuel cells deployment is still at a very early stage with around 900 units deployed worldwide recorded in the GPM Green Deployment Tracker. Some countries, such as Indonesia have most of the active fuel cell units: to date, around 450 fuel cell units have been deployed in Indonesia, thanks to a partnership between Hutchison and IdaTech. In Africa, South African operator Vodacom is one of the only operators having deployed fuel cells with 107 units. Other fuel cell trials are takingplace in African countries such as those with Diverse Energy in Botswana.
The Advantage of Fuel Cells
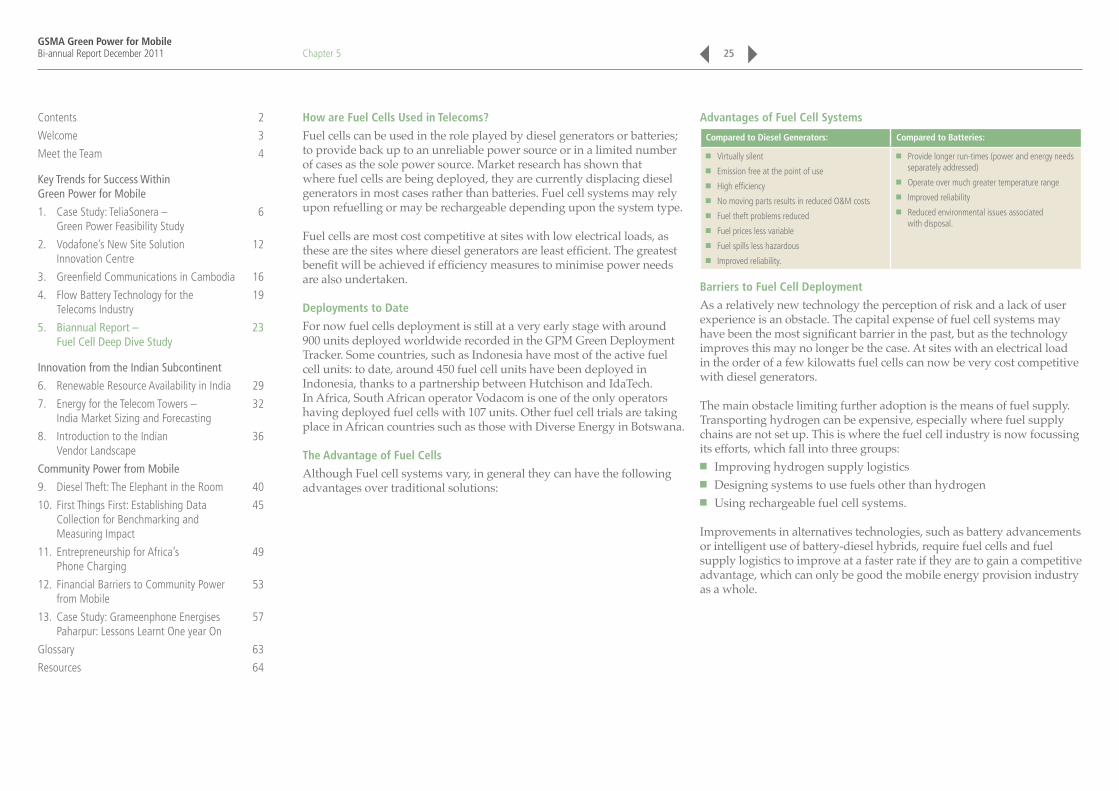
Although Fuel cell systems vary, in general they can have the following advantages over traditional solutions:
Advantages of Fuel Cell Systems
Compared to Diesel Generators: Compared to Batteries:
Virtually silent
Emission free at the point of use
High efficiency
No moving parts results in reduced O&M costs
Fuel theft problems reduced
Fuel prices less variable
Fuel spills less hazardous
Improved reliability.
Provide longer run-times (power and energy needs separately addressed)
Operate over much greater temperature range
Improved reliability
Reduced environmental issues associated with disposal.
Barriers to Fuel Cell Deployment
As a relatively new technology the perception of risk and a lack of user experience is an obstacle. The capital expense of fuel cell systems may have been the most significant barrier in the past, but as the technology improves this may no longer be the case. At sites with an electrical load in the order of a few kilowatts fuel cells can now be very cost competitive with diesel generators.
The main obstacle limiting further adoption is the means of fuel supply. Transporting hydrogen can be expensive, especially where fuel supply chains are not set up. This is where the fuel cell industry is now focussing its efforts, which fall into three groups:
■ Improving hydrogen supply logistics ■ Designing systems to use fuels other than hydrogen ■ Using rechargeable fuel cell systems.
Improvements in alternatives technologies, such as battery advancements or intelligent use of battery-diesel hybrids, require fuel cells and fuel supply logistics to improve at a faster rate if they are to gain a competitive advantage, which can only be good the mobile energy provision industry as a whole.
Chapter 5 25
Contents 2
Welcome 3
Meet the Team 4
Key Trends for Success Within Green Power for Mobile
1. Case Study: TeliaSonera – 6 Green Power Feasibility Study
2. Vodafone’s New Site Solution 12 Innovation Centre
3. Greenfield Communications in Cambodia 16
4. Flow Battery Technology for the 19 Telecoms Industry
5. Biannual Report – 23 Fuel Cell Deep Dive Study
Innovation from the Indian Subcontinent
6. Renewable Resource Availability in India 29
7. Energy for the Telecom Towers – 32 India Market Sizing and Forecasting
8. Introduction to the Indian 36 Vendor Landscape
Community Power from Mobile
9. Diesel Theft: The Elephant in the Room 40
10. First Things First: Establishing Data 45 Collection for Benchmarking and Measuring Impact
11. Entrepreneurship for Africa’s 49 Phone Charging
12. Financial Barriers to Community Power 53 from Mobile
13. Case Study: Grameenphone Energises 57 Paharpur: Lessons Learnt One year On
Glossary 63
Resources 64
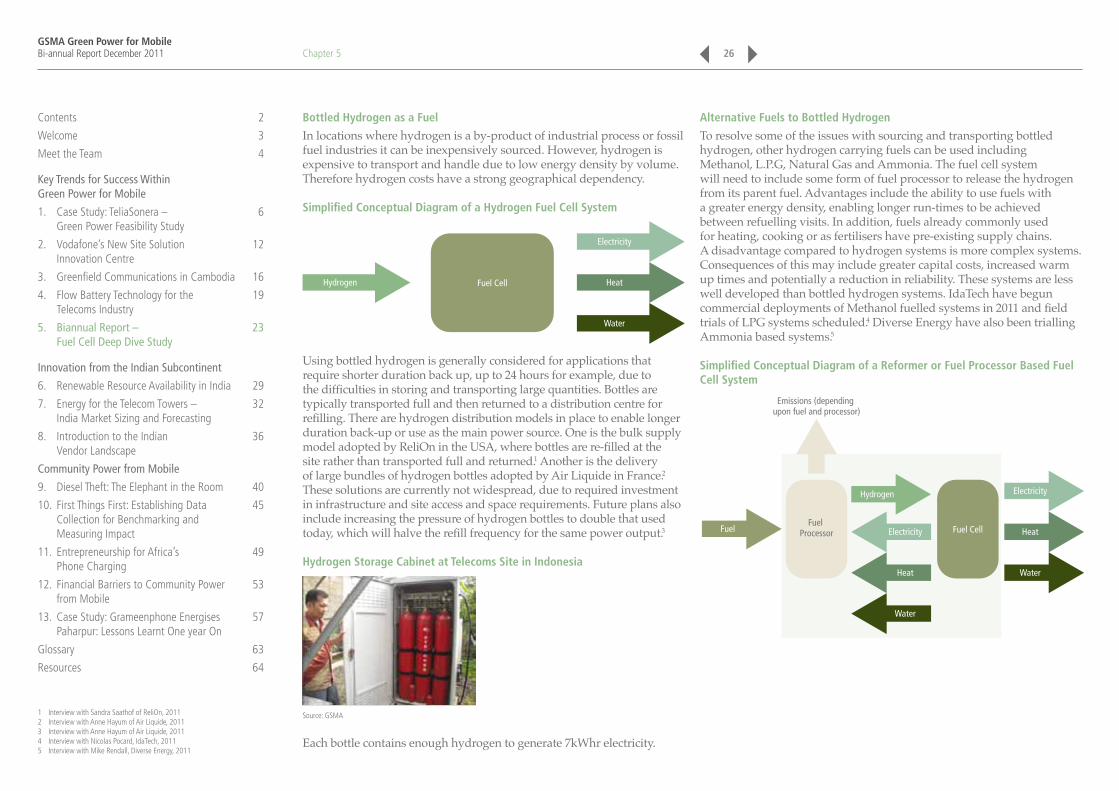
GSMA Green Power for MobileBi-annual Report December 2011
Bottled Hydrogen as a Fuel
In locations where hydrogen is a by-product of industrial process or fossil fuel industries it can be inexpensively sourced. However, hydrogen is expensive to transport and handle due to low energy density by volume. Therefore hydrogen costs have a strong geographical dependency.
Simplified Conceptual Diagram of a Hydrogen Fuel Cell System
Hydrogen HeatFuel Cell
Electricity
Water
Using bottled hydrogen is generally considered for applications that require shorter duration back up, up to 24 hours for example, due to the difficulties in storing and transporting large quantities. Bottles are typically transported full and then returned to a distribution centre for refilling. There are hydrogen distribution models in place to enable longer duration back-up or use as the main power source. One is the bulk supply model adopted by ReliOn in the USA, where bottles are re-filled at the site rather than transported full and returned.1 Another is the delivery of large bundles of hydrogen bottles adopted by Air Liquide in France.2 These solutions are currently not widespread, due to required investment in infrastructure and site access and space requirements. Future plans also include increasing the pressure of hydrogen bottles to double that used today, which will halve the refill frequency for the same power output.3
Hydrogen Storage Cabinet at Telecoms Site in Indonesia
Source: GSMA
Each bottle contains enough hydrogen to generate 7kWhr electricity.
Alternative Fuels to Bottled Hydrogen
To resolve some of the issues with sourcing and transporting bottled hydrogen, other hydrogen carrying fuels can be used including Methanol, L.P.G, Natural Gas and Ammonia. The fuel cell system will need to include some form of fuel processor to release the hydrogen from its parent fuel. Advantages include the ability to use fuels with a greater energy density, enabling longer run-times to be achieved between refuelling visits. In addition, fuels already commonly used for heating, cooking or as fertilisers have pre-existing supply chains.A disadvantage compared to hydrogen systems is more complex systems. Consequences of this may include greater capital costs, increased warm up times and potentially a reduction in reliability. These systems are less well developed than bottled hydrogen systems. IdaTech have begun commercial deployments of Methanol fuelled systems in 2011 and field trials of LPG systems scheduled.4 Diverse Energy have also been trialling Ammonia based systems.5
Simplified Conceptual Diagram of a Reformer or Fuel Processor Based Fuel Cell System
HeatFuel Fuel Cell
Emissions (depending upon fuel and processor)
ElectricityHydrogen
WaterHeat
Electricity
Water
Fuel Processor
Chapter 5 26
1 Interview with Sandra Saathof of ReliOn, 20112 Interview with Anne Hayum of Air Liquide, 20113 Interview with Anne Hayum of Air Liquide, 20114 Interview with Nicolas Pocard, IdaTech, 20115 Interview with Mike Rendall, Diverse Energy, 2011
Contents 2
Welcome 3
Meet the Team 4
Key Trends for Success Within Green Power for Mobile
1. Case Study: TeliaSonera – 6 Green Power Feasibility Study
2. Vodafone’s New Site Solution 12 Innovation Centre
3. Greenfield Communications in Cambodia 16
4. Flow Battery Technology for the 19 Telecoms Industry
5. Biannual Report – 23 Fuel Cell Deep Dive Study
Innovation from the Indian Subcontinent
6. Renewable Resource Availability in India 29
7. Energy for the Telecom Towers – 32 India Market Sizing and Forecasting
8. Introduction to the Indian 36 Vendor Landscape
Community Power from Mobile
9. Diesel Theft: The Elephant in the Room 40
10. First Things First: Establishing Data 45 Collection for Benchmarking and Measuring Impact
11. Entrepreneurship for Africa’s 49 Phone Charging
12. Financial Barriers to Community Power 53 from Mobile
13. Case Study: Grameenphone Energises 57 Paharpur: Lessons Learnt One year On
Glossary 63
Resources 64

GSMA Green Power for MobileBi-annual Report December 2011
Rechargeable Fuel Cells
Rechargeable fuel cells can use excess energy from another power source, such as an unreliable grid or renewable source to electrolyse water to produce hydrogen which is then stored until it is required. Round trip efficiencies of around 30% are much lower than for batteries, but there is the advantage of being able to separate power needs from energy needs. If longer duration backup is required more hydrogen storage tanks are needed not more fuel cells, assuming the hydrogen can be replenished at a sufficiently high rate. Electro PS have commercially deployed these systems in unreliable grid situations.1 There is interest in using rechargeable fuel cells in hybrid systems with renewable energy sources and GPM are aware of a small number of field trials but no commercial deployments.
Simplified Conceptual Diagram of a Rechargeable Fuel Cell System
Heat
Electricity
Water Water
Hydrogen
Electricity Fuel CellElectrolyser
Fuel Cell System Vendors
The leading fuel cell stack manufacturer is the Canadian company Ballard, who supply stacks to many of the fuel cell system vendors operating in the telecom space. Therefore the differentiating features normally arise in the system integration and auxiliary components included. However where vendors source stacks from other providers they are able to offer other features, such as extended stack lifetime warrantees.
Chapter 5 27
1 Interview with Marco Politi, Electro PS, 2011
Contents 2
Welcome 3
Meet the Team 4
Key Trends for Success Within Green Power for Mobile
1. Case Study: TeliaSonera – 6 Green Power Feasibility Study
2. Vodafone’s New Site Solution 12 Innovation Centre
3. Greenfield Communications in Cambodia 16
4. Flow Battery Technology for the 19 Telecoms Industry
5. Biannual Report – 23 Fuel Cell Deep Dive Study
Innovation from the Indian Subcontinent
6. Renewable Resource Availability in India 29
7. Energy for the Telecom Towers – 32 India Market Sizing and Forecasting
8. Introduction to the Indian 36 Vendor Landscape
Community Power from Mobile
9. Diesel Theft: The Elephant in the Room 40
10. First Things First: Establishing Data 45 Collection for Benchmarking and Measuring Impact
11. Entrepreneurship for Africa’s 49 Phone Charging
12. Financial Barriers to Community Power 53 from Mobile
13. Case Study: Grameenphone Energises 57 Paharpur: Lessons Learnt One year On
Glossary 63
Resources 64

GSMA Green Power for MobileBi-annual Report December 2011
Example Fuel Cell Systems Targeted at Telecoms
Application Manufacturer(s) Product(s) Fuel Reason Feedstock is Suitable for Application
Emergency back-up power Electro PS
IdaTech
ReliOn
M-field
Various Bottled Hydrogen Infrequent use and short run times do not preclude delivering hydrogen to site.
No fuel processor minimises CAPEX.
Extended run back-up power IdaTech ElectraGen ME System Methanol-Water Liquid fuel suitable for extended run times compared to hydrogen.
Rechargeable back up power Electro PS ElectroSelf Water and electricity Electrolyser allows system to be self-recharging provided sufficient excess power is available.
Primary power source IdaTech
Diverse Energy
iGen LP System
PowerCube
LPG
Anhydrous Ammonia
Fuel can be practically stored to enable run times comparable with diesel generators and is readily available.
Data sheets for all products available online
Are Fuel Cell Systems “Green”?
At the point of use fuel cells emit no or low carbon dioxide, depending on the system type. There are other local environmental benefits compared to diesel generators, such as reduction in noise and other pollution such as particulate matter, nitrogen and sulphur oxides. Environmental benefits compared to batteries stem from eliminating the potentially frequent disposal of batteries, which can be a particular problem in developing countries.
Whether fuel cells can be considered greener than alternatives on a life-cycle basis is not a simple question to answer. It depends on how the fuels are produced and transported and what the alternatives are. Producing hydrogen can be energy and carbon intensive and transportation is more challenging than for liquid fuels and this stage may also involve significant additional emissions. However hydrogen is often produced as a bi-product of industrial processes which is normally taken into consideration for carbon accounting purposes. Estimates made by GPM in this study show that while not emission free, significant carbon savings can be achieved using fuel cells operating on a variety of different fuels when compared to a diesel generator, particularly at low power load sites.
Despite these issues hydrogen is considered by many to be an important energy vector of a low carbon future. It can be produced using renewables or nuclear power and there are plentiful sources of hydrogen carrying compounds, reducing reliance on fossil fuels. Therefore in the future, with greener hydrogen supply chains in place fuel cells will have a greater emission reduction impact.
GPM Fuel Cell White Paper
The forthcoming White Paper expands on the issues raised above and also includes the following:Indonesia case study. This considers the types of systems deployed and the motivations for doing so, along with experience gained on dealing with fuel supply logistics and operating with local partners.
Technical and economic modelling. Results presented from the study using HOMER software, showing how different fuel cell systems perform compared with alternatives.
Fuel cell system types and applications. Whether a base station is off-grid, connected to an unreliable grid and how often and long power outages occur are among the criteria used to select a suitable fuel cell system.
Future technology evolution. Discussion on how costs and performance are expected to change in the coming years and what the impacts may be on mobile network energy provision.
The White Paper will be published in early 2012.
Mark Crouch is currently completing a Masters in Sustainable Energy Futures at Imperial College London. He has been working with the GSMA for the past 6 months to establish the role of Fuel Cells in the Industry.
Chapter 5 28
Contents 2
Welcome 3
Meet the Team 4
Key Trends for Success Within Green Power for Mobile
1. Case Study: TeliaSonera – 6 Green Power Feasibility Study
2. Vodafone’s New Site Solution 12 Innovation Centre
3. Greenfield Communications in Cambodia 16
4. Flow Battery Technology for the 19 Telecoms Industry
5. Biannual Report – 23 Fuel Cell Deep Dive Study
Innovation from the Indian Subcontinent
6. Renewable Resource Availability in India 29
7. Energy for the Telecom Towers – 32 India Market Sizing and Forecasting
8. Introduction to the Indian 36 Vendor Landscape
Community Power from Mobile
9. Diesel Theft: The Elephant in the Room 40
10. First Things First: Establishing Data 45 Collection for Benchmarking and Measuring Impact
11. Entrepreneurship for Africa’s 49 Phone Charging
12. Financial Barriers to Community Power 53 from Mobile
13. Case Study: Grameenphone Energises 57 Paharpur: Lessons Learnt One year On
Glossary 63
Resources 64

GSMA Green Power for MobileBi-annual Report December 2011 29
Chapter 6Renewable Resource Availability in India
By Michael Nique, GSMA
Contents 2
Welcome 3
Meet the Team 4
Key Trends for Success Within Green Power for Mobile
1. Case Study: TeliaSonera – 6 Green Power Feasibility Study
2. Vodafone’s New Site Solution 12 Innovation Centre
3. Greenfield Communications in Cambodia 16
4. Flow Battery Technology for the 19 Telecoms Industry
5. Biannual Report – 23 Fuel Cell Deep Dive Study
Innovation from the Indian Subcontinent
6. Renewable Resource Availability in India 29
7. Energy for the Telecom Towers – 32 India Market Sizing and Forecasting
8. Introduction to the Indian 36 Vendor Landscape
Community Power from Mobile
9. Diesel Theft: The Elephant in the Room 40
10. First Things First: Establishing Data 45 Collection for Benchmarking and Measuring Impact
11. Entrepreneurship for Africa’s 49 Phone Charging
12. Financial Barriers to Community Power 53 from Mobile
13. Case Study: Grameenphone Energises 57 Paharpur: Lessons Learnt One year On
Glossary 63
Resources 64

GSMA Green Power for MobileBi-annual Report December 2011
In July 2011, The Green Power for Mobile team published maps on the availability of natural resources in India. Solar irradiance and wind power have been mapped out based on datasets collected from the Ministry of New and Renewable Energy and NASA Surface Meteorology. The GSM coverage, as communicated by mobile operators, was also plotted on the map.
In India, solar enjoys a strategic advantage over wind turbine technology in its ability to be deployed with fewer feasibility studies. Existing solar maps provided by sources such as NASA are precise enough to accurately predict solar resources to ensure sites are economically viable. Moreover, most parts of India receive good solar radiation (4-7 kWh/sq.m), bringing solar solutions out on top for reducing the consumption of diesel and kerosene for lighting and power generation.
Solar Radiation in India
kWh/m2
Gujarat
Rajasthan
Karnataka
AndhraPradesh
Madhya Pradesh
UttarPradesh
106
5349
39623
1072
Orissa
4426
87
304
2300289
20
6.6-6,46.4-6,26.2-6,06.0-5,85.8-5,65.6-5,45.4-5,25.2-5,05.0-4,84.8-4,64.6-4,4
Source: MNRE
The wind power for the Indian subcontinent is less often implemented, with average wind speeds being very moderate, sometimes bordering on impractically low. Sites with average wind speeds in excess of 3m/s may possibly be considered with an additional wind generator, but a lower limit of 5m/s would increase the likelihood of achieving more than 1kWh per day. At 10m/s, the entire system load could be handled by wind power alone, but less than 10% of the Indian sites are expected to have such favourable wind resources available.1
Wind Resources Availability in India2
Source: GSMA
Chapter 6 30
1 Source: VNL White Paper The Solar Imperative2 Wind Speed At 50m Above The Surface Of The Earth
(NASA Surface Meteorology and Solar Energy), 2005
Contents 2
Welcome 3
Meet the Team 4
Key Trends for Success Within Green Power for Mobile
1. Case Study: TeliaSonera – 6 Green Power Feasibility Study
2. Vodafone’s New Site Solution 12 Innovation Centre
3. Greenfield Communications in Cambodia 16
4. Flow Battery Technology for the 19 Telecoms Industry
5. Biannual Report – 23 Fuel Cell Deep Dive Study
Innovation from the Indian Subcontinent
6. Renewable Resource Availability in India 29
7. Energy for the Telecom Towers – 32 India Market Sizing and Forecasting
8. Introduction to the Indian 36 Vendor Landscape
Community Power from Mobile
9. Diesel Theft: The Elephant in the Room 40
10. First Things First: Establishing Data 45 Collection for Benchmarking and Measuring Impact
11. Entrepreneurship for Africa’s 49 Phone Charging
12. Financial Barriers to Community Power 53 from Mobile
13. Case Study: Grameenphone Energises 57 Paharpur: Lessons Learnt One year On
Glossary 63
Resources 64
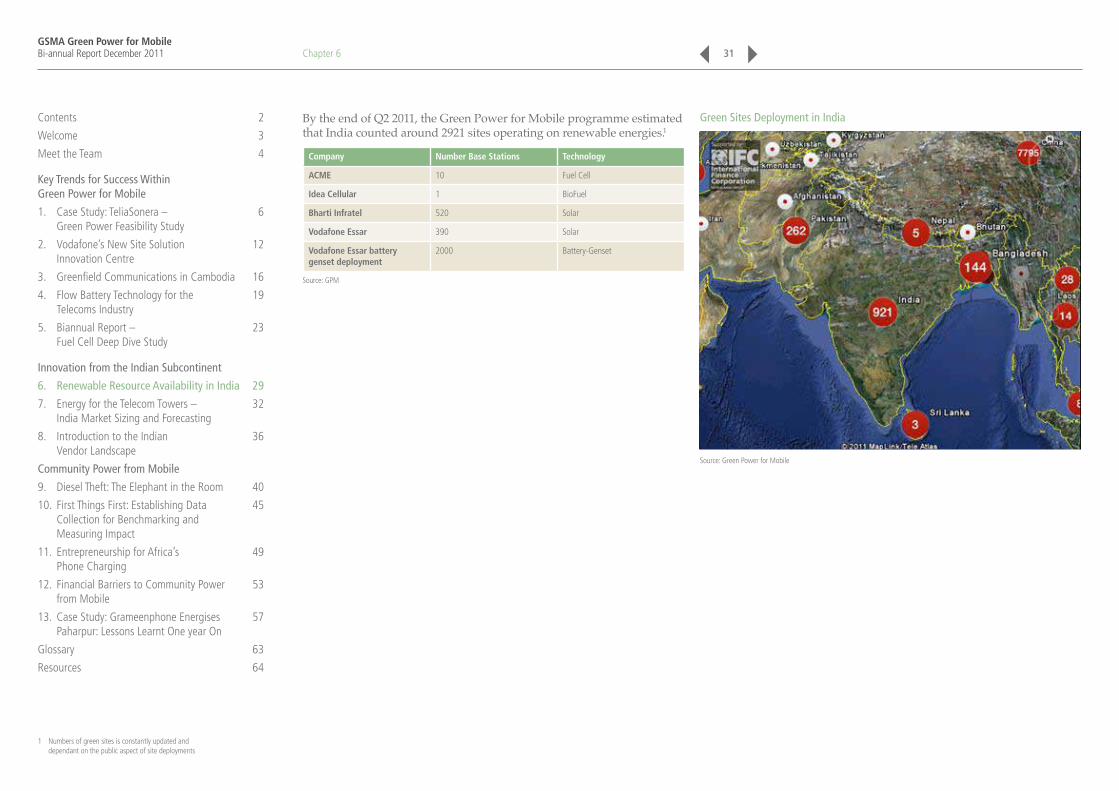
GSMA Green Power for MobileBi-annual Report December 2011
By the end of Q2 2011, the Green Power for Mobile programme estimated that India counted around 2921 sites operating on renewable energies.1
Company Number Base Stations Technology
ACME 10 Fuel Cell
Idea Cellular 1 BioFuel
Bharti Infratel 520 Solar
Vodafone Essar 390 Solar
Vodafone Essar battery genset deployment
2000 Battery-Genset
Source: GPM
Green Sites Deployment in India
Source: Green Power for Mobile
Chapter 6 31
1 Numbers of green sites is constantly updated and dependant on the public aspect of site deployments
Contents 2
Welcome 3
Meet the Team 4
Key Trends for Success Within Green Power for Mobile
1. Case Study: TeliaSonera – 6 Green Power Feasibility Study
2. Vodafone’s New Site Solution 12 Innovation Centre
3. Greenfield Communications in Cambodia 16
4. Flow Battery Technology for the 19 Telecoms Industry
5. Biannual Report – 23 Fuel Cell Deep Dive Study
Innovation from the Indian Subcontinent
6. Renewable Resource Availability in India 29
7. Energy for the Telecom Towers – 32 India Market Sizing and Forecasting
8. Introduction to the Indian 36 Vendor Landscape
Community Power from Mobile
9. Diesel Theft: The Elephant in the Room 40
10. First Things First: Establishing Data 45 Collection for Benchmarking and Measuring Impact
11. Entrepreneurship for Africa’s 49 Phone Charging
12. Financial Barriers to Community Power 53 from Mobile
13. Case Study: Grameenphone Energises 57 Paharpur: Lessons Learnt One year On
Glossary 63
Resources 64

GSMA Green Power for MobileBi-annual Report December 2011 32
Chapter 7Energy for the Telecom Towers – India Market Sizing and Forecasting
By Michael Nique, GSMA
Contents 2
Welcome 3
Meet the Team 4
Key Trends for Success Within Green Power for Mobile
1. Case Study: TeliaSonera – 6 Green Power Feasibility Study
2. Vodafone’s New Site Solution 12 Innovation Centre
3. Greenfield Communications in Cambodia 16
4. Flow Battery Technology for the 19 Telecoms Industry
5. Biannual Report – 23 Fuel Cell Deep Dive Study
Innovation from the Indian Subcontinent
6. Renewable Resource Availability in India 29
7. Energy for the Telecom Towers – 32 India Market Sizing and Forecasting
8. Introduction to the Indian 36 Vendor Landscape
Community Power from Mobile
9. Diesel Theft: The Elephant in the Room 40
10. First Things First: Establishing Data 45 Collection for Benchmarking and Measuring Impact
11. Entrepreneurship for Africa’s 49 Phone Charging
12. Financial Barriers to Community Power 53 from Mobile
13. Case Study: Grameenphone Energises 57 Paharpur: Lessons Learnt One year On
Glossary 63
Resources 64
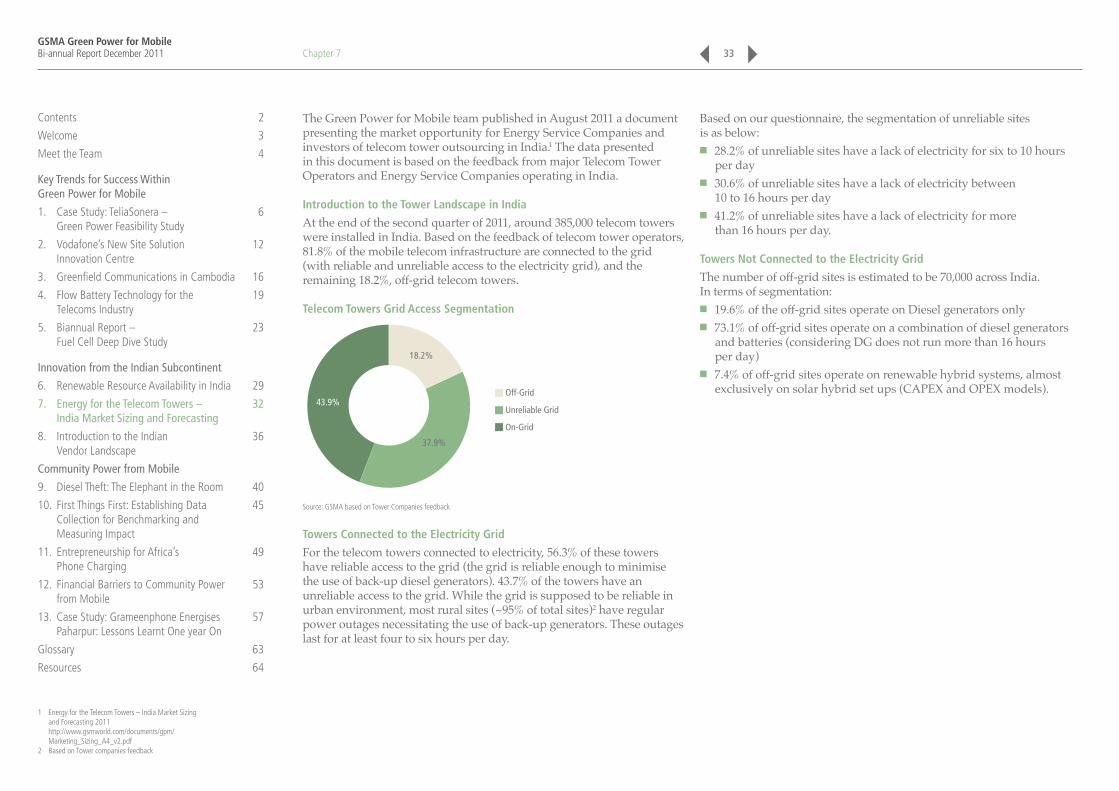
GSMA Green Power for MobileBi-annual Report December 2011
The Green Power for Mobile team published in August 2011 a document presenting the market opportunity for Energy Service Companies and investors of telecom tower outsourcing in India.1 The data presented in this document is based on the feedback from major Telecom Tower Operators and Energy Service Companies operating in India.
Introduction to the Tower Landscape in India
At the end of the second quarter of 2011, around 385,000 telecom towers were installed in India. Based on the feedback of telecom tower operators, 81.8% of the mobile telecom infrastructure are connected to the grid (with reliable and unreliable access to the electricity grid), and the remaining 18.2%, off-grid telecom towers.
Telecom Towers Grid Access Segmentation
Off-Grid
Unreliable Grid
On-Grid
18.2%
43.9%
37.9%
Source: GSMA based on Tower Companies feedback
Towers Connected to the Electricity Grid
For the telecom towers connected to electricity, 56.3% of these towers have reliable access to the grid (the grid is reliable enough to minimise the use of back-up diesel generators). 43.7% of the towers have an unreliable access to the grid. While the grid is supposed to be reliable in urban environment, most rural sites (~95% of total sites)2 have regular power outages necessitating the use of back-up generators. These outages last for at least four to six hours per day.
Based on our questionnaire, the segmentation of unreliable sites is as below:
■ 28.2% of unreliable sites have a lack of electricity for six to 10 hours per day
■ 30.6% of unreliable sites have a lack of electricity between 10 to 16 hours per day
■ 41.2% of unreliable sites have a lack of electricity for more than 16 hours per day.
Towers Not Connected to the Electricity Grid
The number of off-grid sites is estimated to be 70,000 across India. In terms of segmentation:
■ 19.6% of the off-grid sites operate on Diesel generators only ■ 73.1% of off-grid sites operate on a combination of diesel generators
and batteries (considering DG does not run more than 16 hours per day)
■ 7.4% of off-grid sites operate on renewable hybrid systems, almost exclusively on solar hybrid set ups (CAPEX and OPEX models).
Chapter 7 33
1 Energy for the Telecom Towers – India Market Sizing and Forecasting 2011
http://www.gsmworld.com/documents/gpm/Marketing_Sizing_A4_v2.pdf
2 Based on Tower companies feedback
Contents 2
Welcome 3
Meet the Team 4
Key Trends for Success Within Green Power for Mobile
1. Case Study: TeliaSonera – 6 Green Power Feasibility Study
2. Vodafone’s New Site Solution 12 Innovation Centre
3. Greenfield Communications in Cambodia 16
4. Flow Battery Technology for the 19 Telecoms Industry
5. Biannual Report – 23 Fuel Cell Deep Dive Study
Innovation from the Indian Subcontinent
6. Renewable Resource Availability in India 29
7. Energy for the Telecom Towers – 32 India Market Sizing and Forecasting
8. Introduction to the Indian 36 Vendor Landscape
Community Power from Mobile
9. Diesel Theft: The Elephant in the Room 40
10. First Things First: Establishing Data 45 Collection for Benchmarking and Measuring Impact
11. Entrepreneurship for Africa’s 49 Phone Charging
12. Financial Barriers to Community Power 53 from Mobile
13. Case Study: Grameenphone Energises 57 Paharpur: Lessons Learnt One year On
Glossary 63
Resources 64
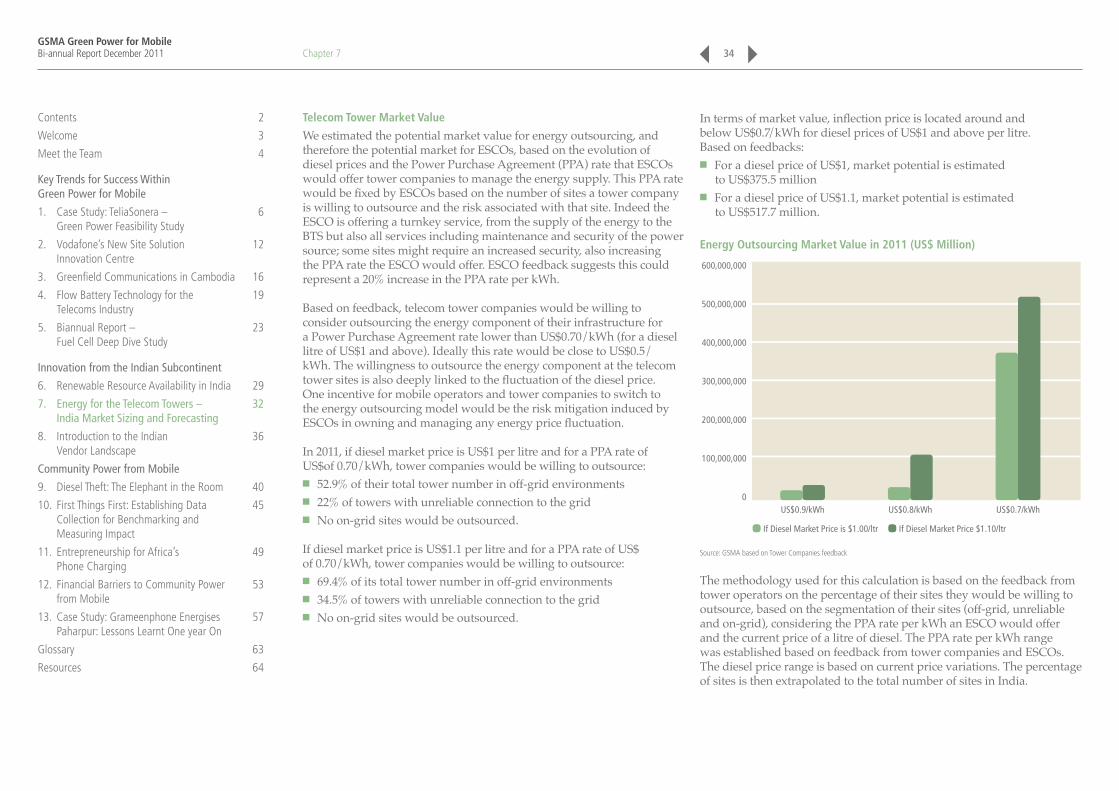
GSMA Green Power for MobileBi-annual Report December 2011
Telecom Tower Market Value
We estimated the potential market value for energy outsourcing, and therefore the potential market for ESCOs, based on the evolution of diesel prices and the Power Purchase Agreement (PPA) rate that ESCOs would offer tower companies to manage the energy supply. This PPA rate would be fixed by ESCOs based on the number of sites a tower company is willing to outsource and the risk associated with that site. Indeed the ESCO is offering a turnkey service, from the supply of the energy to the BTS but also all services including maintenance and security of the power source; some sites might require an increased security, also increasing the PPA rate the ESCO would offer. ESCO feedback suggests this could represent a 20% increase in the PPA rate per kWh.
Based on feedback, telecom tower companies would be willing to consider outsourcing the energy component of their infrastructure for a Power Purchase Agreement rate lower than US$0.70/kWh (for a diesel litre of US$1 and above). Ideally this rate would be close to US$0.5/kWh. The willingness to outsource the energy component at the telecom tower sites is also deeply linked to the fluctuation of the diesel price. One incentive for mobile operators and tower companies to switch to the energy outsourcing model would be the risk mitigation induced by ESCOs in owning and managing any energy price fluctuation.
In 2011, if diesel market price is US$1 per litre and for a PPA rate of US$of 0.70/kWh, tower companies would be willing to outsource:
■ 52.9% of their total tower number in off-grid environments ■ 22% of towers with unreliable connection to the grid ■ No on-grid sites would be outsourced.
If diesel market price is US$1.1 per litre and for a PPA rate of US$ of 0.70/kWh, tower companies would be willing to outsource:
■ 69.4% of its total tower number in off-grid environments ■ 34.5% of towers with unreliable connection to the grid ■ No on-grid sites would be outsourced.
In terms of market value, inflection price is located around and below US$0.7/kWh for diesel prices of US$1 and above per litre. Based on feedbacks:
■ For a diesel price of US$1, market potential is estimated to US$375.5 million
■ For a diesel price of US$1.1, market potential is estimated to US$517.7 million.
Energy Outsourcing Market Value in 2011 (US$ Million)
US$0.8/kWh US$0.7/kWhUS$0.9/kWh
If Diesel Market Price is $1.00/ltr
600,000,000
500,000,000
400,000,000
300,000,000
200,000,000
100,000,000
0
If Diesel Market Price $1.10/ltr
Source: GSMA based on Tower Companies feedback
The methodology used for this calculation is based on the feedback from tower operators on the percentage of their sites they would be willing to outsource, based on the segmentation of their sites (off-grid, unreliable and on-grid), considering the PPA rate per kWh an ESCO would offer and the current price of a litre of diesel. The PPA rate per kWh range was established based on feedback from tower companies and ESCOs. The diesel price range is based on current price variations. The percentage of sites is then extrapolated to the total number of sites in India.
Chapter 7 34
Contents 2
Welcome 3
Meet the Team 4
Key Trends for Success Within Green Power for Mobile
1. Case Study: TeliaSonera – 6 Green Power Feasibility Study
2. Vodafone’s New Site Solution 12 Innovation Centre
3. Greenfield Communications in Cambodia 16
4. Flow Battery Technology for the 19 Telecoms Industry
5. Biannual Report – 23 Fuel Cell Deep Dive Study
Innovation from the Indian Subcontinent
6. Renewable Resource Availability in India 29
7. Energy for the Telecom Towers – 32 India Market Sizing and Forecasting
8. Introduction to the Indian 36 Vendor Landscape
Community Power from Mobile
9. Diesel Theft: The Elephant in the Room 40
10. First Things First: Establishing Data 45 Collection for Benchmarking and Measuring Impact
11. Entrepreneurship for Africa’s 49 Phone Charging
12. Financial Barriers to Community Power 53 from Mobile
13. Case Study: Grameenphone Energises 57 Paharpur: Lessons Learnt One year On
Glossary 63
Resources 64

GSMA Green Power for MobileBi-annual Report December 2011
Payback Period and IRR
In terms of financial viability for the OPEX model, the ESCO should look for a payback period of 3-4 years with a 15-20% Internal Rate of Return1 (IRR). Overall tower companies seem to be more interested in the perspectives of the OPEX model.
Forecast Telecom Tower Market in 2015
By 2015, GSMA estimates that the total number of towers will increase to 451.000; a 17% increase.
The growth of telecom towers is conservative as, based on feedback, off-grid towers would grow less than 5% in comparison to 2010.2 The main growth would come from on-grid and unreliable grid connected sites (>20%) built up by the need to increase 3G coverage and the extension of urban and semi-urban GSM coverage.
Tenancy ratio per site is viewed to increase from 1.55 in 2010 to 2.1 in 2015.
Telecom Tower Growth 2011-2015 (Number of Towers)
Unreliable Grid On-GridOff-Grid
Total Towers 2010
250,000
200,000
150,000
100,000
50,000
0
Total Towers 2015
The number of off-grid sites would grow by 2% to reach 71,400 sites across India. In terms of segmentation:
■ 0.9% of all sites would operate on diesel generator only – the number of pure diesel generator sources is rapidly decreasing due to their conversion to diesel battery hybrid sources
■ 79.5% are diesel generator and have batteries as back-up ■ 19.6% are renewable energies hybrid – mostly solar hybrid
and OPEX model.
Chapter 7 35
1 IRR is the Rate of Return of an Investment2 Estimation of 2% growth of off-grid telecom towers
between 2010 and 2015
Contents 2
Welcome 3
Meet the Team 4
Key Trends for Success Within Green Power for Mobile
1. Case Study: TeliaSonera – 6 Green Power Feasibility Study
2. Vodafone’s New Site Solution 12 Innovation Centre
3. Greenfield Communications in Cambodia 16
4. Flow Battery Technology for the 19 Telecoms Industry
5. Biannual Report – 23 Fuel Cell Deep Dive Study
Innovation from the Indian Subcontinent
6. Renewable Resource Availability in India 29
7. Energy for the Telecom Towers – 32 India Market Sizing and Forecasting
8. Introduction to the Indian 36 Vendor Landscape
Community Power from Mobile
9. Diesel Theft: The Elephant in the Room 40
10. First Things First: Establishing Data 45 Collection for Benchmarking and Measuring Impact
11. Entrepreneurship for Africa’s 49 Phone Charging
12. Financial Barriers to Community Power 53 from Mobile
13. Case Study: Grameenphone Energises 57 Paharpur: Lessons Learnt One year On
Glossary 63
Resources 64

GSMA Green Power for MobileBi-annual Report December 2011 36
Chapter 8Introduction to the Indian Vendor Landscape
By Michael Nique, GSMA
Contents 2
Welcome 3
Meet the Team 4
Key Trends for Success Within Green Power for Mobile
1. Case Study: TeliaSonera – 6 Green Power Feasibility Study
2. Vodafone’s New Site Solution 12 Innovation Centre
3. Greenfield Communications in Cambodia 16
4. Flow Battery Technology for the 19 Telecoms Industry
5. Biannual Report – 23 Fuel Cell Deep Dive Study
Innovation from the Indian Subcontinent
6. Renewable Resource Availability in India 29
7. Energy for the Telecom Towers – 32 India Market Sizing and Forecasting
8. Introduction to the Indian 36 Vendor Landscape
Community Power from Mobile
9. Diesel Theft: The Elephant in the Room 40
10. First Things First: Establishing Data 45 Collection for Benchmarking and Measuring Impact
11. Entrepreneurship for Africa’s 49 Phone Charging
12. Financial Barriers to Community Power 53 from Mobile
13. Case Study: Grameenphone Energises 57 Paharpur: Lessons Learnt One year On
Glossary 63
Resources 64

GSMA Green Power for MobileBi-annual Report December 2011
Indian Vendor/Energy Service Company Landscape
As part of our efforts to better understand the potential of green solutions for the Mobile Telecom Market in India, the Green Power for Mobile team published in August 2011 a document on the Vendors/ESCOs Landscape in India. This analysis has been based on the current knowledge of the Indian Market as well as publically available information from vendors, tower companies and mobile operators.
Introduction to the Indian Mobile Telecom Market
The Indian mobile telecom sector has witnessed unparalleled growth in the last decade. By mid-2011, there were more than 850 million mobile subscribers in India which represents a market penetration of 68.6 %. This is close to the mobile penetration in the Asia Pacific region which is currently around 73%. The mobile market in India is still one of the most dynamic worldwide, with a growth rate of close to 45% (year on year) in 2010.
Growth of Mobile Connections in India
2007 2008 2009 20112010
900
800
700
600
500
400
300
200
100
0
Mobile Connections
Source: Wireless Intelligence
By the second quarter of 2012, the total Indian mobile connections base is expected to reach over one billion, driven by a rise in the demand for communications in semi-urban and rural India. In India, where around 70% of the population live in rural areas, there is a major divide between the numbers of subscribers in urban to rural areas. The untapped rural market is estimated at 400 million people1 who live in areas covered by a GSM signal but who do not own a mobile phone. While the percentage of the population covered by mobile networks has been steadily growing since the turn of the century – to up to 75% of the population in 20102 – the mobile penetration is still lagging behind in rural areas – ~40% in 2010.
Several factors could explain a lower penetration: ■ A lot of rural inhabitants do not have access or only unreliable
access to the electricity grid, which is a clear barrier to mobile phone charging and general well living conditions
■ In a country where 25% of the population lives below the poverty line,3 the cost of mobile phone ownership remains too high.
Blended ARPU Decrease in India (EUR)
2007 2008 2009 20112010
6
5
4
3
2
1
0
ARPU
Source: Wireless Intelligence
Chapter 8 37
1 Source: GSMA2 Source: GSMA based on GIS methodology3 Source UN
Contents 2
Welcome 3
Meet the Team 4
Key Trends for Success Within Green Power for Mobile
1. Case Study: TeliaSonera – 6 Green Power Feasibility Study
2. Vodafone’s New Site Solution 12 Innovation Centre
3. Greenfield Communications in Cambodia 16
4. Flow Battery Technology for the 19 Telecoms Industry
5. Biannual Report – 23 Fuel Cell Deep Dive Study
Innovation from the Indian Subcontinent
6. Renewable Resource Availability in India 29
7. Energy for the Telecom Towers – 32 India Market Sizing and Forecasting
8. Introduction to the Indian 36 Vendor Landscape
Community Power from Mobile
9. Diesel Theft: The Elephant in the Room 40
10. First Things First: Establishing Data 45 Collection for Benchmarking and Measuring Impact
11. Entrepreneurship for Africa’s 49 Phone Charging
12. Financial Barriers to Community Power 53 from Mobile
13. Case Study: Grameenphone Energises 57 Paharpur: Lessons Learnt One year On
Glossary 63
Resources 64
GSMA Green Power for MobileBi-annual Report December 2011
Revenues of the Indian telecom industry were estimated at US$26 billion in 2008 and are projected to reach US$45 billion by 2012. At the second quarter of 2011, blended ARPU was estimated at EUR2.36,1 but has decreased by half over the past four years. This decrease of ARPU is mitigated by the overall growth of subscriber base, contributing to a steady revenue growth. Together with this, declining tariffs are compensated by an increase in the Minutes of Usage (MoU). India also has one of the highest Minute per User rates per month in the world – 340 minutes in 2Q2011.
Outsourcing the Telecom Infrastructure
The rapid growth of the Indian wireless market led to the search for more efficient solutions and business models that will preserve operators’ margins and competitiveness. Initiatives such as network cost optimisation, outsourcing of non-core activities, as well as low-cost business models then began gaining more traction in India. Since 2007, operators have been realising efficiencies through extensive outsourcing across the telecom value chain. By separating infrastructure elements such as towers into separate entities, significant investments have been preserved, and the Indian mobile industry and its customers have benefitted from the sharing of passive infrastructure, reducing the cost burden of each operator and speeding the rollout of mobile services. India has now become a leader in sharing network infrastructure. As network costs typically represent between 15% – 25% of OPEX and 75% – 80% of CAPEX, the benefits of network sharing are obvious. Today, the tower industry continues to grow supported actively by the Government in India.2
Telecom tower companies in India could be segmented into three types. ■ Tower companies formed through joint ventures like Indus Towers
Limited; joint venture between Bharti Airtel, Vodafone Essar and Idea Cellular
■ Tower companies formed though de-mergers such as Bharti Infratel and Reliance Infratel, which are wholly owned subsidiaries of Bharti Airtel and Reliance Communications respectively
■ Independent tower companies such as GTL.
At mid-2011, there were around 385,000 towers across India. Of these towers, up to 75% are owned by tower operators, 25% remaining the property of mobile operators. It remains to be seen how the telecom tower industry will grow in the next years. The GSMA estimates that more than 450,000 towers should be in operation by 2015. However, the difficult financial situation of tower companies might retard further deployments as “rising running costs, rampant diesel pilferage and taxes are taking their toll on the cash flows of the country’s debt-laden telecom tower business”.3 In fact, most of these new towers would be located in rural areas where energy supplies (both electricity and fuels) are in short supply and diesel theft, increasing difficulties for telecom towers to preserve margins. To meet these as well as other challenges, the passive infrastructure companies and suppliers are increasingly turning to “Green Technologies” either to make power available in a location where this is a challenge or to make existing towers in rural areas become more efficient.
Energy Situation in India
According to the Planning Commission of India statistics, the overall electrification rate in India is about 63%. Urban areas in India are typically very well connected to the electricity grid, even though they experience frequent power outages. Rural households, on the other hand, suffer from low electrification levels and according to the data from the Ministry of Power, Government of India (as described in the Rajiv Gandhi Grameen Vidyutikaran Yojana, RGVVY’s documents), about 44% of rural households in India are electrified.
Chapter 8
1 Source: Wireless Intelligence2 Recent online article published in Sept 20103 Deepali Gupta, ET Bureau – What is Hurting
Telecom Tower Business – Oct 2011 – http://articles.timesofindia.indiatimes.com/2011-10-24/infrastructure/30315880_1_standalone-tower-tower-companies-telecom-tower-business
38
Contents 2
Welcome 3
Meet the Team 4
Key Trends for Success Within Green Power for Mobile
1. Case Study: TeliaSonera – 6 Green Power Feasibility Study
2. Vodafone’s New Site Solution 12 Innovation Centre
3. Greenfield Communications in Cambodia 16
4. Flow Battery Technology for the 19 Telecoms Industry
5. Biannual Report – 23 Fuel Cell Deep Dive Study
Innovation from the Indian Subcontinent
6. Renewable Resource Availability in India 29
7. Energy for the Telecom Towers – 32 India Market Sizing and Forecasting
8. Introduction to the Indian 36 Vendor Landscape
Community Power from Mobile
9. Diesel Theft: The Elephant in the Room 40
10. First Things First: Establishing Data 45 Collection for Benchmarking and Measuring Impact
11. Entrepreneurship for Africa’s 49 Phone Charging
12. Financial Barriers to Community Power 53 from Mobile
13. Case Study: Grameenphone Energises 57 Paharpur: Lessons Learnt One year On
Glossary 63
Resources 64

GSMA Green Power for MobileBi-annual Report December 2011
Today, the opportunity to use renewable energy to power base stations, what we refer here as “Green Power for Mobile” is facing a strong dynamic in India. The key reason for the rapid expansion in the Indian market is the move into lower margin rural markets as a way to increase penetration as the average revenue per user has dwindled over the past few years in more mature markets.1 Furthermore, the recent solar feed-in tariffs created by the Indian government is raising awareness across the country of renewable energy solutions for electricity demands, though the impact of the programmes on the telecom base stations remains limited.
Another important difference in the Indian market compared to other off-grid mobile telecom markets, is that the economics of renewable energy solutions for tower companies is drastically different to that of single operator operated BTS. Tower companies can install solar sites with loads in the 5-6kW range and still make the systems economical for customers.
Today, around 60% of the power required for the total number of telecom towers in India is met by diesel generators. Consuming more than two billion litres of diesel per year, India’s Ministry of New and Renewable Energy has asked telecom companies to consider cleaner, more efficient alternatives and ways to cut their dependency on conventional fuels.2 Renewable energy offerings include solar panels, wind turbine technology, biomass and fuel cells. The most common technologies being used to supply off-grid BTS currently are solar and wind, with solar being the more prevalent technology.
Mobile operators and tower companies have begun to deploy such technologies. Indus Towers plans to set up 2,500 solar powered sites by end of 2011 and Bharti Infratel will rollout 1,500 solar powered sites in a similar timescale. Viom Networks, which currently runs more than 38,000 towers, expects to operate a large number of their off-grid sites using solar power. American Tower Corporation ran pilot tests in Pune, Maharashtra and was able to reduce its monthly costs of diesel generators by half in that area.
For more information on Vendors in the India Market, please view our Indian Vendor Directory.
The listing we are providing summarises the main vendors active in the Indian market. The main renewable solutions providers for telecom towers are Moser Baer (who has their own turnkey BTS division), Reliant Solar, Tata BP Solar, Nokia Siemens Networks, ACME Tele Power and Applied Solar Technology. Bharti Infratel, for example, has already installed 750 solar sites and is expected to deploy an additional 1500 over the next two years. These sites are being developed using Applied Solar Technologies (AST) as the preferred ESCO. Applied Solar, based in Delhi, is the most successful ESCO on the Indian Market, working with Bharti Infratel and Indus Tower. After raising money from the IFC in 2010, as of September 2011, Overseas Private Investment Corporation (OPIC), US government’s development finance institution which pools together private sector funds, confirmed the lending of US$150 million for a project to expand the use of solar energy to power telecommunication towers in India.
A number of the other tower companies in India also seem to be looking to use ESCO models. In addition, there is discussion in the market of a potential capital subsidy provided by the government of India. Such subsidy would have a significant impact on the growth and deployment of solar powered base stations.
Multinational companies noted that gaining traction in the Indian market has been difficult because of domestic Indian companies having local advantage due to their familiarity with the tower sharing model. The recent merger between Bharti Infratel and Zain suggests that the tower sharing model will gain market share in Africa as a number of companies are investigating this model.
Chapter 8
1 GPM Energy Service Company (ESCO) and Vendor Research – Energy Efficiency Finance Corp – October 2010
2 http://energyefficiency.coolerplanet.com/News/2011032401-indias-telecom-industry-pushes-green-energy.aspx
39
Contents 2
Welcome 3
Meet the Team 4
Key Trends for Success Within Green Power for Mobile
1. Case Study: TeliaSonera – 6 Green Power Feasibility Study
2. Vodafone’s New Site Solution 12 Innovation Centre
3. Greenfield Communications in Cambodia 16
4. Flow Battery Technology for the 19 Telecoms Industry
5. Biannual Report – 23 Fuel Cell Deep Dive Study
Innovation from the Indian Subcontinent
6. Renewable Resource Availability in India 29
7. Energy for the Telecom Towers – 32 India Market Sizing and Forecasting
8. Introduction to the Indian 36 Vendor Landscape
Community Power from Mobile
9. Diesel Theft: The Elephant in the Room 40
10. First Things First: Establishing Data 45 Collection for Benchmarking and Measuring Impact
11. Entrepreneurship for Africa’s 49 Phone Charging
12. Financial Barriers to Community Power 53 from Mobile
13. Case Study: Grameenphone Energises 57 Paharpur: Lessons Learnt One year On
Glossary 63
Resources 64
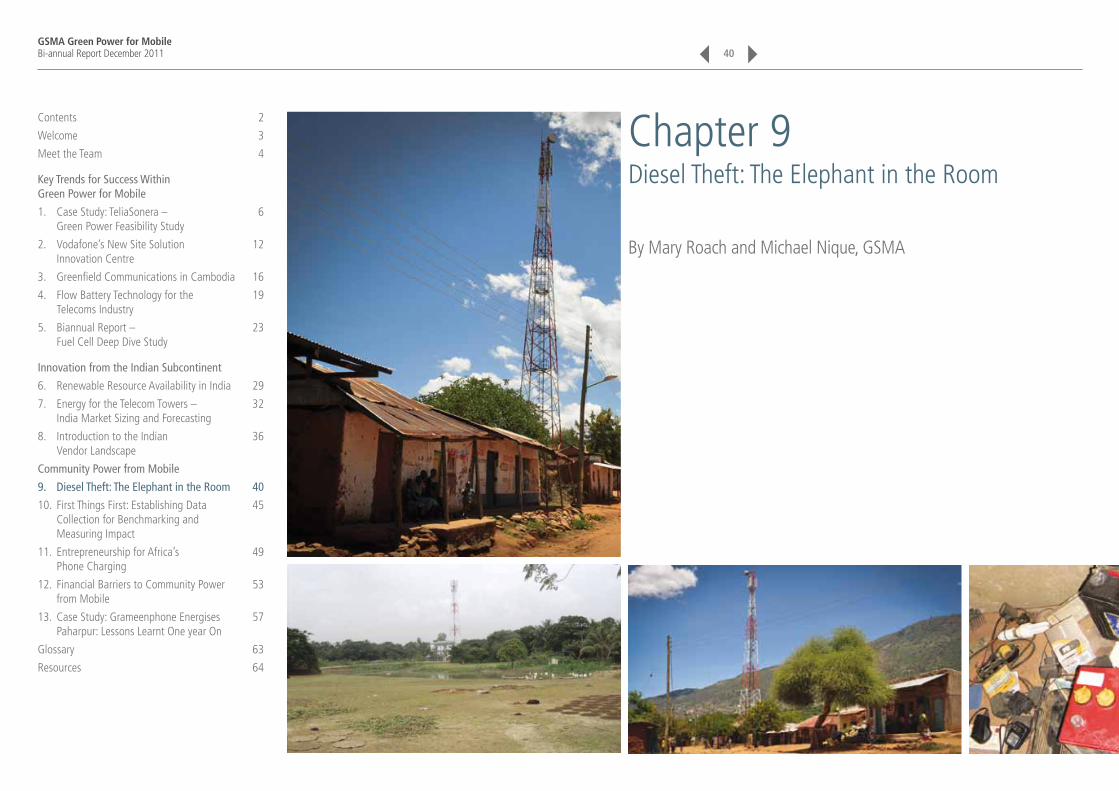
GSMA Green Power for MobileBi-annual Report December 2011 40
Chapter 9Diesel Theft: The Elephant in the Room
By Mary Roach and Michael Nique, GSMA
Contents 2
Welcome 3
Meet the Team 4
Key Trends for Success Within Green Power for Mobile
1. Case Study: TeliaSonera – 6 Green Power Feasibility Study
2. Vodafone’s New Site Solution 12 Innovation Centre
3. Greenfield Communications in Cambodia 16
4. Flow Battery Technology for the 19 Telecoms Industry
5. Biannual Report – 23 Fuel Cell Deep Dive Study
Innovation from the Indian Subcontinent
6. Renewable Resource Availability in India 29
7. Energy for the Telecom Towers – 32 India Market Sizing and Forecasting
8. Introduction to the Indian 36 Vendor Landscape
Community Power from Mobile
9. Diesel Theft: The Elephant in the Room 40
10. First Things First: Establishing Data 45 Collection for Benchmarking and Measuring Impact
11. Entrepreneurship for Africa’s 49 Phone Charging
12. Financial Barriers to Community Power 53 from Mobile
13. Case Study: Grameenphone Energises 57 Paharpur: Lessons Learnt One year On
Glossary 63
Resources 64

GSMA Green Power for MobileBi-annual Report December 2011
Earlier in the year the Indian telecom industry came under attack from Greenpeace in their report “Dirty talking – the case for telecom to shift from diesel to renewable”1 stating that the telecom industry was “exploiting” the Indian government’s diesel subsidy and dragging their feet on switching to renewable scenarios. While the report correctly identified the business opportunities and savings that renewable solutions provide the telecom industry, it failed to address the major challenge in switching technology.
The very large elephant in the room for energy solutions in the telecom industry is the informal diesel economy and the theft that occurs at tower sites across emerging markets. In India and in sub-Saharan Africa it is estimated that 15 to 20% of total diesel consumed by the telecom industry is pilfered.2,3
Mobile operators and tower companies want nothing more than to reduce their dependency on diesel and reduce their Operating Expenses. The challenge is, how?
Origins – How Did The Sector Get Here?
Motives to Steal
In a world where 1.4 billion people lack access to electricity (including 548 million mobile subscribers) it is easy to understand the allure of stealing diesel. Individuals can either use diesel for lighting, powering diesel generators for irrigation and agro-processing or sell the fuel at a handsome profit. Diesel theft occurs across all industries in emerging markets and is heightened in countries with unreliable grid availability and in which the private sector is forced to provide their own electricity; a mandate clearly outside their core competency.
The service reliability that the telecoms industry must deliver means that all towers, regardless of country and geography have back-up energy storage or generation units. In countries where grid reliability is unpredictable at best, energy storage solutions are not enough; telecoms players must place power generation equipment at site.
Once Upon a Time Renewables Were Not a Viable Solution:
At the time of the development of the mobile networks in most emerging markets renewable energy solutions were both considered too expensive and unproven to maintain the fidelity required by the industry to meet requirements and maintain its customer base. As a result, mobile network operators chose diesel generators as the primary means of power in areas with unreliable or no access to grid electricity. When market share was mostly dictated by a mobile operator’s geographic network coverage and reliability, telecom players had no choice but to keep the power on – no matter the cost.
Hindsight is 20:20
As network operators were busy building their networks and improving service delivery to customers, an informal diesel economy was being formed, entrenching expectations about diesel kick-backs and revenue possibilities that are difficult to bring under control in large networks of towers. At the board level growth investments trumped investments on efficiency and thus the diesel thieves were able to continue operating unnoticed.
Increasing Competition
The increased pressure to compete both by the price wars we have seen across India and Africa and policies such as the Indian’s government’s policy on tower-sharing have helped to drive focus on costs. Coupled with the development of energy efficient BTS and the cost reductions and increased confidence in the reliability of renewable energy solutions have made green power a more attractive option to the telecom industry. The pioneering efforts by tower companies and network operators alike have brought to light the challenges of displacing diesel theft: In a recent article in the Times of India, Manoj Toridkar, Chairman of GTL states “at the operational level, the issues of pilferage of diesel and issues related to labour are areas that concern us”.
Chapter 9
1 http://www.greenpeace.org/international/en/news/Blogs/Cool-IT/dirty-talking-a-case-for-telecom-to-shift-fro/blog/34895/
2 http://fuelcellsworks.com/news/2010/07/06/african-telecoms-begin-hydrogen-trials/
3 http://articles.timesofindia.indiatimes.com/2011-10-24/infrastructure/30315880_1_standalone-tower-tower-companies-telecom-tower-business
41
Contents 2
Welcome 3
Meet the Team 4
Key Trends for Success Within Green Power for Mobile
1. Case Study: TeliaSonera – 6 Green Power Feasibility Study
2. Vodafone’s New Site Solution 12 Innovation Centre
3. Greenfield Communications in Cambodia 16
4. Flow Battery Technology for the 19 Telecoms Industry
5. Biannual Report – 23 Fuel Cell Deep Dive Study
Innovation from the Indian Subcontinent
6. Renewable Resource Availability in India 29
7. Energy for the Telecom Towers – 32 India Market Sizing and Forecasting
8. Introduction to the Indian 36 Vendor Landscape
Community Power from Mobile
9. Diesel Theft: The Elephant in the Room 40
10. First Things First: Establishing Data 45 Collection for Benchmarking and Measuring Impact
11. Entrepreneurship for Africa’s 49 Phone Charging
12. Financial Barriers to Community Power 53 from Mobile
13. Case Study: Grameenphone Energises 57 Paharpur: Lessons Learnt One year On
Glossary 63
Resources 64
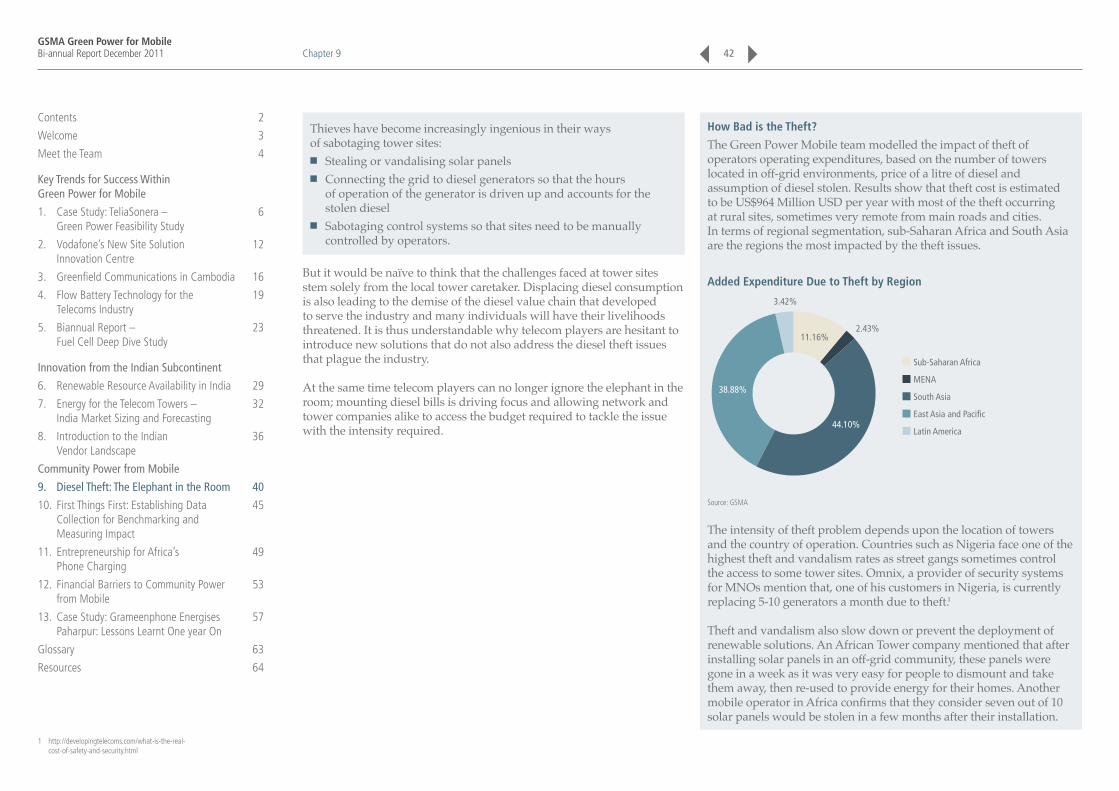
GSMA Green Power for MobileBi-annual Report December 2011
Thieves have become increasingly ingenious in their ways of sabotaging tower sites:
■ Stealing or vandalising solar panels ■ Connecting the grid to diesel generators so that the hours
of operation of the generator is driven up and accounts for the stolen diesel
■ Sabotaging control systems so that sites need to be manually controlled by operators.
But it would be naïve to think that the challenges faced at tower sites stem solely from the local tower caretaker. Displacing diesel consumption is also leading to the demise of the diesel value chain that developed to serve the industry and many individuals will have their livelihoods threatened. It is thus understandable why telecom players are hesitant to introduce new solutions that do not also address the diesel theft issues that plague the industry.
At the same time telecom players can no longer ignore the elephant in the room; mounting diesel bills is driving focus and allowing network and tower companies alike to access the budget required to tackle the issue with the intensity required.
Chapter 9
1 http://developingtelecoms.com/what-is-the-real-cost-of-safety-and-security.html
42
How Bad is the Theft?
The Green Power Mobile team modelled the impact of theft of operators operating expenditures, based on the number of towers located in off-grid environments, price of a litre of diesel and assumption of diesel stolen. Results show that theft cost is estimated to be US$964 Million USD per year with most of the theft occurring at rural sites, sometimes very remote from main roads and cities. In terms of regional segmentation, sub-Saharan Africa and South Asia are the regions the most impacted by the theft issues.
Added Expenditure Due to Theft by Region
Sub-Saharan Africa
MENA
South Asia
East Asia and Pacific
Latin America
3.42%
11.16%2.43%
44.10%
38.88%
Source: GSMA
The intensity of theft problem depends upon the location of towers and the country of operation. Countries such as Nigeria face one of the highest theft and vandalism rates as street gangs sometimes control the access to some tower sites. Omnix, a provider of security systems for MNOs mention that, one of his customers in Nigeria, is currently replacing 5-10 generators a month due to theft.1
Theft and vandalism also slow down or prevent the deployment of renewable solutions. An African Tower company mentioned that after installing solar panels in an off-grid community, these panels were gone in a week as it was very easy for people to dismount and take them away, then re-used to provide energy for their homes. Another mobile operator in Africa confirms that they consider seven out of 10 solar panels would be stolen in a few months after their installation.
Contents 2
Welcome 3
Meet the Team 4
Key Trends for Success Within Green Power for Mobile
1. Case Study: TeliaSonera – 6 Green Power Feasibility Study
2. Vodafone’s New Site Solution 12 Innovation Centre
3. Greenfield Communications in Cambodia 16
4. Flow Battery Technology for the 19 Telecoms Industry
5. Biannual Report – 23 Fuel Cell Deep Dive Study
Innovation from the Indian Subcontinent
6. Renewable Resource Availability in India 29
7. Energy for the Telecom Towers – 32 India Market Sizing and Forecasting
8. Introduction to the Indian 36 Vendor Landscape
Community Power from Mobile
9. Diesel Theft: The Elephant in the Room 40
10. First Things First: Establishing Data 45 Collection for Benchmarking and Measuring Impact
11. Entrepreneurship for Africa’s 49 Phone Charging
12. Financial Barriers to Community Power 53 from Mobile
13. Case Study: Grameenphone Energises 57 Paharpur: Lessons Learnt One year On
Glossary 63
Resources 64
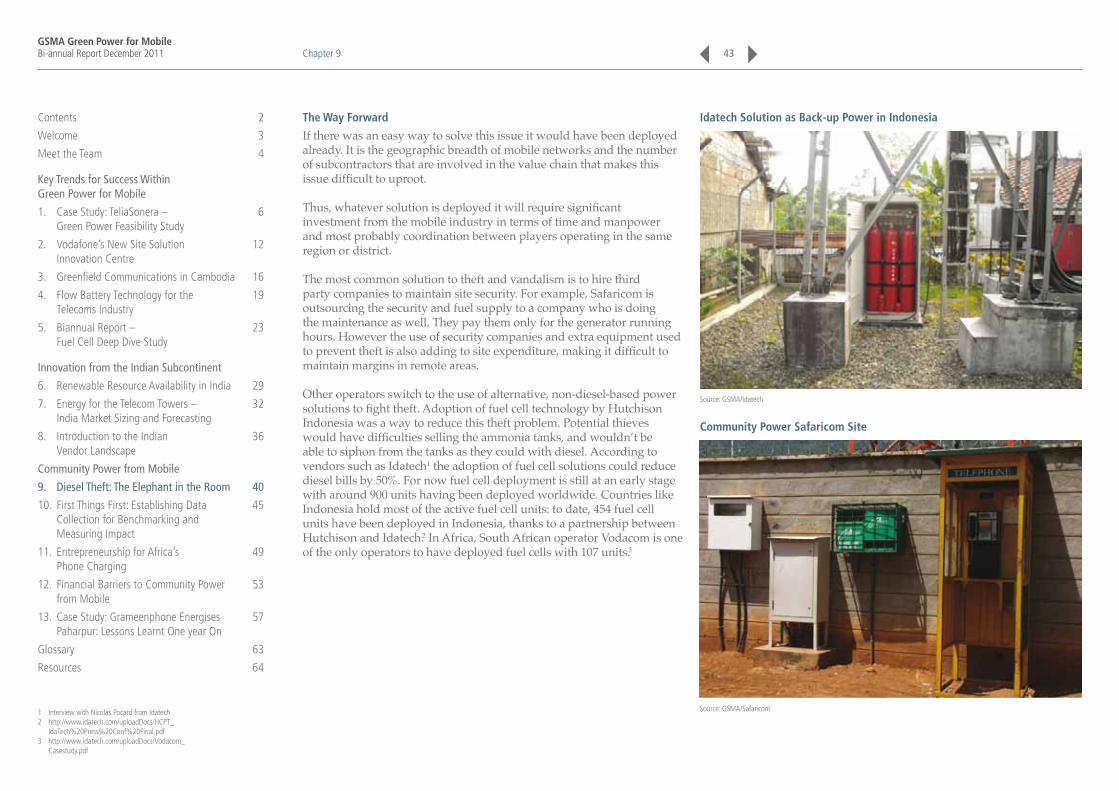
GSMA Green Power for MobileBi-annual Report December 2011
The Way Forward
If there was an easy way to solve this issue it would have been deployed already. It is the geographic breadth of mobile networks and the number of subcontractors that are involved in the value chain that makes this issue difficult to uproot.
Thus, whatever solution is deployed it will require significant investment from the mobile industry in terms of time and manpower and most probably coordination between players operating in the same region or district. The most common solution to theft and vandalism is to hire third party companies to maintain site security. For example, Safaricom is outsourcing the security and fuel supply to a company who is doing the maintenance as well. They pay them only for the generator running hours. However the use of security companies and extra equipment used to prevent theft is also adding to site expenditure, making it difficult to maintain margins in remote areas.
Other operators switch to the use of alternative, non-diesel-based power solutions to fight theft. Adoption of fuel cell technology by Hutchison Indonesia was a way to reduce this theft problem. Potential thieves would have difficulties selling the ammonia tanks, and wouldn’t be able to siphon from the tanks as they could with diesel. According to vendors such as Idatech1 the adoption of fuel cell solutions could reduce diesel bills by 50%. For now fuel cell deployment is still at an early stage with around 900 units having been deployed worldwide. Countries like Indonesia hold most of the active fuel cell units: to date, 454 fuel cell units have been deployed in Indonesia, thanks to a partnership between Hutchison and Idatech.2 In Africa, South African operator Vodacom is one of the only operators to have deployed fuel cells with 107 units.3
Idatech Solution as Back-up Power in Indonesia
Source: GSMA/Idatech
Community Power Safaricom Site
Source: GSMA/Safaricom
Chapter 9 43
1 Interview with Nicolas Pocard from Idatech2 http://www.idatech.com/uploadDocs/HCPT_
IdaTech%20Press%20Conf%20Final.pdf 3 http://www.idatech.com/uploadDocs/Vodacom_
Casestudy.pdf
Contents 2
Welcome 3
Meet the Team 4
Key Trends for Success Within Green Power for Mobile
1. Case Study: TeliaSonera – 6 Green Power Feasibility Study
2. Vodafone’s New Site Solution 12 Innovation Centre
3. Greenfield Communications in Cambodia 16
4. Flow Battery Technology for the 19 Telecoms Industry
5. Biannual Report – 23 Fuel Cell Deep Dive Study
Innovation from the Indian Subcontinent
6. Renewable Resource Availability in India 29
7. Energy for the Telecom Towers – 32 India Market Sizing and Forecasting
8. Introduction to the Indian 36 Vendor Landscape
Community Power from Mobile
9. Diesel Theft: The Elephant in the Room 40
10. First Things First: Establishing Data 45 Collection for Benchmarking and Measuring Impact
11. Entrepreneurship for Africa’s 49 Phone Charging
12. Financial Barriers to Community Power 53 from Mobile
13. Case Study: Grameenphone Energises 57 Paharpur: Lessons Learnt One year On
Glossary 63
Resources 64

GSMA Green Power for MobileBi-annual Report December 2011
Can Community Power Contribute?
While still in its infancy the concept of Community Power from Mobile could be used as a tool to combat diesel theft and deliver value to both the community and telecoms players.
Safaricom has been one of the first mobile operators to equip remote base stations with power outlets where local people can recharge their phones. By providing the community with free power, the local chief ensures security of the base station.
Zantel also found a major incentive to add this community component as they have found a solution to their diesel theft problem and have now reduced theft to almost zero.
For Eaton Towers,1 working with Vodafone in Ghana, involving the local community in maintaining the security and maintenance at each site is key to prevent equipment and fuel theft. Arrangements were made with the local communities to provide maintenance and security of their infrastructure and were paid on the power availability. Within six months they were able to reduce the monthly OPEX of a tower from 40% through “hardening” (increasing the security of the site through site monitoring systems without deploying security guards).
The needs of the community are aligned with the incentives of the telecom players. Communities want access to services (mobile and otherwise) and telecom players want to find ways to increase ARPU, brand loyalty and site security. A potential match made in heaven.
Furthermore by stimulating the development of other services and business in off-grid communities Community Power from Mobile can help to offset the potential loss of employment and revenues previously experienced via diesel theft.
But implementing a community-driven solution to diesel theft will require more olive branches than swords. Telecoms players must get out of their comfort zone, leave their offices in capital cities and listen attentively to what is happening in and around their sites. As mentioned by Thomas Jonell, this process of involving the community may take a high amount of time and energy to gain trust and develop such a scheme. But the reward is worth it to establish a better relationship between the telecom tower site owner and the surrounding population. There is an opportunity to develop stronger relationships with Community Based Organisations, women and farmer groups and community leaders.
Three Suggestions To Involve The Community:Know your neighbours: Mobile networks are, by definition, built near and around people. Whether a tower is 500m from a community or 2km away and on a hill the presence of the tower and the flow of service personnel to and from these sites ensure that telecoms players are having interactions with the community. Telecoms players are best-placed to develop relationships with the leaders in the community.
Talk about the issue and the consequences of not finding a solution: It is easy to imagine why a subsistence farmer can see why there is no harm to steal from the rich telecoms player; they don’t understand the economics of the industry and only see the scale and human resources that are employed to keep the sites running. But there is a very clear and present threat to the community if the diesel theft issue isn’t brought under control: telecoms players can begin to argue that some sites are not financially feasible and thus may need to be shut down; a result that benefits neither the community nor the telecoms industry. By educating the community and local organisations on the business model of the telecom industry they will begin to understand why running a site at a financial loss is unsustainable. Furthermore by speaking about the issue community members will begin to realise that only certain members are benefiting from the diesel theft.
Crowdsource solutions: The telecom industry has the opportunity to engage local communities in solving these issues and starting a dialogue that allows for opportunities of mutual benefit to be identified.
There is no doubt that something is going to have to change in the telecom industry. Renewable solutions are looking more and more appealing and the industry is getting increasingly hammered by the large beast that is diesel theft. Telecom players will have to dedicate more resources to solving the issue and we can expect a series of new technical solutions to be deployed. Community engagement and Community Power from Mobile offer a potential solution that could provide both benefits to the community and telecom players.
Do you have stories or lessons learnt on engaging communities on diesel theft or community based initiatives? If so we would like to hear from you – email [email protected].
Chapter 9 44
1 Interview with Thomas Jonell – CTO of Eaton Towers
Contents 2
Welcome 3
Meet the Team 4
Key Trends for Success Within Green Power for Mobile
1. Case Study: TeliaSonera – 6 Green Power Feasibility Study
2. Vodafone’s New Site Solution 12 Innovation Centre
3. Greenfield Communications in Cambodia 16
4. Flow Battery Technology for the 19 Telecoms Industry
5. Biannual Report – 23 Fuel Cell Deep Dive Study
Innovation from the Indian Subcontinent
6. Renewable Resource Availability in India 29
7. Energy for the Telecom Towers – 32 India Market Sizing and Forecasting
8. Introduction to the Indian 36 Vendor Landscape
Community Power from Mobile
9. Diesel Theft: The Elephant in the Room 40
10. First Things First: Establishing Data 45 Collection for Benchmarking and Measuring Impact
11. Entrepreneurship for Africa’s 49 Phone Charging
12. Financial Barriers to Community Power 53 from Mobile
13. Case Study: Grameenphone Energises 57 Paharpur: Lessons Learnt One year On
Glossary 63
Resources 64

GSMA Green Power for MobileBi-annual Report December 2011 45
Chapter 10First Things First: Establishing Data Collection for Benchmarking and Measuring Impact
By Charlotte Ward and Erica Mackey, GSMA
Contents 2
Welcome 3
Meet the Team 4
Key Trends for Success Within Green Power for Mobile
1. Case Study: TeliaSonera – 6 Green Power Feasibility Study
2. Vodafone’s New Site Solution 12 Innovation Centre
3. Greenfield Communications in Cambodia 16
4. Flow Battery Technology for the 19 Telecoms Industry
5. Biannual Report – 23 Fuel Cell Deep Dive Study
Innovation from the Indian Subcontinent
6. Renewable Resource Availability in India 29
7. Energy for the Telecom Towers – 32 India Market Sizing and Forecasting
8. Introduction to the Indian 36 Vendor Landscape
Community Power from Mobile
9. Diesel Theft: The Elephant in the Room 40
10. First Things First: Establishing Data 45 Collection for Benchmarking and Measuring Impact
11. Entrepreneurship for Africa’s 49 Phone Charging
12. Financial Barriers to Community Power 53 from Mobile
13. Case Study: Grameenphone Energises 57 Paharpur: Lessons Learnt One year On
Glossary 63
Resources 64
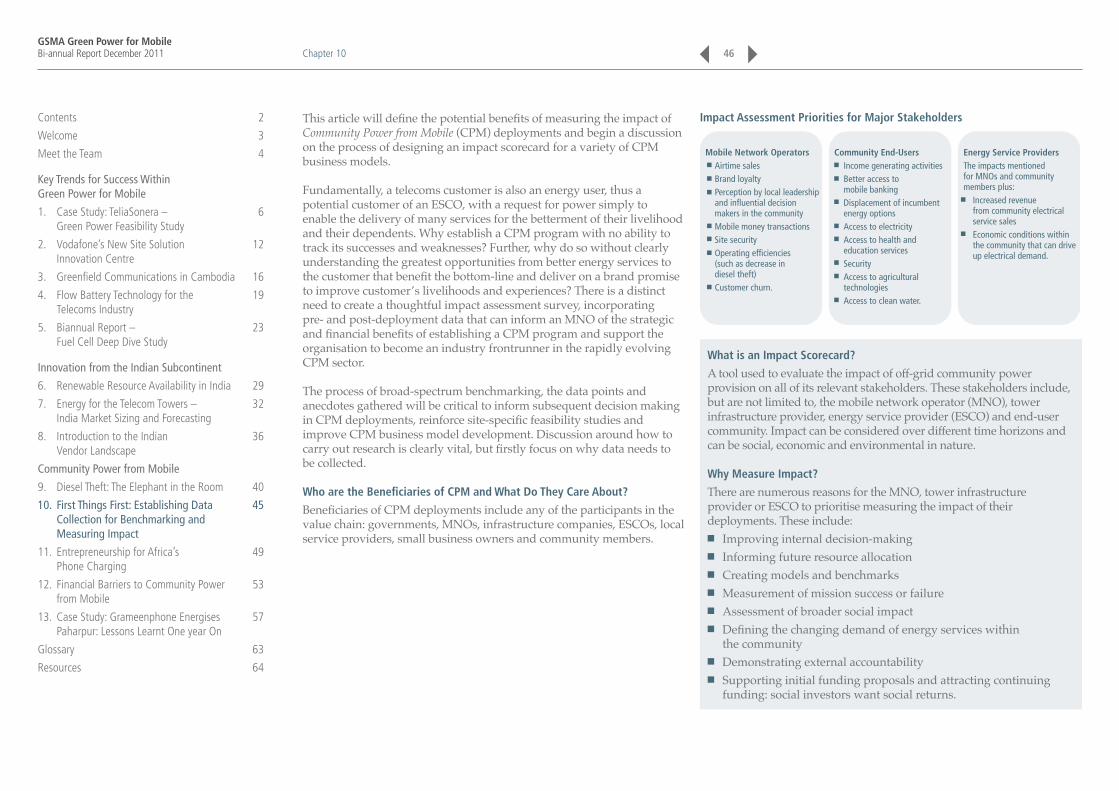
GSMA Green Power for MobileBi-annual Report December 2011
This article will define the potential benefits of measuring the impact of Community Power from Mobile (CPM) deployments and begin a discussion on the process of designing an impact scorecard for a variety of CPM business models.
Fundamentally, a telecoms customer is also an energy user, thus a potential customer of an ESCO, with a request for power simply to enable the delivery of many services for the betterment of their livelihood and their dependents. Why establish a CPM program with no ability to track its successes and weaknesses? Further, why do so without clearly understanding the greatest opportunities from better energy services to the customer that benefit the bottom-line and deliver on a brand promise to improve customer’s livelihoods and experiences? There is a distinct need to create a thoughtful impact assessment survey, incorporating pre- and post-deployment data that can inform an MNO of the strategic and financial benefits of establishing a CPM program and support the organisation to become an industry frontrunner in the rapidly evolving CPM sector.
The process of broad-spectrum benchmarking, the data points and anecdotes gathered will be critical to inform subsequent decision making in CPM deployments, reinforce site-specific feasibility studies and improve CPM business model development. Discussion around how to carry out research is clearly vital, but firstly focus on why data needs to be collected.
Who are the Beneficiaries of CPM and What Do They Care About?
Beneficiaries of CPM deployments include any of the participants in the value chain: governments, MNOs, infrastructure companies, ESCOs, local service providers, small business owners and community members.
Impact Assessment Priorities for Major Stakeholders
Mobile Network Operators Airtime sales Brand loyalty Perception by local leadership and influential decision makers in the community Mobile money transactions Site security Operating efficiencies (such as decrease in diesel theft) Customer churn.
Community End-Users Income generating activities Better access to mobile banking Displacement of incumbent energy options Access to electricity Access to health and education services Security Access to agricultural technologies Access to clean water.
Energy Service ProvidersThe impacts mentioned for MNOs and community members plus: Increased revenue from community electrical service sales Economic conditions within the community that can drive up electrical demand.
What is an Impact Scorecard?
A tool used to evaluate the impact of off-grid community power provision on all of its relevant stakeholders. These stakeholders include, but are not limited to, the mobile network operator (MNO), tower infrastructure provider, energy service provider (ESCO) and end-user community. Impact can be considered over different time horizons and can be social, economic and environmental in nature.
Why Measure Impact?
There are numerous reasons for the MNO, tower infrastructure provider or ESCO to prioritise measuring the impact of their deployments. These include:
■ Improving internal decision-making ■ Informing future resource allocation ■ Creating models and benchmarks ■ Measurement of mission success or failure ■ Assessment of broader social impact ■ Defining the changing demand of energy services within
the community ■ Demonstrating external accountability ■ Supporting initial funding proposals and attracting continuing
funding: social investors want social returns.
Chapter 10 46
Contents 2
Welcome 3
Meet the Team 4
Key Trends for Success Within Green Power for Mobile
1. Case Study: TeliaSonera – 6 Green Power Feasibility Study
2. Vodafone’s New Site Solution 12 Innovation Centre
3. Greenfield Communications in Cambodia 16
4. Flow Battery Technology for the 19 Telecoms Industry
5. Biannual Report – 23 Fuel Cell Deep Dive Study
Innovation from the Indian Subcontinent
6. Renewable Resource Availability in India 29
7. Energy for the Telecom Towers – 32 India Market Sizing and Forecasting
8. Introduction to the Indian 36 Vendor Landscape
Community Power from Mobile
9. Diesel Theft: The Elephant in the Room 40
10. First Things First: Establishing Data 45 Collection for Benchmarking and Measuring Impact
11. Entrepreneurship for Africa’s 49 Phone Charging
12. Financial Barriers to Community Power 53 from Mobile
13. Case Study: Grameenphone Energises 57 Paharpur: Lessons Learnt One year On
Glossary 63
Resources 64
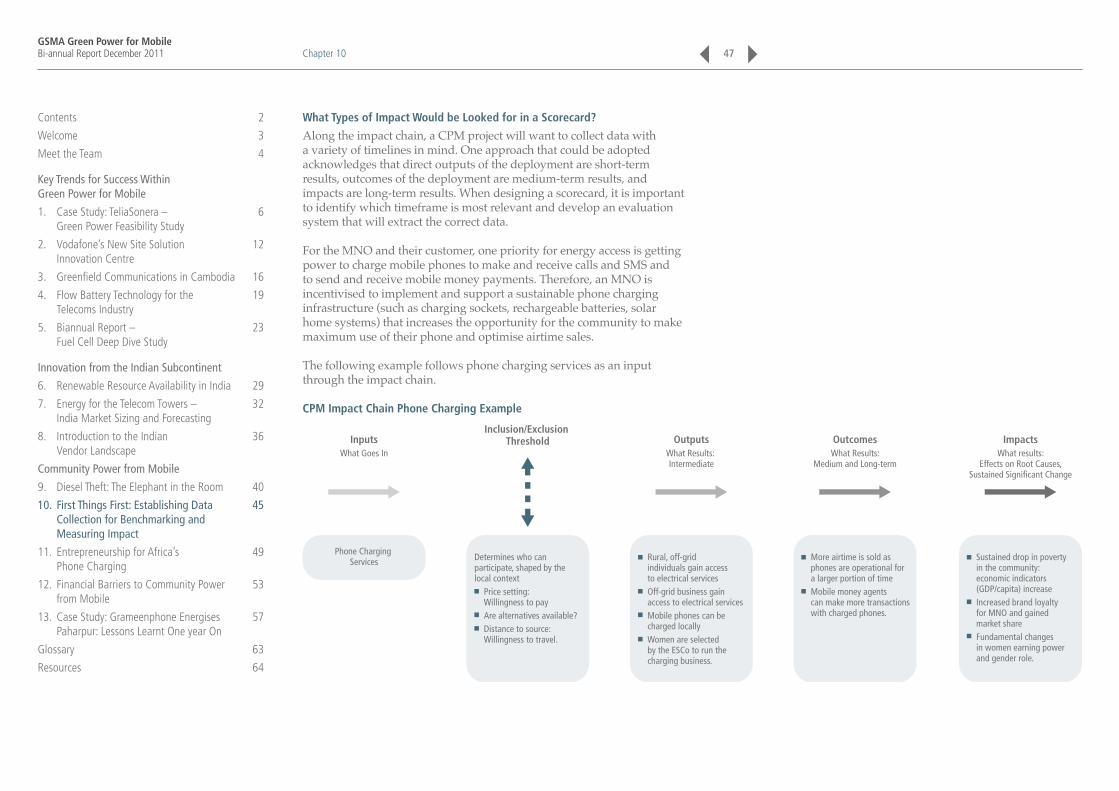
GSMA Green Power for MobileBi-annual Report December 2011
What Types of Impact Would be Looked for in a Scorecard?
Along the impact chain, a CPM project will want to collect data with a variety of timelines in mind. One approach that could be adopted acknowledges that direct outputs of the deployment are short-term results, outcomes of the deployment are medium-term results, and impacts are long-term results. When designing a scorecard, it is important to identify which timeframe is most relevant and develop an evaluation system that will extract the correct data.
For the MNO and their customer, one priority for energy access is getting power to charge mobile phones to make and receive calls and SMS and to send and receive mobile money payments. Therefore, an MNO is incentivised to implement and support a sustainable phone charging infrastructure (such as charging sockets, rechargeable batteries, solar home systems) that increases the opportunity for the community to make maximum use of their phone and optimise airtime sales.
The following example follows phone charging services as an input through the impact chain.
CPM Impact Chain Phone Charging Example
Determines who can participate, shaped by the local context Price setting: Willingness to pay Are alternatives available? Distance to source: Willingness to travel.
Rural, off-grid individuals gain access to electrical services Off-grid business gain access to electrical services Mobile phones can be charged locally Women are selected by the ESCo to run the charging business.
More airtime is sold as phones are operational for a larger portion of time Mobile money agents can make more transactions with charged phones.
Sustained drop in poverty in the community: economic indicators (GDP/capita) increase Increased brand loyalty for MNO and gained market share Fundamental changes in women earning power and gender role.
Phone Charging Services
InputsWhat Goes In
OutputsWhat Results: Intermediate
OutcomesWhat Results:
Medium and Long-term
ImpactsWhat results:
Effects on Root Causes,Sustained Significant Change
Inclusion/Exclusion Threshold
Chapter 10 47
Contents 2
Welcome 3
Meet the Team 4
Key Trends for Success Within Green Power for Mobile
1. Case Study: TeliaSonera – 6 Green Power Feasibility Study
2. Vodafone’s New Site Solution 12 Innovation Centre
3. Greenfield Communications in Cambodia 16
4. Flow Battery Technology for the 19 Telecoms Industry
5. Biannual Report – 23 Fuel Cell Deep Dive Study
Innovation from the Indian Subcontinent
6. Renewable Resource Availability in India 29
7. Energy for the Telecom Towers – 32 India Market Sizing and Forecasting
8. Introduction to the Indian 36 Vendor Landscape
Community Power from Mobile
9. Diesel Theft: The Elephant in the Room 40
10. First Things First: Establishing Data 45 Collection for Benchmarking and Measuring Impact
11. Entrepreneurship for Africa’s 49 Phone Charging
12. Financial Barriers to Community Power 53 from Mobile
13. Case Study: Grameenphone Energises 57 Paharpur: Lessons Learnt One year On
Glossary 63
Resources 64
GSMA Green Power for MobileBi-annual Report December 2011
Considering Impacts to all Beneficiaries
It has been recognised in the design of the impact chain that there is a need to ensure that the effects identified as important by the actual beneficiaries are incorporated into the scorecard. An example of one such externality would be if an MNO begins to offer free charging services in a village that already hosts local entrepreneurs who have previously invested in independent phone charging businesses, this CPM project could displace these existing small charging businesses, eventually putting people out of work.
Key Information for MNO to Gather Internally and Externally
Internal ■ Location of BTS sites within lower socio-economic regions ■ Traffic volumes through BTS ■ Current mobile banking transactions ■ Cost of diesel theft and vandalism at the site ■ Employees in the community.
External ■ Current and developing energy access options
(for lighting, appliances, cooking) ■ Cost to community of connecting to grid-power (if available) ■ Energy services that are a priority to household and community ■ Current expenditure on energy (financial and human resources) ■ Demand for mobile money payments (sending or receiving) ■ Current household income.
What Methodologies are Available to Implement a Scorecard for CPM?
Depending on resources available and what indicators are most appropriate for the deployment, the scorecard tool can be adapted to be as intensive and inclusive as desired. Generally, given the community level impact of CPM, it will be important to capture multiple perspectives and to establish causality and benchmark using a control group. The assessment can be implemented by the business itself, by a consultant firm, or by partnering with a research institution like a university.
It will be important to both setup a consistent monitoring system as well as incorporate a longer term evaluation of the impact of the CPM deployment. This can be done with:
■ Household surveys ■ Constituency feedback and perception reports ■ Story-based evaluations: interviews and site visits ■ Monitoring at local businesses for airtime sales ■ Monitoring internal MNO traffic data ■ Compiling an infrastructure and energy usage survey.
Using Common Data for Building an Impact Scorecard and Feasibility Research
For CPM to succeed as a means for deploying scalable and sustainable rural electrification, the needs of the community must be aligned with the incentives of the MNOs. A ground-level survey of energy fuels, usage, expenditure and access points of communities and households where community power services could potentially be implemented will be very powerful, and indeed critical, to stimulate the most successful and impactful business models for all stakeholders involved. So taking a step-back, the data collection required for pre-deployment benchmarking as a contributor to the scorecard is needed for advising what, how and where to best establish CPM as a solution for rural electrification.
Effective Use of Mapping Data Points (such as these) Could Inform Most Impactful Deployments of CPM and be Monitored for Evaluating Some Impacts:
■ A comprehensive and detailed survey of community energy access ■ Population density across socio-economic groupings ■ Current and planned mobile infrastructure deployment
and energy solutions ■ Location of mobile money agents ■ ARPU and off-grid subscriber growth strategy.
CPM are providing MNOs with technical advice to help them make informed decisions around a community power strategy and to begin the process of creating a tool for assessing the impact of trials and later roll-outs. We would very much like to hear from other operators who are interested to explore this also.
Chapter 10
Contents 2
Welcome 3
Meet the Team 4
Key Trends for Success Within Green Power for Mobile
1. Case Study: TeliaSonera – 6 Green Power Feasibility Study
2. Vodafone’s New Site Solution 12 Innovation Centre
3. Greenfield Communications in Cambodia 16
4. Flow Battery Technology for the 19 Telecoms Industry
5. Biannual Report – 23 Fuel Cell Deep Dive Study
Innovation from the Indian Subcontinent
6. Renewable Resource Availability in India 29
7. Energy for the Telecom Towers – 32 India Market Sizing and Forecasting
8. Introduction to the Indian 36 Vendor Landscape
Community Power from Mobile
9. Diesel Theft: The Elephant in the Room 40
10. First Things First: Establishing Data 45 Collection for Benchmarking and Measuring Impact
11. Entrepreneurship for Africa’s 49 Phone Charging
12. Financial Barriers to Community Power 53 from Mobile
13. Case Study: Grameenphone Energises 57 Paharpur: Lessons Learnt One year On
Glossary 63
Resources 64
48

GSMA Green Power for MobileBi-annual Report December 2011 49
Chapter 11Entrepreneurship for Africa’s Phone Charging
By Mary Roach, GSMA
Contents 2
Welcome 3
Meet the Team 4
Key Trends for Success Within Green Power for Mobile
1. Case Study: TeliaSonera – 6 Green Power Feasibility Study
2. Vodafone’s New Site Solution 12 Innovation Centre
3. Greenfield Communications in Cambodia 16
4. Flow Battery Technology for the 19 Telecoms Industry
5. Biannual Report – 23 Fuel Cell Deep Dive Study
Innovation from the Indian Subcontinent
6. Renewable Resource Availability in India 29
7. Energy for the Telecom Towers – 32 India Market Sizing and Forecasting
8. Introduction to the Indian 36 Vendor Landscape
Community Power from Mobile
9. Diesel Theft: The Elephant in the Room 40
10. First Things First: Establishing Data 45 Collection for Benchmarking and Measuring Impact
11. Entrepreneurship for Africa’s 49 Phone Charging
12. Financial Barriers to Community Power 53 from Mobile
13. Case Study: Grameenphone Energises 57 Paharpur: Lessons Learnt One year On
Glossary 63
Resources 64
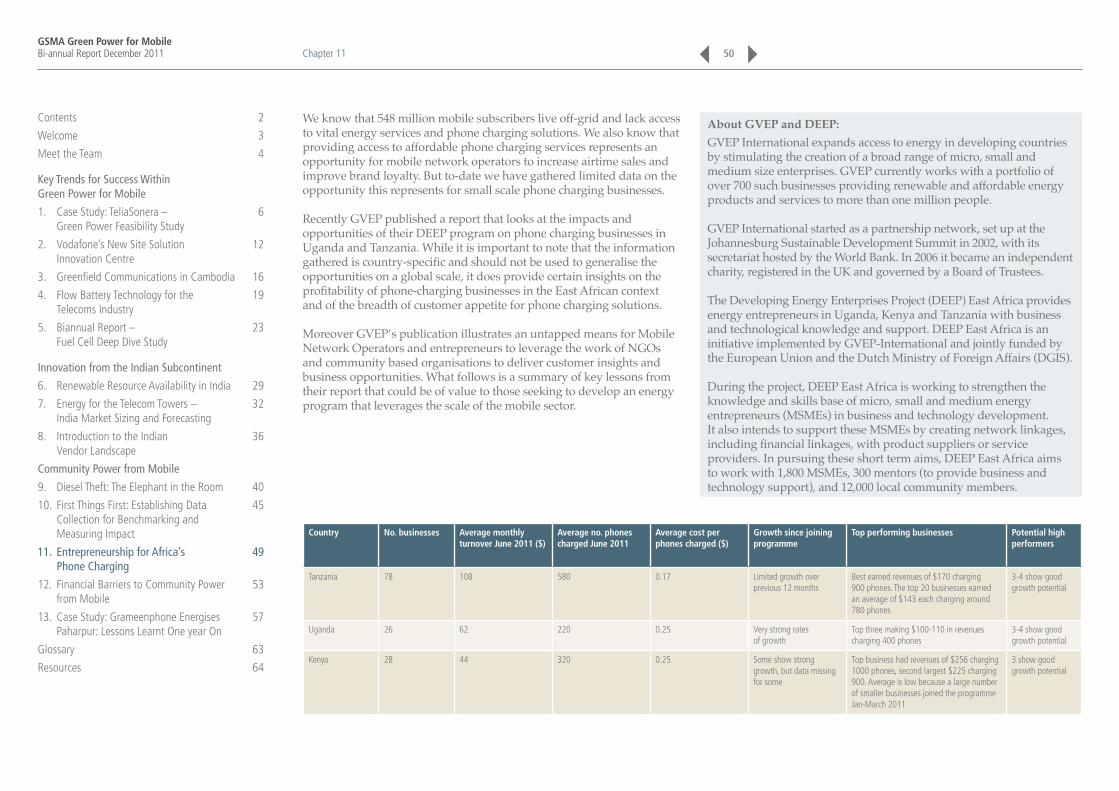
GSMA Green Power for MobileBi-annual Report December 2011
We know that 548 million mobile subscribers live off-grid and lack access to vital energy services and phone charging solutions. We also know that providing access to affordable phone charging services represents an opportunity for mobile network operators to increase airtime sales and improve brand loyalty. But to-date we have gathered limited data on the opportunity this represents for small scale phone charging businesses.
Recently GVEP published a report that looks at the impacts and opportunities of their DEEP program on phone charging businesses in Uganda and Tanzania. While it is important to note that the information gathered is country-specific and should not be used to generalise the opportunities on a global scale, it does provide certain insights on the profitability of phone-charging businesses in the East African context and of the breadth of customer appetite for phone charging solutions.
Moreover GVEP’s publication illustrates an untapped means for Mobile Network Operators and entrepreneurs to leverage the work of NGOs and community based organisations to deliver customer insights and business opportunities. What follows is a summary of key lessons from their report that could be of value to those seeking to develop an energy program that leverages the scale of the mobile sector.
About GVEP and DEEP: GVEP International expands access to energy in developing countries by stimulating the creation of a broad range of micro, small and medium size enterprises. GVEP currently works with a portfolio of over 700 such businesses providing renewable and affordable energy products and services to more than one million people.
GVEP International started as a partnership network, set up at the Johannesburg Sustainable Development Summit in 2002, with its secretariat hosted by the World Bank. In 2006 it became an independent charity, registered in the UK and governed by a Board of Trustees.
The Developing Energy Enterprises Project (DEEP) East Africa provides energy entrepreneurs in Uganda, Kenya and Tanzania with business and technological knowledge and support. DEEP East Africa is an initiative implemented by GVEP-International and jointly funded by the European Union and the Dutch Ministry of Foreign Affairs (DGIS).
During the project, DEEP East Africa is working to strengthen the knowledge and skills base of micro, small and medium energy entrepreneurs (MSMEs) in business and technology development. It also intends to support these MSMEs by creating network linkages, including financial linkages, with product suppliers or service providers. In pursuing these short term aims, DEEP East Africa aims to work with 1,800 MSMEs, 300 mentors (to provide business and technology support), and 12,000 local community members.
Chapter 11 50
Country No. businesses Average monthly turnover June 2011 ($)
Average no. phones charged June 2011
Average cost per phones charged ($)
Growth since joining programme
Top performing businesses Potential high performers
Tanzania 78 108 580 0.17 Limited growth over previous 12 months
Best earned revenues of $170 charging 900 phones. The top 20 businesses earned an average of $143 each charging around 780 phones
3-4 show good growth potential
Uganda 26 62 220 0.25 Very strong rates of growth
Top three making $100-110 in revenues charging 400 phones
3-4 show good growth potential
Kenya 28 44 320 0.25 Some show strong growth, but data missing for some
Top business had revenues of $256 charging 1000 phones, second largest $225 charging 900. Average is low because a large number of smaller businesses joined the programme Jan-March 2011
3 show good growth potential
Contents 2
Welcome 3
Meet the Team 4
Key Trends for Success Within Green Power for Mobile
1. Case Study: TeliaSonera – 6 Green Power Feasibility Study
2. Vodafone’s New Site Solution 12 Innovation Centre
3. Greenfield Communications in Cambodia 16
4. Flow Battery Technology for the 19 Telecoms Industry
5. Biannual Report – 23 Fuel Cell Deep Dive Study
Innovation from the Indian Subcontinent
6. Renewable Resource Availability in India 29
7. Energy for the Telecom Towers – 32 India Market Sizing and Forecasting
8. Introduction to the Indian 36 Vendor Landscape
Community Power from Mobile
9. Diesel Theft: The Elephant in the Room 40
10. First Things First: Establishing Data 45 Collection for Benchmarking and Measuring Impact
11. Entrepreneurship for Africa’s 49 Phone Charging
12. Financial Barriers to Community Power 53 from Mobile
13. Case Study: Grameenphone Energises 57 Paharpur: Lessons Learnt One year On
Glossary 63
Resources 64

GSMA Green Power for MobileBi-annual Report December 2011
Name Sex Location Occupation No. times phone charged per week
Weekly spend on airtime (US$)
Phone charging service provider
Sylivia F Lutisi, Uganda Housewife, husband 'not a farmer'
2 0.90 Vincent Sedeti
Agnes F Lutisi, Uganda Teacher, single mother 2 0.90 Vincent Sedeti
Kyarisiima F Lutisi, Uganda Single woman 2 0.90 Vincent Sedeti
Veronica F Lutisi, Uganda Farmer n/a n/a Vincent Sedeti
Nyinitunyo M Lutisi, Uganda Farmer 4 9.00 Vincent Sedeti
Moses M Besoke, Uganda Cultivator n/a 1.80 Michael Kiggundu
Jimmy M Besoke, Uganda Cultivator 3 0.18 Michael Kiggundu
Saul M Besoke, Uganda Councillor/farmer 2 6.00 Michael Kiggundu
Steven M Besoke, Uganda Student 1 9.00 Michael Kiggundu
Lucas M Mahina, Tanzania Unknown 3 n/a Mpanduji Mhanda
Bagdella M Isesa, Tanzania Cultivator 2 n/a Frank Gilbert
Rashid M Mbarika, Tanzania Farmer 2 3.70 Emmanuel Josiah
Elias M Mbarika, Tanzania Mason 2 4.33 Emmanuel Josiah
Musa M Mbarika, Tanzania Bus owner/driver 2 3.09 Emmanuel Josiah
Key Lesson: Good Entrepreneurs Exist, Need Support and are Looking to Diversify Their Revenue Streams.
While the DEEP program has been set up to support the development of entrepreneurs, the reports suggest that the strongest entrepreneurs are self-made with even greater prospects given the means to develop business acumen. Working with their limited means, they have identified an unmet customer need (phone charging) and built novel business models to bring services to their communities. While most business models involved purchasing a solar panel and battery some entrepreneurs showed more ingenuity:
■ Travelling to nearby towns to charge car batteries and providing the services in their community
■ Attempting to rent solar lanterns ■ Attempting to sell solar lanterns.
All entrepreneurs were engaged in a multitude of income generating activities and seeking ways to further diversify their offering.
Chapter 11 51
Key Lesson: Phone Charging Represents an Attractive Business for Rural Entrepreneurs and a Significant Expense for Mobile Subscribers.
GVEP’s research illustrates that there is significant demand in underserved communities for phone charging solutions. The average phone charge was pegged at $0.20/charge and on average customers charged their phones three times a week. While airtime purchases varied considerably, customers surveyed in Uganda spent an average of 12% of their total weekly airtime budget on phone charging, with customers with the lowest airtime usage spending the most on phone charging. While the data is inconclusive this discrepancy may be caused by people’s general interest to be connected and able to receive phone calls or be “flashed” without spending airtime or due to lower income customers having lower quality batteries which require more frequent charging. Enterprises on average earned $100/month from phone charging and experienced a pay-back period of between two and five months on their initial CAPEX investments. Furthermore most entrepreneurs were unable to meet local demand and had to consequently purchase additional panels and batteries to be able to charge more phones.
Contents 2
Welcome 3
Meet the Team 4
Key Trends for Success Within Green Power for Mobile
1. Case Study: TeliaSonera – 6 Green Power Feasibility Study
2. Vodafone’s New Site Solution 12 Innovation Centre
3. Greenfield Communications in Cambodia 16
4. Flow Battery Technology for the 19 Telecoms Industry
5. Biannual Report – 23 Fuel Cell Deep Dive Study
Innovation from the Indian Subcontinent
6. Renewable Resource Availability in India 29
7. Energy for the Telecom Towers – 32 India Market Sizing and Forecasting
8. Introduction to the Indian 36 Vendor Landscape
Community Power from Mobile
9. Diesel Theft: The Elephant in the Room 40
10. First Things First: Establishing Data 45 Collection for Benchmarking and Measuring Impact
11. Entrepreneurship for Africa’s 49 Phone Charging
12. Financial Barriers to Community Power 53 from Mobile
13. Case Study: Grameenphone Energises 57 Paharpur: Lessons Learnt One year On
Glossary 63
Resources 64
GSMA Green Power for MobileBi-annual Report December 2011
Key Lesson: Product Developers can Improve the Ease of Instalment and Ability to Scale Operation.
Most entrepreneurs incurred a significant expense employing technicians to install their solar panels and connect the components. Since interviewed entrepreneurs often build up their business and charging capacity over time this constitutes a potential recurring costs reducing entrepreneurs profitability. Product companies seeking to serve entrepreneurs should focus on delivering products that could be easily scaled and connected in series. An increased focus on ease of installation can be seen as a significant advantage.
Key Lesson: CPM Service Delivery Will Need to be Adapted to Site Specific Conditions.
The GVEP report underscores the opportunity that the mobile sector provides but challenges a one-size-fits all approach.
What is evident is that the ubiquity of mobile is not only in the mobile network but also in the presence of customer needs and services that support the industry. The universal presence of airtime vendors, mobile phone vendors and phone charging businesses provides a significant retail channel for energy service and product companies while providing additional revenues to local entrepreneurs. GVEP’s research also suggests that using mobile infrastructure to deliver access to energy services may not be the best path to scale in every geography as many of the towers that the team saw in Uganda were positioned on the top of a hill or between two communities. This would suggest that before a mobile network operator attempts Community Power from Mobile, network specific research needs to be conducted to determine the feasibility and attractiveness of using an infrastructure led Community Power from Mobile roll-out. In closing, GVEP’s research helps to highlight the opportunities for energy entrepreneurs working on last mile delivery and the synergies that can occur with larger telecoms players.
As telecoms players and energy service providers attempt to improve their last mile delivery of services, they can draw from the lessons of phone charging entrepreneurs and build upon the strength of existing networks of entrepreneurs to deliver additional value and services to subscribers.
Furthermore the research supports the need for more operator lead and region specific research to better understand how the lack of affordable phone charging solutions impacts airtime sales and their ability to deliver value to rural communities.
The original GVEP report can be found here: http://www.gvepinternational.org/en/business/news/solar-phone-charging-could-help-millions-living-rural-africa-says-report.
Please contact Community Power from Mobile if you would like to discuss any of the areas outlined. We are always eager to speak to organisations working with or supporting entrepreneurs in the energy and mobile sector and learn of new innovations working with our GSMA members.
We would like to give special thanks to GVEP and Simon Collings, COO of GVEP for on-going discussion and debate on the off-grid energy sector.
Chapter 11 52
Contents 2
Welcome 3
Meet the Team 4
Key Trends for Success Within Green Power for Mobile
1. Case Study: TeliaSonera – 6 Green Power Feasibility Study
2. Vodafone’s New Site Solution 12 Innovation Centre
3. Greenfield Communications in Cambodia 16
4. Flow Battery Technology for the 19 Telecoms Industry
5. Biannual Report – 23 Fuel Cell Deep Dive Study
Innovation from the Indian Subcontinent
6. Renewable Resource Availability in India 29
7. Energy for the Telecom Towers – 32 India Market Sizing and Forecasting
8. Introduction to the Indian 36 Vendor Landscape
Community Power from Mobile
9. Diesel Theft: The Elephant in the Room 40
10. First Things First: Establishing Data 45 Collection for Benchmarking and Measuring Impact
11. Entrepreneurship for Africa’s 49 Phone Charging
12. Financial Barriers to Community Power 53 from Mobile
13. Case Study: Grameenphone Energises 57 Paharpur: Lessons Learnt One year On
Glossary 63
Resources 64

GSMA Green Power for MobileBi-annual Report December 2011 53
Chapter 12Financial Barriers to Community Power from Mobile
By Charlotte Ward, GSMA
Contents 2
Welcome 3
Meet the Team 4
Key Trends for Success Within Green Power for Mobile
1. Case Study: TeliaSonera – 6 Green Power Feasibility Study
2. Vodafone’s New Site Solution 12 Innovation Centre
3. Greenfield Communications in Cambodia 16
4. Flow Battery Technology for the 19 Telecoms Industry
5. Biannual Report – 23 Fuel Cell Deep Dive Study
Innovation from the Indian Subcontinent
6. Renewable Resource Availability in India 29
7. Energy for the Telecom Towers – 32 India Market Sizing and Forecasting
8. Introduction to the Indian 36 Vendor Landscape
Community Power from Mobile
9. Diesel Theft: The Elephant in the Room 40
10. First Things First: Establishing Data 45 Collection for Benchmarking and Measuring Impact
11. Entrepreneurship for Africa’s 49 Phone Charging
12. Financial Barriers to Community Power 53 from Mobile
13. Case Study: Grameenphone Energises 57 Paharpur: Lessons Learnt One year On
Glossary 63
Resources 64

GSMA Green Power for MobileBi-annual Report December 2011
A key takeaway from the last six months of the Community Power from Mobile (CPM) programme is the failure of some promising pilots involving a third party energy service company (ESCO) due to the lack of necessary and timely financial backing for the ESCO.
This article explores some of the reasons, and is a step towards understanding what is required to overcome obstacles to funding that may hold back the impact and success of CPM projects.
The rural energy market is still rather immature with the most commercially viable solutions being developed over the last 4-5 years. A range of funding sources are gradually becoming available to organisations improving energy access in emerging economies in the form of grants, guarantees, loans and equity from international development organisations and social impact investors.
The reality, however, is the significant challenges apparent in closing the funding gap between the start-up and operational scale stages.
International development organisations have become particularly active in this funding arena in recent years as calls to support the climate change burden have increased with the purpose of assisting the demonstration, deployment, and commercialisation of low carbon technologies in emerging economies. The increased funding commitments from multilateral development banks do not alleviate all the challenges for rural electrification programs as these facilities often require time consuming pilot project phases, country level support, proven technology and high return profiles. This may actually act as a barrier to fast growth in the Community Power from Mobile sector unless sufficient affordable private and public market capital can be sourced.
The principal reasons for the lack of investors in the community power space are a reflection of the human dynamic of rural electrification and that of a nascent industry.
Energy is Not Attractive
Energy has not at all times been considered a primary need and fallen short, when compared to other opportunities for social, economic and environmental impact, in accessing grant funding for programmatic support or sympathetic investment for new entrants into the sector. Similarly, angel investors hesitate to invest in the sector as they deem it too risky and primarily question the commercial scalability of the model.
Capital Intensive
Like the clean technology industry in developed markets, energy solutions for emerging markets require continual access to funding. The “Valley of Death” is often known as the gap in financing that start-ups face somewhere between grant funding and commercialisation. Two studies conducted last year suggested that the Valley of Death was particularly precarious for energy companies since:
■ They maintain high variable costs even after proof of concept either in the form of building products (i.e. carrying inventory) or developing physical plants
■ They take a long time to scale – in comparison with information technology companies, development of cleantech products and installations takes much longer
■ Energy development must navigate a series of political, financial and regulatory issues specific to the geography they wish to operate in.
As a result, energy entrepreneurs face a tough sell to investors interested in the social enterprise sector, especially when they compete with other technologies with potentially lower development or on-going variable costs.
Chapter 12 54
Contents 2
Welcome 3
Meet the Team 4
Key Trends for Success Within Green Power for Mobile
1. Case Study: TeliaSonera – 6 Green Power Feasibility Study
2. Vodafone’s New Site Solution 12 Innovation Centre
3. Greenfield Communications in Cambodia 16
4. Flow Battery Technology for the 19 Telecoms Industry
5. Biannual Report – 23 Fuel Cell Deep Dive Study
Innovation from the Indian Subcontinent
6. Renewable Resource Availability in India 29
7. Energy for the Telecom Towers – 32 India Market Sizing and Forecasting
8. Introduction to the Indian 36 Vendor Landscape
Community Power from Mobile
9. Diesel Theft: The Elephant in the Room 40
10. First Things First: Establishing Data 45 Collection for Benchmarking and Measuring Impact
11. Entrepreneurship for Africa’s 49 Phone Charging
12. Financial Barriers to Community Power 53 from Mobile
13. Case Study: Grameenphone Energises 57 Paharpur: Lessons Learnt One year On
Glossary 63
Resources 64

GSMA Green Power for MobileBi-annual Report December 2011
Sector Faces Structural Issues
While the reasons above highlight why the energy sector remains unattractive, the finance sector faces significant structural issues which make it difficult to invest in new energy companies.
■ Investment in energy remains risky: without proof of commercial scalability, investments in energy companies are considered to have “technical risks”
■ Longer term investments: the longer term investment requirements of energy companies make them less attractive to funders who seek high risk/high rewards such as the IT space
■ The opportunity cost of early stage investment: donors who also have an interest in leveraging for longer-term returns are aware of giving away value to later stage more risk-averse investors.
The Lynchpin: Attaining a Proof of Concept
For a rural energy provider working with mobile telecom infrastructure and technology, in order to lock-in investment for the growth stage, attaining a proof of concept is essential but can be very difficult.
MNOs do not often have the means to fund pilots themselves. Both the MNOs and investors need to attain a comfort level around the business and technical risks that reflect their type of involvement. An investor may need to see proof that commercial contracts exist between the ESCO and the MNO as its anchor client, and the MNO will need to see evidence that the technical solution is robust and the operation is reliable before committing to commercial service agreements.
One of the reasons for that proof of concept is that there are fewer comparables that can be drawn upon than are perhaps available in other new technologies and so make it harder for the requisite due diligence and risk assessments to be carried out by the MNO and the investor.
The key components to a CPM business model consist of: ■ Electricity supply to rural communities from diesel battery hybrid
and renewable energy hybrid systems ■ Distribution and sale of portable/semi-permanent household solar
and battery devices ■ MNO or tower company is an anchor client to the rural power
company or as the provider of power that is in excess to their requirements at the tower
■ Local entrepreneur(s) managing the sale and maintenance of the power supply and devices
■ Community customer base with low and often irregular incomes.
Most of these actors and activities are already present in alternative solutions that offer energy to rural communities, but none include the MNO/tower companies as a key stakeholder and so CPM business models in their entirety are a relative unknown to the investment community.
Another very specific inherent deployment risk within CPM business models that requires further consideration stems from the immediate reliance upon the power infrastructure by a community once it is introduced.
The opportunity to scale-up power supply within that community is significant as there is (in theory) an infinite number of ‘energy services’ in demand, but at the same time the deployments must be familiarised at the local level in a manner that allows for it to be sustainable. Such crucial human aspects to the deployment of CPM must be thoroughly understood and reconciled with the energy demands and corporate approaches of the MNO.
Chapter 12 55
Contents 2
Welcome 3
Meet the Team 4
Key Trends for Success Within Green Power for Mobile
1. Case Study: TeliaSonera – 6 Green Power Feasibility Study
2. Vodafone’s New Site Solution 12 Innovation Centre
3. Greenfield Communications in Cambodia 16
4. Flow Battery Technology for the 19 Telecoms Industry
5. Biannual Report – 23 Fuel Cell Deep Dive Study
Innovation from the Indian Subcontinent
6. Renewable Resource Availability in India 29
7. Energy for the Telecom Towers – 32 India Market Sizing and Forecasting
8. Introduction to the Indian 36 Vendor Landscape
Community Power from Mobile
9. Diesel Theft: The Elephant in the Room 40
10. First Things First: Establishing Data 45 Collection for Benchmarking and Measuring Impact
11. Entrepreneurship for Africa’s 49 Phone Charging
12. Financial Barriers to Community Power 53 from Mobile
13. Case Study: Grameenphone Energises 57 Paharpur: Lessons Learnt One year On
Glossary 63
Resources 64
GSMA Green Power for MobileBi-annual Report December 2011
Next Steps
To build a robust investor pipeline and see the CPM ‘model’ develop in to a commercial solution to closing the energy divide, by providing a sustainable and scalable power service, a form of revolutionary change to investing and evaluating opportunities is perhaps required to drive continual innovation. Reducing risks of investing in young organisations that deliver rural energy services alongside MNOs and tower companies is also vital.
Concerns of investors about the CPM model, combined with the array of traditional types of investors, are driving the creation of inventive financing mechanisms which may be a necessary contribution to overcoming the obstacles currently faced. One structure which may offer a solution is what the Monitor Group refers to as “ying yang deals”, whereby an investment deal blends the profiles of both an impact investor and a commercial investor and provides an investment opportunity not normally possible for either of them. The trick shall be to quench the thirst for a traditional ‘proof of concept’.
If you would like to discuss any of the areas outlined in this article or as an investor would like to find out more about CPM, please contact [email protected].
Chapter 12 56
Contents 2
Welcome 3
Meet the Team 4
Key Trends for Success Within Green Power for Mobile
1. Case Study: TeliaSonera – 6 Green Power Feasibility Study
2. Vodafone’s New Site Solution 12 Innovation Centre
3. Greenfield Communications in Cambodia 16
4. Flow Battery Technology for the 19 Telecoms Industry
5. Biannual Report – 23 Fuel Cell Deep Dive Study
Innovation from the Indian Subcontinent
6. Renewable Resource Availability in India 29
7. Energy for the Telecom Towers – 32 India Market Sizing and Forecasting
8. Introduction to the Indian 36 Vendor Landscape
Community Power from Mobile
9. Diesel Theft: The Elephant in the Room 40
10. First Things First: Establishing Data 45 Collection for Benchmarking and Measuring Impact
11. Entrepreneurship for Africa’s 49 Phone Charging
12. Financial Barriers to Community Power 53 from Mobile
13. Case Study: Grameenphone Energises 57 Paharpur: Lessons Learnt One year On
Glossary 63
Resources 64

GSMA Green Power for MobileBi-annual Report December 2011 57
Chapter 13Case Study: Grameenphone Energises Paharpur: Lessons Learnt One year On
By Charlotte Ward and Xavier Helgesen, GSMA
Contents 2
Welcome 3
Meet the Team 4
Key Trends for Success Within Green Power for Mobile
1. Case Study: TeliaSonera – 6 Green Power Feasibility Study
2. Vodafone’s New Site Solution 12 Innovation Centre
3. Greenfield Communications in Cambodia 16
4. Flow Battery Technology for the 19 Telecoms Industry
5. Biannual Report – 23 Fuel Cell Deep Dive Study
Innovation from the Indian Subcontinent
6. Renewable Resource Availability in India 29
7. Energy for the Telecom Towers – 32 India Market Sizing and Forecasting
8. Introduction to the Indian 36 Vendor Landscape
Community Power from Mobile
9. Diesel Theft: The Elephant in the Room 40
10. First Things First: Establishing Data 45 Collection for Benchmarking and Measuring Impact
11. Entrepreneurship for Africa’s 49 Phone Charging
12. Financial Barriers to Community Power 53 from Mobile
13. Case Study: Grameenphone Energises 57 Paharpur: Lessons Learnt One year On
Glossary 63
Resources 64

GSMA Green Power for MobileBi-annual Report December 2011
In August 2011, the GSMA Community Power from Mobile programme travelled to visit Grameenphone’s site in Paharpur, Bangladesh one year after installation at one of the most advanced pilots of CPM in the world. The key takeaways were inspiring and include a better understanding of the importance of trust between the mobile network operator (MNO), energy services company (ESCO) and community customers, benefits of a simple payment technology and variations in pricing power.
History
The remote village of Paharpur is located in a vast wetland area in the district of Hobiganj in the division of Sylhet in Bangladesh, about one hour by boat from the nearest city. It is a quiet community of about 20,000 people. Most income is generated by fishing and growing crops in the rich marshlands. Paharpur does not have a road connection to the rest of the country, let alone a connection to the national electrical grid. The Bangladesh Energy Regulatory Committee advise that there are no plans for extending the national grid to this community in at least 20 years (Geirbo, 2011). But in October 2010, over 100 houses turned on their lights thanks to an innovative collaboration between Grameenphone and the University of Oslo.
Grameenphone’s pilot project launched in April 2010 with a field visit from the University of Oslo team. Grameenphone chose the site since it was one of Grameenphone’s first solar sites and is unlikely to see grid extension for a very long time. Working creatively and quickly, the Grameenphone team got the system working at low cost in a few months. They hired a local contractor to build the poles and wiring to their specification. They have made numerous trips to the village and iterated on the design.
Current State
Today, 136 homes and two temples are lit, free mobile phone charging is available and Internet access is provided by Grameenphone’s first off-grid Community Information Centre (CIC). Driving this significant change is a remarkably small amount of power. The total system power load is around 800 Watts, roughly equivalent to the peak output from four rooftop solar panels. Energy efficiency and load timing are both employed to keep this load low. All households receive a seven watt compact fluorescent lightbulb (or two bulbs if they wish to pay). They do not have a “mains” power outlet, so they cannot plug in electrical appliances. Households receive power from the hours of 5pm to midnight, while the CIC and mobile phone charging booth receive it during the daytime.
The CIC provides basic information services to the village via the Internet. It does not operate like a typical Internet café, as most villagers do not operate the computer directly. Instead they ask questions of an operator at the counter who then looks for the information. The presence of the CIC in the village made the community power project much easier, as Grameenphone already had a trusted and technically savvy representative in the form of the CIC manager. When the project started there was no CIC in the village. An entrepreneur ran a shop with a computer without internet access that was mainly used for transferring media from usb sticks to mobile handsets. The manager and an assistant were train by the Grameenphone CIC team. The community power project made it possible for Grameenphone to expand the CICs to remote areas without national grid connection and has allowed for information dissemination to neighbouring villages that do not have a CIC.
Chapter 13 58
Contents 2
Welcome 3
Meet the Team 4
Key Trends for Success Within Green Power for Mobile
1. Case Study: TeliaSonera – 6 Green Power Feasibility Study
2. Vodafone’s New Site Solution 12 Innovation Centre
3. Greenfield Communications in Cambodia 16
4. Flow Battery Technology for the 19 Telecoms Industry
5. Biannual Report – 23 Fuel Cell Deep Dive Study
Innovation from the Indian Subcontinent
6. Renewable Resource Availability in India 29
7. Energy for the Telecom Towers – 32 India Market Sizing and Forecasting
8. Introduction to the Indian 36 Vendor Landscape
Community Power from Mobile
9. Diesel Theft: The Elephant in the Room 40
10. First Things First: Establishing Data 45 Collection for Benchmarking and Measuring Impact
11. Entrepreneurship for Africa’s 49 Phone Charging
12. Financial Barriers to Community Power 53 from Mobile
13. Case Study: Grameenphone Energises 57 Paharpur: Lessons Learnt One year On
Glossary 63
Resources 64

GSMA Green Power for MobileBi-annual Report December 2011
Getting access to mobile charging in the households was among the main requests that were received by the pilot team from villagers, ranking second after requests for lights in households (Geirbo, 2011).
Impact of Community Power Project (Mini-grid and Community Information Centre)
Services Before Establishment of CIC (Jun-Dec ’10) After Establishment of CIC (Jan-Jul ’11) Growth
Internet Service not available US$65
ERS (mobile recharge) US$10,000 US$12,000 21%
GPPP (Public Phone) Service not available US$140
New Connection sale 177 186 5%
Handset 19 23 21%
Data Card Service not available 1
ERS: Electronic Recharge System. Source: Grameenphone
Design and Technical Overview
Community Home Lighting, 7 Watt CFL bulb (5pm to 12am)
Community Information Centre (8am to 5pm)
A separate solar and battery array were set up for community power
The mobile tower that serves as the base of the project is one of Grameenphone’s first solar base stations. It is powered primarily by an 8.5kW peak solar PV array connected to a 2200 Ah battery bank. It also has a backup diesel generator that rarely runs. In 2010 it only ran for about 20 hours in the year. For the community power project, the team decided to set up a separate 3.17 kW solar array with a 400Ah battery bank rather than sharing or expanding the main one. This was probably unnecessary, but was the easiest way to keep the pilot separate from the core power system. The systems do share the backup generator.
The separation of systems was done to simplify the test phase and to minimise risks of tower downtime before the system was proven. In the future, Grameenphone would likely use a combined system for the tower and community rather than a separate system.
Chapter 13 59
Contents 2
Welcome 3
Meet the Team 4
Key Trends for Success Within Green Power for Mobile
1. Case Study: TeliaSonera – 6 Green Power Feasibility Study
2. Vodafone’s New Site Solution 12 Innovation Centre
3. Greenfield Communications in Cambodia 16
4. Flow Battery Technology for the 19 Telecoms Industry
5. Biannual Report – 23 Fuel Cell Deep Dive Study
Innovation from the Indian Subcontinent
6. Renewable Resource Availability in India 29
7. Energy for the Telecom Towers – 32 India Market Sizing and Forecasting
8. Introduction to the Indian 36 Vendor Landscape
Community Power from Mobile
9. Diesel Theft: The Elephant in the Room 40
10. First Things First: Establishing Data 45 Collection for Benchmarking and Measuring Impact
11. Entrepreneurship for Africa’s 49 Phone Charging
12. Financial Barriers to Community Power 53 from Mobile
13. Case Study: Grameenphone Energises 57 Paharpur: Lessons Learnt One year On
Glossary 63
Resources 64

GSMA Green Power for MobileBi-annual Report December 2011
Lesson #1: Proof of Concept May be Required Before a Mobile Company Allows an Organisation to Tap into Their Energy Supply.
This PV/battery system is much larger and more expensive than optimal for a solar base station. Grameenphone’s current solar rollout is based around a 5.5 kW solar array with a 800 Ah battery and a backup generator. These serve an average load of 1.3-1.5 kW per tower. The generator is used for roughly two hours per day, the level that optimises the blend of OPEX and CAPEX. Grameenphone’s target is to power 100 base stations by solar energy by the end of 2011).
Grameenphone in the Market
History
First and largest MNO in Bangladesh
Founded as joint venture between Grameen Bank and Telenor
Long history of rural innovation.
Competitive Position
44% share by volume
52% share by revenue
$3 ARPU, 35 million subscribers
6 operators. Intense price.
Leader in Green Power and Energy Efficiency
Currently 37 solar base stations Work in progress for another 72 by 2011
OPEX model with ESCO partner: Less than $1/kWh off-grid
Rolling out energy-efficient towers
High-level climate executive: Md. Ariful Alam champions projects.
Branding and Marketing
Premium position
Wins hearts and minds with rural service delivery
Widest rural coverage in Bangladesh
Now rolling out wireless broadband.
Lesson #2: Mobile Towers are Looking at Prices that Bring them to a Delivered Cost of Energy Below the $1/kWh mark.
The Village Mini-grid System
Business Model and Economics
Business Model Lighting Mini-Grid
Business Type Corporate Social Responsibility – no return on capital expected
Capital Expense $35,000 (granted by University of Oslo)
Operating Expense Minimal. Caretaker takes 20% of revenue
Revenue Model US$2 per household per month for lighting. Some free recipients
Monthly Revenue US$272 gross, US$218 net
Chapter 13 60
Contents 2
Welcome 3
Meet the Team 4
Key Trends for Success Within Green Power for Mobile
1. Case Study: TeliaSonera – 6 Green Power Feasibility Study
2. Vodafone’s New Site Solution 12 Innovation Centre
3. Greenfield Communications in Cambodia 16
4. Flow Battery Technology for the 19 Telecoms Industry
5. Biannual Report – 23 Fuel Cell Deep Dive Study
Innovation from the Indian Subcontinent
6. Renewable Resource Availability in India 29
7. Energy for the Telecom Towers – 32 India Market Sizing and Forecasting
8. Introduction to the Indian 36 Vendor Landscape
Community Power from Mobile
9. Diesel Theft: The Elephant in the Room 40
10. First Things First: Establishing Data 45 Collection for Benchmarking and Measuring Impact
11. Entrepreneurship for Africa’s 49 Phone Charging
12. Financial Barriers to Community Power 53 from Mobile
13. Case Study: Grameenphone Energises 57 Paharpur: Lessons Learnt One year On
Glossary 63
Resources 64
GSMA Green Power for MobileBi-annual Report December 2011
Lesson #3: Customers are Effectively Paying Above $1/kWh for Access to Lighting Service.
Opportunities for Community Power and Public/Private Partnerships
An interesting finding in the broader context of Community Power from Mobile is the high effective price per kilowatt that users are willing to pay. As the system uses energy-efficient compact fluorescent light bulbs, it grosses US$1.36 per kilowatt hour, or roughly ten times the price from a typical electrical grid. This price level makes many more small-scale power projects, including solar power with batteries, economically viable if most of the energy produced can be sold. However, if the capital costs of the mini-grid and the generation are rolled in, then even this price point is not enough to repay the capital in a commercial model unless substantially more customers are served by the system. This points to possible public-private partnerships, where a government rural energy agency or a NGO funds the distribution and a private party generates then sells the power.
Operations and Maintenance
The first level of support, bill collector, and on-the-ground manager of the project is the manager of the CIC. He is a dedicated and hard-working individual who wants to help his community and is broadly respected by the community.
The operator is expected to clean the solar panels and make certain that the batteries are maintained. He will also flip the circuit breaker if the system becomes overloaded. Overloads happen typically when the line is illegally split, and they can be very difficult to track down. Without community buy-in to enforce rules against it, illegal line tapping can be a very large challenge for community power projects such as this. To make certain that incentives are aligned, the CIC manager receives 20% of the expected amount receivable from electrical services. The funds are deposited in a local bank that maintains a dedicated account for the project, allowing Grameenphone’s team in Dhaka to confirm that funds have been collected.
Chapter 13 61
Contents 2
Welcome 3
Meet the Team 4
Key Trends for Success Within Green Power for Mobile
1. Case Study: TeliaSonera – 6 Green Power Feasibility Study
2. Vodafone’s New Site Solution 12 Innovation Centre
3. Greenfield Communications in Cambodia 16
4. Flow Battery Technology for the 19 Telecoms Industry
5. Biannual Report – 23 Fuel Cell Deep Dive Study
Innovation from the Indian Subcontinent
6. Renewable Resource Availability in India 29
7. Energy for the Telecom Towers – 32 India Market Sizing and Forecasting
8. Introduction to the Indian 36 Vendor Landscape
Community Power from Mobile
9. Diesel Theft: The Elephant in the Room 40
10. First Things First: Establishing Data 45 Collection for Benchmarking and Measuring Impact
11. Entrepreneurship for Africa’s 49 Phone Charging
12. Financial Barriers to Community Power 53 from Mobile
13. Case Study: Grameenphone Energises 57 Paharpur: Lessons Learnt One year On
Glossary 63
Resources 64
Lesson #4: Fixed Monthly Rates can Simplify the Bill Collection System and Allow for Easier Remote Monitoring.
Challenges and Obstacles ■ Agricultural cycles impact fee collection ■ Prompt disconnect of non-payers is currently difficult ■ Remote location makes innovation, maintenance and
monitoring difficult.
Collection of payments has been very high (> 95%) until July 2011 when they dropped off sharply to 65%. Cash income is not regular all year round due to agricultural cycles, and there is also labour migration to cities in the summer which means that the cash earners in the household can be away for months at a time. In the original design of the system, the circuit breaker was inaccessible to the local operator. This meant that if the system was overloaded, a technician had to take a 10 hour trip to the site from the capital city to flip the breaker. The breaker has been moved to be accessible, making it much easier for basic problems to be solved locally. Although people were credited for the days where the system was off, it is likely that some felt they should not pay at all for this level of service. This challenge points to the need for simple and affordable pre-pay meters to be installed in community power projects.
When it was necessary to disconnect a line, the team ran into a problem because the line had been run through the non-paying customer’s house to a paying customer’s house. Therefore they could not disconnect the non-payer without also alienating a good customer. In the future, they will ensure that every house is wired individually. Some other micro-utilities rely on group dynamics like these to help guarantee payment: if you don’t pay, your neighbours lose their lights too.
Finally, the remoteness of the location is a serious challenge. It is at least a 10 hour journey by car and boat through very bad roads. It was chosen for the project because it was very unlikely to be connected to the national grid for decades to come. But this same characteristic makes it very time-consuming and expensive for Grameenphone staff to visit the site and try out new ideas.

GSMA Green Power for MobileBi-annual Report December 2011
The Future
The team at Grameenphone and University of Oslo are continuing to think creatively about how to improve the model and provide better service. In order to achieve a self-sustaining solution capacity will be expanded gradually in accordance with local conditions. The engineers are working on a small biogas plant that will use locally available animal waste to run a generator. This will substantially increase the capacity of the system and will bring down the per unit electricity cost. They also have many requests for connection from the local school, market shops, and other residents. The University of Oslo is also monitoring and evaluating the project on a regular basis to see the difference it has made to the lives of villagers.
If you have any specific questions on any aspect of the Grameenphone project that has been overlooked in this article please contact the CPM team with your questions; [email protected].
Thanks are owed to Ariful Alam (head of the Climate Project for Grameenphone) and Dr Hanne Cecilie Geirbo1 of the University of Oslo for their assistance in organising and supporting Xavier’s field visit to Pahapur and the community site.
Chapter 13 62
1 Geirbo, Hanne Cecilie (2011), The Community Power Concept: Mitigating the urban-rural digital divide with renewable energy mini-grids. Selected Papers of the Information Systems Research Seminar in Scandinavia. Nr. 2 (2011): IRIS 34 ICT of Culture – Culture of ICT ISSN 1891-9863
Contents 2
Welcome 3
Meet the Team 4
Key Trends for Success Within Green Power for Mobile
1. Case Study: TeliaSonera – 6 Green Power Feasibility Study
2. Vodafone’s New Site Solution 12 Innovation Centre
3. Greenfield Communications in Cambodia 16
4. Flow Battery Technology for the 19 Telecoms Industry
5. Biannual Report – 23 Fuel Cell Deep Dive Study
Innovation from the Indian Subcontinent
6. Renewable Resource Availability in India 29
7. Energy for the Telecom Towers – 32 India Market Sizing and Forecasting
8. Introduction to the Indian 36 Vendor Landscape
Community Power from Mobile
9. Diesel Theft: The Elephant in the Room 40
10. First Things First: Establishing Data 45 Collection for Benchmarking and Measuring Impact
11. Entrepreneurship for Africa’s 49 Phone Charging
12. Financial Barriers to Community Power 53 from Mobile
13. Case Study: Grameenphone Energises 57 Paharpur: Lessons Learnt One year On
Glossary 63
Resources 64

GSMA Green Power for MobileBi-annual Report December 2011 63Glossary
Glossary2G/3G – Second-generation and third-generation mobile telephone technologyAC/Alternating Current – An electrical current or voltage with a changeable direction (polarity) with respect to a fixed referenceAh/Ampere-hour – Unit of electric charge, the electric charge transferred by a steady current of one ampere for one hourARPU – Average Revenue per UserBoP – Base of PyramidBTS/Base Transceiver Station – The name for the antenna and radio equipment necessary to provide mobile service in an areaCAPEX – Capital ExpenditureCO2e/Carbon dioxide equivalency – A quantity that describes, for a given mixture and amount of greenhouse gas, the amount of CO2 that would have the same global warming potential when measured over a specified timescale.COAI – Cellular Operators Association of IndiaCPM – Community Power from Mobile, GPM projectDC/Direct Current – An electrical current or voltage with a constant direction (polarity) with respect to a fixed referenceESCO – Energy Service CompanyGDP – Gross Domestic ProductGE – General ElectricsGHG – Green House GasesGPM – GSMA Green Power for Mobile ProgrammeGPRS – General Packet Radio ServiceGSM – Global System for Mobile communicationsGSMA – GSM Association
IFC – International Finance Corporation – a member of the World Bank GroupIRR – Internal Rate of Returnkg/kilogram – A kilogram is a unit of masskm/kilometre – A kilometre is a measure of distanceKPI – Key Performance IndicatorkVA/Kilovolt-Ampere – The unit of apparent power. KVA is used for measuring the power consumption of non-resistive equipments such as generatorskW/kilowatt – A kilowatt is a unit of power (see watt)MEE – Mobile Energy Efficiency, GSMA InitiativeMHz/megahertz – The hertz is a unit of frequency. It is defined as the number of complete cycles per second.MSC/Mobile Switching Centre – Interface between the base station system, ie the BTS and the switching subsystem of the mobile phone networkOPERATOR – Mobile Network OperatorNGO – Non Governmental OrganisationNPV – Net Present ValueOPEX – Operating ExpenditurePV/Photovoltaic – In this instance refers to PV cells which convert visible light into direct currentROI – Return on InvestmentV/volt – The value of the voltage equal to one ampere at one watt of powerW/watt – A unit of electrical power equal to one ampere under a pressure of one volt
Contents 2
Welcome 3
Meet the Team 4
Key Trends for Success Within Green Power for Mobile
1. Case Study: TeliaSonera – 6 Green Power Feasibility Study
2. Vodafone’s New Site Solution 12 Innovation Centre
3. Greenfield Communications in Cambodia 16
4. Flow Battery Technology for the 19 Telecoms Industry
5. Biannual Report – 23 Fuel Cell Deep Dive Study
Innovation from the Indian Subcontinent
6. Renewable Resource Availability in India 29
7. Energy for the Telecom Towers – 32 India Market Sizing and Forecasting
8. Introduction to the Indian 36 Vendor Landscape
Community Power from Mobile
9. Diesel Theft: The Elephant in the Room 40
10. First Things First: Establishing Data 45 Collection for Benchmarking and Measuring Impact
11. Entrepreneurship for Africa’s 49 Phone Charging
12. Financial Barriers to Community Power 53 from Mobile
13. Case Study: Grameenphone Energises 57 Paharpur: Lessons Learnt One year On
Glossary 63
Resources 64

GSMA Green Power for MobileBi-annual Report December 2011 64Resources
Resourceshttp://gsmworld.com/our-work/mobile_planet/green_power_for_mobile/resources.htm
HOMER Software – Training Guide for Renewable Energy Base Station Design
http://www.gsmworld.com/documents/homer_training_guide_210X297.pdf
A free software application used to design and evaluate technically and financially the options for off-grid and on-grid power systems for remote, stand alone and distributed generation applications.
Contents 2
Welcome 3
Meet the Team 4
Key Trends for Success Within Green Power for Mobile
1. Case Study: TeliaSonera – 6 Green Power Feasibility Study
2. Vodafone’s New Site Solution 12 Innovation Centre
3. Greenfield Communications in Cambodia 16
4. Flow Battery Technology for the 19 Telecoms Industry
5. Biannual Report – 23 Fuel Cell Deep Dive Study
Innovation from the Indian Subcontinent
6. Renewable Resource Availability in India 29
7. Energy for the Telecom Towers – 32 India Market Sizing and Forecasting
8. Introduction to the Indian 36 Vendor Landscape
Community Power from Mobile
9. Diesel Theft: The Elephant in the Room 40
10. First Things First: Establishing Data 45 Collection for Benchmarking and Measuring Impact
11. Entrepreneurship for Africa’s 49 Phone Charging
12. Financial Barriers to Community Power 53 from Mobile
13. Case Study: Grameenphone Energises 57 Paharpur: Lessons Learnt One year On
Glossary 63
Resources 64
Green Power for Mobile Vendor Directory
http://www.gsmworld.com/documents/vendor_catalogue.pdf
Community Power from Mobile White Paper (December 2011)
http://www.gsmworld.com/documents/CP_White_Paper_161211_interactive2.pdf
Harnessing The Full Potential of Mobile for Off-Grid EnergyMary Roach and Charlotte Ward – December 2011
Green Power for India Interactive Replication Guide
http://www.gsmworld.com/our-work/mobile_planet/green_power_for_mobile/Interactive_Indian_Replication_Guide/
Green Power Vendor Landscape in India
http://www.gsmworld.com/documents/GSMA_Vendor_Landscape_India_040811_4.pdf

GSMA Green Power for MobileBi-annual Report December 2011 65Resources
Green Power Feasibility Study – Digicel, Haiti
http://www.gsmworld.com/documents/digicel_haiti_04_10_med_res.pdf
Comissioned by Digicel Haiti, this study analyses the operator’s network and proposes an implementation plan for a green power network.
Green Power Feasibility Study – MTN Uganda
http://www.gsmworld.com/documents/gpfm_mtn_feasibilitystudy_pages.pdf
Comissioned by Digicel Haiti, this study analyses the operator’s network and proposes an implementation plan for a green power network.
Green Power for Mobile: Charging Choices (2011)
http://www.gsmworld.com/documents/charging_choices_ 2011.pdf
Community Power Feasibility Study – Zantel, Tanzania
http://www.gsmworld.com/documents/ zantel_tanzania_page_layout(1).pdf
A Feasibility Study to analyse the operator’s network and propose an implementation plan for a green power network..
Green Power for Mobile Replication Guide
http://www.gsmworld.com/documents/replication_guide.pdf
An interactive toolkit to help mobile network operators choose the right energy solution for phone masts of tomorrow.
Indian Market Sizing Forecast
http://www.gsmworld.com/documents/gpm/Marketing_Sizing_A4_v2.pdf
Green Power for Mobile Charging Choices 2011Mobile Phone Charging Solutions in the Developing World
Contents 2
Welcome 3
Meet the Team 4
Key Trends for Success Within Green Power for Mobile
1. Case Study: TeliaSonera – 6 Green Power Feasibility Study
2. Vodafone’s New Site Solution 12 Innovation Centre
3. Greenfield Communications in Cambodia 16
4. Flow Battery Technology for the 19 Telecoms Industry
5. Biannual Report – 23 Fuel Cell Deep Dive Study
Innovation from the Indian Subcontinent
6. Renewable Resource Availability in India 29
7. Energy for the Telecom Towers – 32 India Market Sizing and Forecasting
8. Introduction to the Indian 36 Vendor Landscape
Community Power from Mobile
9. Diesel Theft: The Elephant in the Room 40
10. First Things First: Establishing Data 45 Collection for Benchmarking and Measuring Impact
11. Entrepreneurship for Africa’s 49 Phone Charging
12. Financial Barriers to Community Power 53 from Mobile
13. Case Study: Grameenphone Energises 57 Paharpur: Lessons Learnt One year On
Glossary 63
Resources 64Green Power for Mobile: Top Ten Findings
http://www.gsmworld.com/documents/green_power_top10.pdf
Green power for Mobile Bi-Annual Report (June 2010)
http://www.gsmworld.com/documents/GPM_Bi-Annual_Report_June_10.pdf
Green power for Mobile Bi-Annual Report (November 2010)
http://www.gsmworld.com/documents/GPM_Bi-Annual_Report_Nov10.pdf
Community Power – Using Mobile to Extend the Grid
http://www.gsmworld.com/documents/gpfm_community_power11_white_paper_lores.pdf
Green Power for Mobile: Charging Services (2011)
http://www.gsmworld.com/documents/charging_services_ 2011.pdf

GSMA Head OfficeSeventh Floor, 5 New Street Square, New Fetter Lane, London EC4A 3BF UK Tel: +44 (0)207 356 [email protected]
©GSMA December 2011