BHP Billiton Plc 171 Collins Street Neathouse Place ... · 8/19/2014 · UNLOCKING SHAREHOLDER...
98
To: Australian Securities Exchange New York Stock Exchange UNLOCKING SHAREHOLDER VALUE PRESENTATION Attached are the presentation slides for a presentation that will be given by the Chief Executive Officer and Chief Financial Officer shortly. The Webcast for this presentation can be accessed at: http://www.media-server.com/m/p/fz6a4nkm Nicole Duncan Company Secretary 19 August 2014 BHP Billiton Limited BHP Billiton Plc 171 Collins Street Neathouse Place Melbourne Victoria 3000 Australia London SW1V 1LH UK GPO BOX 86 Tel +44 20 7802 4000 Melbourne Victoria 3001 Australia Fax + 44 20 7802 4111 Tel +61 1300 55 47 57 Fax +61 3 9609 3015 bhpbilliton.com bhpbilliton.com For personal use only
Transcript of BHP Billiton Plc 171 Collins Street Neathouse Place ... · 8/19/2014 · UNLOCKING SHAREHOLDER...

To: Australian Securities Exchange
New York Stock Exchange
UNLOCKING SHAREHOLDER VALUE PRESENTATION
Attached are the presentation slides for a presentation that will be given by the Chief Executive Officer and Chief Financial Officer shortly.
The Webcast for this presentation can be accessed at:
http://www.media-server.com/m/p/fz6a4nkm
Nicole Duncan Company Secretary
19 August 2014
BHP Billiton Limited BHP Billiton Plc 171 Collins Street Neathouse Place Melbourne Victoria 3000 Australia London SW1V 1LH UK GPO BOX 86 Tel +44 20 7802 4000 Melbourne Victoria 3001 Australia Fax + 44 20 7802 4111 Tel +61 1300 55 47 57 Fax +61 3 9609 3015 bhpbilliton.com bhpbilliton.com
For
per
sona
l use
onl
y

Unlocking shareholder value
Andrew Mackenzie Chief Executive Officer
19 August 2014
Escondida F
or p
erso
nal u
se o
nly

Disclaimer
UK Financial Services and Markets Act 2000 approval
The contents of this presentation, which have been prepared by and are the sole responsibility of BHP Billiton, have been approved by Goldman Sachs International solely for the
purposes of section 21 of the United Kingdom’s Financial Services and Markets Act 2000 (as amended). Goldman Sachs International, which is authorised by the Prudential
Regulation Authority and regulated by the Financial Conduct Authority and the Prudential Regulation Authority in the United Kingdom, is acting for BHP Billiton and no one else in
connection with the proposed demerger of the new company (NewCo) and will not be responsible to anyone other than BHP Billiton for providing the protections afforded to clients of
Goldman Sachs International, or for giving advice in connection with the proposed demerger of NewCo or any matter referred to herein.
Forward-looking statements
This presentation contains forward-looking statements, which may include statements regarding: trends in commodity prices and currency exchange rates; demand for commodities;
plans, strategies and objectives of management; closure or divestment of certain operations or facilities (including associated costs); anticipated production or construction
commencement dates; capital costs and scheduling; operating costs and shortages of materials and skilled employees; anticipated productive lives of projects, mines and facilities;
provisions and contingent liabilities; tax and regulatory developments.
Forward-looking statements can be identified by the use of terminology such as ‘intend’, ‘aim’, ‘project’, ‘anticipate’, ‘estimate’, ‘plan’, ‘believe’, ‘expect’, ‘may’, ‘should’, ‘will’,
‘continue’, ‘annualised’ or similar words. These statements discuss future expectations concerning the results of operations or financial condition, or provide other forward-looking
statements.
These forward-looking statements are not guarantees or predictions of future performance, and involve known and unknown risks, uncertainties and other factors, many of which are
beyond our control, and which may cause actual results to differ materially from those expressed in the statements contained in this presentation. Readers are cautioned not to put
undue reliance on forward-looking statements.
For example, our future revenues from our operations, projects or mines described in this presentation will be based, in part, upon the market price of the minerals, metals or
petroleum produced, which may vary significantly from current levels. These variations, if materially adverse, may affect the timing or the feasibility of the development of a particular
project, the expansion of certain facilities or mines, or the continuation of existing operations.
Other factors that may affect the actual construction or production commencement dates, costs or production output and anticipated lives of operations, mines or facilities include our
ability to profitably produce and transport the minerals, petroleum and/or metals extracted to applicable markets; the impact of foreign currency exchange rates on the market prices
of the minerals, petroleum or metals we produce; activities of government authorities in some of the countries where we are exploring or developing these projects, facilities or mines,
including increases in taxes, changes in environmental and other regulations and political uncertainty; labour unrest; and other factors identified in the risk factors discussed in BHP
Billiton’s filings with the US Securities and Exchange Commission (the ‘SEC’) (including in Annual Reports on Form 20-F) which are available on the SEC’s website at www.sec.gov.
Except as required by applicable regulations or by law, the Group does not undertake any obligation to publicly update or review any forward-looking statements, whether as a result
of new information or future events.
Slide 2 Unlocking shareholder value, 19 August 2014
For
per
sona
l use
onl
y

Disclaimer (continued)
Non-IFRS financial information
BHP Billiton results are reported under International Financial Reporting Standards (IFRS) including Underlying EBIT and Underlying EBITDA which are used to measure segment
performance. This presentation also includes certain non-IFRS measures including Underlying EBIT margin, Underlying EBITDA margin, Free cash flow, Net debt and Net operating
assets. These measures are used internally by management to assess the performance of our business, make decisions on the allocation of our resources and assess operational
management. Non-IFRS measures have not been subject to audit or review and should not be considered as an indication of or alternative to an IFRS measure of profitability,
financial performance or liquidity.
UK GAAP financial information
Certain historical financial information for periods prior to FY2005 has been presented on the basis of UK GAAP, which is not comparable to IFRS or US GAAP. Readers are
cautioned not to place undue reliance on UK GAAP information.
Basis of preparation
Historical financial and production data for NewCo has been included on the same basis as reported by BHP Billiton. Figures for NewCo represent the sum of NewCo’s assets, with
no adjustments made to include overhead costs, except to the extent these were charged to the assets within BHP Billiton.
Unless specified otherwise, all references to revenue, Underlying EBITDA and Underlying EBIT exclude third party trading activities.
Unless specified otherwise, production volumes, sales volumes and capital and exploration expenditure from subsidiaries (which include Escondida, Jimblebar, BHP Billiton Mitsui
Coal and our manganese operations) are reported on a 100 per cent basis; production volumes, sales volumes and capital and exploration expenditure from equity accounted
investments (which include Antamina, Samarco and Cerrejón) and other operations are reported on a proportionate consolidation basis.
No offer of securities
Nothing in this presentation should be construed as either an offer to sell or a solicitation of an offer to buy or sell BHP Billiton securities or securities in NewCo in any jurisdiction.
Reliance on third-party information
The views expressed in this presentation contain information that has been derived from publicly available sources that have not been independently verified. No representation or
warranty is made as to the accuracy, completeness or reliability of the information. This presentation should not be relied upon as a recommendation or forecast by BHP Billiton.
No financial or investment advice – South Africa
BHP Billiton does not provide any financial or investment ‘advice’, as that term is defined in the South African Financial Advisory and Intermediary Services Act 37 of 2002, and we
strongly recommend that you seek professional advice.
Slide 3 Unlocking shareholder value, 19 August 2014
For
per
sona
l use
onl
y

Cre
ati
ng
a n
ew
glo
bal m
eta
ls a
nd
min
ing
co
mp
an
y
Worsley F
or p
erso
nal u
se o
nly

A proven strategy and financial discipline
Slide 5
• Our strategy is to own and operate large,
long-life, low-cost, expandable, upstream
assets diversified by commodity, geography
and market
• Over the last 10 years we have maintained
financial discipline and delivered exceptional
results
– our earnings increased at a CAGR of
14%1,2
– our progressive base dividend increased
at a CAGR of 17%1
– we maintained a strong balance sheet
– we returned US$64 billion3 to
shareholders for an Underlying payout
ratio of ~50%
Unlocking shareholder value, 19 August 2014
Source: Datastream.
1. Represents compound annual growth rate from FY04 to FY14.
2. Earnings includes third party trading activities. Calculated on the basis of IFRS 10, IFRS 11 and IFRIC 20 for periods FY13 onwards.
3. Includes dividends and share buy-backs over the period from FY05 to FY14 inclusive.
4. Total shareholder return calculated in US dollar terms.
5. Value as at 30 June 2014; assumes dividends are reinvested.
0
200
400
600
800
Jun2004
Jun2006
Jun2008
Jun2010
Jun2012
Jun2014
We have delivered strong outperformance (total shareholder return4, %)
US$100 invested in BHP Billiton 10 years
ago is worth almost US$5005 today
BHP Billiton Ltd BHP Billiton Plc
S&P/ASX 200 Index FTSE 100 Index
MSCI Global Metals and Mining Index For
per
sona
l use
onl
y

Our major businesses will define our success
Slide 6
• By investing primarily in our major resource
basins where the market fundamentals were
supportive we enhanced investment returns
• Our Petroleum and Potash, Copper, Iron Ore
and Coal businesses now dominate the
portfolio
– contribute 97% of Underlying EBITDA1
– generate the strongest margins
– retain the most attractive investment
options
• These exceptional businesses will drive
future performance for our shareholders
Note: Bubble size represents average analyst NPV in 2014 based on a sample size of up to 16 analysts.
1. Includes third party trading activities.
Unlocking shareholder value, 19 August 2014
FY14 Underlying EBITDA
FY14 revenue
Iron Ore
Copper
Petroleum
& Potash
Coal
Aluminium
Manganese
Nickel For
per
sona
l use
onl
y
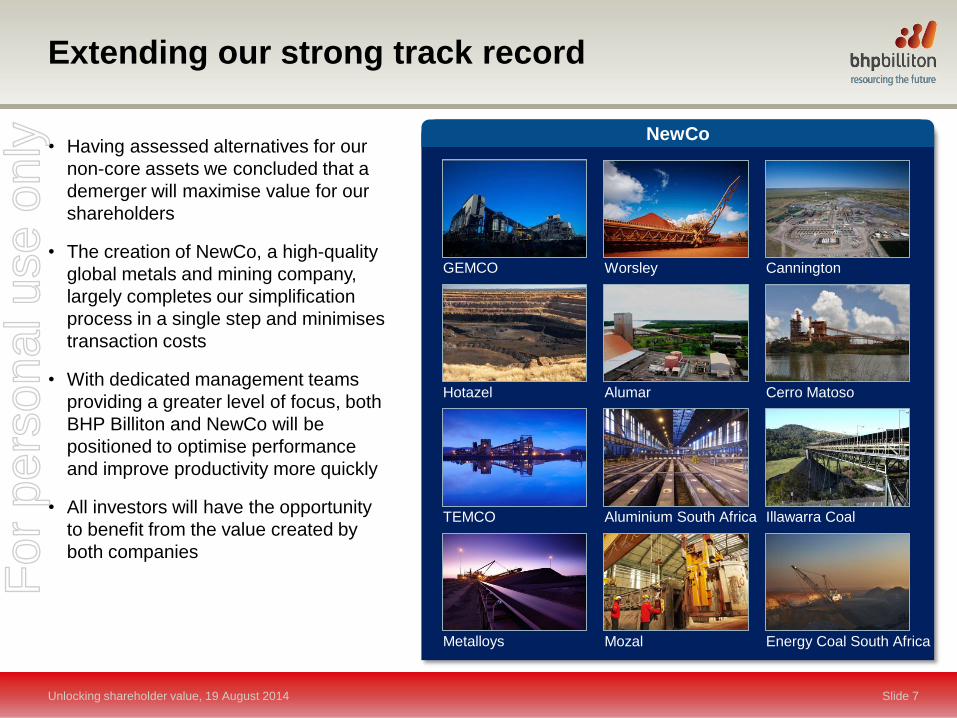
NewCo
Extending our strong track record
Slide 7
• Having assessed alternatives for our
non-core assets we concluded that a
demerger will maximise value for our
shareholders
• The creation of NewCo, a high-quality
global metals and mining company,
largely completes our simplification
process in a single step and minimises
transaction costs
• With dedicated management teams
providing a greater level of focus, both
BHP Billiton and NewCo will be
positioned to optimise performance
and improve productivity more quickly
• All investors will have the opportunity
to benefit from the value created by
both companies
Unlocking shareholder value, 19 August 2014
Energy Coal South Africa
Cerro Matoso
Illawarra Coal
Cannington
Hotazel
GEMCO
TEMCO
Metalloys Mozal
Alumar
Worsley
Aluminium South Africa
For
per
sona
l use
onl
y
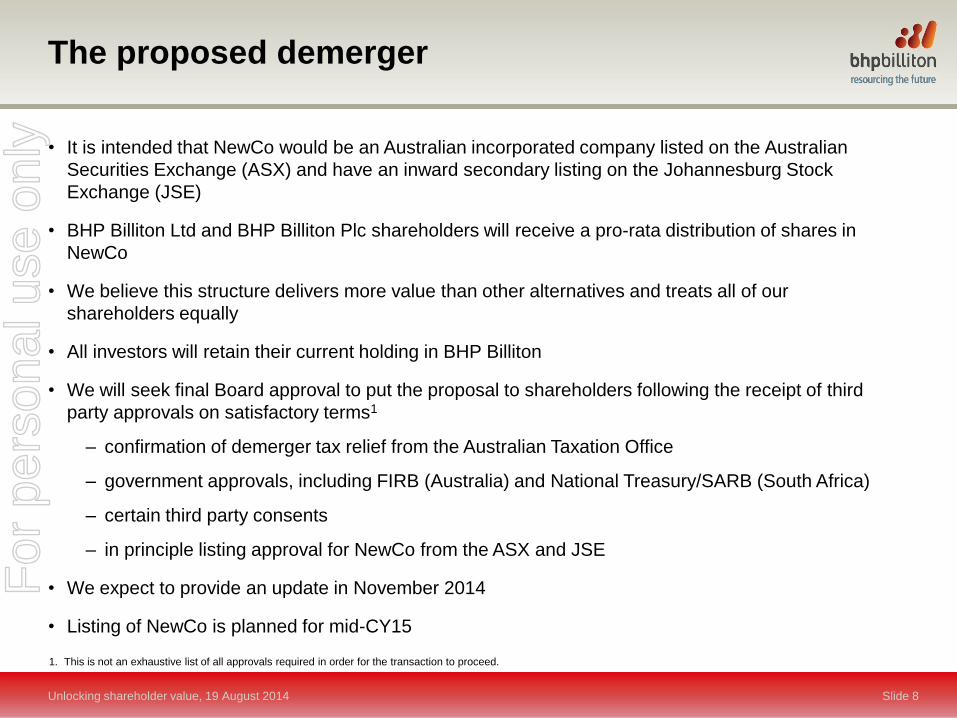
The proposed demerger
Slide 8
• It is intended that NewCo would be an Australian incorporated company listed on the Australian
Securities Exchange (ASX) and have an inward secondary listing on the Johannesburg Stock
Exchange (JSE)
• BHP Billiton Ltd and BHP Billiton Plc shareholders will receive a pro-rata distribution of shares in
NewCo
• We believe this structure delivers more value than other alternatives and treats all of our
shareholders equally
• All investors will retain their current holding in BHP Billiton
• We will seek final Board approval to put the proposal to shareholders following the receipt of third
party approvals on satisfactory terms1
– confirmation of demerger tax relief from the Australian Taxation Office
– government approvals, including FIRB (Australia) and National Treasury/SARB (South Africa)
– certain third party consents
– in principle listing approval for NewCo from the ASX and JSE
• We expect to provide an update in November 2014
• Listing of NewCo is planned for mid-CY15
Unlocking shareholder value, 19 August 2014
1. This is not an exhaustive list of all approvals required in order for the transaction to proceed.
For
per
sona
l use
onl
y

Pampa Norte
A s
imp
ler
an
d m
ore
pro
du
cti
ve B
HP
Billi
ton
For
per
sona
l use
onl
y
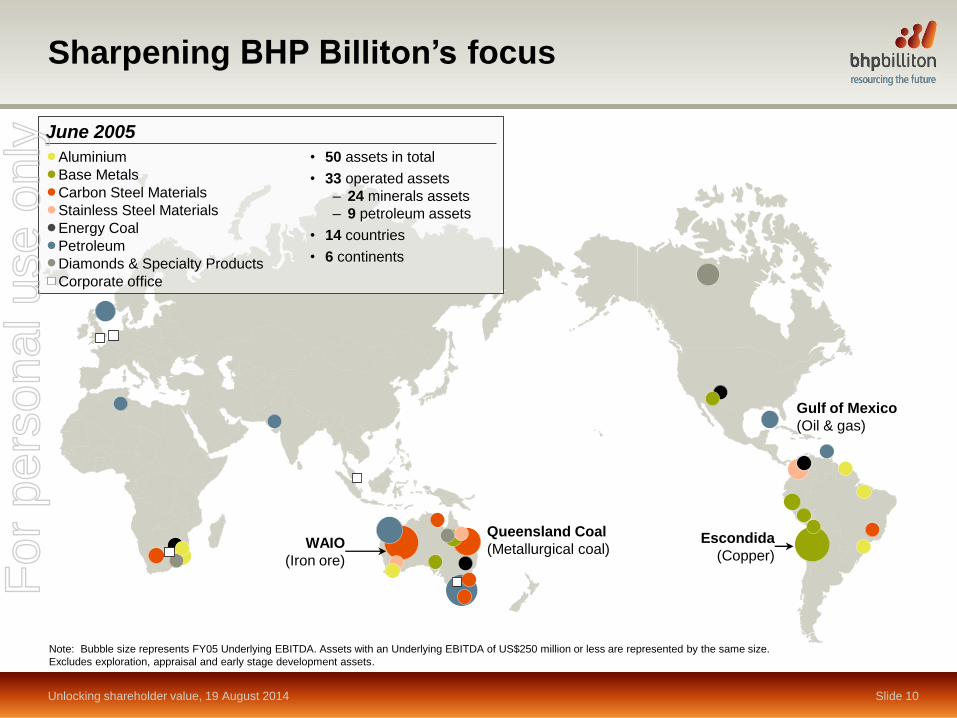
Sharpening BHP Billiton’s focus
Slide 10
Note: Bubble size represents FY05 Underlying EBITDA. Assets with an Underlying EBITDA of US$250 million or less are represented by the same size.
Excludes exploration, appraisal and early stage development assets.
Unlocking shareholder value, 19 August 2014
WAIO
(Iron ore)
Escondida
(Copper)
Queensland Coal
(Metallurgical coal)
Gulf of Mexico
(Oil & gas)
• 50 assets in total
• 33 operated assets
– 24 minerals assets
– 9 petroleum assets
• 14 countries
• 6 continents
Aluminium
Base Metals
Carbon Steel Materials
Stainless Steel Materials
Energy Coal
Petroleum
Diamonds & Specialty Products
Corporate office
June 2005
For
per
sona
l use
onl
y

Sharpening BHP Billiton’s focus
Slide 11
Jansen project
(Potash)
Unlocking shareholder value, 19 August 2014
Note: Bubble size represents FY14 Underlying EBITDA. Assets with an Underlying EBITDA of US$250 million or less are represented by the same size.
Excludes exploration, appraisal and early stage development assets.
Queensland Coal
(Metallurgical coal)
Gulf of Mexico
(Oil & gas)
WAIO
(Iron ore)
Escondida
(Copper)
Onshore US
(Oil & gas)
• 41 assets in total
• 30 operated assets
– 20 minerals assets
– 10 petroleum assets
• 13 countries
• 6 continents Corporate office
Operated major project
Petroleum & Potash
Copper
Iron Ore
Coal
Aluminium, Manganese & Nickel
June 2014
For
per
sona
l use
onl
y

Sharpening BHP Billiton’s focus
Slide 12 Unlocking shareholder value, 19 August 2014
Note: Bubble size represents FY14 Underlying EBITDA. Assets with an Underlying EBITDA of US$250 million or less are represented by the same size.
Excludes exploration, appraisal and early stage development assets.
Core assets include: Western Australia Iron Ore; Samarco; Queensland Coal; NSW Energy Coal; Cerrejón; Escondida; Olympic Dam; Pampa Norte; Antamina; Onshore US; Shenzi,
Mad Dog, Atlantis (included in Gulf of Mexico bubble); Angostura; North West Shelf; Bass Strait; Pyrenees, Macedon (included in Australian operated bubble); and Jansen project.
Jansen project
(Potash)
Queensland Coal
(Metallurgical coal)
Gulf of Mexico
(Oil & gas)
WAIO
(Iron ore)
Escondida
(Copper)
Onshore US
(Oil & gas)
• 19 assets in total
• 12 operated assets
– 7 minerals assets
– 5 petroleum assets
• 8 countries
• 3 continents Corporate office
The future ~50% reduction in the number of assets
Petroleum & Potash
Copper
Iron Ore
Coal
Operated major project
For
per
sona
l use
onl
y

1. Excludes exploration, appraisal and early stage development assets.
2. Queensland Coal comprises the BHP Billiton Mitsubishi Alliance (BMA) asset, jointly operated with Mitsubishi, and the BHP Billiton Mitsui Coal (BMC) asset operated by BHP Billiton.
A simpler and more productive organisation
Unlocking shareholder value, 19 August 2014 Slide 13
Nickel West
Smaller petroleum
assets
New Mexico Coal
Under review
Min
era
ls
Pe
tro
leu
m
Western Australia
Iron Ore
Escondida Pampa Norte Olympic Dam
Queensland Coal2 NSW Energy Coal Jansen project
Operated
Onshore US Shenzi
Pyrenees Macedon
Angostura
BHP Billiton core portfolio1
Non-operated
Mad Dog Atlantis
Bass Strait North West Shelf
Samarco Antamina
Cerrejón
For
per
sona
l use
onl
y

Retaining the benefits of diversification and
supplying commodities to the world
Slide 14
• A portfolio consisting of our core assets will
be further aligned with our differentiated
strategy
– large, long-life, low-cost, expandable,
upstream assets
– diversified by commodity, geography and
market
• We will maintain broad exposure to
steelmaking raw materials, copper, energy
and potentially agricultural markets
• This unique level of diversification and our
OECD oriented footprint affords greater
flexibility and choice as we respond to
changes in commodities demand
1. Revenue by market represents location of customer and includes third party trading activities.
Unlocking shareholder value, 19 August 2014
Iron Ore
Petroleum
Copper
Coal North America
South America
Australia
China
Diversified by commodity, geography and market (core portfolio, FY14 % contribution)
0
25
50
75
100
Revenue bycommodity¹
Revenue bygeography¹
Revenue bymarket¹
Iron Ore
Petroleum
Copper
Coal North America
South America
Australia
China
India
Japan
Other Asia
Australia
Europe
North America
RoW
For
per
sona
l use
onl
y

Delivering stronger growth and margins
Slide 15
1. Compound annual growth rate (CAGR) from FY04 to FY14. Production CAGR is calculated on a copper equivalent basis.
2. Calculated on the basis of IFRS 10, IFRS 11 and IFRIC 20 for periods FY13 onwards.
3. Includes third party trading activities.
• The core portfolio generated stronger
performance compared with the broader
portfolio over the last 10 years
– production CAGR1 of 7% (versus 4%)
– Underlying EBIT CAGR1,2,3 of 21%
(versus 15%)
– an average Underlying EBIT margin2
of 48% (versus 41%) with no increase
in volatility
0
25
50
75
FY
05
FY
06
FY
07
FY
08
FY
09
FY
10
FY
11
FY
12
FY
13
FY
14
Core portfolio
BHP Billiton
Unlocking shareholder value, 19 August 2014
A higher margin business
(Underlying EBIT margin2, %)
For
per
sona
l use
onl
y

Our unique ore bodies underpin our
competitive advantage
Slide 16
• We have more than 100 years of inventory in
our major minerals basins
• Our large hydrocarbon reservoirs underpin
our high-margin Petroleum business
• The size and quality of these resources
ensures we have a leadership position in
each of our core commodities and many of
the best investment options
• We will maintain an internal focus as we seek
to increase free cash flow and maximise
shareholder value
Unlocking shareholder value, 19 August 2014
The scale of our core assets is a differentiator (resource life1, years)
Note: The information in this report that relates to Mineral Resources is based on information compiled by Competent Persons who are Members or Fellows of The Australasian Institute of Mining and Metallurgy, Australian Institute of Geoscientists or other Recognised Professional Organisation. All are full time employees of BHP Billiton unless otherwise stated and are listed on slide 37. All information is reported under the ‘Australasian Code for Reporting of Exploration Results, Mineral Resources and Ore Reserves, 2012’ (the JORC Code). The Competent Persons consent for Petroleum Reserves and Contingent Resources is provided on slide 37. It is BHP Billiton’s opinion that all resources included have potential to be recovered and sold. Refer to detailed tables for Mineral Resources classifications (100% basis) in the Appendix, slides 38 to 39. Petroleum Proved Reserves are defined according to US SEC definitions. Petroleum Probable Reserves and Contingent Resources are defined according to the Society of Petroleum Engineers Petroleum Resource Management System (SPE PRMS). 1. Resource life is estimated from the FY13 classified Mineral Resources (except Escondida and WAIO which use FY14 figures), converted to a run-of-mine basis using historical Mineral
Resources to Ore Reserves conversion divided by the FY14 production rate on a 100% basis. Petroleum asset life is estimated by dividing net interest 2P+2C reserves and resources by net interest FY14 production (except Mad Dog which is based on FY14 production excluding the effects of the extended shutdown). Fuel consumed in operations has been excluded from petroleum reserves, resources and production.
2. The Escondida Mineral Resources information is extracted from the BHP Billiton Operational Review for the nine months ended 31 March 2014, with WAIO Mineral Resources information extracted from the BHP Billiton Operational Review for the year ended 30 June 2014. All other Mineral Resources information is extracted from the BHP Billiton FY13 Annual Report. All reports are available on www.bhpbilliton.com. The company confirms that it is not aware of any new information or data that materially affects the information included in the original market announcement and in the case of Mineral Resources that all material assumptions and technical parameters underpinning the estimates in the relevant market announcement continue to apply and have not materially changed. The company confirms that the form and context in which the Competent Persons’ findings are presented have not been materially modified from the original market announcements.
3. Based on aspirational potash capacity (10 Mtpa KCI) stated on a 100% basis.
0 50 100 150 200
Shenzi
Pyrenees
Macedon
North West Shelf
AtlantisAngosturaBass Strait
Antamina
Jansen³
Onshore US
WAIO²Pampa Norte
Mad Dog
Cerrejon
Samarco
Queensland Coal
NSWECEscondida²
Olympic Dam
Operated
Non-operated
North West Shelf
Antamina
Atlantis
Bass Strait
Samarco
Mad Dog
Cerrejon
910
For
per
sona
l use
onl
y

0
5
10
15
20
25
FY13 FY14 FY15e FY16e
We will invest selectively and maintain
financial discipline
Slide 17
• Capital and exploration expenditure declined
by 32% in FY14 and will be below our US$15
billion investment ceiling next year
• If the demerger is approved BHP Billiton’s
planned investment ceiling will be adjusted to
US$14 billion per annum beyond FY15
• By maintaining strict financial discipline we
expect to generate an average investment
return of >20%1 from the high-quality
development options in our core portfolio
• As we improve capital productivity we may
invest at the same rate to create even more
value or invest less and further increase cash
returns to shareholders
1. Ungeared, post tax, nominal rate of return for our major project options considered in the five year plan.
2. Represents the share of capital and exploration expenditure (on a cash basis) attributable to BHP Billiton shareholders. Includes BHP Billiton’s proportionate share of equity
accounted investments; excludes non-controlling interests and capitalised deferred stripping.
3. Represents forecast spend on approved major projects, maintenance and exploration.
Investing for value over volume (capital and exploration expenditure2, US$ billion)
32% reduction
Unlocking shareholder value, 19 August 2014
Demerger
Co
re p
ort
folio
3
Competition
for capital
For
per
sona
l use
onl
y

Simplicity and focus will be the catalyst for
greater productivity
Unlocking shareholder value, 19 August 2014 Slide 18
• As we concentrate our effort on 12 operated
assets and seven joint ventures in our core
portfolio we will be able to improve
productivity more quickly
– focus on our core capabilities without
distraction
– leverage our common systems and
processes to deliver continual
improvement, akin to an advanced
manufacturing process
– further simplify our management
structure, reduce duplication and
aggregate functional support
• Within our core portfolio alone we are
targeting sustainable, productivity-led gains
of at least US$3.5 billion1 by the end of FY17
1. Represents planned annualised volume and cash cost productivity gains to be delivered from our core assets only, relative to our FY14 baseline. Additional productivity-led gains
are expected to be generated by NewCo and our other non-core assets.
Escondida
For
per
sona
l use
onl
y

Growth in value and shareholder returns
Slide 19
• We see great value in a strong balance sheet
and remain committed to our solid A credit rating
• It provides the necessary confidence and
flexibility to invest selectively in our diversified
portfolio for value
• These investments underpin the future growth of
our progressive base dividend
• Following the proposed demerger we will seek
to steadily increase or at least maintain our
dividend per share, implying a higher payout
ratio
• With our rate of capital expenditure declining,
we expect future dividends to be funded by free
cash flow1
• We will also return excess capital to
shareholders in a consistent and predictable
manner
Maximise
shareholder
returns
Unlocking shareholder value, 19 August 2014
1. Subject to market volatility and financial performance.
For
per
sona
l use
onl
y
Energy Coal South Africa
A n
ew
glo
bal m
eta
ls a
nd
min
ing
co
mp
an
y
For
per
sona
l use
onl
y

A new global metals and mining company
Slide 21 Unlocking shareholder value, 19 August 2014
• A global portfolio of significance
• The new company will operate 11
assets primarily in Australia and
Southern Africa and hold a joint
venture interest in Brazil
• It will have diversified exposure to
manganese, precious metals, base
metals, metallurgical coal and
energy coal
Worsley
Aluminium
Cerro Matoso
Nickel
Alumar
Aluminium Cannington
Silver, Lead, Zinc Mozal
Aluminium
Head office
Perth
Global marketing hub
Singapore Regional head office
Global shared services
Johannesburg
Metalloys
Manganese
Illawarra Coal
Metallurgical coal Aluminium South Africa
Aluminium
Aluminium
Alumina
Energy coal
Silver
Metallurgical coal
Nickel
Australia
Brazil
Southern Africa
Colombia
Australia
Brazil
Southern Africa
Colombia
Revenue by
geography1
Underlying EBITDA
by geography1
Revenue by
commodity1
Other Asia
Europe
Southern Africa
Australia
China
Americas RoW
Revenue by
market1
Manganese
Hotazel
Manganese
GEMCO
Manganese
TEMCO
Manganese Energy Coal South Africa
Energy coal
Note: Manganese revenue and Underlying EBITDA is included on a proportional consolidation (60% interest) basis. Statutory reporting has historically been on a full consolidation
basis and is expected to change to equity accounting in H1 FY15.
1. Represents FY14. Revenue by market represents location of customer and includes third party trading activities.
For
per
sona
l use
onl
y

A dedicated board and management team will
bring renewed focus to this portfolio
Unlocking shareholder value, 19 August 2014 Slide 22
Chief Executive Officer
Graham Kerr
Group
Executive
South Africa
Board
David Crawford (Chairman)
Chief People
Officer
Group
Executive
Australia
Chief Financial
Officer
Chief
Commercial
Officer
Chief Legal
Officer
For
per
sona
l use
onl
y

A high-quality portfolio with a competitive
position in each of its commodities
Slide 23
• NewCo’s commodity exposure is high-quality,
competitively positioned in the first or second
quartile of industry cost curves
• Individually its assets are large, well capitalised
and engineered to BHP Billiton standards
• Collectively they form a robust portfolio which
will be fully integrated with common systems
and processes from day one
• By tailoring its approach to optimise this
portfolio, NewCo will seek to reduce overheads
and increase productivity to ensure it operates
at the lowest possible cost
Source: Wood Mackenzie, AME, CRU, BHP Billiton (for EBITDA only).
Note: Bubble size represents FY14 Underlying EBITDA. Manganese Underlying EBITDA is reported on a proportional consolidation (60% interest) basis. Statutory reporting has
historically been on a full consolidation basis and is expected to change to equity accounting in H1 FY15. Metallurgical coal (Illawarra) shown on margin curve position to account
for coal quality differentials. Silver cost position based on mining cost by commodity rather than by-product credits. Energy coal export tonnage rank and cash cost curve position for
the export thermal coal market.
Unlocking shareholder value, 19 August 2014
Low
est cost
Hig
hest cost
Smallest producer Largest producer
Silver
Nickel
Alumina
Aluminium
Energy coal
Metallurgical coal
A complementary portfolio of high-quality assets (company position on the cash cost curve, CY13)
Production rank (company production rank, CY13)
Manganese
For
per
sona
l use
onl
y

A high-quality portfolio with a competitive
position in each of its commodities
Slide 24
• Illawarra Coal produces high-quality, hard
coking coal with installed capacity of 9 Mtpa
– first quartile margin curve position
– 10-year average EBITDA1 US$426 million
› FY14 US$131 million
– 10-year average EBITDA1 margin 39%
› FY14 15%
Unlocking shareholder value, 19 August 2014
Production rank (company production rank, CY13)
Source: Wood Mackenzie, AME, CRU, BHP Billiton (for EBITDA only).
Note: Bubble size represents FY14 Underlying EBITDA. Metallurgical coal (Illawarra) shown on margin curve position to account for coal quality differentials. Ranks NewCo’s
CY13 metallurgical coal export tonnage against the exports of the 100 companies in the Wood Mackenzie seaborne export metallurgical curve 2013, February 2014.
1. 10-year average Underlying EBITDA from FY05 to FY14.
A complementary portfolio of high-quality assets (company position on the cash cost curve, CY13)
Low
est cost
Hig
hest cost
Smallest producer Largest producer
Metallurgical coal
For
per
sona
l use
onl
y

A high-quality portfolio with a competitive
position in each of its commodities
Slide 25
• Energy Coal South Africa is the third largest
energy coal exporter in the region with sales of
13.3 Mt1 in FY14
– second quartile cost curve position
– 10-year average EBITDA2 US$325 million
› FY14 US$315 million
– 10-year average EBITDA2 margin 21%
› FY14 25%
Unlocking shareholder value, 19 August 2014
Production rank (company production rank, CY13)
Source: Wood Mackenzie, AME, CRU, BHP Billiton (for EBITDA only).
Note: Bubble size represents FY14 Underlying EBITDA. Ranks NewCo’s CY13 thermal coal export tonnage against the exports of the 221 companies in the Wood Mackenzie
seaborne export thermal, energy adjusted curve 2013, February 2104. Cash cost curve position also based on the export thermal coal market.
1. 100% of annualised FY14 sales, NewCo share is 90%.
2. 10-year average Underlying EBITDA from FY05 to FY14.
A complementary portfolio of high-quality assets (company position on the cash cost curve, CY13)
Low
est cost
Hig
hest cost
Smallest producer Largest producer
Energy coal
For
per
sona
l use
onl
y

A high-quality portfolio with a competitive
position in each of its commodities
Slide 26
• Worsley and Alumar are large, modern
integrated alumina refineries with combined
capacity of 8.1 Mtpa (5.2 Mtpa NewCo share)
– first quartile cost curve position
– 10-year average EBITDA1 US$304 million
› FY14 US$217 million
– 10-year average EBITDA1 margin 23%
› FY14 16%
Unlocking shareholder value, 19 August 2014
Production rank (company production rank, CY13)
Source: Wood Mackenzie, AME, CRU, BHP Billiton (for EBITDA only).
Note: Bubble size represents FY14 Underlying EBITDA. Ranks NewCo’s CY13 alumina production against the 57 companies in the Wood Mackenzie cost curve,
alumina refinery costs league, 2014 Q1.
1. 10-year average Underlying EBITDA from FY05 to FY14.
A complementary portfolio of high-quality assets (company position on the cash cost curve, CY13)
Low
est cost
Hig
hest cost
Smallest producer Largest producer
Alumina
For
per
sona
l use
onl
y

A high-quality portfolio with a competitive
position in each of its commodities
Slide 27
• Hillside and Mozal have combined AP30
processing capacity of 1.3 Mtpa (1.0 Mtpa
NewCo share) and NewCo’s share of Alumar
capacity is 179 ktpa
– second quartile cost curve position
– 10-year average EBITDA1 US$584 million
› FY14 US$178 million
– 10-year average EBITDA1 margin 24%
› FY14 9%
Unlocking shareholder value, 19 August 2014
Production rank (company production rank, CY13)
Source: Wood Mackenzie, AME, CRU, BHP Billiton (for EBITDA only).
Note: Bubble size represents FY14 Underlying EBITDA. Ranks NewCo’s CY13 aluminium production against the 108 companies in the Wood Mackenzie cost curve,
aluminium smelter costs league, 2014 Q1.
1. 10-year average Underlying EBITDA from FY05 to FY14.
A complementary portfolio of high-quality assets (company position on the cash cost curve, CY13)
Low
est cost
Hig
hest cost
Smallest producer Largest producer
Aluminium
For
per
sona
l use
onl
y

A high-quality portfolio with a competitive
position in each of its commodities
Slide 28
• Cannington is the world’s largest silver mine
with production of 25.2 Moz in FY14
– first quartile cost curve position
– 10-year average EBITDA1 US$672 million
› FY14 US$459 million
– 10-year average EBITDA1 margin 55%
› FY14 43%
Unlocking shareholder value, 19 August 2014
Production rank (company production rank, CY13)
Source: Wood Mackenzie, AME, CRU, BHP Billiton (for EBITDA only).
Note: Bubble size represents FY14 Underlying EBITDA. Silver cost position based on mining cost by commodity rather than by-product credits. Ranks NewCo’s CY13 silver
production against the 117 companies in the AME cost curve.
1. 10-year average Underlying EBITDA from FY05 to FY14.
A complementary portfolio of high-quality assets (company position on the cash cost curve, CY13)
Low
est cost
Hig
hest cost
Smallest producer Largest producer
Silver
For
per
sona
l use
onl
y

A high-quality portfolio with a competitive
position in each of its commodities
Slide 29
• Cerro Matoso is one of the world’s leading
ferro-nickel assets with production of 44 kt in
FY14
– second quartile cost curve position
– 10-year average EBITDA1 US$513 million
› FY14 US$104 million
– 10-year average EBITDA1 margin 49%
› FY14 17%
Unlocking shareholder value, 19 August 2014
Production rank (company production rank, CY13)
Source: Wood Mackenzie, AME, CRU, BHP Billiton (for EBITDA only).
Note: Bubble size represents FY14 Underlying EBITDA. Ranks NewCo’s CY13 nickel production against the 82 companies in the Wood Mackenzie cost curve,
nickel industry costs league, 2014 Q1.
1. 10-year average Underlying EBITDA from FY05 to FY14.
A complementary portfolio of high-quality assets (company position on the cash cost curve, CY13)
Low
est cost
Hig
hest cost
Smallest producer Largest producer
Nickel
For
per
sona
l use
onl
y

A high-quality portfolio with a competitive
position in each of its commodities
Slide 30
• NewCo would be the world’s largest producer
of manganese ore with an interest in mines at
GEMCO in Australia and Hotazel in South
Africa
– extends across the first and second
quartiles of the cost curve
– FY14 production of 4.4 Mt (NewCo share)
• It would also be a top global producer of
manganese alloy with an interest in smelters at
TEMCO in Australia and Metalloys in South
Africa
• For the combined manganese business
– 10-year average EBITDA1 US$439 million
› FY14 US$383 million
– 10-year average EBITDA1 margin 35%
› FY14 30%
Unlocking shareholder value, 19 August 2014
Production rank (company production rank, CY13)
Source: Wood Mackenzie, AME, CRU, BHP Billiton (for EBITDA only).
Note: Bubble size represents FY14 Underlying EBITDA. Ranks NewCo’s CY13 manganese ore production against the 35 companies in the CRU Manganese Ferroalloy Market
Outlook, this excludes small Chinese and Indian producers. Given the volume of manganese ore that NewCo produces its position extends across the first and second quartiles
of the CRU cost curve. Manganese Underlying EBITDA is reported on a proportional consolidation (60% interest) basis. Statutory reporting has historically been on a full
consolidation basis and is expected to change to equity accounting in H1 FY15.
1. 10-year average Underlying EBITDA from FY05 to FY14.
A complementary portfolio of high-quality assets (company position on the cash cost curve, CY13)
Low
est cost
Hig
hest cost
Smallest producer Largest producer
Manganese
For
per
sona
l use
onl
y

A proven performer with significant upside
Slide 31
• NewCo is cash flow positive today despite
weakness in many of its commodity markets
and major expansions have been completed
• Over the past 10 years1 this portfolio generated
– 50% of Underlying EBITDA in Australia
– 33% of Underlying EBITDA in Southern
Africa
– average Underlying EBITDA margin
of 34%
• As NewCo seeks to reduce overheads and
increase productivity a 5% reduction in
operating costs would, for example, equate to
~20% of current Underlying EBITDA2
• An expected improvement in NewCo’s major
markets, as reflected in consensus estimates,
also offers significant upside
Australian assets dominate the earnings mix (Underlying EBITDA, US$ billion)
Unlocking shareholder value, 19 August 2014
Note: Underlying EBITDA and Underlying EBITDA margin includes Manganese on a proportional consolidation (60% interest) basis. Statutory reporting has historically been on a
full consolidation basis and is expected to change to equity accounting in H1 FY15.
1. 10-year average from FY05 to FY14.
2. Refers to FY14 financial performance.
0.0
2.0
4.0
6.0
FY
05
FY
06
FY
07
FY
08
FY
09
FY
10
FY
11
FY
12
FY
13
FY
14
Th
ou
sa
nd
s
Other
Southern Africa
Australia
Average Underlying
EBITDA ~1.8 x FY14
For
per
sona
l use
onl
y

Shareholders would be rewarded as margins
expand
Slide 32
• On formation, NewCo will target an
investment grade credit rating and have a
strong balance sheet with minimal net debt
before finance leases
• This structure will provide NewCo with the
flexibility to consider a dividend policy that
reflects its cash generating capacity so that
shareholders would be rewarded as margins
expand
• Low-risk brownfield investment opportunities
will become even more compelling as
operational performance improves
– Energy Coal South Africa Klipspruit
open-cut life extension
– Cannington open-cut life extension
Worsley
Unlocking shareholder value, 19 August 2014
For
per
sona
l use
onl
y

Queensland Coal
Key m
essag
es
For
per
sona
l use
onl
y

Unlocking shareholder value
Slide 34
• Having assessed alternatives for our non-core assets we concluded that a demerger will maximise
value for our shareholders
• The creation of a new high-quality global metals and mining company largely completes our
simplification process in a single step and minimises transaction costs
• With fewer assets BHP Billiton will be able to improve productivity more quickly and is targeting at
least US$3.5 billion of sustainable, productivity-led gains by the end of FY17
• NewCo will have a competitive position across a broad range of commodities
• With a dedicated team and tailored approach NewCo will seek to reduce overheads and increase
productivity to ensure it operates at the lowest possible cost
• In addition to BHP Billiton’s progressive base dividend, NewCo will have the flexibility to consider a
dividend policy that reflects its cash generating capacity
Unlocking shareholder value, 19 August 2014
For
per
sona
l use
onl
y

For
per
sona
l use
onl
y
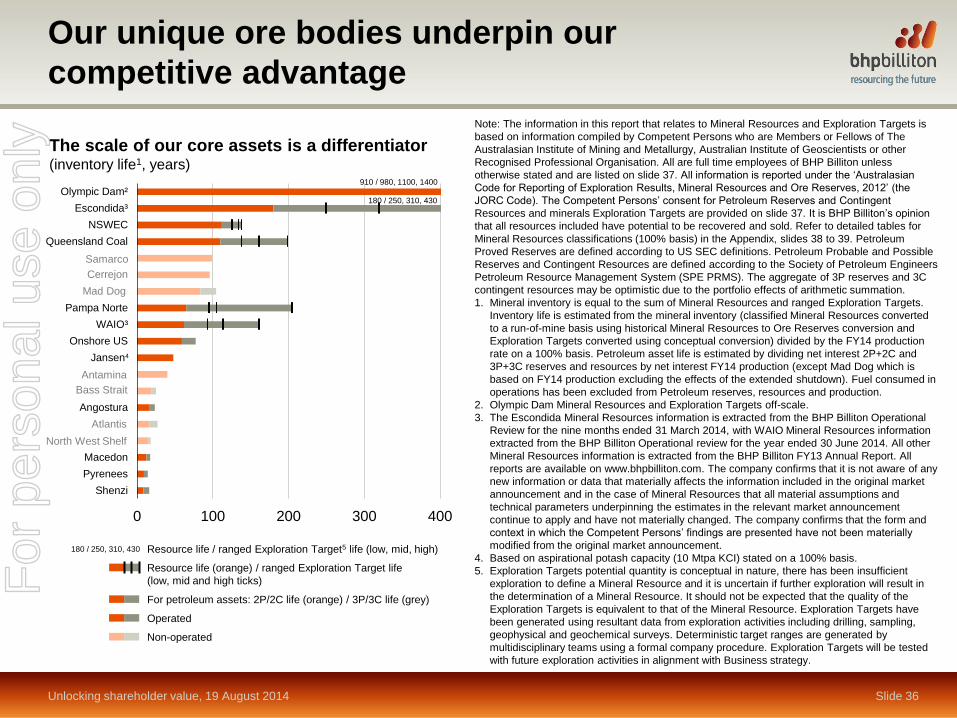
Our unique ore bodies underpin our
competitive advantage
Slide 36
The scale of our core assets is a differentiator (inventory life1, years)
Note: The information in this report that relates to Mineral Resources and Exploration Targets is
based on information compiled by Competent Persons who are Members or Fellows of The
Australasian Institute of Mining and Metallurgy, Australian Institute of Geoscientists or other
Recognised Professional Organisation. All are full time employees of BHP Billiton unless
otherwise stated and are listed on slide 37. All information is reported under the ‘Australasian
Code for Reporting of Exploration Results, Mineral Resources and Ore Reserves, 2012’ (the
JORC Code). The Competent Persons’ consent for Petroleum Reserves and Contingent
Resources and minerals Exploration Targets are provided on slide 37. It is BHP Billiton’s opinion
that all resources included have potential to be recovered and sold. Refer to detailed tables for
Mineral Resources classifications (100% basis) in the Appendix, slides 38 to 39. Petroleum
Proved Reserves are defined according to US SEC definitions. Petroleum Probable and Possible
Reserves and Contingent Resources are defined according to the Society of Petroleum Engineers
Petroleum Resource Management System (SPE PRMS). The aggregate of 3P reserves and 3C
contingent resources may be optimistic due to the portfolio effects of arithmetic summation.
1. Mineral inventory is equal to the sum of Mineral Resources and ranged Exploration Targets.
Inventory life is estimated from the mineral inventory (classified Mineral Resources converted
to a run-of-mine basis using historical Mineral Resources to Ore Reserves conversion and
Exploration Targets converted using conceptual conversion) divided by the FY14 production
rate on a 100% basis. Petroleum asset life is estimated by dividing net interest 2P+2C and
3P+3C reserves and resources by net interest FY14 production (except Mad Dog which is
based on FY14 production excluding the effects of the extended shutdown). Fuel consumed in
operations has been excluded from Petroleum reserves, resources and production.
2. Olympic Dam Mineral Resources and Exploration Targets off-scale.
3. The Escondida Mineral Resources information is extracted from the BHP Billiton Operational
Review for the nine months ended 31 March 2014, with WAIO Mineral Resources information
extracted from the BHP Billiton Operational review for the year ended 30 June 2014. All other
Mineral Resources information is extracted from the BHP Billiton FY13 Annual Report. All
reports are available on www.bhpbilliton.com. The company confirms that it is not aware of any
new information or data that materially affects the information included in the original market
announcement and in the case of Mineral Resources that all material assumptions and
technical parameters underpinning the estimates in the relevant market announcement
continue to apply and have not materially changed. The company confirms that the form and
context in which the Competent Persons’ findings are presented have not been materially
modified from the original market announcement.
4. Based on aspirational potash capacity (10 Mtpa KCI) stated on a 100% basis.
5. Exploration Targets potential quantity is conceptual in nature, there has been insufficient
exploration to define a Mineral Resource and it is uncertain if further exploration will result in
the determination of a Mineral Resource. It should not be expected that the quality of the
Exploration Targets is equivalent to that of the Mineral Resource. Exploration Targets have
been generated using resultant data from exploration activities including drilling, sampling,
geophysical and geochemical surveys. Deterministic target ranges are generated by
multidisciplinary teams using a formal company procedure. Exploration Targets will be tested
with future exploration activities in alignment with Business strategy.
Unlocking shareholder value, 19 August 2014
0 100 200 300 400
Shenzi
Pyrenees
Macedon
North West Shelf
Atlantis
Angostura
Bass Strait
Antamina
Jansen
Onshore US
WAIO³
Pampa Norte
Mad Dog
Cerrejon
Samarco
Queensland Coal
NSWEC
Escondida³
Olympic Dam²910 / 980, 1100, 1400
Cerrejon
Samarco
Mad Dog
Antamina
Atlantis
Bass Strait
North West Shelf
180 / 250, 310, 430
4
180 / 250, 310, 430 Resource life / ranged Exploration Target5 life (low, mid, high)
Resource life (orange) / ranged Exploration Target life
(low, mid and high ticks)
For petroleum assets: 2P/2C life (orange) / 3P/3C life (grey)
Operated
Non-operated
For
per
sona
l use
onl
y

Disclaimer
Unlocking shareholder value, 19 August 2014 Slide 37
Mineral Resources and Exploration Targets
This presentation includes information on:
Mineral or Coal Resources as reported by: S. O’Connell (MAusIMM) – Olympic Dam, L. Soto (MAusIMM), M Cortes (MAusIMM, both employed at Minera Escondida Limitada) –
Escondida, Pampa Escondida, Pinta Verde, R. Turner (MAusIMM, employed by Golders Associates) – Chimborazo, M. Tapia (MAusIMM) - Cerro Colorado and Spence – combined
as Pampa Norte, L. Canchis (MAusIMM, employed by Minera Antamina SA) - Antamina, S. Martinez (MAusIMM) - Goonyella Riverside Broadmeadow, Saraji, Red Hill and Saraji
East, J. Centofanti (MAusIMM) - Peak Downs and Peak Downs East, G. Lawson (MAusIMM) - Norwich Park, R. Macpherson (MAIG) - Blackwater, Daunia, Gregory Crinum and
Liskeard, P. Handley (MAusIMM) - South Walker Creek, Poitrel-Winchester, Nebo West and Bee Creek, S. Groenland (MAusIMM) - Wards Well, P. Wakeling (MAusIMM) - Mt Arthur
Coal, D. Lawrence (SACNASP, self employed) – Cerrejón, P. Whitehouse (MAusIMM), M. Lowry (MAusIMM), M. Smith (MAusIMM), D. Stephens (MAIG) – WAIO, L. Bonfioli
(MAusIMM), J. P. da Silva (MAusIMM), L. Goncalves de Rezende (MAusIMM, all employed by Samarco Mineração SA) - Samarco JV, J. McElroy (MAusIMM), B. Nemeth
(MAusIMM) – Jansen.
Exploration Targets, as reported by: S. O’Connell (MAusIMM) – Olympic Dam mineral district, M. Ipinza (MAusIMM, employed by Minera Escondida Ltda) – Escondida mineral district,
J. des Rivieres (IGI) - Cerro Colorado as Pampa Norte, N. Pranoto (MAusIMM) – BMA and N. Cox (MAusIMM) – BMC ,as Queensland Coal, P. Wakeling (MAusIMM) – Mt Arthur
Coal (NSWEC), J. Knight (MAIG) – Western Australia Iron Ore (WAIO).
Coal figures have been compiled by: R. MacPherson (MAIG) – BMA, N. Cox (MAusIMM) – BMC, P. Wakeling (MAusIMM) – NSWEC and J. Field (MAusIMM) – Cerrejón.
All Competent Person’s have the required qualifications and experience to qualify as Competent Persons for Mineral or Coal Resources or Exploration Results under the JORC Code.
The compilers verify that this report is based on and fairly reflects the Exploration Targets and Mineral Resources information and agree with the form and context of the information
presented. Mineral Resources and Exploration Targets classifications (100% basis) for each province, where relevant, are contained in Table 1. All tonnes and grade information has
been rounded, hence small differences may be present in the totals.
Exploration Targets have been generated using resultant data from exploration activities including drilling, sampling, geophysical and geochemical data. Deterministic target ranges
are generated by multi-disciplinary teams using a formal company procedure. Exploration Targets will be tested with future exploration activities in alignment with business strategy.
JORC Table 1, sections 1 and 2 have been provided as an appendix to the ASX release titled “Unlocking shareholder value” and is available on www.bhpbilliton.com for Exploration
Results that have informed Exploration Target estimates for material projects included in this presentation.
Petroleum resources
The estimates of petroleum reserves and contingent resources used to create the resource life graphic contained in this presentation are based on, and fairly represent, information
and supporting documentation prepared under the supervision of Mr. A. G. Gadgil, who is employed by BHP Billiton. Mr. Gadgil is a member of the Society of Petroleum Engineers
and has the required experience and qualifications to be a qualified petroleum reserves and resources evaluator under the ASX Listing Rules. This presentation is issued with the
prior written consent of Mr. Gadgil who agrees with the form and context in which the petroleum reserves and contingent resources are presented. Aggregates of reserves and
contingent resources estimates utilized in this presentation have been calculated by arithmetic summation of field/project estimates by category. The aggregate 1P reserves and 1C
contingent resources may be conservative due to the portfolio effects of arithmetic summation. The aggregate of 3P reserves and 3C contingent resources may be optimistic due to
the portfolio effects of arithmetic summation.
Reserves and contingent resources estimates utilised in this presentation have been estimated using deterministic methodology with the exception of the North West Shelf gas asset
in Australia where probabilistic methodology has been utilized to estimate and aggregate reserves and contingent resources for the reservoirs dedicated to the gas project only. The
reserves and contingent resources contained in this presentation exclude fuel required for operations. The custody transfer point(s)/point(s) of sale applicable for each field or project
are the reference point for reserves and contingent resources. The barrel of oil equivalent conversion is based on 6,000 scf of natural gas equals 1 boe. Unless noted otherwise,
reserves and contingent resources are as at 30 June 2013 and are on a net revenue interest basis. Where used in this presentation, the term resources represents the sum of 3P
reserves and 3C contingent resources.
BHP Billiton estimates proved reserve volumes according to SEC disclosure regulations and files these in our annual 20F report with the SEC. All unproved volumes are estimated
using SPE-PRMS guidelines which allow escalations to prices and costs, and as such, would be on a different basis than that prescribed by the SEC, and are therefore excluded
from our SEC filings. Non-proved estimates are inherently more uncertain than proved. The split of Reserves and Contingent Resources for each asset are contained in Table 2.
For
per
sona
l use
onl
y

Mineral Inventory classifications
Unlocking shareholder value, 19 August 2014 Slide 38
Mineral Resources and Exploration Targets
Table 1
Deposit
FY13 Mineral Resources
(Mt)
Range of FY14 Exploration Targets
(Mt)
ROM conversion factors
(%) FY14
ROM
production
(Mt)
Mineral
inventory
life
(Mid)
(Years)
BHP
Billiton
interest
(%)1 Measured Indicated Inferred Low Mid High Resource Exploration
Targets
Iron ore
WAIO2 2,600 @
60.0% Fe
4,200 @
59.8% Fe
15,000 @
59.0% Fe
18,000 @
56–60% Fe
31,000 @
56–60% Fe
58,000 @
56-60% Fe 66 43 250 114 88
Samarco 3,000 @
39.4% Fe
3,000 @
37.1% Fe
2,000 @
36.0% Fe - - - 50 – 41 99 50
Potash
Jansen 5,328 @
25.7% K2O –
1,288 @
25.7% K2O – – – 22 – 303 48 100
Copper
Escondida4 5,800 @
0.65% Cu
4,080 @
0.53% Cu
16,400 @
0.48% Cu
11,000 @
0.4–0.6% Cu
20,000 @
0.4–0.6% Cu
37,000 @
0.4–0.6% Cu 100 100 148 310 57.5
Pampa Norte5 593 @
0.63% Cu
1,390 @
0.49% Cu
1,280 @
0.40% Cu
1,600 @
0.43% Cu
2,200 @
0.41% Cu
7,400 @
0.40% Cu 100 100 52 110 100
Olympic Dam
1,470 @
1.02% Cu,
2g/t Ag,
0.35g/t Au,
0.30kg/t U3O8
4,840 @
0.84% Cu,
1g/t Ag,
0.34g/t Au,
0.27kg/t U3O8
3,260 @
0.70% Cu,
1g/t Ag,
0.25g/t Au,
0.23kg/t U3O8
750 @
1.08% Cu
2,400 @
1.08% Cu
4,800 @
1.08% Cu 100 100 11 1,100 100
Antamina
183 @
0.77% Cu,
10g/t Ag,
0.6% Zn
943 @
0.92% Cu,
11g/t Ag,
0.7% Zn
860 @
0.82% Cu,
11g/t Ag,
0.4% Zn
- - - 100 100 45 40 33.8
1. Interest represents the weighted average of BHP Billiton’s ownership in the individual mines comprising the deposit.
2. WAIO resources as at 30 June 2014. Interest represents weighted average of Ore Reserves.
3. Jansen based on aspirational potash capacity (10 Mtpa KCl) stated on a 100% basis.
4. Escondida includes Escondida as at 31 March 2014 and the Pampa Escondida, Pinta Verde, and Chimborazo resources as at 30 June 2013.
5. Pampa Norte consists of Spence and Cerro Colorado resources.
For
per
sona
l use
onl
y

Mineral Inventory classifications
Unlocking shareholder value, 19 August 2014 Slide 39
Coal Resources, Exploration Targets and Quality Data1
Table 1 continued
1. Indicative coal quality ranges are based on classified Coal Resources, exploration data and regional coal quality trends.
2. Interest represents the weighted average of BHP Billiton’s ownership in the individual mines comprising the deposit.
3. Queensland Coal BHP Billiton interest represents weighted average of total Mineral Inventory (Total FY13 Resources + FY14 mid-case Exploration Target).
Deposit Parameter
FY13 Mineral Resources Range of FY14 Exploration Targets ROM conversion factors
(%) FY14
ROM
production
(Mt)
Mineral
inventory
life
(Mid)
(Years)
BHP
Billiton
interest
(%)2 Measured Indicated Inferred Low Mid High Resource Exploration
Targets
Energy Coal
NSWEC –
Australia
Quantity (Bt) 0.9 2.2 0.7 1.8 2.5 3.1
77 22 26 133 100
Coal Type Th Th
Ash (%) 20.9 21.4 23.4 10.5 - 40.0
Volatile Matter (%) 30.0 29.0 28.0 15.6 - 35.0
Sulphur (%) 0.65 0.53 0.83 -
Calorific Value
(kCal/kg) 6,100 6,100 6,000 4300 - 6700
Vitrinite
Reflectance (%) - - - 0.6 - 0.9
Colombia
Quantity (Bt) 2.9 1.0 0.7 - - -
77 – 37 96 33.33
Coal Type Th -
Ash (%) 3.7 3.6 3.8 -
Volatile Matter (%) 35.1 34.5 34.4 -
Sulphur (%) 0.50 0.50 0.50 -
Calorific Value
(kCal/kg) 6,600 6,500 6,500 -
Metallurgical coal
Queensland
Coal
Quantity (Bt) 3.1 6.3 4.1 13.6 23.5 29.7
76 20 93 161 553
Coal Type Met / Th / Anth Met / Th / Anth
Ash (%) 6.0 - 11.2 5.7 - 12.4 7.1 - 15.2 5.1 - 19.0
Volatile Matter (%) 13.3 - 34.6 7.5 - 32.9 13.0 - 31.5 6.1 - 39.1
Sulphur (%) 0.31 - 2.30 0.29 - 0.79 0.29 - 0.76 -
Calorific Value
(kCal/kg) - - - 5600 - 7820
Vitrinite
Reflectance (%) - - - 0.5 - 3.1
For
per
sona
l use
onl
y

Petroleum Inventory classifications
Unlocking shareholder value, 19 August 2014 Slide 40
Petroleum Reserves and Contingent Resources split per category
Table 2
Reserves Contingent Resources
Location P1 (%) P2 (%) P3 (%) C1 (%) C2 (%) C3 (%)
Macedon 49 2 17 2 21 9
Pyrenees 30 3 24 7 26 10
Bass Strait 43 10 15 7 17 8
North West Shelf 62 14 3 6 8 7
Trinidad & Tobago 22 28 5 16 4 25
Shenzi 36 3 11 2 37 11
Atlantis 28 5 17 9 30 11
Mad Dog 17 26 5 32 7 13
Onshore US 16 3 42 15 11 13
For
per
sona
l use
onl
y

Image references
Unlocking shareholder value, 19 August 2014 Slide 41
Location BHP Billiton interest
(%)
Slide reference
Petroleum & Potash
Onshore US <1–100 13
Shenzi 44 13
Atlantis 44 13
Mad Dog 23.9 13
Bass Strait 50 13
North West Shelf 8.33–16.67 13
Pyrenees 40–71.43 13
Macedon 71.43 13
Angostura 45 13
Jansen Project 100 13
Copper
Escondida 57.5 1, 13, 18
Pampa Norte 100 9, 13
Olympic Dam 100 13
Antamina 33.75 13
Cannington 100 7
Iron Ore
Western Australia Iron Ore 851 13
Samarco 50 13
1. BHP Billiton has an effective economic interest of 85% in Western Australia Iron Ore.
2. New Mexico Coal includes the San Juan and Navajo mines. BHP Billiton sold the Navajo mine on 30 December 2013 however will retain control until full consideration is received.
Location BHP Billiton interest
(%)
Slide reference
Coal
Queensland Coal 50–80 13, 33
NSW Energy Coal 100 13
Illawarra Coal 100 7
Energy Coal South Africa 50–90 7, 20
Cerrejón 33.33 13
New Mexico Coal2 100 13
Aluminium, Manganese & Nickel
Worsley 86 4, 7, 32
Mozal 47.1 7
Aluminium South Africa 100 7
Alumar 36–40 7
Nickel West 100 13
Cerro Matoso 99.94 7
GEMCO 60 7
TEMCO 60 7
Hotazel 44.4 7
Metalloys 60 7
For
per
sona
l use
onl
y

For
per
sona
l use
onl
y

APPENDIX 1
Supporting document to the BHP Billiton presentation “Unlocking shareholder value”.
Table of contents
1 Escondida ............................................................................................................................................................. 2
2 Queensland Coal ................................................................................................................................................ 27
3 Western Australia Iron Ore ................................................................................................................................. 41
4 Units .................................................................................................................................................................... 55
For
per
sona
l use
onl
y

Appendix 1 – Competent Persons Report 2
1 Escondida
1.1 Executive summary
Escondida District
Exploration Targets as at 30 June 2014 in 100 per cent terms – reported in compliance with the 2012 JORC Code.
Project Date Low Case Mid Case High Case
Ton (Mt) %Cu Ton (Mt) %Cu Ton (Mt) %Cu
Escondida Este* Feb 2013 5,200 0.44 10,000 0.48 15,000 0.47
Escondida (Deep) Mar 2011 2,000 0.55 3,600 0.55 7,500 0.62
Escondida Norte (Deep) Oct 2012 1,800 0.33 2,800 0.30 5,000 0.35
Chimborazo (Deep) Oct 2011 1,000 0.50 2,000 0.35 6,600 0.32
Baker Hypogene Feb 2012 600 0.31 800 0.31 1,100 0.31
Baker Supergene Feb 2012 50 0.43 80 0.45 150 0.38
Hamburgo Oct 2012 200 0.48 400 0.53 800 0.56
Rincones Mar 2009 100 0.47 200 0.47 700 0.47
Pamela Oxide Nov 2011 30 0.70 30 0.72 50 0.73
Total 11,000 0.47 20,000 0.46 37,000 0.47
* Updated to be consistent with additional data reported as Escondida Mineral Resources as of 31 March 2014.
Exploration Targets potential quantity is conceptual in nature, there has been insufficient exploration to define a
Mineral Resource and it is uncertain if further exploration will result in the determination of a Mineral Resource.
It should not be expected that the quality of the Exploration Targets is equivalent to that of the Mineral
Resource.
The estimates are based on exploration results of projects in and around the Escondida and Escondida Norte
mineral deposits, are all of porphyry copper style of mineralisation, and are currently developed at varying
degrees of project maturity and therefore exploration drilling density.
Estimations were performed within a facilitated process called Resource Range Analysis (RRA), in which
deterministic estimates of potential volumes and grades are made over a range of assumptions on continuity
and extension that are consistent with available data and genetic models of porphyry copper style of
mineralisation.
For
per
sona
l use
onl
y

Appendix 1 – Competent Persons Report 3
1.2 Competent Person acknowledgement
This Competent Persons Report, which provides supporting documentation for the Exploration Targets estimate for
the Escondida mining district as at 31 March 2014 was prepared under the direction of the Competent Person
listed below (Table 1.1).
The Competent Person verify that:
he has full knowledge of information contained in this report relating to the estimation of the Exploration Targets
of the said deposits;
the Exploration Targets are estimated in accordance with the relevant assessment criteria contained in Table 1
of the JORC Code;
he is a member of the AusIMM, and has the relevant experience and competency required by the JORC Code;
and
material issues are transparently disclosed on an ‘if not, why not’ basis.
Table 1.1: Escondida Exploration Targets Competent Persons
Name Professional Membership Title
Marco Ipinza Member of the Australasian Institute of Mining and Metallurgy ( #316626)
Superintendent, Cluster Exploration, employee of Minera Escondida,
Ltda
1.3 Introduction
Escondida is one of the largest open-pit porphyry copper operations in the world, owned by BHP Billiton (57.5 per
cent), Rio Tinto (30 per cent), JECO Corporation consortium comprising Mitsubishi, Nippon Mining and Metals (10
per cent) and JECO 2 Ltd (2.5 per cent). The Mining Exploitation right is granted from the Chilean Government and
is valid indefinitely (subject to payment of annual fees).
Escondida is located in the Atacama Desert, Chile, 170 km southeast of the city of Antofagasta and produces
copper cathode and copper concentrate. The cathodes are transported by privately owned rail to ports at
Antofagasta and Mejillones and concentrate is transported by the Escondida owned pipeline to its Coloso port
facilities.
The district is anchored by two mineral deposits, Escondida and Escondida Norte, that comprise the mining
component of the Escondida operations that is reported as a singular operating entity. Exploration activities began
in 2000 to better establish the complete metal endowment of the Minera Escondida Ltda. (MEL) tenement. Major
successes include the discovery of the concealed Pampa Escondida porphyry Cu-Au deposit in late 2006, followed
by the discovery of Escondida Este deposit in 2009. However, exploration activities have identified a number of
smaller deposits and are investigating extensions of the Escondida and Escondida Norte deposits where these
continue to be open at depth. These projects are currently at different stages of development and study. This report
describes results of the early and advanced exploration projects and is issued in support of the BHP Billiton
declaration of Exploration Targets in the Escondida mining tenement as part of the “Unlocking Shareholder value”
publication.
1.4 Tenure
Escondida has a Mining Exploitation right for mining the ore bodies of the Escondida and Escondida Norte deposits
as well as Exploration Lease rights for select properties surrounding the existing operation. A Mining Exploitation
concession permits the concession holder to mine the area indefinitely with an annual payment of corresponding
license fees.
For
per
sona
l use
onl
y

Appendix 1 – Competent Persons Report 4
The Mining Exploitation and Exploration Lease rights have been obtained according to the Political Constitution
and current mining laws of Chile and are administered in-house by the Escondida Mining Concessions Department.
The infrastructure and the pipeline corridor to the coast are administered under an ‘Easement’, Right of Way
permits and maritime concessions. There are no impediments (environmental, legal, socioeconomic or
infrastructure permits or factors) which can obstruct the current mining operation.
Figure 1.1 shows the Mining Property boundaries of Escondida.
Figure 1.1: Escondida location plan and property boundaries
1.5 Regional Geology
The Escondida and Escondida Norte copper deposits lie in the Escondida-Sierra de Varas shear lens of the
Domeyko Fault System (Mpodozis et al., 1993). Both deposits are supergene-enriched copper-molybdenum
porphyries with primary mineralisation related in space and time to multi-phase middle Eocene to early Oligocene
intrusive bodies of monzonite to granodiorite composition. Cretaceous and Palaeozoic volcanic and volcaniclastic
units of andesite and rhyolite host the porphyry bodies and important quantities of mineralisation. Figure 1.2
presents the regional geology that includes locations of the more important projects that comprise the Exploration
Targets.
Ore Reserves are currently defined in the Escondida and Escondida Norte deposits, which are considered to be
part of a relatively long-lived cluster of mid-Eocene to early Oligiocene (44-33 Ma) multiphase porphyritic stocks of
biotite granodiorite composition, hosted by intrusive and extrusive rocks of Palaeozoic and Cretaceous ages. In
Escondida, several intrusive pulses ~38-36 Ma in age can be distinguished from cross-cutting relationships that are
hosted in andesitic rocks of Cretaceous age. Escondida Norte is associated with an intrusive system of similar age
to Escondida that is hosted by Palaeozoic-aged rhyolite complex that overlies an andesite volcaniclastic unit, both
part of the La Tabla formation.
For
per
sona
l use
onl
y

Appendix 1 – Competent Persons Report 5
Figure 1.2: Regional geological setting of the Escondida-Escondida Norte deposits, showing major exploration and
development project (Chimborazo lies north of the map area). Geology modified from Urzúa, 2009 in Hervé et al., 2012.
Overprinting the primary mineralisation, a secondary supergene leaching and enrichment process occurring
14-18 Ma developed the large part of historical production and current Ore Reserves. A nearly barren supergene
leached cap was developed in the near-surface environment, with the local formation of high-grade copper oxide
mineralisation (predominately brochantite). The enrichment process importantly generated laterally-continuous and
sub-horizontal high-grade sulphide mineralisation zones across the deposit. The dominant copper sulphide
minerals within the supergene mineral zone are chalcocite and covellite. The primary hypogene mineralisation is
mainly present in the deepest parts of the ore body and is defined with the presence of chalcopyrite and bornite.
For
per
sona
l use
onl
y

Appendix 1 – Competent Persons Report 6
Mineral Resources that are exclusive of Ore Reserves occur in deep and peripheral sectors of Escondida and
Escondida Norte, and in the advanced projects of Pampa Escondida, Pinta Verde, and Chimborazo (Figure 1.2).
These projects are also associated with granodiorite porphyry intrusives, with Pampa Escondida and Pinta Verde
occurring within the Escondida cluster. Pampa Escondida is located between Escondida and Escondida Norte,
spatially continuous in a NE trend and of slightly younger age (36-34 Ma). Chimborazo is believed to be within a
separate porphyry cluster, located at a distance several kilometres NW of Escondida and earlier in time (41 Ma).
Significant addition of Mineral Resources in the Escondida mine since 2010 have been a result of in-fill drilling the
Escondida Este exploration project. Escondida Este and Escondida porphyry systems overlap each other in space,
but Escondida Este is associated with distinctly younger intrusive pulses compared to Escondida. Recent studies
have identified structural discontinuities in the eastern portion of Escondida that juxtapose Cretaceous host rocks to
the west (Escondida) against Palaeozoic rocks to the east (Escondida Este). These structures have been defined
by the exploration team as strands of the Panadero Fault, a regional pre-mineral structure that controlled the
emplacement of intrusive pulses related to both Escondida and Escondida Este porphyry units, as well as the
differing age of host rocks.
A major feature of porphyry copper deposits is the development of a zoned alteration system that accompanied
sulphide mineralisation. Three main alteration assemblages are recognised throughout the district as important
controls on copper grade:
Quartz-Sericite-Clay that is related in part to secondary supergene mineralisation, and in part as primary pyrite-
bearing alteration, that consists of quartz, sericite and clays that occurs with pyrite, chalcocite and covellite
association that averages 1.0 per cent total copper grade.
Potassic alteration that occurs as K-feldspar in the porphyry units and in the andesitic rocks as secondary biotite
alteration and associated with mineralisation of chalcopyrite, magnetite, primary covellite and pyrite and
averages 0.8 per cent total copper grade.
Sericite-Chlorite-Clay occurs in the periphery of the deposit, generally in more mafic host rocks. The
assemblage consists of chlorite + sericite and clays associated with pyrite, chalcopyrite, chalcocite and
molybdenite and averages 0.6 per cent total copper grade.
These zones are used as guides in exploration to establish productive porphyry stocks in the cluster, as well as to
better define estimation domains in Mineral Resource estimation.
1.6 Data acquisition
Data acquisition of exploration and advanced projects is performed by the Minera Escondida Geology team, who
provide specialist services to the exploration, mine, and resource geology teams. Description of data acquisition
procedures and protocols are sourced from the March 2014 Competent Person report for Escondida Mineral
Resources.
Geological data used for evaluation of exploration potential was derived from drill logging and geochemical
sampling of diamond core holes. All data was captured digitally, validated, and stored in an acQuire database. The
average turnaround time between sample collection and data available in the verified database was three months.
Partially validated drill holes may have been used to inform geological interpretation of projects, depending on
timing of the analysis and status of workflow. A summary of the information used to evaluate the exploration
projects is provided in Table 1.2.
For
per
sona
l use
onl
y

Appendix 1 – Competent Persons Report 7
Table 1.2: Summary of drilling information used for evaluation of Exploration Targets.
Project Date of RRA No. of DHs Length (km) Nominal Drill grid (m)
Escondida Este Feb 2013 110 185.8 500–1,000
Baker Feb 2012 83 45.4 250–500
Chimborazo (Deep)* Oct 2011 12 16.6 N/A
Escondida Norte (Deep)* Oct 2012 26 45.9 500–1,000
Escondida (Deep) Mar 2011 6 7.0 300–400
Hamburgo Oct 2012 71 59.3 300–500
Rincones Mar 2009 45 15.8 250–750
Pamela Oxides Nov 2011 163 107.2 250
* Evaluation includes consideration of drilling and interpretation of overlying Mineral Resources.
1.6.1 Drilling and logging
Since the initial exploration in the early 1980s four drilling methods have been used by Escondida:
Conventional open rotary holes;
Reverse circulation (RC) drill holes;
Diamond drilling (DDH) – HQ (63.5 mm diameter) with reduction to NQ (47.6 mm) and BQ (36.4 mm) as
required. PQ holes (85 mm) for metallurgical purposes; and
Combination of RC and diamond drilling.
Diamond drilling is the most common of the methods used in the exploration programs. Combined drill holes (RC
DDH) have been used mainly to save drilling cost by using RC to drill through barren overburden, and switching to
DDH method shortly above mineralised rock. The local presence of water will force a change in the drilling method
from RC to DDH, even if the hole is still in overburden.
With the exception of the diamond drilling in unconsolidated gravels, the average recovery (RC and diamond) for
any given lithology exceeded 90 per cent. This was calculated by either the sample weight recovery percentage of
the theoretical weight for RC samples or by direct length measurement of the drill core recovered from each sample
run.
Geological logging was captured using a Tablet-pc and entered into an acQuire database. Logged features include:
Lithology: Includes granodiorite, quartz porphyry, feldspar porphyry, andesite and breccia;
Alteration: Main and subordinate alteration, description of mineralogical species and associated intensity; and
Mineralisation: Ore minerals, proportion and relations, mineralisation styles, vein types, etc.
1.6.2 Survey
Prior to June 2000, the locations of the drill hole collars were surveyed by conventional surveying techniques after
which a high resolution GPS system was implemented. All collar locations were measured using high-definition
GPS before and after drilling, with the latter measurement considered final. Differences between both
measurements are less than 30 cm. Approximately 10 per cent of collar locations were checked by the same
contractor, but using a different surveyor. The differences reported for all of the location checks are smaller than
10 cm.
The drill hole orientation was historically determined primarily by one of three techniques: prior to 2000, single-shot
cameras collected orientation measurements at intervals of approximately 50 m; the “Maxibor” instrument that
obtained orientations at 3 m of separation from February 2000 to August 2003; and a multi-shot instrument that
determined orientations at 6 m of separation from August 2003 through 2012. The Continuous North Seeking
Gyroscope was implemented in 2012 and is still in use today.
For
per
sona
l use
onl
y

Appendix 1 – Competent Persons Report 8
Other techniques for measuring orientation have also been used for a small number of drill holes, including ATV
(Acoustic Televiewer, with orientation measurements every 10 m) and real time gyroscope (measurements every
20 m).
In general, the down-hole deviation of drill holes is minimal, rarely exceeding a cumulative deviation of 1 per 100 m
for both diamond and RC drilling. More significant cumulative deviations that average 2 per 100 m, have
occasionally occurred with high pressure RC drilling.
1.6.3 Sampling and assaying
Escondida has two core facilities, one located on site and the other located in Antofagasta. Both core facilities are
fitted with racks for drill core storage and are used for sample receiving, core logging, and sample preparation for
assay. Additionally, the site core facility has a warehouse for storing the RC drill cuttings, assay pulps, and 10
mesh rejects.
The core facilities are segregated away from the main mining operations and have restricted access regulations in
place. The facilities are managed by the Minera Escondida Ltda. Sample Control & Database Superintendent.
Diamond drill sampling was conducted on 2 m intervals, mainly obtained from hydraulic core splitting. Less than
five per cent of cores have been cut using a core saw that was recently acquired to split core of good physical core
quality. One half of the split core is sent for preparation and analysis and the remaining half stored on site for
reference and metallurgical sampling. In the case of the PQ core, one half is sent for metallurgical test work, one
quarter is sent for preparation and chemical analysis while the remaining quarter is retained for reference. RC
cuttings from 2 m sample intervals were reduced to approximately 20 kg at the rig site, using a riffle splitter
according to a standardised splitting protocol with the remainder of sample discarded.
Field duplicate samples (three per cent of total analysed samples) correspond to paired samples obtained from the
first splitting process in the case of RC and a quarter of the core in the case of DDH.
All assay samples are crushed to 90 per cent passing 10 mesh, subsequently reduced to a 1 kg sample by a rotary
splitter. The sample is then pulverised to 95 per cent passing 150 mesh to produce three 200 g duplicate pulp
samples for chemical analysis. The RC and diamond sampling flowchart is presented in Figure 1.3.
All assaying is performed externally by Geoanalítica, Verilab and SGS laboratories, located in Antofagasta, with
routine chemical analysis for TCu (Total Copper), SCu (Acid-soluble Copper), Fe (Iron) and As (Arsenic). TCu has
routinely been carried out by atomic absorption spectrometry (AAS) after a hot nitric-perchloric acid digestion,
although in a number of assays aqua regia alone was used. SCu is obtained using citric-sulphuric acid digestion,
then filtered and analysed by AAS.
Fe and As were analysed using the same digestion solutions as for TCu however the results for Fe represent only
a partial analysis, as the digestion will not remove primary oxide iron (e.g. magnetite). Fe and As have not being
routinely assayed throughout the mine history; the coverage is about 66 per cent of the data set for both elements.
To address this issue a different interpolation strategy was adopted compared to the copper grade estimation.
For
per
sona
l use
onl
y
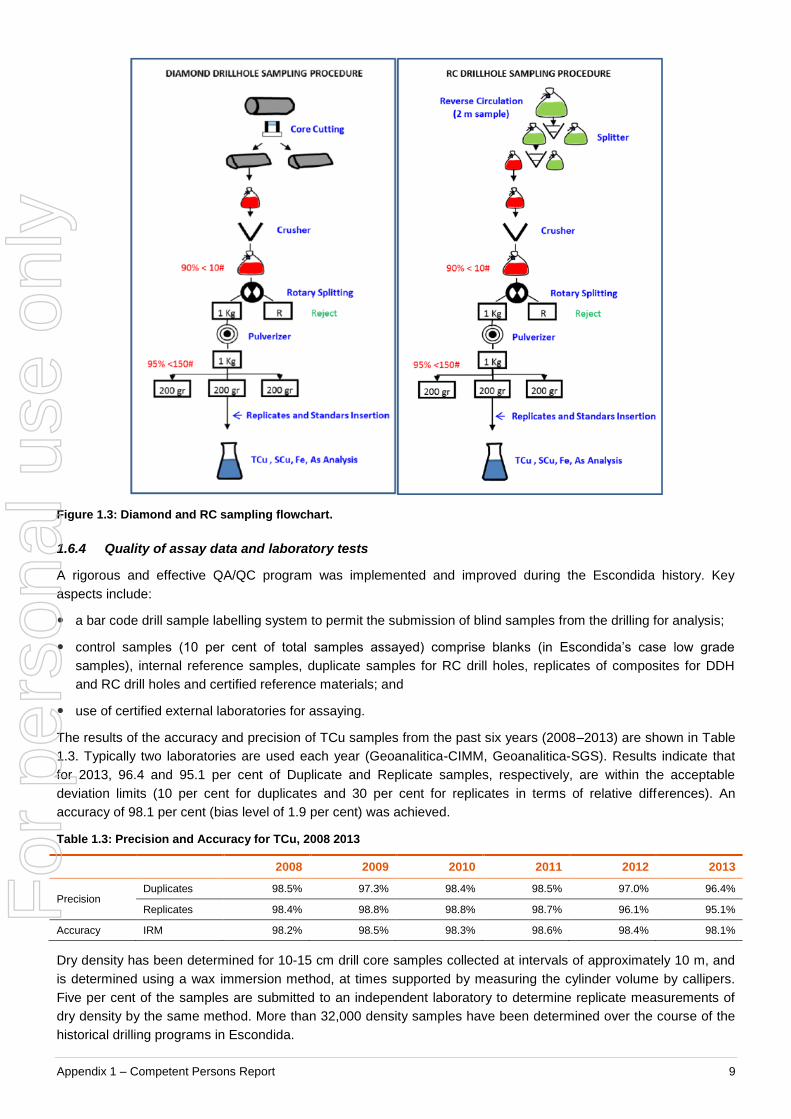
Appendix 1 – Competent Persons Report 9
Figure 1.3: Diamond and RC sampling flowchart.
1.6.4 Quality of assay data and laboratory tests
A rigorous and effective QA/QC program was implemented and improved during the Escondida history. Key
aspects include:
a bar code drill sample labelling system to permit the submission of blind samples from the drilling for analysis;
control samples (10 per cent of total samples assayed) comprise blanks (in Escondida’s case low grade
samples), internal reference samples, duplicate samples for RC drill holes, replicates of composites for DDH
and RC drill holes and certified reference materials; and
use of certified external laboratories for assaying.
The results of the accuracy and precision of TCu samples from the past six years (2008–2013) are shown in Table
1.3. Typically two laboratories are used each year (Geoanalitica-CIMM, Geoanalitica-SGS). Results indicate that
for 2013, 96.4 and 95.1 per cent of Duplicate and Replicate samples, respectively, are within the acceptable
deviation limits (10 per cent for duplicates and 30 per cent for replicates in terms of relative differences). An
accuracy of 98.1 per cent (bias level of 1.9 per cent) was achieved.
Table 1.3: Precision and Accuracy for TCu, 2008 2013
2008 2009 2010 2011 2012 2013
Precision Duplicates 98.5% 97.3% 98.4% 98.5% 97.0% 96.4%
Replicates 98.4% 98.8% 98.8% 98.7% 96.1% 95.1%
Accuracy IRM 98.2% 98.5% 98.3% 98.6% 98.4% 98.1%
Dry density has been determined for 10-15 cm drill core samples collected at intervals of approximately 10 m, and
is determined using a wax immersion method, at times supported by measuring the cylinder volume by callipers.
Five per cent of the samples are submitted to an independent laboratory to determine replicate measurements of
dry density by the same method. More than 32,000 density samples have been determined over the course of the
historical drilling programs in Escondida.
For
per
sona
l use
onl
y

Appendix 1 – Competent Persons Report 10
1.6.5 Verification of sampling and assaying
Protocols have been defined in order to assure data verification and data storage of both physical and electronic
records.
Currently the geological data is captured electronically in the field (bar codes used for RC and Diamond drill
samples) and entered directly in an acQuire database. The analytical data is electronically provided by laboratories
and loaded into the database using specifically designed and automated interfaces.
Upon capture into the database and prior to any export for modelling and resource estimation purposes, survey,
geology and assay data is validated. The database is located on the Escondida server and backed up daily.
An internal audit of the database has been completed annually since 2005. This involved a manual check on five
per cent of the information, including survey, grades, collars and geological coding (mineral zone, alteration and
lithology). These audits on average determine a total error rate of less than one per cent.
The integrity and validity of Escondida’s drilling database, is managed by the Minera Escondida Ltda. Database
Administrator, and was audited by Consultores de Recursos Minerales (CRM) in 2012. The conclusion was that the
“management of the database is competent, and the quality of the database and the contained data is more than
sufficient to support the resource estimation and reserve statement”.
1.6.6 Method of estimation
All of the projects in this report (Figure 1.4) have sufficient distribution of drill data to support evaluation of the size
and quality of the target, but at a drill spacing that is insufficient to assume continuity of mineralisation. The projects
each have sufficient drill data that reduce the importance of individual drill hole intercepts. For that reason, tables of
individual drill hole results are not given for each project, but instead a listing of the total number of holes and
meters that support high-level estimates of the exploration target size and quality.
Evaluation of each exploration project is performed with a defined process called Resource Range Analysis (RRA).
The analysis consists of a facilitated workshop that includes project-based experts with detailed knowledge of the
deposit, content experts who are external to the project, and the Exploration Results Competent Person.
The workshop participants evaluate compiled data, assumptions, and interpretations of the deposit and known
analogues to obtain three deterministic interpretations of key geological features that control size and quality of the
deposit. Each interpretation must honour the available data, but can challenge project assumptions and
interpretations in order to obtain estimates of maximum, minimum, and mid-case (or most likely) size and/or quality.
The interpretations are often aided by the use of GIS and three-dimensional geological modelling software for
volumetric determination, and reference to grade-tonnage curves for quality.
The three deterministic interpretations provide volume and grade estimates that roughly correspond to the 1st,
99th, and 50th percentile of meeting or exceeding the estimate, respectively. In general, interpretations in the low
end of the range tend to assume little to no continuity of mineralisation between widely-spaced drilling.
Interpretations at the high end assume extrapolation of mineralisation where still permissive within data and
reasonable geometry for porphyry copper deposits. These estimates are fitted to a Weibull distribution, a three-
parameter distribution generally used in reliability analysis, which then provides a probabilistic estimate of the 10th
and 90th percentile that are termed the high and low cases, respectively, and provide the basis for public reporting.
Due to the disseminated nature of mineralisation in all of the exploration projects, ore body dimensions are
estimated from multiple holes within mineralised rocks, at a 0.2% Cu cut-off or higher, and are listed as true
lengths. Bulk density assumptions are based on measurements within individual projects where sufficient
information is available, supported by historical information of samples with same lithology and alteration style. For
per
sona
l use
onl
y

Appendix 1 – Competent Persons Report 11
Figure 1.4: Location map of exploration and development projects in the Escondida mining district
1.6.7 Escondida Este
Escondida Este (EE) is the most recent of several large porphyry copper-molybdenum deposits discovered in the
Escondida district, located at depth and immediately east to southeast of the Escondida deposit (Figure 1.4). As
was the case for Pampa Escondida in 2006, EE was initially discovered from reinterpretation of historical data in
context of changing conceptual and geological models. The EE target was successfully tested by deep drill holes,
resulting in the discovery of two mineralisation zones: the northern orebody in early 2009 and the southern one in
late 2010.
For
per
sona
l use
onl
y

Appendix 1 – Competent Persons Report 12
One hundred and ten drill holes were completed within the exploration program that total 185.8 km of drilling, the
deepest to a depth of 2,000 m. Slightly more than 170 km of drill program consisted of diamond core HQ and NQ
core, with the remainder being RC pre-collar drilling. At the time of the RRA estimate in February 2013,
approximately 151 km of the drilling had been verified and in the data base. Remaining drill hole information was
completed after the RRA and used for resource estimation in May 2013. All sample preparation is completed
according to standard MEL sampling preparation protocol previously described in this document.
The drilling pattern is locally irregular due to some surface constraints caused by existing infrastructure, but angle
holes are used to obtain a more regular grid pattern at depth. Some portions of the deposit have been drilled with a
combination of exploration and mine in-fill drilling to a sample grid sufficient for Inferred Resource classification,
where other portions are drilled to a nominal grid ranging from 500 to 1,000 m (Figure 1.5). Those parts of the
deposit that have been classified as Inferred Mineral Resources (both prior and subsequent to the February 2013
RRA) have been excluded from this estimate and are included in the Escondida Mineral Resource Statement as of
31 March 2014.
Figure 1.5: Aerial photo of the Escondida mine area, showing footprint of the Escondida Este deposit, distribution of
exploration drill holes, and location of cross sections along 107700N and the Hamburgo tails D-Dike
EE is located immediately to the east of the Escondida deposit and the two deposits, while distinct in age, overlap
with each other at depth. The newly discovered porphyry Cu-Mo system, extending 4.5 km north-south by 1 km
east-west, is composed of two centres of mineralisation that are genetically related to a granodiorite porphyry
complex that largely postdate mineralised feldspar porphyries in the Escondida deposit. The northern orebody lies
underneath a nearly barren quartz porphyry dome that post-dates Escondida mineralisation (Figure 1.6), whereas
the southern mineralisation zone is concealed by a sequence of Miocene gravels (Figure 1.7).
107700 Section
D-Dike Section
For
per
sona
l use
onl
y

Appendix 1 – Competent Persons Report 13
EE porphyry system is hosted by a succession of bimodal volcanic and intrusive rocks of Carboniferous-Permian
La Tabla Formation, Palaeocene-Eocene andesite of Augusta Victoria Formation and also by the Escondida
Intrusive Complex (~38-35 Ma; U-Pb zircon dating). All these units are intruded by the “Escondida Este Intrusive
Complex”, which composed of a pre-mineral phase of diorite to monzodiorite intrusives (~36 Ma; U-Pb zircon
dating), an early-mineral intrusive phase characterised by multiple pulses of granodiorite porphyry stocks
(34.5-33.7 Ma; U-Pb zircon dating) and a late-mineral porphyry stock of granodiorite composition (33.3 Ma; U-Pb
zircon dating).
Figure 1.6: Cross section along 107700N, looking north. through the Escondida mine and northern mineralised centre
of Escondida Este. The drill hole data and mid-case interpretation of copper grade zoning are superimposed on
interpretations of lithology (diagram on left) and sulphide mineral zone (diagram on right). Topography is based on the
current mine surface.
Figure 1.7: Cross section along D-Dike looking northeast. through the southern mineralised centre of Escondida Este.
The drill hole data and mid-case interpretation of copper grade zoning are superimposed on interpretations of lithology
(diagram on left) and sulphide mineral zone (diagram on right).
The top of the high grade hypogene mineralisation zone is encountered approximately 900 m below the current
surface (Figure 1.6 and Figure 1.7). Disseminated and vein-hosted hypogene copper mineralisation, mostly
fractionated in the potassic alteration stage, is dominated by chalcopyrite and bornite with minor chalcocite. The
bulk of copper mineralisation is paragenetically and spatially related to early gray-green sericite alteration (31.8 Ma;
Ar-Ar sericite dating) that is the strongest hydrothermal event within the potassic stage and is centered at the top of
the early-mineral porphyry stocks. This alteration event overprints early K-feldspar and biotite assemblages and
also the eastern side of the older Escondida mineralisation system. Although mineralisation at EE is predominately
hypogene, an immature supergene chalcocite blanket was developed in the uppermost part of the southern
orebody, 150 m beneath current surface.
For
per
sona
l use
onl
y

Appendix 1 – Competent Persons Report 14
Potential size of the mineral deposit was estimated by an RRA process in February 2013 from drilling data
available at that time as ranging between 9 and 19 Bt at an average grade from 0.4 and 0.6% Cu and 150 to 200
ppm Mo (0.3% Cu cut-off). The tonnage range is based a low degree of continuity between drill holes at the low
end, while the high end assumes a lateral extension of the deposit from mineralised drill hole intercepts in the
southern orebody, northeast of the D-Dike cross section (Figure 1.5). This estimate was updated in March 2014 to
exclude the results of recent in-fill drilling immediately southeast of the Escondida mine that converted
approximately 4 Bt of exploration results to Inferred Mineral Resources.
1.6.8 Baker Project
The Baker project is located about 7 km east of the Escondida Norte pit, north of the Escondida Sulphide Leach
heap pads (Figure 1.4). The porphyry copper deposit consists of a near-surface supergene sulphide zone
overlaying a deeper primary target. The upper portion of the deposit is defined by a NNE-trending footprint
approximately 1,500 by 500 m (Figure 1.8) that flairs outward with increasing depth (Figure 1.9).
The deposit was initially discovered in 2007 through surface geology and drill hole testing. Evaluation of the deposit
was conducted by a drilling program between 2007 and 2011 that completed a total of 83 vertical and inclined
holes. Evaluation of the deposit was based on 61 shallow RC holes and 22 deep diamond core totalling 45,377 m
and 20,331 samples collected on 2 m intervals. All samples were logged submitted and control for quality
according to the standard MEL protocols. Samples were analysed by AA technique for total and acid-soluble Cu,
As, Zn, Mo, Ag, and Fe. Gold was analysed by fire assay with an AA finish. Down-hole gyroscopic survey was
performed only in deep drill holes.
The deposit is delineated on a nominal 250 m drilling grid. Near the edges of the deposit, drill spaces is on the
order of 500 m, while spacing of 100 m or less is locally achieved in the deposit centre (Figure 1.8). Deeper
portions of the deposit are evaluated on a nominal drill spacing of 200 m.
The deposit is largely hosted by an elongated granodiorite porphyry stock that was intruded into Augusta Victoria
andesite at 37.1 Ma. Primary mineralisation consists as veinlets and disseminated of bornite-chalcopyrite occurring
as a central zone bordered by lower-grade chalcopyrite-pyrite (Figure 1.9). Secondary enrichment by chalcocite
and minor covellite is developed as a 20-200 m blanket overprinting the primary sulphide zone and below 150 m of
leach cap, The enrichment zone is controlled by NW- and NE-trending structures and the primary sulphide zone by
NE-trending zones.
For
per
sona
l use
onl
y

Appendix 1 – Competent Persons Report 15
Figure 1.8: Drill hole collars and supergene sulphide footprint (mid-case estimate) of the Baker project
Size and quality of the project was evaluated in an RRA workshop performed in February 2012, separately
evaluating the supergene and hypogene resource base. The supergene zone was estimated to contain between 50
and 150 Mt of mineralisation, averaging 0.4% Cu (0.2% Cu cut-off). The primary mineralisation was estimated be
within the range of 600 to 1,100 Mt averaging 0.3% (0.2% Cu cut-off).
For
per
sona
l use
onl
y

Appendix 1 – Competent Persons Report 16
Figure 1.9: Geology of the Baker project. A. Surface topography and projection to the surface of the granodiorite
porphyry (early) in pink and in monzodiorite (intermineral) in salmon and footprint of supergene sulphide with cross
section location. B. Long section looking NE of mineral zonation and drill hole location
1.6.9 Chimborazo (Deep)
The Chimborazo deposit has a long history of gold and copper exploration as outlined by Herve, et al. (2012).
Earliest exploration began in 1968 and was focused on epithermal-style gold mineralisation that outcrops near the
crest of Cerro Chimborazo in the south part of the project. By the early 1990s, discovery and partial delineation had
been made of a chalcocite enrichment zone underlying intermontane gravel on the northern flank of the hill (Figure
1.10). Minera Escondida Limitada purchased the Chimborazo property from Cyprus in 2000, began a systematic
development program of the project in 2007, and first announced Mineral Resources as of December 2011.
A
B
For
per
sona
l use
onl
y

Appendix 1 – Competent Persons Report 17
While Chimborazo mineralisation is largely supergene chalcocite enrichment, it was recognised that the deposit
manifests several characteristics of an epithermal deposit, rather than those of a typical porphyry copper. This
triggered a drilling program to determine potential for deep porphyry mineralisation below or lateral to the near-
surface deposit. A program of twelve deep drill holes totalling 16,585 m was completed in 2010 and 2011,
confirming the occurrence of porphyry copper-style mineralisation of 0.1% to 0.4% Cu. Locally, higher grade
intercepts of mineralisation average 0.5% to 1% Cu were encountered (Table 1.4). The deep exploration program
included only diamond core drilling and was carried under the standard MEL logging, sampling and assaying
protocols, including down hole gyroscopic survey of the holes.
Figure 1.10: Surface map of the Chimborazo project.
The Chimborazo porphyry and epithermal system is largely hosted to a depth of ~1,000 m by dacitic tuffs and
lesser andesitic breccias and flows assigned to the Augusta Victoria Formation (Herve, et al., 2012). Hornblende
diorite and monzodiorite intrusions that appear to be both premineral (~42 Ma) and late-mineral (38.1±0.3 Ma)
occur within altered volcanic succession in outcrop and drill hole intercepts. At ~1,000 m below the surface, drill
holes have intersected the uppermost parts of an early mineralised biotite granodiorite porphyry intrusion.
Northwest of the deposit (Figure 1.11A) is the Chimborazo intrusive complex that is of inter- to late-mineral age.
The complex is composed of fine-grained diorite to granodiorite phase and dated at ~39 to 37 Ma. The volcanic
rocks and monzodiorite are cut by a series of pipe-like, magmatic-hydrothermal breccias that are developed over a
1,000 m vertical interval. The breccias are mineralised, largely through open space filling, by a sequence of mineral
assemblages that changes vertically with the system-scale alteration-mineralisation zoning pattern seen in host
rocks.
For
per
sona
l use
onl
y

Appendix 1 – Competent Persons Report 18
Table 1.4: Deep Chimborazo drill hole intercepts.
Drill Hole Collar location (UTM) DH Length (m)
Significant Intercept1
East North Elev. From
(m)
To
(m)
Length
(m)
Cu
(wt %)
Au
(g/t)
Mo
(ppm)
DDH 39952 485,543 7,329,919 2591 656 442 642 200 0.61 0.05 838
DDH 86502 485,099 7,329,449 2612 1,400 1028 1082 54 0.78 0.05 91
DDH 86953 485,475 7,329,615 2616 1,400 1136 1194 58 2.36 0.27 1337
DDH 86952 485,475 7,329,615 2616 1,400 1194 1398 204 0.51 0.05 102
D-9045 486,226 7,329,846 2602 524 -- -- -- -- -- --
D-9047 486,526 7,329,900 2619 909 -- -- -- -- -- --
D-9057 486,675 7,329,525 2635 1,517 -- -- -- -- -- --
RD-9065 486,524 7,330,050 2612 1,955 -- -- -- -- -- --
RD-9067 486,674 7,330,200 2612 1,022 -- -- -- -- -- --
RD-9068 485,475 7,329,900 2592 1,212 -- -- -- -- -- --
D-9161 485,735 7,329,300 2678 1,559 -- -- -- -- -- --
D-9166 485,400 7,329,750 2596 1,333 -- -- -- -- -- --
D-9193 486,147 7,329,762 2615 1,700 -- -- -- -- -- --
1 Significant intercepts are quoted as down hole lengths, not necessarily representing true widths of mineralisation. Minimum
intervals quoted are approximately 50 metres down hole length, unless at the end of the drill hole, with a minimum assay
interval grade of 0.5% Cu. Calculations are from length-weighted averages of contiguous two meter, half-core samples, and
include internal low-grade intervals.
2 Chalcopyrite mineralisation zone.
3 Bornite mineralisation zone.
Figure 1.11: Cross sections through Deep Chimborazo target. A. Lithological interpretation. B. Mineral zone
interpretation.
Fine-grained quartz-alunite dominates the uppermost section of Cerro Chimborazo, and grades downward to
advanced argillic assemblage of quartz-alunite-kaolinite plus minor dickite. Alteration passes downward and
outward through sericitic alteration to an earlier chlorite-sericite assemblage that in turn transitions to a deep
potassic zone (pervasive biotitization of volcanic rocks and orthoclase veining in porphyry). A gray-green sericite
event locally overprint the potassic alteration.
The potassic-altered rocks contain minor amounts of chalcopyrite, pyrite, and subordinate magnetite, whereas the
overprinted gray sericite zone is characterised by chalcopyrite and bornite plus elevated gold values. The chlorite-
sericite zone is dominantly pyritic, while advanced argillic alteration is associated with early pyrite and enargite ±
tennantite as disseminations, veinlets, and veins, and late chalcopyrite-sphalerite ± pyrite ± galena veins, which
tend to occur peripherally. Highest copper grades are developed in the gray sericite zone, while the porphyry-
hosted potassic alteration generally contains low-grade mineralisation.
A B
For
per
sona
l use
onl
y

Appendix 1 – Competent Persons Report 19
The potential size and quality of the deep primary deposit was estimated during an October 2011 RRA to range
between 1 and 6 Bt at an average grade of 0.3% to 0.6% Cu. Ranges on the size of the deposit were estimated on
the basis of continuity of mineralisation among the drill hole intercepts and footprint of the deposit provided by
surface exposures and interpretation of geophysical information (ground magnetic, induced polarisation, and
magnetotelluric surveys). Range in copper grade was based on assumptions of the relative proportions of the
deposit assumed to be altered to gray sericite. This higher grade zone was assumed to comprise about 20%, 40%,
and 50% of the deposit in the Low, Mid, and High-case estimates, respectively.
1.6.10 Escondida Norte Deep
Escondida Norte is one of the two enriched porphyry copper deposits that comprise the mine operations of Minera
Escondida. The deposit was originally discovered in 1981 in conjunction with the nearby Escondida deposit, but
development was delayed in deference to the higher quality of initial Escondida ore feed. Pre-feasibility and
Feasibility studies were carried out to develop the Escondida Norte supergene deposit between 1995 and 2003, at
which time stripping of the ore body was started. Project execution was completed in 2005 when initial ore
deliveries were made to the Escondida concentrators. Mineral Resources and Ore Reserves of the Escondida
Norte deposit are based on a database of nearly 2,600 drill holes that total 841.7 km of drilling and are declared,
combined with those in the Escondida mine, on the basis of open-pit mining of high-grade chalcocite-covellite
supergene mineralisation and uppermost parts of the underlying primary chalcopyrite-bearing deposit.
A total of 26 drill holes and 45,926 m have been drilled below and lateral to the Escondida Norte deposit to
evaluate the potential for vertical extension of chalcopyrite ± bornite at depth and additional mineral centres. These
deeper drill holes were combined with distribution of grade in the interpolated grade at the base of the Mineral
Resources to evaluate deep potential of the deposit. All drilling was logged, sampled, and assayed under the MEL
standard protocol.
Geological features of the Escondida Norte deposit are summarised by Herve, et al. (2012) and by MEL (2013),
who also provides discussion of the interpretation and estimation of the Mineral Resources by Escondida Norte.
For that reason, only a brief overview is presented here.
Escondida Norte is hosted by rhyolites, andesites, and their coeval intrusives of the Palaeozoic La Tabla
Formation, intruded 38-36 Ma by multiple stages of mineralised northeast-striking dikes and stocks of biotite
granodiorite porphyry, often associated with igneous and hydrothermal breccias (Figure 1.12). Potassic alteration
and veining is developed at depth throughout the deposit, characterised by biotite-K-feldspar in felsic and
intermediate rocks, and biotite in mafic protoliths. Gray-green sericite veinlets overprint the potassic alteration at
depth. At shallower levels, chlorite-sericite-sulphide alteration is wide-spread and overprints potassic veins.
Chlorite-sericite alteration gives way at shallower depths to pervasive and veinlet-controlled quartz-sericite-pyrite,
which is overprinted locally by quartz-pyrophyllite ± alunite alteration, closely associated with northwest-striking
veinlet zones that are locally sheeted and host high-sulphidation mineralisation.
Leached lithocap and the underlying chalcocite enrichment blanket overprints hypogene mineralisation in the
uppermost 200-500 m of the deposit. Most of the hypogene sulphide mineralisation at Escondida Norte is
associated with gray sericite and chlorite-sericite veins, and consists of chalcopyrite and pyrite. Only localised
centres of chalcopyrite-bornite ± chalcocite mineralisation have been encountered in the potassic zone. There is a
tendency for copper tenors to drop at depth in the potassic zone, implying that appreciable copper was introduced
at the chlorite-sericite stage. Potential size of the mineral primary deposit has been estimated in an October 2012
RRA workshop, incorporating 13 new condemnation drill holes completed in the previous year and a revised
interpretation of the sequence and geometry of the syn-mineral intrusions. Volumes were estimated at a 0.2% cut-
off grade, and exclude Mineral Resources defined by a Lerchs-Grossman optimised pit shell.
The range in tonnes was based on assumptions regarding continuity, overall strike length, and width of mineralised
zones adjacent to syn-mineral granodiorite porphyry units encountered down-dip from the interpolated mineral
resources. Variable assumptions were also applied to continuity and geometry of post-mineral dacite porphyry
units. Copper grade assumptions were based on the continuity and size of deep potassic zones with chalcopyrite-
bornite, while a consistent molybdenum grade of 125 ppm. The high-tonnage case postulated lateral extensions of
mineralisation, consistent with shallow (~300 m) and widely-spaced condemnation drilling that tested the mine and
dump areas.
For
per
sona
l use
onl
y

Appendix 1 – Competent Persons Report 20
Figure 1.12: Collar location of deep diamond holes.
Figure 1.13: Cross section looking NE along the Hamburgo tailings D-Dike. Red box highlights the Hamburgo project
area of interest.
1.6.11 Hamburgo Project
The Hamburgo project consists of evaluation of supergene mineralisation that was sporadically encountered in
drilling of the Escondida Este southern mineral centre (Figure 1.4 and Figure 1.5). The drill data and geological
framework was previously described in section 5.1.
Supergene mineralisation was encountered in 22 of the 71 drill holes located in and around the Hamurgo tailings
facilities to a depth of 500 m (Figure 1.13). Moderate amounts of disseminated supergene sulphides mineralisation
was encountered in intervals of 40 to 150 m of chalcopyrite-pyrite in phyllic-altered andesite, below approximately
150 m of unconsolidated gravels and leached capping. Secondary enrichment in late northwest-trending pyrite and
high-sulphidation veinlets of the Escondida Feldspar Porphyry increase grades in the moderate enrichment of
Escondida Este. Thicker zones of secondary mineralisation is associated with higher primary grades at depth.
For
per
sona
l use
onl
y

Appendix 1 – Competent Persons Report 21
Evaluation of the deposit was made in an RRA workshop held in October 2012. The deposit size was based on
various assumptions on the extension and continuity of intercepts by widely spaced drill sites in the Hamburgo
tailings facility (Figure 1.5 and Figure 1.13). The assumptions range from narrow zones, constrained by structurally
controlled sericitic alteration to relatively consistent enrichment over the mineralised footprint within the Hamburgo
Basin. Quality of the blanket was estimated from an average of grades encountered in the drill hole intercepts, with
variable influence assumed from high-sulphidation veins.
1.6.12 Rincones Project
The Rincones project, located 10 km west of Escondida Norte (Figure 1.4), is considered part of the Chimborazo
cluster of porphyry copper deposits. The project was discovered in 2004 by surface mapping, geochemistry and
drill testing. Exploration drilling completed 45 holes totalling 15,769 m by 2009. All holes were drilled with reverse
circulation, all of which were vertical. The remainder were drilled at orientations greater than -75°. Drill hole logging,
sampling and assaying were performed under standard MEL protocols. Samples were obtained on 2 m intervals
starting 10 m above first occurrence of sulphides and analysed by AA methods for total and acid-soluble Cu, Mo,
Zn, and As. Additional exploration and sampling data used for evaluation of the project include ground magnetic
survey, performed 100 m line spacing with continuous surveying; approximately 3,500 m of trenching for sampling
of near-surface oxide mineralisation, and 65 stream sediment sample (sieved -150 micron size fraction analysed for
Cu, Mo, As, Pb, Zn, Au, Ag).
Outcropping host rocks in the project area are andesitic volcanics of the Palaeocene-Eocene Augosto Victoria
Formation that have been intruded by diorite to granodiorite stock complexes of late Eocene-Oligocene age. These
units are largely covered by post-mineral gravel deposits of Miocene-Pliocene age (Figure 1.14 and Figure 1.15).
Main structural trends correspond to N-S lineaments controlling the topography and geomorphology in the area.
Other important structural features are NE and NW trending faults thought to be important for emplacement of the
porphyry cluster.
Drilling and trenching encountered narrow and erratic intercepts of oxide and supergene chalcocite mineralisation
to a depth of 300 m below the surface (Figure 1.15). The intercepts are interpreted as a thin and discontinuous
blanket overprinting structurally controlled enargite-pyrite mineralisation. Using a range of assumptions on the
continuity and extent of the supergene deposit, and average drill hole grades at a 0.2% cut-off, a March 2009 RRA
workshop resulted in an estimated supergene deposit between 100 and 700 Mt in size, averaging 0.5% Cu.
Figure 1.14: Surface geology and drill hole locations in the Rincones project area.
For
per
sona
l use
onl
y

Appendix 1 – Competent Persons Report 22
Figure 1.15: Cross section through the Rincones project, looking NW, showing drill holes locations and Mid-case
interpretation
1.6.13 Pamela Oxides Project
The Pamela Oxides project area is located between the Escondida Norte and Pampa Escondida deposits, partially
covered by waste stockpiles from the Escondida Norte mine (Figure 1.4). The mineralisation in the vicinity of the
deposit was initially discovered as a result of condemnation drilling during Escondida Norte Feasibility studies.
Subsequent drilling in the Pampa Escondida and Carmen projects identified the presence of lithological and
structurally controlled copper oxide mineralisation overlying portions of the deeply buried porphyry systems.
Drill hole information in the project area includes a total of 163 holes with 107,214 m of diamond core samples and
RC pre-collar drilling (Figure 1.16). Drill core logging, sampling, and assaying was conducted under standard MEL
protocol. Samples were collected on 2 m intervals, and analysed by AA methods for total and acid-soluble Cu, Mo,
Fe, Ag, Pb, Zn, As, and for Au by 50 g fire assay method with AA finish. Drill hole orientations are largely vertical,
with approximately 15% inclined holes, with drill orientation between -75º and vertical.
Figure 1.16: Drill hole collar locations in the Pamela Oxides project area. Red symbols correspond to drilling
completed in the most recent drilling campaign in 2010.
For
per
sona
l use
onl
y

Appendix 1 – Competent Persons Report 23
The Pamela Project is partially under Escondida Norte waste stockpiles and is bordered to the north with the
Escondida Norte mine, to the east with deep sterilisation drilling, to the west by the Zaldivar mine and abuts the
Pampa Escondida deposit to the south. Late Cainozoic unconsolidated gravels cover 100% of the Pamela project
area, with an average depth of 30 m to pre-mineral bedrock.
Host rocks consist of the vertical sequence of (from top to bottom) UVS (Volcanic-Sedimentary Unit) that are
assigned to the La Tabla Formation along with the underlying dacite and andesite volcanics, and several intrusives
of Upper Palaeozoic age (~290 Ma): Grueso Porphyry, Rhyolite Porphyry and Negro Porphyry. These units are
intruded by the Pamela Porphyry, a granodiorite porphyry associated with mineralisation and two post-mineral
dacite porphyry bodies. Late-stage hydrothermal breccias are observed and are mineralised.
Mineralisation within the UVS consists of an upper zone of copper oxides hosted by sedimentary units and dacite
tuff interbedded with the andesite volcanics. Disseminated and fracture-controlled mineralisation hosted by
limestone interbeds in the UVS is dominated by chrysocolla-brochantite, with or without formation of garnet-
actinolite skarn. Oxide mineralisation in dacite tuff is dominated by fracture controlled chrysocolla. Thin and erratic
chalcocite-covellite enrichment occurs below the oxidised lithocap, transitioning to weak chalcopyrite mineralisation
at depth (Figure 1.17).
Evaluation of the project area was conducted with Resource Range Analysis in November 2011, focusing on size
and quality of the oxide zone mineralisation. Grade was estimated from a range of relative proportions of dacite
and limestone units assumed to be contained in the UVS oxide zone. Tonnes were estimated from assumptions on
the continuity, relative abundance, and orientation of the favourable host rocks. This included a range of
assumptions on the extent of mineralisation within open and sparsely drilled volumes. Due to small drill grid, the
permissive range on the size of the deposit is low, ranging from a low of 30 Mt and high estimate of 50 Mt,
averaging 0.5% Cu, at a 0.2% Cu cut-off.
Figure 1.17: Representative cross section of mineral zones, Pamela Oxides, looking NNE For
per
sona
l use
onl
y

Appendix 1 – Competent Persons Report 24
1.6.14 Escondida (Deep)
The Escondida deposit, was discovered in 1981 and brought into production in December 1990. Herve, et. al
provides the most recent summary of the geological framework and exploration history of the deposit. A summary
of the methods and results of estimation and classification of Mineral Resources is provided by MEL (2014).
Escondida Deep exploration program is part of an on-going evaluation of the deeper portions of the deposit, and is
aligned with overall brownfield exploration program. The Escondida program area has an upper limit of the
Escondida Mineral Resources as defined by a Lerchs-Grossman optimised pit surface. The Panadero Fault is used
to divide the Escondida inventory from Escondida Este (Figure 1.18).
The Escondida Deep exploration target was evaluated in March 2011, at which time the deposit was drilled by
3,876 holes totalling nearly 969 km of drilling, most of which was used for estimating mineral resources at a drill
grids ranging from 50 to 110 spacing. A total of 6 drill holes have been drilled to depths reaching 2,000 m amsl
(~1,100 m depth). All drilling has been performed under the MEL protocol as previously described in this document.
Evaluation of the deep mineralisation considered the geological interpretation of the overlying Mineral Resource,
adjacent Escondida Este data and interpretations, but excluded these zones from grade and tonnage tabulation.
The Resource Range Analysis assumed a range of extent and continuity on key geological features assumed to
control deep hypogene grade, including geometry of post-mineral intrusions, distribution of grey-green sericite, and
bornite-chalcopyrite mineralisation in intrusive-hosted potassic alteration. Assumptions for the low end in range on
tonnes were based on potential for post-mineral intrusives to dominate the sparsely drilled volumes. High end of
the ranges assumed limited additional vertical extent, but a larger volume was due to assumptions of lateral
extension of early-stage porphyry pulses to the north and west. The resulting range for increased mineralisation in
Escondida was 2,000 to 7,000 Mt averaging 0.5-0.6% Cu, at a 0.3% Cu cut-off. The average grade is consistent
with chalcopyrite mineralisation in the low end of the range, with increased proportion of bornite-chalcopyrite
assumed for the high end of the range.
Figure 1.18: Cross sectional interpretation of the mid-case Escondida Deep target
1.7 Exploration Targets statement
Exploration Targets in the Escondida district have been compiled to reflect the range of potential size and quality,
consistent with actual exploration results and porphyry copper models developed from but exclusive to the
Escondida Mineral Resources.
For
per
sona
l use
onl
y

Appendix 1 – Competent Persons Report 25
Table 1.5: Exploration Targets as at 30 June 2014 in 100 per cent terms – reported in compliance with the 2012 JORC
Code.
Project Date Low Case Mid Case High Case
Ton (Mt) %Cu Ton (Mt) %Cu Ton (Mt) %Cu
Escondida Este* Feb 2013 5,200 0.44 10,000 0.48 15,000 0.47
Escondida (Deep) Mar 2011 2,000 0.55 3,600 0.55 7,500 0.62
Escondida Norte (Deep) Oct 2012 1,800 0.33 2,800 0.30 5,000 0.35
Chimborazo (Deep) Oct 2011 1,000 0.50 2,000 0.35 6,600 0.32
Baker Hypogene Feb 2012 600 0.31 800 0.31 1,100 0.31
Baker Supergene Feb 2012 50 0.43 80 0.45 150 0.38
Hamburgo Oct 2012 200 0.48 400 0.53 800 0.56
Rincones Mar 2009 100 0.47 200 0.47 700 0.47
Pamela Oxide Nov 2011 30 0.70 30 0.72 50 0.73
Total 11,000 0.47 20,000 0.46 37,000 0.47
* Updated to be consistent with additional data reported as Escondida Mineral Resources as of 31 March 2014
Exploration Targets potential quantity is conceptual in nature, there has been insufficient exploration to define a
Mineral Resource and it is uncertain if further exploration will result in the determination of a Mineral Resource.
It should not be expected that the quality of the Exploration Targets is equivalent to that of the Mineral Resource
The estimates are based on exploration results of projects in and around the Escondida and Escondida Norte
mineral deposits, are all of porphyry copper style of mineralisation, and are currently developed at varying
degrees of project maturity and therefore exploration drilling density
Estimations were performed within a formal facilitated process called Resource Range Analysis, in which
deterministic estimates of potential volumes are determined over a range of assumptions on continuity and
extension that are consistent with available data and genetic models of porphyry copper style of mineralisation.
1.8 Further work
Exploration work continues to test the high-case assumptions of the exploration projects in a prioritised sequence,
with priorities established for oxide and enrichment open pit targets. Resource development work has been started
to determine potential for exploitation through underground mining methods of higher-grade intercepts in deep
mineralisation. Geological studies to improve the geological understanding of the deposits, especially in regards to
mapping the sequence of productive and barren intrusives continue to be of high priorities. Better understanding of
the geological features will be needed for the deeper portion of the Escondida deposit. At this time this
mineralisation could be scheduled far into the future.
1.9 References
Australasian Code for Reporting of Mineral Resources and Ore Reserves (The JORC Code 2012 Edition).
Prepared by the Joint Ore Reserves Committee of The Australasian Institute of Mining and Metallurgy, Australian
Institute of Geoscientists and Minerals Council of Australia (JORC), Effective 20 December 2012 and mandatory
from 1 December 2013.
Clarke, K. Pinto, D. 2009. Escondida y Escondida Norte, Definición de dominios de estimación EDA Mayo-2010.
Noviembre 2009. Superintendencia de Estimación de Recursos. Gerencia de Calidad y Control de Mineral.
Vicepresidencia de Planificación y Estudio. Minera Escondida limitada. Reporte Interno.
Consultores de Recursos Minerales S.A. & NCL Ltda. Resource and Reserve Audit Escondida and Escondida
Norte. Prepared For: Minera Escondida Ltda, 30 May, 2013. Internal report.
García, F. 1967. Geología del Norte Grande de Chile. Sociedad Geológica de Chile. Symposium sobre el
Geosinclinal Andino, 1962. N°3, p 138, Santiago.
For
per
sona
l use
onl
y

Appendix 1 – Competent Persons Report 26
Hervé, M; Sillitoe, R; Wong, Ch; Fernandez, P; Crignola, F; Ipinza, M and Urzúa, F. 2012. Geologic Overview of the
Escondida Porphyry Copper District, Northern Chile. Society of Economic Geology. Special Publication N°16,
pp 55-78.
Minera Escondida Ltda. (MEL). 2014. Escondida Competent Person Report for Mineral Resources as of 31 March
2014, Appendix to BHP Billiton Operational Review for the Nine Months Ended 31 March 2014, p 22.
Mpodozis, C.; Marinovic, A.; Smoje, I. y Cuitiño, L. 1993. Estudio geológico- estructural de la Cordillera de
Domeyko entre la Sierra Limón Verde y Sierra Mariposas. Región de Antofagasta. Servicio Nacional de Geología y
Minería. p 232.
For
per
sona
l use
onl
y

Appendix 1 – Competent Persons Report 27
2 Queensland Coal
2.1 Executive summary
This report summarises the estimation of FY14 Explorations Targets for BHP Billiton’s Queensland Coal Assets of
BHP Billiton Mitsubishi Alliance (BMA) (50% BHP Billiton Interest) and BHP Billiton Mitsui Coal (BMC) (80% BHP
Billiton Interest).
Table 2.1: Explorations Targets as at 30 June 2014 in 100% terms reported in compliance with the JORC Code.
Mine / Project Explorations Targets (Bt) (excluding Resources)
Low Mid High
BMA 12.3 20.8 26.3
BMC 1.2 2.7 3.4
Total Queensland Coal 13.6 23.5 29.7
Exploration Targets Vitrinite Reflectance Ash Volatile Matter Calorific Value Coal Type
Quality Data % % % kCal/kg
BMA 0.5-2.1 5.1-18.9 6.1-39.1 6,080-7,820 Met / Th
BMC 1.1-3.1 5.9-19.0 7.5-26.3 5,600-7,710 Met / Th / Anth
Queensland Coal 0.5-3.1 5.1-19.0 6.1-39.1 5,600-7,820 Met / Th / Anth
For
per
sona
l use
onl
y
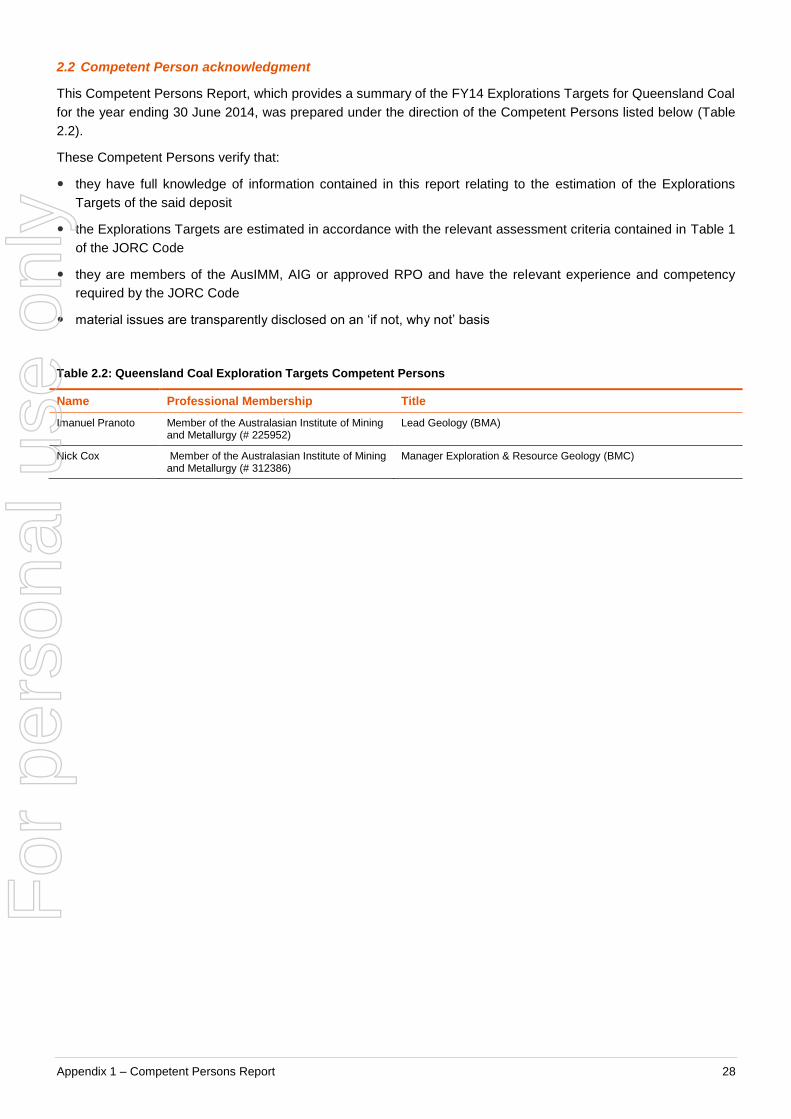
Appendix 1 – Competent Persons Report 28
2.2 Competent Person acknowledgment
This Competent Persons Report, which provides a summary of the FY14 Explorations Targets for Queensland Coal
for the year ending 30 June 2014, was prepared under the direction of the Competent Persons listed below (Table
2.2).
These Competent Persons verify that:
they have full knowledge of information contained in this report relating to the estimation of the Explorations
Targets of the said deposit
the Explorations Targets are estimated in accordance with the relevant assessment criteria contained in Table 1
of the JORC Code
they are members of the AusIMM, AIG or approved RPO and have the relevant experience and competency
required by the JORC Code
material issues are transparently disclosed on an ‘if not, why not’ basis
Table 2.2: Queensland Coal Exploration Targets Competent Persons
Name Professional Membership Title
Imanuel Pranoto Member of the Australasian Institute of Mining and Metallurgy (# 225952)
Lead Geology (BMA)
Nick Cox Member of the Australasian Institute of Mining and Metallurgy (# 312386)
Manager Exploration & Resource Geology (BMC)
For
per
sona
l use
onl
y

Appendix 1 – Competent Persons Report 29
2.3 Introduction
This report is issued in support of the BHP Billiton Coal Business declaration of FY14 Explorations Targets for
Queensland Coal.
2.3.1 BHP Billiton Mitsubishi Alliance (BMA)
BHP Billiton Mitsubishi Alliance (BMA) is an unincorporated alliance between BHP Billiton (50%) and Mitsubishi
Development (50%) which operates six open cut and two underground mines in the Bowen Basin of Central
Queensland, and includes an additional four undeveloped resources (Red Hill, Peak Downs East, Saraji East and
Liskeard) and three exploration projects (Humboldt, Picardy and Ridgeland). The Ridgeland Project is located in
the Surat Basin of Southern Queensland.
BMA Development History
1960s First exploration on BMA-held tenements in the Bowen Basin is conducted by Utah Development Company Limited
1967 Blackwater Mine commences operation
1971 Goonyella Mine commences operation
1972 Peak Downs Mine commences operation
1974 Saraji Mine commences operation
1976 Utah Development is purchased by GE
1979 Norwich Park Mine commences operation
1984 BHP Coal purchases coal business from GE
1997 First underground operation (Crinum) commences
2001 BHP Billiton Mitsubishi Alliance (BMA) is formed
2005 Broadmeadow Mine commences underground operation
2012 Norwich Park and Gregory Mines placed under care and maintenance
2013 Daunia Mine commences operation
2014 Caval Ridge Mine commences operation
2.3.2 BHP Billiton Mitsui Coal (BMC)
BMC is a joint venture between BHP Billiton (80%) and Mitsui Corporation (20%) which operates two open cut
mines at South Walker Creek and Poitrel in the Bowen Basin of Central Queensland and includes three
undeveloped resources (Wards Well, Bee Creek and Nebo West).
BMC Development History
1960s First exploration on BMC-held tenements is conducted by Thiess Peabody Mitsui Pty Ltd
1996 South Walker Creek Mine commences operation
2006
2011
Poitrel Mine commences operation
BHP Billiton Mitsui Coal Pty Ltd (BMC) is formed
The Queensland Coal BMA and BMC assets location plan is represented as Figure 2.1.
For
per
sona
l use
onl
y
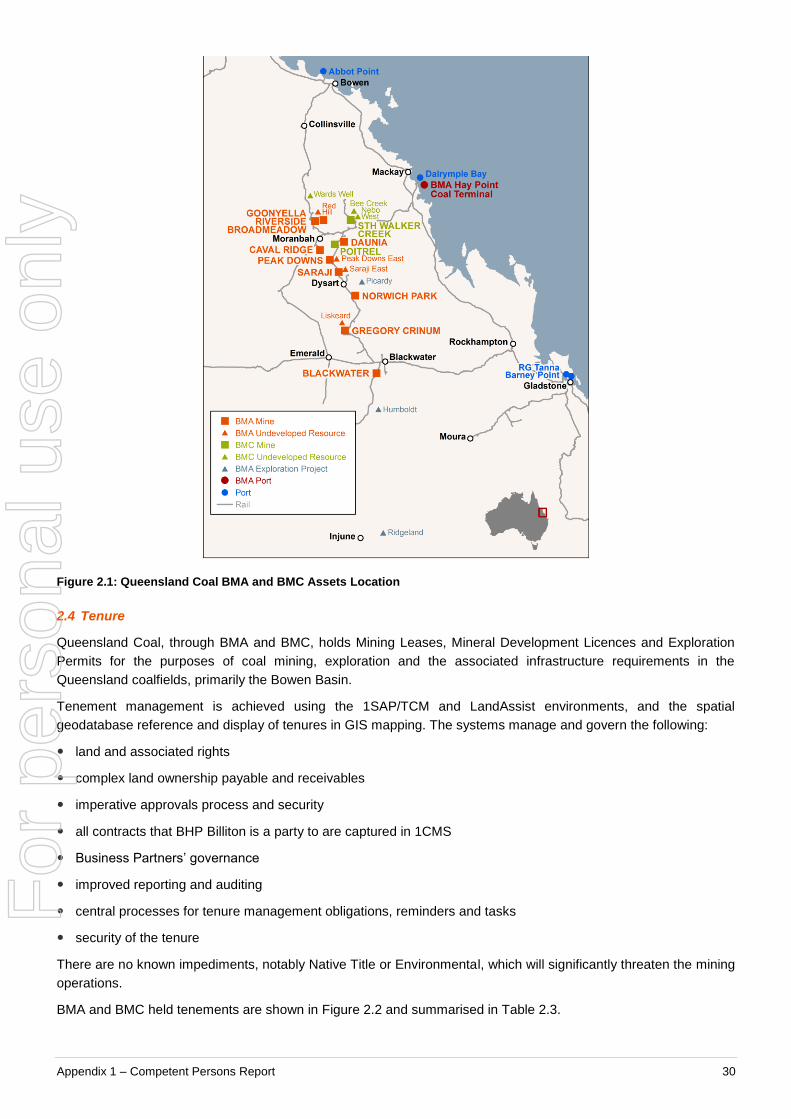
Appendix 1 – Competent Persons Report 30
Figure 2.1: Queensland Coal BMA and BMC Assets Location
2.4 Tenure
Queensland Coal, through BMA and BMC, holds Mining Leases, Mineral Development Licences and Exploration
Permits for the purposes of coal mining, exploration and the associated infrastructure requirements in the
Queensland coalfields, primarily the Bowen Basin.
Tenement management is achieved using the 1SAP/TCM and LandAssist environments, and the spatial
geodatabase reference and display of tenures in GIS mapping. The systems manage and govern the following:
land and associated rights
complex land ownership payable and receivables
imperative approvals process and security
all contracts that BHP Billiton is a party to are captured in 1CMS
Business Partners’ governance
improved reporting and auditing
central processes for tenure management obligations, reminders and tasks
security of the tenure
There are no known impediments, notably Native Title or Environmental, which will significantly threaten the mining
operations.
BMA and BMC held tenements are shown in Figure 2.2 and summarised in Table 2.3.
For
per
sona
l use
onl
y

Appendix 1 – Competent Persons Report 31
Figure 2.2: Mining Tenure
For
per
sona
l use
onl
y

Appendix 1 – Competent Persons Report 32
Table 2.3: Summary of Queensland Coal Tenure
Mining Lease Mineral Development Licence Exploration Permit for Coal
Mine/Project Number Area (ha) Number Area (ha) Number Area (ha)
Operations
Blackwater 21 42,000 2 15,512 1 2,193
Caval Ridge 3 10,167
Gregory Crinum 4 12,601 1 597
Daunia 3 3,349
Goonyella/Broadmeadow 18 25,946 2 3,814
Norwich Park 9 15,170 1 2,842
Peak Downs 10 13,534 1 2,824
Saraji 8 11,734
South Walker Creek 2 15,168 3 3,819
Poitrel / Winchester 3 4,969 2 1,269
Undeveloped Resources
Liskeard 1 1,890
Peak Downs East 1 2,824
Red Hill 2 6,336 1 4,134
Saraji East 2 12,347
Wards Well 2 6,758 4 7,639
Bee Creek 1 1,712
Nebo West 1 8,058
Exploration
Cockenzie 2 157,127
Humboldt 1 72,190
Picardy 3 24,037
Ridgeland 2 39,524
Total 84 163,108 8 36,150 25 332,825
2.5 Deposit Geology
The deposits (with the exception of Ridgeland) are located in the Permo-Triassic Bowen Basin and principally
comprise of fluvial and some marine sediments. The Bowen Basin extends for more than 250 km north to south
and up to 200 km east to west and is related to the group of Permo-Triassic basins in eastern Australia that
includes the Sydney and Gunnedah Basins. The Bowen Basin’s axis orientation is NNW-SSE, roughly parallel to
the Palaeozoic continental margin. The basin is situated between stable, Devonian to Carboniferous rocks of the
Clermont Block to the west and a Devonian to early Permian island arc system, the Eungella-Cracow Mobile belt,
to the east, as shown in Figure 2.3.
Tectonically, the basin can be divided into NNW-SSE trending platforms or shelves separated by sedimentary
troughs. These units from west to east are the Springsure Shelf, Denison Trough, Collinsville Shelf/Comet Platform,
Taroom Trough, Connors and Auburn Arches (interrupted by the Gogango Over-folded Zone) and the Marlborough
Trough.
Development of the basin in the Early Permian occurred as a series of half-grabens that subsequently became
areas of regional crustal sag. The basin has suffered extensional and compression events oriented in NE-SW
direction. Variations in depositional patterns and deformation styles that occur along strike suggest the possibility of
NE trending deep seated crustal transfer faults referred to as a ‘transfer corridor’ by Hammond (1987). This
structural evolution of the basin occurred in five phases:
For
per
sona
l use
onl
y

Appendix 1 – Competent Persons Report 33
1. Late Carboniferous to Early Permian tensional basin development (rifting).
2. Late Permian thermal relaxation and slow subsidence resulting in widespread accumulation of coal bearing
sequences.
3. Late Triassic compression, resulting in folding and reverse faulting.
4. Cretaceous to Tertiary normal faulting due to extension associated with the opening of the Coral Sea.
5. Tertiary hot spots resulting in thermal doming and collapse. Widespread intrusion\extrusion of basalt dykes, sills
and flows.
A generalised geology and stratigraphic column of the Bowen Basin is represented in Figure 2.3. Schematic cross
sections of the northern and southern Bowen Basin are represented in Figure 2.4.
A generalised geology and stratigraphic column of the Ridgeland Project within the Surat Basin is represented in
Figure 2.5.
Figure 2.3: Generalised Geology Plan and Stratigraphy of the Bowen Basin
For
per
sona
l use
onl
y

Appendix 1 – Competent Persons Report 34
Figure 2.4: Bowen Basin Schematic Cross-sections
For
per
sona
l use
onl
y

Appendix 1 – Competent Persons Report 35
Figure 2.5: Generalised Geology Plan and Stratigraphy of the Ridgeland Project (Surat Basin)
2.6 Data Acquisition
A consistent method of data acquisition is used by exploration and development drilling campaigns through the use
of a Field Data Capture System (FDCS) and Drillsite Management System (DSM), developed by the Snowden
Group. BMA manages BMC’s data acquisition via a service level agreement. The acquired data sets which are
used for the Exploration Target estimations include:
drilling: open hole mud and/or air rotary, conventional core, and diamond core
seismic surveys: 2D and 3D
For
per
sona
l use
onl
y

Appendix 1 – Competent Persons Report 36
other geophysical surveys: gravity and magnetic
topographic survey, including:
– aerial surveys (photography)
– LIDAR scans
– satellite imagery
– scanned 1:250,000 topographic sheets
The drilling data acquired includes:
drill hole collar coordinates, surveyed, before and after drilling,by in-house teams using a survey quality GPS
(Global Positioning System) system with accuracy of sub-decimetre for x, y and z values
downhole geophysics logging
standard geological logging and automated data capture procedures, which are followed for the different drilling
methods
geotechnical logging and/or sampling, typically undertaken in accordance with established geotechnical
standards
coal analysis in accordance with site specific sampling and analysis programs
2.6.1 Drilling
Exploration drilling is conducted using standard operating procedures. Both core and non-core methods are used.
These comprise:
core drilling, utilised for the following:
– coal quality sampling and washability and coking properties analysis – 100 mm or PQ sized and on requirement, large diameter (200 mm) core
– gas testing (usually HQTT), often combined with,
– geotechnical testing (strata geomechanical testing)
– other specialised testing as required (spontaneous combustion, geochemistry, clay mineralogy etc.)
non-core drilling: utilised for the following:
– pilot holes (drilled at core sites to provide details for conventionally cored holes)
– structural definition (fault delineation, seam splitting, intrusions, etc.)
– Line of Oxidation (LOX) definition
Drill holes are routinely geophysically logged by a coal combination sonde which has a width caliper, natural
gamma, long (45 cm) and short (15 cm) spaced density logs, sonic and verticality probes where water level allows.
Other sondes run from time to time for specific purposes include magnetic or gyro verticality (deeper holes),
focussed electric (intruded holes), resistivity (for e.g. suspected intrusions in seams), acoustic and optical
televiewers and temperature. Neutron sondes are not presently approved for use but have been used historically.
Boreholes drilled prior to 1986 were not generally geophysically logged and for a period between the late 1980’s
and early 1990’s logs were run but not routinely quality controlled. Accordingly, additional verification on the logs
run during this period is required. Subsequently there has been a policy to geophysically log all holes.
Table 2.4 represents a summary of the total drilling completed on the BMA and BMC deposits since the late
1960’s. Drilling is undertaken on a grid basis and the data is collectively used to establish Exploration Targets
estimates. Hence actual drillhole locations, which are extensive, are not material to the context of this Report.
For
per
sona
l use
onl
y

Appendix 1 – Competent Persons Report 37
Table 2.4: Total BMA and BMC Drilling (to June 2014)
Deposit No. Chip Holes No. Core Holes Other Holes Total Holes
BMA
Blackwater 15,656 4,386 660 20,702
Daunia 3,127 553 16 3,696
Gregory Crinum (Incl. Liskeard) 6,988 1,048 328 8,364
Goonyella (incl. Red Hill) 10,056 2,301 369 12,726
Humboldt 13 32 0 45
Norwich Park 6,339 1,386 16 7,741
Peak Downs (incl. Peak Downs East) 12,823 2,081 7 14,911
Picardy 656 67 0 723
Ridgeland 20 31 0 51
Saraji (incl. Saraji East) 4,565 2,332 69 6,966
BMC
Bee Creek 125 54 - 179
Nebo West 2,015 199 - 2,214
Poitrel 3,524 941 9 4,474
South Walker Creek 3,300 2,215 8 5,523
Wards Well 358 299 10 667
Total 69,565 17,925 1,492 88,982
2.6.2 Sampling and Analytical Procedures
Geological logging and sampling is undertaken as per the BMA geological service procedure. There are minor
differences in requirements at each site, but the procedure serves as a generic reference document that field
personnel follow.
Coal analysis is carried out at either BMA’s Barney Point laboratory, ACIRL’s (ALS) Ipswich laboratory or
contracted to Barney Point approved laboratories. ALS and AMDEL provide specialised trace element analyses
and coke oven testing. Assay validation is performed by Barney Point laboratory staff and on site by the project
geologist.
All laboratories utilised are NATA registered and all analysis techniques are carried out to the relevant Australian
Standard. Work performed by the non-BMA laboratories is conducted under the terms of a sub-contractor
agreement which stipulates the required sample control and storage procedures, analytical procedures and
standards, participation in NATA and BHP Billiton Round Robin check testing and document control.
2.6.3 Quality of Assay Data and Laboratory Tests
The laboratories utilised are all NATA accredited and have documented procedures.
To test the performance of Barney Point and external laboratories used for coal quality analysis; blind samples and
round robins are routinely undertaken. Blind samples are submitted monthly and round robins performed six
monthly.
An audit of the laboratories quality assurance and quality control processes was undertaken in 2008. A summary of
the report is included here for reference:
“The scope of this report was to review the typical geology sample and coal quality QAQC procedures applied by
BMA to ensure the final sample data are sufficiently representative for Coal Resource estimation and reporting.
The aim was to comment on whether the existing QAQC procedures provide the information and processes
necessary to assess and report on the reliability of the sample data and identify any opportunities for
improvements.”
For
per
sona
l use
onl
y

Appendix 1 – Competent Persons Report 38
Assuring the quality of the sample data is critical as this data is the basis for the Coal Resource. The estimation,
confidence classification and reporting of Coal Resources relies on the following main inputs and steps:
the geological sample data in the form of geology and coal quality data
the interpretation and modelling process
the validation, assessment and final reporting of the modelled resource
The QAQC control of the final laboratory analytical steps can be considered as generally very good; however as
the sample flow is traced further back in the sample preparation stages, fewer quantitative and qualitative controls
are in place. Therefore, whilst it is possible to demonstrate the reliability of the final step in the protocol, namely the
final quality analysis of the 1 g sample, it is currently not possible to comment on how representative the 1 g
sample is of the original field sample.
2.6.4 Verification of Sampling and Assaying
Predicted coal seam from and to depths are provided to the exploration geologist to ensure that the correct coal
seam intervals are sampled. If the depths appear to be inaccurate whilst the drilling is being undertaken, remedial
action is implemented e.g. early geophysical logging of the bore hole or re-drilling if required.
Twinned holes are rarely undertaken in the coal industry because quality variations tend to be small and are
investigated in short-term exploration programs.
There are a large number of physical and chemical analysis techniques undertaken on coal samples. The type and
number of analysis techniques depends on the type of the product that is to be achieved (Energy or Metallurgical
(i.e. Coking or Pulverised Coal Injection (PCI))). As coal seam grade varies from one product type to another,
analysis techniques are developed so that all simulations can be undertaken. This means that each deposit will
have a specific detailed analysis program.
During field collection, data is encoded directly into Toughbook computers via Micromine’s GBis software. Rigorous
validation is undertaken such that only predefined values can be entered.
2.6.5 Sample Security
All sampling is conducted on site; the rig geologist will lithologically log the core, determine sample intervals, assign
sample numbers, bag the samples and load them into steel drums for transport. Sample numbers are recorded in
the BMA Field Data Capture System (FDCS) and sample submission forms generated and sent to the laboratory.
The samples are then despatched from the field to BMA’s primary external laboratory for cold storage until
instructions are generated; currently this is ALS’ Richlands Laboratory.
Upon receipt of each despatch, ALS records sample details and advises BMA that samples have been received
and requests analytical instructions.
The majority of results produced by the lab are captured by various automatic data capture processes and stored in
the laboratory’s LIMS database until testing for each job is completed and ready for reporting. The laboratory uses
internal QA/QC processes to validate each batch of specific tests including:
standard coal reference material analysed with batches of unknowns for ash, sulphur etc.
other test results are validated via a number of graphical relationships to ensure integrity of the results for
unknown samples, e.g. sizing analysis, Ash versus Relative Density etc.
At the completion of testing, the laboratory LIMS database generates files which are sent to the BMA Specialist
Coal Quality for importing into BMA’s GBis LIMS database. The lab results are then exported via GBis LIMS to
create a block summary in Microsoft Excel format, used by the BMA Specialist Coal Quality to perform quality data
validation using well established and documented BMA validation procedures. Any data anomalies are resolved
with the laboratory before approval is given by BMA to transfer the results into the coal quality tables in GBis.
For
per
sona
l use
onl
y

Appendix 1 – Competent Persons Report 39
2.7 Coal Resource Range Analysis (RRA) and Explorations Targets Reporting
In-Situ Exploration Targets (Exploration Targets) are estimated from geological information including boreholes,
outcrops and geophysical information, and are shown as a range, around the mid value. The potential quantity is
conceptual in nature, as there has been insufficient exploration to define a Mineral Resource, in accordance with
the JORC Code. It is uncertain if further exploration will result in the determination of a Mineral Resource. It should
not be expected that the coal quality of the Explorations Targets is equivalent to the existing Resource.
The Resource Range Analysis (RRA) process methodically identifies and accommodates, in the final estimate, all
uncertainties that may influence a coal / mining inventory. This attempts to anticipate all possible future datasets
and provides a risk based assessment of possible mineral inventory outcomes. Both the known uncertainties, for
which allowances need to be considered in the estimate as well as the unknown certainties and the risk exposures
which may eventuate and affect the mineral inventory estimate, are all taken into account to derive a range of
inventory quantities.
RRA is used at a number of stages during a project or operation's life cycle to estimate the uncertainty in a number
of key variables, particularly for capital and operating cost, metallurgy and resource and mining uncertainties. In
early stage opportunities, resource uncertainty can often have the largest influence in value, and even in the
assessment option additional to an existing operation, uncertainty around resource can be a key value driver.
A summary of FY14 Exploration Targets is shown in the Executive Summary of this document.
2.8 Independent Audit and Review
Independent audits are conducted as required by BHP Billiton procedures. A summary of recent audits by deposit
is tabulated below in Table 2.5. There were no material findings from these audits.
Table 2.5: Independent Audit Summary for BMA and BMC Operations
Operation External Audit
Saraji 2013 BMA Technical Audit*
Daunia and Caval Ridge BMA Major Projects Audit January 2013*
South Walker Creek Poitrel BHP Billiton Group Audit Services April 2014*
Wards Well 2013 BMC Technical Audit*
*Internal audit only.
2.9 Further Work
The RRA process provides a methodology for assessing deposits for the range of mineralisation that can exist in
an area under varying geological conditions. Incomplete knowledge of a deposit creates uncertainty. The
understanding of a deposit will change over time, as the level of knowledge increases. However the ability to detect
and characterise the deposit is limited by data, even after detailed exploration and evaluation. The RRA process is
a means of quantifying the uncertainty by considering all possible outcomes as a range and modelling a probability
distribution to quantify risk.
The range of mineralisation is estimated from geological information including boreholes, outcrops and geophysical
information. The potential quantity is conceptual in nature, there has been insufficient exploration to define Mineral
Resources and it is uncertain if further exploration will result in the determination of Mineral Resources. It should
not be expected that the quality of the Exploration Targets is equivalent to that of the Mineral Resources.
Exploration work continues to test the high-case assumptions of the exploration projects in a prioritised sequence,
based on expected margin rank analysis and aligned with tenement work commitments. Both the RRA process and
margin rank analysis (with input from Marketing) occur on an annual basis. The timing of exploration is balanced
across the life of the combined Coal asset portfolio to balance new growth projects with existing mine depletion.
For
per
sona
l use
onl
y

Appendix 1 – Competent Persons Report 40
2.10 References
Hammond, R. L., 1987, The Bowen Basin, Queensland, Australia: An upper extension model for its early history:
Australian Bureau of Mineral Resources Record 1987/51.
Noppe, M., 2008, Audit Report of Laboratories QA/QC processes 14 November 2008.
For
per
sona
l use
onl
y

Appendix 1 – Competent Persons Report 41
3 Western Australia Iron Ore
3.1 Executive summary
Western Australia Iron Ore
Table 3.1: Exploration Targets as at 30 June 2014 in 100 per cent terms – reported in compliance with the 2012 JORC
Code.
Ore Type Billions (wet Mt) Fe %
Low Mid High
Brockman 9.0 15 27 57-61%
Marra Mamba 4.2 7.2 15 57-61%
Nimingarra 0.3 0.5 1.2 57-61%
Other Bedrock 0.6 1.1 1.7 52-56%
Channel Iron 0.9 1.5 2.5 52-56%
Detrital Iron 3.1 5.8 11 52-56%
Total 18 31 58 56-60%
Note: Totals rounded to nearest billion wet metric tonnes (wmt) to reflect the appropriate level of precision. Tonnes and grade
are reported above a 50% Fe cut-off. Other Bedrock includes Whaleback and Yandicoogina Shale members excluded from
Brockman as well as Mt McRae Shale, Mt Sylvia, Weeli Wolli and Boolgeeda Formations.
Western Australia Iron Ore (WAIO) is located within the Pilbara region of Western Australia. The geology of the
region, comprising the Hamersley and North East Pilbara provinces, has been extensively studied and is well
documented from over five decades of mapping, exploratory drilling and mining. Notably, the geological
information is publicly available from the Geological Survey of Western Australia (GSWA – Department of Mines
and Petroleum) in the form of maps, cross-sections, drillhole based formation and other publications.
Due to the size of work programs and geographical area covered, WAIO does not publically report individual
Exploration Results instead we report Exploration Targets. The ranges of Exploration Targets are estimated
from geological information including boreholes, outcrops and geophysical information. The potential quantity is
conceptual in nature, there has been insufficient exploration to define Mineral Resources and it is uncertain if
further exploration will result in the determination of Mineral Resources. It should not be expected that the
quality of the Exploration Targets is equivalent to that of the Mineral Resources.
Estimations are performed within a formal facilitated process called Resource Range Analysis (RRA), in which
deterministic estimates of potential volumes are determined over a range of assumptions on continuity and
extension that are consistent with available data and genetic models of the Pilbara region of Western Australia.
For
per
sona
l use
onl
y

Appendix 1 – Competent Persons Report 42
3.2 Competent Person Acknowledgement
This Competent Persons Report, which provides supporting documentation for the Exploration Targets estimated
for WAIO as at 30 June 2014, was prepared under the direction of the Competent Person listed below (Table 3.2).
The Competent Person verifies that:
he has full knowledge of information contained in this report relating to the estimation of the Exploration Targets
of the said deposits;
the Exploration Targets are estimated in accordance with the relevant assessment criteria contained in Table 1
of the JORC Code;
he is a member of MAIG, and has the relevant experience and competency required by the JORC Code; and;
Material issues are transparently disclosed on an ‘if not, why not’ basis
Table 3.2: WAIO Exploration Targets Competent Persons
Name Professional Membership Title
J Knight Member of Australian Institute of Geoscientists
Head of Exploration
For
per
sona
l use
onl
y

Appendix 1 – Competent Persons Report 43
3.3 Introduction
This report covers Exploration Targets and is issued in addition to the BHP Billiton, Iron Ore Business declaration
of Mineral Resources in the BHP Billiton Operational Review Report for the year ended 30 June 2014 for Western
Australia Iron Ore, Australia, released on the 23 July 2014.
BHP was the first company to start iron ore mining in Western Australia in the Kimberley area in 1956 at Yampi
Sound’s Cockatoo Island – the adjacent Koolan Island mine followed in 1965. These mines primarily supplied
BHP’s domestic steelworks at Newcastle and Port Kembla, although some product was exported. In 1966 BHP
developed the Pilbara’s first wholly export mine at Mt Goldsworthy by Goldsworthy Mining Limited (GML) and the
Koolyanobbing (by Dampier Mining Company Ltd – DMC) mine in the Yilgarn. The latter mainly provided ore for
BHP’s steelworks in Kwinana near Perth with a minor portion exported to the Chinese market.
Major export operations commenced in 1969 with the creation of the Mt Newman Mining Joint Venture (MNM), and
subsequent production from the Mt Whaleback deposit. In 1986 BHP acquired majority ownership of MNM, which
along with the 100% BHP owned but undeveloped Yandi property (eventually developed in 1991) began a growth
phase. Acquisition of Goldsworthy Mining Limited (GML) and Jimblebar (formerly McCamey's Monster) followed in
1990 and 1992 respectively. In July 2013, the completion of the ITOCHU Corporation (ITOCHU) and Mitsui & Co.,
Ltd. (Mitsui) transaction reduced our ownership in the Jimblebar Joint Venture to 85%.
BHP Billiton has been expanding the WAIO operations in response to increasing demand for iron ore. Production
has increased from 68 Mt (100% basis) in the 2001 financial year to 225 Mt (100% basis) in the 2014 financial
year. BHP Billiton’s share of 2014 financial year production was 193 Mt.
3.4 Tenure
The majority of deposits reported are located over five main lease areas held by WAIO (and its joint venture
partners, as appropriate, Figure 3.1. The leases, listed in Table 3.3, are governed by State Agreement Acts.
These State Agreement Acts are:
Iron Ore (Mount Newman) Agreement Act 1964 (WA)
Iron Ore (Mount Goldsworthy) Agreement Act 1964 (WA)
Iron Ore (Goldsworthy-Nimingarra) Agreement Act 1972 (WA)
Iron Ore (McCamey's Monster) Agreement Authorisation Act 1972 (WA)
Iron Ore (Marillana Creek) Agreement Act 1991 (WA)
Table 3.3: WAIO Main Lease Areas
Lease Number Joint Venture or Tenement Name
ML 244 SA Mt Newman JV
M 266 SA Jimblebar
M 270 SA Yandi JV
ML 281 SA Mt Goldsworthy (Area C) JV
ML 235 SA, ML 249 SA, ML 263 SA, ML 251 SA Mt Goldsworthy (Northern Areas) JV
There is a well-defined process for operating within the tenements that comprise each of the State Agreement Acts.
This process includes various State Agreement approvals required before mining, processing and transport of iron
ore products can commence.
In addition, one minor operation (Callawa part of Mt Goldsworthy JV Northern) is conducted upon a mining
tenement issued under the Mining Act 1978 (WA).
Proposals approved under State Agreements are a binding commitment between the State and the relevant Joint
Venture and provide long-term security to the tenure and thereby the rights to mine. The approvals will remain
current whilst operations are actively conducted and the State Agreements, which are ratified by the relevant Act,
provide security to the renewal of tenure for the life of the operations.
For
per
sona
l use
onl
y
Appendix 1 – Competent Persons Report 44
Tenure is managed by the Land Tenure Team. The systems in place include a database of all tenure which
includes details of the location, ownership, size, grant and expiry dates and records of the rent paid. In October
2013, the 1SAP Tenement Contract Management (TCM) Module was implemented and, since then, all WAIO
tenements are captured in TCM with all payments governed through this process.
A minority of deposits for which Mineral Resources have been stated are located on exploration licences. The
tenements systems described above manage all mining, exploration and infrastructure tenements.
Exploration titles are applied for under the processes set out in the Mining Act 1978 (WA) and once an exploration
licence is granted it entitles the holder to explore for minerals over the tenement area. Retention of these licences
is subject to annual rental and reporting obligations and meeting annual expenditure commitments or being granted
exemptions.
During FY14, Exploration Licences and Mining Leases under the Mining Act 1978 (WA) held by BHP Coal Pty Ltd
and BHP Billiton Minerals Pty Ltd as detailed in the points below were transferred to BHP Iron (Jimblebar) Pty Ltd.
East Jimblebar / Caramulla – Mining Leases 52/865 – 52/869 and 52/874 – 52/885
MAC North – Exploration Licence 47/628 and Mining Lease applications 47/703 – 47/709
Mindy / Coondiner – Mining Leases 47/710 – 47/731
Prairie Downs – Exploration Licences 52/21 – 52/23, Mining Leases 52/886 – 52/893, 52/907 – 52/909 and
Mining Lease applications 52/870 – 52/873 and 52/897 – 52/900
Roy Hill – Exploration Licence 45/1073 and 45/1074 and Mining Lease applications 45/1038 – 45/1065
Western Ridge – Exploration Licence 52/170 and Mining Leases 52/901 – 52/906
Western Ridge – Exploration Licence 52/2008
In 2010, amendments were made to the five State Agreements managed by BHP Billiton Iron Ore Pty Ltd to,
amongst other matters, permit applications to be made to include the area of exploration and mining tenements
granted under the Mining Act 1978 (WA) into mining and mineral leases granted under the State Agreements up to
777 km2. The State Agreement amendments also allow separate applications to be made to increase the total area
of these State Agreement mining and mineral leases up to a limit not exceeding 1,000 km2.
BHP Billiton made an application to the Minister for State Development for the inclusion of areas into Mining Lease
266SA pursuant to clause 11B(1) of the McCamey's Monster State Agreement. The Minister approved the
application and in order for the new sections of Mining Lease 266SA to be granted, conditional surrenders for the
tenements in Application 1 were required.
The tenements within Application 1 are:
East Jimblebar / Caramulla – Mining Leases 52/865 – 52/869 and 52/874 – 52/885
Mindy / Coondiner – Mining Leases 47/710 – 47/731
Prairie Downs – Mining Leases 52/886 – 52/893, 52/907 – 52/909
West Jimblebar – Mining Lease 52/894 – 52-896
Dongardoo – Exploration Licence 52/1830 and Mining Lease 52/1056
Western Ridge – Exploration Licence 52/170 and Mining Leases 52/901 – 52/906
Western Ridge – Exploration Licence 52/2008
The conditional surrenders have now been registered and these areas are now part of Mining Lease 266SA. For
per
sona
l use
onl
y

Appendix 1 – Competent Persons Report 45
Figure 3.1: WAIO tenement location plan
F
or p
erso
nal u
se o
nly

Appendix 1 – Competent Persons Report 46
3.5 Deposit Geology
The Hamersley Province, Figure 3.2 (after Harmsworth et al 1990), covers an area of 80,000 km2 and contains late
Archaean – Lower Proterozoic age (2,800-2,300 Ma) sediments of the Mount Bruce Supergroup.
The Hamersley Group forms the central part of the Mt Bruce Supergroup and is conformable with both the
underlying Fortescue Group and overlying Turee Creek Group. It is a 2.5 km thick sequence of dominantly deep
water chemical sediments, with subordinate turbiditic sediments and various intrusive and extrusive rocks.
Sediments include (in approximate order of decreasing abundance) banded iron-formation (BIF), shale, dolomite
derived from peri-platformal ooze, chert, pyroclastic shale and tuff, turbiditic carbonate and turbiditic volcanic,
Figure 3.3 (after Harmsworth et al 1990).
The Hamersley Province overall can be considered as two structurally distinct regions:
i. a northern / northwest region of mild deformation typified by shallow, open folds with a west to north-west trend;
ii. a southern region displaying more intense deformation where the major iron deposits occur. This latter area can
be further subdivided into a south-western area dominated by en echelon type open folds, and a south-eastern
area dominated by tight E-W trending folds of shorter wavelength.
Within the banded iron-formations of the Hamersley Group there are two iron bearing stratigraphic sequences
where the major bedded ores are formed:
Brockman Iron Formation
Marra Mamba Iron Formation
On the northern margin of the Archaean Pilbara Craton, in the North-East Pilbara (Figure 3.2) the Nimingarra Iron
Formation hosts the Yarrie-Nimingarra iron ore deposits.
Another important iron bearing sequence is the Marillana Formation which is a detrital derived Channel Iron
Deposit (CID) of late Eocene – Early Miocene age.
Detrital Iron deposits are colluvial-alluvial fans adjacent to some bedded iron deposits with their chemistry aligned
to their source rocks. A schematic structural relationship of the various ore types in the SE Pilbara is represented
as Figure 3.4.
For
per
sona
l use
onl
y

Appendix 1 – Competent Persons Report 47
Figure 3.2: Hamersley Province – Pilbara geological sketch map.
For
per
sona
l use
onl
y

Appendix 1 – Competent Persons Report 48
Figure 3.3: WAIO Hamersley Province stratigraphic column.
For
per
sona
l use
onl
y

Appendix 1 – Competent Persons Report 49
Figure 3.4: Schematic structural sections of mineralisation types of the SE Pilbara.
3.6 Data acquisition
A consistent method of data acquisition is used by WAIO for exploration and development drilling campaigns.
The data acquired includes:
Drillhole collar coordinates, surveyed before and after drilling.
Drillholes are geophysically logged for gamma, gamma-gamma density, calliper and magnetic susceptibility
using industry standard tools and calibration methods.
Magnetic susceptibility tool is used for measuring downhole deviation data as well as intermittent use of
gyroscopes, chiefly for holes greater than 250 m length.
Chip sampling protocols for Reverse Circulation (RC) holes follow benchmark industry practices, with QA/QC
targets established and monitored.
Standard geological logging and automated data capture procedures are followed for the different mineralisation
types and different drilling methods.
Geotechnical logging is typically undertaken in accordance with the BHP Billiton WAIO Geotechnical logging
manual or under a separate consultants system which records similar features.
Hydrogeological logging, bore construction and aquifer testing are completed in line with Australian Standards.
3.6.1 Drilling
Spacing of the drillholes is project dependent, but as a guide, the nominal grids have their greatest spacing
occurring along the main strike of the mineralisation and closer spacing occurring perpendicular to the main strike
of mineralisation. Drilling grids, where present, vary from 2,000 m – 50 m along strike and 300 m – 50 m across
strike.
For
per
sona
l use
onl
y

Appendix 1 – Competent Persons Report 50
A range of historical and current drilling methods are used in geological modelling and/or resource estimation:
Conventional Open-hole Percussion drilling (historical): Utilised a 140 mm conventional downhole hammer
drill bit to produce chip samples of the rock mass. Compressed air forces the drill spoil up the outside of the drill
rods where it is collected in a rig mounted cyclone and then drops down through a drop box into a five tier riffle
splitter to produce a final sample split and reject sample.
Open-hole Percussion drilling with a Cross Over Sub (historical): Identical to Conventional Open-Hole
Percussion drilling except that compressed air forces drill spoil from the drill bit through a cross over sub and
into dual tubed drill rods (outer and inner) and then back to the surface where it is collected in a rig mounted
cyclone.
Reverse Circulation (RC) drilling (current): Utilises a 140 mm RC hammer face sampling bit to produce chip
samples of the rock mass. Dual tube drill rods (outer and inner) are used to carry air to the hammer and drill
spoil to the surface. The volume of air forces the drill spoil up the inner tubes where it is collected in a rig
mounted cyclone and then drops down through a drop box into either a static cone splitter or a five tier riffle
splitter to produce a final sample split and reject sample.
Diamond drillholes (current and historical): Utilises a diamond impregnated drill bit to advance an attached
hollow drill rod string into hard bedrock, producing a cylindrical core sample representing the formation being
drilled. BHP Billiton Iron Ore uses various diameter diamond drillholes depending on the intended use of the
drillhole samples (e.g. geological drillhole, geotechnical drillhole, hydrological drillhole, geo-metallurgical
drillhole). Typically though the drillhole diameters are either 63.5 mm (HQ3) or 85 mm (PQ3).
In FY14, exploration activity was completed over multiple project areas and deposits. Drilling totalled 500,464 m
comprising:
426,214 m RC (reverse circulation drilling utilising 140 mm Face Hammer)
52,300 m DD (diamond drilling typically 63.5 mm HQ triple core)
21,950 m Hydrology* drilling.
* Hydrology drilling incorporates a range of methods and diameters including conventional air rotary, dual rotary and flooded
reverse.
Table 3.4 details the historical drilling carried out in the Pilbara since the 1950s by main drill types. It is interesting
to note that 68% of all drilling has occurred since the year 2000.
Table 3.4: Historical Drill Meters by Period
Period Drilled
Air Core
Conventional Hammer
(Percussion)
Diamond Percussion Reverse Circulation
RC Hammer Face
Sampling Bit
Other Drill Type
Total Per Period
1950s 0 0 132 0 0 0 86,034 86,166
1960s 0 0 1,518 5,963 1,898 0 80,602 89,981
1970s 15 107 37,298 51,560 2,354 205 381,854 473,392
1980s 3,612 6,722 15,308 54,973 10,599 0 490,444 581,659
1990s 17,407 8,411 68,450 12,243 70,745 106,937 771,694 1,055,887
2000s 1,419 46,660 246,593 1,809 237,627 2,054,475 24,731 2,613,309
2010 0 15,774 41,618 0 0 409,541 5,482 472,415
2011 0 6,393 75,680 0 1,194 502,693 2,151 588,111
2012 0 28,091 85,655 0 0 556,359 5,314 675,420
2013 0 31,914 44,211 0 0 459,473 10,780 546,378
Total 22,453 144,072 616,463 126,548 324,417 4,089,683 1,859,086 7,182,712
Note: Other Drill Types comprised of Blade; Conventional Blade; Conventional Hammer - Crossover Sub; Conventional Rock
Roller; Dual Rotary; Drag Bit; Reverse Flush / Flooded Reverse; Flushing; Hydro; RC Blade - Crossover Sub; Rotary Mud;
Sonic; Vacuum and Unknown Drill Type.
For
per
sona
l use
onl
y

Appendix 1 – Competent Persons Report 51
3.6.2 Survey
Survey practices have improved over time, ground truthing and re-survey of historic data is completed where
issues are identified and it is practical to do so.
All surveys are referenced to Geocentric Datum of Australia 1994 (GDA94) and the Australian Height Datum
(AHD).
Current practices are based on industry standards and best practice. The typical methodologies utilised and
minimum accuracy requirements are;
For collar surveys:
Multi Frequency Real Time Kinematic Global Positioning System (RTK GPS).
Positional uncertainty: Horizontal 0.3 m; Vertical 0.1 m.
For QA/QC 5% of each drill program is re-surveyed.
Historical drillhole collars were surveyed using traditional terrestrial based techniques including trigonometric
heighting and gridding by theodolite. Current RTK GPS practices were adopted circa 2000.
For mapping and relief modelling:
Aerial Survey.
Positional uncertainty: Horizontal 2.5 m; Vertical 1.0 m.
For downhole surveys:
A Magnetic susceptibility tool is used for measuring downhole deviation data as well as intermittent use of
gyroscopes, chiefly for holes greater than 250 m length.
Any holes with greater than 2 degrees deviation over 5 m are investigated.
For QA/QC purposes 5% of each drill program is re-surveyed.
3.6.3 Sampling and Analytical Procedures
The standard sample interval employed for the vast majority of drill holes is 3 m in the Bedded Iron Formations, and
2 m in Channel Iron Deposits. There is no specific trigger driving the choice of diamond drilling over RC drilling. In
fact there are many varying reasons, these may include but are not limited to; QA/QC of RC techniques,
geotechnical requirements, increased sample confidence below water table and detailed structural logging
requirements in geologically complex deposits.
For diamond drillholes the entire interval of core is sent for Hylogging (HyLogger: Automated visible to infrared drill
core scanning system that provides semi-quantitative colour and mineralogy estimates), Geometallurgy processing
(typically studies on lump / fines relationships) and sample preparation.
For Open-hole Percussion and RC drillholes approximately 6 kg sample of drill cuttings is collected using either a
static cone splitter or a five tier riffle splitter.
Historical assaying processes were employed by Mt Newman Mining Ltd and Goldsworthy Mining Ltd in the 1960s
and 1970s where samples were processed in company-owned laboratories. Mt Newman Mining Ltd regularly
assayed samples for Fe, P, SiO2, Al2O3 by X-Ray Fluorescence (XRF) and sporadically for other elements such
Mn, CaO, K2O, MgO, S and TiO2. Very early scout drill campaigns in the 1960s at Area C Goldsworthy Mining Ltd
assayed Fe using a wet chemical titration method for analysis which only determined soluble Fe. Later drill
programs were assayed for Fe, P, SiO2, Al2O3 by X-Ray Fluorescence (XRF).
Post 1980, BHP Billiton Iron Ore has employed third party owned laboratories to process and assay drillhole
samples. Samples are first oven dried and then are subsequently crushed to minus 2.8 mm (90% passing) and
from each, a 2.5 kg split is robotically pulverised to minus 160 μm (95% passing). After this process, 200 g of pulp
is collected and later used for chemical analysis by X-Ray Fluorescence (XRF) for Fe, P, SiO2, Al2O3, MnO, CaO,
K2O, MgO, S and TiO2 and Robotic Thermo-Gravimetric Analysis (ROBTGA) for LOI.
For
per
sona
l use
onl
y

Appendix 1 – Competent Persons Report 52
Since FY13, RC drilling requires the injection of water at the bit so as to minimise dust exposure. Early indications
are that a 40% reduction in dust exposure to personnel has been achieved. This practice produces wet samples of
slurry consistency.
During the FY14 drilling campaign, approximately 90% of the samples collected were from reverse circulation face
hammer (RC) (140 mm diameter) and 10% from diamond drilling HQ triple tube core (DDH) (63.5 mm diameter). A
total of 181,284 samples were analysed, with 21,462 samples collected by diamond drilling and 159,822 samples
by RC drilling.
During FY14, WAIO used external laboratories for the realisation of chemical analysis. UltraTrace (Bureau Veritas)
was the main lab, processing 99% of WAIO samples, SGS laboratory was also used for processing project
samples, chiefly from Bulk Sampling programs. Both are ISO 17025 certified Labs and work under the same
procedures.
Sample preparation protocols (drying temperatures and times, crushing and pulverising sizing requirements, etc) at
laboratories meet standards defined in contracts in line with ISO standards, with QA/QC targets established;
duplicates, blanks and standards are routinely included in sample batches for monitoring of precision,
contamination and accuracy.
Diagrammatic flow chart of the sample preparation process is shown Figure 3.5.
Figure 3.5: Sampling and analytical flow diagram
For
per
sona
l use
onl
y

Appendix 1 – Competent Persons Report 53
3.6.4 Quality of assay data and laboratory tests
Since the year 2000, WAIO have employed a formalised QA/QC program that includes routine controls for
approximately 10% of the samples sent for chemical analysis. The WAIO QA/QC controls include certified
reference materials (CRM), duplicates samples for RC drillholes, and blanks. They have specific objectives in the
process controlling mechanical preparation of sampling and analyses. Certified reference materials were prepared
by Ore Research & Exploration Lab (ORE, an independent company specialising in CRM preparation) in 2010.
Additionally by contract, WAIO have set third party laboratory QA/QC controls that include sizing checks, crusher
duplicates, pulp repeats, blanks and standards.
Acceptance limits have been defined according to BHP Billiton guidelines and global sampling benchmarks.
QA/QC controls include routine and ‘without prior notice’ visits to the laboratories, with the aim of ensuring that the
laboratories are working according to our procedure and to supervise sample integrity. If issues are detected, they
are raised with the laboratory managers and an action plan is developed to improve the process.
QA/QC improvements implemented during FY14, including the quantification of sampling error and the facilitation
of QA/QC improvements in the field, saw a reduction of the business risk associated with sampling uncertainty.
3.6.5 Verification of sampling and assaying
WAIO drillhole data is managed internally using processes and systems including:
Computerised field logging system that includes controlled input through drop down lists and inbuilt validation
checks to trap erroneous data at the earliest possible stage.
Comprehensive SQL Server relational database that is structured such that quality data and relevant meta-data
are integrated with the primary geological, geochemical and geophysical data, and
Strict validation rules including confirmation of acceptable QA/QC results for each batch of samples assayed.
Data is only loaded to the master database after all data for the hole has been validated and signed off by the
field geologist.
The WAIO drillhole database was audited by Golder Associates in July 2008 with no fatal flaws identified and all
the key recommendations actioned.
The WAIO database has a security model which requires user access to have supervisor approval. The system is
backed up per standard backup procedures nightly. A disaster recovery test was successfully completed in May
2010 which recovered the database from a server image and backup.
Primary data sources for all drillhole data are stored on the database server in a secure archive directory. As part of
standard work procedures, 5% of the assay data stored in the drillhole database are physically checked by
geologists against hardcopy laboratory certificates. The details of these checks and approvals are stored in the
database. Additionally QA/QC requirements require 5% of all drillhole collars to be resurveyed.
Data exported from the drillhole database for modelling contains summary statistics, and on the upload of the
exported data into the modelling systems, work procedures require statistical checks to ensure the data loaded is
the same as exported.
3.6.6 Physical parameters
In general in situ bulk density is measured using gamma-gamma single density tool. A single detector density tool
with a cobalt source is used. The density tool is calibrated every fortnight at designated calibration sites against
known physical densities. The tool measures electron density and it is then converted to bulk density using the
calibration points. The following QAQC measures are taken to monitor data quality and ensure the credibility of the
density data for geological modelling and resource evaluation:
Calibration of log responses to known engineering units (accuracy).
Logging a repeatability borehole (demonstrate accuracy and determine precision / repeatability).
Resurveying of 5-10% of drill holes on a drill program (repeatability / reproducibility check).
For
per
sona
l use
onl
y

Appendix 1 – Competent Persons Report 54
Comparison of independent density measures, i.e. downhole gamma-gamma density versus density
measurements made on diamond drill core samples (‘volume and weight’ method).
RC drilling techniques cause a rougher sidewall condition in the drillhole internally termed rugosity, this rugosity
causes an air gap between the downhole gamma density tool and the wall rock thus resulting in reduced density
values. Therefore all RC derived density information is studied on a project by project basis.
3.6.7 Audits and reviews
The WAIO resource drillhole process was audited by Golder Associates in July 2008. The audit covered drillhole
planning; set out, pick up and downhole survey practices; drilling supervision; sample collection and submission;
downhole geophysical surveys and calibration; data management processes; chain of custody; procedure
documentation; data security and data validation. The audit had no fatal flaws identified and all the key
recommendations have been actioned.
3.7 Exploration targets
BHP Billiton’s Exploration Targets within its Western Australia Iron Ore tenements have been estimated as the
tonnage ranges provided in Table 3.1. These figures are an estimation of mineralisation with Fe cut-off ≥50%,
exclude magnetite deposits, and are determined from a Resource Range Analysis (RRA) process on 76 deposit
areas, together with the addition of unclassified material from resource models (withheld from reporting as JORC-
compliant Mineral Resources).
The RRA process provides a methodology for assessing deposits for the range of mineralisation that can exist in
an area under varying geological conditions. The range in mineralisation characteristics (tonnage, geometry and
chemistry) generally has the largest single influence on project valuation. Incomplete knowledge of a deposit
creates uncertainty. The understanding of a deposit will change over time, as the level of knowledge increases.
However the ability to detect and characterise the deposit is limited by data, even after detailed exploration and
evaluation. The RRA process is a means of quantifying the uncertainty by considering all possible outcomes as a
range and modelling a probability distribution to quantify risk.
The range of mineralisation is estimated from geological information including boreholes, outcrops and geophysical
information. The potential quantity is conceptual in nature, there has been insufficient exploration to define Mineral
Resources and it is uncertain if further exploration will result in the determination of a Mineral Resources. It should
not be expected that the quality of the Exploration Targets is equivalent to that of the Mineral Resources.
A systematic approach is utilised by Exploration to test the Max case geological thinking and these programs of
work form part of the five year plan aligned with business strategic requirements.
3.8 References
Harmsworth R.A., Kneeshaw M., Morris R.C., Robinson C.J., and Shrivastava P.K., 1990. BIF-Derived Iron Ores of
the Hamersley Province in Monograph 14, Geology of the Mineral Deposits of Australia and Papua New Guinea,
pp 617-642. (AusIMM, Melbourne).
For
per
sona
l use
onl
y

Appendix 1 – Competent Persons Report 55
4 Units
μm micrometre
mm millimetre
cm centimetre
m meter
km kilometre
km2 square kilometre
Ha hectare
Ma million years
DH drill hole
RRA Resource Range Analysis
g gram
kg kilogram
kcal/kg kilocalories per kilogram
g/t grams per tonne
Mt million tonnes
Bt billion tonnes
ppm parts per million
Mo Molybdenum
UTM Universal Transverse Mercator
wt % weight percentage
amsl above mean sea level
% percent
For
per
sona
l use
onl
y