
BHHS Westchester Properties 2015 Q3 Market Report
9
Third Quarter 2015 Westchester County Market Report
-
Upload
berkshire-hathaway-homeservices-new-england-properties -
Category
Documents
-
view
212 -
download
0
description
Welcome to Berkshire Hathaway HomeServices Weshchester Properties' Third Quarter Market Report, our examination of the single family and condominium markets throughout Westchester County NY.
Transcript of BHHS Westchester Properties 2015 Q3 Market Report

Third Quarter 2015Westchester County Market Report

www.bhhsWestchester.com Westchester county market report • 2
Executive summary
Welcome to the Berkshire Hathaway HomeServices Westchester Properties’ Third Quarter 2015 Westchester County Market Report, our examination of the single family, cooperative and condominium markets.
Countywide, the number of single family home sales jumped 5.8% compared to last year (2,076 vs. 1,953) while the average price of single family homes decreased slightly 1.5% year to year ($914,300 vs. $928,500). Average days on market decreased from 155 to 147. The average price for cooperatives grew slightly ($193,800 vs. $187,400). The number of cooperatives sold in Westchester County also increased, up 11.4% compared to last year (548 vs. 492). Condominium sales also increased this quarter when compared to last year by 19.2% at an average price of $458,600 (-2.2%). Luxury sales remained strong this quarter when compared to last year with 128 sales over $2 million. 10.9% of these sales were over $5 million.
As the market continues to gain momentum in the fourth quarter; buyers and sellers will ride the wave of low interest rates and value priced homes. Most will do it without obstacles, provided they are well versed in the new TRID mortgage regulations. Berkshire Hathaway HomeServices Westchester Properties Realtors are educated and well prepared for the new Dodd Frank rules and regulations that we believe will have minimal impact on the market. Sellers will need to get their attorneys involved earlier and buyers should be aware of the fact that they should contact a mortgage professional who is versed on the new process at the onset of their search.
At Berkshire Hathaway HomeServices Westchester Properties, our mission is to provide an unparalleled customer service experience throughout all aspects of the home transaction process. If you have any questions regarding the report, Berkshire Hathaway HomeServices Westchester Properties Realtors® are here to help you navigate the current market with expert knowledge and exceptional service.
Candace Adams
President and CEO
3rd Quarter 2015
Prepared by:
Candace Adams, President/CEO, [email protected] Redican, Director of Marketing, [email protected]
cover photo: scarsdale • www.34axtellDrive.bhhswestchester.com

Q3-2015
www.bhhsWestchester.com Westchester county market report • 3
Clo
sed
Sale
s
0
500
1000
1500
2000
2500
Q4 2013 Q1 2014 Q2 2014 Q3 2014 Q4 2014 Q1 2015 Q2 2015 Q3 2015
Clo
sed
Sal
es
Single Family Condominium Coop
CLOSED SALES & CONTRACTS SIGNED
There were 2,076 closed sales for single family homes during Third Quarter 2015, up 5.8% year over year. Condominium and cooperatives saw increases in closed sales as well by 19.2% and 11.4% respectively.
SALES vOLuME
Sales volume for single family homes increased to $1,837,664,149 up 2.6% year over year. Condominium sales volume jumped 23.6% year over year ($177,149,945 vs. $143,281,484) while cooperative volume grew 14.4% to $105,931,387. Notable cooperative increases were in Scarsdale, White Plains and New Rochelle.
$0.0
$0.2
$0.4
$0.6
$0.8
$1.0
$1.2
$1.4
$1.6
$1.8
Q4 2013 Q1 2014 Q2 2014 Q3 2014 Q4 2014 Q1 2015 Q2 2015 Q3 2015
Do
lla
rs i
n B
illi
on
s
Statewide Sales Volume
Single Family
Condominium
Coop
+2.59%Q3 2015 vs Q3 2014
+23.64%
Q3 2015 vs Q3 2014
Q3 2015 vs Q3 2014
+14.38%

Q3-2015
www.bhhsWestchester.com Westchester county market report • 4
HOME PRICES
Year over year average price for single family homes decreased to $914,300, down 1.5% while cooperative prices increased to $193,800, up 3.4%. The median sale prices year over year for single family homes increased from $689,000 to $690,000, up 0.1% while cooperatives went up 5.4% ($163,300 vs. $155,000). Median condominium prices remained relatively flat at $399,500.
AverAge SAleS Price
Single FAmily
AverAge SAleS Price
condominium
AverAge SAleS Price
cooP
mediAn SAleS Price Single
FAmily
mediAn SAleS Price
condominium
mediAn SAleS Price cooP
Q2 2015 $874,900 $468,300 $181,500 $669,000 $378,000 $145,000
chAnge 4.5% -2.1% 6.8% 3.1% 5.7% 12.6%
Q3 2015 $914,300 $458,600 $193,800 $690,000 $399,500 $163,300
Q3 2014 $928,500 $469,100 $187,400 $689,000 $395,000 $155,000
chAnge -1.5% -2.2% 3.4% 0.1% 1.1% 5.4%
Q3 2015 $914,300 $458,600 $193,800 $690,000 $399,500 $163,300
Mon
ths
Supp
ly o
f Inv
ento
ry
0
2
4
6
8
10
12
14
16
18
20
Q4 2013 Q1 2014 Q2 2014 Q3 2014 Q4 2014 Q1 2015 Q2 2015 Q3 2015
Mo
nth
s S
up
ply
of
Inve
nto
ry
Single Family Condominium coop_inventory
CuRRENT INvENTORY
Supply for all home types is down year over year but up when compared to the second quarter. Single family home inventory decreased 4.5% year over year to 12.6 months and condominium supply decreased to 8.4 months, down 31.2%. Cooperative inventory is at a 12.3 month supply, down 22.6% year over year. This indicates pricing will remain strong in the fourth quarter.

Q3-2015
www.bhhsWestchester.com Westchester county market report • 5
THIRD QuARTER LuxuRY SALES
Sales over $2 million make up the luxury market in Westchester County. The total number of high end sales during the third quarter of 2015 remained steady year over year compared to second quarter 2015 (128 vs. 131). The majority of high end sales were in the $2 - $5 Million range.
0 20 40 60 80 100 120 140
Q4 2013
Q1 2014
Q2 2014
Q3 2014
Q4 2014
Q1 2015
Q2 2015
Q3 2015
Number of Sales
Luxury Sales Over $5 Million $3-$5 Million $2-$3 Million
Luxu
ry S
ales
eastchester • www.36LakeshoreDr.bhhswestchester.com

Q3-2015
www.bhhsWestchester.com Westchester county market report • 6
AVERAGE SALES PRICE MEDIAN SALES PRICE SALES DAyS oN MARkEt DoLLAR VoLuMEQTR 32015
%CHG14-15
QTR 32015
%CHG14-15
QTR 32015
%CHG14-15
QTR 32015
%CHG14-15
QTR 32015
%CHG14-15
ARDSLEy
Singe Family 614,180 -19.0% 620,000 -4.6% 34 -30.6% 43 -54.7% 15,354,500 -58.7%
Condo 857,000 3.4% 840,000 2.4% 5 -28.6% 56 -37.1% 4,285,000 -26.1%
Co-op 0 N/A 0 N/A 0 N/A N/A N/A 0 N/A
BEDFoRD
Singe Family 1,010,110 -14.1% 750,000 2.6% 68 -15.0% 75 -29.9% 68,687,513 -27.0%
Condo 350,783 11.5% 350,180 6.8% 13 116.7% 78 -53.6% 4,560,180 141.6%
Co-op 105,218 -28.7% 85,000 -36.8% 11 10.0% 154 90.1% 1,157,400 -21.6%
BLIND BRook
Singe Family 862,049 4.4% 845,000 3.7% 41 2.5% 75 23.0% 35,344,000 7.0%
Condo 0 N/A 0 N/A 0 N/A N/A N/A 0 N/A
Co-op 0 N/A 0 N/A 0 N/A N/A N/A 0 N/A
BRIARCLIFF MANoR
Singe Family 886,018 -7.1% 855,000 0.8% 31 6.9% 49 -32.9% 27,466,560 -0.7%
Condo 573,667 17.3% 527,000 13.3% 3 0.0% 16 -78.9% 1,721,000 17.3%
Co-op 137,500 22.2% 137,500 22.2% 2 100.0% 90 -68.4% 275,000 144.4%
BRoNXVILLE
Singe Family 2,379,500 29.1% 2,200,000 34.4% 21 -44.7% 73 28.1% 49,969,500 -28.7%
Condo 1,238,000 20.8% 1,238,000 20.8% 2 100.0% 18 0.0% 2,476,000 141.6%
Co-op 525,633 -14.1% 540,000 6.9% 15 -6.3% 64 -21.0% 7,884,500 -19.5%
ByRAM HILLS
Singe Family 1,377,164 -21.8% 1,185,000 12.5% 44 -12.0% 86 14.7% 60,595,197 -31.2%
Condo 0 N/A 0 N/A 0 N/A N/A N/A 0 N/A
Co-op 0 N/A 0 N/A 0 N/A N/A N/A 0 N/A
CHAPPAQuA
Singe Family 1,026,710 -6.6% 918,500 0.3% 86 10.3% 75 0.0% 88,297,041 2.9%
Condo 498,179 -14.8% 490,000 -8.4% 14 27.3% 52 -16.1% 6,974,500 8.5%
Co-op 0 N/A 0 N/A 0 N/A N/A N/A 0 N/A
CRotoN-HARMoN
Singe Family 657,171 14.7% 590,000 7.3% 41 46.4% 55 -19.1% 26,944,000 68.0%
Condo 591,000 12.0% 591,000 17.0% 2 -33.3% 20 -35.5% 1,182,000 -25.3%
Co-op 0 N/A 0 N/A 0 N/A N/A N/A 0 N/A
WESTCHESTER COuNTY BY THE NuMBERS
• Mamaroneck saw increases in both average and median sales prices for single family homes, 19.8% and 23.5% respectively.
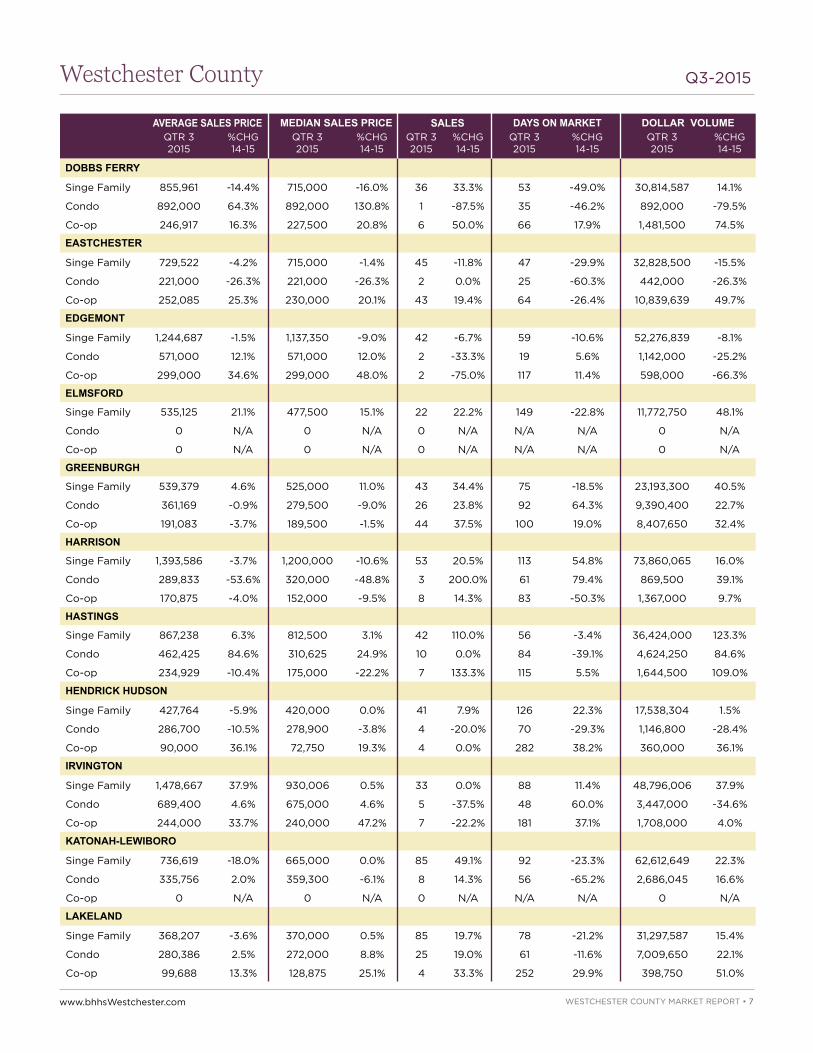
• Median price for single family homes in Scarsdale increased by 6.3% this quarter to $1,600,000.• Sales and sales volume in Eastchester increased by 19.4% and 49.7% respectively for cooperatives
this quarter.
Q3-2015
www.bhhsWestchester.com Westchester county market report • 7
AVERAGE SALES PRICE MEDIAN SALES PRICE SALES DAyS oN MARkEt DoLLAR VoLuMEQTR 32015
%CHG14-15
QTR 32015
%CHG14-15
QTR 32015
%CHG14-15
QTR 32015
%CHG14-15
QTR 32015
%CHG14-15
DoBBS FERRy
Singe Family 855,961 -14.4% 715,000 -16.0% 36 33.3% 53 -49.0% 30,814,587 14.1%
Condo 892,000 64.3% 892,000 130.8% 1 -87.5% 35 -46.2% 892,000 -79.5%
Co-op 246,917 16.3% 227,500 20.8% 6 50.0% 66 17.9% 1,481,500 74.5%
EAStCHEStER
Singe Family 729,522 -4.2% 715,000 -1.4% 45 -11.8% 47 -29.9% 32,828,500 -15.5%
Condo 221,000 -26.3% 221,000 -26.3% 2 0.0% 25 -60.3% 442,000 -26.3%
Co-op 252,085 25.3% 230,000 20.1% 43 19.4% 64 -26.4% 10,839,639 49.7%
EDGEMoNt
Singe Family 1,244,687 -1.5% 1,137,350 -9.0% 42 -6.7% 59 -10.6% 52,276,839 -8.1%
Condo 571,000 12.1% 571,000 12.0% 2 -33.3% 19 5.6% 1,142,000 -25.2%
Co-op 299,000 34.6% 299,000 48.0% 2 -75.0% 117 11.4% 598,000 -66.3%
ELMSFoRD
Singe Family 535,125 21.1% 477,500 15.1% 22 22.2% 149 -22.8% 11,772,750 48.1%
Condo 0 N/A 0 N/A 0 N/A N/A N/A 0 N/A
Co-op 0 N/A 0 N/A 0 N/A N/A N/A 0 N/A
GREENBuRGH
Singe Family 539,379 4.6% 525,000 11.0% 43 34.4% 75 -18.5% 23,193,300 40.5%
Condo 361,169 -0.9% 279,500 -9.0% 26 23.8% 92 64.3% 9,390,400 22.7%
Co-op 191,083 -3.7% 189,500 -1.5% 44 37.5% 100 19.0% 8,407,650 32.4%
HARRISoN
Singe Family 1,393,586 -3.7% 1,200,000 -10.6% 53 20.5% 113 54.8% 73,860,065 16.0%
Condo 289,833 -53.6% 320,000 -48.8% 3 200.0% 61 79.4% 869,500 39.1%
Co-op 170,875 -4.0% 152,000 -9.5% 8 14.3% 83 -50.3% 1,367,000 9.7%
HAStINGS
Singe Family 867,238 6.3% 812,500 3.1% 42 110.0% 56 -3.4% 36,424,000 123.3%
Condo 462,425 84.6% 310,625 24.9% 10 0.0% 84 -39.1% 4,624,250 84.6%
Co-op 234,929 -10.4% 175,000 -22.2% 7 133.3% 115 5.5% 1,644,500 109.0%
HENDRICk HuDSoN
Singe Family 427,764 -5.9% 420,000 0.0% 41 7.9% 126 22.3% 17,538,304 1.5%
Condo 286,700 -10.5% 278,900 -3.8% 4 -20.0% 70 -29.3% 1,146,800 -28.4%
Co-op 90,000 36.1% 72,750 19.3% 4 0.0% 282 38.2% 360,000 36.1%
IRVINGtoN
Singe Family 1,478,667 37.9% 930,006 0.5% 33 0.0% 88 11.4% 48,796,006 37.9%
Condo 689,400 4.6% 675,000 4.6% 5 -37.5% 48 60.0% 3,447,000 -34.6%
Co-op 244,000 33.7% 240,000 47.2% 7 -22.2% 181 37.1% 1,708,000 4.0%
kAtoNAH-LEWIBoRo
Singe Family 736,619 -18.0% 665,000 0.0% 85 49.1% 92 -23.3% 62,612,649 22.3%
Condo 335,756 2.0% 359,300 -6.1% 8 14.3% 56 -65.2% 2,686,045 16.6%
Co-op 0 N/A 0 N/A 0 N/A N/A N/A 0 N/A
LAkELAND
Singe Family 368,207 -3.6% 370,000 0.5% 85 19.7% 78 -21.2% 31,297,587 15.4%
Condo 280,386 2.5% 272,000 8.8% 25 19.0% 61 -11.6% 7,009,650 22.1%
Co-op 99,688 13.3% 128,875 25.1% 4 33.3% 252 29.9% 398,750 51.0%

Q3-2015
www.bhhsWestchester.com Westchester county market report • 8
AVERAGE SALES PRICE MEDIAN SALES PRICE SALES DAyS oN MARkEt DoLLAR VoLuMEQTR 32015
%CHG14-15
QTR 32015
%CHG14-15
QTR 32015
%CHG14-15
QTR 32015
%CHG14-15
QTR 32015
%CHG14-15
MAMARoNECk
Singe Family 1,447,163 19.8% 1,307,500 23.5% 105 -16.0% 44 -6.4% 151,952,160 0.6%
Condo 404,682 -25.4% 425,000 -1.3% 11 57.1% 52 52.9% 4,451,500 17.2%
Co-op 245,853 2.8% 249,000 31.1% 17 -32.0% 55 -42.1% 4,179,500 -30.1%
MouNt PLEASANt
Singe Family 580,634 -4.4% 555,800 4.6% 38 5.6% 61 -24.7% 22,064,100 1.0%
Condo 434,333 8.6% 503,000 25.8% 3 200.0% 42 -83.7% 1,303,000 225.8%
Co-op 0 N/A 0 N/A 0 N/A N/A N/A 0 N/A
MouNt VERNoN
Singe Family 420,666 -18.8% 383,000 -3.0% 44 0.0% 125 28.9% 18,509,309 -18.8%
Condo 235,000 -0.1% 235,000 1.7% 1 -66.7% 109 -6.8% 235,000 -66.7%
Co-op 111,222 -5.7% 107,000 -11.2% 27 -20.6% 158 -4.2% 3,003,000 -25.1%
NEW RoCHELLE
Singe Family 691,958 -3.3% 654,400 1.5% 141 14.6% 72 -26.5% 97,566,137 10.8%
Condo 468,972 10.5% 458,750 12.6% 18 0.0% 119 30.8% 8,441,500 10.5%
Co-op 175,691 18.1% 158,000 26.4% 54 20.0% 130 -7.1% 9,487,299 41.7%
NoRtH SALEM
Singe Family 492,906 -10.4% 455,000 -11.7% 18 -5.3% 109 -6.0% 8,872,301 -15.1%
Condo 0 N/A 0 N/A 0 N/A N/A N/A 0 N/A
Co-op 0 N/A 0 N/A 0 N/A N/A N/A 0 N/A
oSSINING
Singe Family 405,458 -1.0% 390,000 -3.7% 61 10.9% 83 1.2% 24,732,945 9.8%
Condo 417,480 9.1% 405,000 12.5% 25 19.0% 72 10.8% 10,437,001 29.9%
Co-op 138,229 -24.3% 100,750 8.3% 12 0.0% 69 -47.7% 1,658,750 -24.3%
PEEkSkILL
Singe Family 280,614 6.3% 303,490 10.4% 24 4.3% 128 34.7% 6,734,729 11.0%
Condo 270,813 6.2% 256,000 23.4% 20 42.9% 96 -4.0% 5,416,250 51.6%
Co-op 77,188 13.7% 64,500 2.4% 8 -11.1% 144 -13.8% 617,500 1.1%
PELHAM
Singe Family 988,788 17.9% 942,500 25.7% 66 53.5% 66 -8.3% 65,260,006 80.9%
Condo 431,700 -21.7% 542,500 2.4% 5 66.7% 58 -30.1% 2,158,500 30.4%
Co-op 284,000 30.5% 227,000 31.4% 4 -50.0% 188 45.7% 1,136,000 -34.8%
PLEASANtVILLE
Singe Family 625,662 4.7% 625,000 8.7% 17 -32.0% 67 -30.9% 10,636,250 -28.8%
Condo 333,000 -4.1% 333,000 -16.5% 2 -60.0% 20 -37.5% 666,000 -61.6%
Co-op 202,375 23.4% 192,000 6.7% 4 33.3% 89 -15.2% 809,500 64.5%
PoCANtICo HILLS
Singe Family 881,100 17.1% 714,500 5.5% 5 25.0% 32 -41.8% 4,405,500 46.4%
Condo 211,000 -25.2% 211,000 -25.2% 1 -50.0% 37 -7.5% 211,000 -62.6%
Co-op 0 N/A 0 N/A 0 N/A N/A N/A 0 N/A
PoRt CHEStER
Singe Family 828,628 83.7% 476,000 13.3% 25 -16.7% 95 17.3% 20,715,700 53.0%
Condo 243,990 7.3% 218,000 -1.6% 10 0.0% 54 -73.5% 2,439,900 7.3%
Co-op 123,143 12.2% 120,000 33.3% 7 -41.7% 157 -9.8% 862,000 -34.6%

Q3-2015
www.bhhsWestchester.com Westchester county market report • 9
AVERAGE SALES PRICE MEDIAN SALES PRICE SALES DAyS oN MARkEt DoLLAR VoLuMEQTR 32015
%CHG14-15
QTR 32015
%CHG14-15
QTR 32015
%CHG14-15
QTR 32015
%CHG14-15
QTR 32015
%CHG14-15
PutNAM VALLEy
Singe Family 431,667 45.0% 490,000 55.2% 3 -25.0% 130 -0.8% 1,295,000 8.8%
Condo 0 N/A 0 N/A 0 N/A N/A N/A 0 N/A
Co-op 0 N/A 0 N/A 0 N/A N/A N/A 0 N/A
RyE CIty
Singe Family 2,364,087 0.0% 1,712,500 -21.3% 60 -1.6% 67 3.1% 141,845,228 -1.7%
Condo 1,019,200 -76.3% 795,000 84.9% 5 400.0% 36 -28.0% 5,096,000 1085.1%
Co-op 281,156 -44.0% 270,000 -28.5% 9 50.0% 138 16.9% 2,530,400 -15.9%
RyE NECk
Singe Family 1,395,196 35.5% 865,000 -8.3% 25 -16.7% 88 31.3% 34,879,900 12.9%
Condo 362,000 -12.1% 325,000 -38.7% 4 -20.0% 54 10.2% 1,562,999 -24.1%
Co-op 194,375 -34.7% 190,625 -35.9% 4 300.0% 91 -26.0% 777,500 161.3%
SCARSDALE
Singe Family 1,713,936 -8.9% 1,600,000 6.3% 101 -1.0% 45 -25.0% 173,107,507 -9.8%
Condo 0 N/A 0 N/A 0 N/A N/A N/A 0 N/A
Co-op 480,000 N/A 500,000 N/A 3 N/A 76 N/A 1,440,000 N/A
SoMERS
Singe Family 537,764 -9.2% 495,000 -20.8% 55 41.0% 71 -23.7% 29,577,000 28.0%
Condo 417,897 7.1% 415,000 5.3% 57 29.5% 60 -4.8% 23,820,120 38.8%
Co-op 0 N/A 0 N/A 0 N/A N/A N/A 0 N/A
tARRytoWN
Singe Family 702,047 2.0% 657,250 17.6% 32 88.2% 72 -49.7% 22,465,495 92.0%
Condo 618,325 11.2% 497,500 8.5% 30 66.7% 56 12.0% 18,549,750 85.3%
Co-op 169,000 12.9% 155,000 2.0% 9 50.0% 123 8.8% 1,521,000 69.4%
tuCkAHoE
Singe Family 814,528 -5.2% 753,750 -2.7% 18 28.6% 58 -40.2% 14,661,500 21.9%
Condo 421,500 -15.2% 432,000 -14.3% 8 60.0% 55 41.0% 3,372,000 35.7%
Co-op 156,500 -0.9% 156,500 -0.9% 4 300.0% 97 340.9% 626,000 296.2%
VALHALLA
Singe Family 549,156 10.1% 503,750 -0.2% 32 14.3% 78 -9.3% 17,573,000 25.9%
Condo 0 N/A 0 N/A 0 N/A N/A N/A 0 N/A
Co-op 147,180 -18.2% 130,000 -31.2% 5 66.7% 57 -56.5% 735,900 36.3%
WHItE PLAINS
Singe Family 734,045 8.6% 642,500 11.6% 84 5.0% 59 -21.3% 61,659,766 14.1%
Condo 528,065 -4.7% 359,000 -9.1% 55 27.9% 107 5.9% 29,043,600 21.9%
Co-op 213,299 12.9% 190,000 7.0% 73 19.7% 81 -26.4% 15,570,850 35.1%
yoNkERS
Singe Family 535,812 9.1% 459,000 5.3% 158 0.0% 73 -29.1% 84,658,244 9.1%
Condo 304,273 -0.8% 295,000 0.9% 22 10.0% 109 36.3% 6,694,000 9.1%
Co-op 160,287 0.2% 134,125 -1.6% 154 18.5% 112 -14.5% 24,684,249 18.7%
yoRktoWN
Singe Family 490,637 5.2% 487,000 16.0% 62 -4.6% 79 1.3% 30,419,474 0.4%
Condo 403,500 -4.8% 403,500 -4.8% 1 0.0% 30 42.9% 403,500 -4.8%
Co-op 170,000 N/A 170,000 N/A 1 N/A 75 N/A 170,000 N/A