BGC PARTNERS, INC.s1.q4cdn.com › 101769452 › files › doc_financials › 2017 › q4 ›...
55
BGC PARTNERS, INC. Earnings Presentation 4Q 2017 NASDAQ: BGCP
Transcript of BGC PARTNERS, INC.s1.q4cdn.com › 101769452 › files › doc_financials › 2017 › q4 ›...

1
BGC PARTNERS, INC.Earnings Presentation 4Q 2017
NASDAQ: BGCP

2
Discussion of Forward-Looking Statements by BGC Partners
Statements in this document regarding BGC that are not historical facts are “forward-looking statements” that involve risks and uncertainties, which could cause
actual results to differ from those contained in the forward-looking statements. Except as required by law, BGC undertakes no obligation to update any forward-
looking statements. For a discussion of additional risks and uncertainties, which could cause actual results to differ from those contained in the forward-looking
statements, see BGC's Securities and Exchange Commission filings, including, but not limited to, the risk factors set forth in the most recent Form 10-K and any
updates to such risk factors contained in subsequent Forms 10-Q or Forms 8-K.
Note Regarding Financial Tables and Metrics
Excel files with the Company’s quarterly financial results and metrics from the current period dating back to the full year 2008 are accessible in the various
financial results press releases at the “Investor Relations” section of http://www.bgcpartners.com. They are also available directly at ir.bgcpartners.com/news-
releases/news-releases.
Other Items
BGC’s financial results consolidate those of the Company’s publicly traded and majority-owned subsidiary, Newmark Group, Inc. (NASDAQ: NMRK)
("Newmark"). Newmark is a leading commercial real estate advisory firm that completed its initial public offering (“IPO”) on December 19, 2017, and unless
otherwise stated, its results are recorded for the purposes of this document as BGC’s “Real Estate Services” segment. Newmark reports its stand-alone results
separately today.
Newmark operates as “Newmark Knight Frank”, “Newmark”, "NKF“, or derivations of these names. Our discussion of financial results for Real Estate Services
reflects only those businesses owned by us or our affiliates and subsidiaries and does not include the results for Knight Frank or for the independently-owned
offices that use some variation of the Newmark name in their branding or marketing. Berkeley Point Financial LLC, and its wholly owned subsidiary Berkeley
Point Capital LLC may together be referred to as “Berkeley Point” or “BPF”. For its consolidated results, BGC classifies certain Newmark stand-alone expenses
as Corporate Items, and for the periods discussed herein, pro-rates for Adjusted Earnings the income related to Nasdaq earn-out. BGC calculates certain
revenue items slightly differently than Newmark. Newmark’s stand-alone revenues and pre-tax earnings will therefore differ in certain respects from those
recorded in BGC’s Real Estate Services segment. Please see “Reconciliation of BGC Real Estate Segment to Newmark Group, Inc. Stand-Alone for Revenues”,
“Reconciliation of BGC Real Estate Segment to Newmark Group, Inc. Stand-Alone for GAAP Income (Loss) From Operations before Income Taxes” and
“Reconciliation of BGC Real Estate Segment to Newmark Group, Inc. Stand-Alone for Pre-Tax Adjusted Earnings” tables later in this presentation.
For the purposes of this document, all of the Company’s fully electronic businesses in the Financial Services segment may be referred to interchangeably as
“FENICS.” This includes fees from fully electronic brokerage, as well as data, software, and post-trade services (formerly known as “market data and software
solutions”). FENICS results do not include those of Trayport, which are reported separately due to its sale to Intercontinental Exchange, Inc. (“ICE”) for
approximately 2.5 million ICE common shares in December of 2015. Trayport generated gross revenues of approximately $80 million for the trailing twelve
months ended September 30, 2015 and had a pre-tax earnings margin of nearly 45 percent.
Throughout this document the “GSE” is used to refer to a government-sponsored enterprise (“GSE”) such as Fannie Mae or Freddie Mac, “FHA” is used to refer
to the Federal Housing Administration.
© 2018 BGC Partners, Inc. All rights reserved.2
DISCLAIMER

3
On June 28, 2013, BGC sold eSpeed to Nasdaq, Inc. (“Nasdaq”). The purchase consideration consisted of $750 million in cash paid upon
closing, plus an expected payment of up to 14.9 million shares of Nasdaq common stock to be paid ratably over 15 years beginning in 2013,
assuming that Nasdaq, as a whole, generates at least $25 million in gross revenues each of these years. “Payments” may be used
interchangeably with the Nasdaq share “earn-out”.
Beginning with the third quarter of 2017, BGC will record the receipt of payments from Nasdaq as part of other income in Real Estate Services. As a
result, the Nasdaq payment for the third quarter of 2017 was recorded as part of Newmark, while the tables for both segments show pre-tax
Adjusted Earnings excluding the impact of the Nasdaq payments for both periods and as reported. Nasdaq payments and the impact of related
mark-to-market movements and/or hedging are still recorded within Financial Services for all periods prior to the third quarter of 2017. The change
does not affect BGC’s consolidated results for either GAAP or Adjusted Earnings, but only adjusts the presentation of the Company’s segments.
BGC, BGC Trader, GFI, FENICS, FENICS.COM, Capitalab, Swaptioniser, ColleX, Newmark, Grubb & Ellis, ARA, Computerized Facility Integration,
Berkeley Point, Landauer, Lucera, Excess Space, and Excess Space Retail Services, Inc. are trademarks/service marks, and/or registered
trademarks/service marks of BGC Partners, Inc. and/or its affiliates. Knight Frank is a service mark of Knight Frank (Nominees) Limited.
Certain reclassifications may have been made to previously reported amounts to conform to the current presentation and to show results on a
consistent basis across periods. Any such changes would have had no impact on consolidated revenues or earnings for GAAP and would either
leave essentially unchanged or increase pre- and post-tax Adjusted Earnings for the prior periods, all else being equal. Certain numbers in the
tables throughout this document may not sum due to rounding. Rounding may have also impacted the presentation of certain and year-on-year
percentage changes. See the tables towards the end of this document titled “Segment Disclosure” for additional information about both Real Estate
Services and Financial Services, as well as about Corporate Items, which are shown separately from the following segment results.
Adjusted Earnings and Adjusted EBITDA
This presentation should be read in conjunction with BGC’s most recent financial results press release. Unless otherwise stated, throughout this
document BGC refers to its income statement results only on an Adjusted Earnings basis. BGC may also refer to “Adjusted EBITDA”. For a
complete and revised description of these non-GAAP terms and how, when, and why management uses them, see the " Adjusted Earnings Defined“
and “Adjusted EBITDA Defined” pages of this presentation. For both this description and a reconciliation to GAAP, as well as for more information
regarding GAAP results, see BGC’s most recent financial results press release, including the sections called “Adjusted Earnings Defined”,
“Differences Between Consolidated Results for Adjusted Earnings and GAAP”, “Reconciliation of GAAP Income (Loss) to Adjusted Earnings”,
Adjusted EBITDA Defined”, and “Reconciliation of GAAP Income (Loss) to Adjusted EBITDA”. These reconciliations can also be found in the
“Appendix” section of this presentation. On the next page, is a summary of certain GAAP and non-GAAP results for BGC. Segment results on a
GAAP and non-GAAP basis are included towards the end of this presentation.
© 2018 BGC Partners, Inc. All rights reserved.
DISCLAIMER (CONTINUED)

Liquidity Defined
BGC also uses a non-GAAP measure called “liquidity”. The Company considers liquidity to be comprised of the sum of cash and cash
equivalents plus marketable securities that have not been financed, reverse repurchase agreements, and securities owned, less securities
loaned and repurchase agreements. BGC considers this an important metric for determining the amount of cash that is available or that could be
readily available to the Company on short notice.
A discussion of Adjusted Earnings and adjusted EBITDA and reconciliations of these items, as well as liquidity, to GAAP results are found later in
this document, incorporated by reference, and also in our most recent financial results press release and/or are available at
http://ir.bgcpartners.com/Investors/default.aspx.
DISCLAIMER (CONTINUED)
4
Note: Adjusted Earnings were formerly referred to as Distributable Earnings.

5
BGC PARTNERS
GENERAL OVERVIEW
6
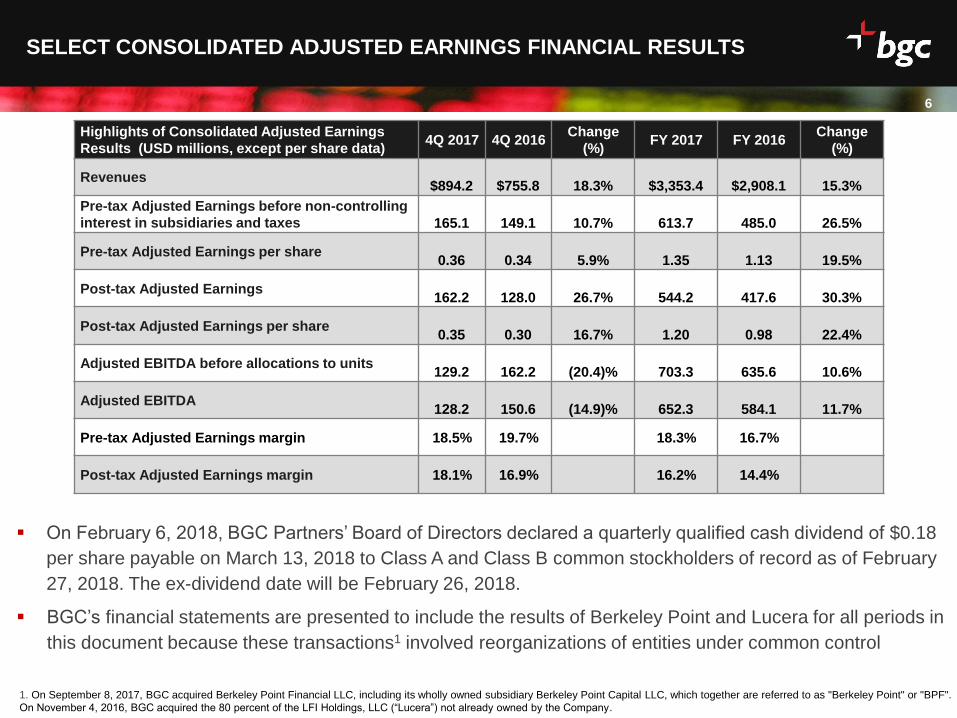
SELECT CONSOLIDATED ADJUSTED EARNINGS FINANCIAL RESULTS
On February 6, 2018, BGC Partners’ Board of Directors declared a quarterly qualified cash dividend of $0.18
per share payable on March 13, 2018 to Class A and Class B common stockholders of record as of February
27, 2018. The ex-dividend date will be February 26, 2018.
BGC’s financial statements are presented to include the results of Berkeley Point and Lucera for all periods in
this document because these transactions1 involved reorganizations of entities under common control
Highlights of Consolidated Adjusted Earnings
Results (USD millions, except per share data)4Q 2017 4Q 2016
Change
(%)FY 2017 FY 2016
Change
(%)
Revenues$894.2 $755.8 18.3% $3,353.4 $2,908.1 15.3%
Pre-tax Adjusted Earnings before non-controlling
interest in subsidiaries and taxes 165.1 149.1 10.7% 613.7 485.0 26.5%
Pre-tax Adjusted Earnings per share0.36 0.34 5.9% 1.35 1.13 19.5%
Post-tax Adjusted Earnings162.2 128.0 26.7% 544.2 417.6 30.3%
Post-tax Adjusted Earnings per share0.35 0.30 16.7% 1.20 0.98 22.4%
Adjusted EBITDA before allocations to units129.2 162.2 (20.4)% 703.3 635.6 10.6%
Adjusted EBITDA128.2 150.6 (14.9)% 652.3 584.1 11.7%
Pre-tax Adjusted Earnings margin 18.5% 19.7% 18.3% 16.7%
Post-tax Adjusted Earnings margin 18.1% 16.9% 16.2% 14.4%
1. On September 8, 2017, BGC acquired Berkeley Point Financial LLC, including its wholly owned subsidiary Berkeley Point Capital LLC, which together are referred to as "Berkeley Point" or "BPF".
On November 4, 2016, BGC acquired the 80 percent of the LFI Holdings, LLC (“Lucera”) not already owned by the Company.

Total Americas revenue up 21% in 4Q 2017 and up 15% in FY17
Europe, Middle East & Africa revenue up 13% in 4Q 2017 and up 17% in FY17
Asia Pacific revenue up 17 % in 4Q 2017 and up 15% in FY17
7
GLOBAL REVENUE BREAKDOWN
Note: Percentages may not sum to 100% due to rounding, less than 1% of Real Estate Services revenues are outside the Americas.
EMEA26%
Americas FS16%
Americas RE51%
APAC7%
EMEA28%
Americas FS17%
Americas RE47%
APAC7%
FY17
FY17 & 4Q17
Global Revenues
4Q17

Rates, 13%
F/X, 9%
Credit, 7%
Energy & Commodities, 6%
Equities, insurance, and
other asset classes, 10%
Data, Software, Post-trade and Other, 2%
Leasing and Other Services, 21%
Real Estate Capital Markets, 14%
Gains from mortgage banking
activities, net, 5%
Management, Servicing Fees and Other, 12%
Corporate, 1%
Financial
Services
47%
Real Estate
Services
52%
Corporate
1%
8
BGC'S 4Q 2017 REVENUE BREAKUP
BGC maintains a highly diverse
revenue base
Wholesale Financial Services
Brokerage revenues and
earnings typically seasonally
strongest in 1st quarter,
weakest in 4th quarter
Commercial Real Estate
Brokerage revenues typically
seasonally strongest in 4th
quarter, weakest in 1st quarter
BGC’s Businesses at a Glance
Note: Percentages may not sum to 100% due to rounding.

Rates, 15%
F/X, 10%
Credit, 8%
Energy & Commodities, 6%
Equities, insurance, and
other asset classes, 10%
Data, Software, Post-trade and Other, 2%
Leasing and Other Services, 18%
Real Estate Capital Markets, 12%
Gains from mortgage banking
activities, net, 6%
Management, Servicing Fees and Other, 11%
Corporate, 1%
Financial
Services
51%
Real Estate
Services
48%
Corporate
1%
9
BGC'S FY 2017 REVENUE BREAKUP
BGC maintains a highly diverse
revenue base
Wholesale Financial Services
Brokerage revenues and
earnings typically seasonally
strongest in 1st quarter,
weakest in 4th quarter
Commercial Real Estate
Brokerage revenues typically
seasonally strongest in 4th
quarter, weakest in 1st quarter
BGC’s Businesses at a Glance
Note: Percentages may not sum to 100% due to rounding.

10
Financial Services average revenue per front office employee was $676,000 in FY 2017, up 7%
– $168,000 in 4Q 2017, up 12%
Real Estate Services average revenue front office employee was $806,000 in FY 2017, up 14%
– $230,000 in 4Q 2017, up 16%
BGC’S FRONT OFFICE HEADCOUNT & PRODUCTIVITY
FRONT OFFICE HEADCOUNT
Note: The Real Estate Services productivity figures are based on revenues from “leasing and other”, “real estate capital markets”, and “gains from mortgage banking activities, net”. The productivity
figures exclude both revenues and staff in management services and “other.” The Financial Services figures in the above table include segment revenues from total brokerage revenues, data,
software and post-trade. The average revenues for all producers are approximate and based on the total revenues divided by the weighted-average number of producers for the period.
FRONT OFFICE PRODUCTIVITY
169 191
660725
4Q 2016 4Q 2017 FY 2016 FY 2017
(period-average, USD Thousands)(as of period-end)
2,491 2,561 2,539 2,515 2,491
1,498 1,495 1,494 1,532 1,554
4Q 2016 1Q 2017 2Q 2017 3Q 2017 4Q 2017
Financial Brokerage Real Estate
4,0333,989 4,056 4,047 4,045

11
ADJUSTED EARNINGS EXPENSE & PRE-TAX MARGIN TRENDS
Pre-tax margins were 18.5% in 4Q 2017 vs. 19.7% in 4Q 2016
Pre-tax margins were 18.3% in FY 2017 vs. 16.7% in FY 2016
58.6% 57.4% 56.0% 57.3%
40%
50%
60%
70%
80%
90%
100%
$0
$500
$1,000
$1,500
$2,000
FY 2016 FY 2017 4Q 2016 4Q 2017
(US
D m
illi
on
s)
Compensation and Employee Benefits Compensation and Employee Benefits as % of Total Revenue
Note: % of revenue numbers do not sum primarily due to the large amount of other income related to the Nasdaq earn-out.
16.7%
18.3% 19.7% 18.5%
23.6% 23.6% 22.4%24.3%
0%
7%
14%
21%
28%
35%
5%
9%
13%
17%
21%
25%
FY 2016 FY 2017 4Q 2016 4Q 2017
Pre-tax Margin Non-compensation Expense as a % of Total Revenue

12
Overview
FINANCIAL SERVICES
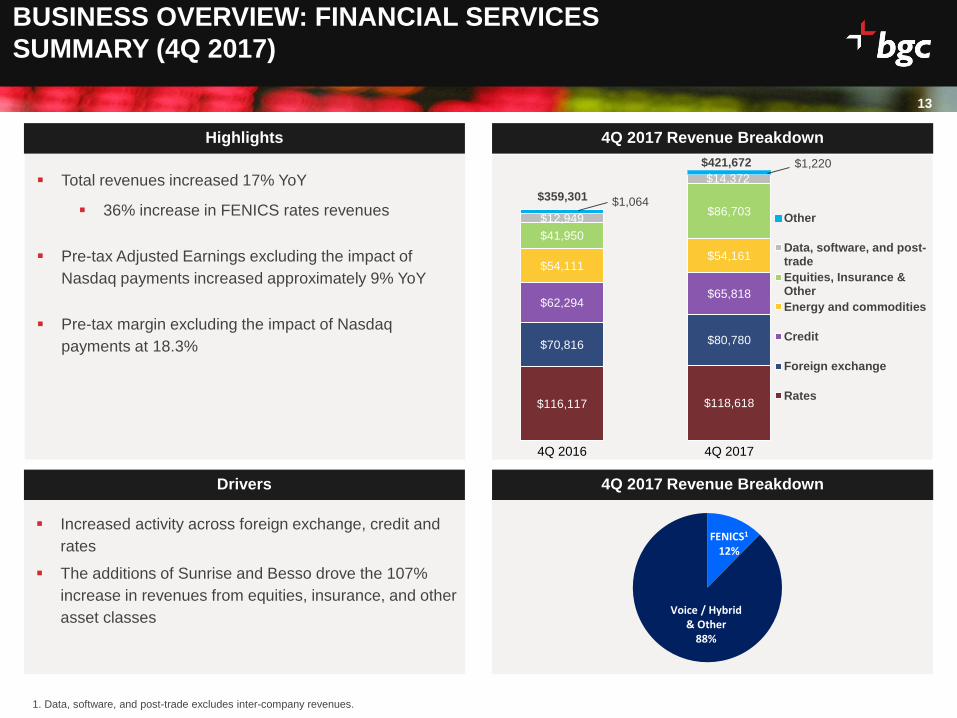
BUSINESS OVERVIEW: FINANCIAL SERVICES
SUMMARY (4Q 2017)
$116,117 $118,618
$70,816 $80,780
$62,294$65,818
$54,111$54,161
$41,950
$86,703$12,949
$14,372
4Q 2016 4Q 2017
Other
Data, software, and post-trade
Equities, Insurance &Other
Energy and commodities
Credit
Foreign exchange
Rates
$1,064
Total revenues increased 17% YoY
36% increase in FENICS rates revenues
Pre-tax Adjusted Earnings excluding the impact of
Nasdaq payments increased approximately 9% YoY
Pre-tax margin excluding the impact of Nasdaq
payments at 18.3%
13
Drivers
Highlights
Increased activity across foreign exchange, credit and
rates
The additions of Sunrise and Besso drove the 107%
increase in revenues from equities, insurance, and other
asset classes
4Q 2017 Revenue Breakdown
4Q 2017 Revenue Breakdown
$359,301
$421,672 $1,220
1. Data, software, and post-trade excludes inter-company revenues.
FENICS1
12%
Voice / Hybrid & Other
88%

14
FENICS Net Revenue Growth1 4Q 2017 FENICS Breakdown2
BUSINESS OVERVIEW: FENICS
FENICS brokerage revenues increased 8% year-over-year in 4Q 2017; overall FENICS revenues up 9%3
FY 2017 FENICS revenues comprised 12% of total Financial Services revenues versus approximately 3% in
2010 (net of inter-company eliminations)
Fully Electronic revenues have grown at a CAGR of 24% between FY 2010 and FY 2017
Rates25%
Credit24%
F/X11%
Data, software and
post trade (inter-
company)20%
Data, software and
post trade21%
1. Excludes inter-company revenues, revenues related to eSpeed (sold in June 2013), and revenues related to Trayport (sold in December 2015). Results shown by segment or business exclude
revenues, earnings and/or losses associated with Corporate items.
2. Excludes a de minimis amount of revenue related to equities and other products.
3. Includes inter-company revenues.
(USD $000s)
0%
4%
8%
12%
16%
-
60,000
120,000
180,000
240,000
FY10 FY11 FY12 FY13 FY14 FY15 FY16 FY17
Fenics Revenue FENICS as % of Total Revenue

154,323 168,294
34,975 37,884
54,309 54,557
12,949
51,978 54,015
12,306
-
50,000
100,000
150,000
200,000
250,000
300,000
FY 2016 FY 2017 4Q16 4Q17
Electronic Brokerage Data, software and post-trade Data, software and post-trade (inter-company)
15
BGC’S FENICS (FULLY ELECTRONIC) REVENUE GROWTH
15
FENICS (Fully Electronic) Revenues1
4Q 2017 FENICS Electronic Brokerage revenues up 8% to $37.9 million
Data, software and post-trade revenues up 11% to $14.4 million
New products and services expected to drive growth
(USD 000s)
1. “FENICS” results include data, software, and post-trade (inter-company) revenues of $13.5 million and $12.3 million for 4Q17 and 4Q16, respectively, and $54.0 million and $52.0 for FY2017
and FY2016, respectively, which are eliminated in BGC’s consolidated financial results. Data, software, and post-trade revenues, net of inter-company eliminations were $14.4 million, $12.9
million, $54.6 million and $54.3 million in 4Q17, 4Q16, FY2017, and FY2016 respectively. Results shown by segment or business exclude revenues, earnings and/or losses associated with
Corporate items.
$60,230 $65,770
$276,866$260,610
13,514
14,372

3%
5%7%
4%4%
14%
24%
9%
15%
10%
1317
13
42
70 69
28
167
0
20
40
60
80
100
120
140
160
180
0%
5%
10%
15%
20%
25%
30%
Rates Credit F/X Rates,
Credit and
FX
Total
Electronic
Brokerage
Revenues
**
Rates Credit F/X Total
(Rates,
Credit and
F/X)
FY 2010* FY 2017 $ MN
Electronic Brokerage Revenues (% of Brokerage Revenues)
Electronic Brokerage Revenues ($ MN)
CONVERSION TO ELECTRONIC BROKERAGE
BY ASSET CLASS
16
Electronic Brokerage Revenues (% of Brokerage Revenues and in $ MN)
* 2010 excludes eSpeed
** total electronic brokerage revenues includes de minimis amounts of revenue from Energy & Commodities and Equities, insurance, and other asset classes

FENICS HIGHLIGHTS (2017)
17
Brokerage:
Official 1Q 2017 launch of FENICS Trading Solutions (TS) – a middleware solution automating the price
making and distribution of FX options liquidity to third party platforms, multi-dealer venues, and
exchanges.
Five Industry Awards including:
FENICS TS – Technology Development of the Year (Asia Risk Magazine)
FENICS Pro – Best Vendor for FXO Pricing & Risk Management (FX Week Magazine)
Data, Software and Post-trade:
Capitalab becomes Compression Provider (ACSP) at LCH – allowing the business to commence
compression of cleared IRS within the clearing house
Capitalab launches combined compression cycles of cleared interest rate swaps and interest rate options
– a market first.
Capitalab introduces its Initial Margin Optimisation service for Rates.
Milestones

18
Overview
NEWMARK

19
Highlights
BUSINESS OVERVIEW: NEWMARK
Newmark stand-alone revenues increased by 18% YoY for FY 2017 (up 19% YoY in 4Q2017)
Pre-tax Adjusted Earnings increased by 74% for FY 2017 (up 23% in 4Q 2017)
See Newmark’s stand-alone financial results press release and Powerpoint presentation for more details
Details regarding Newmark Group, Inc.’s stand-alone results are contained in its financial results press release for the fourth quarter and full year 2017 (accessible at http://ir.bgcpartners.com or http://ir.ngkf.com)
Results shown by segment or business exclude revenues, earnings and/or losses associated with Corporate items. Newmark’s stand-alone revenues and pre-tax earnings will therefore differ in certain respects from those recorded in BGC’s Real Estate Services segment. Please see tables later in this presentation.1
1. Please see tables “Reconciliation of BGC Real Estate Segment to Newmark Group, Inc. Stand-Alone for Revenues”, “Reconciliation of BGC Real Estate Segment to Newmark Group, Inc.
Stand-Alone for GAAP Income (Loss) From Operations before Income Taxes” and “Reconciliation of BGC Real Estate Segment to Newmark Group, Inc. Stand-Alone for Pre-Tax Adjusted
Earnings” later in this presentation.

20
NEWMARK IPO
1. Source: Final prospectus filed by Newmark with the SEC on December 15, 2017
Newmark’s IPO of 23 million shares of Class A common stock at a price of $14.00 per share
closed in December 2017 (NASDAQ: NMRK)
Newmark's public stockholders owned approximately 9.8% of Newmark’s 234.2 million fully
diluted shares outstanding as of December 31, 2017
BGC currently expects to pursue a distribution (or “spin-off”) to its common stockholders of all
the Class A shares and Class B shares of Newmark common stock that it then owns in a
manner intended to qualify as generally tax-free for U.S. federal income tax purposes
If the distribution were to have occurred immediately after the NMRK IPO, then each
Class A common share of BGCP would have received approximately 0.45 Class A
common share of NMRK (a holder of 10,000 Class A BGCP common shares would
receive ~ 4,545 Class A NMRK common shares)1
The distribution is subject to a number of conditions, and BGC may determine not to
proceed with the distribution if the BGC board of directors determines, in its sole
discretion, that the distribution is not in the best interest of the Company and its
stockholders

21
BGC PARTNERS
OUTLOOK

22
OUTLOOK COMPARISON
Outlook Compared with a Year Ago Results
BGC anticipates first quarter 2018 consolidated revenues of between $870 million and $920 million, or 11 to 17 percent higher compared to $783 million for the first quarter of 2017.
BGC expects consolidated pre-tax Adjusted Earnings before noncontrolling interest in subsidiaries and taxes to be in the range of $140 million and $160 million, or 18 to 34 percent higher compared to $119 million in the year ago period, which excludes the Nasdaq earn-out.
BGC anticipates its consolidated Adjusted Earnings tax rate to be in the range of approximately 10 percent and 11 percent for the first quarter of 2018, compared with 14 percent for the first quarter of 2017.
BGC expects Newmark Group, Inc.’s stand-alone tax rate to be in the range of approximately 12 percent and 14 percent.

GAAP FinancialsGAAP FINANCIAL RESULTS
24
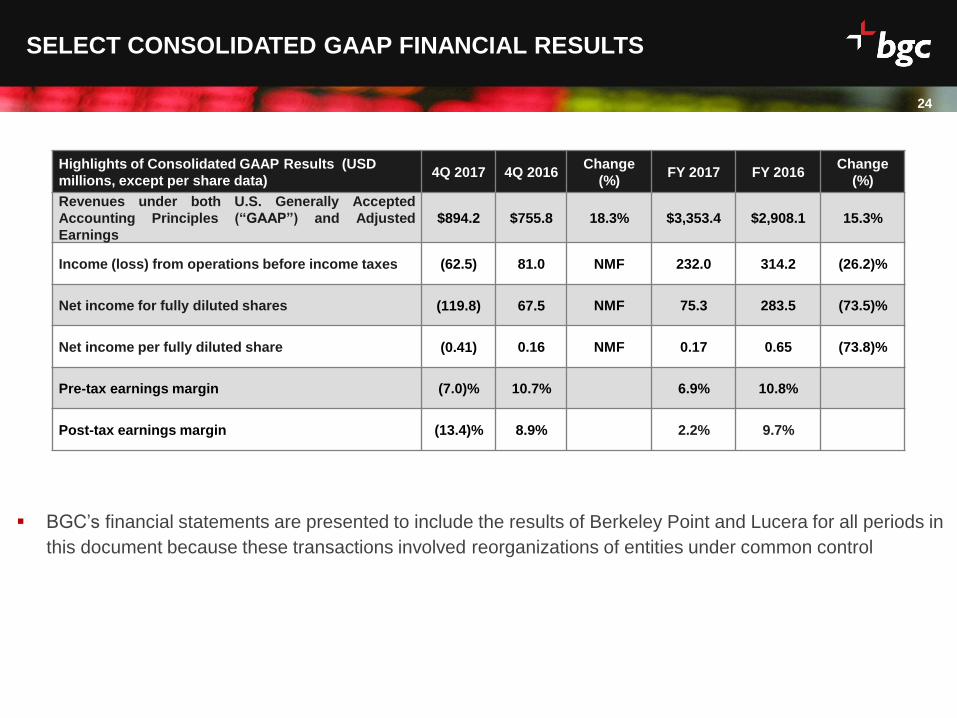
SELECT CONSOLIDATED GAAP FINANCIAL RESULTS
Highlights of Consolidated GAAP Results (USD
millions, except per share data)4Q 2017 4Q 2016
Change
(%)FY 2017 FY 2016
Change
(%)
Revenues under both U.S. Generally Accepted
Accounting Principles (“GAAP”) and Adjusted
Earnings
$894.2 $755.8 18.3% $3,353.4 $2,908.1 15.3%
Income (loss) from operations before income taxes (62.5) 81.0 NMF 232.0 314.2 (26.2)%
Net income for fully diluted shares (119.8) 67.5 NMF 75.3 283.5 (73.5)%
Net income per fully diluted share (0.41) 0.16 NMF 0.17 0.65 (73.8)%
Pre-tax earnings margin (7.0)% 10.7% 6.9% 10.8%
Post-tax earnings margin (13.4)% 8.9% 2.2% 9.7%
BGC’s financial statements are presented to include the results of Berkeley Point and Lucera for all periods in
this document because these transactions involved reorganizations of entities under common control
25
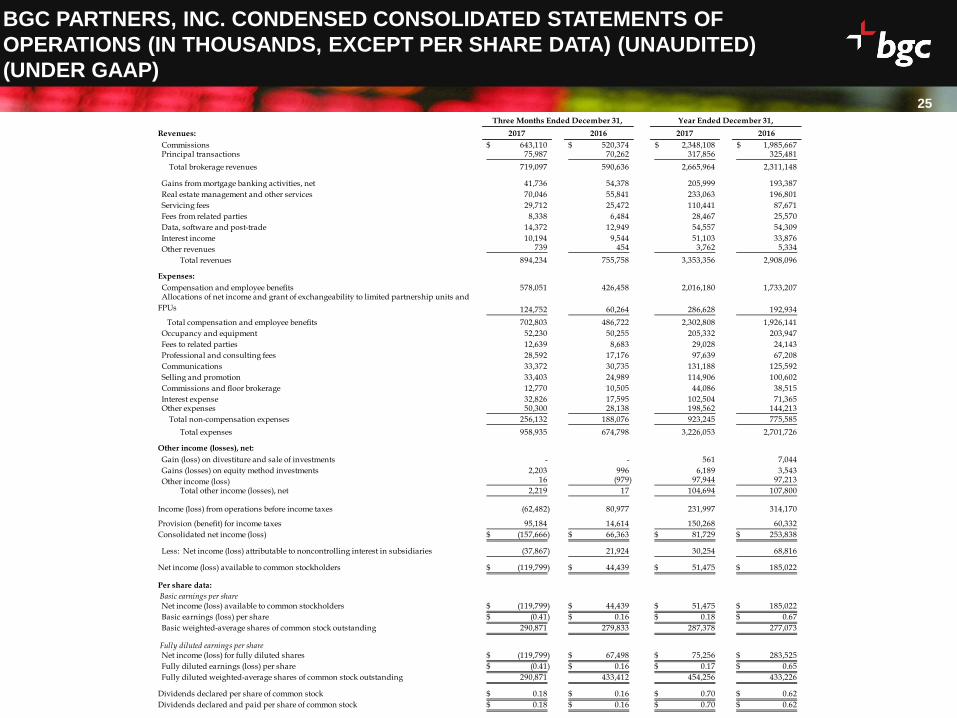
BGC PARTNERS, INC. CONDENSED CONSOLIDATED STATEMENTS OF
OPERATIONS (IN THOUSANDS, EXCEPT PER SHARE DATA) (UNAUDITED)
(UNDER GAAP)
Revenues: 2017 2016 2017 2016
Commissions 643,110$ 520,374$ 2,348,108$ 1,985,667$ Principal transactions 75,987 70,262 317,856 325,481
Total brokerage revenues 719,097 590,636 2,665,964 2,311,148
Gains from mortgage banking activities, net 41,736 54,378 205,999 193,387
Real estate management and other services 70,046 55,841 233,063 196,801
Servicing fees 29,712 25,472 110,441 87,671
Fees from related parties 8,338 6,484 28,467 25,570
Data, software and post-trade 14,372 12,949 54,557 54,309
Interest income 10,194 9,544 51,103 33,876
Other revenues 739 454 3,762 5,334
Total revenues 894,234 755,758 3,353,356 2,908,096
Expenses:
Compensation and employee benefits 578,051 426,458 2,016,180 1,733,207 Allocations of net income and grant of exchangeability to limited partnership units and
FPUs 124,752 60,264 286,628 192,934
Total compensation and employee benefits 702,803 486,722 2,302,808 1,926,141
Occupancy and equipment 52,230 50,255 205,332 203,947
Fees to related parties 12,639 8,683 29,028 24,143
Professional and consulting fees 28,592 17,176 97,639 67,208
Communications 33,372 30,735 131,188 125,592
Selling and promotion 33,403 24,989 114,906 100,602
Commissions and floor brokerage 12,770 10,505 44,086 38,515
Interest expense 32,826 17,595 102,504 71,365 Other expenses 50,300 28,138 198,562 144,213
Total non-compensation expenses 256,132 188,076 923,245 775,585
Total expenses 958,935 674,798 3,226,053 2,701,726
Other income (losses), net:
Gain (loss) on divestiture and sale of investments - - 561 7,044
Gains (losses) on equity method investments 2,203 996 6,189 3,543
Other income (loss) 16 (979) 97,944 97,213
Total other income (losses), net 2,219 17 104,694 107,800
Income (loss) from operations before income taxes (62,482) 80,977 231,997 314,170
Provision (benefit) for income taxes 95,184 14,614 150,268 60,332
Consolidated net income (loss) (157,666)$ 66,363$ 81,729$ 253,838$
Less: Net income (loss) attributable to noncontrolling interest in subsidiaries (37,867) 21,924 30,254 68,816
Net income (loss) available to common stockholders (119,799)$ 44,439$ 51,475$ 185,022$
Per share data:
Basic earnings per share Net income (loss) available to common stockholders (119,799)$ 44,439$ 51,475$ 185,022$
Basic earnings (loss) per share (0.41)$ 0.16$ 0.18$ 0.67$
Basic weighted-average shares of common stock outstanding 290,871 279,833 287,378 277,073
Fully diluted earnings per share Net income (loss) for fully diluted shares (119,799)$ 67,498$ 75,256$ 283,525$
Fully diluted earnings (loss) per share (0.41)$ 0.16$ 0.17$ 0.65$
Fully diluted weighted-average shares of common stock outstanding 290,871 433,412 454,256 433,226
Dividends declared per share of common stock 0.18$ 0.16$ 0.70$ 0.62$
Dividends declared and paid per share of common stock 0.18$ 0.16$ 0.70$ 0.62$
Three Months Ended December 31, Year Ended December 31,

26
BGC PARTNERS, INC. CONDENSED CONSOLIDATED STATEMENTS OF FINANCIAL
CONDITION (IN THOUSANDS, EXCEPT PER SHARE DATA) (UNAUDITED)
(UNDER GAAP)
December 31, December 31,
2017 2016
Assets
Cash and cash equivalents 634,333$ 535,613$
Cash segregated under regulatory requirements 162,457 57,822
Reverse repurchase agreements - 54,659
Securities owned 33,007 35,357
Marketable securities 208,176 164,820
Loans held for sale, at fair value 362,635 1,071,836
Receivables from broker-dealers, clearing organizations, customers and related broker-dealers 772,820 517,481
Mortgage servicing rights, net 392,626 339,816
Accrued commissions and other receivables, net 620,039 385,810
Loans, forgivable loans and other receivables from employees and partners, net 335,734 269,773
Fixed assets, net 189,347 167,239
Investments 141,788 33,439
Goodwill 945,582 863,881
Other intangible assets, net 311,021 253,163
Receivables from related parties 3,739 6,956
Other assets 343,826 289,921
Total assets 5,457,130$ 5,047,586$
Liabilities, Redeemable Partnership Interest, and Equity
Short-term borrowings 6,046$ -$
Securities loaned 202,343 -
Warehouse notes payable 360,440 257,969
Accrued compensation 432,733 383,407
Payables to broker-dealers, clearing organizations, customers and related broker-dealers 634,998 384,822
Payables to related parties 40,988 30,475
Accounts payable, accrued and other liabilities 942,917 649,029
Long-term debt and collateralized borrowings 1,650,509 965,767
Notes payable to related parties - 690,000
Total liabilities 4,270,974 3,361,469
Redeemable partnership interest 46,415 52,577
Equity
Stockholders' equity:
Class A common stock, par value $0.01 per share; 750,000 shares authorized; 306,218 and 292,549 shares
issued at December 31, 2017 and December 31, 2016, respectively; and 256,969 and 244,870 shares
outstanding at December 31, 2017 and December 31, 2016, respectively 3,063 2,925
Class B common stock, par value $0.01 per share; 150,000 shares authorized; 34,848 shares issued and
outstanding at December 31, 2017 and December 31, 2016, convertible into Class A common stock 348 348
Additional paid-in capital 1,763,371 1,662,615
Contingent Class A common stock 40,472 42,472
Treasury stock, at cost: 49,249 and 47,679 shares of Class A common stock at December 31, 2017 (303,873) (288,743)
and December 31, 2016, respectively
Retained deficit (859,009) (212,858)
Accumulated other comprehensive income (loss) (10,486) (23,199)
Total stockholders' equity 633,886 1,183,560
Noncontrolling interest in subsidiaries 505,855 449,980
Total equity 1,139,741 1,633,540
Total liabilities, redeemable partnership interest and equity 5,457,130$ 5,047,586$

APPENDIX

Voice/Hybrid/Other Pre-tax AE (as reported) includes $3.1 million, $17.2 million, $49.2 million, and $79.6
million related to Nasdaq earn-out income and associated mark-to-market movements and/or hedging for
4Q17, 4Q16, FY 2017, and FY 2016, respectively
Real Estate Pre-tax AE (as reported) includes $19.0 million, and $38.3 million related to related to Nasdaq
earn-out income and associated mark-to-market movements and/or hedging for 4Q17 and FY 2017,
respectively
28
Note: “FENICS” results include data, software, and post-trade (inter-company) revenues of $13.5 million and $12.3 million for 4Q17 and 4Q16, respectively, and $54.0 million and $52.0 for FY 2017
and FY 2016, respectively, which are eliminated in BGC’s consolidated financial results. Results shown by segment or business exclude revenues, earnings and/or losses associated with Corporate
items. Numbers may not foot and/or cross foot due to rounding.
REAL ESTATE SEGMENT, VOICE/HYBRID BROKERAGE AND
FENICS DETAILS
(USD millions)
FENICS
Voice /
Hybrid /
Other
Real
Estate Corporate Total FENICS
Voice /
Hybrid /
Other
Real
Estate Corporate Total
Revenue $65.8 $355.9 $462.0 $10.5 $894.2 Revenue $276.9 $1,435.0 $1,601.4 $40.1 $3,353.4
Pre-Tax AE $26.4 $50.6 $108.8 ($20.7) $165.1 Pre-Tax AE $116.1 $273.0 $294.3 ($69.7) $613.7
Pre-tax AE Margin 40.1% 14.2% 23.6% NMF 18.5% Pre-tax AE Margin 41.9% 19.0% 18.4% NMF 18.3%
FENICS
Voice /
Hybrid /
Other
Real
Estate Corporate Total FENICS
Voice /
Hybrid /
Other
Real
Estate Corporate Total
Revenue $60.2 $299.1 $388.6 $7.9 $755.8 Revenue $260.6 $1,262.6 $1,353.7 $31.1 $2,908.1
Pre-Tax AE $24.1 $63.6 $70.2 ($8.8) $149.1 Pre-Tax AE $109.2 $242.6 $192.7 ($59.4) $485.0
Pre-tax AE Margin 40.0% 21.3% 18.1% NMF 19.7% Pre-tax AE Margin 41.9% 19.2% 14.2% NMF 16.7%
FENICS
Voice /
Hybrid /
Other
Real
Estate Corporate Total FENICS
Voice /
Hybrid /
Other
Real
Estate Corporate Total
Revenue 9.2% 19.0% 18.9% 34.0% 18.3% Revenue 6.2% 13.6% 18.3% 28.8% 15.3%
Pre-Tax AE 9.6% -20.5% 55.0% NMF 10.7% Pre-Tax AE 6.3% 12.5% 52.7% NMF 26.5%
Q4 2017
Q4 2016
FY 2017
FY 2016
Yr/Yr Change Yr/Yr Change

OUR RATES BUSINESS CONTINUES TO DO WELL
DESPITE INCREASES IN G-4 BALANCE SHEETS
29
G-4* Balance Sheet as % of GDP YoY Change (pp) in G-4 Balance Sheet as % of GDP
1
Source: Bloomberg Source: Bloomberg
Despite the end of quantitative easing in the US, G-4 central bank balance sheets continue
to grow
Our rates business, which includes non-US markets, continues to do well even as G-4
central bank balance sheets have grown
0%
5%
10%
15%
20%
25%
30%
35%
40%
Jan-06 Jan-07 Jan-08 Jan-09 Jan-10 Jan-11 Jan-12 Jan-13 Jan-14 Jan-15 Jan-16 Jan-17
-3
-2
-1
0
1
2
3
4
5
6
7
8
Jan-07 Jan-08 Jan-09 Jan-10 Jan-11 Jan-12 Jan-13 Jan-14 Jan-15 Jan-16 Jan-17
percentage points
Note: The G-4 are US, Europe, Japan and the UK.

30
BGC’S ECONOMIC OWNERSHIP AS OF DECEMBER 31, 2017
1. Class A shares owned by employees only includes restricted shares. Any Class A share owned by an employee without restriction is included in the “Class A owned by Public”
2. In conjunction with the proposed spin-off of Newmark, the employee limited partners partnership units of both Newmark and BGC. Over time, virtually all of the partners of
Newmark are expected to only own units and/or shares of Newmark and virtually all of the partners of BGC are expected to only own units and/or shares of BGC. Going forward,
partners of BGC will be compensated with BGC partnership units and partners of Newmark will be compensated with Newmark partnership units.
3. These primarily represent contingent shares and/or units for which all necessary conditions have been satisfied except for the passage of time
BGC Partners, Inc. Detailed Ownership
(as of December 31, 2017)
Fully-diluted
Shares (MN)
Economic
Ownership (%)
Class A owned by Public 223.9 48%
Class A owned by executives, board members and employees1 18.4 4%
Limited partnership units 2 115.3 25%
Other owned by employees3 7.9 2%
Class A owned by Cantor 14.7 3%
Class B owned by Cantor 34.8 7%
Cantor partnership units owned by Cantor 36.6 8%
Cantor distribution rights 15.8 3%
Total 467.4 100%
BGC Partners, Inc. Economic Ownership
(as of December 31, 2017)
Fully-diluted
Shares (MN)
Economic
Ownership (%)
Public 223.9 48%
Employees 141.6 30%
Cantor 101.9 22%

31
STRONGLY CAPITALIZED; INVESTMENT GRADE CREDIT PROFILE
1. As of December 31, 2017, $202.3 million of Marketable securities on our balance sheet were lent out in Securities Loaned transactions and therefore are not included in Total Liquidity.
2. Callable at par beginning June 26, 2017.
3. Does not include the approximately $746 million in NDAQ stock (at February 8, 2018 closing prices) expected to be received over time.
4. Interest expense excludes $20.3 million of operating interest on Warehouse notes payable.
5. Defined as "redeemable partnership interest," "noncontrolling interest in subsidiaries," and "total stockholders' equity".
($ in '000s)
BGC Partners, Inc. 12/31/2017
Cash and Cash Equivalents $634,333
Securities Owned 33,007
Marketable Securities (net) 5,833
Total Liquidity1
$673,173
BGC Partners, Inc. and Subsidiaries Issuer Maturity 12/31/2017
8.375% Senior Notes GFI 7/19/2018 $242,474
Unsecured converted term loan credit agreement BGC 9/8/2019 $397,310
Unsecured term loan credit agreement BGC 9/8/2019 $270,710
5.375% Senior Notes BGC 12/9/2019 298,064
5.125% Senior Notes BGC 5/27/2021 296,996
Collateralized borrowings BGC 5/31/2021 35,559
8.125% Senior Notes² BGC 6/15/2042 109,396
Total Long-term Debt $1,650,509
12/31/2017
Adjusted EBITDA $652,257
Leverage Ratio: Total Long-term Debt / Adjusted EBITDA 3
2.5x
Net Leverage Ratio: Net Long-term Debt / Adjusted EBITDA 1.5x
Adjusted EBITDA / Interest Expense4
7.9x
Total capital5
1,186,156
BGC Partners, Inc. (Adj. EBITDA and Ratios are 2017 YTD)

4Q 2017 INDUSTRY VOLUMES MIXED; VOLATILITY DOWN
4Q 2017: Yr/Yr Change in Capital Markets Activity 4Q 2017: Yr/Yr Change in Average Daily Volatility
Volumes were mixed compared to 4Q 2016
Volatility measures were generally down compared to 4Q 2016; increased volatility often signals
increased trading activity, however severe bouts of volatility often results in lower trading activity
32
Source: Bloomberg, Eurex, CME, ICE, Trax, ISDA, and Thomson Source: Bloomberg
(ADV excl. Eurex Equity Derivatives)
10%
7%
7%
5%
1%
(2%)
(4%)
(4%)
(6%)
(7%)
(18%)
(34%)
(40%) (30%) (20%) (10%) 0% 10% 20% 30% 40%
Thomson Reuters FX Spot
FX Futures (CME)
Energy & Commodities (CME)
U.S. Corp. Bonds (Primary Dealer)
Interest Rate Futures (ICE)
Energy (ICE)
U.S. Treasuries (Primary Dealer)
Interest Rate Futures (CME)
CDS Notional Turnover (ISDA)
Eurex Equity Derivatives
Energy & Commodities Futures (FIA)
Equity Indices (ICE)
16%
11%
(8%)
(9%)
(12%)
(20%) (10%) 0% 10% 20%
U.S. Equities (VIX)
European Equities (V2X)
Commodity Volatility Index (BofAML)
FX (CVIX)
U.S. Rates (MOVE)
Note: Global futures volumes reported to FIA for agriculture, energy, non-precious metals, and precious metals.

33
VOLUMES GENERALLY MIXED; VOLATILITY UP FROM
A YEAR AGO
33
1Q 2018TD Change in Capital Markets Activity 1Q 2018TD Change in Average Daily Volatility
Source: Bloomberg and Goldman Sachs Investment Research
1Q 2018 to-date industry volumes generally down across most of the asset classes we
broker
Industry volumes typically correlate to volumes in our Financial Services business
Volatility is up across some asset classes we broker; increased volatility often signals
higher trading activity, however severe bouts of volatility often result in lower trading activity
Source: Bloomberg
15%
7%
5%
(6%)
(62%)
(75%) (60%) (45%) (30%) (15%) 0% 15%
U.S. Rates (MOVE)
FX (CVIX)
U.S. Equities (VIX)
European Equities (V2X)
Commodity Volatility Index (BofAML)
28%
17%
7%
6%
4%
0%
(2%)
(4%)
(5%)
(25%) (15%) (5%) 5% 15% 25% 35%
U.S. Agency (Primary Dealer)
European Equities
FX Futures (CME)
Interest Rate Futures (CME)
U.S Equities
U.S. Corp. Bonds (Primary Dealer)
Energy (ICE)
U.S. Treasuries (Primary Dealer)
Investment Grade Credit
(1/1/2018 – 1/25/2018) (1/1/2018 – 1/25/2018)

34
AVERAGE EXCHANGE RATES
Source: Bloomberg
34
4Q 2017 4Q 2016January 1 – January 25,
2018
January 1 – January 25,
2017
US Dollar 1 1 1 1
British Pound 1.328 1.243 1.374 1.231
Euro 1.178 1.079 1.215 1.061
Hong Kong Dollar 0.128 0.129 0.128 0.129
Singapore Dollar 0.739 0.709 0.755 0.699
Japanese Yen 112.895 109.495 111.407 115.115
Note: The Japanese Yen average exchange rate is inverted relative to the other average exchange rates shown here

35
DIFFERENCES BETWEEN CONSOLIDATED RESULTS FOR ADJUSTED
EARNINGS AND GAAP
35
Differences between Other income (losses), net, for Adjusted Earnings and GAAP
In the fourth quarters of 2017 and 2016, gains of $2.2 million and $1.0 million, respectively, related to BGC’s investments accounted for under the equity
method, were included as part of “Other income (losses), net” under GAAP but were excluded for Adjusted Earnings. For the full years 2017 and 2016, these
amounts were gains of $6.2 million and $3.5 million, respectively.
Items related to the Nasdaq payment are pro-rated over four quarters as “Other income” for Adjusted Earnings, but recognized as incurred under GAAP.
Realized and unrealized mark to market movements and/or hedging related to shares of Intercontinental Exchange, Inc. (“ICE”) received in relation to the
Trayport transaction are treated in a similar manner.
Under GAAP, gains (losses) of $(1.8) million and $(0.8) million related to mark-to-market movements on our hedging of Nasdaq shares were recognized as
part of “Other income (losses), net”, in the fourth quarters of 2017 and 2016, respectively. For the full years 2017 and 2016, GAAP amounts related to the
Nasdaq payment and associated mark-to-market movements and/or hedging recognized were $96.1 million and $78.7 million, respectively. In the fourth
quarters of 2017 and 2016, BGC recorded other income for Adjusted Earnings related to the Nasdaq payment and associated mark-to-market movements
and/or hedging of $22.1 million and $17.2 million, respectively. For the full years 2017 and 2016, these amounts for Adjusted Earnings were $87.5 million and
$79.6 million, respectively.
In the fourth quarters of 2017 and 2016, gains (losses) of $0.4 million and $2.0 million, respectively, related to the net realized and unrealized gain on the ICE
shares were included in GAAP “Other income (losses), net”. These amounts were $4.0 million and $6.8 million, respectively, for the full years 2017 and 2016.
For Adjusted Earnings, net gains (losses) of $0.3 million and $1.6 million related to the ICE shares were recorded in the fourth quarters of 2017 and 2016,
respectively as “Other income”. The corresponding adjusted items were $6.7 million and $14.3 million, respectively, for the full years 2017 and 2016.
For the full year 2016, a gain of $18.3 million related to an adjustment of future earn-out payments that will no longer be required and a $7.1 million gain
related to the sale of a non-core Financial Services asset were included as part of “Other income (losses), net” under GAAP but were excluded for Adjusted
Earnings. There were no similar items in the current year period.
Adjusted Earnings calculations for the fourth quarters of 2017 and 2016 also excluded additional net gains (losses) of $(0.9) million and $(2.3) million,
respectively as part of “(Gains) and charges with respect to acquisitions, dispositions and/or resolutions of litigation, and other non-cash, non-dilutive items,
net”. The corresponding adjusted items were $(4.8) million and $(3.7) million, respectively, for the full years 2017 and 2016.
Impact of OMSRs and MSRs for Adjusted Earnings and GAAP
GAAP income from operations before income taxes for the fourth quarter of 2017 includes a $3.3 million non-cash gain attributable to originated mortgage
servicing rights (“OMSRs”) net of amortization of mortgage servicing rights (“MSRs”). In the year earlier period, the gain attributable to OMSRs net of
amortization of MSRs was $23.6 million. For the full years 2017 and 2016, the gain attributable to OMSRs net of amortization of MSRs was $48.5 million and
$66.2 million, respectively.

DIFFERENCES BETWEEN CONSOLIDATED RESULTS FOR ADJUSTED
EARNINGS AND GAAP (CONTINUED)
Differences between Compensation Expenses for Adjusted Earnings and GAAP
In the fourth quarter of 2017 and full year 2017, the difference between compensation expenses as calculated for GAAP and Adjusted Earnings included
non-cash, non-dilutive net charges related to the $123.7 million and $235.6 million, respectively, in grants of exchangeability; $1.0 million and $51.0 million,
respectively, in allocation of net income to limited partnership units and FPUs; charges related to additional reserves on employee loans of $23.3 million and
$42.9 million respectively; and charges related to equity awards of $40.3 million, respectively.
In the fourth quarter of 2016 and full year 2016, the difference between compensation expenses as calculated for GAAP and Adjusted Earnings included
non-cash, non-dilutive net charges related to $48.7 million and $141.4 million, respectively, in grants of exchangeability; $11.6 million and $51.5 million,
respectively, in allocation of net income to limited partnership units and FPUs; and charges related to additional reserves on employee loans of $0.8 million
and $16.2 million, respectively.
In the fourth quarter of 2017 and full year 2017, $1.9 million and $7.9 million, respectively, in GAAP non-cash charges related to the amortization of GFI
employee forgivable loans granted prior to the closing of the January 11, 2016 back-end merger with GFI were also excluded from the calculation of pre-tax
Adjusted Earnings as part of “(Gains) and charges with respect to acquisitions, dispositions and / or resolutions of litigation, and other non-cash, non-dilutive
items, net”. For the fourth quarter of 2016 and full year 2016, the corresponding amounts were $2.6 million and $12.5 million, respectively.
Differences between Certain Non-compensation Expenses for Adjusted Earnings and GAAP
The difference between non-compensation expenses in the fourth quarter of 2017 and 2016 as calculated for GAAP and Adjusted Earnings included
additional “(Gains) and charges with respect to acquisitions, dispositions and / or resolutions of litigation, and other non-cash, non-dilutive items, net”. These
included $8.0 million and $5.1 million, respectively, of non-cash GAAP charges related to amortization of intangibles; $6.3 million and $2.2 million,
respectively, of acquisition related costs; $3.0 million and $0.6 million, respectively, of non-cash GAAP impairment charges; and various other GAAP items
that together came to a net charge of $1.1 million and a net gain $1.2 million, respectively.
For the full years 2017 and 2016, additional “(Gains) and charges with respect to acquisitions, dispositions and / or resolutions of litigation, and other non-
cash, non-dilutive items, net” included $31.0 million and $20.1 million, respectively, of non-cash GAAP charges related to amortization of intangibles; $10.3
million and $7.2 million, respectively, of acquisition related costs; $6.3 million related to the write-down of the Grubb & Ellis Company tradename in full year
2017; $5.1 million and $4.4 million, respectively, of other non-cash GAAP impairment charges; and various other GAAP items that together came to a net
charge of $7.1 million and a net gain $0.7 million, respectively.
36

DIFFERENCES BETWEEN CONSOLIDATED RESULTS FOR ADJUSTED
EARNINGS AND GAAP (CONTINUED)
Differences between Taxes for Adjusted Earnings and GAAP
BGC’s GAAP provision for income taxes from 2016 forward is calculated based on an annualized methodology. The Company’s GAAP provision for income
taxes was $95.2 million and $14.6 million for the fourth quarters of 2017 and 2016, respectively, and $150.3 million and $60.3 million for the full years 2017
and 2016, respectively. The Company includes additional tax-deductible items when calculating the provision for taxes with respect to Adjusted Earnings
using an annualized methodology. These include tax-deductions related to equity-based compensation with respect to limited partnership unit exchange,
employee loan amortization, and certain net-operating loss carryforwards.
The non-GAAP provision for income taxes was adjusted by $(95.4) million and $5.3 million for the fourth quarters of 2017 and 2016, respectively, and by
$(85.4) million and $5.5 million for the full years 2017 and 2016, respectively. As a result, the provision for income taxes with respect to Adjusted Earnings
was $(0.2) million and $19.9 million for the fourth quarters of 2017 and 2016, respectively, and $64.9 million and $65.8 million for the full years 2017 and
2016, respectively. The calculation of taxes for Adjusted Earnings excluded the effect of the 2017 U.S. Tax Cuts and Jobs Act.
37
38
ADJUSTED EARNINGS DEFINED
38
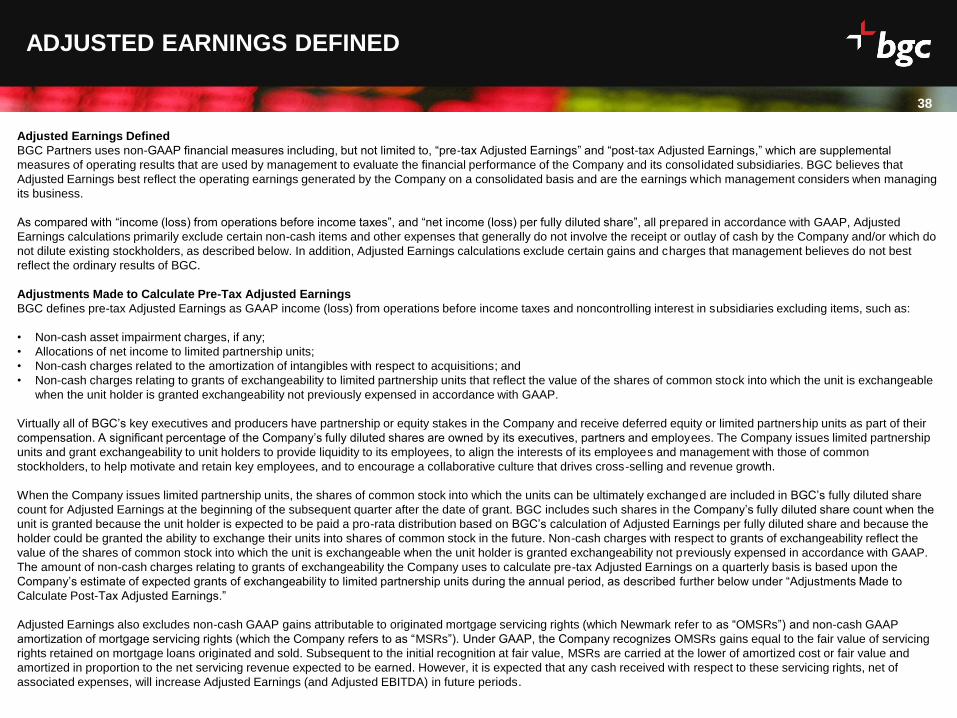
Adjusted Earnings Defined
BGC Partners uses non-GAAP financial measures including, but not limited to, “pre-tax Adjusted Earnings” and “post-tax Adjusted Earnings,” which are supplemental
measures of operating results that are used by management to evaluate the financial performance of the Company and its consolidated subsidiaries. BGC believes that
Adjusted Earnings best reflect the operating earnings generated by the Company on a consolidated basis and are the earnings which management considers when managing
its business.
As compared with “income (loss) from operations before income taxes”, and “net income (loss) per fully diluted share”, all prepared in accordance with GAAP, Adjusted
Earnings calculations primarily exclude certain non-cash items and other expenses that generally do not involve the receipt or outlay of cash by the Company and/or which do
not dilute existing stockholders, as described below. In addition, Adjusted Earnings calculations exclude certain gains and charges that management believes do not best
reflect the ordinary results of BGC.
Adjustments Made to Calculate Pre-Tax Adjusted Earnings
BGC defines pre-tax Adjusted Earnings as GAAP income (loss) from operations before income taxes and noncontrolling interest in subsidiaries excluding items, such as:
• Non-cash asset impairment charges, if any;
• Allocations of net income to limited partnership units;
• Non-cash charges related to the amortization of intangibles with respect to acquisitions; and
• Non-cash charges relating to grants of exchangeability to limited partnership units that reflect the value of the shares of common stock into which the unit is exchangeable
when the unit holder is granted exchangeability not previously expensed in accordance with GAAP.
Virtually all of BGC’s key executives and producers have partnership or equity stakes in the Company and receive deferred equity or limited partnership units as part of their
compensation. A significant percentage of the Company’s fully diluted shares are owned by its executives, partners and employees. The Company issues limited partnership
units and grant exchangeability to unit holders to provide liquidity to its employees, to align the interests of its employees and management with those of common
stockholders, to help motivate and retain key employees, and to encourage a collaborative culture that drives cross-selling and revenue growth.
When the Company issues limited partnership units, the shares of common stock into which the units can be ultimately exchanged are included in BGC’s fully diluted share
count for Adjusted Earnings at the beginning of the subsequent quarter after the date of grant. BGC includes such shares in the Company’s fully diluted share count when the
unit is granted because the unit holder is expected to be paid a pro-rata distribution based on BGC’s calculation of Adjusted Earnings per fully diluted share and because the
holder could be granted the ability to exchange their units into shares of common stock in the future. Non-cash charges with respect to grants of exchangeability reflect the
value of the shares of common stock into which the unit is exchangeable when the unit holder is granted exchangeability not previously expensed in accordance with GAAP.
The amount of non-cash charges relating to grants of exchangeability the Company uses to calculate pre-tax Adjusted Earnings on a quarterly basis is based upon the
Company’s estimate of expected grants of exchangeability to limited partnership units during the annual period, as described further below under “Adjustments Made to
Calculate Post-Tax Adjusted Earnings.”
Adjusted Earnings also excludes non-cash GAAP gains attributable to originated mortgage servicing rights (which Newmark refer to as “OMSRs”) and non-cash GAAP
amortization of mortgage servicing rights (which the Company refers to as “MSRs”). Under GAAP, the Company recognizes OMSRs gains equal to the fair value of servicing
rights retained on mortgage loans originated and sold. Subsequent to the initial recognition at fair value, MSRs are carried at the lower of amortized cost or fair value and
amortized in proportion to the net servicing revenue expected to be earned. However, it is expected that any cash received with respect to these servicing rights, net of
associated expenses, will increase Adjusted Earnings (and Adjusted EBITDA) in future periods.

39
ADJUSTED EARNINGS DEFINED (CONTINUED)
39
Additionally, Adjusted Earnings calculations exclude certain unusual, one-time, non-ordinary or non-recurring items, if any. These items are excluded from Adjusted Earnings
because the Company views excluding such items as a better reflection of the ongoing operations of BGC. BGC’s definition of Adjusted Earnings also excludes certain gains
and charges with respect to acquisitions, dispositions, or resolutions of litigation. Management believes that excluding such gains and charges also best reflects the ongoing
performance of BGC.
Recognition of Nasdaq Earn-out Payments
Consistent with Newmark’s methodology of recognizing income related to the receipt of Nasdaq earn-out payments in the third quarter under GAAP, beginning with the first
quarter of 2018, BGC will recognize the receipt of Nasdaq earn-out payments when earned in the third quarter for Adjusted Earnings instead of pro-rating over four quarters.
This GAAP methodology will lead to earlier recognition of the Nasdaq income under Adjusted Earnings.
Adjustments Made to Calculate Post-Tax Adjusted Earnings
Because Adjusted Earnings are calculated on a pre-tax basis, BGC also intends to report post-tax Adjusted Earnings on a consolidated basis. The Company defines post-tax
Adjusted Earnings as pre-tax Adjusted Earnings reduced by the non-GAAP tax provision described below and Adjusted Earnings attributable to noncontrolling interest in
subsidiaries.
The Company calculates its tax provision for post-tax Adjusted Earnings using an annual estimate similar to how it accounts for its income tax provision under GAAP. To
calculate the quarterly tax provision under GAAP, BGC estimates its full fiscal year GAAP income (loss) from operations before income taxes and noncontrolling interests in
subsidiaries and the expected inclusions and deductions for income tax purposes, including expected grants of exchangeability to limited partnership units during the annual
period. The resulting annualized tax rate is applied to BGC’s quarterly GAAP income (loss) from operations before income taxes and noncontrolling interests in subsidiaries. At
the end of the annual period, the Company updates its estimate to reflect the actual tax amounts owed for the period.
To determine the non-GAAP tax provision, BGC first adjusts pre-tax Adjusted Earnings by recognizing any, and only, amounts for which a tax deduction applies under
applicable law. The amounts include non-cash charges with respect to grants of exchangeability; certain charges related to employee loan forgiveness; certain net operating
loss carryforwards when taken for statutory purposes; certain charges related to tax goodwill amortization; and deductions with respect to charitable contributions. These
adjustments may also reflect timing and measurement differences, including treatment of employee loans, changes in the value of units between the dates of grants of
exchangeability and the date of actual unit exchange, variations in the value of certain deferred tax assets and liabilities and the different timing of permitted deductions for tax
under GAAP and statutory tax requirements.
After application of these previously described adjustments, the result is the Company’s taxable income for its pre-tax Adjusted Earnings, to which BGC then applies the
statutory tax rates. This amount is the Company’s non-GAAP tax provision. BGC views the effective tax rate on pre-tax Adjusted Earnings as equal to the amount of its non-
GAAP tax provision divided by the amount of pre-tax Adjusted Earnings.
Generally, the most significant factor affecting this non-GAAP tax provision is the amount of non-cash charges relating to the grants of exchangeability to limited partnership
units. Because the non-cash charges relating to the grants of exchangeability are deductible in accordance with applicable tax laws, increases in exchangeability have the
effect of lowering the Company’s non-GAAP effective tax rate and thereby increasing its post-tax Adjusted Earnings.
Management uses post-tax Adjusted Earnings in part to help it evaluate, among other things, the overall performance of the business, to make decisions with respect to the
Company’s operations, and to determine the amount of dividends payable to common stockholders and distributions payable to ho lders of limited partnership units.
40
ADJUSTED EARNINGS DEFINED (CONTINUED)
40
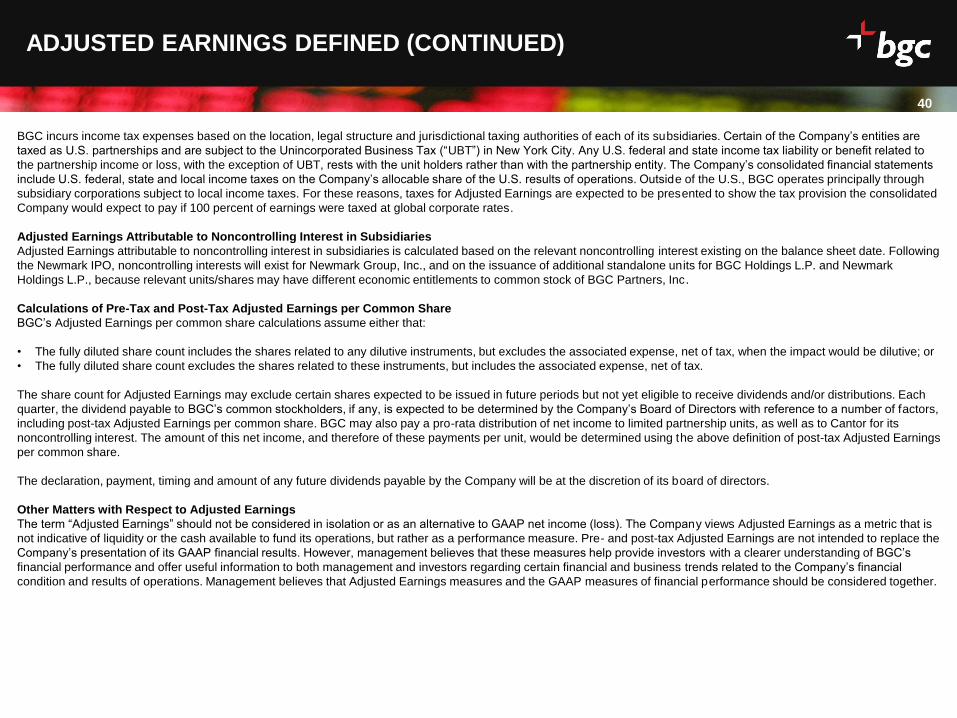
BGC incurs income tax expenses based on the location, legal structure and jurisdictional taxing authorities of each of its subsidiaries. Certain of the Company’s entities are
taxed as U.S. partnerships and are subject to the Unincorporated Business Tax (“UBT”) in New York City. Any U.S. federal and state income tax liability or benefit related to
the partnership income or loss, with the exception of UBT, rests with the unit holders rather than with the partnership entity. The Company’s consolidated financial statements
include U.S. federal, state and local income taxes on the Company’s allocable share of the U.S. results of operations. Outside of the U.S., BGC operates principally through
subsidiary corporations subject to local income taxes. For these reasons, taxes for Adjusted Earnings are expected to be presented to show the tax provision the consolidated
Company would expect to pay if 100 percent of earnings were taxed at global corporate rates.
Adjusted Earnings Attributable to Noncontrolling Interest in Subsidiaries
Adjusted Earnings attributable to noncontrolling interest in subsidiaries is calculated based on the relevant noncontrolling interest existing on the balance sheet date. Following
the Newmark IPO, noncontrolling interests will exist for Newmark Group, Inc., and on the issuance of additional standalone units for BGC Holdings L.P. and Newmark
Holdings L.P., because relevant units/shares may have different economic entitlements to common stock of BGC Partners, Inc.
Calculations of Pre-Tax and Post-Tax Adjusted Earnings per Common Share
BGC’s Adjusted Earnings per common share calculations assume either that:
• The fully diluted share count includes the shares related to any dilutive instruments, but excludes the associated expense, net of tax, when the impact would be dilutive; or
• The fully diluted share count excludes the shares related to these instruments, but includes the associated expense, net of tax.
The share count for Adjusted Earnings may exclude certain shares expected to be issued in future periods but not yet eligible to receive dividends and/or distributions. Each
quarter, the dividend payable to BGC’s common stockholders, if any, is expected to be determined by the Company’s Board of Directors with reference to a number of factors,
including post-tax Adjusted Earnings per common share. BGC may also pay a pro-rata distribution of net income to limited partnership units, as well as to Cantor for its
noncontrolling interest. The amount of this net income, and therefore of these payments per unit, would be determined using the above definition of post-tax Adjusted Earnings
per common share.
The declaration, payment, timing and amount of any future dividends payable by the Company will be at the discretion of its board of directors.
Other Matters with Respect to Adjusted Earnings
The term “Adjusted Earnings” should not be considered in isolation or as an alternative to GAAP net income (loss). The Company views Adjusted Earnings as a metric that is
not indicative of liquidity or the cash available to fund its operations, but rather as a performance measure. Pre- and post-tax Adjusted Earnings are not intended to replace the
Company’s presentation of its GAAP financial results. However, management believes that these measures help provide investors with a clearer understanding of BGC’s
financial performance and offer useful information to both management and investors regarding certain financial and business trends related to the Company’s financial
condition and results of operations. Management believes that Adjusted Earnings measures and the GAAP measures of financial performance should be considered together.

41
ADJUSTED EARNINGS DEFINED (CONTINUED)
41
BGC anticipates providing forward-looking guidance for GAAP revenues and for certain Adjusted Earnings measures from time to time. However, the Company does not
anticipate providing an outlook for other GAAP results. This is because certain GAAP items, which are excluded from Adjusted Earnings, are difficult to forecast with precision
before the end of each period. The Company therefore believes that it is not possible to forecast GAAP results or to quantitatively reconcile GAAP results to non-GAAP results
with sufficient precision unless BGC makes unreasonable efforts. The items that are difficult to predict on a quarterly basis with precision and which can have a material
impact on the Company’s GAAP results include, but are not limited, to the following:
• Allocations of net income and grants of exchangeability to limited partnership units, which are determined at the discretion of management throughout and up to the period-
end;
• The impact of certain marketable securities, as well as any gains or losses related to associated mark-to- market movements and/or hedging. These items are calculated
using period-end closing prices;
• Non-cash asset impairment charges, which are calculated and analyzed based on the period-end values of the underlying assets. These amounts may not be known until
after period-end; and
• Acquisitions, dispositions and/or resolutions of litigation which are fluid and unpredictable in nature.

42
ADJUSTED EBITDA DEFINED
42
Adjusted EBITDA and Adjusted EBITDA Before Allocations to Units Defined
BGC also provides an additional non-GAAP financial performance measure, “Adjusted EBITDA”, which it defines as GAAP “Net income (loss) available to common
stockholders”, adjusted to add back the following items:
• Interest expense;
• Fixed asset depreciation and intangible asset amortization;
• Impairment charges;
• Employee loan amortization and reserves on employee loans;
• Provision (benefit) for income taxes;
• Net income (loss) attributable to noncontrolling interest in subsidiaries;
• Non-cash charges relating to grants of exchangeability to limited partnership interests;
• Non-cash charges related to issuance of restricted shares;
• Non-cash earnings or losses related to BGC’s equity investments; and
• Net non-cash GAAP gains related to OMSR gains and MSR amortization.
The Company also discloses “Adjusted EBITDA before allocations to units”, which is Adjusted EBITDA excluding GAAP charges with respect to allocations of net income to
limited partnership units. Such allocations represent the pro-rata portion of pre-tax earnings available to such unit holders. These units are in the fully diluted share count, and
are exchangeable on a one-to-one basis into common stock. As these units are exchanged into common shares, unit holders become entitled to cash dividends rather than
cash distributions. The Company views such allocations as intellectually similar to dividends on common shares. Because dividends paid to common shares are not an
expense under GAAP, management believes similar allocations of income to unit holders should also be excluded by investors when analyzing BGC’s results on a fully diluted
share basis with respect to Adjusted EBITDA.
The Company’s management believes that these Adjusted EBITDA measures are useful in evaluating BGC’s operating performance, because the calculation of this measure
generally eliminates the effects of financing and income taxes and the accounting effects of capital spending and acquisitions, which would include impairment charges of
goodwill and intangibles created from acquisitions. Such items may vary for different companies for reasons unrelated to overall operating performance. As a result, the
Company’s management uses these measures to evaluate operating performance and for other discretionary purposes. BGC believes that Adjusted EBITDA is useful to
investors to assist them in getting a more complete picture of the Company’s financial results and operations.
Since these Adjusted EBITDA measures are not recognized measurements under GAAP, investors should use these measures in addition to GAAP measures of net income
when analyzing BGC’s operating performance. Because not all companies use identical EBITDA calculations, the Company’s presentation of these Adjus ted EBITDA
measures are may not be comparable to similarly titled measures of other companies. Furthermore, these Adjusted EBITDA measures are not intended to be a measure of
free cash flow or GAAP cash flow from operations, because these Adjusted EBITDA measures do not consider certain cash requirements, such as tax and debt service
payments.
For a reconciliation of these non-GAAP measures to GAAP “Net income (loss) available to common stockholders”, the most comparable financial measure calculated and
presented in accordance with GAAP, see the section of BGC’s most recent quarterly financial results press release titled “Reconciliation of GAAP Income (Loss) to Adjusted
EBITDA”.

43
IMPACT OF ASC 606 NEWMARK’S FUTURE RESULTS
43
Impact of ASC 606 on Newmark’s Future Results
From 2014 through 2016, the Financial Accounting Standards Board (“FASB”) issued several accounting standard updates, which together comprise Accounting Standards
Codification Topic 606, Revenue from Contracts with Customers (“ASC 606”). Beginning in the first quarter of 2018, the Company will record its financial results to conform to
ASC 606. The Company has elected to adopt the guidance using the modified retrospective approach, under which the Company wil l apply the new standard only to new
contracts initiated on or after January 1, 2018 and record the transition adjustments in its retained earnings.
Under this approach, Newmark will not record revenues or earnings related to “Leasing and other commissions” with respect to cash received for contingent revenue as of
December 31, 2017, in relation to contracts signed prior to January 1, 2018, for which services have already been completed. Instead, the Company will record this contingent
revenue and related commission payments on the balance sheet on January 1, 2018, with a corresponding increase of approximately $24 million to retained earnings as part
of “Total stockholders’ equity”. Over time, the Company expects to receive $24 million of cash related to these “Leasing and other commissions” receivables, primarily over the
course of 2018 and 2019. This cash, however, is no longer expected to be recorded as GAAP net income, Adjusted Earnings, or Adjusted EBITDA.
The adoption of ASC 606 is also expected to impact the Company’s recognition of revenue from its outsourcing businesses, which are recorded as part of “Management
services, servicing fees, and other.” Implementation of the updated principal versus agent considerations under ASC 606 is expected to increase the proportion of
reimbursable expenses related to the Company’s outsourcing activities accounted for as revenue on a gross basis. This will result in an increase in revenue and a
corresponding increase in cost of revenue, with no impact on earnings for periods from January 1, 2018 onward. For full year 2018, this is expected to increase Newmark’s
revenues by approximately $100 million, all else equal, with a corresponding increase in costs attributable to these revenues. Because BGC’s financial results consolidate
those of Newmark, the consolidated Company’s revenues are expected to increase by a similar amount.

44
PROPOSED SPIN-OFF OF NEWMARK
44
Proposed Spin-Off of Newmark
BGC currently expects to pursue a distribution (or “spin-off”) to its common stockholders of all the Class A shares and Class B shares of Newmark common stock that it then
owns in a manner intended to qualify as generally tax-free for U.S. federal income tax purposes. The Newmark common shares owned by BGC are subject to a 180-day “lock-
up” restriction contained in the underwriting agreement for the Newmark IPO. The distribution is subject to a number of conditions, and BGC may determine not to proceed
with the distribution if the BGC board of directors determines, in its sole discretion, that the distribution is not in the best interest of the Company and its stockholders.
Accordingly, the distribution may not occur on any expected timeframe, or at all. Please see the section on “Certain Relationships and Related-Party Transactions—
Separation and Distribution Agreement—The Distribution” in Newmark’s final prospectus.
45
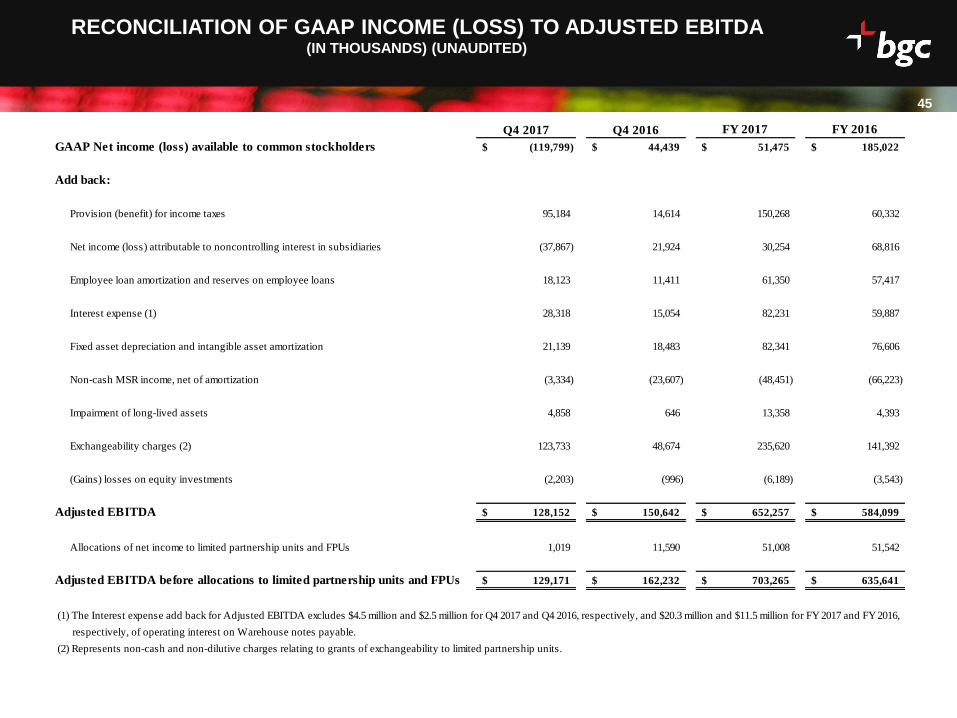
RECONCILIATION OF GAAP INCOME (LOSS) TO ADJUSTED EBITDA (IN THOUSANDS) (UNAUDITED)
Q4 2017 Q4 2016 FY 2017 FY 2016
GAAP Net income (loss) available to common stockholders (119,799)$ 44,439$ 51,475$ 185,022$
Add back:
Provision (benefit) for income taxes 95,184 14,614 150,268 60,332
Net income (loss) attributable to noncontrolling interest in subsidiaries (37,867) 21,924 30,254 68,816
Employee loan amortization and reserves on employee loans 18,123 11,411 61,350 57,417
Interest expense (1) 28,318 15,054 82,231 59,887
Fixed asset depreciation and intangible asset amortization 21,139 18,483 82,341 76,606
Non-cash MSR income, net of amortization (3,334) (23,607) (48,451) (66,223)
Impairment of long-lived assets 4,858 646 13,358 4,393
Exchangeability charges (2) 123,733 48,674 235,620 141,392
(Gains) losses on equity investments (2,203) (996) (6,189) (3,543)
Adjusted EBITDA 128,152$ 150,642$ 652,257$ 584,099$
Allocations of net income to limited partnership units and FPUs 1,019 11,590 51,008 51,542
Adjusted EBITDA before allocations to limited partnership units and FPUs 129,171$ 162,232$ 703,265$ 635,641$
(1) The Interest expense add back for Adjusted EBITDA excludes $4.5 million and $2.5 million for Q4 2017 and Q4 2016, respectively, and $20.3 million and $11.5 million for FY 2017 and FY 2016,
respectively, of operating interest on Warehouse notes payable.
(2) Represents non-cash and non-dilutive charges relating to grants of exchangeability to limited partnership units.

46
RECONCILIATION OF GAAP INCOME (LOSS) TO ADJUSTED EARNINGS AND GAAP
FULLY DILUTED EPS TO POST-TAX ADJUSTED EPS (IN THOUSANDS, EXCEPT PER SHARE DATA) (UNAUDITED)
Q4 2017 Q4 2016 FY 2017 FY 2016
GAAP income (loss) before income taxes (62,482)$ 80,977$ 231,997$ 314,170$
Pre-tax adjustments:
Non-cash (gains) losses related to equity investments, net (2,203) (996) (6,189) (3,543)
Allocations of net income and grant of exchangeability to limited partnership units and FPUs 124,752 60,264 286,628 192,934
Nasdaq earn-out income (a) 23,837 18,032 (8,597) 849
Non-cash MSR income, net of amortization (3,334) (23,607) (48,451) (66,223)
(Gains) and charges with respect to acquisitions, dispositions and / or resolutions of litigation, and other
non-cash, non-dilutive items, net 84,568 14,445 158,303 46,833
Total pre-tax adjustments 227,620 68,138 381,694 170,850
Pre-tax adjusted earnings 165,138$ 149,115$ 613,691$ 485,020$
GAAP net income (loss) available to common stockholders (119,799)$ 44,439$ 51,475$ 185,022$
Allocation of net income (loss) to noncontrolling interest in subsidiaries (40,994) 20,750 25,719 67,203
Total pre-tax adjustments (from above) 227,620 68,138 381,694 170,850
Income tax adjustment to reflect adjusted earnings taxes 95,370 (5,290) 85,359 (5,516)
Post-tax adjusted earnings 162,197$ 128,037$ 544,247$ 417,559$
Per Share Data
GAAP fully diluted earnings per share (0.41)$ 0.16$ 0.17$ 0.65$
Less: Allocations of net income to limited partnership units and FPUs, net of tax 0.06 (0.01) (0.00) (0.05)
Total pre-tax adjustments (from above) 0.49 0.16 0.84 0.39
Income tax adjustment to reflect adjusted earnings taxes 0.21 (0.01) 0.19 (0.01)
Post-tax adjusted earnings per share (b) 0.35$ 0.30$ 1.20$ 0.98$
Pre-tax adjusted earnings per share (b) 0.36$ 0.34$ 1.35$ 1.13$
Fully diluted weighted-average shares of common stock outstanding 462,912 433,412 454,256 433,226
(a) Adjusted earnings for Q4 2017 and Q4 2016 includes $23.8 million and $18.0 million, respectively, and FY 2017 and FY 2016 includes $(8.6) million and $0.8 million,
respectively, of adjustments associated with the Nasdaq transaction. For Q4 2017 and Q4 2016 income (loss) related to the Nasdaq earn-out shares was $(1.8) million and
$(0.8) million for GAAP and $22.1 million and $17.2 million for adjusted earnings, respectively. For FY 2017 and FY 2016 income (loss) related to the Nasdaq earn-out
shares was $96.1 million and $78.7 million for GAAP and $87.5 million and $79.6 million for adjusted earnings, respectively.
(b) On July 29, 2011, BGC Partners issued $160 million in 4.50 percent Convertible Senior Notes due 2016, which matured and were settled for cash and 6.9 thousand Class A
common shares in Q3 2016. The adjusted earnings per share calculations for FY 2016 included 8.6 million shares underlying these Notes. The adjusted earnings
per share calculations excluded the interest expense, net of tax, associated with these Notes.
Note: Certain numbers may not add due to rounding.

47
RECONCILIATION OF FENICS GAAP INCOME BEFORE TAXES TO PRE-TAX
ADJUSTED EARNINGS (IN THOUSANDS) (UNAUDITED)
Q4 2017 Q4 2016 FY 2017 FY 2016
FENICS GAAP income before income taxes (1) 24,974$ 22,498$ 110,083$ 102,003$
Pre-tax adjustments:
Grant of exchangeability to limited partnership units 479 649 2,258 3,452
Amortization of intangible assets 940 940 3,761 3,760
Total pre-tax adjustments 1,419 1,589 6,019 7,212
FENICS Pre-tax adjusted earnings 26,393$ 24,087$ 116,102$ 109,215$
(1) Includes market data, software and post-trade revenues along with intercompany revenues which are eliminated
at the segment level upon consolidation.

48
48
FULLY DILUTED WEIGHTED-AVERAGE SHARE COUNT FOR GAAP AND ADJUSTED EARNINGS (IN
THOUSANDS) (UNAUDITED)
Q4 2017 Q4 2016 FY 2017 FY 2016
Common stock outstanding 290,871 279,833 287,378 277,073
Limited partnership units - 86,290 100,215 79,727
Cantor units - 50,932 51,361 50,653
Founding partner units - 14,078 13,474 14,563
4.50% Convertible debt shares (Matured July 15, 2016) - - - 8,598
RSUs - 573 521 452
Other - 1,706 1,307 2,160
Fully diluted weighted-average share count for GAAP 290,871 433,412 454,256 433,226
Adjusted Earnings Adjustments:
Limited partnership units 105,336 - - -
Cantor units 51,888 - - -
Founding partner units 12,943 - - -
RSUs 679 - - -
Other 1,195 - - -
Fully diluted weighted-average share count for AE 462,912 433,412 454,256 433,226

49
SEGMENT DISCLOSURE – 4Q 2017 VS 4Q 2016(IN THOUSANDS) (UNAUDITED)
Financial
Services
Real
Estate Services
Corporate
Items Total
Financial
Services
Real
Estate Services
Corporate
Items Total
Total revenues 421,672$ 462,041$ 10,521$ 894,234$ 359,301$ 388,606$ 7,851$ 755,758$
Total expenses 354,339 369,755 234,841 958,935 294,762 296,160 83,876 674,798
Total other income (losses), net (1,118) (636) 3,973 2,219 (838) - 855 17
Income (loss) from operations before income taxes 66,215$ 91,650$ (220,347)$ (62,482)$ 63,701$ 92,446$ (75,170)$ 80,977$
Pre-tax adjustments:
Non-cash (gains) losses related to equity
investments, net - - (2,203) (2,203) - - (996) (996)
Allocations of net income and grant of
exchangeability to limited partnership units and
FPUs - - 124,752 124,752 - - 60,264 60,264
Nasdaq earn-out income (1) 4,171 19,666 - 23,837 18,032 - - 18,032
Non-cash MSR income, net of amortization - (3,334) - (3,334) - (23,607) - (23,607)
(Gains) and charges with respect to acquisitions,
dispositions and / or resolutions of litigation, and
other non-cash, non-dilutive items, net 6,621 866 77,081 84,568 5,980 1,407 7,058 14,445
Total pre-tax adjustments 10,792 17,198 199,630 227,620 24,012 (22,200) 66,326 68,138
Pre-tax adjusted earnings 77,007$ 108,848$ (20,717)$ 165,138$ 87,713$ 70,246$ (8,844)$ 149,115$
(1) Financial Services' pre-tax adjusted earnings for Q4 2017 and Q4 2016 includes $4.2 million and $18.0 million, respectively, of adjustments associated with the Nasdaq transaction. For Q4 2017
and Q4 2016, Financial Services recognized income (loss) related to the Nasdaq earn-out shares of $(1.1) million and $(0.8) million for GAAP and $3.1 million and $17.2 million for adjusted
earnings, respectively. Real Estate Services' pre-tax adjusted earnings for Q4 2017 includes a $18.0 million adjustment associated with the Nasdaq transaction. For Q4 2017, Real Estate Services
recognized income (loss) related to the Nasdaq earn-out shares of $(0.6) million for GAAP and $19.0 million for adjusted earnings. The Real Estate Services segment did not recognize income
related to the Nasdaq transaction for GAAP or AE prior to Q3 2017.
Q4 2017 Q4 2016

50
SEGMENT DISCLOSURE – FY 2017 VS FY 2016(IN THOUSANDS) (UNAUDITED)
Financial
Services
Real
Estate Services
Corporate
Items Total
Financial
Services
Real
Estate Services
Corporate
Items Total
Total revenues 1,711,824$ 1,601,420$ 40,112$ 3,353,356$ 1,523,235$ 1,353,720$ 31,141$ 2,908,096$
Total expenses 1,398,264 1,301,503 526,286 3,226,053 1,275,397 1,099,196 327,133 2,701,726
Total other income (losses), net 19,727 76,332 8,635 104,694 78,701 - 29,099 107,800
Income (loss) from operations before income taxes 333,287$ 376,249$ (477,539)$ 231,997$ 326,539$ 254,524$ (266,893)$ 314,170$
Pre-tax adjustments:
Non-cash (gains) losses related to equity
investments, net - - (6,189) (6,189) - - (3,543) (3,543)
Allocations of net income and grant of
exchangeability to limited partnership units and
FPUs - - 286,628 286,628 - - 192,934 192,934
Nasdaq earn-out income 29,463 (38,060) - (8,597) 849 - - 849
Non-cash MSR income, net of amortization - (48,451) - (48,451) - (66,223) - (66,223)
(Gains) and charges with respect to acquisitions,
dispositions and / or resolutions of litigation, and
other non-cash, non-dilutive items, net 26,320 4,538 127,445 158,303 24,384 4,384 18,065 46,833
Total pre-tax adjustments 55,783 (81,973) 407,884 381,694 25,233 (61,839) 207,456 170,850
Pre-tax adjusted earnings 389,070$ 294,276$ (69,655)$ 613,691$ 351,772$ 192,685$ (59,437)$ 485,020$
(1) Financial Services' pre-tax adjusted earnings for FY 2017 and FY 2016 includes $29.5 million and $0.8 million, respectively, of adjustments associated with the Nasdaq transaction.
For FY 2017 and FY 2016, Financial Services recognized income (loss) related to the Nasdaq earn-out shares of $19.7 million and $78.7 million for GAAP and $49.2 million and $79.6 million
for adjusted earnings, respectively. Real Estate Services' pre-tax adjusted earnings for FY 2017 includes a $(38.1) million adjustment associated with the Nasdaq transaction. For FY 2017,
Real Estate Services recognized income (loss) related to the Nasdaq earn-out shares of $76.3 million for GAAP and $38.3 million for adjusted earnings. The Real Estate Services segment did not
recognize income related to the Nasdaq transaction for GAAP or AE prior to Q3 2017.
FY 2017 FY 2016

51
RECONCILIATION OF BGC REAL ESTATE SEGMENT REVENUES TO
NEWMARK GROUP, INC. STAND-ALONE REVENUES(IN THOUSANDS) (UNAUDITED)
Q4 2017 Q4 2016 FY 2017 FY 2016
BGC Real Estate segment revenues 462,041 388,606 1,601,420 1,353,720
Interest income (1) (1,446) (1,021) (4,970) (3,737)
Newmark Group, Inc. stand-alone revenues 460,595 387,585 1,596,450 1,349,983
(1) This is not included as part of Total revenues in Newmark Group, Inc.'s stand-alone financial statements.
BGC PARTNERS, INC.
RECONCILIATION OF BGC REAL ESTATE SEGMENT REVENUES TO NEWMARK GROUP, INC.
STAND-ALONE REVENUES
(in thousands)
(unaudited)

52
RECONCILIATION OF BGC REAL ESTATE SEGMENT TO NEWMARK
GROUP, INC. STAND-ALONE FOR GAAP INCOME (LOSS) FROM
OPERATIONS BEFORE INCOME TAXES (IN THOUSANDS) (UNAUDITED)
Q4 2017 Q4 2016 FY 2017 FY 2016
BGC Real Estate segment income (loss) from operations before income taxes 91,650 92,446 376,249 254,524
BGC Corporate Items:
Interest income 226 2 984 75
Compensation and employee benefits (13,905) (2,054) (38,276) (18,912)
Allocations of net income and grant of exchangeability to limited
partnership units and FPUs (61,941) (32,316) (114,657) (72,319)
Fees to related parties (1,530) (1,284) (4,529) (4,618)
Professional and consulting fees (1,437) (790) (2,832) (479)
Interest expense (2,841) (884) (5,338) (2,267)
Other expenses - (45) (6,335) (80)
Gains (losses) on equity method investments 616 - 1,561 -
Other income (loss) (2,294) (684) (4,252) 15,279
Total BGC Corporate Items (83,106) (38,055) (173,674) (83,321)
Newmark Group, Inc. stand-alone income (loss) from operations before
income taxes 8,544 54,391 202,575 171,203
BGC PARTNERS, INC.
RECONCILIATION OF BGC REAL ESTATE SEGMENT TO NEWMARK GROUP, INC. STAND-ALONE FOR GAAP
INCOME (LOSS) FROM OPERATIONS BEFORE INCOME TAXES
(in thousands)
(unaudited)

53
RECONCILIATION OF BGC REAL ESTATE SEGMENT TO NEWMARK
GROUP, INC. STAND-ALONE FOR PRE-TAX ADJUSTED EARNINGS(IN THOUSANDS) (UNAUDITED)
Q4 2017 Q4 2016 FY 2017 FY 2016
BGC Real Estate segment pre-tax adjusted earnings 108,848 70,246 294,276 192,685
BGC Corporate Items:
Interest income 226 2 984 75
Compensation and employee benefits (551) 1,089 (2,222) (768)
Fees to related parties (1,530) (1,284) (4,529) (4,618)
Professional fees - - (154) 311
Interest expense (2,841) (884) (5,338) (2,267)
Other expenses 77 (39) 172 (259)
Gains (losses) on equity method investments 616 - 1,561 -
Other income (loss) (1) (19,666) - 38,060 -
Total BGC Corporate Items (23,669) (1,116) 28,534 (7,526)
Newmark Group, Inc. stand-alone pre-tax adjusted earnings 85,179 69,130 322,810 185,159
BGC PARTNERS, INC.
RECONCILIATION OF BGC REAL ESTATE SEGMENT TO NEWMARK GROUP, INC. STAND-ALONE FOR PRE-TAX
ADJUSTED EARNINGS
(in thousands)
(unaudited)
(1) Consistent with Newmark's methodology of recognizing income related to the receipt of Nasdaq payments in the third quarter under GAAP, beginning
from the first quarter of 2018, BGC will recognize the receipt of Nasdaq earn-out payments when earned in the third quarter for Adjusted Earnings instead of
pro-rating over four quarters in its consolidated results. Other income (loss) includes an adjustment related to the Nasdaq payments of $(19.7) million and
$38.1 million for Q4 2017 and FY 2017, respectively. The Real Estate Services segment did not recognize income related to the Nasdaq transaction for GAAP
and AE prior to Q3 2017.

54
54
LIQUIDITY ANALYSIS (IN THOUSANDS) (UNAUDITED)
December 31, 2017 December 31, 2016
Cash and cash equivalents 634,333$ 535,613$
Reverse repurchase agreements - 54,659
Securities owned 33,007 35,357
Marketable securities (1) 5,833 164,820
Total 673,173$ 790,449$
(1) As of December 31, 2017, $202.3 million of Marketable securities on our balance sheet
were lent out in Securities Loaned transactions and therefore are not included as
part of our Liquidity Analysis.

5555
ir.bgcpartners.com
twitter.com/bgcpartners
linkedin.com/company/bgc-partners
Media Contact:
Karen Laureano-Rikardsen
+1 212-829-4975
Investor Contact:
Ujjal Basu Roy (BGC), Kelly Collar (Newmark),
or Jason McGruder (BGC and Newmark)
+1 212-610-2426