Beyond the inventory - Change detection at the … · Ruedi Haller1, Pius Hauenstein2, Pia...
8
257 5 th Symposium Conference Volume for Research in Protected Areas pages 257 - 263 10 to 12 June 2013, Mittersill Beyond the inventory - Change detection at the landscape level using aerial photographs in four protected areas of the Alps Ruedi Haller 1 , Pius Hauenstein 2 , Pia Anderwald 1 , Kristina Bauch 3 , Florian Jurgeit 4 , Katharina Aichhorn 5 , Daniel Kreiner 6 , Tamara Höbinger 6 , Annette Lotz 7 , Helmut Franz 7 1 Swiss National Park, Zernez, Switzerland 2 Hauenstein Geoinformatics, Tamins, Switzerland 3 Hohe Tauern National Park, Mittersill, Austria 4 Hohe Tauern National Park, Matrei, Austria 5 Hohe Tauern National Park, Mallnitz, Austria 6 National Park Gesäuse, Weng, Austria 7 Berchtesgaden National Park, Berchtesgaden, Germany Abstract Long-term monitoring is a key task for any national park. Therefore, a set of monitoring programs has been established by ecologists in the last decades to observe changes of different ecological processes. However, monitoring change at the landscape level has lagged behind because of the cost-intensive investments to be made and also because of the lack of a meaningful framework to detect and measure change as well as store data at this scale. Documenting change of the landscape could give insights into processes which were not expected by experts and therefore no specific monitoring system was implemented. The four national parks Berchtesgaden, Hohe Tauern, Gesäuse and the Swiss National Park have recently developed a framework to fill this gap in their monitoring system. Based on aerial image comparison and on a formerly defined interpretation key from the Interreg IIIB project HABITALP, the working group has developed the necessary workflow and tools. The group has also expanded the existing inventory based on aerial photographs to a change detection data set which allows quantifying change at the landscape level in the protected areas. Fields denoting change were added to the existing interpretation key and the data model from HABITALP based on two different time series of aerial photographs. Current technology allows for a comparison between the two stereoscopic images and the detection of thematic and geometric changes. The system was trialed in test areas of all four national parks. Resulting maps allow for a detailed insight into change of the main habitat types, as well as several smaller, often not immediately obvious, changes in the landscape over time. Keywords landscape change, long term monitoring, detection, aerial images, aerial image interpretation, data model, digital photogrammetry Background Nature conservation is a key task of large protected areas in general and national parks in particular. This includes absolute protection of the landscape and species, as well as tolerating and accepting natural processes and ecological disturbances. The latter is followed by changes in landscape structures or unpredicted succession of species. A precise monitoring with long-term perspectives is indispensable to differentiate between natural processes and anthropogenic influences, provide facts when conflicts occur and document change over time (MARGULES & PRESSEY 2000). The monitoring systems established in protected areas in the last decades allow for observation of change on small-scale plots of flora and fauna (LOCKWOOD & WORBOYS et al. 2006). However, change at the landscape level - one of the key elements for large protected areas - has been largely neglected so far. Mainly cost factors and missing meaningful conceptual models for protected areas prohibited a systematic documentation of change at landscape scales in national parks. Moreover, a lack of methodologies has prevented managers from investing in these approaches. There are different requirements in protected areas compared to other regions, where human impacts such as, sheeting, or drainage mainly need to be documented. Common data models documenting change often do not know terms such as abandoning, restoring or natural succession. But these types of change must be included if an area-wide analysis in a conservation area is to be successful. Increasingly, these analyses have to provide quantitative evidence. Special definitions are needed for a planar quantification. It is of crucial importance to know the quality of the data in terms of their positional and thematic accuracy and completeness with respect to the question to be answered - is something changing or not? Otherwise, there is a risk to document erroneous spatial boundaries instead of true change (HALLER 2011). In
Transcript of Beyond the inventory - Change detection at the … · Ruedi Haller1, Pius Hauenstein2, Pia...

257
5th Symposium Conference Volume for Research in Protected Areas pages 257 - 263
10 to 12 June 2013, Mittersill
Beyond the inventory - Change detection at the landscape level using aerial photographs in four protected areas of the Alps
Ruedi Haller1, Pius Hauenstein2, Pia Anderwald1, Kristina Bauch3, Florian Jurgeit4,
Katharina Aichhorn5, Daniel Kreiner6, Tamara Höbinger6, Annette Lotz7, Helmut Franz7
1 Swiss National Park, Zernez, Switzerland
2 Hauenstein Geoinformatics, Tamins, Switzerland 3 Hohe Tauern National Park, Mittersill, Austria
4 Hohe Tauern National Park, Matrei, Austria 5 Hohe Tauern National Park, Mallnitz, Austria
6 National Park Gesäuse, Weng, Austria 7 Berchtesgaden National Park, Berchtesgaden, Germany
Abstract
Long-term monitoring is a key task for any national park. Therefore, a set of monitoring programs has been established by ecologists in the last decades to observe changes of different ecological processes. However, monitoring change at the landscape level has lagged behind because of the cost-intensive investments to be made and also because of the lack of a meaningful framework to detect and measure change as well as store data at this scale. Documenting change of the landscape could give insights into processes which were not expected by experts and therefore no specific monitoring system was implemented.
The four national parks Berchtesgaden, Hohe Tauern, Gesäuse and the Swiss National Park have recently developed a framework to fill this gap in their monitoring system. Based on aerial image comparison and on a formerly defined interpretation key from the Interreg IIIB project HABITALP, the working group has developed the necessary workflow and tools. The group has also expanded the existing inventory based on aerial photographs to a change detection data set which allows quantifying change at the landscape level in the protected areas.
Fields denoting change were added to the existing interpretation key and the data model from HABITALP based on two different time series of aerial photographs. Current technology allows for a comparison between the two stereoscopic images and the detection of thematic and geometric changes. The system was trialed in test areas of all four national parks. Resulting maps allow for a detailed insight into change of the main habitat types, as well as several smaller, often not immediately obvious, changes in the landscape over time.
Keywords
landscape change, long term monitoring, detection, aerial images, aerial image interpretation, data model, digital photogrammetry
Background
Nature conservation is a key task of large protected areas in general and national parks in particular. This includes absolute protection of the landscape and species, as well as tolerating and accepting natural processes and ecological disturbances. The latter is followed by changes in landscape structures or unpredicted succession of species. A precise monitoring with long-term perspectives is indispensable to differentiate between natural processes and anthropogenic influences, provide facts when conflicts occur and document change over time (MARGULES & PRESSEY 2000).
The monitoring systems established in protected areas in the last decades allow for observation of change on small-scale plots of flora and fauna (LOCKWOOD & WORBOYS et al. 2006). However, change at the landscape level - one of the key elements for large protected areas - has been largely neglected so far. Mainly cost factors and missing meaningful conceptual models for protected areas prohibited a systematic documentation of change at landscape scales in national parks. Moreover, a lack of methodologies has prevented managers from investing in these approaches. There are different requirements in protected areas compared to other regions, where human impacts such as, sheeting, or drainage mainly need to be documented. Common data models documenting change often do not know terms such as abandoning, restoring or natural succession. But these types of change must be included if an area-wide analysis in a conservation area is to be successful.
Increasingly, these analyses have to provide quantitative evidence. Special definitions are needed for a planar quantification. It is of crucial importance to know the quality of the data in terms of their positional and thematic accuracy and completeness with respect to the question to be answered - is something changing or not? Otherwise, there is a risk to document erroneous spatial boundaries instead of true change (HALLER 2011). In

258
addition, there is no prior experience of a meaningful time period between two recordings to detect changes in natural landscapes.
Thanks to increasingly more powerful remote sensing systems, new methods have been developed, which allow for a more differentiated view of the earth's surface and identification of conditions. If the condition is not the same as the previous time, something has obviously changed in between - but what?
This question was also the challenge of this project: First, the spatial and temporal resolution had to be chosen so that the usually slow pace of change in national parks could actually be recognized. Secondly, the issue of what types of change should be recognized had to take into account the needs of all four national parks and their specific environmental and management conditions. This was the starting point of this project, entitled "Change check of the Habitats of the Alps".
Aims and objectives
During the Interreg III project HABITALP, the basic methodology (using CIR aerial images), as well as the semantics of the landscape inventory, were developed (HALLER 2006; LOITZ 2006). At the time, the adaption of the theoretical framework could only be tested in the Nationalpark Berchtesgaden (Germany) due to missing time series of aerial images in other partner regions.
In this follow-up project "Change check Habitalp"- CC-HABITALP, it should be investigated whether this method meets the key requirements for detection of changes in the various national parks in the Alps. The four national parks Hohe Tauern (NPHT; A), Gesäuse (NPG; A), Berchtesgaden (NPB) and the Swiss National Park (SNP; CH) have been working on five priority objectives:
- Identification of space-related (landscape ecology) parameters which are important to the parks
- Elaboration of the semantics of change based on the mapping of space-related parameters
- Developing the logic of the interpretation key which considers the possibilities of different types of aerial images
- The creation of a technical and operational framework and tools for area-wide mapping
- Test the framework and tools on concrete examples in test areas in the four national parks and with different aerial image material (e. g. color-infrared (CIR), normal colours (RGB) and panchromatic (pan)).
CC-Habitalp should deliver the base for future work in the individual national parks.
Results
Interpretation methodology
We used Stereo Analyst for ArcGIS Desktop in versions 9.3 and 10.0. Therefore, all aerial photos had to be digital, and an aerial triangulation had to be present. The procedure enables the interpreter to compare the two image pairs of the default time series with the existing inventory, and to detect and correct errors. In a second step, the interpreter searches for changes in the landscape according to the defined key. Changes in geometry are followed by splitting polygons and thematic changes are recorded in the attribute table.
Basically, only the aerial visible elements can be evaluated. However, because the national parks already have many other data and therefore knowledge of the landscape, the use of these data is desirable to enhance the knowledge of possible processes. The same goes for any local knowledge of the interpreter.
Figure 1: Used infrastructure
Data
A set of aerial images for each protected area was prepared. Taking into account the effort involved, this can be seen as a major output of the project. The basic methodology generally requires very high spatial resolution (15-20 cm ground resolution) and CIR images in the spectral range of 400 - 900 nm. However, for the SNP and the NPG, panchromatic images were also used to allow for retrospective analysis. Moreover, for NPHT and the NPG, RGB-images for the years 2003 and 2009 were used (Table 1).

259
Table 1: Aerial area-wide images prepared for digital photogrammetry in the four national parks Gesäuse (NPG), Hohe Tauern (NPHT), Berchtesgaden (NPB) and the Swiss National Park (SNP)
NPG NPHT NPB SNP
Aerial pictures series 1 2003 1998 2003 2000
Spectral range RGB CIR CIR CIR
Pixel resolution 25 cm 17 cm 17 cm 20 cm
Aerial pictures series 2 1954 2009 2009 1946
Spectral range PAN RGB CIR PAN
Pixel resolution 30 cm 28 cm 20 cm 50 cm
Interpretation key and data model
The fundamental conceptual model of the interpretation key and associated guidelines were developed and described in HABITALP (LOITZ 2006). However, this so-called "universe of discourse" has been modified to include the aspect of ongoing processes. This has been included in the coding, and new directives for interpretation have been developed. The data model has become of vital importance. A data model is a generalized custom representation of data that reflect the real world. Since the entire workflow had to be developed from image interpretation through to the actual data in ArcGIS 9.3 and 10.0, the technical data model was constructed as an ESRI-geodatabase (Figure). Essentially, the key is based on the elements of HIK-2 (DEMEL & HAUENSTEIN 2005). Further developed, HIK-CD (Version 1.1.3) includes not only an inventory of one time series, but also the data structure of the second time level, as well as the associated process information.
Figure 2: UML-data model of HIK-CD (Version 1.1.3)
260
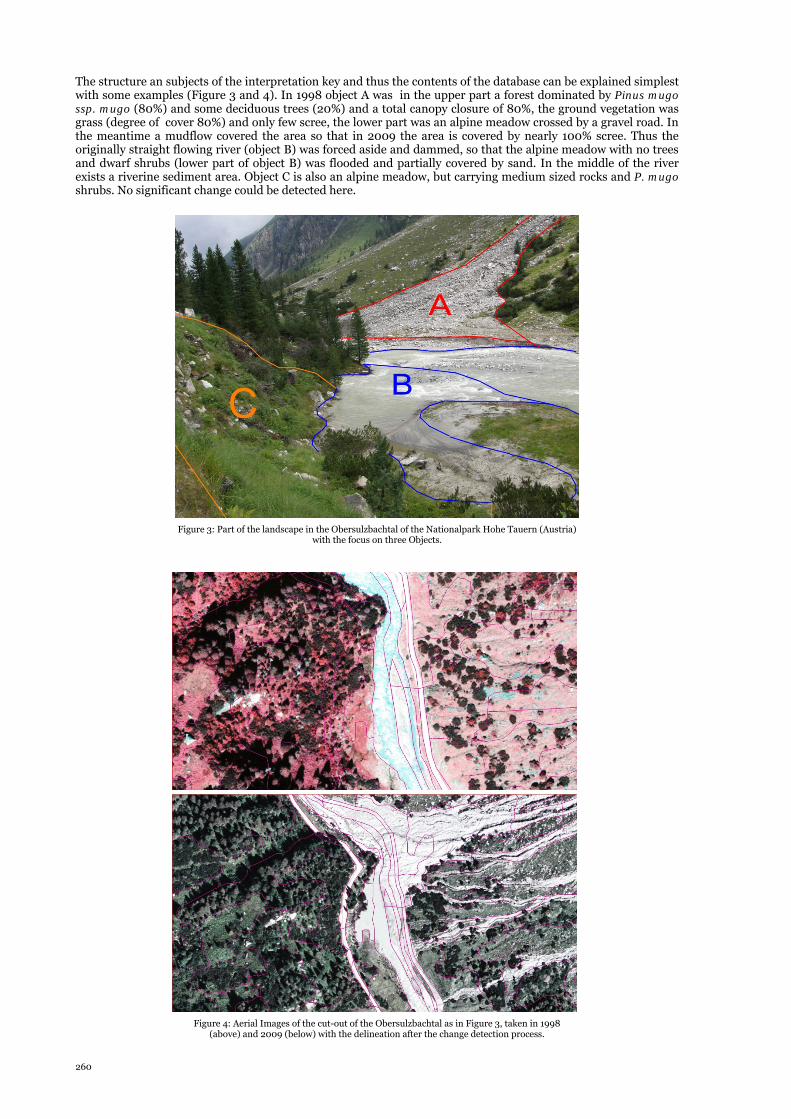
The structure an subjects of the interpretation key and thus the contents of the database can be explained simplest with some examples (Figure 3 and 4). In 1998 object A was in the upper part a forest dominated by Pinus mugo ssp. mugo (80%) and some deciduous trees (20%) and a total canopy closure of 80%, the ground vegetation was grass (degree of cover 80%) and only few scree, the lower part was an alpine meadow crossed by a gravel road. In the meantime a mudflow covered the area so that in 2009 the area is covered by nearly 100% scree. Thus the originally straight flowing river (object B) was forced aside and dammed, so that the alpine meadow with no trees and dwarf shrubs (lower part of object B) was flooded and partially covered by sand. In the middle of the river exists a riverine sediment area. Object C is also an alpine meadow, but carrying medium sized rocks and P. mugo shrubs. No significant change could be detected here.
Figure 3: Part of the landscape in the Obersulzbachtal of the Nationalpark Hohe Tauern (Austria)
with the focus on three Objects.
Figure 4: Aerial Images of the cut-out of the Obersulzbachtal as in Figure 3, taken in 1998 (above) and 2009 (below) with the delineation after the change detection process.

261
Test area interpretation
In each of the national parks, a test area between 12 and 16 km2 was selected and mapped according to the proposed method and interpretation of the key. In order to test as many of the habitats and changes occurring in the four protected areas as possible, the test areas were selected in different habitats within each area. Together with different image material and time gaps between the photographs, we gained a detailed view of advantages and limitations of the selected method.
The shortest time interval is shown on the images in the NPB, for which the best imagery was available. Thematically, the test mapping concentrated on rocky, karstified limestone with grasslands and pine shrubs Pinus mugo ssp mugo. Dynamics in forests were mainly dominated by European bark beetle Ips typographicus.
The greatest difference between images, both with respect to time span (between 1946 and 2000) and quality of the pictures, was seen for the test area of the SNP. Nevertheless, in the upper Val Mingèr, only natural changes were captured, as this area has been fully protected since 1914. Land changes of 7.62% in the main habitat types of key HIK-CD were detected here, particularly in the degree of mixing of forest, but also in rubble and debris surfaces. The dynamics of an avalanche path is shown in Figure.
Figure 5: In 2000 (left), all mapped forest left in Val Mingèr in the SNP appeared approximately evenly distributed and organized. A look back at the picture from 1946 (right) shows that the current avalanche area around the trees at that time was much smaller (b). Presumably, these are the consequences of an even larger avalanche event before 1946. Larger amounts of dead wood - which should also be seen in the picture from 1946 -
are missing. Along with historical information, this indicates that it was removed in 1900 before the establishment of the Swiss National Park, possibly along with other wood uses.
Changes were also evident in retrospect in the NPG. By contrast to the SNP, the first series of aerial photographs was taken some 40 years before the park was founded. Therefore, we found many signs of landscape utilization by comparison to images from 2003, especially in pastures and woodland. A focus was set on detecting changes within avalanche tracks. Avalanche events and a frequent used forest road, together with the natural forest growth and forestry measures, led to changes in many objects between 1954 and 2003.
The mapped area in the NPHT was 13.07 km2, within which 998 different landscapes could be detected. Figure shows the areas where relevant landscape changes were identified and measured. These make up 6% of the total area. Changes happened due to avalanches, debris flows or mountain stream dynamics, but also due to natural forest growth and rock glacier or glacier dynamics. The glaciers also show the limitations of the methodology: the method is of little use for precise monitoring of glaciers, since it was often not able to define whether the glacier still existed under scree or snow. Although mass changes are visible and measurable on the aerial photographs, they would have to be precisely captured in an additional process. Human-induced changes such as forestry operations and construction activities, or derelict buildings, are also visible in the images.
Conclusions
The interpretation key based on experiences and results from the Interreg III project HABITALP was named HIK 2.2.2. Basically, the method allows for detection of changes (ΔH) at the landscape level in accordance with requirements of the national parks. Within in the CC-HABITALP framework, landscape changes could be detected and recorded at different time intervals (Δt). ΔH can be detected over an interval of 6 years or of 55 years. HIK-2 was already holistic and homogeneous at the spatial and thematic resolution, and the change detection interpretation key was developed and completed according to this principle. Particularly in terms of definitions and tools against the inventory key HIK-2, significant progress has been achieved.

262
Longer intervals naturally favor detection of changes in the landscape and allow the use of aerial photos from other spectral ranges. If the time interval is short, the use of CIR aerial images is highly recommended. However, short time intervals require very high spatial resolution and accuracy of aerial images and the base inventory. It is expected that even small-scale changes can be detected and recorded by potential users. Moreover, results are expected within a shorter time frame than with longer intervals, which also increases pressure on interpreters.
Figure 6: Changes and process information on the Steiner Alm in Nationalpark Hohe Tauern
A homologous base inventory based on HIK-2 resp. HIK-CD is central to all inventories of change. Only if the starting material meets the high demands of thematic and spatial accuracy can changes in the defined habitats be properly quantified .
On the other hand, long time intervals have their pitfalls, as the test mapping in the NPG and the SNP showed. Especially in the NPG, forest areas managed in the period before the establishment of the national park were difficult to interpret if the time interval covered 50 years. It is possible that old changes were masked by new events already . The two recorded time readings can thus hardly be traced to ongoing succession of the area.
The SNP has worked with very old pictures from the 1940s. The difficulties experienced in the NPG were not an issue here due to the very slow and natural development. On the other hand, limited detectability of changes due to the relatively poor panchromatic imagery with a resolution of 0.5 m and the geometrical distortion of aerial material was evident.
Based on these experiences, we recommend time intervals of 10 - 20 years for aerial image-based change detection in the national parks of the Alps. The precise interval depends on the soil type and plant growth of an area. Only if the time interval is relatively long (> 15 years) normal color and panchromatic images can be recommended.
The mapping scale has frequently been discussed. With ground-pixel resolutions from 17cm to 50cm we approved an overall reference scale of 1:5'000. This means zooming in to a scale of 1:800 - 1'000 to reasonably detect and map changes. However, there is also an economic aspect: the smaller the area of change to be detected, the greater the effort.
Estimates of cost are essential for a comprehensive inventory in the national parks. We divided effort into two sections: in a first phase, the quality of the first inventory was checked and corrected. This included the transformation of the 2-D inventory of HABITALP into 3-D by using a high resolution terrain model (DTM; Δz <= 1m) in the NPB, NPG and NPHT. This so-called homology was achieved depending on the quality of the first inventory. Once the basic inventory is of good quality, we expect as a first guideline a 2 km2 mapping capacity per day per person. Additional GIS-data is helpful, but does not increase the daily output. Field verifications are not

263
within this time estimation, but are highly recommended, since they allow additional statistical testing of interpretation and improve the interpreter’s familiarity with the area.
Outlook
The project has demonstrated that the detection of landscape change using aerial photographs is still a viable method. However, the demands are considerable. Moreover, exchange of ideas and reciprocal verification of results are an essential element in a long-term application to gain comparable results between different protected areas. It is also important to support the interpreters with technical tools and support to ensure optimal quality and productivity. Since the development is complicated, a common application is highly recommended and should be the aim in future. Moreover, we should invest in analysis and visualization of this complex content demonstrating change in landscapes over time.
Apart from the protected areas involved in the project HABITALP, only few other protected areas have base mapping available which was performed with the key HIK-2. There is no obligation in Alpine countries to use this key in protected areas and to capture the landscape and its changes over time. Therefore, it would now be important for that key to invest in a political breakthrough. This could be followed by setting up a steering group for amendments, which reviews new ideas and useful additions to the existing code.
The development of remote sensing will continue. We assume that the spatial and spectral resolution will increase in the future at the same cost base. The information gained will be beneficial for this method, but must be integrated into this framework and be processed using appropriate infrastructure.
Acknowledgements
We thank the management authorities of the four participating national parks Berchtesgaden, Gesäuse, Hohe Tauern and the Swiss National Park for the financial support and man power in this project.
References
DEMEL, W. & P. HAUENSTEIN 2005. Habitatkartierung mit Farbinfrarot-Luftbildern – Anleitung zur Abgrenzung und Interpretation. Weihenstephan, Fachhochschule Weihenstephan: 28.
HALLER, R. 2006. Landschaftsinventur und -analyse in einem heterogenen, alpinen und internationalen Umfeld. GIS/ SIT Schweizer Forum für Geoinformation, Zürich.
HALLER, R. 2011. Integratives Geoinformationsmanagement in der Schutzgebietsforschung, Forschungskom-mission des Schweizerischen Nationalparks.
LOCKWOOD, M. G. & L. WORBOYS et al., Eds. 2006. Managing protected areas: a global guide. Sterling, VA, Earthscan.
LOTZ, A. 2006. Alpine Habitat Diversity - HABITALP - Project Report 2002 -2006. EU Community Initivative Interreg III B Alpine Space Programme. Berchtesgaden, Nationalpark Berchtesgaden: 196.
MARGULES, C. R. & R. L. Pressey 2000. "Systematic conservation planning." Nature 405 (6783): 243-253 Contact
Ruedi Haller [email protected]
Swiss National Park Chastè Planta-Wildenberg 7530 Zernez Switzerland

264