Beyond the Efficient Frontier: Using a DFA Model to Derive the Cost of Capital CAS Special Interest...
26
CO N N IN G Beyond the Efficient Frontier: Using a DFA Model to Derive the Cost of Capital CAS Special Interest Seminar The Insurance Market Dallas April 16, 2002
-
Upload
conrad-robertson -
Category
Documents
-
view
214 -
download
0
Transcript of Beyond the Efficient Frontier: Using a DFA Model to Derive the Cost of Capital CAS Special Interest...

CON N I N G
Beyond the Efficient Frontier:
Using a DFA Model to Derive the Cost of Capital
CAS Special Interest Seminar
The Insurance Market
DallasApril 16, 2002

2
• EVA®
• Economic Value Added (Stern Stewart & Co.)
• EVA=NOPAT-WACC*Assets
• Economic Value added is the Amount of Profit (after-taxes) less the Cost of Capital (weighted average cost of capital times assets)
Why Should we care about Cost of Capital?
3
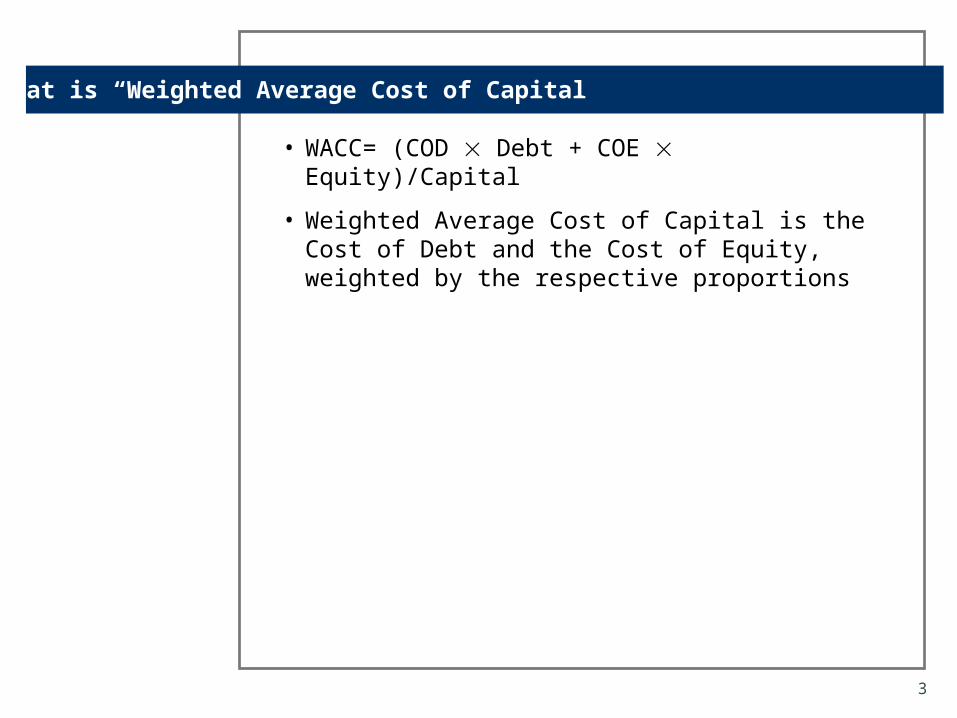
• WACC= (COD Debt + COE Equity)/Capital
• Weighted Average Cost of Capital is the Cost of Debt and the Cost of Equity, weighted by the respective proportions
What is “Weighted Average Cost of Capital”

4
• Widget factory requires:
• Equity from investors
• Debt from lenders
• Weighted Average Cost of Capital is the Cost of Debt (COD) and the Cost of Equity (COE), weighted by the respective proportions
• COD - determined easily from actual terms
• COE - more troublesome, but can be determined from CAPM, and knowledge of the Widget Factory's beta
• (Cost of equity capital = Risk free rate + Stock’s Beta Market Risk Premium)
Finance 101 Widget Factory

5
• Insurance company requires:
• Equity from investors
• Funds Advanced by policyholders
• Weighted Average Cost of Capital is the Cost of Funds Advanced (COFA) and the Cost of Equity (COE), weighted by the respective proportions
• COFA - not determined easily
• COE - more troublesome, but can be determined from CAPM, and knowledge of the Insurance Company’s beta
Finance 101 Insurance Company

6
• Rather than identify COE and COFA separately, calculate overall Cost of Capital
• Use a DFA Model to calculate Cost of Capital
Goal of this Presentation

7
• What can I get elsewhere (at similar levels of risk)?
• “Opportunity” Cost
Cost of Capital

8
• Is related to the types of returns available from other financial instruments in the market-place
• Increases along with the riskiness of the related strategy - but not a simple measure of dispersion. Investors only rewarded for non-diversifiable risk.
• Is related to the length of the project (but this exercise will only examine a one-period result)
Properties of the Cost of Capital

9
Comparison of Corporate Strategies
• Recent papers: use a DFA model to compare strategies
• DFA model’s focus: to find the Efficient Frontier of corporate strategies
• Efficient Frontier
- Subset of strategies that maximize reward for each level of risk
- A company will improve its results by moving towards the Frontier

10
Efficient Frontier
0%
3%
6%
9%
12%
15%
0% 15%
Economic Value
Standard Deviation of Economic Value
Efficient Frontier

11
Comparison of Corporate Strategies
Question:
How should management choose among strategies that are points on the “corporate strategy” Efficient Frontier?
Answer:
Determine two additional strategy-specific measurements from existing DFA results:
- Economic Value Added
- Cost of capital

12
• Definition: portfolio on the “asset-only” Efficient Frontier with the smallest value of
[ (strategy results) - (portfolio results) ]
• Variance of the cost of capital is referred to as the systemic, or non-diversifiable, risk
Cost of Capital

13
• Definition: strategy’s return in excess of the return that would have been generated by the strategy’s cost of capital
• Variance of the EVA is referred to as diversifiable, or non-systemic, risk
• Variance of the EVA is independent of the returns on all other securities in the marketplace
Economic Value Added (EVA) for a Strategy

14
1) Run the DFA model to generate cumulative returns for each portfolio on the “asset-only” Efficient Frontier
2) Model the corporate strategy in the same DFA scenarios
3) For each portfolio, calculate the initial investment required to minimize the std. dev. of the differences between
a) ending portfolio value and
b) ending market surplus
4) Select the portfolio with the lowest standard deviation of differences - it is the strategy’s basis for the cost of capital
Identifying a Corporate Strategy’s Basis for the Cost of Capital

15
1) Generate cumulative returns for each portfolio
Identifying a Corporate Strategy’s Basis for the Cost of Capital
Scenario Portfolio A Portfolio B Portfolio C Portfolio D
1 1.065 1.112 1.125 1.115
2 1.069 1.079 1.051 1.052
3 1.031 1.051 1.061 1.095
4 1.070 1.059 1.092 1.113
5 1.058 1.045 1.101 1.145
1.059 1.069 1.086 1.104
0.0161 0.0272 0.0301 0.0342
Cumulative Return Factors

16
2) Model the corporate strategy in the same DFA scenarios
Identifying a Corporate Strategy’s Basis for the Cost of Capital
Scenario Portfolio A Portfolio B Portfolio C Portfolio D
1 1.065 1.112 1.125 1.115 1,487,995
2 1.069 1.079 1.051 1.052 1,232,381
3 1.031 1.051 1.061 1.095 1,138,587
4 1.070 1.059 1.092 1.113 1,279,724
5 1.058 1.045 1.101 1.145 1,271,275
Ending Market Surplus
Cumulative Return Factors

17
3) For each portfolio, calculate the initial investment required
Identifying a Corporate Strategy’s Basis for the Cost of Capital
Scenario Portfolio A Portfolio B Portfolio C Portfolio D
1 1.065 1.112 1.125 1.115 1,487,995
2 1.069 1.079 1.051 1.052 1,232,381
3 1.031 1.051 1.061 1.095 1,138,587
4 1.070 1.059 1.092 1.113 1,279,724
5 1.058 1.045 1.101 1.145 1,271,275
Initial Investment
1,211,755 1,200,164 1,182,207 1,161,338
Ending Market Surplus
Cumulative Return Factors

18
4a) Calculation of Ending Asset Values for Each Portfolio
Identifying a Corporate Strategy’s Basis for the Cost of Capital
Scenario Portfolio A Portfolio B Portfolio C Portfolio D
1 1,290,124 1,335,034 1,329,848 1,294,892 1,487,995
2 1,295,276 1,295,270 1,241,921 1,221,727 1,232,381
3 1,249,257 1,261,289 1,254,034 1,271,665 1,138,587
4 1,296,506 1,271,206 1,291,127 1,292,184 1,279,724
5 1,282,039 1,254,386 1,301,221 1,329,732 1,271,275
Accumulated Value= Initial Investment * Cumulative Return Factor
Ending Market Surplus

19
4b) The basis for the cost of capital is the portfolio with the lowest standard deviation of differences
Identifying a Corporate Strategy’s Basis for the Cost of Capital
Scenario Portfolio A Portfolio B Portfolio C Portfolio D
1 197,871 152,961 158,147 193,103 1,487,995
2 -62,895 -62,889 -9,540 10,654 1,232,381
3 -110,670 -122,702 -115,447 -133,078 1,138,587
4 -16,782 8,518 -11,403 -12,460 1,279,724
5 -10,764 16,889 -29,946 -58,457 1,271,275
118,061 103,399 99,318 121,124
Difference= Ending Market Surplus – Accumulated Value
Ending Market Surplus

20
From: CAS Task Force on Fair Value Liabilities
• “An alternative approach to computing the underwriting beta is to regress accounting underwriting returns in a line of business on stock market returns. The method suffers from the weakness that the reported underwriting returns often contain values for the liabilities that have been smoothed over the underwriting cycle, thus depressing their variability.”

21
Comparison
• CAS Fair Value Approach:
• A weighted average of an asset beta and an underwriting beta.
• Regression technique applied to empirical underwriting results
• Isaac/Babcock Approach
• Directly estimate total company Cost of Capital
• Regression technique applied to modeled total company results

22
• Comparison of strategy’s returns with portfolio benchmarks’ market returns
• Allows comparison of different companies
• Eliminates the advantage of changing the valuation of certain assets and/or liabilities
Preference of Market-Based Values over Accounting Values

23
Identifying an Optimal Corporate Strategy
• For each strategy under consideration:
- Run the strategy through the DFA model
- Identify the benchmark that best matches the strategy’s results (i.e., the strategy’s basis for the cost of capital)
- Calculate the cumulative EVA (compared to the benchmark)
• Select the strategy with the largest cumulative EVA

24
Identifying an Optimal Corporate Strategy
Scenario Strategy X Strategy Y Strategy Z
1 1,237,995 1,487,995 1,337,995
2 1,252,381 1,232,381 1,082,381
3 1,258,587 1,138,587 1,458,587
4 1,279,724 1,279,724 1,399,724
5 1,191,275 1,271,275 1,191,275 1,243,992 1,281,992 1,293,992 33,073 128,046 154,545
Portfolio A C D
EVA 53,182 60,477 52,067
Ending Market Surplus

25
• Beyond the Frontier: Using a DFA Model to Derive the Cost of Capital by Daniel Isaac FCAS and Nathan
Babcock ACAS
• http://www.casact.org/coneduc/reinsure/astin/2000/handouts/handouts.htm
• EVA http://www.sternstewart.com/evaabout/whatis.shtml
• Underwriting Beta http://www.casact.org/research/tffvl/app02.pdf
References

CON N I N G
C O N N I N G A S S E T M A N A G E M E N T
Beyond the Efficient Frontier:
Using a DFA Model to Derive the Cost of Capital
April 15-16, 2002