Beyond synoptic timescales - · • Precipitation band is tilted northwestward. ... TC genesis ....
36
Beyond synoptic timescales Topic 5.3 Intraseasonal time scales Working Group Hyemi Kim (SUNY-Stony Brook Univ, US), James Belanger (Georgia Tech, US) Eric Blake (NHC/NOAA, US) Savin S. Chand (Federation University, Australia) Prashant Goswami (C-MMACS, India) Myong-In Lee (UNIST, Korea) IWTC8, Dec-06-2014 Kazuyoshi Oouchi (JAMSTEC, Japan) Jae-Kyung Schemm (CPC/NOAA, US) Michael Ventrice (WSI, US) Bin Wang (UH, US) Liguang Wu (NUIST, China) Adam Sobel (Topic Chair)
Transcript of Beyond synoptic timescales - · • Precipitation band is tilted northwestward. ... TC genesis ....

Beyond synoptic timescales
Topic 5.3 Intraseasonal time scales
Working Group
Hyemi Kim (SUNY-Stony Brook Univ, US),
James Belanger (Georgia Tech, US)
Eric Blake (NHC/NOAA, US)
Savin S. Chand (Federation University, Australia)
Prashant Goswami (C-MMACS, India)
Myong-In Lee (UNIST, Korea)
IWTC8, Dec-06-2014
Kazuyoshi Oouchi (JAMSTEC, Japan)
Jae-Kyung Schemm (CPC/NOAA, US)
Michael Ventrice (WSI, US)
Bin Wang (UH, US)
Liguang Wu (NUIST, China)
Adam Sobel (Topic Chair)
Main Progresses during the past 4 years
• Improved understanding of the impact of the intra-seasonal modes (MJO/BSISO, equatorial waves, MJO-ENSO) on TC activity.
• Improvement in the simulation and prediction of the intra-seasonal modes and its impact on TC activity.
• Operational sub-seasonal TC forecasts.

Main sources of intraseasonal TC predictability
• Madden Julian Oscillation (MJO)
• Boreal Summer ISO (BSISO)
• Equatorial waves
• Quasi-biweekly oscillation (QBWO)
• Combined effects (MJO-ENSO)

10 days interval
Madden (2003)
Dr. Adrian Matthews webpage: http://envam1.env.uea.ac.uk/mjo.html
Madden Julian Oscillation (MJO)
MJO cycle: Precipitation

Dr. Adrian Matthews webpage: http://envam1.env.uea.ac.uk/mjo.html
Madden Julian Oscillation (MJO)
MJO cycle: Precipitation
Lin et al. (2006)
MJO teleconnection

Real-time Multivariate MJO (RMM) index
OLR
U850 U200
• Variables: 15S-15N mean OLR, u850, and u200 (unfiltered) • Minimal prior removal of lower-frequency variability
• The PCs of leading EOFs are RMM1 and RMM2
Wheeler and Hendon (2004)
EOF modes MJO composite
Kikuchi et al. (2011)

MJO and Boreal Summer ISO (BSISO)
Number of days/month
• The major centers of BSISO is shifted to Asian-Pacific summer monsoon regions.
• Prominent northward propagation prevail in the northern Indian monsoon region, and northwestward propagation over the WNP.
• Precipitation band is tilted northwestward.
• For many applications it is instructive to consider the tropical ISO by MJO and BSISO.
MJO composite
Kikuchi et al. (2011)
BSISO composite

OLR and 850-hPa wind anomalies (30–60-day filtered)
Cyclogenesis Parenthesis: # of TCs
Li and Zhou (2013a)
• Cyclogenesis is statistically enhanced in the convective phases of the MJO, while it is suppressed in the non-convective phases.
Western North Pacific: TC-MJO
TC genesis

Western North Pacific: TC-MJO
Li and Zhou (2013b) • TC tracks exhibit distinctive differences in different MJO phases. • TCs have a higher probability of landfall in the convective phases of the MJO. • Strengthening of the monsoon trough favorable environment for cyclogenesis
TC tracks and landfall locations

• TD-type disturbances exert their greatest relative influence on the number of storms.
• TC activity is enhanced when these equatorial waves are present during the coincident active phases of the MJO. Schreck et al. (2012)
Red: active MJO Blue: inactive MJO
Percentage of storms (20S-20N) attributed to each wave type
Equatorial waves and global TC genesis

Western North Pacific: TC-Equatorial Waves
Chen and Chou (2014)
Percentage of TC genesis
• TC genesis related to multiple waves are twice as many as those related to a single wave.

North Atlantic: TC-MJO
Genesis locations for storms
Klotzbach (2010)
MJO phase 1-2 MJO phase 6-7
Green dots: storms <64 kt Red dots: major hurricanes
General consensus is that TC activity in the Atlantic is enhanced in MJO Phases 1-3, while it is suppressed in MJO Phases 5-7
(Maloney and Hartmann 2000, Camargo et al. 2009, Belanger et al. 2010, Klotzbach 2010, 2014, Ventrice et al. 2011, 2013)

• Hurricanes are four times more likely when the MJO is located over the Indian Ocean than over the Pacific.
Ventrice et al. (2013)
Indian Ocean Pacific Ocean
JJAS composite VP200 and 200hPa winds
North Atlantic: TC-MJO

• While tropical cyclogenesis can occur within the convective envelop of the CCKW, it is most often observed approximately 2 days after its passage.
Ventrice et al. (2012) Shading: OLR anomalies averaged along 10°N Dot: Tropical cyclogenesis
North Atlantic: TC-CCKW
OLR anomaly composite (1979-2009) Tropical cyclogenesis relative to the Kelvin wave

Chand and Walsh (2010)
Australian/South Pacific
TC genesis locations TC genesis rate
• Five times more cyclones forming in active MJO phase than inactive phase

Chand and Walsh (2010)
Australian/South Pacific
• Five times more cyclones forming in active MJO phase than inactive phase
• This modulation is further strengthened in El Nino phase.
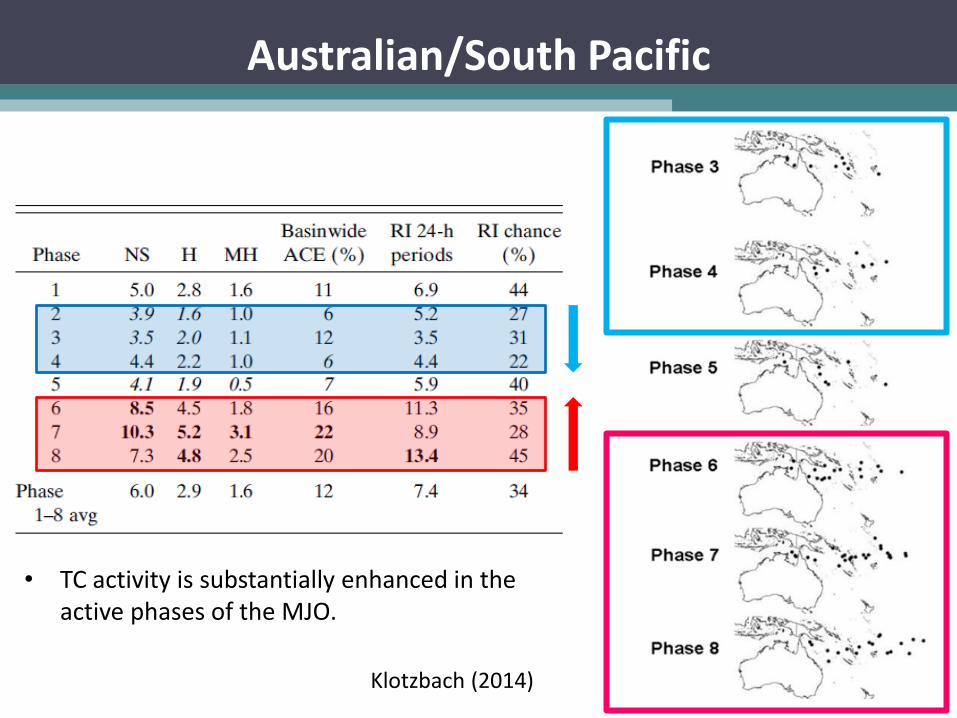
• TC activity is substantially enhanced in the active phases of the MJO.
Australian/South Pacific
Klotzbach (2014)

North Indian Ocean
BSISO and TC activity
Kikuchi and Wang (2010)
• Nearly 60 % of TCs over the Indian Ocean form in association with BSISO events.
• TC formation is enhanced during the wet phases (75 %)
• Most TC formation in phase 8: enhanced convection, low-level cyclonic circulation.
OLR (shading) 850-hPa winds TC genesis (dots)
Wet phase
Wet phase
Wet phase

TC Genesis (dot), Relative Vorticity (shading) RH700 (contour), 850 hPa wind
D. Kim et al. (2014)
Simulation: NASA GEOS-5 (50-km)
OBS GEOS-5
• TC genesis is enhanced by anomalous westerlies, positive relative vorticity, positive relative humidity during the MJO active phase.
MJO phase 5-6

Satoh et al. (2012)
Simulation: NICAM (7-km)
VP200 anomalies (2001-2009)
P3
+4
NICAM OBS
TC genesis number
• The contribution of MJO to cyclogenesis is prominent in P3+4 and 5+6.

Simulation: ECMWF
Tropical storm density (Oct-Mar, 1995-2001)
Vitart (2014)
Observation Reforecast produced in 2011 Reforecast produced in 2002

Sub-seasonal TC forecasts: NHC
http://www.cpc.ncep.noaa.gov/products/precip/CWlink/ghazards/ghaz.shtml
• Week 1-2 forecast: NHC participates in the CPC’s bi-weekly Global Tropical Hazards Assessments by providing guidance on the likelihood of TC genesis.
• Predictand: TC genesis
• Major tools: MJO forecasts from NOAA CPC, long-range ECMWF and GEFS ensemble forecasts, CCKW, circulation anomalies, climatology.
• Forecast process is largely subjective and relies on large-scale pattern (MJO).

NOAA/CPC
• Week 1-4 forecast: Global basins (provide an input for the Global Tropical Hazards Outlook )
• Predictand: Number of storms, track location
• Major tools: CFSv2 16-member ensemble forecasts produced daily
• TC detection/tracking: Camargo and Zebiak (2002)
• CFSv2 45day hindcasts (1999-2010)
TS Count (correlation) ATL
WNP
Week 4 Corr=0.63
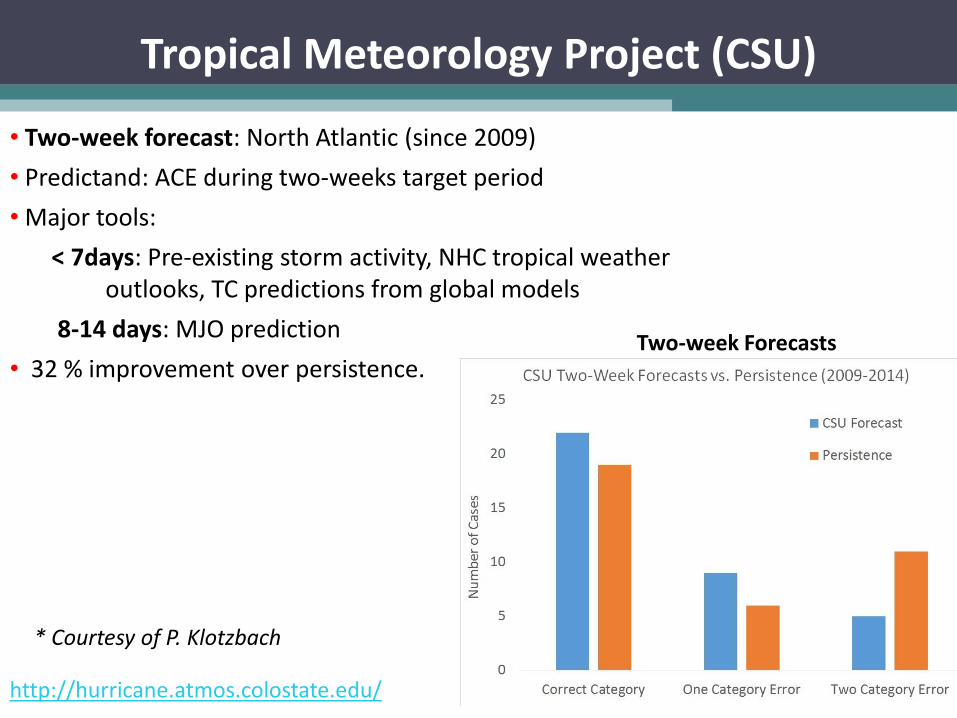
Tropical Meteorology Project (CSU)
http://hurricane.atmos.colostate.edu/
• Two-week forecast: North Atlantic (since 2009)
• Predictand: ACE during two-weeks target period
• Major tools:
< 7days: Pre-existing storm activity, NHC tropical weather outlooks, TC predictions from global models
8-14 days: MJO prediction
• 32 % improvement over persistence.
* Courtesy of P. Klotzbach
Two-week Forecasts
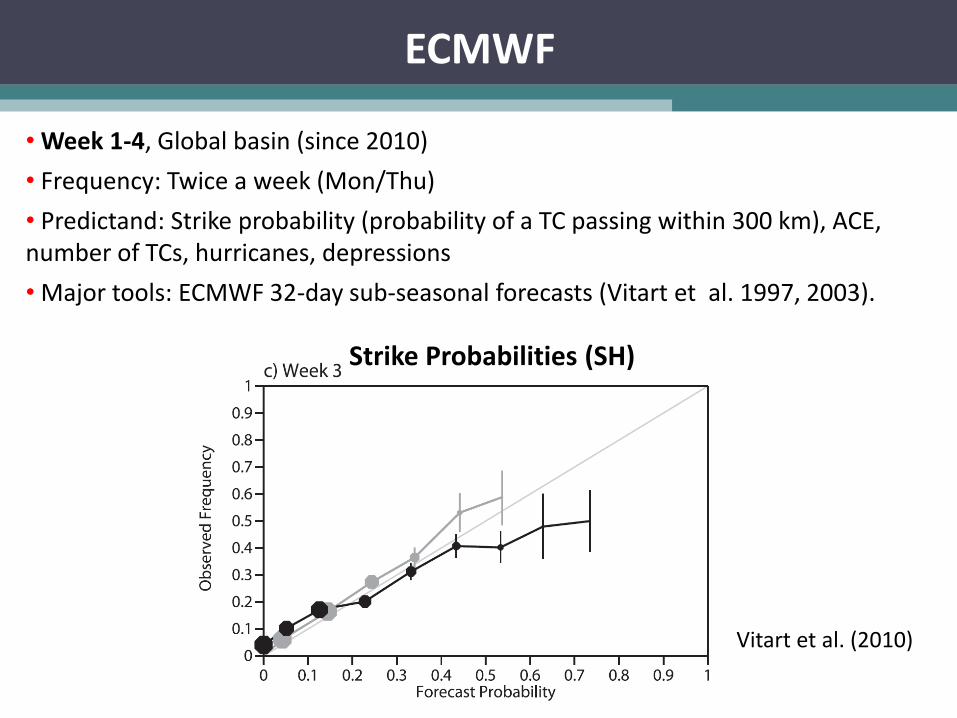
Vitart et al. (2010)
ECMWF
Strike Probabilities (SH)
• Week 1-4, Global basin (since 2010)
• Frequency: Twice a week (Mon/Thu)
• Predictand: Strike probability (probability of a TC passing within 300 km), ACE, number of TCs, hurricanes, depressions
• Major tools: ECMWF 32-day sub-seasonal forecasts (Vitart et al. 1997, 2003).

* Courtesy of F. Vitart
TC forecast in 2014 (Vongfong)
2 weeks forecast OBS (Vongfong, 02~14 Oct)
• The model predicted 2 weeks in advance relatively high probability of TC strike over Japan
Weekly Mean TC Strike Probabilities
ECMWF

CFAN: Monthly Probabilistic Track Verification
• Raw monthly forecast probabilities never exceed 30% and agree with observations only 20% of the time
• For calibrated forecasts when the MJO is in Phases 1–3, maximum forecast probabilities reach 50–60% and agree with observations 30–40% of the time
• CFAN’s ROC score is 36% greater than ECMWF Monthly forecast system and 5% greater than18-year climatology
ROC Score (# of Forecasts)
18-Year Climate
ECMWF Monthly
CFAN
All Dates (88) 0.75 0.57 0.78
MJO 1-3 (24) 0.82 0.61 0.84
MJO 4-5 (15) 0.70 0.52 0.71
MJO 6-8 (9) 0.66 0.59 0.75
Weak MJO (40) 0.73 0.55 0.77

Capability of MJO forecast
Dynamical MJO prediction skill
(Chen and Alpert 1990, Jones et al. 2000, Hendon et al. 2000, Waliser et al. 2003, Seo et al. 2005, 2009, Pegion and Kirtman 2008, Lin et al. 2008, Vitart and Molteni 2010, Weaver et al. 2011, Arribas et al. 2011, Fu et al. 2011, 2013, Rashid et. al.,2011, Kang et al. 2013, Ham et al. 2013, Kim et. al. 2014, Neena et al. 2014, Vitart 2014, Wang et al. 2014)
Lead time (weeks)
Statistical models

Neena et al. (2014)
~ 2 weeks ~ 2-4 weeks ~ 3-5 weeks ~ 5-7 weeks
* ISVHE (Intraseasonal Variability Hindcast Experiment)
Capability of MJO forecast

CFSv1 : ~15 days (Seo et al. 2009)
NCEP CFSv2
Capability of MJO forecast
MJO prediction skill (RMM index)
(Wang et al. 2014)
NICAM
Miyakawa et al. (2014)

Predictability
Prediction skill (ensemble mean)
Kim et al. (2014)
Capability of MJO forecast
MJO prediction skill (RMM index)

MJO Maritime Continent Prediction barrier
CFSv2 shows sharp decrease in skill at phase 1 and 5
deficiency in predicting the enhanced (or
suppressed) convective signal associated with the MJO
over the Maritime Continent.
MJO composite
Kim et al. (2014)
MJO Prediction skill by target MJO phase

* dots: 5-days interval
MJO composite
Slow propagation speed
Rapid drop of MJO amplitude
Maritime Continent barrier
Kim et al. (2014)
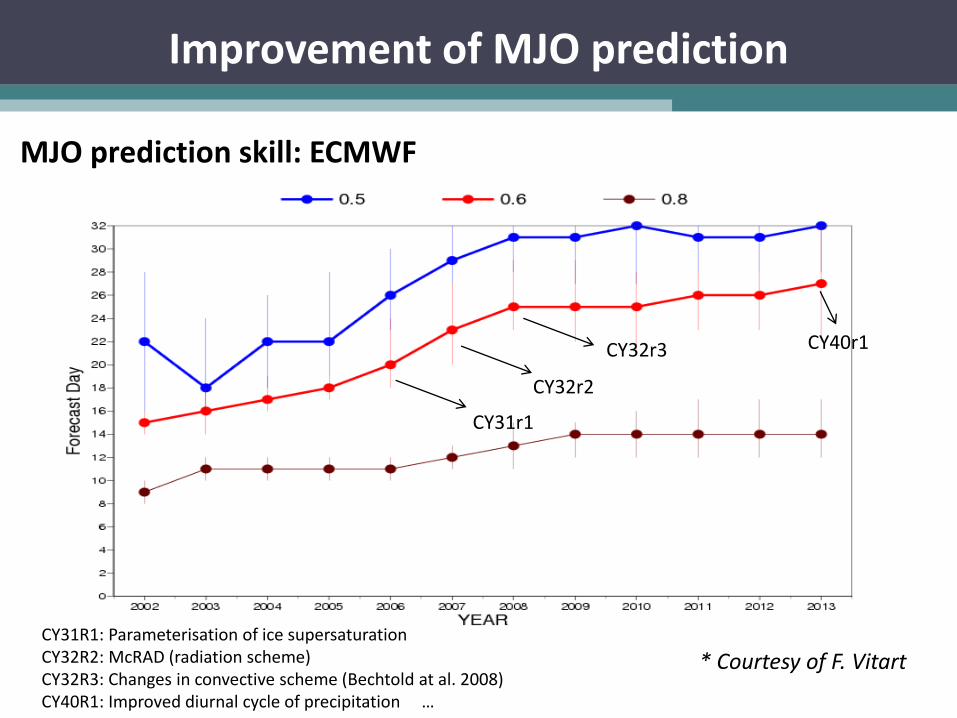
CY31r1
CY32r2
CY32r3
CY31R1: Parameterisation of ice supersaturation CY32R2: McRAD (radiation scheme) CY32R3: Changes in convective scheme (Bechtold at al. 2008) CY40R1: Improved diurnal cycle of precipitation …
CY40r1
* Courtesy of F. Vitart
Improvement of MJO prediction
MJO prediction skill: ECMWF

Improvement of MJO prediction
40R1
40R3
Improvement due to revised organised convective detrainment term and the revised convective momentum transport. * Courtesy of F. Vitart
MJO prediction skill: ECMWF

Main Progresses during the past 4 years
• Improved understanding of the impact of the intra-seasonal modes (MJO/BSISO, equatorial waves, MJO-ENSO) on TC activity
• Improvement in the simulation of the MJO and its impact on TCs activity
• Enhanced dynamical MJO prediction skill (4-5 weeks)
Summary