Beyond GDP: Measuring What Counts for Economic and Social...
143
Beyond GDP: Measuring What Counts for Economic and Social Performance
Transcript of Beyond GDP: Measuring What Counts for Economic and Social...

Beyond GDP:
Measuring What Counts for Economic
and Social Performance
BEYOND GDP: MEASURING WHAT COUNTS FOR ECONOMIC AND SOCIAL PERFORMANCE © OECD 2018
Please leave this page blank. PAC will complete this page.
PREFACE │ 3
BEYOND GDP: MEASURING WHAT COUNTS FOR ECONOMIC AND SOCIAL PERFORMANCE © OECD 2018
Preface
This short book provides our personal perspective, as Chairs of the OECD-hosted High-
Level Group on the Measurement of Economic Performance and Social Progress
(HLEG), on the most salient issues discussed by the Group over the past five years (from
2013 to 2018). Over this period, the HLEG periodically convened to discuss many of the
issues that are reflected in this book. The HLEG, whose members are listed in Box 1
below, was created to pursue the work of the Commission on the Measurement of
Economic Performance and Social Progress convened by former French President
Nicolas Sarkozy in 2008 (the “Stiglitz-Sen-Fitoussi Commission”). A companion report,
For Good Measure: Advancing Research on Well-being Metrics Beyond GDP, provides a
series of authored chapters, prepared by some HLEG members, on those topics that have
been the focus of the HLEG work, and which are also discussed here.
While this book presents our own perspective on the deliberations of the HLEG, it rests
on the enormous contributions of its members; not just the authored chapters in the
companion report but the extensive discussions and deliberations, both in our plenary
meetings and in the thematic workshops. Full credit needs to be given to the HLEG
members for their huge intellectual contributions, which are reshaping how we think
about the measurement of economic performance and social progress.
Any Group of this kind, dealing with complex and important issues, faces an insoluble
dilemma. To get agreement among all HLEG members on all the salient issues is
extraordinarily difficult and time consuming. As we undertook this new phase of the
work, with greater constraints and higher ambitions, the Group decided to have authored
chapters on each of the topics upon which it would focus – with the hope that each of
these chapters would take into account the deliberations and comments of other HLEG
members.
At the same time, we believed it important to provide an overview of the issues that we
discussed. The Group therefore agreed that there would be a Chairs’ summary, reflecting
and taking into account the views of all members of the HLEG. It was understood that not
every member would agree with each of our interpretations of the issues. Some members
might not even agree that we have captured accurately the spirit of our deliberations
though, based on the feedback we have received from members, we are confident that we
have been able to strike a good balance.
We feel remiss that we have not been able to give individual credit to each of the ideas
that each HLEG member has contributed. They have been selfless in their dedication to
this project, and we are deeply grateful. All we can say is “thank you”.
Our thanks also go to the OECD, for having hosted the work of the HLEG during this 5-
year period, to the many foundations and organisations who hosted and financially
supported the organisation of the thematic workshops, and to the many researchers who
attended these workshops and shared with us their expertise on these subjects. These
workshops have focused on:
4 │ PREFACE
BEYOND GDP: MEASURING WHAT COUNTS FOR ECONOMIC AND SOCIAL PERFORMANCE © OECD 2018
“Intra-generational and Inter-generational Sustainability” (22-23 September
2014), Rome, hosted by the Einaudi Institute for Economics and Finance and the
Bank of Italy and sponsored by SAS;
“Multi-dimensional Subjective Well-being” (30-31 October 2014), Turin,
organised in collaboration with the International Herbert A. Simon Society and
Collegio Carlo Alberto, and with the support of Compagnia di San Paolo;
“Inequality of Opportunity” (14 January 2015), Paris, hosted by the Gulbenkian
Foundation in collaboration with Sciences-Po Paris and the CEPREMAP;
“Measuring Inequalities of Income and Wealth” (15-16 September 2015), Berlin,
organised in collaboration with Bertelsmann Stiftung;
“Measurement of Well-being and Development in Africa” (12-14 November
2015), Durban, South Africa, organised in collaboration with the Government of
South Africa, the Japanese International Cooperation Agency, Columbia
University and Cornell University;
“Measuring Economic, Social and Environmental Resilience” (25-26 November
2015), Rome, hosted by the Einaudi Institute for Economics and Finance,
supported by the Bank of Italy and Istat, and sponsored by SAS;
“Economic Insecurity: Forging an Agenda for Measurement and Analysis”
(4 March 2016), New York, organised in collaboration with the Washington
Center for Equitable Growth, the Yale Institution for Social and Policy Studies,
and the Ford Foundation; and
“Measuring Trust and Social Capital” (10 June 2016), Paris, organised in
collaboration with Science-Po Paris and the European Research Council.
We would like to express our special thanks to a number of colleagues who have
supported our work throughout this period: Marco Mira d’Ercole, for his many valuable
inputs to this book; Elizabeth Beasley, for acting as rapporteur of the authored volume;
Martine Zaïda, for co-ordinating the HLEG and organising all the thematic workshops
and plenary meetings; Patrick Love, for his inputs and for editing the books; Christine Le
Thi for statistical assistance; and Anne-Lise Faron, for preparing these books for
publication.
PREFACE │ 5
BEYOND GDP: MEASURING WHAT COUNTS FOR ECONOMIC AND SOCIAL PERFORMANCE © OECD 2018
Box 1. High-Level Group on the Measurement of Economic Performance and Social
Progress
Chairs
Joseph E. Stiglitz, Professor of Economics, Business and International Affairs,
Columbia University
Jean-Paul Fitoussi, Professor of Economics at Sciences-Po, Paris and Luiss
University, Rome
Martine Durand, Chief Statistician, OECD
Members
Yann Algan, Professor of Economics, Sciences-Po, Paris
François Bourguignon, Paris School of Economics
Angus Deaton, Senior Scholar and Dwight D. Eisenhower Professor of
Economics and International Affairs Emeritus, Woodrow Wilson School of
Public and International Affairs and Economics Department, Princeton University
Enrico Giovannini, Professor of Economic Statistics, University of Rome Tor
Vergata
Jacob Hacker, Director of the Institution for Social and Policy Studies, and
Stanley B. Resor Professor of Political Science, Yale University
Geoffrey Heal, Garrett Professor of Public Policy and Corporate Responsibility,
Professor of Economics and Finance, Columbia University Graduate School of
Business; Director of the Earth Institute Center for Economy, Environment, and
Society, Columbia University
Ravi Kanbur, T.H. Lee Professor of World Affairs, International Professor of
Applied Economics and Management and Professor of Economics, Cornell
University
Alan Krueger, Bendheim Professor of Economics and Public Affairs, Princeton
University
Nora Lustig, Samuel Z. Stone Professor of Latin American Economics, Tulane
University
Jil Matheson, Former United Kingdom National Statistician
Thomas Piketty, Professor, Paris School of Economics
Walter Radermacher, Former Director-General, Eurostat
Chiara Saraceno, Honorary fellow at the Collegio Carlo Alberto, Turin
Arthur Stone, Senior Behavioral Scientist, Professor of Psychology, University of
Southern California
Yang Yao, Director of CCER and Dean of National School of Development,
Peking University
Rapporteurs
Marco Mira d’Ercole, OECD
Elizabeth Beasley, CEPREMAP and Sciences-Po

FOREWORD │ 7
BEYOND GDP: MEASURING WHAT COUNTS FOR ECONOMIC AND SOCIAL PERFORMANCE © OECD 2018
Foreword
The release of the Report by the Commission on the Measurement of Economic
Performance and Progress in September 2009, was a defining moment. During his
presentation of the Report, the then President of France, Nicolas Sarkozy said: “In today’s
circumstances, this report is important not just technically (but) also politically. It deals
with questions that concern not only economists, statisticians and accountants, but also
politics, and as a consequence, the whole world”. The Report’s key message was simple:
change the focus of our statistics from measuring the size of economic production, which
is what GDP is about, to measuring what shapes the well-being of people today and that
of future generations. This change of perspective is crucial, in the words of Nobel
laureate Joseph E. Stiglitz – one of the Commission’s chairs: “What you measure affects
what you do”.
This message resonated well with the OECD where statistics are at the core of our
evidence-based policy advice, and where, as early as 2004, we had been advocating for
the expansion of our measurement frameworks to capture, not only aggregate economic
performance, but also people’s quality of life. So we were well-placed to follow-up on
President Sarkozy’s call that the OECD should play a critical role in implementing the
Commission’s recommendations at the international level. In 2011, we adopted our new
motto “Better Policies for Better Lives” and we launched the OECD Better Life Initiative
which has played a key role in advancing the “Beyond GDP” agenda, through our
flagship publication How’s Life? and the OECD Better Life Index.
Our contribution has not been limited to measures and statistics though. In 2012, in the
aftermath of the devastating crisis, we launched the New Approaches to Economic
Challenges (NAEC) Initiative, an organisation-wide reflection on why we did not see the
warning signs, and in what ways we could change our “GPS” (our data, our models and
our tools) in order to establish the basis of a better way for analysing economic challenges
and improving our policy advice. Moreover, in the same year, we launched our Inclusive
Growth project, aimed at jointly analysing “growth” and “inequality”, which had, until
then, been looked at separately, sometimes leading to inconsistent policy
recommendations. Building on this work, this year we launched the OECD Framework
for Policy Action on Inclusive Growth which aims to guide policy-makers in designing
policies that distribute the benefits of growth more equally, and to give people a fair
chance to achieve their full potential. While we may not have travelled the full distance,
we are now better equipped to address today’s realities and challenges. For these reasons,
I very much supported the suggestion of our Chief Statistician, Martine Durand, that the
OECD was the ideal place to “host” an independent group of experts, convened by
Joseph E. Stiglitz and Jean-Paul Fitoussi, to maintain the momentum of the 2009
Commission and provide further direction to the “Beyond GDP” agenda.
This book provides an overview by the chairs of the OECD-hosted High-Level Group on
the Measurement of Economic Performance and Social Progress (HLEG), summarising
almost five years of work. I would like to thank Joseph E. Stiglitz, Jean-Paul Fitoussi and
Martine Durand for their leadership, and all HLEG members for their dedication and
contributions.
8 │ FOREWORD
BEYOND GDP: MEASURING WHAT COUNTS FOR ECONOMIC AND SOCIAL PERFORMANCE © OECD 2018
I very much hope that the views expressed in this book – and in the companion report For
Good Measure: Advancing Research on Well-being Metrics Beyond GDP, a collection of
authored chapters by HLEG members – which are offered in the authors’ personal
capacity, will have the same significant influence in the economic and statistical
community as those of the 2009 Stiglitz-Sen-Fitoussi Commission. It is only by having
better metrics that truly reflect people’s lives and aspirations that we will be able to
design and implement “better policies for better lives”.
Angel Gurría
OECD Secretary-General
TABLE OF CONTENTS │ 9
BEYOND GDP: MEASURING WHAT COUNTS FOR ECONOMIC AND SOCIAL PERFORMANCE © OECD 2018
Table of contents
Preface .................................................................................................................................................... 3
Foreword ................................................................................................................................................ 7
Executive Summary ............................................................................................................................ 13
Chapter 1. The continued importance of the “Beyond GDP” Agenda ........................................... 17
1.1. Introduction ................................................................................................................................. 18 1.2. GDP statistics and the Great Recession ...................................................................................... 20 1.3. The Commission and its central recommendations .................................................................... 22 1.4. An array of problems .................................................................................................................. 23 1.5. A national dialogue ..................................................................................................................... 26 1.6. Key changes in the world ............................................................................................................ 27 1.7. Advances in data availability ...................................................................................................... 32 1.8. Policy implications of “Beyond GDP” metrics........................................................................... 33 1.9. Conclusions ................................................................................................................................. 33 Notes .................................................................................................................................................. 35
Chapter 2. The measurement of economic downturns .................................................................... 39
2.1. Introduction ................................................................................................................................. 40 2.2. The right choice of metrics ......................................................................................................... 40 2.3. Missing wealth ............................................................................................................................ 41 2.4. Economic security and subjective well-being ............................................................................. 46 2.5. Economies never fully recover from a deep downturn ............................................................... 47 2.6. The misuse of existing metrics: A misplaced focus on government liabilities ........................... 48 2.7. Unemployment: A partial view of available labour resources .................................................... 51 2.8. Conclusions ................................................................................................................................. 53 Notes .................................................................................................................................................. 54
Chapter 3. The need to follow up on the Stiglitz-Sen-Fitoussi Commission .................................. 59
3.1. Introduction ................................................................................................................................. 60 3.2. Sustainable Development Goals: How to measure progress in poorer countries ....................... 60 3.3. Inequalities in income and wealth ............................................................................................... 62 3.4. Macro- and micro-level statistics on household economic resources ......................................... 70 3.5. Horizontal inequalities ................................................................................................................ 71 3.6. Inequality of opportunity ............................................................................................................ 72 3.7. Subjective well-being.................................................................................................................. 76 3.8. Economic insecurity ................................................................................................................... 81 3.9. Sustainability .............................................................................................................................. 87 3.10. Social capital and trust .............................................................................................................. 92 3.11. Conclusions ............................................................................................................................... 98 Notes .................................................................................................................................................. 98
Chapter 4. Country-experiences with using well-being indicators to steer policies .................... 103
4.1. Introduction ............................................................................................................................... 104
10 │ TABLE OF CONTENTS
BEYOND GDP: MEASURING WHAT COUNTS FOR ECONOMIC AND SOCIAL PERFORMANCE © OECD 2018
4.2. Using well-being indicators in policy-making .......................................................................... 104 4.3. Selected countries’ experiences with implementing well-being indicators in the policy cycle 108 4.4. Use of subjective well-being data in policy analysis ................................................................ 112 4.5. Conclusions ............................................................................................................................... 113 Notes ................................................................................................................................................ 114
Chapter 5. Twelve recommendations on the way ahead in measuring well-being ...................... 115
Bibliography....................................................................................................................................... 119
Annex A. Taking stock of progress in the “Beyond GDP” measurement agenda since the 2009
Commission report ............................................................................................................................ 129
National initiatives ........................................................................................................................... 129 International initiatives .................................................................................................................... 132 Communicating information on well-being ..................................................................................... 134 Notes ................................................................................................................................................ 143
Tables
Table 3.1. From the MDGs to the SDGs ............................................................................................... 60 Table 4.1. Mechanisms and frameworks for integrating well-being metrics into policy-making in
selected countries ........................................................................................................................ 109
Table A.1. Selected national well-being measurement initiatives and indicator sets .......................... 136 Table A.2. Well-being indicators included in How’s Life? 2017 ........................................................ 138
Figures
Figure 1.1. People’s trust in the United States federal government ...................................................... 22 Figure 1.2. Productivity trends .............................................................................................................. 32 Figure 2.1. Actual and projected GDP per capita, the United States and the euro area ........................ 43 Figure 2.2. Public and private expenditures in education and health-care ............................................ 45 Figure 2.3. Unemployment and labour underutilisation ........................................................................ 52 Figure 2.4. Unemployment rates by age ................................................................................................ 53 Figure 3.1. Cumulative gains in real income growth around the world, 1988-2008 ............................. 64 Figure 3.2. The Lorenz curve for income .............................................................................................. 69 Figure 3.3. Gender earnings gap and adjusted earnings gap in a meta-analysis of the literature .......... 76 Figure 3.4. Trends in subjective well-being in Egypt ............................................................................ 77 Figure 3.5. Average, range and evolution of the incidence of large income losses across countries .... 86 Figure 3.6. Trust in others around the world ......................................................................................... 94 Figure 4.1. The policy cycle ................................................................................................................ 108
Figure A.1. The OECD well-being framework ................................................................................... 133 Figure A.2. The OECD’s How’s Life? assessment of the comparative strengths and weaknesses in
average levels of current well-being, the Netherlands ................................................................ 135
Boxes
Box 1. High-Level Group on the Measurement of Economic Performance and Social Progress ........... 5
TABLE OF CONTENTS │ 11
BEYOND GDP: MEASURING WHAT COUNTS FOR ECONOMIC AND SOCIAL PERFORMANCE © OECD 2018
Box 4.1. Stages in the policy cycle at which well-being indicators and evidence can be used ........... 107 Box 5.1. Recommendations by the Chairs of the HLEG ..................................................................... 117
Box A.1. Public consultations within national measurement initiatives ............................................. 130 Box A.2. The OECD Better Life Initiative .......................................................................................... 132
Look for the StatLinks2at the bottom of the tables or graphs in this book.
To download the matching Excel® spreadsheet, just type the link into your
Internet browser, starting with the http://dx.doi.org prefix, or click on the link from
the e-book edition.
Follow OECD Publications on:
This book has... StatLinks2A service that delivers Excel® files from the printed page!
http://twitter.com/OECD_Pubs
http://www.facebook.com/OECDPublications
http://www.linkedin.com/groups/OECD-Publications-4645871
http://www.youtube.com/oecdilibrary
http://www.oecd.org/oecddirect/Alerts
OECD

EXECUTIVE SUMMARY │ 13
BEYOND GDP: MEASURING WHAT COUNTS FOR ECONOMIC AND SOCIAL PERFORMANCE © OECD 2018
Executive Summary
The High-Level Expert Group on the Measurement of Economic Performance and Social
Progress (HLEG) builds on the analyses and recommendations of the 2009 Commission
on the Measurement of Economic Performance and Social Progress (the “Stiglitz-Sen-
Fitoussi” Commission, SSF) in highlighting the role of well-being metrics in policy and
encouraging a more active dialogue between economic theory and statistical practice. The
report makes explicit the often-implicit assumptions hidden in statistical practices and
their real-world consequences. Its central message is that what we measure affects what
we do. If we measure the wrong thing, we will do the wrong thing. If we don’t measure
something, it becomes neglected, as if the problem didn’t exist.
There is no simple way of representing every aspect of well-being in a single number in
the way GDP describes market economic output. This has led to GDP being used as a
proxy for both economic welfare (i.e. people’s command over commodities), and general
welfare (which also depends on people’s attributes and non-market activities). GDP was
not designed for this task. We need to move “Beyond GDP” when assessing a country’s
health, and complement GDP with a broader dashboard of indicators that would reflect
the distribution of well-being in society and its sustainability across its social, economic
and environmental dimensions. The challenge is to make the dashboard small enough to
be easily comprehensible, but large enough to summarise what we care about the most.
The 2008 crisis and its aftermath illustrate why a change in perspective is needed. The
GDP loss that followed the crisis was not the temporary one-off event predicted by
conventional macro-economic models. Its effects have lasted over time, suggesting that
the crisis caused the permanent loss of significant amounts of capital; not just machines
and structures, but also “hidden capital”, in the form of lower on-the-job training,
permanents scars on youths entering the labour market during a recession, and lower trust
in an economic system “rigged” to benefit a few.
Different metrics, including better measures of people’s economic insecurity, could have
shown that the consequences of the recession were much deeper than GDP statistics
indicated, and governments might have responded more strongly to mitigate the negative
impacts of the crisis. If, based on GDP, the economy is perceived to be well on the road
to recovery, as many governments believed in 2010, one would not take the strong policy
measures needed to support people’s living conditions suggested by metrics that inform
on whether most of the population still feels in recession. Nor would one take measures to
bolster the safety net and social protection in the absence of metrics on the extent of
people’s economic insecurity.
These failings in the policy responses to the crisis were compounded by overly focusing
on the consequences of public spending in raising government’s liabilities, when this
spending could take the form of investment increasing the assets in governments’ and
countries’ balance sheets. The same follows when measures of unemployment do not
reflect the full extent of a country’s “unused” labour resources. The “Beyond GDP”
14 │ EXECUTIVE SUMMARY
BEYOND GDP: MEASURING WHAT COUNTS FOR ECONOMIC AND SOCIAL PERFORMANCE © OECD 2018
agenda is sometimes characterised as “anti-growth”, but this is not the case: the use of a
dashboard of indicators reflecting what we value as a society would have led, most likely,
to stronger GDP growth than that actually achieved by most countries after 2008.
This book also looks at progress in implementing the recommendations of SSF since
2009, identifying areas that require increased focus by statistical agencies, researchers
and policy-makers. The UN Sustainable Development Goals, agreed by the international
community in 2015, clearly go far “Beyond GDP”, but their 169 policy targets and more
than 200 indicators for “global monitoring” are too many to guide policies. Countries will
have to identify their priorities within the broader UN agenda, and upgrade their
statistical capacities which, even in developed countries, are insufficient to monitor
whether the agreed commitments are being met. The international community should
invest in upgrading the statistical capacity of developing countries, especially in areas
where country data are needed to assess global phenomena, such as climate change or the
world distribution of income.
Inequality in income and wealth has today a central role in policy discussions in ways it
did not in 2009. But important progress is still needed in a range of areas, such as
measuring what happens at both ends of the income distribution, integrating different data
sources, and measuring the joint distribution of income, consumption and wealth at the
individual level. When looking at inequality, it is also important to look at differences
between groups (“horizontal inequalities”), at inequalities within households and the way
resources are shared and managed, which are especially important in the case of wealth.
We should also look beyond inequalities in outcomes to inequality of opportunity.
Inequality of opportunity is even more unacceptable than inequality of outcomes, but the
operational distinction between the two is fuzzy, as we don’t observe all circumstances
that shape people’s outcomes and are independent of their efforts. It is also important to
pursue efforts to integrate information on economic inequalities within national accounts,
to provide metrics of how GDP growth is shared in as timely a fashion as output statistics.
The book also highlights metrics that still lack a solid foundation within official statistics.
Subjective well-being measures are critical to assess the non-monetary costs and benefits
of public programmes and policies. While much progress has been achieved since 2009 in
embedding these measures in large-sample official surveys, such efforts should be
maintained to shed light on the many measurement and research issues that are still open.
Economic insecurity is a “new” field where much more effort is needed to develop
metrics of the shocks affecting people, and of the buffers available to them. The 2008
crisis reduced not just people’s economic security but also their trust, because of the
widespread perception of the unfairness in the manner in which the crisis was handled.
The loss of trust (both in others and in institutions) is a long-lasting legacy of the crisis,
whose effects are contributing to the political upheavals we are witnessing around the
world. Finally, the measurement of sustainability in its environmental, economic and
social dimensions, and of the resilience of systems to shocks, are priorities for research
and statistical practice, requiring the contributions of different disciplines and approaches.
The book provides 12 recommendations for further work in all these areas, which
complement those in the Stiglitz, Sen and Fitoussi (2009) report.
While different measures are clearly needed, alone they are not enough. What also
matters is to anchor these indicators in the policy process, in ways that survive the
vagaries of electoral cycles. This book draws on country-experiences to show how well-
being indicators are being used in the different stages in the policy cycle, from identifying
priorities for action, to assessing the advantages and disadvantages of different strategies
EXECUTIVE SUMMARY │ 15
BEYOND GDP: MEASURING WHAT COUNTS FOR ECONOMIC AND SOCIAL PERFORMANCE © OECD 2018
to achieve a given policy goal, to help allocate the resources needed to implement the
selected strategy, to monitor interventions in real time as they are implemented, and to
audit the results achieved by policies and programmes to help decide how to change them
in the future. Steps taken by several countries in this direction are described in this book.
While these experiences are recent, they hold the promise of delivering policies that, by
going beyond traditional silos, are more effective in achieving their goals and that could
help in restoring people’s trust that public policies can deliver what we all care about: an
equitable and sustainable society.


1. THE CONTINUED IMPORTANCE OF THE “BEYOND GDP” AGENDA │ 17
BEYOND GDP: MEASURING WHAT COUNTS FOR ECONOMIC AND SOCIAL PERFORMANCE © OECD 2018
Chapter 1. The continued importance of the “Beyond GDP” Agenda
This chapter looks at what has changed since the 2009 Commission on the Measurement
of Economic Performance and Social Progress (Stiglitz-Sen-Fitoussi Commission). It
describes the contribution of the High-Level Expert Group on the Measurement of
Economic Performance and Social Progress (HLEG) to moving “Beyond GDP” when
assessing a country’s health, towards a broader dashboard of indicators that would
reflect concerns such as the distribution of well-being and sustainability in all of its
dimensions. The challenge is to make the dashboard small enough to be easily
comprehensible, but large enough to include a summary of what we care about the most.
The chapter argues that what governments measure strongly influences what they do. If
they do not regularly include income inequality or economic insecurity in their
dashboard of indicators, for example, they may not notice that these are getting worse.
The chapter also argues that distorted metrics can lead to misleading assessments, for
example when gauging success solely through the lens of GDP while failing to measure
the potential environmental damages caused by economic activities
18 │ 1. THE CONTINUED IMPORTANCE OF THE “BEYOND GDP” AGENDA
BEYOND GDP: MEASURING WHAT COUNTS FOR ECONOMIC AND SOCIAL PERFORMANCE © OECD 2018
1.1. Introduction
In January 2008, before the Global Financial Crisis, President Sarkozy of France
established a Commission to examine the adequacy of our metrics for assessing economic
performance and social progress. He, like many others before him, was worried that too
much attention was placed on GDP as an over-arching measure of performance. GDP, as
we all know, is a measure of the volume of goods and services produced within a country
over a given period of time. It is not – as it is often used – a measure of a country’s
success.
This is not a new complaint. Just over 50 years ago, Robert Kennedy gave expression to
similar concerns:1
Gross National Product counts air pollution and cigarette advertising, and
ambulances to clear our highways of carnage. It counts special locks for our doors
and the jails for the people who break them. It counts the destruction of the
redwood and the loss of our natural wonder in chaotic sprawl. It counts napalm
and … nuclear warheads and armored cars for the police to fight the riots in our
cities. It counts Whitman’s rifle and Speck’s knife, and the television programs
which glorify violence in order to sell toys to our children. Yet the gross national
product does not allow for the health of our children, the quality of their education
or the joy of their play. It does not include the beauty of our poetry or the strength
of our marriages, the intelligence of our public debate or the integrity of our
public officials. It measures neither our wit nor our courage, neither our wisdom
nor our learning, neither our compassion nor our devotion to our country, it
measures everything in short, except that which makes life worthwhile. (Kennedy,
1968)
In spite of its shortcoming as a measure of a country’s success, GDP has remained its key
proxy. We take measures like GDP for granted – until they fail us. Much of this book is
about the discovery of how this metric has failed us when used for purposes that it was
not designed to address, and about what can and is being done to create measures that
better reflect changes in economic performance and social progress.
It was not until after the Great Depression that governments started to collect the data
necessary to measure GDP. Keynesian economics – which explained the level of
economic output in terms of the demand from different sectors of the economy and
argued that government action could maintain the economy at full employment – made it
imperative to have better indicators in order to assess the state of the economy.2 Two
economists, Simon Kuznets, of the University of Pennsylvania, and Richard Stone, of
Cambridge University, received Nobel Prizes, in part for their contribution in setting up
the System of National Accounts (often abbreviated as SNA) which includes GDP, a
concept developed by Kuznets.
For a while, economics students had to learn the ins and outs of these metrics, the
assumptions that went into them (and why those assumptions were made) and the
limitations of these measures and their uses. GDP and other national accounts indicators
became part of the tool kit of economists. Careers were built trying to explain the
movements of GDP and to show how these movements could help explain that of other
indicators. This trend was reinforced by economists’ growing ability to analyse data
statistically, as a result of better computers.

1. THE CONTINUED IMPORTANCE OF THE “BEYOND GDP” AGENDA │ 19
BEYOND GDP: MEASURING WHAT COUNTS FOR ECONOMIC AND SOCIAL PERFORMANCE © OECD 2018
But, as time went by, and as the sophistication of analysing the inter-relationship among
different data series increased, the attention paid to the data series themselves, and in
particular, to the limitations of GDP as a welfare metric declined. The result was that the
reliability and relevance of results of analysis in areas such as macro-economics that were
heavily reliant on GDP measures may have declined too. The paradox is that those who
built the system knew of its shortcomings and were cautious when using it.3 But as the
general understanding of these indicators and their construction diminished, their use
became more widespread and their limits were forgotten by most users. While GDP had
been designed and used to measure market activity, increasingly it became a thermometer
used for assessing the general health of societies.
Simon Kuznets warned against this risk more than 50 years ago:
As a general formula, the desirability of as high and sustained a growth rate as is
compatible with the costs that society is willing to bear is valid; but when using it
to judge economic problems and policies, distinctions must be kept in mind
between quantity and quality of growth, between its costs and returns, and
between the short and long run…Given the variety of qualitative content in the
overall quantitative rate of economic growth, objectives should be explicit: goals
for more “growth” should specify more growth of what and for what.
(Kuznets, 1962)4
The issues discussed in this book may, at first sight, appear as technical, and addressed to
a narrow field of specialists. But they are not only technical: they go to the root of how
our democratic systems function. In the words of President Sarkozy, the goal of the
Commission was to address:
A gulf of incomprehension between the expert certain in his knowledge and the
citizen whose experience of life is completely out of synch with the story told by
the data… nothing is more destructive of democracy… people believe that they
are being lied to… that they are being manipulated”. (Stiglitz, Sen and Fitoussi,
2009)5
This gap between the “experts” and the citizen they are supposed to be serving has played
an important role in the bitter divisions within society that have been so vividly
demonstrated in a number of recent elections. President Sarkozy was thus prescient in
drawing attention to the consequences in a democracy of a growing gulf between the
statements, assertions and beliefs of the experts and elites, on one side, and the lived
experiences of significant numbers of citizens, on the other.
The Commission had as one of its central missions ensuring that our metrics drew our
attention to those things that made a difference to people’s lives. One thrust of this book
is that, had the recommendations of the Commission been more fully implemented – and
some of the issues developed in this volume more fully explored – different policies
might have been chosen. There were early warning signs not only of the discontent, but
also of the underlying changes in our economy and society that might have been expected
to give rise to such discontent. Whether that is so or not, one thing is clear: metrics
matter, and in both the financial crisis of 2008 and what some have called the political
crisis of 2016, our system of national accounts, centring on GDP, did not give us
adequate warning of what was around the corner. Some may say that was not the purpose,
that was not what national accounts were designed to do. But surely it would have been
good for society to have some well-established and widely used indicators of the major
traumas that were about to befall.
20 │ 1. THE CONTINUED IMPORTANCE OF THE “BEYOND GDP” AGENDA
BEYOND GDP: MEASURING WHAT COUNTS FOR ECONOMIC AND SOCIAL PERFORMANCE © OECD 2018
1.2. GDP statistics and the Great Recession
Even when focusing on market income, national accounts statistics may sometimes fail to
provide the full picture. In September 2008, the United States – and then the world – fell
into what has been called the Great Recession, the worst global downturn since the Great
Depression 80 years earlier. As the economy was about to slip into recession, leading
economists pronounced the economy to be in good health.6 A few years earlier, the long-
time head of the US Federal Reserve, Alan Greenspan, dismissed worries about the
possibility of a bubble in asset prices by saying that there was just a little “froth”.7 These
leading economists had taken the vital signs of the economy and pronounced it fit and
healthy.
In retrospect, there were a number of failures. Those in positions of power, who have to
decide whether, for instance, to tighten or loosen credit if they judge the economy to be,
or about to be, over- or under-heated, rely on a variety of indicators – just like medical
doctors take a patient’s pulse, monitor blood pressure, take a blood cell count, look at
whether the patient is gaining or losing weight, etc. Indicators that could have provided a
warning signal to policy-makers of what was about to happen were, in many cases,
available but were not part of a well-established reporting system and were mostly
ignored by those who should have noticed. In other cases, these indicators were simply
not available – e.g. sectoral accounts and balance sheets, which led (post-crisis) to several
initiatives aimed at improving the kind of information available to decision makers.8 In
other cases yet, early estimates of GDP failed to provide a sense of the true scale of the
recession, and were heavily revised in later periods.9
Most fundamentally, policy-makers ignored these warning signals due to the ideological
blinders that prevented them (and their economic advisors) seeing the dangers ahead.
They were also reassured by conventional macro-economic models that said that a crisis
of such proportions could not happen. They took comfort from past movements in GDP,
in the hope that the “Great Moderation” (combining good GDP performance with lack of
inflationary pressures) that prevailed before the crisis could extend into the future.
A year later, as GDP began to increase in 2009, President Obama announced that the
economy was on the mend, that recovery in the United States had begun. Yet, to the
overwhelming majority of Americans, this did not seem to be the case. Again, aggregate
economic indicators, such as GDP, seemed out of synch with “the facts on the ground”.
What was going on, what was being experienced by most Americans and by most people
in the developed world, was not conveyed by the figure that is usually relied upon, GDP.
There were, of course, some simple explanations of this conundrum. One factor was that
GDP growth often disproportionally benefitted those at the top of the income scale: in the
United States, 91% of all the gains in income in the first three years of recovery (2009-
12) is estimated to have gone to the top 1% (Saez, 2016). Thus, in the United States, most
households were not experiencing a recovery. There was a similar phenomenon in
Europe, more visible in countries most affected by the crisis. In those same three years of
supposed recovery, growth in average household income in Europe, as measured in the
national accounts, lagged GDP growth;10
while growth in median household income –
where 50% of the population is above that level and 50% below – as measured in surveys,
lagged average income growth (which was boosted by gains going to a relatively small
number of people). No wonder, then, that most people felt that there was no real recovery.
A second factor was that many households lost their home and jobs, and often their hope
in the future, in addition to their income. And those who didn’t were fearful of doing so.
1. THE CONTINUED IMPORTANCE OF THE “BEYOND GDP” AGENDA │ 21
BEYOND GDP: MEASURING WHAT COUNTS FOR ECONOMIC AND SOCIAL PERFORMANCE © OECD 2018
Income itself does not provide a full summary of the economic anxieties facing
individuals.
One clear lesson from the crisis is the need for a broader range of statistics, including
more granular data that capture the diverse situations of different groups of the
population. GDP, for example, is not constructed to measure the economic situation of
individual households. Indeed, if GDP goes up by say 5%, it doesn’t mean that everyone
sees their income go up by 5%, nor even that the typical household or person sees his or
her income go up by that amount. GDP describes what is happening to total economic
production and to the average income generated from this production – whether this
income accrues to a few people or many, to residents or foreigners, to households or to
firms. Even if the income is going to residents, GDP doesn’t say how this income is
distributed among households.
But the US President should have been aware (or been made aware by his economic
advisors) that GDP could go up even though the vast majority of people saw no increase
in their incomes – if inequality increases enough. And that was precisely what happened
in the US “recovery”. The single number, GDP, didn’t adequately summarize what most
people were experiencing. So too, when Ireland’s GDP went up 26% in 2015, it wasn’t
that the Irish citizens, who had been suffering so much from the euro crisis, suddenly
found their worries at an end. Indeed, Irish household disposable income per capita rose
by only 2.7% in that year. In this case, the surge in GDP reflected, to a large extent, the
transfer of the intellectual property assets of a few multinationals to independent entities
in Ireland, which much of the profits generated by these entities transferred abroad rather
than benefitting Irish households.11
That GDP didn’t do all that was hoped of it shouldn’t be a surprise: no single number can
summarise anything as complex as the economy. Further, an average is just an abstract
number for the individuals who are averaged. But there are real consequences of relying
on an incomplete set of measures. If the economy is perceived to be well on the road to
recovery, based on GDP, one might not take the strong policy measures needed to
resuscitate the economy that one would take with metrics that inform on whether most of
the population still feels in recession. Nor would one take measures to bolster the safety
net and social protection in the absence of metrics on the extent of people’s economic
insecurity.
If the measures we rely on are out of synch with how citizens experience their lives, a
lack of trust in government will develop. Some would argue this is what happened in the
United States and in most other industrialised countries in recent years, when the GDP
statistics said the economy was in recovery and yet most people felt otherwise. While
other factors might have been at work (Pew Research Center, 2017), the disparity
between what was happening on the ground and the announced “recovery” almost surely
contributed to the growing lack of trust in governments by so many citizens over this
period. Most OECD countries are today facing a “trust crisis”, a crisis that in some cases
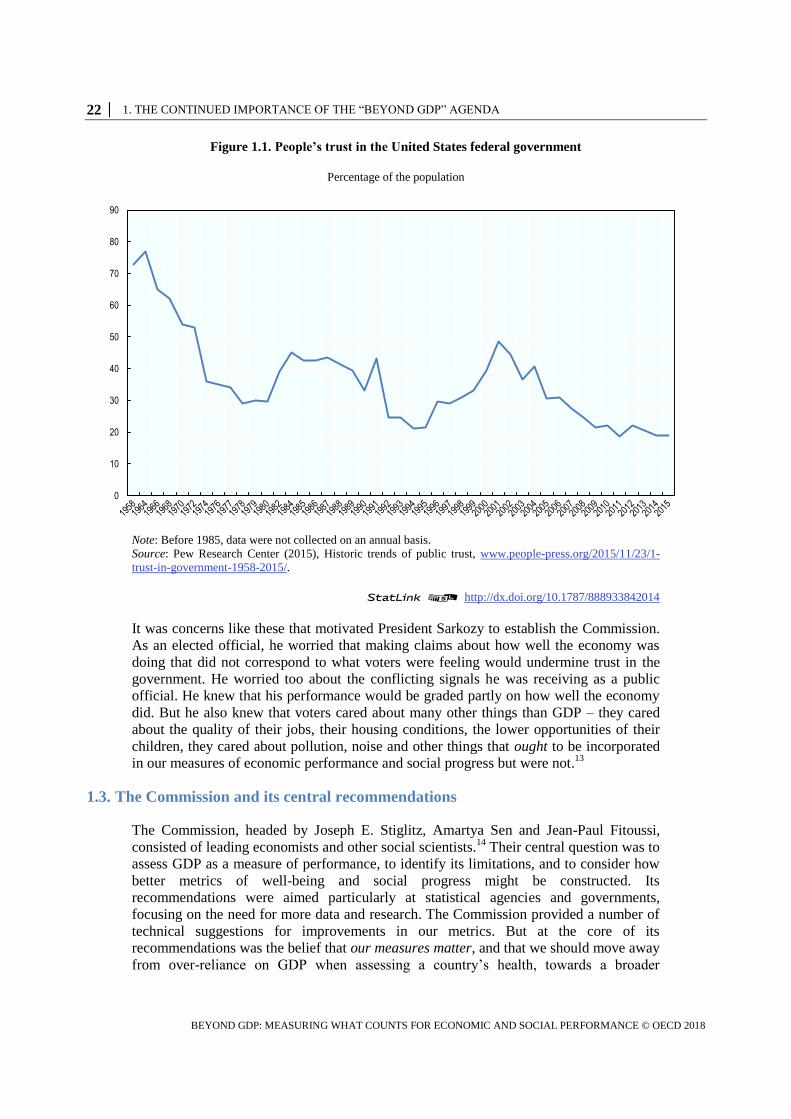
goes back in time. To give one example, fewer than 20% of Americans trusted their
federal government to do what is right most of the time in 2017, as compared to close to
80% in 1964 (Figure 1.1). Data for a broader range of countries show that confidence in
national governments, which hovers today around 40% on average across OECD
countries, fell by 10 points or more in many of the countries most significantly hit by the
crisis (e.g. Greece, Spain and Portugal) while strongly improving in countries that were
less affected, such as Germany (OECD, 2017b).12
22 │ 1. THE CONTINUED IMPORTANCE OF THE “BEYOND GDP” AGENDA
BEYOND GDP: MEASURING WHAT COUNTS FOR ECONOMIC AND SOCIAL PERFORMANCE © OECD 2018
Figure 1.1. People’s trust in the United States federal government
Percentage of the population
Note: Before 1985, data were not collected on an annual basis.
Source: Pew Research Center (2015), Historic trends of public trust, www.people-press.org/2015/11/23/1-
trust-in-government-1958-2015/.
StatLink 2 http://dx.doi.org/10.1787/888933842014
It was concerns like these that motivated President Sarkozy to establish the Commission.
As an elected official, he worried that making claims about how well the economy was
doing that did not correspond to what voters were feeling would undermine trust in the
government. He worried too about the conflicting signals he was receiving as a public
official. He knew that his performance would be graded partly on how well the economy
did. But he also knew that voters cared about many other things than GDP – they cared
about the quality of their jobs, their housing conditions, the lower opportunities of their
children, they cared about pollution, noise and other things that ought to be incorporated
in our measures of economic performance and social progress but were not.13
1.3. The Commission and its central recommendations
The Commission, headed by Joseph E. Stiglitz, Amartya Sen and Jean-Paul Fitoussi,
consisted of leading economists and other social scientists.14
Their central question was to
assess GDP as a measure of performance, to identify its limitations, and to consider how
better metrics of well-being and social progress might be constructed. Its
recommendations were aimed particularly at statistical agencies and governments,
focusing on the need for more data and research. The Commission provided a number of
technical suggestions for improvements in our metrics. But at the core of its
recommendations was the belief that our measures matter, and that we should move away
from over-reliance on GDP when assessing a country’s health, towards a broader
0
10
20
30
40
50
60
70
80
90
1. THE CONTINUED IMPORTANCE OF THE “BEYOND GDP” AGENDA │ 23
BEYOND GDP: MEASURING WHAT COUNTS FOR ECONOMIC AND SOCIAL PERFORMANCE © OECD 2018
dashboard of indicators that would reflect concerns such as the distribution of well-being
and sustainability in all of its dimensions.
How large could a dashboard be? As citizens and officials, there are limits to the amount
of information that we can absorb and process. The Commission recommended that there
should be a relatively small number of indicators (what it called a dashboard), with some
of them reflecting how well ordinary citizens were doing (for example, measures of
households median income may be a better indicator of the economic well-being of the
“typical” person than average income, which can be pulled up by a few people having
enormously high incomes) and some measuring sustainability. Economic sustainability is
typically captured best by some monetary measure of wealth, but environmental
sustainability might be better assessed by using some physical metrics. So too, it made
sense to reflect how well society was doing on health by considering physical metrics of
longevity and morbidity – not even trying to convert them into some dollar equivalent.
The challenge was to make the dashboard small enough to be easily comprehensible, but
large enough to include a summary of what we care about the most.
1.3.1. Measurement matters
We live in a world of metrics, where we are constantly quantifying our progress, our
success. What we measure affects what we do. If we measure the wrong thing, we will do
the wrong thing. If we don’t measure something, it becomes neglected, as if the problem
didn’t exist. If we don’t measure inequality or environmental degradation, we are less
likely to attend to these concerns.
Of course, measures will always be imperfect. That’s not the issue. The real question is,
are they misleading us? And of course, even if measures are imperfect, we can’t do
without them. One can’t imagine flying a plane without a dashboard of instruments, so
too we can’t imagine steering an economy without a dashboard of indicators. In a sense,
the simple message from the Commission was that we needed a dashboard, that we must
understand better each of the dials on the dashboard, and that we need to develop new
dials for important problems that are still inadequately measured. To achieve all of this,
we need to re-activate a dialogue in society about the final destination of our plane and
the greatest risks it faces while heading there.
1.4. An array of problems
As important as metrics are, all metrics are beset by problems. The choice of metrics is
part of the debate in many other areas of public and private life. For example, one of the
responses to concerns that our schools are not doing what they should be doing is that we
need better student assessments. We can then know when we are failing our children. But,
putting aside the question of how those assessments are used, the question is what is to be
assessed. Standard tests often focus on basic skills, such as reading, writing and
arithmetic. However, schooling is about more than that. It teaches social skills – how to
get along with others; it teaches basic life skills – to show up on time every morning, to
obey orders, to work as a member of a team. And it teaches higher order cognitive skills
that may foster creativity. If student testing focuses only on basic skills, teachers will
focus on those at the expense of other skills. Overall, schools will perform less well –
though they will perform better in the basic skills. Such considerations led to the changes
introduced in the well-known OECD Programme for International Student Assessment
(PISA) tests. While PISA started in the late 1990s measuring 15 years-old students’ basic

24 │ 1. THE CONTINUED IMPORTANCE OF THE “BEYOND GDP” AGENDA
BEYOND GDP: MEASURING WHAT COUNTS FOR ECONOMIC AND SOCIAL PERFORMANCE © OECD 2018
skills in reading, science and numeracy, it now also assesses “soft” skills and students’
well-being in school.
1.4.1. A monetary metric
If there were a simple way of converting every aspect of well-being into money we could
simply estimate the total money value of well-being. Together with an indication of how
this value is distributed, this would provide a clear guide for increasing societal well-
being: wherever possible, substitute a higher money metric activity for a lower one. If we
had the right information, we might even have a way of incentivising people to do the
right thing. In this grand conception, our money metric would reflect not just the market
prices of the goods or services produced, but also the intrinsic (social) value of the
activity. For example, making shoes that strengthened muscle power (the value of which
was not reflected in the market price) would be valued more than one that led to muscle
deterioration.
The market economy does something that is almost as spectacular. So long as all firms
are small and numerous, and so too are households, and so long as there is no market
failure (the exact meaning of which will be elaborated on below) and no externalities, the
economy is efficient and maximizes the market value of goods and services produced.15
Thus, if the market value of the goods and services produced increases, aggregate social
well-being increases, or so it would seem.
But things are not so simple. One reason is that an economy at different dates has
different relative prices and different money prices. The problem of higher money prices
(in, say, dollars or euros) is easy to fix. That’s called inflation. When we want to assess
changes in the real output, we want to take out the effect of inflation. If, on average, the
prices of all goods and services have increased by 3%, we simply reduce the change of
nominal GDP by 3%, to get a measure of the change in real GDP. If real GDP has gone
up, so has aggregate economic welfare. We have thus created a money-metric of
aggregate economic welfare.
Matters are more difficult when there is a change in relative prices, i.e. the price of one
good relative to that of another. Economists and statisticians have devised ways of
making approximate, but fairly good, estimates of what has happened to real GDP when
relative prices change. Typically, prices don’t change very quickly, and so if we assess
GDP at annual intervals, the differences in most relative prices will be quite small. We
can calculate the value of GDP at time t+1 by using prices at time t. If that value has gone
up by, say, 3%, we can say economic welfare has gone up (in our money metric) by a
corresponding amount. We compare GDP in 2018 with that in 2007 by performing this
exercise every year. The result is called the chain-weighted GDP index.
1.4.2. Beyond mere technical problems
More fundamental problems arise as soon as we depart from the simple model.
For a start, much activity occurs outside the marketplace. Individuals may be given
education and health care by the government, and economic production also occurs at
home. Market production, on its side, does not always increase people’s economic well-
being, as firms may deceive their clients about the value of the goods and services that
they sell.
More fundamentally, individuals’ well-being is affected by other factors than economic
production and the income generated by it. It is shaped by their sense of security, and
1. THE CONTINUED IMPORTANCE OF THE “BEYOND GDP” AGENDA │ 25
BEYOND GDP: MEASURING WHAT COUNTS FOR ECONOMIC AND SOCIAL PERFORMANCE © OECD 2018
their relationship with others, including their employer. The simple economic model also
assumes that individuals can “sell” as much labour as they want at the going wage, so that
the wage measures the marginal value of leisure (or of time). This, in turn, implies that
there is no unemployment, or at least that all unemployment is voluntary – i.e. individuals
are indifferent (at the margin) to more leisure or to more work at the going wage – an
obviously false assumption.
Further, at any point in time, there are many market failures (failures of markets to
produce the fully efficient outcomes associated with the “ideal” textbook competitive
market economy with full information) and all lead to market prices that differ from those
corresponding to the “intrinsic marginal value” (the value of adding an extra unit) of
goods, services and assets that are exchanged. Market failures, externalities and public
goods all imply that an economy that maximises the market value of goods and services
would not necessarily maximise aggregate social welfare, and that market prices do not
adequately reflect either social costs or benefits. These market failures arise from
imperfect information, market power, environmental externalities, absence of markets for
important risks, public goods, deficiencies in corporate governance and bankruptcy
frameworks and a host of other problems. These market failures are pervasive; they
represent not a small glitch in economic design but an inherent consequence of, say, the
fact that information and knowledge are costly to produce and transmit, or that markets
are costly to create and to transact on, or that it is efficient to have certain goods publicly
provided or publicly produced. While in some cases, the consequences may be small, in
many cases they are of first order importance, not only for ascertaining the efficiency of
the economy but also for assessing the adequacy of our standard statistical measures in
providing an assessment of the performance of the economy.
When we assess the conditions of the economy as a whole, there are other considerations
still: most importantly, the sustainability of the economy. The present generation can be
living off inherited riches, leaving nothing to the future. More broadly, societal well-
being is about economic, social, and environmental sustainability, none of which is well
reflected in GDP.
Finally, as a society, we care about the distribution of well-being. People may prefer
patterns of economic growth whose benefits are widely shared to those where benefits are
limited to a few or are concentrated among the better off.
There are thus multiple reasons why GDP is not a good measure of societal welfare.
As Kuznets warned, GDP was constructed with a much more modest ambition –
measuring the level of market activity. It grew out of the Great Depression to answer a
very important question: how could we quantify the loss in economic output that was
evidently occurring? Over time, it has expanded into a measure of welfare: of economic
welfare first, and of general welfare second. This expansion of the use of GDP is where
the problem lies.16
The Commission on the Measurement of Economic Performance and Social Progress,
and its successor, the High-Level Expert Group on the Measurement of Economic
Performance and Social Progress had as their mission the development of better metrics
of economic performance and social progress, improved understanding of the limitations
of commonly used metrics like GDP, and enhanced understanding of how these better
metrics can lead to better policies.
The Commission looked at long-standing problems, such as the measurement of public
services (where individual choices do not reveal information about individual valuations),
26 │ 1. THE CONTINUED IMPORTANCE OF THE “BEYOND GDP” AGENDA
BEYOND GDP: MEASURING WHAT COUNTS FOR ECONOMIC AND SOCIAL PERFORMANCE © OECD 2018
as well as three areas: the assessment of economic inequalities, sustainability, and quality
of life. The latter included the new field of subjective well-being, i.e. metrics derived
from surveys administered to individuals in which respondents reflect on their life as a
whole or report on their daily experiences. Such surveys have been shown to provide
relevant and reliable information about individual’s well-being that is not contained in
other metrics, calling attention to aspects of well-being that might otherwise be neglected:
the importance of social connections, political voice or quality jobs. For example, we
know today that the loss of a job is important for more than just the loss of income that is
associated with it, so that even making up for the lost income won’t really restore the
individual’s well-being.
Later chapters of this book will look more closely at inequality and sustainability. Here,
we simply reiterate their importance: what matters is not just the size of the pie, but how
it is divided, the set of ingredients used when preparing it, and whether these ingredients
will continue to be available in the future. An economy whose benefits are not widely
shared, and where whole industries, occupations and regions are left to suffer, carries
within it the germs of its rejection by those who are called to adjust to conditions that are
not of their making (Kuznets, 1962). Similarly, an economy whose growth is not
sustainable in all its dimensions (economic, social environmental) is stealing from future
generations. It is clear, in retrospect, that GDP growth in much of the developed world
prior to 2008 was not sustainable. Similarly, it should be clear today that our economic
growth is not environmentally sustainable: climate change represents an existential threat.
Some elements of our dashboard should have called this to our attention.
1.5. A national dialogue
The Commission report argued that a national dialogue determining what should be
included in the dashboard of indicators, and whether existing metrics well reflected what
society cares about, is an important part of democratic engagement. Since then, many
civil society groups have come forward, urging changes in our measurement system, and
many governments have responded through measurement initiatives (see Annex) and by
taking steps to anchor well-being indicators in the policy process (see Chapter 4). The
response has, in many ways, exceeded what the Commission had anticipated, reflecting
growing concerns around the world over issues like income inequality and the
environment. The growing participation in the OECD World Fora on “Statistics,
Knowledge and Policy”17
which started in 2004 – before the Great Recession and the
establishment of the Commission – and continue to be organised periodically by the
OECD to promote the “Beyond GDP” agenda, are a testimony to this success.
There is some tension, though, between the desire to have metrics that reflect the
particular situation within a country and the need to have metrics that enable cross-
country comparisons, i.e. to give a picture of how a country is doing relative to others.
Both perspectives are important: we all want to know how well we are doing (in one
dimension or another) relative to our past or relative to what is occurring elsewhere. The
OECD Better Life Initiative – launched in 201118
in response to the Commission’s
recommendations – and its biennial report How’s Life? Measuring Well-being (OECD,
2017a, see Annex), provide a dashboard of well-being indicators that can be compared
across OECD member countries. Individual countries have developed their own
dashboards, adapting the framework to reflect their specific circumstances.
At the end of the Commission’s term, one of its main recommendations was that more
needed to be done at the international level. This message was taken up by the OECD,
1. THE CONTINUED IMPORTANCE OF THE “BEYOND GDP” AGENDA │ 27
BEYOND GDP: MEASURING WHAT COUNTS FOR ECONOMIC AND SOCIAL PERFORMANCE © OECD 2018
who took the lead in hosting the follow-on HLEG. But, rather than follow through on the
full gamut of issues raised in the Commission report, this Group decided to focus on
selected issues that had not been dealt with adequately or fully in the initial report.
Thus, this book and its companion volume (For Good Measure: Advancing Research on
Well-being Metrics Beyond GDP), focus on a selected number of topics, many of which
are related to each other: the relevance of the “Beyond GDP” agenda for less developed
countries; the distribution of household income, consumption and wealth; horizontal
inequalities among people sharing common characteristics; inequality of opportunity;
subjective well-being; economic insecurity; sustainability; and trust. Some of these issues
were not discussed in the Commission’s earlier report, but have since received increasing
attention. This is the case, for example, of vulnerability, the risk that an economy (or an
individual) could fall into a non-sustainable state, and resilience, the ability of an
economy (or an individual) to recover from an adverse shock. Some issues are old but
have become an increasing source of concern: GDP growth cannot continue as it is within
our planetary boundaries. Global warming and climate change are real and already upon
us, with significant well-being impacts from both weather variability and higher average
temperatures, and further effects, such as those associated with sea level rise and
changing levels of ocean acidity, not far away. Our indicators must account of these
realities.
These subjects were chosen in view both of their importance and of the possibility to
develop metrics to measure them. Just listing them conveys their richness and importance
for the life of people. The fact that standard metrics have not even attempted to capture
changes in these variables helps explain our difficulties in understanding our society and
its behaviour, and in devising policies that would enhance individual and societal well-
being. Several of the topics discussed in this book and the accompanying collection of
authored chapters are at the limit of what we can assess with any reasonable degree of
confidence. Measurement problems are complex but that is not an excuse: what we
measure is a choice, which reflects implicitly our value system. Not measuring
something, even if the measurement is imperfect, has consequences, as we have already
noted.
One of the objectives of the report of the Commission on the Measurement of Economic
Performance and Social Progress was to highlight the role of metrics in policy, and to
instigate a more active dialogue between economic theory, statistical practice and
economic policy, bringing out more clearly the often implicit assumptions in our
statistical practices and their real-world consequences. The same objectives remain
central for this book.
1.6. Key changes in the world
The Commission report explained how changes in the economy and society affect both
what we want to measure and the adequacy of our metrics. Before the problem of climate
change was recognised, there was no reason to measure an economy’s carbon emissions.
The report also noted that the changing structure of the economy had led to an increasing
reliance on imputations – numbers not directly collected by official statisticians but
estimated by them in some indirect way.
Since the publication of the Commission report, there have been several changes that
heightened the need for (and shaped thinking concerning) a new report. While the
Commission was formed before the Great Recession of 2008, this long and deep
28 │ 1. THE CONTINUED IMPORTANCE OF THE “BEYOND GDP” AGENDA
BEYOND GDP: MEASURING WHAT COUNTS FOR ECONOMIC AND SOCIAL PERFORMANCE © OECD 2018
recession naturally focused attention on the adequacy of our metric system for assessing
the consequences of deep downturns – in some ways, the original mission of the system
of national accounts. It also highlighted the importance of metrics of economic
sustainability, indicators showing how an economy might be vulnerable to a major shock.
1.6.1. Higher economic insecurity and lower trust
The Great Recession had two follow-on effects: a growth of economic insecurity and an
undermining of people’s trust, especially in public institutions (which we have already
noted). While the Commission had recognised the importance of insecurity and trust, it
hadn’t done much to propose metrics, or even to explore the conceptual underpinnings of
such metrics. It was clear, however, that not taking into account economic insecurity left
out one of the main adverse effects of the deep downturn. It was also clear that the
weakening of people’s trust in public institutions was having social, political and even
economic effects that needed attention, even if no commonly accepted measures of trust
had yet been developed.
1.6.2. Rising inequalities, global warming and sustainability
Meanwhile, growing concern about rising inequalities and global warming put an even
greater emphasis on sustainability, in all of its dimensions. This, in turn, led to the global
agreement reached in September 2015 in New York on the Sustainable Development
Goals (SDGs), whose overarching objectives are ensuring sustainability and leaving no
one behind; and, in December 2015 in Paris, to a common goal of reducing global
emissions of greenhouse gases so as to limit the increase in global temperatures to
between 1.5 and 2 degrees centigrade.
The SDGs, approved unanimously by the UN General Assembly, were testimony to the
power of commonly agreed goals. Fifteen years earlier, the countries of the world had
agreed on the Millennium Development Goals (MDGs), a set of goals for reducing
extreme poverty by half and raising other aspects of standards of living in developing
countries. The attention that the MDGs focused on these commonly agreed goals
arguably played a role in the success the international community had in achieving a
number of them – though even as they were achieved their limitations were clear: while
extreme poverty globally was halved, poverty in Africa remained high. The new SDGs
played the role of setting global norms, and not just for developing countries but for
developed countries as well.
There were intense fights over what to include and not to include in the SDGs. Every
NGO wanted the issues for which they were fighting to be included, possibly in the belief
that if only more attention were focused on their objectives, more progress would be
made. Thus, attempts were made to include some measure of rule of law or even, more
narrowly, land titling. The resulting Agenda 2030 was a mix of “ends” and “means to
ends”, since the ends themselves often proved elusive.
One area in which there was a broad consensus was to set a goal on income inequality.19
The MDGs had, as we noted, turned the spotlight on extreme poverty, based on the same
income threshold across all countries. But, as the SDGs negotiations unfolded, broader
concerns came to the fore, not just about those at the very bottom of the income scale.
Some worried about the seeming decrease in equality of opportunity, others about the
squeezing of the middle-class, while others argued that the large gap between those at the
top and everyone else presented a societal problem. These were all different aspects of the
1. THE CONTINUED IMPORTANCE OF THE “BEYOND GDP” AGENDA │ 29
BEYOND GDP: MEASURING WHAT COUNTS FOR ECONOMIC AND SOCIAL PERFORMANCE © OECD 2018
distribution of income. Though no single measure of inequality could capture them all,
there was a strong case for including some measure of income inequality.
As Kanbur, Patel, and Stiglitz emphasise in their chapter in the accompanying volume,
the demand for comprehensiveness of the SDGs had an adverse effect: some 17 goals,
with 169 targets and 232 indicators were eventually listed – too many to be meaningfully
comprehended or to be a focus of policy. This was not the narrow dashboard that the
Commission had recommended. What this implied, the authors suggest, is that countries
needed to select which of the goals to focus on, to make them the object of their efforts
over the coming years. For most developing countries, that narrow list would almost
surely include some measure of employment, of the environment, and of how well the
standard of living of the typical individual was doing – not just GDP. More developed
economies are also confronted with the same issue of prioritisation. To help them identify
where efforts are most needed, and thus establish a limited set of priorities for policy
action, the OECD undertook to develop a tool to assess the distance that countries need to
travel to achieve each of the SDG targets.20
Even when the set of goals broadly defined is decided, the choice of metrics can make a
difference – another of the messages of the Commission. Within any metric are buried
assumptions, often quite subtle, about what is important and what is not. We will discuss
the measurement of income inequality more extensively below. Here, we simply note
that, over time, the shape of the income distribution can change in many complicated
ways. Looking at the number of poor people focuses simply on the fraction of the
population below a given monetary threshold. The danger of such a measure is that
countries can improve it simply by concentrating attention on those just below the
poverty line, pushing them across it. In contrast, the poverty gap measures the depth of
poverty, i.e. how much income would have to be increased to move everyone out of
poverty. Today, however, there is much concern about the squeezed middle-class, the
reduction of median income and the fraction of the population that is near the middle of
the distribution, say plus or minus ½ of median income. To capture these concerns, the
share of income that is appropriated by those in the central deciles of the income
distribution (or the income ratio between those at the 10th or 1st percentile relative to the
50th, showing the gap between the rich and the rest) seems a more appropriate metric.
The SDGs rely on a variety of other indicators, e.g. focusing on the share of income going
to the bottom 40%. Others, based on the observation that the income share received by
the middle-class was quite similar across a large number of countries, argued in favour of
the Palma ratio – i.e. the ratio between the income share of the top 10% of the population
and that of the bottom 40%.21
While the SDGs are mainly aspirational, they can also be seen as part of an explicit global
norm setting. All of us want to be part of a “good” society. No one is sure what that
means, but when world leaders collectively decide what it means, as they did through the
SDGs, it matters – and it provides a point of entry for concerned citizens to press policy-
makers to respect their commitments.
In practice, several countries are today organising their policy agenda around the SDGs,22
especially those goals that are salient to them, such as those concerning poverty,
inequality and sustainability. Once national goals have been set, countries will want to
know how well they are doing, and whether more resources should be devoted to specific
areas such as reducing inequality or promoting sustainability. Part of the answer to the
question “how are we doing?” is provided by our metrics. That is why the 232 indicators
that were agreed upon as part of the SDGs agenda are so important. Of course, as noted
30 │ 1. THE CONTINUED IMPORTANCE OF THE “BEYOND GDP” AGENDA
BEYOND GDP: MEASURING WHAT COUNTS FOR ECONOMIC AND SOCIAL PERFORMANCE © OECD 2018
above, this does not mean that each country should use a dashboard of 232 indicators, but
rather that it should select a limited subset once it has decided on its policy priorities.
Ideally, selecting these goals and targets through an open process to assess what society
values would deepen a country’s democracy and enhance solidarity, trust, and social
cohesion.
1.6.3. Changes in economic structure
The need for better metrics, particularly on the economic side, is partly related to changes
in the structure of our economies. There have been many changes since the system of
national accounts was created that affect both its ability to perform its original function –
monitoring the state of the market economy – and its usefulness as a measure of
economic welfare.
As we observed earlier, the Commission report noted several of these changes. There
were, for instance, shifts in many economic activities from the household to the market.
As women left the home to work in the labour market, childcare services that previously
took place within the home now occurred more frequently within the market. The
increase in market activity then exaggerated the growth of production, as it ignored the
simultaneous reduction in the production of household services for own use. The benefits
of home appliances to welfare may also have been underestimated, because they may
have allowed households to enjoy more leisure, whose value is not reflected in GDP. In
the United States, the rapid growth of mass incarceration required higher expenditures in
prisons that boosted GDP growth but almost surely did not reflect an increase in societal
well-being. So too, the weakening of the welfare state and the shift in some advanced
countries’ pension systems from defined benefit systems to defined contribution systems
has not only made economies less resilient and more vulnerable to shocks, but also
increased individuals’ economic insecurity, as risks were transferred from firms and
governments to the people themselves. This has increased the importance of
incorporating insecurity into our metrics of well-being, as we have done in this book and,
more extensively, in the companion volume.
The Commission report noted two further factors. First, housing has become an
increasingly important part of GDP, but the value of housing services is largely based on
imputations. It is not just that, with owner-occupied housing, housing services are not a
market transaction; but that the system of national accounts imputes what the value of
those rents would be if owners had rented their house, based on observation of rents for
similar dwellings. As imputations take on a more important role in GDP estimates, the
extent to which GDP accurately reflects changes in market activity may be reduced.
Second, as goods and services produced by the government are not, for the most part,
sold in markets, the value of their output cannot be derived based on market prices but is
measured based on the costs of inputs, which in practice are typically limited to labour.
Depending on the methodology used for price and volume measurement, this approach
risks underestimating GDP growth when the government becomes more efficient in
providing these services. When a labour input measure is used to estimate price and
volume changes, efficiency gains will lead to a lower volume of output and value added,
and to an underestimation of GDP growth. Although several countries are now using
output indicators to measure the volume of government non-market production (e.g. for
health and education services provided by the government)23
, most still rely on labour
inputs when measuring the volume of government production. As the size of the
government sector increases, this may result in a downward bias in GDP measures.
1. THE CONTINUED IMPORTANCE OF THE “BEYOND GDP” AGENDA │ 31
BEYOND GDP: MEASURING WHAT COUNTS FOR ECONOMIC AND SOCIAL PERFORMANCE © OECD 2018
1.6.4. Digitalisation of the economy
One change in the structure of our economy, particularly notable in the last decade, which
was not discussed in the Commission report, is the emergence of the digital economy.
Google, Facebook, and other digital firms seem among the most innovative in the world,
and they have garnered for themselves a large share of the increase in global stock market
value. Other companies report large efficiency gains permitted by digital technologies
and algorithms. The success of these firms has led many to conclude that we are in an
“innovative era”. Yet, aggregate data covering this “innovative era” suggests no reversal
in the longer- term slowdown in productivity growth over the last two to three decades in
many advanced economies (Figure 1.2). How do we reconcile being in what some call an
unprecedented era of innovation with the slow pace of productivity growth? Gordon
(2016) suggests that we are not today in a particularly innovative era: the invention of
electricity had far more profound effects on our economy and society than the internet
did. Indeed, one could argue that much of the profits of these internet giants, based in
large part on advertising revenues, merely reflects a displacing effect (away from
traditional forms of media) that has arguably only a minimal net impact on societal well-
being. Others have argued that the pace of technological progress has not slowed down,
but that adoption requires changes in organisational structures and business models and
that productivity growth naturally lags innovations (Brynjolfsson and Mac Afee, 2011;
Baily, Manyika and Gupta, 2013).
Some argue that our GDP metrics underestimate the value of the new technologies,
because some of their key services are provided for free to users. Google’s search engine,
for example, has enormous societal value and yet, because access is free, the value of
these services does not directly enter GDP (although their advertising revenues do). There
are of course good reasons why the value of these services are not directly included in
measures of GDP (Ahmad and Schreyer, 2016). As the search is provided for free, its
marginal value is zero, and our system of national accounts values goods at their marginal
value (the value of the last unit provided), not incorporating “consumer surplus” (the
value of all units consumed up to the last). There are other aspects of new technologies
that may be of high value, such as the sense of connectedness provided by social media,
which are similarly missed by GDP.
On the other hand, critics point out some of the less positive social impacts of
digitalisation, such as societal polarisation and a reduction in people’s attention span.
Moreover, at the same time that the new technologies provide services of value, there is a
reduction in other services of value, such as those that were previously supplied jointly
with print media. Consumers have long been accustomed to free newspapers,
investigative reporting and television programmes for example, funded by advertising
revenues. That being said, current estimates suggest that the impact of this “exclusion”, at
least at present, is not significant and cannot explain the slowdown in productivity growth
seen during this “innovative era” (Ahmad, Ribarsky and Reinsdorf, 2017), accounting, at
best, for 0.1% per annum of US GDP growth.24
Where potential mismeasurement related
to digitalisation may be more important is in the area of prices, particularly in relation to
services and new technologies where quality changes rapidly. Even here, however, the
impact on real GDP growth and on measures of consumer inflation is estimated at most
around 0.2% percentage points per annum (Schreyer and Reinsdorf, 2018).
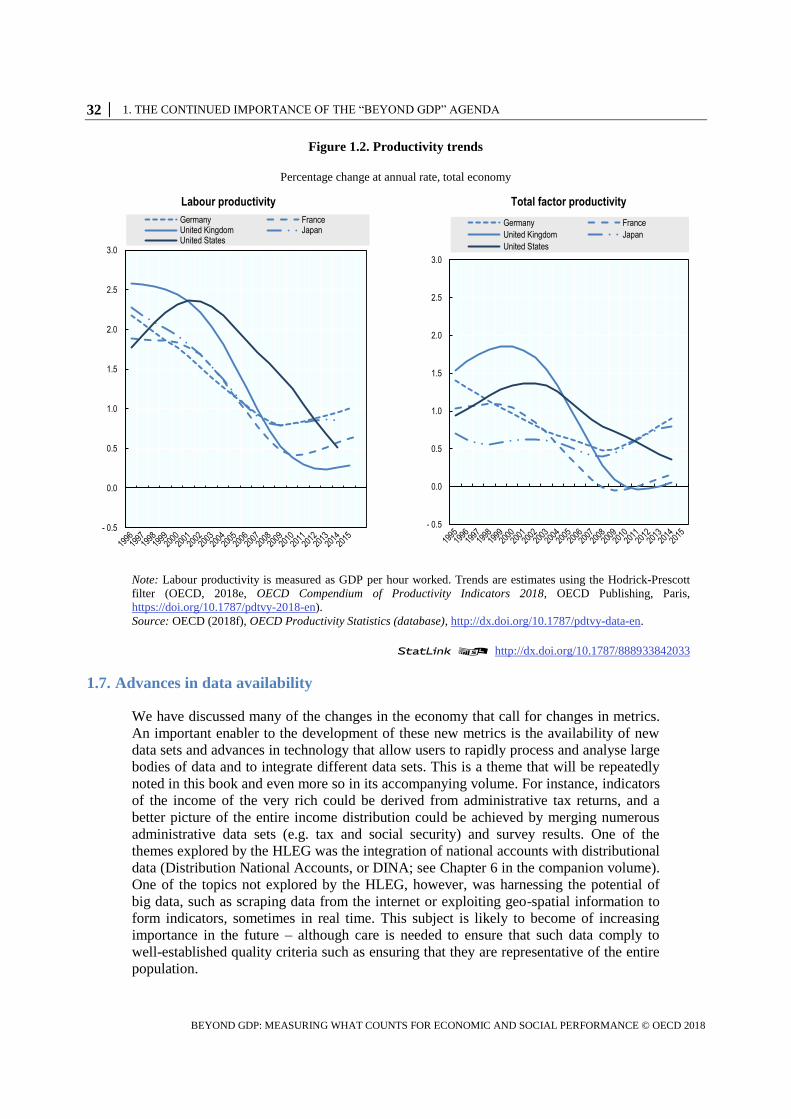
32 │ 1. THE CONTINUED IMPORTANCE OF THE “BEYOND GDP” AGENDA
BEYOND GDP: MEASURING WHAT COUNTS FOR ECONOMIC AND SOCIAL PERFORMANCE © OECD 2018
Figure 1.2. Productivity trends
Percentage change at annual rate, total economy
Note: Labour productivity is measured as GDP per hour worked. Trends are estimates using the Hodrick-Prescott
filter (OECD, 2018e, OECD Compendium of Productivity Indicators 2018, OECD Publishing, Paris,
https://doi.org/10.1787/pdtvy-2018-en).
Source: OECD (2018f), OECD Productivity Statistics (database), http://dx.doi.org/10.1787/pdtvy-data-en.
StatLink 2 http://dx.doi.org/10.1787/888933842033
1.7. Advances in data availability
We have discussed many of the changes in the economy that call for changes in metrics.
An important enabler to the development of these new metrics is the availability of new
data sets and advances in technology that allow users to rapidly process and analyse large
bodies of data and to integrate different data sets. This is a theme that will be repeatedly
noted in this book and even more so in its accompanying volume. For instance, indicators
of the income of the very rich could be derived from administrative tax returns, and a
better picture of the entire income distribution could be achieved by merging numerous
administrative data sets (e.g. tax and social security) and survey results. One of the
themes explored by the HLEG was the integration of national accounts with distributional
data (Distribution National Accounts, or DINA; see Chapter 6 in the companion volume).
One of the topics not explored by the HLEG, however, was harnessing the potential of
big data, such as scraping data from the internet or exploiting geo-spatial information to
form indicators, sometimes in real time. This subject is likely to become of increasing
importance in the future – although care is needed to ensure that such data comply to
well-established quality criteria such as ensuring that they are representative of the entire
population.
Total factor productivityLabour productivity
- 0.5
0.0
0.5
1.0
1.5
2.0
2.5
3.0
Germany FranceUnited Kingdom JapanUnited States
- 0.5
0.0
0.5
1.0
1.5
2.0
2.5
3.0
Germany France
United Kingdom Japan
United States
1. THE CONTINUED IMPORTANCE OF THE “BEYOND GDP” AGENDA │ 33
BEYOND GDP: MEASURING WHAT COUNTS FOR ECONOMIC AND SOCIAL PERFORMANCE © OECD 2018
1.8. Policy implications of “Beyond GDP” metrics
As we noted earlier, a major impetus for work going “Beyond GDP” was to improve
policy: what you measure affects what you do. If you don’t measure important
phenomena, you may not act on them. But distorted metrics can be even worse. When
economic metrics don’t include the effects of environmental degradation, we have no way
of knowing whether a country’s welfare is increasing when it expands coal-generated
energy, for example. The owners of coal mines might argue that GDP is being sacrificed
in the name of the environment if the coal mine is shut down, when in reality, correctly
measured, total welfare would increase when the value of the lost GDP is more than
offset by the environmental benefits of cleaner air and reduced risks of climate change.
Similarly, a developing country might allow a foreign company to develop a gold mine
within its territory, believing that doing so will increase GDP, while a correct account of
the impact of the mine on the well-being of the residents in the country might suggest
otherwise. In some (but far from all) countries, better metrics than GDP are produced
within the system of national accounts – such as measures of national product and
national income, sometimes net of the depreciation of capital goods used in production –
that would allow better decisions. But these indicators are not routinely used by those
making decisions.
Similarly, some may suggest that privatising social security will increase GDP as a result
of the increased efficiencies and associated savings by households, while a correct
accounting of the value of social security could show that the private sector may in fact
be less efficient than the government in providing these services even when the private
sector generates profits, and that privatisation may increase individuals’ economic
insecurity.
One of the key examples we develop later is that, because GDP metrics do not fully
capture all of the adverse effects of economic downturns on people’s well-being, less may
have been done by policy-makers to combat the recession than would have been the case
had we had relevant additional or better metrics.
1.9. Conclusions
The Commission report, published in English with the title Mismeasuring Our Lives: Why
GDP Doesn’t Add Up (Stiglitz et al., 2009),25
not only spurred important work by
National Statistical Agencies and academics, but also helped to found a global movement,
which has taken the form of Parliamentary Commissions, statistical initiatives involving
civil society, and central and local government initiatives to use “Beyond GDP” metrics
in their policy determinations. At the international level, one key set of moments of this
global movement is represented by the periodic World Fora on “Statistics, Knowledge
and Policy” organised by the OECD, bringing together civil society, academics, national
statisticians and government officials to move forward the “Beyond GDP” agenda. There
have been conferences in Palermo in 2004, in Istanbul in 2007, in Busan in 2009, in New
Delhi in 2012, in Guadalajara in 2015, and in Incheon in 2018 (where we are launching
this book), with each meeting gathering more people than the previous one.
A key change that has occurred since the Commission report is the broader acceptance of
the need to develop measures of societal welfare, and a stronger appreciation that policies
based narrowly on increasing GDP may be misguided.

34 │ 1. THE CONTINUED IMPORTANCE OF THE “BEYOND GDP” AGENDA
BEYOND GDP: MEASURING WHAT COUNTS FOR ECONOMIC AND SOCIAL PERFORMANCE © OECD 2018
There were multiple reasons for this increased interest. Environmentalists worried that a
focus on GDP resulted in inadequate attention to the environment. And for good reason:
current GDP measures pay no attention to resource depletion or environmental
degradation. Stiglitz’s experience as a member of the US Council of Economic Advisers
under President Clinton is telling. Working with the Under-Secretary of Commerce, he
pushed to expand conventional GDP towards a metric of “green GDP”, including
resource depletion and environmental degradation. Increased coal production might add
to conventionally measured GDP, but that does not take account of the adverse effects on
health from the increased air pollution, or on climate change or on the local environment.
Perhaps not surprisingly, the coal lobby struck back, and Congress threatened to cut off
financing to the federal agencies undertaking this work if they continued to develop these
metrics. These responses made it clear that the coal industry itself believed that what a
country measures affects what it does. If a country measures environmental degradation,
it is more likely it will do something about it. And that is precisely what the politicians
from the coal states did not want to happen.
The same applies in other fields. Those who worried about climate change expressed
concerns about the absence of measures on sustainability and resilience – and argued that,
without such measures, we would pay insufficient attention to these key attributes of a
good economic system.
Those who wanted more active government policies – sometimes involving higher public
expenditures – also wanted a change in metrics. As the next Chapter will make clear, the
costs of recession are not fully captured by GDP. By understating these costs, one is less
likely to take strong counter-measures. So too, a focus on government liabilities, without
looking at assets, induces excessive conservatism in government borrowing in a
recession.
Those who were concerned about social justice, about inequality of outcomes and of
opportunity, worried that the focus on GDP had resulted in insufficient attention to “how
the pie was sliced”. Countries where GDP was increasing but where most people were not
doing well were rated as performing as well as those where the benefits of GDP growth
were more equally shared. They should not have been.
All these reasons have translated into large number of measurement initiatives, at both the
domestic and international levels. When presenting the Commission report in 2009,
President Sarkozy asked INSEE, the French National Statistical Office, to ensure the
implementation of the Commission’s recommendations at the national level, and the
OECD to do the same at the international one, as well as committing his government to
bring the Commission’s arguments to the attention of the whole international
community.26
The response by the statistical community has gone beyond our
expectations, and explains the presence of several official statisticians in the HLEG.
These statistical initiatives (which are described in more detail in the Annex) have
followed a double track. On the one side, they aimed at making better use of statistics that
already existed (e.g. on household living standards, inequalities, environmental
pressures), bringing them together into dashboards aimed at providing a comprehensive
picture of current well-being and of its sustainability. On the other side, they aimed at
building the foundations for new and better statistics on the many aspects of concern to
people and communities that are still inadequately covered by official statistics. Progress
in both directions is needed to meet the Commission’s goal to shift the focus of our
statistical system from measuring the volume of economic production to measuring the
conditions of people “here and now” and assuring their sustainability tomorrow.
1. THE CONTINUED IMPORTANCE OF THE “BEYOND GDP” AGENDA │ 35
BEYOND GDP: MEASURING WHAT COUNTS FOR ECONOMIC AND SOCIAL PERFORMANCE © OECD 2018
The response to the Commission report has also gone beyond the development of new
metrics, to explore ways of making systematic use of these metrics directly in the policy
process. As highlighted in Chapter 4, having a dashboard of well-being indicators is, in
some cases, not enough. What is needed are institutional tools to force public agencies to
act based on the evidence provided by these indicators, and to overcome the silo thinking
whereby each agency pursues its own narrow goal, without paying attention to how their
actions impact on the goal pursued by other government departments and with unintended
negative effects being recognised only after the damage has been done. In some countries
(e.g. France, Italy), national parliaments, assigned the task of allocating budgets, have
pushed for better metrics, because they worried that inadequate metrics would induce
wrong budgetary allocations. In others (e.g. New Zealand) it was Treasuries who took the
lead in developing broad frameworks – encompassing sustainability, inequalities and
risks – as tools to help their officials when designing policy reforms or providing advice
to other government departments. In other countries yet, policy use of well-being metrics
has focused on aligning priorities and actions across government departments and levels
of administration (Scotland) and on identifying “what works best” in achieving specific
goals (the United Kingdom), leveraging the initiatives of various public agencies and
actors in the pursuit of higher level goals.
While all these initiatives, which are described in more detail in Chapter 4, are fairly
recent, they share a common ambition: to anchor in policy practice societal concerns that
currently don’t receive the attention they deserve by policy-makers. The hope is that a
discussion of measurement would lead to more democratic engagement around the central
questions facing all societies. What do we value? What should we measure? What should
we pay more attention to?
Notes
1. Speech at University of Kansas, March 18, 1968.
2. The picture of the state of the economy provided by these early GDP estimates came as a shock
to observers who had, until then, relied on partial data on production, employment and sales for
different industries and regions: For the United States “the volume of net income paid out to
individuals shrank by 40% during this (1929-32) three year period” (US Congress, 1934).
3. The joke of Paul Samuelson is famous: “what happens to GDP when a professor marries his
servant?”
4. In the same article, Simon Kuznets – moving from the observation that “no one would welcome
an acceleration of the overall rate of economic growth that was associated primarily with a market
increase in defence expenditure” – argued that “effort must be exerted to formulate a consensus
(on a list of desirable contents of economic growth, omitting the vulgar, the frivolous and the
dangerous)... and to reformulate it in response to changing conditions” (Kuznets, 1962).
5. Speech at the University La Sorbonne in Paris, 14 September 2009, for the launch of the
Commission’s report.
6. On 15 October 2007, commenting on “The Recent Financial Turmoil and its Economic and
Financial Consequences” at the Economic Club in New York, Ben Bernake (Chair of the US
Federal Reserve from 2006 to 2014) noted that: “the financial system entered the episode of the
past few months with strong capital positions and a robust infrastructure. The banking system is
healthy. Despite a few notable failures, hedge funds overall seem to have held up well, and their
counterparties have not sustained material losses. The clearing and settlement infrastructure
generally worked well despite trading volumes that were extremely high in some cases.
36 │ 1. THE CONTINUED IMPORTANCE OF THE “BEYOND GDP” AGENDA
BEYOND GDP: MEASURING WHAT COUNTS FOR ECONOMIC AND SOCIAL PERFORMANCE © OECD 2018
Nevertheless, the market strains were serious… and they posed risks to the broader economy”
(www.federalreserve.gov/newsevents/speech/bernanke20071015a.htm). In August 2008, Olivier
Blanchard – who was to take up his role as IMF chief economist on the following month – wrote
about the state of macro-economics as a field to conclude “The state of macro is good” (Blanchard,
2009). This was just as the economics profession as a whole failed to anticipate the most
significant macro-economic event in three-quarters of a century, with the dominant DSGE
(dynamic stochastic general equilibrium) model saying that a crisis of such features and proportion
couldn’t or wouldn’t happen. They were unable to provide the analytic framework to address the
crisis, including answering key policy questions. It was a financial crisis, and yet in the standard
DSGE model the banking system, the wider financial system, credit rationing, or liquidity made no
significant appearance. Perhaps even more remarkable, after the depth and severity of the crisis
became apparent, Bernanke would write that there had been nothing wrong with the underlying
models, only with their implementation (Lectures at Princeton University, Bernanke, 2014).
7. Comments made by Alan Greenspan at the Economic Club of New York on 20 May 2005.
Greenspan also noted: “Without calling the overall national issue a bubble it’s pretty clear that it’s
an unsustainable underlying pattern”, with “a lot of local bubbles” around the country
(www.federalreserve.gov/boarddocs/speeches/2005/200505202/default.htm).
8. The need to develop data on institutional balance sheets was recognised by the G20 as part of
the G20 Data Gap Initiative led by the IMF and the Financial Stability Board and implemented by
several international organisations. The G20 Data Gap Initiative includes 23 recommendations.
Recommendation II.8 (on sectoral accounts, including “from-whom-to-whom” information, i.e.
financial relations by sector of origin and destination) and recommendation II.9 (which is about
incorporating information on distribution in the system of national accounts household account)
are led by the OECD.
9. US quarterly GDP growth for the 3rd and 4th quarter of 2009, which was originally estimated
by the Bureau of Economic Analysis at -0.5% (actual rate) was revised downwards 3 years later
(in steps) to -1.6%. The final estimate for average GDP growth over these two quarters was finally
set at -1.3%.
10. In the euro area, GDP per capita increased by a cumulative 0.7% from 2009 to 2012, while
household disposable income per capita fell over the same period by -0.7%, i.e. a gap of 1.8 point.
The gap was larger in countries most affected by the Great Recession (e.g. in Spain real GDP
contracted over the same period by -1.6% while household income fell by -3.6%) while it had the
opposite sign in a few OECD countries – e.g. in the US, growth of real household income (at
1.5%) slightly exceed that of real GDP (at 1.3%).
11. The transfer of intellectual property assets within multinational enterprises was significantly
incentivised by Ireland’s favourable tax system.
12. There were many other factors contributing to the growing lack of trust, and there are, to our
knowledge, no good studies parsing out the relative role of these factors. For instance, many
commentators cite the lack of accountability of the bankers who were viewed as causing the crisis
– the bailouts centred on the banks rather than helping those who had suffered from predatory
lending. Thus, there was a sense that the decisions about the response to the crisis were often in the
hands of the very people who had brought on the crisis. This increased the sense that people have
little control over what their government does: on average, only one third of people in OECD
countries feel that they have some influence on what their government does (OECD, 2017b,
p. 183). For a more extensive discussion of trust, see Chapter 10 by Yann Algan in the companion
volume and Chapter 3 in this volume.
13. The Commission had as one of its central missions ensuring that our metrics drew our attention
to those things that made a difference in the lives of ordinary people.
1. THE CONTINUED IMPORTANCE OF THE “BEYOND GDP” AGENDA │ 37
BEYOND GDP: MEASURING WHAT COUNTS FOR ECONOMIC AND SOCIAL PERFORMANCE © OECD 2018
14. The members of the Commission were Bina Agarwal, University of Delhi; Kenneth J. Arrow,
Stanford University; Anthony B. Atkinson, Nuffield College, Oxford; François Bourguignon, Paris
School of Economics; Jean-Philippe Cotis, Insee; Angus S. Deaton, Princeton University; Kemal
Dervis, UNPD ; Marc Fleurbaey, Université Paris 5 ; Nancy Folbre, University of Massachusetts ;
Jean Gadrey, Université de Lille ; Enrico Giovannini, OECD; Roger Guesnerie, Collège de France,
Paris; James J. Heckman, Chicago University; Geoffrey Heal, Columbia University; Claude
Henry, Sciences-Po/Columbia University; Daniel Kahneman, Princeton University; Alan B.
Krueger, Princeton University; Andrew J. Oswald, University of Warwick; Robert D. Putnam,
Harvard University; Nick Stern, London School of Economics; Cass Sunstein, University of
Chicago; and Philippe Weil, Sciences-Po, Paris.
15. Assuming that there exist complete markets for future goods as well.
16. Abramovitz (1959) noted that: “Since Pigou … economists have generally distinguished
between ... welfare at large, and the narrower concept of economic welfare”, with “national
product taken to be the objective and measurable counterpart of economic welfare”. Easterlin
(1974) further noted that Arthur Pigou first expressed the “clear presumption that changes in
economic welfare indicate changes in social welfare in the same direction, if not in the same
degree”.
17. www.oecd-6wf.go.kr/eng/main.do.
18. www.oecd.org/statistics/better-life-initiative.htm.
19. In his final State of the Union Address in 2016, President Obama described rising income
inequality as the “defining challenge of our time”
(www.nytimes.com/2016/01/13/us/politics/obama-2016-sotu-transcript.html).
20. www.oecd.org/sdd/measuring-distance-to-the-sdgs-targets.htm.
21. See Doyle and Stiglitz (2014). Condensed and reprinted in Ministers Reference Book
Commonwealth 2015, London: Henley Media Group, pp. 86-88.
22. See for example the Slovenian National Development Strategy:
www.vlada.si/en/projects/slovenian_development_strategy_2030/.
23. Within Europe, several Statistical Offices have taken steps to account for “quality changes” in
the volume measures for various types of government services (Eurostat, 2016).
24. This work is being pursued through a collaboration between the OECD and IMF.
25. Also published in French by Odile Jacob under the title Richesse des nations et bien-être des
individus, in Chinese (reduced version) by Xinhua, in Italian by Etas, in Korean by Dongnyok, and
in Spanish by RBA.
26. Following the French initiative, the G20 Leaders released a statement in Pittsburgh (November
2009) and Toronto (June 2010) encouraging “work on measurement methods so as to better take
into account the social and environmental dimensions of economic development”. In Europe, the
EU Commission issued a communication to the European Council and Parliament in 2009 on
“GDP and beyond: Measuring progress in a changing world”, which referred to the Commission
report. This communication identified five concrete actions aimed at: 1) complementing GDP with
better environmental and social indicators; 2) developing (near) real time information for decision
making; 3) reporting more accurate information on distribution and inequalities; 4) developing a
European scoreboard on sustainable development; and 5) extending the National Accounts to
cover environmental and social issues.

2. THE MEASUREMENT OF ECONOMIC DOWNTURNS │ 39
BEYOND GDP: MEASURING WHAT COUNTS FOR ECONOMIC AND SOCIAL PERFORMANCE © OECD 2018
Chapter 2. The measurement of economic downturns
This chapter summarises how inadequate metrics (and models) might have affected the
assessment of, and response to, the 2008 crisis, and what can be done about it. It argues
that GDP may have given an over-optimistic account of how well the economy was doing
both prior to the crisis and in the recovery phase, and of the sustainability of growth. The
problem was that too many analysts didn’t look beyond GDP. If we had had better
metrics, including measures that had incorporated more adequately the increases in
people’s economic insecurity, we might have realised that the consequences of the
downturn were deeper than the GDP statistics indicated, and governments may have
responded more strongly to mitigate the negative impacts of the crisis. The chapter
emphasises two shortcomings in standard metrics: only looking at government liabilities
while ignoring the asset side of the government (and country’s) balance sheet, and
ignoring measures (broader than the standard unemployment metrics) of the unused
resources in the labour market. It stresses the need to complete existing data with
measures of economic security and subjective well-being, and to include changes in
human and social capital in models.
The statistical data for Israel are supplied by and under the responsibility of the relevant Israeli authorities.
The use of such data by the OECD is without prejudice to the status of the Golan Heights, East Jerusalem and
Israeli settlements in the West Bank under the terms of international law.
40 │ 2. THE MEASUREMENT OF ECONOMIC DOWNTURNS
BEYOND GDP: MEASURING WHAT COUNTS FOR ECONOMIC AND SOCIAL PERFORMANCE © OECD 2018
2.1. Introduction
National income accounting began as part of Keynesian economics, as we noted earlier.
The hope was that, if we measured GDP better, we might be able to better manage the
business cycle and to avoid extended periods of recession. Some also hoped that, based
on these data, we could build up models to anticipate recessions, and take pre-emptive
action to head them off. So, it is fitting that we begin with an issue within the spirit of
these origins. Do our metrics accurately portray the costs or magnitude of downturns,
such as the Great Recession? More generally, do they provide the information we need to
assess whether the economy is vulnerable to an economic downturn?
This issue is perhaps of particular salience because the Commission report was released
only a few months after the default of Lehman Brothers in September 2008, which
triggered the financial crisis. The significance of the crisis was present in the mind of the
Commission members. They noted that GDP was not a measure of sustainability. In the
run up to the Great Recession, it was evident that US GDP growth had been built on a
mountain of private debt, itself partly the consequence of an overvaluation of (real estate)
assets, that is a market failure of a gigantic size. This chapter summarises how inadequate
metrics (and models) might have affected the assessment of, and the response to, the
crisis, and what can be done about it.
2.2. The right choice of metrics
As seen in Chapter 1, the problems with the information content of standard economic
metrics began even before the crisis. Many people thought their economy was in better
shape than it actually was. In the United States, where the crisis originated, GDP was
growing strongly. Yet, it was clear that much of that GDP growth was based on a real
estate bubble that was leading households and firms to consume and invest more than
would have been justified by a more sober assessment of market conditions; and that
some of the US government’s strong fiscal position was a result of tax revenues garnered
as a result of that real estate bubble.1
Though GDP may have given an over-optimistic account of how well the economy was
doing, and whether growth was sustainable, the real problem was that too many analysts
didn’t look beyond GDP.2 A dashboard of indicators such as the one suggested by the
Commission, including measures providing accurate information on financial fragility,
would certainly have helped. But, more fundamentally, analysts and decision makers
should have abandoned the ideological blinders that stood in the way of getting a good
understanding of how the economic system works.
When there are symptoms that the economy might be in a real estate bubble, say when the
ratio of median housing prices to median income is abnormally high,3 then one might
want to look more closely at a set of indicators of the financial health of the economy and
of its banking system. Real estate bubbles are associated with rapid increases in bank
lending. A simple analysis of the fraction of households who might face difficulties in
refinancing their mortgage, or who might not have incentives to repay their loans in the
event of a significant fall in house prices, would have shown the economy’s financial
fragility.4
This illustrates that care must be exercised in the choice of the relevant indicators. Some
analysts looked at average house prices compared to the average level of household
indebtedness: if all households were the same, the crisis would not have occurred, for
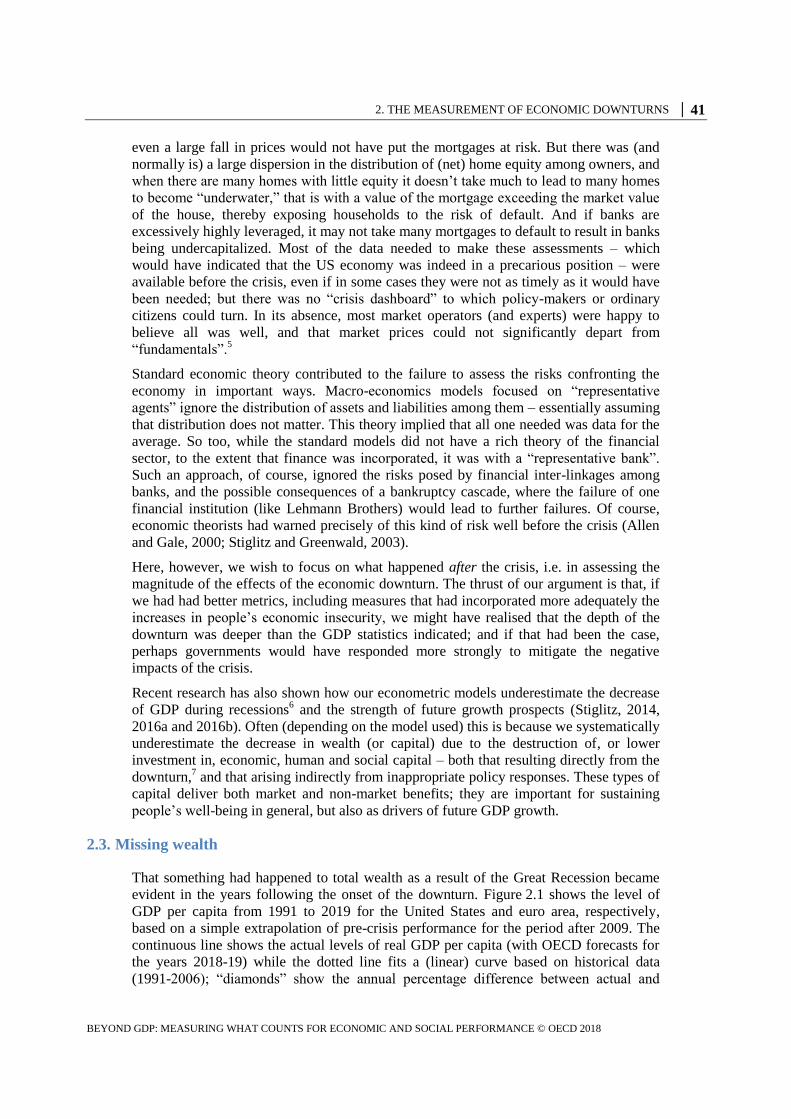
2. THE MEASUREMENT OF ECONOMIC DOWNTURNS │ 41
BEYOND GDP: MEASURING WHAT COUNTS FOR ECONOMIC AND SOCIAL PERFORMANCE © OECD 2018
even a large fall in prices would not have put the mortgages at risk. But there was (and
normally is) a large dispersion in the distribution of (net) home equity among owners, and
when there are many homes with little equity it doesn’t take much to lead to many homes
to become “underwater,” that is with a value of the mortgage exceeding the market value
of the house, thereby exposing households to the risk of default. And if banks are
excessively highly leveraged, it may not take many mortgages to default to result in banks
being undercapitalized. Most of the data needed to make these assessments – which
would have indicated that the US economy was indeed in a precarious position – were
available before the crisis, even if in some cases they were not as timely as it would have
been needed; but there was no “crisis dashboard” to which policy-makers or ordinary
citizens could turn. In its absence, most market operators (and experts) were happy to
believe all was well, and that market prices could not significantly depart from
“fundamentals”.5
Standard economic theory contributed to the failure to assess the risks confronting the
economy in important ways. Macro-economics models focused on “representative
agents” ignore the distribution of assets and liabilities among them – essentially assuming
that distribution does not matter. This theory implied that all one needed was data for the
average. So too, while the standard models did not have a rich theory of the financial
sector, to the extent that finance was incorporated, it was with a “representative bank”.
Such an approach, of course, ignored the risks posed by financial inter-linkages among
banks, and the possible consequences of a bankruptcy cascade, where the failure of one
financial institution (like Lehmann Brothers) would lead to further failures. Of course,
economic theorists had warned precisely of this kind of risk well before the crisis (Allen
and Gale, 2000; Stiglitz and Greenwald, 2003).
Here, however, we wish to focus on what happened after the crisis, i.e. in assessing the
magnitude of the effects of the economic downturn. The thrust of our argument is that, if
we had had better metrics, including measures that had incorporated more adequately the
increases in people’s economic insecurity, we might have realised that the depth of the
downturn was deeper than the GDP statistics indicated; and if that had been the case,
perhaps governments would have responded more strongly to mitigate the negative
impacts of the crisis.
Recent research has also shown how our econometric models underestimate the decrease
of GDP during recessions6 and the strength of future growth prospects (Stiglitz, 2014,
2016a and 2016b). Often (depending on the model used) this is because we systematically
underestimate the decrease in wealth (or capital) due to the destruction of, or lower
investment in, economic, human and social capital – both that resulting directly from the
downturn,7 and that arising indirectly from inappropriate policy responses. These types of
capital deliver both market and non-market benefits; they are important for sustaining
people’s well-being in general, but also as drivers of future GDP growth.
2.3. Missing wealth
That something had happened to total wealth as a result of the Great Recession became
evident in the years following the onset of the downturn. Figure 2.1 shows the level of
GDP per capita from 1991 to 2019 for the United States and euro area, respectively,
based on a simple extrapolation of pre-crisis performance for the period after 2009. The
continuous line shows the actual levels of real GDP per capita (with OECD forecasts for
the years 2018-19) while the dotted line fits a (linear) curve based on historical data
(1991-2006); “diamonds” show the annual percentage difference between actual and
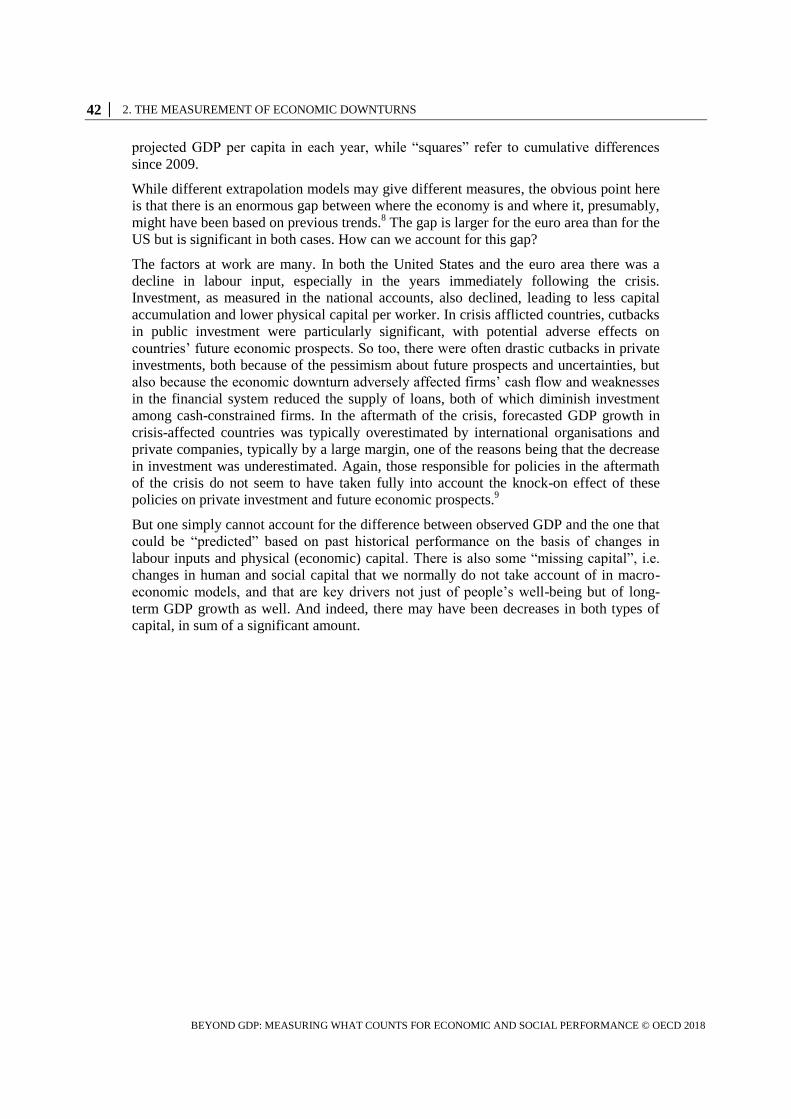
42 │ 2. THE MEASUREMENT OF ECONOMIC DOWNTURNS
BEYOND GDP: MEASURING WHAT COUNTS FOR ECONOMIC AND SOCIAL PERFORMANCE © OECD 2018
projected GDP per capita in each year, while “squares” refer to cumulative differences
since 2009.
While different extrapolation models may give different measures, the obvious point here
is that there is an enormous gap between where the economy is and where it, presumably,
might have been based on previous trends.8 The gap is larger for the euro area than for the
US but is significant in both cases. How can we account for this gap?
The factors at work are many. In both the United States and the euro area there was a
decline in labour input, especially in the years immediately following the crisis.
Investment, as measured in the national accounts, also declined, leading to less capital
accumulation and lower physical capital per worker. In crisis afflicted countries, cutbacks
in public investment were particularly significant, with potential adverse effects on
countries’ future economic prospects. So too, there were often drastic cutbacks in private
investments, both because of the pessimism about future prospects and uncertainties, but
also because the economic downturn adversely affected firms’ cash flow and weaknesses
in the financial system reduced the supply of loans, both of which diminish investment
among cash-constrained firms. In the aftermath of the crisis, forecasted GDP growth in
crisis-affected countries was typically overestimated by international organisations and
private companies, typically by a large margin, one of the reasons being that the decrease
in investment was underestimated. Again, those responsible for policies in the aftermath
of the crisis do not seem to have taken fully into account the knock-on effect of these
policies on private investment and future economic prospects.9
But one simply cannot account for the difference between observed GDP and the one that
could be “predicted” based on past historical performance on the basis of changes in
labour inputs and physical (economic) capital. There is also some “missing capital”, i.e.
changes in human and social capital that we normally do not take account of in macro-
economic models, and that are key drivers not just of people’s well-being but of long-
term GDP growth as well. And indeed, there may have been decreases in both types of
capital, in sum of a significant amount.
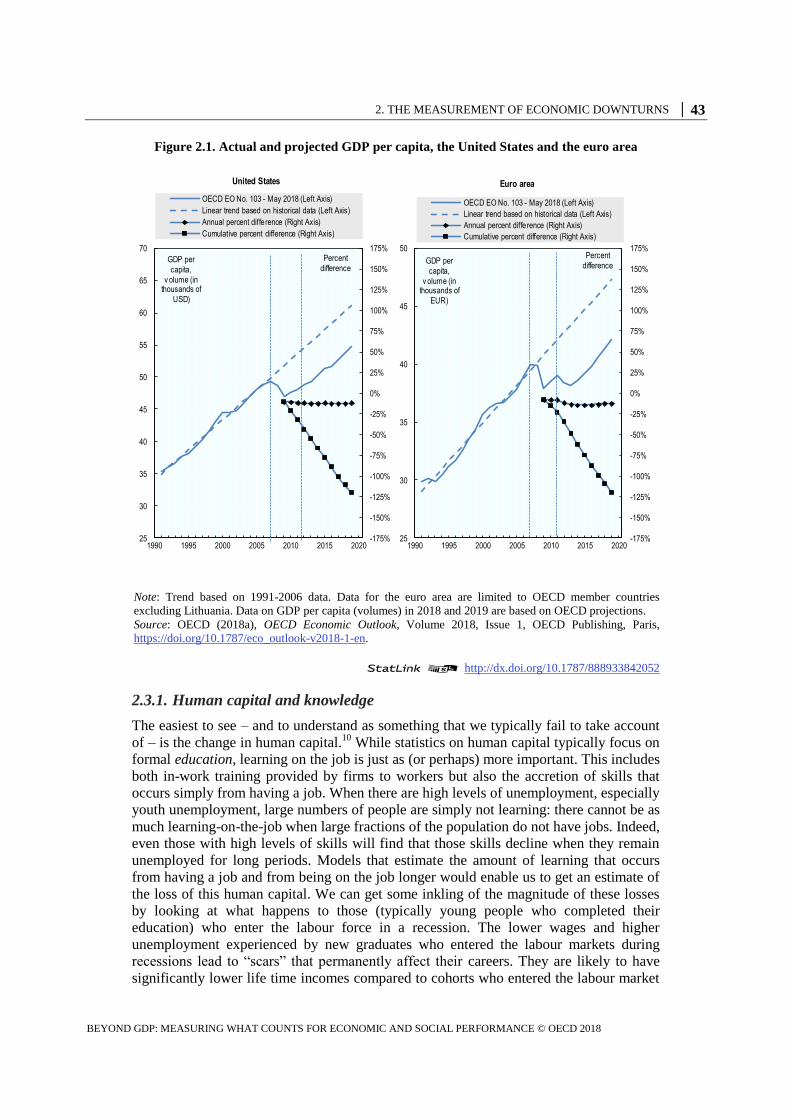
2. THE MEASUREMENT OF ECONOMIC DOWNTURNS │ 43
BEYOND GDP: MEASURING WHAT COUNTS FOR ECONOMIC AND SOCIAL PERFORMANCE © OECD 2018
Figure 2.1. Actual and projected GDP per capita, the United States and the euro area
Note: Trend based on 1991-2006 data. Data for the euro area are limited to OECD member countries
excluding Lithuania. Data on GDP per capita (volumes) in 2018 and 2019 are based on OECD projections.
Source: OECD (2018a), OECD Economic Outlook, Volume 2018, Issue 1, OECD Publishing, Paris,
https://doi.org/10.1787/eco_outlook-v2018-1-en.
StatLink 2 http://dx.doi.org/10.1787/888933842052
2.3.1. Human capital and knowledge
The easiest to see – and to understand as something that we typically fail to take account
of – is the change in human capital.10
While statistics on human capital typically focus on
formal education, learning on the job is just as (or perhaps) more important. This includes
both in-work training provided by firms to workers but also the accretion of skills that
occurs simply from having a job. When there are high levels of unemployment, especially
youth unemployment, large numbers of people are simply not learning: there cannot be as
much learning-on-the-job when large fractions of the population do not have jobs. Indeed,
even those with high levels of skills will find that those skills decline when they remain
unemployed for long periods. Models that estimate the amount of learning that occurs
from having a job and from being on the job longer would enable us to get an estimate of
the loss of this human capital. We can get some inkling of the magnitude of these losses
by looking at what happens to those (typically young people who completed their
education) who enter the labour force in a recession. The lower wages and higher
unemployment experienced by new graduates who entered the labour markets during
recessions lead to “scars” that permanently affect their careers. They are likely to have
significantly lower life time incomes compared to cohorts who entered the labour market
-175%
-150%
-125%
-100%
-75%
-50%
-25%
0%
25%
50%
75%
100%
125%
150%
175%
25
30
35
40
45
50
55
60
65
70
1990 1995 2000 2005 2010 2015 2020
Percent
differenceGDP per
capita,
v olume (in thousands of
USD)
United States
OECD EO No. 103 - May 2018 (Left Axis)
Linear trend based on historical data (Left Axis)
Annual percent difference (Right Axis)
Cumulative percent difference (Right Axis)
-175%
-150%
-125%
-100%
-75%
-50%
-25%
0%
25%
50%
75%
100%
125%
150%
175%
25
30
35
40
45
50
1990 1995 2000 2005 2010 2015 2020
Percent
differenceGDP per
capita,
v olume (in thousands of
EUR)
Euro area
OECD EO No. 103 - May 2018 (Left Axis)
Linear trend based on historical data (Left Axis)
Annual percent difference (Right Axis)
Cumulative percent difference (Right Axis)

44 │ 2. THE MEASUREMENT OF ECONOMIC DOWNTURNS
BEYOND GDP: MEASURING WHAT COUNTS FOR ECONOMIC AND SOCIAL PERFORMANCE © OECD 2018
during phases of expansion (Garrouste and Godard, 2016; Kahn, 2010; Oreopoulos, von
Wachter and Heisz, 2012).11
In crisis-affected countries, formal schooling was affected too, but in less visible ways.
While the share of public expenditure in GDP increased marginally (on average and in
most OECD countries) from 2008 to 2014, it declined (by 0.2 point or more) in countries
most affected by the crisis such as Italy and Spain (Figure 2.2, top panel). Of course,
when considered in absolute terms, the decrease in public education expenditure was
larger, as GDP was falling or increasing by less than before the crisis. The effect of the
crisis on private expenditures on education is more ambiguous: cash-constrained
households cut back spending on education but many young people stayed in school for
longer, as fewer jobs were available – i.e. the opportunity cost of education is lower. In
Italy and Spain, the reduction in public spending in education simply shifted the costs to
households, whose private spending increased.
Overall, the recession may have led to a regression in the state of knowledge, including
institutional knowledge held within organisations/firms, and studies have shown that such
knowledge accounts for a large part of multi-factor productivity growth (OECD, 2013a).
The bankruptcies that abound in an economic downturn lead to a destruction of this
institutional knowledge. Even when knowledge is not destroyed, the pace of creation of
new knowledge is reduced, as both public and private investments in knowledge are
reduced. Because the effects of cutbacks in such investments will only be felt years later,
it is often far easier to make cutbacks in these expenditures than, say, on the wage bill.
This shows the importance of developing better metrics of human capital that encompass
all forms of knowledge, and to take this into account in conventional “growth
accounting” models.12
This issue is discussed in more detail in the chapter by De Smedt,
Giovannini and Radermacher in the companion volume.
Another important aspect of human capital is health. Whether or not the economic crisis
and the macro-economic policies implemented in its aftermath had an effect in worsening
the health conditions of the population in the affected countries is an issue debated by
researchers, including HLEG members. On the one hand, a plausible case can be made
that individuals who lose their jobs may suffer adverse mental health effects, partly
because of the emotional effects of unemployment, including stress. Long periods of
unemployment can also have particularly large adverse effects on people’s health, and
give rise to a vicious cycle, with poor health leading to poor job prospects and low
incomes, reinforcing weak health. So too, cutbacks in health services in some European
countries resulting from austerity policies (most notably in Greece) may have long-run
effects on the health of the population (Kentikelenis et al., 2014). There is also some
evidence that these health consequences directly affect economic performance years after
the crisis (IMF, 2013). The US low labour force participation rate is in part explained by
the poor health status of a large fraction of those not in the labour force, with nearly half
of them being on prescription pain medication (CEA, 2016; Krueger, 2017).
On the other hand, other empirical studies have failed to detect a significant effect of the
recession on health conditions. Most OECD countries experienced higher spending (as a
share of GDP) in both public and private health-care spending (Figure 2.2, bottom
panel).13
In the United States, the decrease in life expectancy among middle-aged whites,
which mainly affected low-educated people due to what Case and Deaton (2015) refer to
as “deaths of despair”, started well before the crisis, and does not appear to have
intensified since then. And while most OECD countries experienced a decline in life
expectancy in 2015, it represented a unique occurrence – the decline reversed in 2016 –
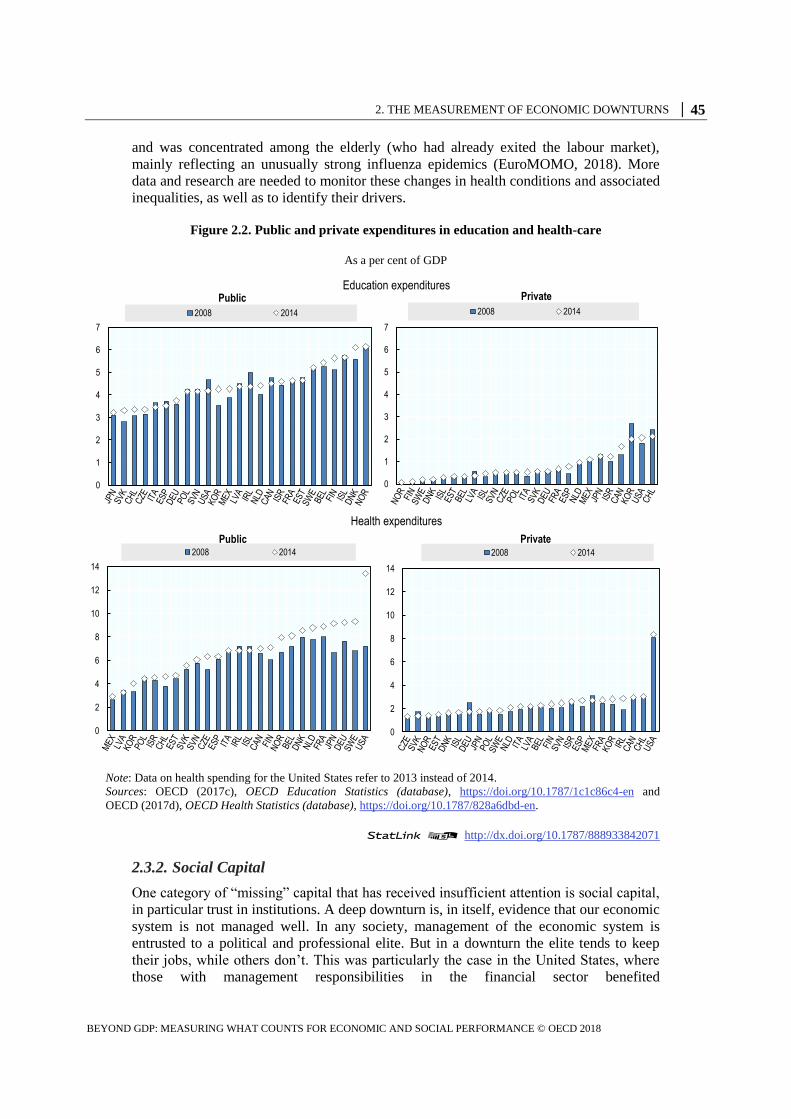
2. THE MEASUREMENT OF ECONOMIC DOWNTURNS │ 45
BEYOND GDP: MEASURING WHAT COUNTS FOR ECONOMIC AND SOCIAL PERFORMANCE © OECD 2018
and was concentrated among the elderly (who had already exited the labour market),
mainly reflecting an unusually strong influenza epidemics (EuroMOMO, 2018). More
data and research are needed to monitor these changes in health conditions and associated
inequalities, as well as to identify their drivers.
Figure 2.2. Public and private expenditures in education and health-care
As a per cent of GDP
Note: Data on health spending for the United States refer to 2013 instead of 2014.
Sources: OECD (2017c), OECD Education Statistics (database), https://doi.org/10.1787/1c1c86c4-en and
OECD (2017d), OECD Health Statistics (database), https://doi.org/10.1787/828a6dbd-en.
StatLink 2 http://dx.doi.org/10.1787/888933842071
2.3.2. Social Capital
One category of “missing” capital that has received insufficient attention is social capital,
in particular trust in institutions. A deep downturn is, in itself, evidence that our economic
system is not managed well. In any society, management of the economic system is
entrusted to a political and professional elite. But in a downturn the elite tends to keep
their jobs, while others don’t. This was particularly the case in the United States, where
those with management responsibilities in the financial sector benefited
Education expenditures
Health expenditures
0
1
2
3
4
5
6
7
Public
2008 2014
0
1
2
3
4
5
6
7
Private
2008 2014
0
2
4
6
8
10
12
14
Public2008 2014
0
2
4
6
8
10
12
14
Private2008 2014
46 │ 2. THE MEASUREMENT OF ECONOMIC DOWNTURNS
BEYOND GDP: MEASURING WHAT COUNTS FOR ECONOMIC AND SOCIAL PERFORMANCE © OECD 2018
disproportionately from the economic system in the run-up to the crisis but were not in
any way held accountable, even in the many cases where they engaged in socially
reprehensible behaviour.14
Meanwhile, ordinary citizens were not only losing their jobs,
but also their homes and more. To many, it appeared that the economic system was
“rigged” to benefit a few. Workers and middle-class families saw themselves as
hardworking, yet reaping little reward for their work. They had been promised that
globalisation, new technologies and the liberalisation of the financial system would
increase their living standards. In reality, these changes in the economic system did not
lead to the faster growth promised, but what growth did occur went disproportionately to
the top. This not only implied growing inequality, but was also followed by the most
serious crisis in three quarters of a century.
Even the recovery may have given rise to a decrease in trust, with politicians declaring
the end to a recession even as most continued to suffer its consequences. In short, there
were multiple reasons for the loss of trust in the economy and in institutions. Later in this
book, we will describe more fully the relationship between trust and economic
performance. Here, we simply note that this loss of trust can be thought of as an erosion
of social capital, another part of the explanation of the “missing” capital. Having an
accounting system that could reliably trace changes in economic, human and social
capital would provide the basis for a better understanding of the costs of economic
downturns – which in turn could induce governments to take more resolute actions in
responding during a recession.
2.4. Economic security and subjective well-being
The “missing capitals” that we discussed above can be understood as drivers of both
people’s well-being and GDP growth. Beyond these effects, however, there are several
other ways in which our system of economic indicators does not adequately reflect the
true consequences (i.e. the costs) of recessions.
For instance, we observed earlier that an important aspect of individual well-being is
economic security. Individuals spend large amounts of money to buy insurance against
many of the risks they face. Markets, however, fail to provide insurance against some of
the most important risks, like the loss of a job. In response, governments have provided a
variety of forms of social insurance, most notably unemployment insurance, based on the
idea of pooling risks among different groups of workers. In a number of European
countries, as well as in the United States, unemployment benefits were increased in the
earlier years of the crisis to cushion the negative income impact of the increase in
unemployment. But in most countries, unemployment insurance covers only a fraction of
those who don’t have jobs. In most countries, it does not cover those entering the labour
force, who may have spent large amounts of money and invested considerable time in the
hope that education would enable them to get a suitable job.15
And very few countries
provide insurance for under-employment, as in the case of self-employed people who see
their incomes contract as their sales get reduced. In addition, because of the lack of
adequate insurance, some people may also lose their homes when their earnings fall. Few
countries have designed mortgages that enable individuals to postpone repayments in
periods when they have lost their jobs.
The longer a recession lasts, the greater the cost for people’s economic security. Better
measures of economic insecurity would have shown the large losses caused to individuals
by the crisis in this respect.

2. THE MEASUREMENT OF ECONOMIC DOWNTURNS │ 47
BEYOND GDP: MEASURING WHAT COUNTS FOR ECONOMIC AND SOCIAL PERFORMANCE © OECD 2018
More broadly, individuals’ sense of well-being fell sharply in the countries most affected
by the recession,16
and especially so for those who lost their jobs or for young people who
didn’t get one. People who become unemployed report lower life-evaluations, even after
controlling for their lower income. These adverse effects persist over time. The
unemployed also report higher prevalence of various negative experiences (sadness, stress
and pain) and lower levels of positive ones (joy, contentment, optimism). These
subjective experiences suggest that the costs of unemployment exceed the income-loss
suffered by those who lose their jobs, reflecting the existence of non-pecuniary effects
associated with unemployment, and the fears and anxieties generated by unemployment
in the rest of society.
Research has provided what might seem obvious explanations for these patterns.
Individuals look to work as an important part of their identity and sense of worth.
Someone who cannot support his family loses face with himself, his family, and those he
or she associates with. Being connected to others is also important for people’s sense of
well-being, and the workplace is one of the main sources of connectedness in our society.
Individuals who lose their jobs thus feel more isolated, and more unhappy (De Neve,
2018). Measures of subjective well-being, the importance of which were emphasized in
the Commission report, would have indicated this.
2.5. Economies never fully recover from a deep downturn
In short, had policy-makers relied on a dashboard of indicators, which reflected more
broadly what was going on in the economy and society, they would have realized the
severity of the economic downturn for well-being. The decline in the “true wealth” of the
country should have been of particular concern in those countries most afflicted by the
crisis such as Greece, Spain, Ireland, Italy and Portugal, as it undermined their economic
potential in the future.
Economies that experience deep downturns may never fully recover. Figure 1.1 and
Figure 1.2 illustrate what is at stake. Even when GDP growth returns, it is never
sufficiently strong to close the gap between where the level of the economy was and
where it would have been. And even if growth returns to its pre-recession rates (without
closing the original GDP gap in levels), the present discounted value of the loss is
enormous.17
Beyond the effects of the crisis on the level of GDP, there is a debate on whether the
long-term effects of a deep recession also extend to its future growth rate. Recent
research has suggested that, while economies never recover to the pre-crisis level of GDP,
the long-term growth rate is unaffected.18
This is what we should expect from standard
growth theories, where the pace of technological change is exogenous to the system (i.e.
“manna from heaven”). But, as we argued above, deep downturns affect human capital
and impair a country’s capacities to invest in research, which may affect growth for an
extended period of time. Note that Figure 2.1 shows that rates of GDP growth post-
recession in both the United States and the euro area are lower than prior to it. While the
growth slowdown started before the crisis,19
the crisis may well have intensified it. The
real estate bubble burst two years before the crisis, and its full impact took time to be felt.
Moreover, distortions associated with the crisis, with excessive resources going into real
estate, would themselves undermine a country’s long-run growth potential. More
fundamentally, whether the economy might eventually recover its growth rate may not be
as important as the question of how long it takes. The longer it takes, the greater the
cumulative value (discounted) of the loss. Interventions that more quickly restore the
48 │ 2. THE MEASUREMENT OF ECONOMIC DOWNTURNS
BEYOND GDP: MEASURING WHAT COUNTS FOR ECONOMIC AND SOCIAL PERFORMANCE © OECD 2018
economy to full employment may, accordingly, reduce the cumulative loss by a
substantial amount.
2.6. The misuse of existing metrics: A misplaced focus on government liabilities
The other side of the coin when discussing the implications of our measurement system is
the cost of responding to the crisis. An inappropriate use of statistics may have led many
countries to overestimate this cost. A standard tool for managing the business cycle over
the past three-quarters of a century has been an increase in government spending which,
in a deep economic downturn with high levels of unemployment, can generate an increase
in GDP that is a multiple of the original spending (Blanchard and Leigh, 2013). This is
especially the case when such policy is put in place through concerted action of different
governments.20
But in economic downturns, tax revenues are down and, especially in
countries with more developed social safety nets, public expenditures are already high, so
that fiscal deficits increase. Government spending, unaccompanied by increases in taxes,
naturally leads to further increases in the public deficit. Some governments, focusing
narrowly on this increase in public deficit and debt, argued against responding to the
downturn with more government spending. Indeed, in Europe, a strict interpretation of the
Growth and Stability Pact would require that euro-area governments keep their deficits
below 3% of GDP even during a recession – although de facto many euro area countries
exceeded the 3% limit as a consequence of the crisis, and a number of them have public
debt levels above the 60% target.21
Whatever their merits in providing the basis of
sustained long-term growth and mitigating cross border financial and economic problems
within the euro zone, it is clear that the deficit and debt limits hamper the functioning of
automatic stabilisers (the tendency for public deficit to increase when growth falters), just
as the very moment when those stabilizers are most needed. In practice, the enforcement
of the constraints has converted government fiscal policy from being counter-cyclical to
being pro-cyclical, exacerbating economic downturns, an effect that was most evident in
crisis-affected countries.
This focus on government liabilities is, we would argue, another example of a misuse of
data. What matters for the country as a whole going forward is the nation’s balance sheet,
along with balance sheets of all institutional sectors, i.e. households, private companies,
the government and the rest of the world. The balance sheet looks at both assets and
liabilities. If the increased government expenditure takes the form of higher investments –
whether in people, technology or infrastructure – its balance sheet should not deteriorate,
as assets and liabilities increase by the same amount. It is simply a mistake to look only at
the liability side of a balance sheet. No analyst would do that in looking at the economic
prospects of a firm. Neither should we when we are looking at government.
There is however a major difference between the balance sheet of the government and
that of a firm (or household). The firm doesn’t capture the multiplier effects of its
increased spending on its own revenues, while the government does. If a firm borrows
money to buy an asset, its balance sheet improves if and only if the return on the asset
exceeds the cost of capital. (Of course, households typically face a higher cost of capital
than the government, putting the threshold rate of return still higher.) But this does not
apply to the government’s account, which will also benefit from the higher tax revenues
generated by the fiscal expansion. Especially in a deep downturn (when multipliers are
large and interest rates are low), the government’s balance sheet position might improve
even when the return on investment is below the interest rate on government debt.22
2. THE MEASUREMENT OF ECONOMIC DOWNTURNS │ 49
BEYOND GDP: MEASURING WHAT COUNTS FOR ECONOMIC AND SOCIAL PERFORMANCE © OECD 2018
It might be argued that the picture is less bright when the government cannot appropriate
the returns of its investment. But even in this case, the balance sheet for the country as a
whole should be improved by this investment. Broadly speaking, whether it pays for a
country to borrow from abroad depends on how it invests the funds. If it borrows abroad
for current consumption, then the country balance sheet worsens, and the prospects of
future generations deteriorate, absent any macro-economic effects. Conversely, if it
borrows to finance high return investments, the country’s balance sheet improves. For
example, the criticism of the higher amounts that the United States as a whole borrowed
abroad every year – as reflected in current accounts deficit above 5% of GDP in the years
before the crisis – was that, at the margin, much of the spending was for consumption and
for low yield investments, such as building shoddy homes in the middle of the Nevada
desert. When that happens, the country’s balance sheet deteriorates.23
There is another reason for taking a comprehensive view of the balance sheet position of
all sectors of the economy, beyond the government. This is because large deficits and
debts for the country as a whole may reflect household and firm deficits and debt, even
when the government’s fiscal position is seemingly sound. In a crisis, these private debts
often morph quickly into public debts. This is especially the case with bank liabilities. We
saw this happening in the case of Ireland, where bank debts guaranteed by the
government quickly changed the government’s fiscal position from a debt-to-GDP ratio
of less than 30% in 2007 to one that was over 130% in 2012.24
In most cases, this shift in
liabilities from the private to the public sector is a result of domestic political pressures,
as when the politically powerful financial sector puts pressure on the government to bail
out banks, arguing that otherwise the whole country would suffer. Though there is now a
consensus that such arguments are specious – the government should not bail out
shareholders, bondholders or bankers, but only (where necessary) assume liabilities to
protect depositors – and some governments like that of the United States have enacted
legislation to thwart such bail-outs in the future, the reality is that, especially when there
are banks too-big-to-fail (or too inter-connected) there will be bailouts.
Accordingly, in assessing the government’s financial position, one should look beyond
the government’s balance sheet, and make some assessment of the risk that private
liabilities will become public liabilities in the future. This is precisely why the G20 Data
Gap Initiative includes a recommendation to record transactions that take place between
the different economic sectors (households, private companies, government and the rest
of the world) to detect when financial weakness in one sector can spill-over to another.
2.6.1. Constructing capital accounts
Today, few governments construct these general government and national balance sheets.
Information on financial assets held by governments (such as cash balances, equity
holdings and the value of government participation in state enterprises) and by other
sectors of the economy is typically available, but this doesn’t apply to non-financial (i.e.
real) assets, such as infrastructure networks, schools and health care centres.
There are also issues on the liabilities side. Beyond the government liabilities that are
recorded on the government balance sheet, off-balance liabilities may stem from
contractual obligations of the government (e.g. commitments to pay pensions to its
former employees or to jointly invest with private partners), contingent liabilities
associated to guarantees provided to financial institutions, and implicit liabilities which,
while not having a contractual form, represent a “promise” to citizens (and other
institutions) to provide benefits in the future.
50 │ 2. THE MEASUREMENT OF ECONOMIC DOWNTURNS
BEYOND GDP: MEASURING WHAT COUNTS FOR ECONOMIC AND SOCIAL PERFORMANCE © OECD 2018
Issues arise also relating to the distinction between general government and other public
sector entities (such as central banks and state enterprises). These are important because
of the close interactions between these entities and the government, especially in the case
of vehicles created to deal with troubled financial institutions (Barnes and Smyth, 2013).
This is a form of the “debt transfers” from the private to the public sector discussed
above.
The implementation of some of the recommendations of the G20 Data Gap Initiative
would give a better picture of what is happening to a country’s overall wealth and the
government’s financial position. It does not, however, go far enough, because not all
forms of capital are currently considered. More comprehensive balance sheets can be
constructed on the basis of currently available data, though in doing so judgments would
have to be made. One such judgement is where to draw the “asset boundary”. Today,
structures (bridges, buildings, etc.), equipment (machines), research and development
spending, land and subsoil assets are all within the asset boundary of national balance
sheets (although rarely fully measured). Other assets could be brought into those
boundaries, for instance human capital – the result of expenditures on education and
training – or functioning ecosystems that may have been helped by expenditure on the
environment.25
Most health expenditures, especially on children, should also be included
as investments.
National accounts experts have been discussing these issues for many years, and the
reason for their omission is, in most cases, not one of principle but of pragmatism: new
assets are only included when robust and comparable measures can be developed, and
data are available.26
There are likely to be disagreements about how best to treat each
category of government expenditure, and about how rapidly the investment made may
depreciate in the future.
These problems must and can be overcome, and data generated to support the creation of
more comprehensive national and sectoral balance sheets. As a principle, items
considered as investments should be treated more favourably than those that are not,
especially in an economic downturn when funds are short.
2.6.2. Responses to government deficits and debts
The previous paragraphs explained why conventionally measured deficits and debts
provide only a partial view of the government’s true net worth and of its changes. A
repeated message of this book is that what you measure affects what you do. When public
assets are not fully measured, while its financial liabilities are, there is undue focus on the
liability side of the government’s balance sheet. The same applies because of incomplete
capital accounts and national balance sheets. This has contributed to policy stances, such
as that of the euro area Growth and Stability Pact, limiting government deficits to 3% and
debts to 60% (numbers that are the result of a political process rather than based on
economic theory or strong empirical evidence). Government deficits increased in the
Great Recession as a consequence of automatic stabilisers (the natural tendency for
government expenditure to rise, and for taxes to fall, when the economy weakens) and of
the expansionary policies adopted by some countries in the period up to 2010. But these
policies were then reversed due to concerns about higher public debt. With the onset of
the euro crisis, some countries lost access to funds, and were forced to adopt extreme
policies of austerity – cutbacks in government expenditure – which exacerbated the
economic downturn and the hardship associated with it. Even in countries like the United
2. THE MEASUREMENT OF ECONOMIC DOWNTURNS │ 51
BEYOND GDP: MEASURING WHAT COUNTS FOR ECONOMIC AND SOCIAL PERFORMANCE © OECD 2018
States, which had easy access to funds, expansionary policies were severely constricted;
at least part of the reason was an excessive focus on the wrong metric.
Thus, while austerity was not an inevitable consequence of the reliance on a misguided
set of statistics, the latter contributed to the hardship imposed by the crisis and to its long-
run consequences.
2.7. Unemployment: A partial view of available labour resources
Most of the discussion in this book is on the measurement of people’s welfare, and of the
limits of GDP when used as a proxy of it. But other statistics, some of which need to be
part of the dashboard of indicators by which to judge how well the economy is doing,
need to be looked at with equal caution. Consider one of the primary indicators of an
economic downturn, the level of unemployment.
Unemployment is typically measured by surveys, asking individuals whether they were
not at work in the reference week of the survey, actively seeking employment, and
available to start work if a job was found. If they meet all these conditions, they are
counted as unemployed. But, especially as the economy goes into a deep downturn, this
approach may give an overly rosy view of the depth of the recession.
When individuals have been looking for a job for months and don’t find one, they often
give up looking. They become “discouraged workers”. They are not unemployed
according to the criteria listed above, but surely they are not employed either. So too,
many are forced to take a part time job when they would prefer to work full time. Broader
measures of unemployment, which include discouraged workers and those involuntarily
working part time, show a far higher level of unused labour resources (Figure 2.3). There
are other adjustments that could be made to give a better picture of the true status of the
labour market. Some individuals who can’t get jobs claim disability benefits, since these
are usually higher than unemployment benefits.27
These people may well be suffering
from a disability, but when a decent job is available they manage to overcome their
disability and work. Many individuals who would like a job decide to get further
education (as noted above) and stop searching for a job. While this may increase human
capital, the measured unemployment rate would in any case underestimate the weakness
in the labour market by excluding these people.
Part-time work presents still another measurement problem. According to international
standards, a person is classified as employed even if working only one hour a week. But
many workers in a recession work fewer hours than they wish. In many respects, then, a
better measure of the state of the labour market may be the total number of hours
worked.28

52 │ 2. THE MEASUREMENT OF ECONOMIC DOWNTURNS
BEYOND GDP: MEASURING WHAT COUNTS FOR ECONOMIC AND SOCIAL PERFORMANCE © OECD 2018
Figure 2.3. Unemployment and labour underutilisation
Note: The labour underutilisation rate is the ratio between the sum of the unemployed, persons not in the labour force
who did not look for work during the past four weeks but who wish and are available to work, full time workers
working less than full week for economic reason, and part-time workers who could not find full-time work, as a
percentage of the labour force.
Source: OECD (2018d), OECD Labour Force Statistics 2017, OECD Publishing, Paris,
https://doi.org/10.1787/oecd_lfs-2017-en.
StatLink 2 http://dx.doi.org/10.1787/888933842090
Deep economic downturns can have, as we have noted, particularly severe effects on
particular groups. In many OECD countries, the unemployment rate of youth increased
by roughly twice the rise for the population as a whole (Figure 2.4). Disadvantaged
groups were particularly adversely affected: in the United States, the unemployment rate
of African-Americans increased by roughly twice that of the country as a whole, and that
of young African-Americans increased by four times. Indeed, the only time when the
unemployment rate of African-Americans came down to what might be viewed as an
acceptable level was in the late 1990s and then in 2007, when it fell to around 8%. High
unemployment rate among these groups is particularly of concern, because it increases
societal divides, an issue which we discuss below.
While progress has been made by the statistical community in improving the
measurement of labour market slack (See Annex), these measures still fail to capture the
attention of politicians and the media to the same extent that the standard unemployment
rate does. One consequence is that we may have a too optimistic picture of the state of the
labour market than warranted by reality.
Unemployment rate Labour underutilisation rate
0
4
8
12
16
20
United States Euro area Japan Italy
0
4
8
12
16
20
24
28
32
Italy Japan
United States Euro area
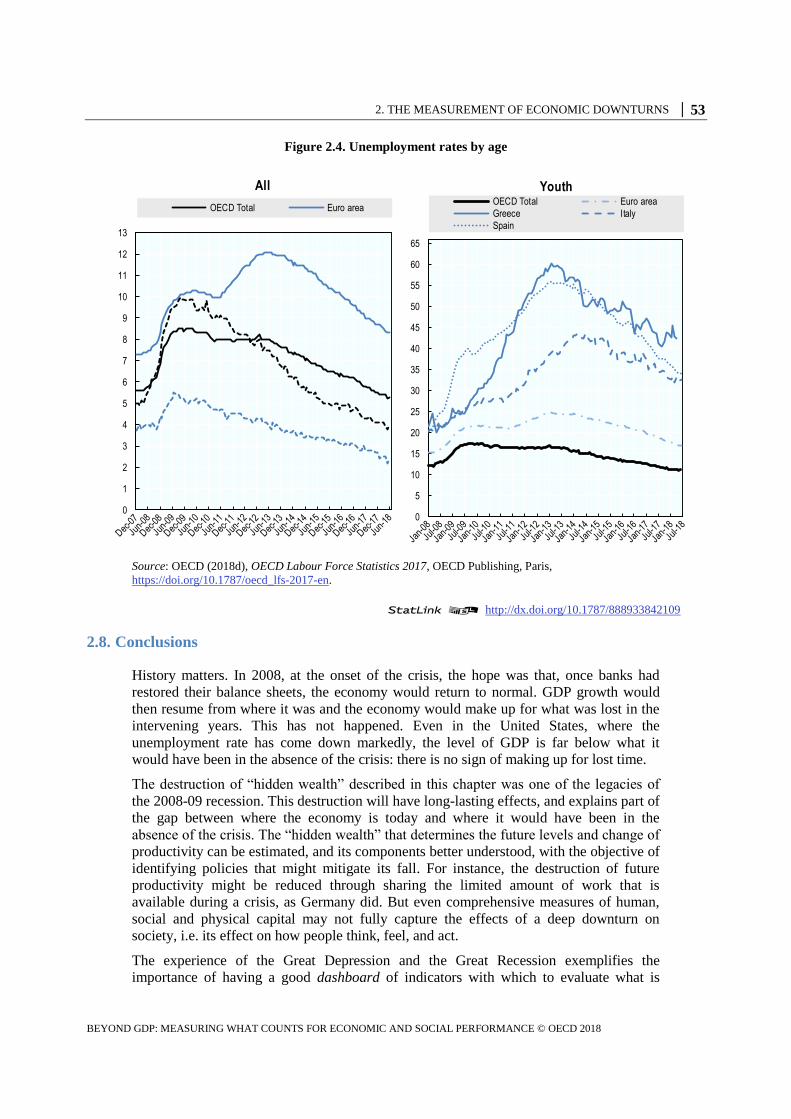
2. THE MEASUREMENT OF ECONOMIC DOWNTURNS │ 53
BEYOND GDP: MEASURING WHAT COUNTS FOR ECONOMIC AND SOCIAL PERFORMANCE © OECD 2018
Figure 2.4. Unemployment rates by age
Source: OECD (2018d), OECD Labour Force Statistics 2017, OECD Publishing, Paris,
https://doi.org/10.1787/oecd_lfs-2017-en.
StatLink 2 http://dx.doi.org/10.1787/888933842109
2.8. Conclusions
History matters. In 2008, at the onset of the crisis, the hope was that, once banks had
restored their balance sheets, the economy would return to normal. GDP growth would
then resume from where it was and the economy would make up for what was lost in the
intervening years. This has not happened. Even in the United States, where the
unemployment rate has come down markedly, the level of GDP is far below what it
would have been in the absence of the crisis: there is no sign of making up for lost time.
The destruction of “hidden wealth” described in this chapter was one of the legacies of
the 2008-09 recession. This destruction will have long-lasting effects, and explains part of
the gap between where the economy is today and where it would have been in the
absence of the crisis. The “hidden wealth” that determines the future levels and change of
productivity can be estimated, and its components better understood, with the objective of
identifying policies that might mitigate its fall. For instance, the destruction of future
productivity might be reduced through sharing the limited amount of work that is
available during a crisis, as Germany did. But even comprehensive measures of human,
social and physical capital may not fully capture the effects of a deep downturn on
society, i.e. its effect on how people think, feel, and act.
The experience of the Great Depression and the Great Recession exemplifies the
importance of having a good dashboard of indicators with which to evaluate what is
0
1
2
3
4
5
6
7
8
9
10
11
12
13
All
OECD Total Euro area
0
5
10
15
20
25
30
35
40
45
50
55
60
65
YouthOECD Total Euro area
Greece Italy
Spain
54 │ 2. THE MEASUREMENT OF ECONOMIC DOWNTURNS
BEYOND GDP: MEASURING WHAT COUNTS FOR ECONOMIC AND SOCIAL PERFORMANCE © OECD 2018
going on in the country, to formulate appropriate economic responses, and to assess the
consequences of those policies. The dashboard that may be appropriate in normal times
may have to be modified in times of crisis, to monitor closely and respond to fast-
changing circumstances.
The human costs of the crisis have been large, and some of them are missed by
conventional statistics. In most countries, while GDP growth is now back or close to pre-
crisis levels, the economy will never return to where it would have been without the
crisis. In many advanced countries, the recession had the effect of depressing productivity
growth and capital accumulation relative to what it would otherwise have been. Even
without taking into account the full cost of human suffering, the long-run costs of the
recession to people’s well-being have been enormous.
There is a chance that a more adequate set of indicators, reflecting the true depth of the
downturn and its long-term economic implications, would have allowed governments to
respond more forcefully, with special attention to those parts of the population that were
feeling the full brunt of the recession. And it may well be the case that reliance on the
wrong indicators, with governments announcing a recovery when large fractions of the
population were not experiencing any improvement in their well-being, contributed, at
least partly, to the distrust in public institutions and the rise in discontent and anti-
globalisation sentiments that we are witnessing today throughout the world.
Notes
1. The previous chapter noted that GDP metrics typically rely on market prices to assess the
relative value of different goods and services, and it will normally be impossible for national
accounts statisticians to determine whether there is some distortion in pricing. Still, there should
perhaps be a warning about the use of GDP to assess how well the economy is doing when there is
the possibility of a bubble, especially in real estate: “use with extreme caution”.
2. Of course, many did: for instance, the IMF warned of unsustainable current account imbalances,
and many others warned about unsustainable public debt. Ironically, it was not these imbalances
that brought down the economy, but something more mundane, and historically more familiar: bad
and excessive lending by the financial sector, and an accumulation of private debt.
3. In the United States, for example, the median sale prices for new homes increased by 130%
from 1995 to 2016, while median (equivalised) household disposable income increased by 80% (in
nominal terms). Over the same period, the median size of new single-family houses increased from
178 to 225 square metres. As noted by Robert H. Frank, in the United States good schools (whose
budgets are typically funded by local property taxes) are located in more expensive
neighbourhoods, implying that “any family that failed to rent or purchase a house near the median
of its local price distribution would have to send its children to below-average schools” (Frank,
2011).
4. Since 2015, the OECD has been releasing measures of over-indebtedness of households based
on different thresholds (i.e. debt-to-income above 3, and debt-to-assets above 0.75). For a recent
analysis, see Balestra and Tonkin (2018).
5. There are numerous policy actions that the government, including the Federal Reserve, could
have taken had it had an adequate appreciation of the economy’s financial fragility. Indeed, some
of the actions it took may actually have increased the economy’s fragility.
2. THE MEASUREMENT OF ECONOMIC DOWNTURNS │ 55
BEYOND GDP: MEASURING WHAT COUNTS FOR ECONOMIC AND SOCIAL PERFORMANCE © OECD 2018
6. Beyond the reasons we emphasise here, preliminary estimates of GDP systematically
underestimate the revised estimates, for technical reasons, for instance related to the entry of new
firms and exit of old firms. These need further study, and appropriate corrections introduced. Real
time estimates of GDP based on scraping data from the internet may provide a check against such
systematic errors in the future (Buono et al., 2017, pp. 118-120).
7. Sustainability of well-being requires an increase in wealth appropriately measured. If wealth is
increasing, then later generations can sustain the same level of well-being that is prevailing now;
but not so if wealth is decreasing. Wealth includes economic capital (which includes both physical
and immaterial items, such as knowledge and research), human capital, natural capital (natural
resources and the environment), and social capital (i.e. how well members of a society co-operate
with each other).
8. Gaps of similar size are visible when comparing current levels of GDP per capita to those
implied by the pre-crisis growth of “potential output” – the level of GDP that could be expected to
prevail based on the long-term drivers of economic growth. Since 2007, OECD estimates of the
(annual) growth of potential output were revised downward from 2.7% (mid-2007) to 1.7% (mid-
2018) for the United States, and from 1.9% to 1.4% for the euro area.
9. One aspect of physical capital normally not measured, which may increase more than normal
during recessions, is associated with maintenance: with greater free time, workers may spend
more time on repair and maintenance.
10. OECD (2001) defined human capital as “the knowledge, skills, competencies and attributes
embodied in individuals that facilitate the creation of personal, social and economic well-being”.
11. When firms are cash starved, they may also cut back on formal on-the-job training.
Unfortunately, again, there are no good statistics assessing the level or changes in these
expenditures, though in some countries and in some firms they are likely to be quite significant.
12. There is a longstanding controversy about the benefits and costs of an economic downturn,
with some, like Joseph Schumpeter, arguing that recessions and depressions have a cleansing
effect, forcing firms to become more efficient. Stiglitz (1994) argued that the adverse effects on
learning and R&D outweighed these “agency” benefits.
13. But note the observation made earlier in the context of education: in the countries most
affected by the crisis, GDP per capita decreased, and so even if the share of health education in
GDP held up, spending per capita went down. Austerity typically forced significant cuts in public
health expenditures.
14. Sitaraman (2017) describes how some financial institutions have grown so powerfully
economically that they can now evade law enforcement, even when taking part in illegal activities,
by paying fines.
15. In the United States, they may have borrowed heavily – on average, a college graduate has
some USD 37 000 in student debt (www.forbes.com/sites/zackfriedman/2018/06/13/student-loan-
debt-statistics-2018/#1efa9ee87310). The amount of student debt is much higher for some
degrees: according to a 2017 Gallup survey, 60% of those who completed their law degree in
2010 or later report borrowing more than USD 100 000, compared with around half of those who
graduated in the 2000s and a quarter of law graduates in the 1990s
(http://www.accesslex.org/sites/default/files/2018-
01/Examining%20Value%2C%20Measuring%20Engagement%20-
%20A%20National%20Study%20of%20the%20Long-
Term%20Outcomes%20of%20a%20Law%20Degree.pdf).
16. OECD (2013d) reports, based on data from the Gallup World Poll, that average life
satisfaction declined by more than 20% in Greece and by between 12 and 10% in Italy and Spain,
as compared to gains by more than 4% in Germany, Israel, Mexico, the Russian Federation and
56 │ 2. THE MEASUREMENT OF ECONOMIC DOWNTURNS
BEYOND GDP: MEASURING WHAT COUNTS FOR ECONOMIC AND SOCIAL PERFORMANCE © OECD 2018
Sweden. The same report refers to “evidence of growing feelings of anger, stress and worry and
lower feelings of joy and contentment in many OECD countries” (p. 88).
17. Assume that the gap between actual and potential GDP is 10% of GDP, and that this gap
persists in the future; discounting these future losses at a conservative long-run real interest rate of
2% implies that the present value of the loss in GDP is five times GDP – in the case of Europe and
the United States, some USD 300 trillion.
18. A number of recent articles highlight the permanent effect of recessions on the level of output
but not on output growth. For example, Cerra and Saxena (2008), based on analysis of
190 countries over the period 1960-2001, concludes that, following all crises, GDP reverts to his
previous growth path.
19. Fernald et al. (2017) for the United States, and Antolin-Diaz, Drechsel and Petrella (2017) for
G7 countries.
20. In addition, multipliers in deep downturns are, almost by definition, much greater than when
the economy is near full employment, when an increase in government spending has to be offset
by a contraction somewhere else. In deep downturns, central banks don’t need to raise interest
rates (in the 2008 crisis, they didn’t) as government spends more; hence there is no crowding out
of private spending. Indeed, there may be crowding in, as expectations of higher GDP lead to more
investment and consumption. The empirical analysis by Caggiano et al. (2015) confirms that fiscal
multipliers in a deep recession are much higher than those observed in an expansionary period;
that the deeper the recession, the greater the amount of output generated by a fiscal expansion; and
that government spending is very effective when it is most needed (in their estimates, one extra
dollar spent by the US government during the Great Recession would have generated higher
output of up to USD 2.5 in three-years’ time).
21. Originally, the 3% deficit limit and 60% debt limits were set as conditions of entry into the
euro area. They subsequently were adopted as criteria for acceptable macro-economic policies.
22. This conclusion may not be shared by all. Public investments may require long planning
horizons, so that undertaking them in a rush in a recession may result in lower-quality projects
(implying that good policy design entails having an inventory of projects to be undertaken should
the economy go into a downturn). More generally, the mistrust of governments and their
propensity to spend leads some to the view that the only productive investment is the one entrusted
to the private sector. Empirical research, however, shows that, on average, investments in both
technology and infrastructure, for instance, have high return, markedly in excess of the
government’s cost of capital.
23. The US global balance sheet position moved from a negative balance of 7% of GDP in 2007 to
32% in 2017 (OECD Annual National Accounts database,
https://stats.oecd.org/Index.aspx?DataSetCode=NAAG). Interestingly, some of the money that was
invested in the United States from abroad was invested in low yield assets, and some of the money
that the United States invested abroad was invested in high yield assets, so that the country’s net
asset position deteriorated by less (25 percentage points of GDP, over the 10 years to 2017) than
one would have expected given its recurrent current account deficits (whose cumulative value was
equivalent to 27 percentage points of GDP), which require it to get funds abroad year after year.
24. See https://ec.europa.eu/ireland/news/key-eu-policy-areas/economy_en. Looking beyond gross
public debt, Barnes and Smyth (2013) show that the net financial liabilities of the Irish general
government increased by 81 points of GDP from 2007 to 2012; also, by 2012 the non-financial
assets of the Irish general government were equivalent to 35% of GDP, while its banking-related
contingent liabilities amounted to 73% of GDP.
25. Most educational expenditures, though, create private assets, not public assets; the
government’s “claim” is only that associated with its ability to capture tax revenues. Still, as we
2. THE MEASUREMENT OF ECONOMIC DOWNTURNS │ 57
BEYOND GDP: MEASURING WHAT COUNTS FOR ECONOMIC AND SOCIAL PERFORMANCE © OECD 2018
explain above, the government’s overall balance sheet may improve under a broad range of
circumstances.
26. There is also a concern that those categories of expenditure not included within the capital
budget will be given short shrift.
27. Such a behaviour was strongly encouraged by the government in some countries, e.g. the
Netherlands in the 1980s, the aim being to lower the unemployment rate by moving unemployed
workers from unemployment benefits to disability or early retirement schemes.
28. Total hours worked declined in Italy by 6% from 2009 to 2014, and then recovered by around
3%. In the United States, total hours worked declined marginally in 2010, and then increased
continuously in later years, with a cumulative rise of 10% over 2009-16 (OECD
Employment Outlook database, www.oecd.org/employment/emp/onlineoecdemploymentdatabase.
htm).

3. THE NEED TO FOLLOW UP ON THE STIGLITZ-SEN-FITOUSSI COMMISSION │ 59
BEYOND GDP: MEASURING WHAT COUNTS FOR ECONOMIC AND SOCIAL PERFORMANCE © OECD 2018
Chapter 3. The need to follow up on the Stiglitz-Sen-Fitoussi Commission
This chapter looks at work carried out since the 2009 Stiglitz-Sen-Fitoussi Commission
on going “Beyond GDP”. It argues that the 169 targets agreed by the international
community on the Sustainable Development Goals are too many, and that countries have
to select a set that corresponds to their priorities. It shows that growing inequality in
income and wealth are global concerns and that, even in developed countries, data are
often inadequate. It warns against over-reliance on broad averages, since these fail to
reflect important inequalities across given groups (“horizontal inequalities”) and say
nothing about how resources are shared and managed within households. The chapter
argues that what matters are not just inequalities in outcomes but inequalities in people’s
opportunity to achieve those outcomes, and that measuring this is possible. Other areas
where more work is needed include subjective well-being and economic insecurity, which
interact with social capital and trust, as well as sustainability across its social, economic
and environmental dimensions.
The statistical data for Israel are supplied by and under the responsibility of the relevant Israeli authorities.
The use of such data by the OECD is without prejudice to the status of the Golan Heights, East Jerusalem and
Israeli settlements in the West Bank under the terms of international law.
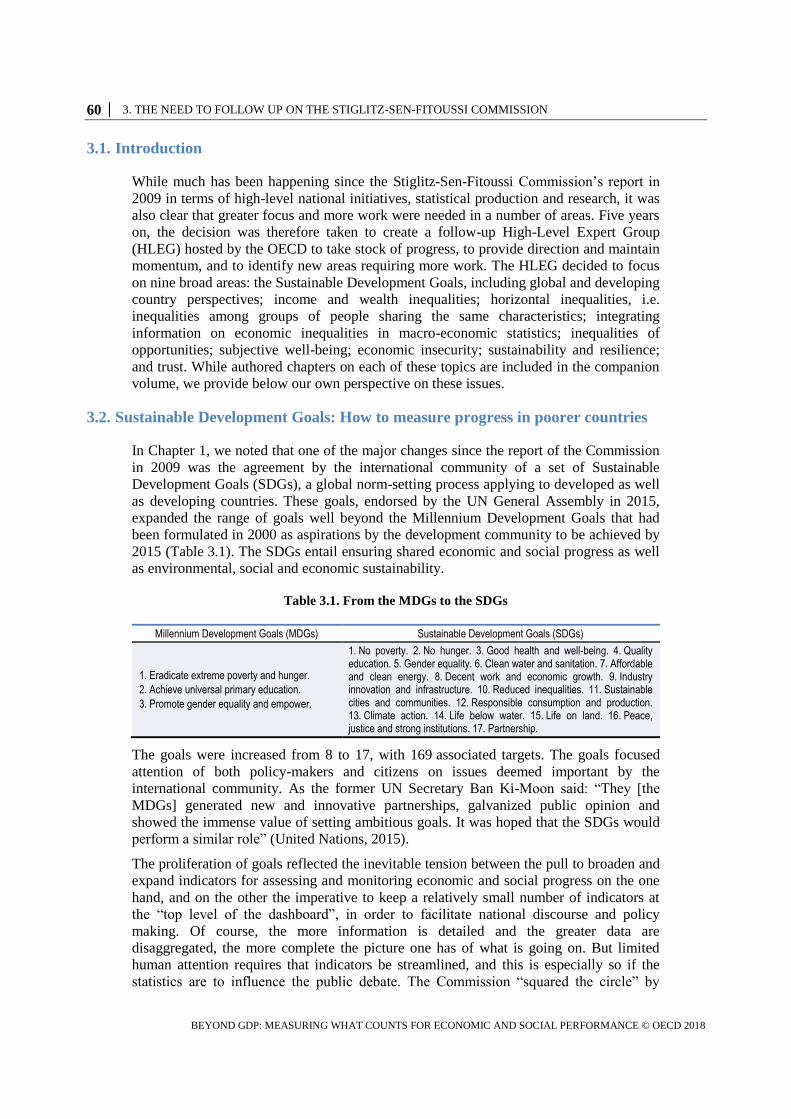
60 │ 3. THE NEED TO FOLLOW UP ON THE STIGLITZ-SEN-FITOUSSI COMMISSION
BEYOND GDP: MEASURING WHAT COUNTS FOR ECONOMIC AND SOCIAL PERFORMANCE © OECD 2018
3.1. Introduction
While much has been happening since the Stiglitz-Sen-Fitoussi Commission’s report in
2009 in terms of high-level national initiatives, statistical production and research, it was
also clear that greater focus and more work were needed in a number of areas. Five years
on, the decision was therefore taken to create a follow-up High-Level Expert Group
(HLEG) hosted by the OECD to take stock of progress, to provide direction and maintain
momentum, and to identify new areas requiring more work. The HLEG decided to focus
on nine broad areas: the Sustainable Development Goals, including global and developing
country perspectives; income and wealth inequalities; horizontal inequalities, i.e.
inequalities among groups of people sharing the same characteristics; integrating
information on economic inequalities in macro-economic statistics; inequalities of
opportunities; subjective well-being; economic insecurity; sustainability and resilience;
and trust. While authored chapters on each of these topics are included in the companion
volume, we provide below our own perspective on these issues.
3.2. Sustainable Development Goals: How to measure progress in poorer countries
In Chapter 1, we noted that one of the major changes since the report of the Commission
in 2009 was the agreement by the international community of a set of Sustainable
Development Goals (SDGs), a global norm-setting process applying to developed as well
as developing countries. These goals, endorsed by the UN General Assembly in 2015,
expanded the range of goals well beyond the Millennium Development Goals that had
been formulated in 2000 as aspirations by the development community to be achieved by
2015 (Table 3.1). The SDGs entail ensuring shared economic and social progress as well
as environmental, social and economic sustainability.
Table 3.1. From the MDGs to the SDGs
Millennium Development Goals (MDGs) Sustainable Development Goals (SDGs)
1. Eradicate extreme poverty and hunger.
2. Achieve universal primary education.
3. Promote gender equality and empower.
1. No poverty. 2. No hunger. 3. Good health and well-being. 4. Quality education. 5. Gender equality. 6. Clean water and sanitation. 7. Affordable and clean energy. 8. Decent work and economic growth. 9. Industry innovation and infrastructure. 10. Reduced inequalities. 11. Sustainable cities and communities. 12. Responsible consumption and production. 13. Climate action. 14. Life below water. 15. Life on land. 16. Peace, justice and strong institutions. 17. Partnership.
The goals were increased from 8 to 17, with 169 associated targets. The goals focused
attention of both policy-makers and citizens on issues deemed important by the
international community. As the former UN Secretary Ban Ki-Moon said: “They [the
MDGs] generated new and innovative partnerships, galvanized public opinion and
showed the immense value of setting ambitious goals. It was hoped that the SDGs would
perform a similar role” (United Nations, 2015).
The proliferation of goals reflected the inevitable tension between the pull to broaden and
expand indicators for assessing and monitoring economic and social progress on the one
hand, and on the other the imperative to keep a relatively small number of indicators at
the “top level of the dashboard”, in order to facilitate national discourse and policy
making. Of course, the more information is detailed and the greater data are
disaggregated, the more complete the picture one has of what is going on. But limited
human attention requires that indicators be streamlined, and this is especially so if the
statistics are to influence the public debate. The Commission “squared the circle” by
3. THE NEED TO FOLLOW UP ON THE STIGLITZ-SEN-FITOUSSI COMMISSION │ 61
BEYOND GDP: MEASURING WHAT COUNTS FOR ECONOMIC AND SOCIAL PERFORMANCE © OECD 2018
arguing for a dashboard of indicators. However, the 169 SDG policy targets, and
232 indicators for “global monitoring” agreed by the international community are clearly
too many.
Focus is especially important for developing countries, where resources – including the
human resources necessary to design and implement the policies required to achieve the
goals and to develop the large number of indicators to monitor progress – are limited.
Given that different countries are in different circumstances, it is natural that they will
and should focus on different objectives. Differences are likely to be especially
significant between developed and developing countries. For example, while most of the
former have managed to achieve relatively high rates of formal employment and low
levels of extreme poverty, lack of productive employment and poverty are still of central
concern to most developing countries. But there is a cost to having different goals
pursued by different countries – it undermines inter-country comparability. Countries
themselves need to be mindful of the benefits of comparability: to know how well one is
doing, one wants to know how well other similarly situated countries are performing.
Still, it is likely that many similarly situated countries will choose similar goals.
3.2.1. Metrics
Even when the set of goals is decided, the choice of metrics can make a difference –
another of the messages of the Commission – and the metrics that developing countries
might want to focus on may well differ from those of the more developed ones.
In the case of SDG 1 (“end poverty”), for example, the indicator agreed by the UN
Statistical Commission for Target 1.1 (“By 2030, eradicate extreme poverty for all people
everywhere”) is the number of people living below the USD 1.9 per person per day global
poverty line.1 Most developed countries are likely to have met this target already: poverty
generally means something markedly different in the developed world.2
Or consider SDG 10 (“reduce inequality”). The indicator chosen for Target 10.1 (“By
2030, progressively achieve and sustain income growth of the bottom 40 per cent of the
population at a rate higher than the national average”) is the growth rate of household
expenditure or income per capita among the bottom 40 per cent of the population. Jose
Gabriel Palma of Cambridge University has argued that a more sensitive measure of
income inequality, especially for emerging economies and developing countries, is the
ratio of the income share of the top 10% of population divided by the share of the poorest
40% (Palma, 2016). He argues that the income share of the middle-class seems relatively
similar across at least middle-income and developing countries, so that this ratio really
identifies the differences across countries. Doyle and Stiglitz (2014) argued therefore that
the Palma ratio might be the preferred measure of income inequality for the SDGs.
Measures, of course, embrace values and concerns. Target 10.1, advocated by the World
Bank, is a more inclusive measure than extreme poverty, but is still in keeping with the
Bank’s traditional focus on the lower part of the distribution.
3.2.2. Global Policy Issues
One important issue raised by Kanbur, Patel and Stiglitz in their chapter of the companion
report relates to metrics for matters of global concern. Most importantly, we need to
know what is happening to climate change (which requires measuring the global carbon
emissions from the economic activities of a country, i.e. both those relating to the
production within its borders and those associated with a country’s imports to satisfy its
62 │ 3. THE NEED TO FOLLOW UP ON THE STIGLITZ-SEN-FITOUSSI COMMISSION
BEYOND GDP: MEASURING WHAT COUNTS FOR ECONOMIC AND SOCIAL PERFORMANCE © OECD 2018
domestic demand). There is also a great deal of interest in knowing what is happening to
global income inequality (the inequality that we would observe if we ranked all people in
the world by their income, as if they were living in the same country), especially in
assessing the offsetting effects of higher within-countries inequalities and lower income
disparities across countries (Deaton, 2013; Milanovic, 2016). There is value in having
National Statistical Offices collect data on a sufficiently comparable basis that we can
make reasonable estimates of what is happening in both regards.
3.3. Inequalities in income and wealth
At the time of the Stiglitz, Sen and Fitoussi (2009) report, we were intensely aware that
one of the reasons that GDP was not a good measure of economic and social performance
was that it took no account of distribution: a society in which most people were doing
poorly, but a few were doing very well was not, in a fundamental sense, a well-
performing economy, even if GDP was increasing, possibly even rapidly. Indeed, that
was the case for the United States and in most other advanced countries. Using GDP as a
metric, the US economy seemed to be doing reasonably well. But looking at measures
that took into account distribution provided a markedly different picture. The United
States, as some commentators put it, was a great country in which to be born, if you knew
you were going to be in the top 1%, or even better, in the top 0.1%; being born in the
bottom 90% was a markedly different story.
In the years since the Stiglitz, Sen and Fitoussi report, the attention paid to income
inequality has increased significantly, partly thanks to the availability of new data
showing the long-term nature of this rise and the increasing share taken by the 1%
(Piketty, 2014); and partly driven by the sheer size of the increase in income inequality
that took place since the late 1970s. Comparative data analyses have also shown cross-
country differences in the size of this increase in inequality, which suggests that country-
specific factors, and in particular policies and institutions, matter considerably.
Income inequality, its causes, consequences and what should be done about it have thus
become a focus of policy discussions around the world. This is a new and important
development, which also reflects the contributions of several of the members of the
HLEG (Fitoussi and Rosanvallon, 1996; Fitoussi and Stiglitz, 2013; López-Calva and
Lustig, 2010; Bourguignon, 2012b; Stiglitz, 2012a; Piketty, 2014; Deaton, 2013;
Atkinson, 2015) and international organisations (OECD, 2008, 2015; IMF, 2017; Ostry,
Berg and Tsangarides, 2014). Research has highlighted a number of drivers of income
inequality and of its increases over time, which include both changes in the structure of
the economy (globalisation, skill-biased technological change, the more important role of
the service sector, especially the financial sector, higher market power of firms in many
sectors) and weaker bargaining power of workers, itself a function of some of the other
changes noted. Changes in policy affect the distribution of both market and disposable
income. These include changes in the rules governing labour markets, corporate
governance, globalisation and anti-trust; changes in policies affecting the inter-
generational transfer of advantage and disadvantage, such as inheritance taxes and public
education; and policies affecting redistribution through taxes and transfers (Stiglitz, 2015;
Inchauste and Lustig, 2017). In all cases, however, policies to reduce inequalities will
require better data, and incorporating more systematically into policy deliberations an
analysis of the effects of alternative policies on the distribution of income and wealth.
The Stiglitz, Sen and Fitoussi report emphasised not only the importance of inequalities
in income and wealth, but also of every other aspect of well-being: health, education,
3. THE NEED TO FOLLOW UP ON THE STIGLITZ-SEN-FITOUSSI COMMISSION │ 63
BEYOND GDP: MEASURING WHAT COUNTS FOR ECONOMIC AND SOCIAL PERFORMANCE © OECD 2018
political voice, insecurity, access to justice, opportunity. Many of these inequality
indicators are correlated, with the same households or individuals experiencing
disadvantage in many of these dimensions. The report argued that one should focus on the
household (or even better, the individual) as the unit of analysis, looking at all the
dimensions that affect well-being at the same time. Dashboards need to take into account
what is happening, say, to average health outcomes, but also who is in good or bad health.
The Case-Deaton study (2015) referred to earlier highlights this issue: even if longevity is
increasing and mortality decreasing on average, just the opposite is happening among
American whites who have only a high school education, and this is the same group that
has seen their incomes plummet. (The same issues arise in making cross-country
comparisons.)
3.3.1. Growing inequality in most advanced countries
For more than 30 years, while the income gap between major emerging markets (e.g.
China, India and Brazil) and advanced countries was narrowing, that within most, but not
all, advanced countries was rising. According to OECD data, 18 out of 23 OECD
countries experienced a significant increase in income inequality between the mid-1980s
and around 2013 (OECD, 2015a, p. 24). In some cases, the increase in inequalities in
market income was offset by government tax and transfer programmes. In others, most
notably the United States, it was not, resulting in statistics that could only be called
alarming. By 2017, the median family income adjusted for inflation was barely above the
level a quarter century earlier, real wages were barely above the level attained 60 years
earlier, and the real median income of a full-time male worker was lower than 41 years
previously.
While the United States was the most extreme case, others were not far behind. OECD
studies showed that there were large increases in income inequalities even in countries
like Sweden that had earlier established a reputation for egalitarianism, though even with
their large increases in inequality, their income inequality was far lower than for others.
The rise of income inequality was also important in most emerging countries.
3.3.2. A global perspective
Branko Milanovic combined what was happening within and between countries into a
global picture (Milanovic, 2016). A single diagram, reprinted below (Figure 3.1),
summarises much of the story. Two groups have been doing very well, the global top
(point D in diagram), i.e. the 1%, and the emerging middle-class in China and India,
around the 50 percentile (point C). These two groups have been the main beneficiaries of
globalisation. There are two groups, conversely, who did not do well: those at the bottom,
e.g. people in conflict-affect areas or subsistence farmers in developing countries (point
A), hurt in part by European and American agricultural subsidies; and the
working/middle-classes in Europe and America (point B), especially those with limited
education.

64 │ 3. THE NEED TO FOLLOW UP ON THE STIGLITZ-SEN-FITOUSSI COMMISSION
BEYOND GDP: MEASURING WHAT COUNTS FOR ECONOMIC AND SOCIAL PERFORMANCE © OECD 2018
Figure 3.1. Cumulative gains in real income growth around the world, 1988-2008
Percentages
Source: Milanovic, B. (2016), Global Inequality: A New Approach for the Age of Globalization, Harvard
University Press, Cambridge, MA.
StatLink 2 http://dx.doi.org/10.1787/888933842128
Using the standard metrics for measuring inequality, the Gini coefficient (see the
discussion below), the effect of reduced cross-country inequality and increased within-
country inequality largely offset each other.3 But summarising Figure 3.1 into a single
number such as the Gini coefficient misses much of the story – the discontent among the
middle-class in the advanced countries and among those at the bottom of the income
pyramid, and the outsized gains of the very wealthy.
Milanovic’s data may be affected by a range of assumptions and measurement problems
(Kharas and Seidel, 2018)4, and do not give a full picture of the extent of variability in
levels and changes in income inequality across countries. Income inequality (by most
measures) is not only higher in the United States than in other advanced countries, it has
also increased the most. In several OECD countries, the increase in inequality was
concentrated in the early 1990s, while in Germany the increase started in the early 2000s
and in France in the late 2000s (Bourguignon, 2012b). Some countries in Latin America
even saw income inequality reduced, albeit from a high level. In some countries like
China, a massive reduction in poverty has been achieved alongside higher income
inequality – with the rich experiencing greater income gains than the poor.
3.3.3. Some Broad Data Issues
Comparative data on income distribution for OECD countries5 exist today but not when
the long-term “wave” of higher inequality started (in the United Kingdom, the United
A
C
B
D
0
10
20
30
40
50
60
70
80
0 10 20 30 40 50 60 70 80 90 100
Rea
l PP
P in
com
e ch
ange
(in
per
cent
)
Percentile of global income distribution

3. THE NEED TO FOLLOW UP ON THE STIGLITZ-SEN-FITOUSSI COMMISSION │ 65
BEYOND GDP: MEASURING WHAT COUNTS FOR ECONOMIC AND SOCIAL PERFORMANCE © OECD 2018
States, New Zealand) in the mid-1970s and early 1980s. Had these data been available
back then, policy-makers and concerned citizens could have noticed the trend and might
have taken action to counter it. While the increase in economic inequality was noted
earlier in individual countries, this was often dismissed as reflecting country specificities.
In reality, the common pattern to higher economic inequalities became more evident and
common across countries, partly the consequence of the same set of policies that had been
introduced in the United Kingdom and the United States in the late 1970s and early 1980s
being adopted elsewhere. Income inequality became an area of concern long after the
damage was done.6
Data on economic inequalities are today often weaker in those countries where they are
most needed, for instance in those emerging and developing countries that are
experiencing strong economic growth unequally shared, without the cushion provided by
adequate social protection programmes. As documented by Nora Lustig in the companion
volume, while various data on economic inequalities for these countries exist, they are
often based on estimates made up by researchers. Even when good quality official micro
data exist (e.g. China), access to them is often out of reach for both researchers and
international organisations. Also, most data on economic inequality in developing and
emerging countries are based on surveys of consumption expenditures rather than
income. When countries grow rapidly, and household savings increase (for those
households that benefit from growth), consumption inequalities will increase by less than
income inequalities. Similarly, as these countries undergo a process of urbanisation and
demographic transition, growth of household income and consumption per capita may
exceed growth of household income and consumption per consumption unit, due to lower
household size. On both accounts, policy-makers in these countries may be under-
estimating the increase in economic inequalities because of inadequate data.
Even in rich countries, out-of-date measures of income inequalities are a problem, with
such data typically lagging by years the most recent data on GDP. Data on income
inequality have little traction in policy discussions simply because, by the time the data
become available, they represent “water under the bridge”, and often reflect policy
decisions taken by previous administrations.
Limits to the metrics used in national official statistics on economic inequality can bias
policy discussions, as some examples illustrate. While, for purposes of measuring
inequality, the broader metric of income inequality is that of adjusted disposable income
(which includes the individual services provided for free, or at subsidised prices, by
governments to households), most of the available measures of income inequality are
typically based on cash income. While there are methodological challenges in measuring
in-kind services, their exclusion from the income metric often allows policy-makers to get
away with the “fiction” that tax cuts improve people’s economic well-being even when
they are offset by cuts in valued public services. Similarly, some developing countries
have devoted significant expenditures to help the poor through better education and
health care programmes. These programmes improve the well-being of poor children, but
do not show up as an increase of the cash income of beneficiaries.7 Over time, they
should lead to higher incomes, moving people out of poverty, but these income effects
take time to show up.8
Statistics on the distribution of household economic resources remain limited in other
respects.9 First, traditional surveys on the distribution of household income have come
under increasing scrutiny because of their failure to capture development at the top-end of
the distribution. Other sources (mainly tax records) have been increasingly used, in
66 │ 3. THE NEED TO FOLLOW UP ON THE STIGLITZ-SEN-FITOUSSI COMMISSION
BEYOND GDP: MEASURING WHAT COUNTS FOR ECONOMIC AND SOCIAL PERFORMANCE © OECD 2018
particular following the work by Atkinson and Piketty (2007) and their co-authors. Use of
administrative data sets has prompted questions about the role of each source, their
strengths and limitations, and possible ways to integrate them. Tax records typically don’t
have adequate representation of those at the bottom end of the distribution; while there is
some presumption that the incomes of those at the top are understated, in some cases as a
result of employing legal loopholes, in other cases as a result of more questionable
practices bordering on tax evasion. In some countries, the rich shelter much of their
income through corporations, and so income that rightly should be attributed to them is
not. In most countries, capital gains are reported in tax declarations (if reported at all)
only when an asset is sold.10
Indeed, when capital gains are given tax preferences (as is
often the case), rich individuals have found easy ways of converting what otherwise
would be a dividend into a capital gain. At the other end of the distribution, even surveys,
which do a better job than administrative data in picking up incomes at the very bottom,
are inadequate (Atkinson, 2016). Surveys miss the homeless, people in institutions and
jails or those with no permanent address.11
Second, there are typically large differences in levels, and sometimes changes, in income
inequalities, on one side, and inequalities in consumption expenditures and wealth, on the
other. Administrative data can provide good income measures, subject to the limitations
discussed above, but we have to rely on surveys when it comes to measuring consumption
expenditures. Measuring consumption, rather than income, has both advantages and
drawbacks. On the one hand, individuals may be better able to report what they consumed
(through diaries) than the income they have received: “net income”, for example for a
small shopkeeper who does not keep books, is an abstract concept, and reported numbers
may be inaccurate. On the other hand, individual-level data on consumption have their
own limits: they are burdensome to report for survey participants, implying that results
may miss the very poor; they may omit expenditures on durable goods or, when they
include them (often in a separate module), record them as consumption expenditure flows
that should, in theory, be distributed over several years.12
These data are also affected by
their own measurement errors, due to factors such as the length of the recall period, the
number of consumption items listed in the diary, and whether participants record their
consumption themselves or are interviewed.13
Especially troublesome is the fact that we
may have data only for income inequality in some countries and only for consumption
inequality in some others, making cross-country comparisons difficult.
Third, the treatment of government-provided goods and services is especially
problematic, as these items may represent a large fraction of the “effective consumption”
of low-income individuals. Ignoring such goods and services may give a misleading view
of levels and changes in both economic inequality and average living standards. The
problem (to which the 2009 Commission report called attention) is that because these are
not market transactions, it is hard to value them, and in some cases, hard even to identify
who are the recipients. Medical services are especially difficult to value for non-insured
people; but even for those covered by health insurance, valuing the transactions at market
prices is unsatisfactory, since market prices are generally distorted. In many countries,
such as the United States, the cost of providing health care services has risen much faster
than the cost of living in general. The result is that, even when nominal health spending is
increasing faster than the CPI (the overall measure of cost of living), real health services
may be actually falling if one used a health-care specific price index. This is important:
Burkhauser, Larrimore and Simon (2012) noted, using income metrics in nominal terms,
that inequality in living standards in the United States was increasing by less than claimed
once one takes into account the large increase in (nominal) health care expenditures.

3. THE NEED TO FOLLOW UP ON THE STIGLITZ-SEN-FITOUSSI COMMISSION │ 67
BEYOND GDP: MEASURING WHAT COUNTS FOR ECONOMIC AND SOCIAL PERFORMANCE © OECD 2018
However, accounting for the higher increase in health-care prices would lead to the
opposite conclusion.
Fourth, we still lack adequate data on the distribution of household wealth. This lack is
especially troublesome at a time when many rich countries have been reducing taxes on
wealth holdings, capital income, capital gains and inheritances (OECD, 2018b). The
regressive implications of these policies are not given adequate weight in policy
discussions, partly because adequate data on wealth distribution are not available.14
In
addition to the problems described earlier on the measurement of income, there are two
more critical limitations in the case of household wealth data. First, in some countries,
significant amounts of the wealth are held abroad, including in tax heavens. While
Zucman (2015) has shown the large magnitude of this hidden wealth, incorporating it into
countries’ wealth distribution data is a huge challenge. Second, in some countries wealthy
people may hold significant fractions of their wealth in trusts and foundations, the
beneficial ownership of which is often not transparent. Since the fraction of the wealth so
held can vary markedly across countries, this makes it difficult to make cross-country
comparisons of wealth inequality. Similarly, the fraction of wealth so held can vary
markedly over time, especially with changes in regulations and tax laws.15
Last, micro-statistics on household income, consumption and wealth (even when they
exist) are only rarely collectedly in a joint way, with information of each component
available for each household.16
A stronger correlation between different types of
economic resources would imply higher economic inequality even when the (marginal)
distribution of each type is unchanged. As noted earlier, the natural unit of analysis is the
household, or the individual, and those at the bottom typically suffer deprivations in all
dimensions. Evidence on the joint distribution of income, consumption and wealth for the
United States suggests that their correlation has increased over time, meaning that “true”
economic inequality has increased faster than when looking at each type of economic
resource separately (Fisher et al., 2016). For most other countries, we simply don’t know
the magnitudes of the underestimate. Recent OECD work on the joint distribution of
income and wealth shows for instance that more than 40% people in OECD countries
lack the liquid financial assets that would prevent them from falling into poverty if they
had to forego three months of income, indicating widespread vulnerability to unforeseen
economic shocks (Balestra and Tonkin, 2018).
3.3.4. Technical issues
Beyond these issues, a host of important technical issues have to be addressed when
comparing economic inequality both across countries and over time. There are, for
instance, many issues affecting the comparability of data, which in turn affect the ability
to make cross-country comparisons. There are also differences in the nature of datasets
between advanced and developing countries, and in the extent to which the data provided
by respondents correspond to appropriate definitions of income or consumption. For
advanced economies, economic inequality is typically measured based on equivalised
income (where adjustments are made for family size and sometimes for the age of each
household member) while for other countries consumption or income per capita is more
commonly used. Large differences across countries and over time in household size raise
questions about cross-country comparisons of income inequality. In some developing
countries, the very notion of household (people sharing the same roof and meals) may be
difficult to define and measure.

68 │ 3. THE NEED TO FOLLOW UP ON THE STIGLITZ-SEN-FITOUSSI COMMISSION
BEYOND GDP: MEASURING WHAT COUNTS FOR ECONOMIC AND SOCIAL PERFORMANCE © OECD 2018
While in principle the income variable that should be the focus of attention when
analysing inequalities is disposable income (what individuals can spend, after paying
their direct taxes and receiving any current transfers) the precise income concept used by
respondents in most Latin American countries (where surveys have traditionally
measured income, rather than consumption) is often not clear. Likewise, while
international standards in this field (UNECE, 2011) argue that both income and
consumption should include goods produced within the household for their own use
(services produced within the household, such as child care, are excluded due to the
difficulties in measuring them) as well as imputed rents of owner-occupied housing (the
rent that individuals would have had to pay if they were renting their house), in practice
this is not in general the case, even among industrialised countries.17
Similarly, the impacts of consumption taxes and subsidies on household economic
resources are typically neglected. As shown in the chapter by Nora Lustig in the
accompanying volume, while it is generally acknowledged that household consumption
possibilities are reduced/increased by consumption taxes/production subsidies passed on
to the prices that households pay for the goods and services they purchase, taking this
impact into account has not been part of the conventions typically used for analysing
disparities in households’ economic well-being and for analysing the redistributive
impacts of government taxes and spending.18
Fiscal incidence studies that take these taxes
into consideration highlight significant distributive effects (Lustig, 2018).
Secondary databases differ too on whether adjustments (and which ones) are made to the
underlying micro data in order to correct for under-reporting, to eliminate outliers, or to
address missing responses on specific items. This situation results in inconsistencies
between datasets, meaning that different datasets may produce different estimates about
the level of inequality even when the underlying data source is the same. In some cases,
these problems may be so large that ascertaining whether there has been convergence in
levels of inequality among countries may simply depend on which secondary dataset is
used.
3.3.5. Describing income inequality: the choice of indicator
Presenting (and summarising) data on inequalities in income also gives rise to a number
of problems. The usual summary statistic is the Gini coefficient, an index which varies
between zero (in the case of perfect equality. i.e. everyone has the same income) and 1 (in
the case of perfect inequality, i.e. all the income accrues to a single person). This index is
computed based on a (Lorenz) curve (Figure 3.2) that plots cumulative shares of the
population against the cumulative shares of the income received (e.g. people in the
bottom 10% of the population may receive 5% of total income, people in the bottom 20%
may receive 12% of total income, etc.). The Gini coefficient is (twice) the area between
the Lorenz curve and the diagonal, and corresponds to the average income difference
between all pairs of individuals in the sample.
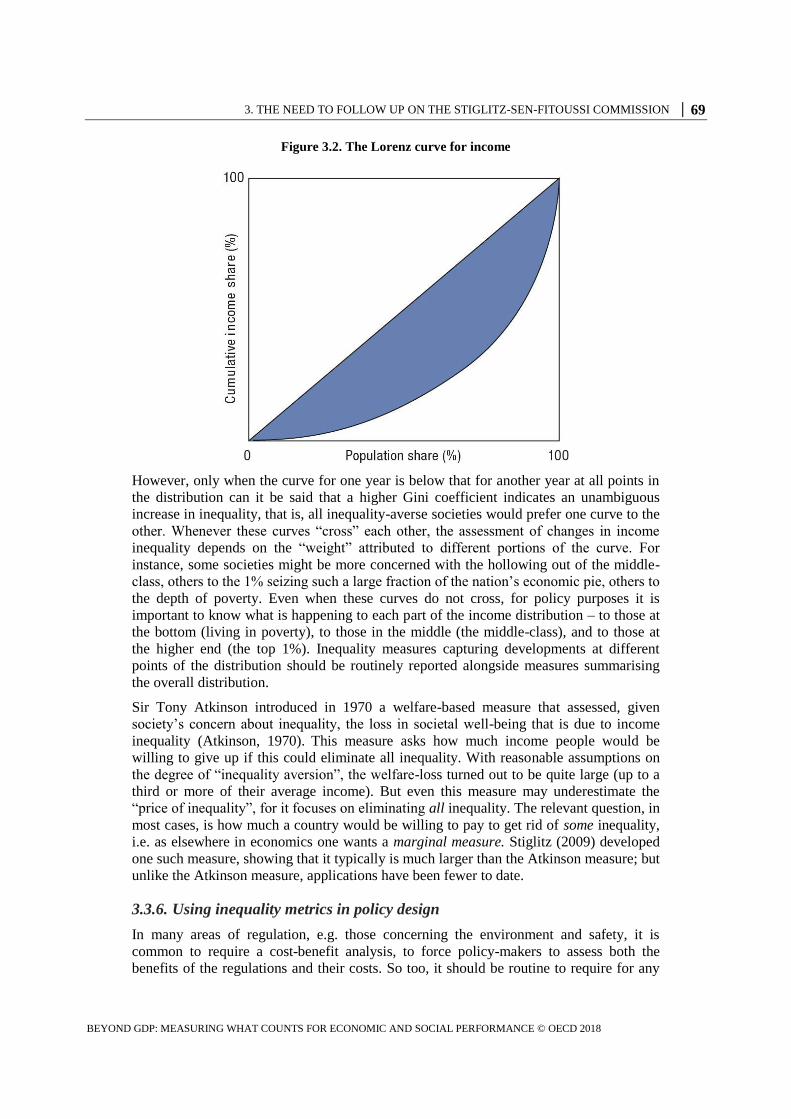
3. THE NEED TO FOLLOW UP ON THE STIGLITZ-SEN-FITOUSSI COMMISSION │ 69
BEYOND GDP: MEASURING WHAT COUNTS FOR ECONOMIC AND SOCIAL PERFORMANCE © OECD 2018
Figure 3.2. The Lorenz curve for income
However, only when the curve for one year is below that for another year at all points in
the distribution can it be said that a higher Gini coefficient indicates an unambiguous
increase in inequality, that is, all inequality-averse societies would prefer one curve to the
other. Whenever these curves “cross” each other, the assessment of changes in income
inequality depends on the “weight” attributed to different portions of the curve. For
instance, some societies might be more concerned with the hollowing out of the middle-
class, others to the 1% seizing such a large fraction of the nation’s economic pie, others to
the depth of poverty. Even when these curves do not cross, for policy purposes it is
important to know what is happening to each part of the income distribution – to those at
the bottom (living in poverty), to those in the middle (the middle-class), and to those at
the higher end (the top 1%). Inequality measures capturing developments at different
points of the distribution should be routinely reported alongside measures summarising
the overall distribution.
Sir Tony Atkinson introduced in 1970 a welfare-based measure that assessed, given
society’s concern about inequality, the loss in societal well-being that is due to income
inequality (Atkinson, 1970). This measure asks how much income people would be
willing to give up if this could eliminate all inequality. With reasonable assumptions on
the degree of “inequality aversion”, the welfare-loss turned out to be quite large (up to a
third or more of their average income). But even this measure may underestimate the
“price of inequality”, for it focuses on eliminating all inequality. The relevant question, in
most cases, is how much a country would be willing to pay to get rid of some inequality,
i.e. as elsewhere in economics one wants a marginal measure. Stiglitz (2009) developed
one such measure, showing that it typically is much larger than the Atkinson measure; but
unlike the Atkinson measure, applications have been fewer to date.
3.3.6. Using inequality metrics in policy design
In many areas of regulation, e.g. those concerning the environment and safety, it is
common to require a cost-benefit analysis, to force policy-makers to assess both the
benefits of the regulations and their costs. So too, it should be routine to require for any
70 │ 3. THE NEED TO FOLLOW UP ON THE STIGLITZ-SEN-FITOUSSI COMMISSION
BEYOND GDP: MEASURING WHAT COUNTS FOR ECONOMIC AND SOCIAL PERFORMANCE © OECD 2018
major policy an assessment of its distributional consequences, as the IMF has now started
doing.19
It is conceivable that, if such procedures had been routine, there might not have
been the large cuts in capital gains taxes in the United States under President Clinton,
which contributed so greatly to the growth in inequality; and if there had been a cut, it
might well have been designed differently.20
It is also possible that such assessments
would have led to some second thoughts about the austerity policies imposed on some
European countries following the financial crisis. Similarly, it would be advisable to
assess the distributional impacts of changes in labour market regulations. For example,
changing a labour market regulation without providing adequate social protection and
active labour markets programmes might generate adverse impacts on inequality out of
balance with any positive efficiency gains.
3.4. Macro- and micro-level statistics on household economic resources
The system of national accounts originated out of the need to have the information
necessary to manage the economy following the Great Depression, and based on Keynes’
notion that governments could use monetary and fiscal policy to manage the economy.
Both the impact of income distribution on macro-economics and the impact of macro-
economic policies on distribution were often not well recognised, and even less
frequently taken into account in policy discussions, especially over the past four
decades.21
This has changed today. A range of studies since the crisis (mainly undertaken by
researchers at the IMF and OECD), and based on cross-country datasets combining data
on GDP growth and income inequality, have suggested that higher income inequalities
may have reduced GDP growth (Ostry, Berg and Tsangarides, 2014; Cingano, 2014).
Such negative association has some plausibility in the aftermath of the 2008 crisis, when
lack of demand was a key constraint on growth, due to different propensities to spend by
people at different levels of the distribution.22
But there are obviously huge data problems
for any research that combines micro and macro data that are measured based on different
concepts and that exhibit large differences in how they change over the same period. The
difficulties are even larger when it comes to assessing the direction of causality between
the two and the role of other factors in explaining their association.
At the same time, the unorthodox monetary policies (quantitative easing) used by central
banks to support the economy in the aftermath of the crisis had large (adverse)
distributional impacts. Retired individuals who held safe, short and medium term bonds
saw their incomes hurt because of low interest rates, while wealthy individuals who
owned a disproportionately large share of equities saw the value of their stocks soar as a
result of markets’ positive response to quantitative easing. This distributive effect, largely
or more than offsetting the distributive benefits from higher employment which had been
one of the objectives of these monetary policies, may have contributed to limit the
effectiveness of these policies in sustaining growth and contributed to a sense of
unfairness in the design of public policy, fuelling people’s mistrust in government.
It is thus clear that macro-economic and distributional data need to be integrated. Macro-
and micro-statistics on household economic well-being have historically developed on
parallel tracks, sometimes leading to very different conclusions on how household living
standards had, on average, changed over time. Macro- and micro-consistency is obviously
important, and the disparity in numbers should call attention to the deficiencies in each
source. Scholars have been aware of the large discrepancies for some time (Altimir, 1987;
Deaton, 2005; Anand, Segal and Stiglitz, 2010), and suggested ideas to explain the
3. THE NEED TO FOLLOW UP ON THE STIGLITZ-SEN-FITOUSSI COMMISSION │ 71
BEYOND GDP: MEASURING WHAT COUNTS FOR ECONOMIC AND SOCIAL PERFORMANCE © OECD 2018
reasons behind them. However, co-ordinated action at the international level to put
macro- and micro-data on household economic resources on a consistent framework
started only in 2011, when the OECD and Eurostat carried out a feasibility study on
compiling distributional measures of household income, consumption and saving within
the framework of national accounts on the basis of micro data (see Box 5.1 in the
companion volume). By working to obtain consistency, we may get a far more accurate
picture of what is going on. Research reported by Alvaredo et al. in the accompanying
volume highlights the progress that has been achieved in harmonising the two sets of
data, through harmonised definitions and methods, and in using national accounts,
surveys and tax data together with other data sources such as rankings provided by “rich
lists” compiled by the press.
While most analyses of the rise in income inequalities are based on summary inequality
measures based on surveys, assessment of the pace of income growth for people at
different points in the distribution have to contend with the large (and growing)
differences in measured income growth that are reported in micro and macro sources. All
attempts to bring together information on both sources have to confront a range of
controversial methodological issues (described by Alvaredo et al.) and to make choices
that are open to disagreements. That said, when these choices and assumptions are made,
these estimates highlight some of the markedly different patterns across the world. For
instance, the estimates reported by Alvaredo et al., which combine data from tax, survey
and macro-data sources, show that between 1978 and 2015 national income per adult
increased by over 800% in China, by around 60% in the United States, and by around
40% in France. In China, the average income of the bottom 50% also grew strongly, by
around 400%, but less than the average, hence inequality increased. In contrast, the
bottom 50% of the population in the United States experienced a small (-1%) income
drop. In France, the income of adults in the bottom half of the distribution increased at the
same pace as the average, and income inequality was broadly stable – with only small
increases in the second half of the 2000s.
The integration of macro and micro statistics on household income, in ways that are
consistent with macro-economic totals for GDP and its components, is necessary to reach
firmer conclusions about the relationships between macro-economic activity, policy and
distribution. An understanding of these relationships is important not just because macro-
economic policy may have unintended distributional consequences, but also because
economic inequalities matter for the transmission of monetary and fiscal policies, and for
assessing risks of default linked to changes in asset prices. Macro-economists simply
cannot ignore issues of distribution in the way they did in the past.
3.5. Horizontal inequalities
Vertical inequalities such as those discussed above describe the extent of differences
between, say, the rich and the poor. Horizontal inequalities describe differences among
roughly similarly situated individuals or groups, e.g. between men and woman, across
races or ethnic lines, or within the family. Horizontal inequalities are often associated
with discrimination, which has well-discussed moral, social, political and economic
consequences. Horizontal (i.e. group) inequalities can lead to political instability when
the groups on the losing side manage to build coalitions based on their shared identities
(Doyle and Stiglitz, 2014). It is possible, even likely, that had more attention been paid to
horizontal inequalities, conflicts based on ethnic or religious groups might have been
avoided or at least lessened. At the same time, data showing the magnitude of horizontal
72 │ 3. THE NEED TO FOLLOW UP ON THE STIGLITZ-SEN-FITOUSSI COMMISSION
BEYOND GDP: MEASURING WHAT COUNTS FOR ECONOMIC AND SOCIAL PERFORMANCE © OECD 2018
inequalities can confirm existing beliefs about discrimination, thereby heightening
tensions.
Some types of horizontal inequalities are more difficult to capture than others. Traditional
settlement countries have long-established data collection that look at race and ethnicity,
while in many European countries (those scarred by the experience of genocide and
discrimination during WWII, or those that only recently experienced large-scale
immigration) such types of data collection are either explicitly forbidden or still under-
developed. A case can be made that, by not collecting these data, these countries are
blinding themselves to the most severe forms of discrimination.
Some of the criteria for comparing horizontal inequalities across countries also lack well-
established statistical conventions and definitions. An example is provided by disability
status where, despite decade-long discussions, no generally accepted definition applied
across official surveys exists yet. In other cases, no statistical criteria exist simply because
these types of horizontal inequalities (for example, those linked to sexual orientation)
have only recently entered public discussions: it is important that such definitions are
agreed and implemented in the context of population censuses.
Other types of horizontal inequalities are better understood but raise specific issues in
terms of measurement. In particular, focusing on household economic resources doesn’t
tell us how economic resources are distributed within the family or household, and
whether there are systematic gender biases. We know that there are inequalities in the
distribution of resources within families, especially in poor societies where girls are less
likely to receive education, or even food or health care, than their male siblings. In more
developed countries, we also know that who in the family receives the welfare payments
affects how these benefits are shared within the family (Woolley, 2004; Browning,
Chiappori and Weiss, 2014).
Deere, Kanbur and Stewart, in Chapter 4 of the accompanying volume, argue that
inequality is underestimated when intra-household inequality is not taken into account
(see also Deaton, 1997). However, as we have noted, gathering the requisite data to assess
intra-household distribution is not straightforward. Indirect indicators such as marital
regimes, or information on the weight or stunting of different household members, may
provide information on within-household inequalities in some contexts. In most
circumstances, however, measuring intra-household inequalities will require
distinguishing between those income streams that are paid to each household member
(e.g. earnings) and those that accrue jointly to all (e.g. returns on family assets), who in
the family takes the most important financial decisions, or the part of individual income
that is not shared with other members. Collecting information on both individual and
household economic resources in the context of the same survey would allow developing
better (if still imperfect) measures of gender inequalities, and help to target a range of
policies (e.g. whether welfare payments are paid to the male of female partner in a
couple) to reduce them.
3.6. Inequality of opportunity
Inequalities in the distribution of household economic resources and other individual
characteristics are not the only type of inequalities that matter to people and communities.
In fact, many observers claim that what matters are not inequalities of outcomes but
inequalities of opportunity. In a fair society, everyone should have equal chances to
achieve good outcomes regardless of the circumstances of his or her birth. Prominent

3. THE NEED TO FOLLOW UP ON THE STIGLITZ-SEN-FITOUSSI COMMISSION │ 73
BEYOND GDP: MEASURING WHAT COUNTS FOR ECONOMIC AND SOCIAL PERFORMANCE © OECD 2018
politicians have claimed, for instance, that while the United States has more inequality of
incomes than other countries, it has more equality of opportunity. This is an empirical
claim, one that needs to be supported. To ascertain the answer to that question, one needs
a conceptual framework – how should equality of opportunity be defined – as well as
metrics and data with which to make the assessment.
Inequality of opportunity may be defined as the differences in the set of options available
to individuals and/or families in different circumstances. Thus, an important strand in the
economics literature attempts to distinguish between an individual’s circumstances and
efforts. Equality of opportunity, in this approach, means that individuals exerting the
same levels of effort should have the same outcomes (or the same probability distribution
of outcomes) regardless of their circumstances.23
In particular, it would mean that
individuals born into poor families who exert a given level of effort would have as great a
chance in succeeding in life as those born to a rich parent exerting the same level of
effort.
Unfortunately, as shown by Bourguignon in Chapter 5 of the accompanying volume, we
typically do not observe effort. What this means in practice is that differences in
outcomes that are not explained by observable circumstances are attributed to effort. If
these circumstances explain only a small fraction of outcomes, there is a presumption that
there is a high level of equality of opportunity. In fact, if differences in circumstances
shift significantly the probability distribution of outcomes for a given level of effort, then
it is not possible to disentangle what is due to one and what is due to the other. Moreover,
our ability and willingness to exert effort may itself be affected by the circumstances of
birth. So the conceptual distinction between circumstances and efforts is, at best, blurred.
3.6.1. Why do we care?
People care about equality of opportunity because it is unfair, because it is inefficient, or
because of both. Most people feel that children are not responsible for the circumstances
of their birth, and many would find it deeply unfair if a child’s life chances were found to
be determined by those circumstances. Inequality of opportunity is economically
inefficient because it generates disincentives, undermines morale and is associated with a
misallocation of resources. Individuals who perceive that outcomes are largely
predetermined by the circumstances of their birth have little incentive to exert effort. A
perception that the economic system is rigged, that those born at the top will be the
winners, will also lower morale. (This is sometimes referred to as the fairness-efficiency
wage effect). If part of the inequality of opportunity is associated with a lack of access to
education or other resources, then it implies that those at the bottom of the scale will
underinvest in it. All of these factors imply that inequality of opportunities leads to a less
efficient and a more unequal society.
Indeed, inequalities of opportunity will lead to the perpetuation of inequalities of
outcomes. Most of the inequalities in income and wealth of the present generations
(which are an essential determinant of the set of opportunities of their children) transfer
themselves to the next generation. In turn, inequalities of the latter generation become
inequality of opportunities of the following generation. Thus greater inequalities in one
generation are translated to the next. The process is cumulative. In the words of Alan
Krueger: “the rise in inequality in the United States over the last three decades has
reached the point that inequality in incomes is causing an unhealthy division in
opportunities, and is a threat to economic growth. Restoring a greater degree of fairness
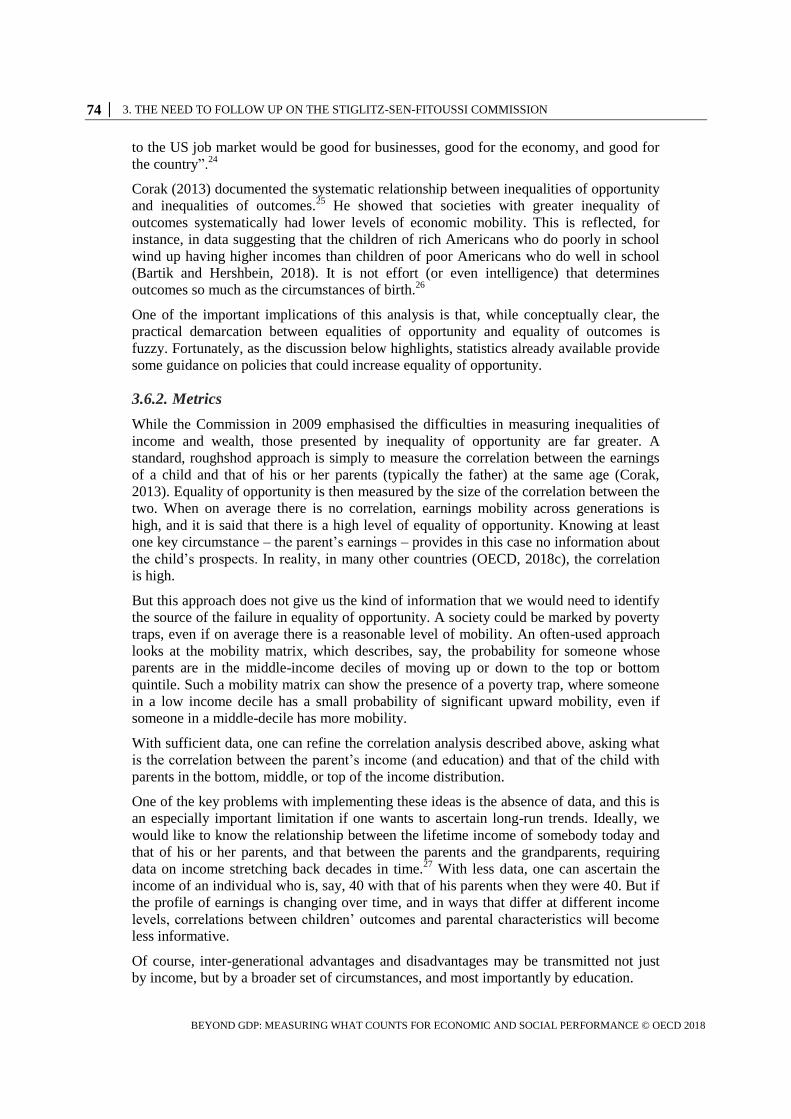
74 │ 3. THE NEED TO FOLLOW UP ON THE STIGLITZ-SEN-FITOUSSI COMMISSION
BEYOND GDP: MEASURING WHAT COUNTS FOR ECONOMIC AND SOCIAL PERFORMANCE © OECD 2018
to the US job market would be good for businesses, good for the economy, and good for
the country”.24
Corak (2013) documented the systematic relationship between inequalities of opportunity
and inequalities of outcomes.25
He showed that societies with greater inequality of
outcomes systematically had lower levels of economic mobility. This is reflected, for
instance, in data suggesting that the children of rich Americans who do poorly in school
wind up having higher incomes than children of poor Americans who do well in school
(Bartik and Hershbein, 2018). It is not effort (or even intelligence) that determines
outcomes so much as the circumstances of birth.26
One of the important implications of this analysis is that, while conceptually clear, the
practical demarcation between equalities of opportunity and equality of outcomes is
fuzzy. Fortunately, as the discussion below highlights, statistics already available provide
some guidance on policies that could increase equality of opportunity.
3.6.2. Metrics
While the Commission in 2009 emphasised the difficulties in measuring inequalities of
income and wealth, those presented by inequality of opportunity are far greater. A
standard, roughshod approach is simply to measure the correlation between the earnings
of a child and that of his or her parents (typically the father) at the same age (Corak,
2013). Equality of opportunity is then measured by the size of the correlation between the
two. When on average there is no correlation, earnings mobility across generations is
high, and it is said that there is a high level of equality of opportunity. Knowing at least
one key circumstance – the parent’s earnings – provides in this case no information about
the child’s prospects. In reality, in many other countries (OECD, 2018c), the correlation
is high.
But this approach does not give us the kind of information that we would need to identify
the source of the failure in equality of opportunity. A society could be marked by poverty
traps, even if on average there is a reasonable level of mobility. An often-used approach
looks at the mobility matrix, which describes, say, the probability for someone whose
parents are in the middle-income deciles of moving up or down to the top or bottom
quintile. Such a mobility matrix can show the presence of a poverty trap, where someone
in a low income decile has a small probability of significant upward mobility, even if
someone in a middle-decile has more mobility.
With sufficient data, one can refine the correlation analysis described above, asking what
is the correlation between the parent’s income (and education) and that of the child with
parents in the bottom, middle, or top of the income distribution.
One of the key problems with implementing these ideas is the absence of data, and this is
an especially important limitation if one wants to ascertain long-run trends. Ideally, we
would like to know the relationship between the lifetime income of somebody today and
that of his or her parents, and that between the parents and the grandparents, requiring
data on income stretching back decades in time.27
With less data, one can ascertain the
income of an individual who is, say, 40 with that of his parents when they were 40. But if
the profile of earnings is changing over time, and in ways that differ at different income
levels, correlations between children’ outcomes and parental characteristics will become
less informative.
Of course, inter-generational advantages and disadvantages may be transmitted not just
by income, but by a broader set of circumstances, and most importantly by education.

3. THE NEED TO FOLLOW UP ON THE STIGLITZ-SEN-FITOUSSI COMMISSION │ 75
BEYOND GDP: MEASURING WHAT COUNTS FOR ECONOMIC AND SOCIAL PERFORMANCE © OECD 2018
A shortcut to looking over long time-periods is to look at indicators of future
performance: for example, performance in students’ test scores, such as those
administered under the OECD PISA programme to 15 year-old students. Through these
data, one can ask whether there are circumstances of the child, such as the education of
his or her parents, the language spoken at home, or the number of books available, that
significantly affect his or her performance in school. The answer to that question is that
there are, and that the socio-economic conditions of households account for a significant
part of the competencies gained at school by students (OECD, 2013b). Other studies
show that childhood programmes, the health of the mother and exposure to adverse
environmental conditions during pregnancy can have significant effects on how children
develop (Currie, 2009).
3.6.3. Policy
While the available evidence shows that inequalities in child outcomes (e.g. among
children with parents at different levels of education and income) are large and, in many
cases, increasing over time, this evidence is limited in terms of both the outcomes
considered and the age of the child. Were such evidence available, it might be possible to
intervene earlier, and avoid more costly remedial interventions at later ages. Mounting
evidence on these inequalities, especially for children born of parents in the bottom of the
distribution, has led to a surge of interest around the world in early childhood education
(Heckman and Masterov, 2004).
As individuals move through life, they experience a variety of shocks (sickness, layoffs,
etc.). The ability to respond to such shocks – as well as the probability of experiencing
such a shock, its depth and duration – are, to a large extent, determined by circumstances.
This is probably the main source of inequality of opportunity appearing during adult life.
The availability of data on these circumstances would help in evaluating the role of social
policies in neutralising the long-run effects of such shocks.
While our discussion has focused on inequalities of opportunity in terms of income and
wealth, just as important is the opportunity to live a long and healthy life. Especially in
countries where there is inadequate public provision of health care services, a child born
of poor parents faces a greater prospect of a shorter and a less healthy life. Health and
economic outcomes are, of course, deeply inter-related, with low income contributing to,
and resulting from, poor health. Just as there is inter-generational transmission of
economic advantages and disadvantages, the same applies to health.
Gender is a key circumstance shaping outcome inequalities, and many of the indicators
conventionally used to chart gender inequalities, such as earnings differentials, point to a
progressive, albeit slow, reduction of these inequalities, at least in OECD countries. This
conclusion is however less clear-cut when controlling for the many characteristics
influencing earnings (e.g. education, job experience). Figure 3.3 (drawn from Chapter 5
by Bourguignon in the companion volume, itself sourced from Weichselbaumer and
Winter-Ebmer, 2005) shows that when some of these other characteristics are controlled
for, there is little or no reduction of women’s earnings gap (the continuous line in
Figure 3.3). In other terms, a circumstance of birth – gender – remains a critical
determinant of outcomes when controlling for observable aspects of effort such as
education. There is no equality of opportunity, as the economic system treats differently a
man and a woman with the same characteristics. This, in turn, implies that policies that
are only aimed at raising women’s participation in school and the labour market are
failing to address enduring wage discrimination.
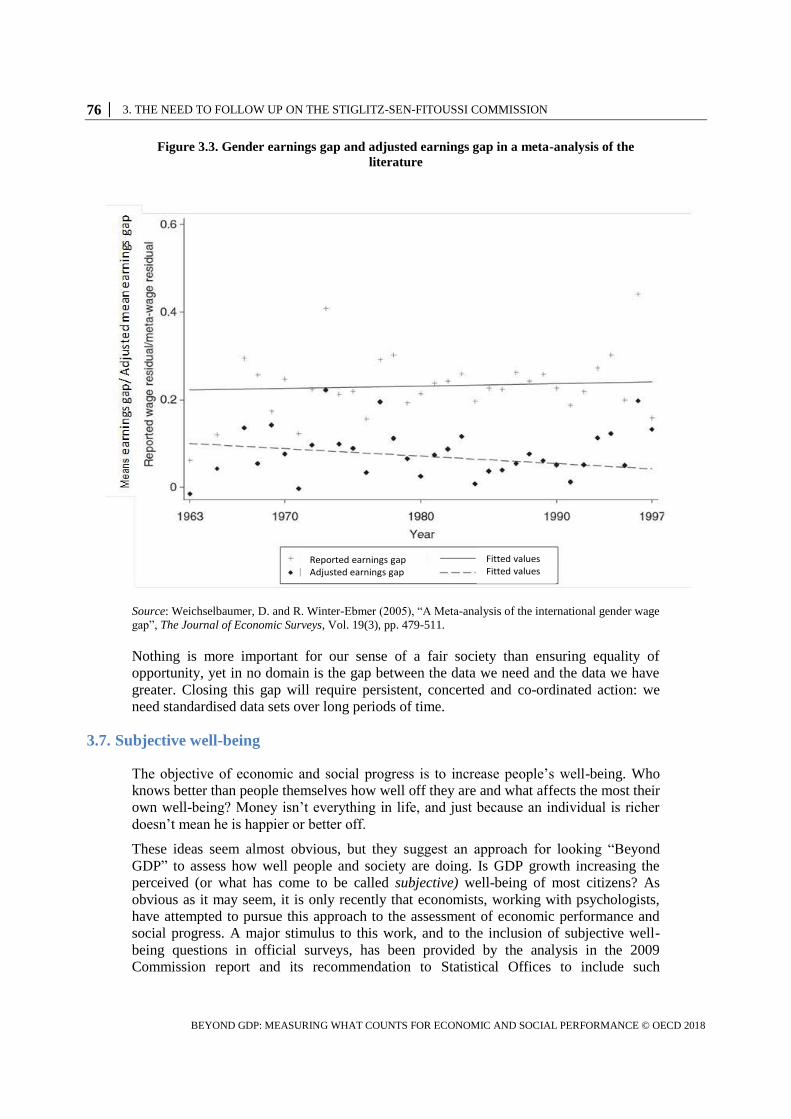
76 │ 3. THE NEED TO FOLLOW UP ON THE STIGLITZ-SEN-FITOUSSI COMMISSION
BEYOND GDP: MEASURING WHAT COUNTS FOR ECONOMIC AND SOCIAL PERFORMANCE © OECD 2018
Figure 3.3. Gender earnings gap and adjusted earnings gap in a meta-analysis of the
literature
Source: Weichselbaumer, D. and R. Winter-Ebmer (2005), “A Meta-analysis of the international gender wage
gap”, The Journal of Economic Surveys, Vol. 19(3), pp. 479-511.
Nothing is more important for our sense of a fair society than ensuring equality of
opportunity, yet in no domain is the gap between the data we need and the data we have
greater. Closing this gap will require persistent, concerted and co-ordinated action: we
need standardised data sets over long periods of time.
3.7. Subjective well-being
The objective of economic and social progress is to increase people’s well-being. Who
knows better than people themselves how well off they are and what affects the most their
own well-being? Money isn’t everything in life, and just because an individual is richer
doesn’t mean he is happier or better off.
These ideas seem almost obvious, but they suggest an approach for looking “Beyond
GDP” to assess how well people and society are doing. Is GDP growth increasing the
perceived (or what has come to be called subjective) well-being of most citizens? As
obvious as it may seem, it is only recently that economists, working with psychologists,
have attempted to pursue this approach to the assessment of economic performance and
social progress. A major stimulus to this work, and to the inclusion of subjective well-
being questions in official surveys, has been provided by the analysis in the 2009
Commission report and its recommendation to Statistical Offices to include such
Reported earnings gapAdjusted earnings gap
Fitted valuesFitted values
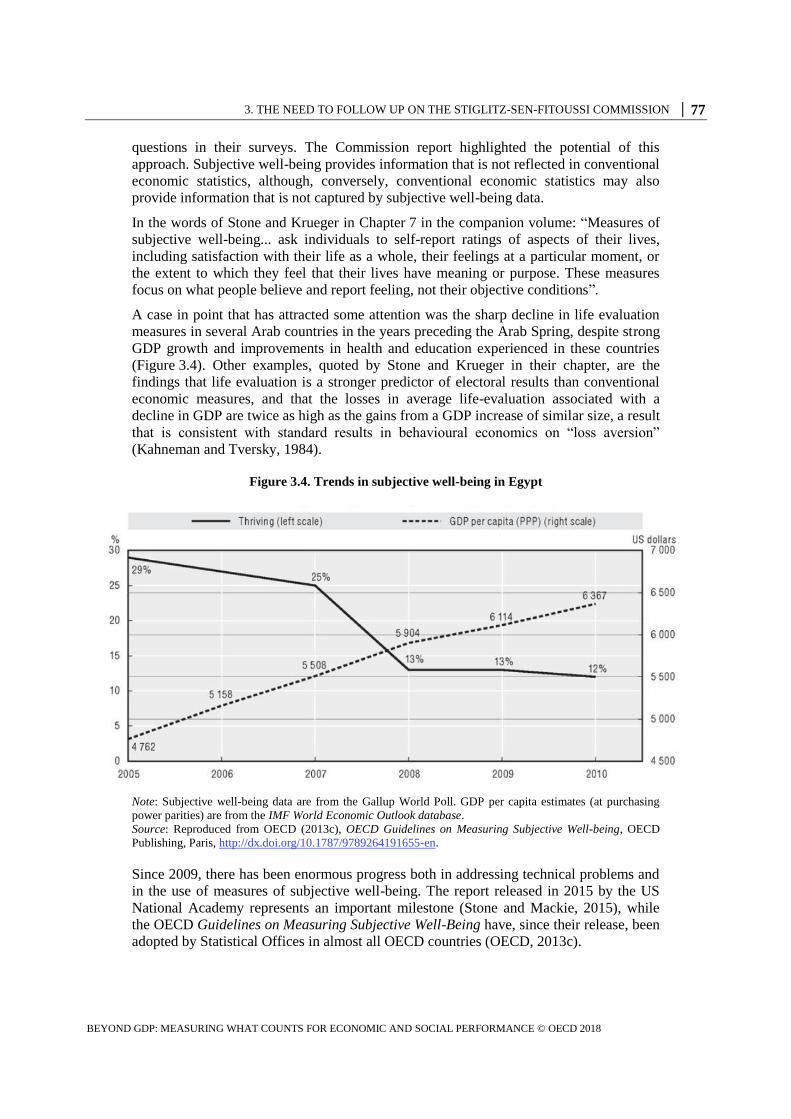
3. THE NEED TO FOLLOW UP ON THE STIGLITZ-SEN-FITOUSSI COMMISSION │ 77
BEYOND GDP: MEASURING WHAT COUNTS FOR ECONOMIC AND SOCIAL PERFORMANCE © OECD 2018
questions in their surveys. The Commission report highlighted the potential of this
approach. Subjective well-being provides information that is not reflected in conventional
economic statistics, although, conversely, conventional economic statistics may also
provide information that is not captured by subjective well-being data.
In the words of Stone and Krueger in Chapter 7 in the companion volume: “Measures of
subjective well-being... ask individuals to self-report ratings of aspects of their lives,
including satisfaction with their life as a whole, their feelings at a particular moment, or
the extent to which they feel that their lives have meaning or purpose. These measures
focus on what people believe and report feeling, not their objective conditions”.
A case in point that has attracted some attention was the sharp decline in life evaluation
measures in several Arab countries in the years preceding the Arab Spring, despite strong
GDP growth and improvements in health and education experienced in these countries
(Figure 3.4). Other examples, quoted by Stone and Krueger in their chapter, are the
findings that life evaluation is a stronger predictor of electoral results than conventional
economic measures, and that the losses in average life-evaluation associated with a
decline in GDP are twice as high as the gains from a GDP increase of similar size, a result
that is consistent with standard results in behavioural economics on “loss aversion”
(Kahneman and Tversky, 1984).
Figure 3.4. Trends in subjective well-being in Egypt
Note: Subjective well-being data are from the Gallup World Poll. GDP per capita estimates (at purchasing
power parities) are from the IMF World Economic Outlook database.
Source: Reproduced from OECD (2013c), OECD Guidelines on Measuring Subjective Well-being, OECD
Publishing, Paris, http://dx.doi.org/10.1787/9789264191655-en.
Since 2009, there has been enormous progress both in addressing technical problems and
in the use of measures of subjective well-being. The report released in 2015 by the US
National Academy represents an important milestone (Stone and Mackie, 2015), while
the OECD Guidelines on Measuring Subjective Well-Being have, since their release, been
adopted by Statistical Offices in almost all OECD countries (OECD, 2013c).

78 │ 3. THE NEED TO FOLLOW UP ON THE STIGLITZ-SEN-FITOUSSI COMMISSION
BEYOND GDP: MEASURING WHAT COUNTS FOR ECONOMIC AND SOCIAL PERFORMANCE © OECD 2018
Underlying the success of subjective well-being measures are several research findings.
First, information obtained in this way is replicable, and the statistics produced have a
high degree of reliability. Second, these measures themselves can, at least in part, be
explained and the explanations make intuitive sense. For example, people who live in
conflict zones, like Syria, report very low levels of subjective well-being; also, across
countries, an increase in average income increases people’s subjective well-being. As
noted in the previous chapter, the Great Recession lowered people’s subjective well-being
in countries most affected by the crisis (OECD, 2015b), especially for those who had lost
their jobs.
Explaining subjective well-being is not only of academic interest. It provides us with
tools for enhancing individual and societal welfare. If being employed matters for
people’s subjective well-being, then this evidence should provide impetus for stronger
responses to economic downturns, and perhaps even a justification for a government jobs
programme. This is even more true if economic insecurity adversely affects subjective
well-being and if there are compounding effects, i.e. both unemployment and economic
insecurity have a direct effect on subjective well-being, but the combination of the two
may have impacts that are multiplicative rather than just additive. These measures in turn
may help explain other variables of interest, though here research is still progressing, and
we have to worry about causality. For example, as noted by Krueger and Stone, there is a
positive correlation between people’s health status and their subjective well-being, but it
may be that low subjective well-being leads to negative health consequences, rather than
the other way around, where negative health consequences lead to low subjective well-
being. In reality, causality runs both ways. It will also be important in the future to assess
the consequences of lower subjective well-being for trust and for people’s view of how
the political system functions.
Throughout this book and the companion volume, we have emphasised the inter-relations
among the various threads discussed in this chapter, and this is especially true for
subjective well-being. Economic downturns affect insecurity, as we just noted, but
economic insecurity also affects health, and health and insecurity both affect subjective
well-being. Unemployment, or even the threat of unemployment, affects economic
insecurity as well as subjective well-being. Recognising these inter-relations is important
for at least two reasons. First, it helps us understand the multiple channels through which
changes in policy may affect economic performance and societal well-being. And,
second, in many cases, it helps us understand that there may be multiplier effects, not just
the positive effects upon which we are focusing (e.g. the benefits of say expansionary
fiscal policy on GDP) but indirect effects as well, through the reduction of economic
insecurity, the increase in human capital and the strengthening of wealth accumulation,
all adding up to what we are really interested in, i.e. the impact of policy on people’s
lives.
3.7.1. Technical issues
The 2009 Commission report argued that subjective well-being is in itself a multi-
dimensional construct encompassing several different aspects, such as life evaluations,
positive and negative experiences, and eudemonia (having a sense of purpose in life).
Each of these aspects requires its own metrics, and better understanding of its drivers.
Evaluative measures require a person to reflect upon and evaluate his or her life. Survey
questions can be used to elicit people’s summary evaluations of their current lives.
Measures based on these questions also appear to be broadly consistent with people’s
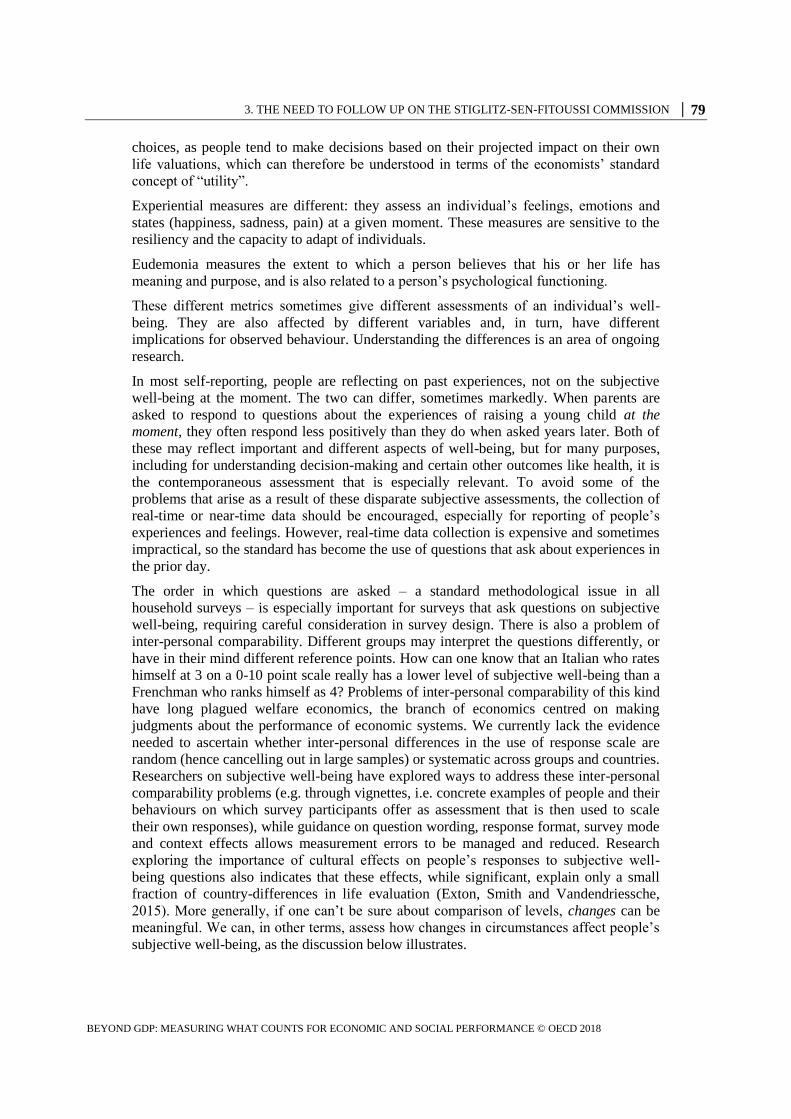
3. THE NEED TO FOLLOW UP ON THE STIGLITZ-SEN-FITOUSSI COMMISSION │ 79
BEYOND GDP: MEASURING WHAT COUNTS FOR ECONOMIC AND SOCIAL PERFORMANCE © OECD 2018
choices, as people tend to make decisions based on their projected impact on their own
life valuations, which can therefore be understood in terms of the economists’ standard
concept of “utility”.
Experiential measures are different: they assess an individual’s feelings, emotions and
states (happiness, sadness, pain) at a given moment. These measures are sensitive to the
resiliency and the capacity to adapt of individuals.
Eudemonia measures the extent to which a person believes that his or her life has
meaning and purpose, and is also related to a person’s psychological functioning.
These different metrics sometimes give different assessments of an individual’s well-
being. They are also affected by different variables and, in turn, have different
implications for observed behaviour. Understanding the differences is an area of ongoing
research.
In most self-reporting, people are reflecting on past experiences, not on the subjective
well-being at the moment. The two can differ, sometimes markedly. When parents are
asked to respond to questions about the experiences of raising a young child at the
moment, they often respond less positively than they do when asked years later. Both of
these may reflect important and different aspects of well-being, but for many purposes,
including for understanding decision-making and certain other outcomes like health, it is
the contemporaneous assessment that is especially relevant. To avoid some of the
problems that arise as a result of these disparate subjective assessments, the collection of
real-time or near-time data should be encouraged, especially for reporting of people’s
experiences and feelings. However, real-time data collection is expensive and sometimes
impractical, so the standard has become the use of questions that ask about experiences in
the prior day.
The order in which questions are asked – a standard methodological issue in all
household surveys – is especially important for surveys that ask questions on subjective
well-being, requiring careful consideration in survey design. There is also a problem of
inter-personal comparability. Different groups may interpret the questions differently, or
have in their mind different reference points. How can one know that an Italian who rates
himself at 3 on a 0-10 point scale really has a lower level of subjective well-being than a
Frenchman who ranks himself as 4? Problems of inter-personal comparability of this kind
have long plagued welfare economics, the branch of economics centred on making
judgments about the performance of economic systems. We currently lack the evidence
needed to ascertain whether inter-personal differences in the use of response scale are
random (hence cancelling out in large samples) or systematic across groups and countries.
Researchers on subjective well-being have explored ways to address these inter-personal
comparability problems (e.g. through vignettes, i.e. concrete examples of people and their
behaviours on which survey participants offer as assessment that is then used to scale
their own responses), while guidance on question wording, response format, survey mode
and context effects allows measurement errors to be managed and reduced. Research
exploring the importance of cultural effects on people’s responses to subjective well-
being questions also indicates that these effects, while significant, explain only a small
fraction of country-differences in life evaluation (Exton, Smith and Vandendriessche,
2015). More generally, if one can’t be sure about comparison of levels, changes can be
meaningful. We can, in other terms, assess how changes in circumstances affect people’s
subjective well-being, as the discussion below illustrates.

80 │ 3. THE NEED TO FOLLOW UP ON THE STIGLITZ-SEN-FITOUSSI COMMISSION
BEYOND GDP: MEASURING WHAT COUNTS FOR ECONOMIC AND SOCIAL PERFORMANCE © OECD 2018
3.7.2. Some further insights
A long-standing issue in research is the relationship between subjective well-being and
income. Early “happiness” studies (Easterlin, 1974) suggested that, as countries reach a
certain level of GDP per capita, their average subjective well-being (life evaluation)
didn’t increase. A great deal of effort has gone into explaining this “Easterlin paradox”.
For instance, if subjective well-being is related to one’s relative position, then if
everyone’s income doubles one’s relative position will be unchanged, in which case
subjective well-being would not change either. Recent studies have enhanced our
understanding of the relationship between GDP and subjective well-being (Stevenson and
Wolfers, 2012) but many aspects of the relationship remain unsettled. We know, for
instance, that the shape and strength of the relation depends on which aspect of subjective
well-being (evaluative, experiential, eudemonia) is considered. At lower levels of income,
the association between GDP and subjective well-being is positive whatever the specific
aspect considered, while at higher levels of income evaluative well-being is positively
associated with per capita GDP whereas experiential well-being is not (Kahneman and
Deaton, 2010).
We also know that many other factors beyond income influence subjective well-being
(Helliwell, Layard and Sachs, 2018). Being employed, in better health, having stronger
relationships and just being connected with others are among the most important factors,
with many other factors also identified in research. For instance, environmental
conditions and (lack of) air pollution not surprisingly contribute to subjective well-being.
There is also strong evidence of the importance of childhood experiences for people’s
subjective well-being as adults, and of the importance of people’s resilience, i.e. their
capacity to bounce back when confronting shocks. Childhood subjective well-being and
children’s emotional health are strong predictors of adult life satisfaction (Layard et al.,
2014).
Subjective well-being studies have provided us insights into how people fare over their
life. There are, of course, other indicators, such as depression and suicide, but these are
indicators that might be viewed as capturing “extremes” in subjective well-being. As
shown by Krueger and Stone in their chapter in the companion report, in most Western
countries, there is a U-shaped pattern of life evaluations with respect to age, a pattern that
does not hold for experiential well-being (which is often low for young people) and that is
absent in poorer countries (Steptoe, Deaton and Stone, 2015). This relationship holds
across different birth-cohorts. This suggests that people’s life priorities change as they
age (away from income), implying that policies towards the elderly should focus on a
range of aspects beyond income security in old age.
Differences in subjective well-being, for example between individuals at different ages or
in different circumstances, can also enrich distributional analysis. Elsewhere, in this and
the companion volume, we speak of “inequalities”. But perhaps the most important
inequalities are those associated with subjective well-being. These should be more
systematically measured and reported.
3.7.3. Further research
Our earlier discussion (and, even more so, the chapter by Krueger and Stone) has already
called attention to many areas where further research is needed. For instance, we noted
that there are measures for different aspects of subjective well-being. It will be important
to understand better their relationship with each other, the factors that affect each, and the
consequences of each.
3. THE NEED TO FOLLOW UP ON THE STIGLITZ-SEN-FITOUSSI COMMISSION │ 81
BEYOND GDP: MEASURING WHAT COUNTS FOR ECONOMIC AND SOCIAL PERFORMANCE © OECD 2018
The measurement agenda is a comprehensive and inter-related one. We already noted the
importance of subjective well-being as a mediating variable. As we get better measures of
economic insecurity, for instance, we will be able to ascertain better how economic
insecurity affects subjective well-being; and as we get better metrics of trust, we can
ascertain better how subjective well-being affects trust, thus providing a more
comprehensive perspective on the determinants of societal well-being.
While there has been great progress in collecting subjective well-being data, these are still
far from adequate, particularly if we are to assess changes over time (such as might be
associated with an economic downturn) or across countries. A low-cost way to increase
data availability about subjective well-being is to add subjective well-being questions to
existing surveys. We encourage National Statistical Offices to continue regular, frequent,
and standardised collection of subjective well-being data based on the OECD Guidelines.
3.8. Economic insecurity
In the late 1990s, the World Bank surveyed around 60 000 individuals living in poverty in
60 countries around the world in their project on Voices of the Poor (Deepa et al., 2000).
The project asked poor people about what aspects of their lives presented the greatest
hardship. After the obvious deprivation of income came their sense of economic
insecurity.
Concern about economic security grew during the financial crisis that erupted in 2008.
Even those who had not yet lost their job realised that their jobs were at risk, as the
unemployment rate soared. More than 12 million people are estimated to have lost their
jobs in OECD countries from the last quarter of 2008 to the first quarter of 2010, when
the employment count reached its trough. Small businesses experienced large falls in
sales, sufficient to push many to the brink of bankruptcy, and many went over the brink.
Declining asset and housing wealth affected many people, especially those in or nearing
retirement. Young people graduating from school worried whether they would be able to
get a job, especially one commensurate with their education and talents, and in countries
where tertiary education is often financed by student loans they worried about whether
they would have sufficient income just to repay their debt.
The impact of the crisis on people’s sense of economic insecurity may have been all the
greater because, even before the crisis, large parts of society had faced growing insecurity
due to changes in the economy, society and policies. For instance, areas of the world
confronting de-industrialisation saw life prospects in decline. Without adequate systems
of social protection, active labour market policies, and policies ensuring near-full
employment, the result was high insecurity.
It is, accordingly, natural that the topic of economic security is nowadays a greater
concern than at the time when the Commission report was published in 2009, not only for
citizens, but also for economists and policy-makers.
As argued by Jacob Hacker in Chapter 8 of the companion volume, economic insecurity
is a major aspect of people’s well-being. One of the reasons that governments did not pay
sufficient attention to it was that it was not adequately reflected in our standard statistics.
We focus here on economic security, but the boundary between economic security and
other forms of security is hazy. Countries like the United States with inadequate systems
of health care and disability insurance, forcing especially those with limited incomes to
face high levels of health insecurity, have high levels of economic insecurity. A major

82 │ 3. THE NEED TO FOLLOW UP ON THE STIGLITZ-SEN-FITOUSSI COMMISSION
BEYOND GDP: MEASURING WHAT COUNTS FOR ECONOMIC AND SOCIAL PERFORMANCE © OECD 2018
determinant of personal bankruptcy in the United States is an extended period of illness
or expensive health expenditures for some member of the family. In countries with high
levels of physical insecurity, people also face the risk of serious losses of their assets
from theft.
3.8.1. The concept of economic insecurity
Hacker defines economic insecurity as “individuals’ (or households’) degree of
vulnerability to economic loss”. This broad definition includes three elements: 1) the
probability of an adverse event (a shock); 2) the negative consequences from this shock
(the loss); and 3) the kinds of protection to prevent or cover these losses (the buffers). All
three elements are inherent in this definition: some probability of an adverse event; some
negative economic consequence if this event occurs; and some set of protections (from
formal insurance to informal risk sharing, to self-insurance through savings and the like)
that potentially offset or reduce the impact of the losses. All of these elements of
economic security are crucial when it comes to the development of measures to capture
overall economic insecurity.
Within this definition, one can also distinguish between “observed” (or objective)
insecurity, where analysts use economic data to determine whether an individual or
household is, in some sense, at risk of experiencing large reduction in say consumption
(perhaps reflected in large proportions of those within a particular group experiencing
such large reductions); and “perceived” (or subjective) insecurity, reflecting the sense of
vulnerability felt by individuals. With measures of perceived insecurity, individuals
themselves reveal their subjective response to their economic situation, whether through
surveys, experiments or some other revelation technique.
3.8.2. The drivers of growing economic insecurity
Even before the financial crisis, citizens and leaders in advanced democracies expressed
concern that economic security was declining. In developing countries, governments
grappled with new economic risks as people moved into wage labour and the traditional
risk-spreading role of the family declined. In both developed and developing countries,
public concern centred on the changing character of the economy and society with, for
instance, the fast-paced changes driven by globalisation and technological advances,
rising health care costs and lower pension benefits (especially in relation to previous
earnings) in many countries, and on the roles of governments, markets and households in
coping with the related economic risks.
Economic insecurity stems from the interaction of shocks, impacts and buffers, with
changes in any of the three potentially leading to higher economic insecurity. Changes in
the structure of the economy or in economic policies can increase people’s economic
insecurity by increasing the probability of a negative shock or its impact or by reducing
buffers available to respond to shocks. For instance, changes in family arrangements that
increase the likelihood of living alone have reduced the protections provided by the
family. Financial globalisation, it was argued, would enable countries to better manage
risks, borrowing in bad times and repaying in good; but in fact, for most countries (and
for most individuals), it has also increased volatility and insecurity, with capital flows
typically being pro- rather than counter-cyclical. Digitalisation increases consumer choice
and provides access to new services, but also fuels concerns about the effects of robotics
and artificial intelligence in displacing jobs and entire occupations, increasing people’s
fear of losing their job and income.
3. THE NEED TO FOLLOW UP ON THE STIGLITZ-SEN-FITOUSSI COMMISSION │ 83
BEYOND GDP: MEASURING WHAT COUNTS FOR ECONOMIC AND SOCIAL PERFORMANCE © OECD 2018
The risks that can lead to economic losses are many, and stretch beyond the economic
realm narrowly defined. While some of them are recognised by existing social security
programmes (e.g. unemployment, disability, illness, old age), others are often disregarded
(as in the case of needs of long-term care for frail elderly, of mental health problems, and
of frequent shifts between low-paid work and unemployment) or addressed through
programmes originally devised for addressing risks that no longer exist (such as
programmes for war widows, which are used today in the United States to address the
needs of lone mothers).
Many reforms to social protection or health care introduced in recent years, pursued
either to contain costs or to extend coverage, have reduced buffers available to people or
shifted risks to those less capable of protecting themselves against them. As we discuss
later, the weakening of social protection systems has had the collateral effect of
increasing economic insecurity. In developing countries, the security provided by family
support systems has typically weakened faster than countries have been able to provide
public systems of social protection. Similarly, in advanced countries, the shift from
defined benefit to defined contribution retirement systems has shifted risk from pension
schemes to the elderly.
Even good systems of social protection do not fully offset the increase in economic
insecurity associated with macro-economic volatility. This is especially so because
individuals are more sensitive to an income loss of a given size than to a gain of the same
amount (“loss aversion”, as mentioned above). This evidence suggests that macro-
economic policies should pay more attention to minimising the bumps that the economy
may face rather than just focusing on achieving the maximum GDP growth rate possible.
Increasing income inequality also increases economic insecurity: as the rungs of the
ladder are further apart, slipping down a rung becomes more consequential. Labour
market reforms aimed at increasing flexibility, while giving more discretion to the
employer, may have increased workers’ economic insecurity, except in those countries
where unemployment benefits were raised and policies that helped workers find a new
job quickly introduced.
3.8.3. Consequences
The consequences of economic insecurity can be severe, both economically and
politically, both for individuals and for society as a whole. Economic insecurity is a
source of stress and misery for people around the world. When individuals worry about
the future, trying to figure out how various contingencies might impact them when they
are just getting by as it is, they are less able to make good decisions, including about
those elements that will affect their future well-being. There is not just a present cost
from economic insecurity, but a future cost as well.
An increase in economic insecurity affects well-being and economic performance through
many other channels. Autonomy at work is reduced by the fear of losing one’s job. Job
satisfaction falls and, with it, overall well-being. Growing economic insecurity and
inadequate safety nets make people less willing to take risks, undermining economic
growth and entrepreneurship.
Economic insecurity is conceptually different from poverty. It affects a much larger share
of the population than poverty does. Those above the poverty level but at risk of falling
into it might feel high economic insecurity. Because of its wider reach, a growing sense
of economic insecurity is more likely to lead to shifts in political power than changes in
84 │ 3. THE NEED TO FOLLOW UP ON THE STIGLITZ-SEN-FITOUSSI COMMISSION
BEYOND GDP: MEASURING WHAT COUNTS FOR ECONOMIC AND SOCIAL PERFORMANCE © OECD 2018
poverty headcounts. Perhaps the increase of populist voting after the crisis would have
been less of a surprise had the higher economic insecurity among large parts of the
population prompted by the crisis and by ongoing structural and policy changes been
recognised.
We noted earlier the increase in economic insecurity associated with deep downturns. But
economic insecurity may also deepen and extend the downturn: individuals, worried
about their future, may be hesitant to spend, just at a time when such spending could help
spur recovery.
3.8.4. Market failure and policy
One might ask, if individuals value security in the same way they value the nutritional
content of food, why isn’t economic security reflected in market prices? Shouldn’t the
increased value of market products designed to reduce insecurity be reflected in higher
GDP?
To some extent, this is already the case. The market does provide insurance that helps
reduce economic insecurity, and the value of those products (the excess of the price of
those products, i.e. of the benefits paid out, over their costs - the wages paid to those
administering the system) is indeed included in GDP. But, due to informational
asymmetries, transaction costs and other market failures, insurance markets for many
important contingencies do not exist.
Social protection systems were created to address these market failures and to reduce
economic insecurity associated with unemployment, illness, disability, widowhood and
old age. But recent reforms have often shifted risks from governments to individuals,
from firms to workers, and reduced the extent to which risks are “mutualised”. Consider
for instance, the risks to economic security in old age. Before governments created public
pensions (known as social security in the United States), the private market failed to
provide annuities (i.e. assets paying someone a fixed amount of money for the rest of his
or her life). Even today, transaction costs for annuities are large and, whether because of
this or of information asymmetries or other market failures, buying a long-term bond is
often more advantageous than buying an annuity. Yet, reforms of public pension systems
have tended to put more reliance on the private sector. According to the EU Pension
Adequacy Report, the UK partial privatisation of public pensions may have had the effect
of reducing the projected pension benefits of men earning the average wage by 52%
(European Commission, 2018, p. 114). More generally, the shift from defined benefit to
defined contribution programmes has shifted risk from corporations to individuals, even
though the former are generally in a better position to bear and manage such risks.
There is an extensive literature on the fact that market failures are widespread in risk
markets. Social insurance programmes were created to make up for failures in insurance
markets, and are often more efficient than private schemes, partly because they do not
have advertising costs, partly because the private sector devotes large efforts at “cream
skimming”, trying to make sure that they insure only those with the lowest risk. Some of
these public institutions can be thought of as reflecting a social contract that arises from a
democratic process. When these social contracts become more costly to maintain, policy
reforms need to confront the risk that, as they try to make social protection systems
financially sustainable, they may also increase the economic insecurity of groups of the
population who have little capacity to bear it.
3. THE NEED TO FOLLOW UP ON THE STIGLITZ-SEN-FITOUSSI COMMISSION │ 85
BEYOND GDP: MEASURING WHAT COUNTS FOR ECONOMIC AND SOCIAL PERFORMANCE © OECD 2018
If our metrics do not capture the benefits that social insurance provides through greater
economic security, there will be a tendency to focus on their costs, underestimating their
benefits. The move towards a leaner welfare state is thus in part a consequence of not
accounting properly for the benefits of the welfare state.
These benefits are, of course, greater than just the value of the increased individual
security. If more secure individuals are more productive and/or are able to undertake
higher productivity but higher risk activities because of the presence of good social
insurance, then society is better off, with some of the benefits of the increased
productivity captured for the public benefit through taxation.
Concerns about moral hazard (adverse incentives) imply that it is not always desirable to
provide complete insurance. The attack against social insurance, however, has gone
beyond the level which can be so justified, especially today when so many people feel
economically insecure. It is clear that we need to improve our metrics of economic
insecurity and to assess policies for their impact on economic security, in addition to
other goals.
Both globalisation and technological change increase the likelihood of many of the risks
mentioned above. Hence, their acceleration should be accompanied by higher and/or
different (rather than lower) social protections, including systems that permit the
portability of acquired rights across jobs and countries of residence, as well as
investments in education and training to make people more resilient in the event of a
negative shock. In all cases, however, it would be better to explicitly consider the effects
of globalisation and technological change on people’s economic insecurity ex ante, rather
than just coping with their effects ex post.
3.8.5. Metrics
There are two critical distinctions in designing metrics of economic insecurity. The first
we referred to earlier: that between objective and subjective measures. The second
distinction is between dashboards of economic security based on multiple measures, and
integrated measures, which try to capture individual or household security in a single
measure. For many purposes, dashboards are preferable to single indexes, which are less
transparent and more sensitive to analysts’ choice of components and weights.
One of the main challenges for researchers and Statistical Offices is to identify a limited
set of measures of economic security that can be used in a broader dashboard of well-
being indicators. These selected measures should generally be: 1) broadly comparable
across countries; 2) available over sufficient time periods to monitor changes; 3) closely
linked to individuals’ actual experience; and 4) capable of informing policy-makers as
they seek to address economic security.
Surveys for assessing perceived economic security have the advantage of directly
capturing individuals’ perception of their personal and household economic conditions.
However, they have two shortcomings: surveys have not been run for a significant time
span, and questions differ among national surveys, thus hampering cross-country
comparisons. Survey questions can be grouped in three categories: 1) general assessment
of the economy (how one feels about the economy or the economic situation in the
present or in the past); 2) perception of the buffers available to respondents (for example,
the length of time respondents believe they could avoid economic hardship if faced with
an adverse shock); and 3) expectations regarding future shocks (one’s likely economic

86 │ 3. THE NEED TO FOLLOW UP ON THE STIGLITZ-SEN-FITOUSSI COMMISSION
BEYOND GDP: MEASURING WHAT COUNTS FOR ECONOMIC AND SOCIAL PERFORMANCE © OECD 2018
situation in the future or one’s worry with regard to specific risks, such as job loss). All
types of questions should be included in household surveys.
Objective measures try to quantify the shocks facing an individual (the probability of a
shock and the depth and duration of the impacts) and the size of the buffers enabling
individuals to cope with these shocks. One such measure, described by Jacob Hacker in
his chapter in the accompanying volume, looks at the size of the population who
experienced a large income loss (a fall in household-size-adjusted individual income from
one year to the next of 25% or more). This measure, which relies on panel data following
the same individual over time, is now available in a large number of industrialised
countries; it shows large differences across OECD countries (Figure 3.5), with many
countries experiencing increasing insecurity.28
Other types of objective measures
discussed by Hacker look at the key features (such as coverage and generosity) of the
public programmes that exist in various countries to address risks such as unemployment,
disability, old age, etc.
Figure 3.5. Average, range and evolution of the incidence of large income losses across
countries
Note: Based on the following panel data collections: ECHP, EU-SILC, CPS, CNEF (BHPS, SOEP, HILDA,
KLIPS, SHP, SLID). For each country, the period covered is indicated on the horizontal axis. Arc-changes,
unlike percentage changes, treat gains and losses symmetrically (e.g. an income gain from USD 50 to
USD 100 implies a 100 per cent change but a 67 per cent arc-change; while an income loss from USD 100 to
USD 50 implies a 50 per cent change but a 67 per cent arc-change); they are bound between +2 and -2.
Source: Hacker, J. (2018), “Economic security”, in Stiglitz, J.E., J.-P. Fitoussi and M. Durand (eds.) (2018),
For Good Measure: Advancing Research on Well-being Metrics Beyond GDP, OECD Publishing, Paris.
StatLink 2 http://dx.doi.org/10.1787/888933842147
0
0.05
0.1
0.15
0.2
0.25
0.3
0.35
0.4
0.45
SW
E (
03-1
4)
NO
R (
02-1
4)
FIN
(95
-14)
SV
N (
04-1
4)
NLD
(93
-14)
DN
K (
93-1
4)
RO
U (
06-1
4)
LUX
(94
-14)
CZ
E (
04-1
4)
DE
U (
84-1
5)
FR
A (
93-1
4)
MLT
(05
-14)
SV
K (
04-1
4)
CA
N (
93-1
0)
CH
E (
99-1
6)
ISL
(03-
14)
PO
L (0
4-14
)
BE
L (9
3-14
)
IRL
(93-
14)
AU
S (
01-1
6)
GB
R (
92-1
5)
AU
T (
94-1
4)
HU
N (
04-1
4)
ES
T (
03-1
4)
ITA
(93
-14)
US
A (
85-1
2)
BG
R (
05-1
4)
LTU
(04
-13)
ES
P (
93-1
4)
KO
R (
98-1
4)
PR
T (
93-1
4)
HR
V (
09-1
4)
GR
C (
93-1
4)
LVA
(05
-14)
SR
B (
12-1
4)
Mean incidence of 25% arc decline (DI) Range (min-max), no trend Range (min-max), w/trend arrow

3. THE NEED TO FOLLOW UP ON THE STIGLITZ-SEN-FITOUSSI COMMISSION │ 87
BEYOND GDP: MEASURING WHAT COUNTS FOR ECONOMIC AND SOCIAL PERFORMANCE © OECD 2018
3.8.6. Further research
Further work is required to select the best type of measure, to understand its properties,
and to relate insecurity to other aspects of economic performance and individual well-
being. The availability of reliable and cross-nationally comparable data has been a crucial
constraint on the development of improved measures of economic security. Three
shortcomings of existing statistics stand out: the limited pool of long-term and cross-
nationally comparable panel data about the income of various individuals; the weaknesses
of most administrative data for tracing individuals over time; and the lack of regular
questions about economic insecurity in conventional household surveys.
Measures of complex phenomena are necessarily imperfect, as is the measure of GDP,
but that should not prevent us from going ahead. The implication of the remarkable
advances in the measurement of economic insecurity, described by Jacob Hacker in his
chapter, is that governments should no longer ignore the effects of changes in economic
structure and policy on economic insecurity. Policies and statistical practice cannot ignore
something that is of first order importance for people and communities.
3.9. Sustainability
The importance of sustainability has been emphasised by the name of the goals that the
world has set for itself for the coming decades: Sustainable Development Goals. GDP
growth today that is at the expense of future generations is unacceptable. As we think
about what we do today, we must bear in mind our legacy to the future. If we leave the
world a worst place to live, then our own prosperity is at the expense of our descendants.
Economists and philosophers refer to this as inter-generational equity. People used to
believe that future generations would automatically be better off than the current one, the
only question being by how much. This assumption no longer holds.
Assessing sustainability requires determining if the current level of well-being can be
maintained for future generations. By its very nature, sustainability involves the future
and, as Yogi Berra quipped (paraphrasing Niels Bohr), “It’s tough to make predictions,
especially about the future.” Its assessment involves many assumptions and normative
choices. If (appropriately measured) wealth is increasing, then presumably society could
do in the future whatever it does today, i.e. it can sustain its per capita well-being. But, to
assure that outcome, we need a comprehensive measure of wealth, and we need to use the
right valuations. The Commission report in 2009 argued that measures of the
sustainability of well-being are conceptually different from measures of current well-
being, except to the extent that individuals’ current well-being is adversely affected by
anxieties over sustainability itself.29
Well-being may be enhanced today by depleting
some of the capital stocks essential for maintaining future production and future well-
being.
3.9.1. Environmental, economic and social sustainability
The most immediate threat to sustainability is the environment. We live within a limited
biosphere. Economists traditionally ignored these limitations, and constructed models of
economic growth without end. When, some half century ago, the Club of Rome started
talking about Limits to Growth (Meadows et al., 1972), the response was a wave of
technological optimism: we are innovative, the argument was, and whatever the Earth’s
limitations we can innovate around them. This techno-optimism has now been
questioned, especially with the growing awareness of climate change brought about by
88 │ 3. THE NEED TO FOLLOW UP ON THE STIGLITZ-SEN-FITOUSSI COMMISSION
BEYOND GDP: MEASURING WHAT COUNTS FOR ECONOMIC AND SOCIAL PERFORMANCE © OECD 2018
the accumulation of greenhouse gases in the atmosphere, and natural scientists have
quantified “safe operation boundaries” for several critical types of natural capital
(Rockström et al., 2009). Of course, there may be a technological revolution, but right
now, in the race between technology and humans’ destruction of the single planet on
which they live, technology is losing. We are on course for disruptive changes in our
ecosystem, with temperatures and sea levels rising, and disease vectors and weather
variability increasing – a host of changes that, at the very least, threaten to impose costs
on future generations which may well lower their standards of living, and significantly so.
Major cities will be affected, and hundreds of millions, perhaps billions, of people
relocated. The world faces countless environmental threats.
The 2008 crisis also showed that the economic system might itself not be sustainable.
Much of the GDP growth that preceded the crisis was based on a bubble, and when the
bubble burst, so did the seeming prosperity. Governments that thought that they were
acting prudently (like Spain and Ireland) found that their spending was based on “bubble
revenues”. Families that thought they could get by with stagnating wages because their
wealth was increasing as house prices soared and they could increase their debt, were
brought down to earth. They had been living beyond their means, and promises of ever-
rising standards of living were shown to be false. Standards of living in large swaths of
advanced countries were seen to be little better than they were decades earlier.
In 2009, the Commission emphasised the importance of looking at sustainability in all of
these dimensions. It was keenly aware that standard economic measures captured none of
this, and it struggled with the question of what indicators would best reflect sustainability.
The Commission arrived at a consensus that if markets worked well, one could form a
comprehensive measure of the “capital” of the country, i.e. the value of the resources that
one generation passes on to the next. This would include all forms of capital,
physical/economic capital (buildings and machines), human capital (and knowledge
capital); natural capital (environmental resources); and social capital (trust and
connections with each other). If we leave more capital to our descendants than we
inherited, then our descendants are likely to be better off, and their standards of living
will be at least as good as that of the current generation. We say then that such growth is
sustainable. This is the capital approach to sustainability.
The Commission, however, recognised that there were many problems with this
approach, especially with its practical implementation. The first, and most obvious, is that
markets for the future often don’t work very well. There was a housing bubble because
markets put an excessively high value on real estate. For fifty years, economists have
studied why markets so often systematically get these prices wrong. In the case of natural
resources, the market failure is even more obvious: we generally don’t impose a price on
carbon emitters or on biodiversity loss.30
The obvious failures of market pricing led the Commission to suggest that within the
dashboard of indicators, there ought to be some physical metrics, such as the carbon
footprint or the levels of concentration of carbon in the atmosphere.
In the narrower sphere of economics, some asset metrics also need to be introduced (see
below). Unfortunately, in much public discourse, attention gets centred on gross debt, and
especially public debt. Chapter 2 emphasised that this is an unbalanced perspective: no
one looking at a firm would consider its debt without also looking at its assets. You need
to consider the overall balance sheet. Partial information is dangerous: focusing on debt
alone may lead governments to take actions (like cutting productive investments) that
more than offset the increased value of liabilities, leaving the country worse off.
3. THE NEED TO FOLLOW UP ON THE STIGLITZ-SEN-FITOUSSI COMMISSION │ 89
BEYOND GDP: MEASURING WHAT COUNTS FOR ECONOMIC AND SOCIAL PERFORMANCE © OECD 2018
Other aspects of wealth, such as social and human capital, present even more formidable
challenges for measurement. The HLEG, as we noted, decided to focus its attention on
one aspect only, trust, a key part of social capital (see below).
As argued by De Smedt, Giovannini and Radermacher in Chapter 9 of the companion
volume, another problem with the capital approach is that it may suggest a
straightforward trade-off: one could make up for the deterioration of environmental
capital simply by adding more economic (physical) capital. This reasoning led some
economists to suggest that it would be better to do nothing about climate change today;
we should simply set aside enough money (economic capital) so that, should climate
change occur, we had made future generations better off by leaving them more capital
overall.
Even at the time of the Commission report, we cast doubt on that analysis. As a practical
matter, the magnitude of the increased economic capital that would be required to offset
the effects of climate change simply wouldn’t be forthcoming. Any rational discourse had
to take into account risk, recognising that in the worst outcomes, when the magnitude and
consequences of climate change were most severe, we would be least able to take the
actions to offset those effects.
The work of the HLEG has highlighted these risks in several ways. First, it highlighted
the concepts of resilience and vulnerability. Secondly, it focused on the complexity of the
economic/social/environmental system as a whole. Complex systems are characterised by
extensive non-linearities and interactions, which make them hard to predict. Even simple
complex systems can give rise to chaotic dynamics, with the system oscillating forever
without any discernible patterns. Small changes in initial conditions or in the parameter
values of the system can give rise to large changes in the dynamics of the system. This
inherent uncertainty should make us particularly cautious as we approach major changes
in the ecosystem, and the marked increases in atmospheric greenhouse gases represent
such a large change. As the debates on climate change unfolded, we already saw several
examples of this, many of which were not fully anticipated: as the tundra has defrosted,
methane gases have been released which have hastened its melting. As the solar ice cap
melts, the Earth reflects back less energy, exacerbating global warming. There can be
sudden reversals in patterns of ocean currents.
Analytically, price systems work only when the underlying technology is “well behaved”,
that is it exhibits familiar patterns of diminishing returns, as seen when one adds more
and more labour and capital to land in agriculture. The early pioneers in mathematical
economics (Arrow and Debreu, 1954) recognised this.31
Unfortunately it was a lesson that
practical followers of market economics lost sight of – a mistake that has become
increasingly important as attention has centred on a host of violations of conventional
assumptions of economic models, such as those associated with R&D, learning,
bankruptcy, contagion, etc. (Stiglitz and Greenwald, 2016; Battiston et al., 2013). The
fact that systems dynamics can be so sensitive to slight perturbations in initial conditions
and parameter values means that, even if it were possible to find competitive prices that
might prevail in the future, it would be extraordinarily difficult to be sure what those
prices should be, with small errors in estimates of the relevant parameters resulting in
large changes in prices (Roukny, Battiston and Stiglitz, 2017).
3.9.2. Vulnerability and resilience
As important as risks are, most earlier analyses paid insufficient attention to the
uncertainties and variabilities. Just as the previous section focused on how risk gave rise

90 │ 3. THE NEED TO FOLLOW UP ON THE STIGLITZ-SEN-FITOUSSI COMMISSION
BEYOND GDP: MEASURING WHAT COUNTS FOR ECONOMIC AND SOCIAL PERFORMANCE © OECD 2018
to economic insecurity at the individual level, here we need to focus on the consequences
of risk to the sustainability of systems. There are two related questions.
First, what is the risk of a negative shock to the economic or environmental system, in
particular of a shock that might make the growth path unsustainable (in which case past
living standards might not be attainable in the future)? For instance, there is uncertainty
about the relationship between current levels of greenhouse gas emissions, the total stock
of these gases in the atmosphere, and future levels of climate change. As shown by the
Stern Review (2006), while stabilising concentrations of greenhouse gases at the level of
450 parts per million (the level targeted by the 2015 Paris Agreement) will most likely
limit the increase in global temperature to 2 degrees Celsius, greenhouse gas
concentrations at this level still imply an 18% risk of a temperature increase of 3 degrees,
and a 4% risk of increases of 4 degrees of more. The system may be more fragile and
vulnerable than we currently think, so that, for a given level of GHG concentration in the
atmosphere, the size of temperature increase (with all the attendant knock-on effects)
could be much greater than in the baseline scenario.
Second, what is the resilience of the system, i.e. how strong are its capabilities of
recovering, for instance, from a large shock?
We can think of quantifying, at least in principle, the vulnerability of the economic and
environmental system – taking into account its resilience – by asking (analogously to how
we measure the impact of inequality) how much would a person or a society be willing to
give up (in terms of their wealth) to eliminate this risk. Similarly, we could measure the
value of an improvement in the resilience of the system by ascertaining by how much the
“vulnerability premium” is reduced as a result. Both types of measures, however, are
likely to vary across individuals and countries. The question of how much society would
pay to reduce vulnerability entails judgments about the welfare across generations. In
turn, any reasonable assessment of the welfare of future generations – especially taking
into account the risks of very adverse scenarios on climate change and recognising that, in
those contingencies, society would have limited capacity to deal with the impending
disaster – implies that we are almost surely not investing enough to reduce vulnerability.
3.9.3. Metrics of environmental and human capital
In Chapter 2 we discussed the particular difficulties in measuring capital (notably human
capital), especially in the aftermath of a crisis. We noted there how underestimating the
impact on wealth (and thereby on sustainability) of the recession and of the
accompanying austerity policies lead governments to not take strong enough policies to
stimulate the economy.
We also discussed some of the flawed measures used to assess economic sustainability
(looking just at the government gross debt-to-GDP ratio) and how these too may have
contributed to a weaker than desirable response to the downturn. As we noted earlier,
even in the lead-up to the crisis, standard metrics may have given an impression that the
economy was doing better than it really was, and not just because the government’s
revenues were artificially inflated as a result of capital gains associated with the bubble.
Higher risks incurred by banks raised the spread between interest rates on loans and
deposits, and thereby the measured output of financial intermediaries.32
Since the 2009 report, there has been significant progress in the availability of data on
environmental sustainability. In 2012, the UN Statistical Commission – the guardian of
official statistics – adopted as a statistical standard (the same status given to the System of
3. THE NEED TO FOLLOW UP ON THE STIGLITZ-SEN-FITOUSSI COMMISSION │ 91
BEYOND GDP: MEASURING WHAT COUNTS FOR ECONOMIC AND SOCIAL PERFORMANCE © OECD 2018
National Accounts) a set of “core” economic and environmental accounts (the System of
Environmental-Economic Accounting, or SEEA). The SEEA provides a framework in
which environmental statistics are fully integrated with national accounts, and thus offers
a measurement framework for analysing the interactions between the economy and the
environment.33
SEEA accounts cover flows of natural resources, products and residuals entering in (as
inputs) and exiting from (as waste) the economic system. These accounts (which include
both flow and asset accounts, in both monetary and physical units) cover minerals and
energy resources; land and soil resources; timber resources; water and aquatic resources;
as well as other biological resources (United Nations et al., 2014).34
While these core
accounts start from an economic perspective, a separate set of ecosystem accounts (whose
status is recognised as “experimental”) starts from the perspective of ecosystems,35
looking at both the relation between ecosystems and human activities, and at the relation
among ecosystems (for example, how wetlands depends on water flows from a
contiguous river basin). While these are important developments, implementation of these
accounts will spread over a long period, with different countries giving priority to
different types of natural resources. So we still fall short of having adequate measures of
the risks to the natural system, and scientific consensus on where the planetary
boundaries and tipping points are (Steffen et al., 2015).
As we take a closer look at each of the elements of “capital”, the notion underlying
sustainability, we note many unresolved measurement problems, both at the conceptual
level and in implementation. Beyond the issues on measuring trust and social capital
discussed below, there are also unresolved controversies over the best way of accounting
for the depletion of natural resources, the degradation of the environment and the loss of
biodiversity. For instance, the discovery (or the confirmation of the existence) of an
economically exploitable natural resource (adding to the level of “proven reserves”) is
treated in the national accounts as an addition to wealth, implying that if discoveries and
depletion move in tandem, there is no reduction in capital. That would be the case if there
were an infinite amount of natural resources and all that was needed was to discover
them. What is scarce, in this view, is information about where the resources are, rather
than the resources in themselves. A more realistic view, though, is that in the case of
many non-producible and non-renewable resources, resources are finite, and when we
consume those resources, our natural capital is being reduced even if this may be offset
by discoveries.
The SEEA addresses this issue. While the SNA only includes mineral and energy
resources that are economically exploitable given current prices and technology, SEEA
includes (at least in theory) all known mineral and energy resources, exploitable and not
exploitable. Nonetheless, extending the boundary of mineral and energy assets in the
accounts is more easily done in physical than in monetary terms. The valuation of mineral
and energy deposits, especially those that are currently non-exploited because of market
prices that are below extraction costs, poses considerable challenges to Statistical
Offices.36
Human capital is another important asset for individuals and communities to maintain
their well-being over time. An increase in human capital, and a decrease in the inequality
of its distribution, can have great positive effects on the economy and on the well-being
of society. It enhances future productivity and the ability to innovate. People with higher
education live longer, have higher earnings and accumulated wealth, better health
conditions, denser networks of connections and are more active citizens. While well-
92 │ 3. THE NEED TO FOLLOW UP ON THE STIGLITZ-SEN-FITOUSSI COMMISSION
BEYOND GDP: MEASURING WHAT COUNTS FOR ECONOMIC AND SOCIAL PERFORMANCE © OECD 2018
being, both now and in the future, is enhanced when human capital increases, people’s
skills and competencies decay when they are not used (e.g. in the workplace). Market and
individual decisions may also lead to under-provision of human capital when the full
range of its benefits is not fully recognised or doesn’t accrue to the person or firm
investing in it, or when there are capital constraints limiting the resources that an
individual with limited means has to invest in himself.
The problem is that there is no fully satisfactory way of measuring human capital. One
approach focuses on “costs” (like the costs of constructing physical capital). But physical
capital goods are bought and sold in relatively competitive markets, so that the price of a
machine reflects, in some sense, its underlying “value”. Human capital is generated by
formal education, most of which is publicly provided, but also by work experience and
upbringing: in none of these cases do we have a good mechanism for assessing the value
of the asset which has been acquired. Another approach looks at the “income generated”,
say by education and work experience, over the working life of each person. But this has
at least two problems. First, it is impossible to identify with any precision how much of
the income generated is a result of capital investment and of the individual’s own efforts.
It may be that individuals with more education, for instance, work harder, in which case
some of the increased income associated with higher education is wrongly attributed to
human capital, exaggerating the estimates of its magnitude and importance. Secondly, it
suggests that the only value of human capital is to produce more goods and services. In
this approach, when a person retires, he or she has no more human capital left. This is
obviously wrong. Even then, human capital continues to yield dividends in terms of
higher well-being.
While both of the approaches to human capital measurement described above aim to
derive a monetary value of the stock of human capital, a more practical approach is the
one used by the OECD to measure the key cognitive and workplace skills needed by
adults to prosper in society, similar to that used to measure the skills and competencies of
15 year-old students. The OECD Survey of Adult Skills has so far been conducted in
40 countries, with second cycles starting in 2019. Physical measures of this type need to
be continued in the future, extended to more countries and to more types of (non-
cognitive) skills.
3.10. Social capital and trust
Previous sections have outlined aspects of economic performance that have typically been
given short shrift in policy discussions, and suggested that one of the reasons for this is
that they are inadequately reflected in our standard measures of economic performance,
such as GDP, and social progress.
Here we consider one area that has only recently moved into the purview of economic
discourse: social capital in general and trust in particular. The Commission report in 2009
recognised the importance of social capital, the glue that holds society together, noting
the importance of social ties within the community to individual and societal well-being.
The extent of connectedness with other members of society varies widely between
individuals, with people with more connections having advantages over others.37
An
important source of inequalities of opportunity is the unequal distribution of social
capital.
Social capital allows contracts to be honoured without resorting to courts. If every
contract had to be enforced through the courts, the market system could not function.

3. THE NEED TO FOLLOW UP ON THE STIGLITZ-SEN-FITOUSSI COMMISSION │ 93
BEYOND GDP: MEASURING WHAT COUNTS FOR ECONOMIC AND SOCIAL PERFORMANCE © OECD 2018
Indeed, most economic relations are not based on contracts but on generalised trust.
Traditionally, trust has been recognised as a fundamental factor in the history of finance
and financial transactions. There is now a well-developed literature on social capital.
Some of this is formalised through game theory, showing that it is rational, in repeated
games, for people to act in a co-operative and trustworthy way (Dasgupta and Serageldin,
2000). More recently, a small literature has used insights from sociology and cultural
psychology to explain trustworthy and co-operative behaviour, for instance to explain the
success of micro-credit lending in Bangladesh and its failures in India (Haldar and
Stiglitz, 2016).
The HLEG decided to focus its attention on one aspect of social capital, albeit a very
important one, trust. Yann Algan, in Chapter 10 of the companion volume, defines trust
as “a person’s belief that another person or institution will act consistently with their
expectations of positive behaviour”. What makes the concept of trust so useful is: 1) there
are a variety of relatively consistent ways by which it can be measured; 2) variations in
levels of trust can be explained in ways that correspond to theory and common sense; and
3) trust metrics can be shown to be related to other measures of economic performance
and individual well-being. Given the importance of trust, policy-makers should pay more
attention to it, and to how their policies affect it.
The 2008 crisis reduced not just economic security but also trust. This was especially so
because of the widespread perception of the unfairness in the manner in which the crisis
was handled, as we showed in Chapter 2. The loss of people’s trust (both in others and in
institutions) is likely to be a long-lasting legacy of the crisis. This loss was predictable,
given what we know about the determinants of trust.
We should think of trust as an asset, as a key part of social capital. Trust takes time to
build but can dissipate quickly when people perceive that others did not behave in a
trustworthy way. There are thus important hysteresis effects, i.e. long lasting impacts of
past actions on present or future circumstances and behaviours.
There are many different forms of trust. A key distinction is that between trust among
individuals (inter-personal trust) and trust in institutions (institutional trust). Similarly,
within a given society, there can be trust in some institutions and not in others; trust
among people you know personally but not strangers (generalised trust). While trust in
others and trust in institutions are different, they are also related. When institutions are
dysfunctional and the rules of the game are perceived as unfair, they lower people’s
willingness to co-operate with each other, creating a “society of mistrust” (Coyle, 2013).
It then becomes more difficult to implement policies for the common good, which helps
create the conditions for populism and can even put democracy at risk (Inglehart and
Norris, 2016).
Typically, trust diminishes the more distant the relationship or the institution is, as we go
from “local” to “national” or “global”, from families to clans to strangers. While each
aspect of trust has its own determinants, causes and consequences, some general patterns
are discussed briefly below.
3.10.1. Metrics
Good measures of trust have been lacking, and this has contributed to policy-makers’
failure to focus adequately on trust. Existing measures of trust in institutions are typically
based on small-scale unofficial surveys that use a single question conflating different
aspects of trust, for instance trust in different institutions, and provide only limited
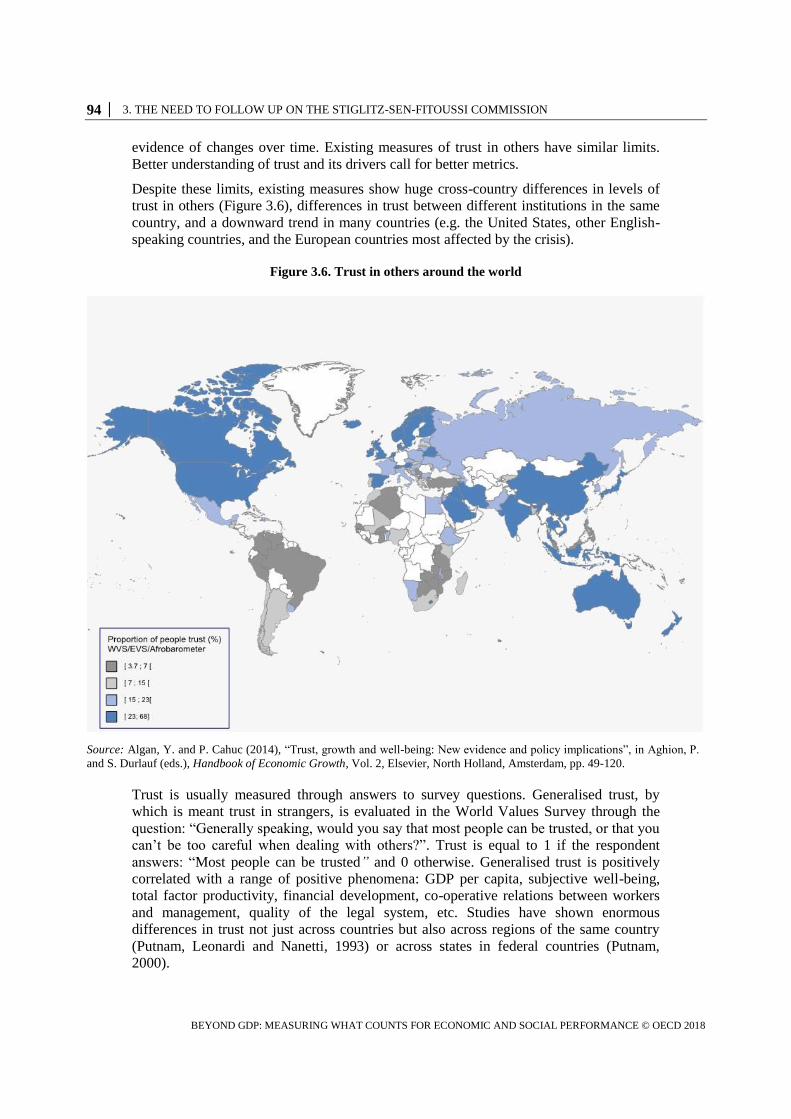
94 │ 3. THE NEED TO FOLLOW UP ON THE STIGLITZ-SEN-FITOUSSI COMMISSION
BEYOND GDP: MEASURING WHAT COUNTS FOR ECONOMIC AND SOCIAL PERFORMANCE © OECD 2018
evidence of changes over time. Existing measures of trust in others have similar limits.
Better understanding of trust and its drivers call for better metrics.
Despite these limits, existing measures show huge cross-country differences in levels of
trust in others (Figure 3.6), differences in trust between different institutions in the same
country, and a downward trend in many countries (e.g. the United States, other English-
speaking countries, and the European countries most affected by the crisis).
Figure 3.6. Trust in others around the world
Source: Algan, Y. and P. Cahuc (2014), “Trust, growth and well-being: New evidence and policy implications”, in Aghion, P.
and S. Durlauf (eds.), Handbook of Economic Growth, Vol. 2, Elsevier, North Holland, Amsterdam, pp. 49-120.
Trust is usually measured through answers to survey questions. Generalised trust, by
which is meant trust in strangers, is evaluated in the World Values Survey through the
question: “Generally speaking, would you say that most people can be trusted, or that you
can’t be too careful when dealing with others?”. Trust is equal to 1 if the respondent
answers: “Most people can be trusted” and 0 otherwise. Generalised trust is positively
correlated with a range of positive phenomena: GDP per capita, subjective well-being,
total factor productivity, financial development, co-operative relations between workers
and management, quality of the legal system, etc. Studies have shown enormous
differences in trust not just across countries but also across regions of the same country
(Putnam, Leonardi and Nanetti, 1993) or across states in federal countries (Putnam,
2000).
3. THE NEED TO FOLLOW UP ON THE STIGLITZ-SEN-FITOUSSI COMMISSION │ 95
BEYOND GDP: MEASURING WHAT COUNTS FOR ECONOMIC AND SOCIAL PERFORMANCE © OECD 2018
Countries with higher levels of trust tend to have higher per capita income. (This is a
correlation, not a statement about causation. As we have already noted, there may be a
two-way relationship, with greater trust leading to higher GDP, and a higher GDP leading
to behaviours which stimulate trust, as well as other factors that may influence both trust
and GDP.) Both generalised trust and trust in institutions are higher among higher income
groups and among more highly-educated people. They are lower among unemployed
people and single-person households with one or more dependent child.
As one might expect, trust is negatively correlated with income inequality. And rising
income inequality has also been related to lower trust in institutions. High-trusting
societies have lower levels of income inequality, measured by Gini coefficients, while
low-trusting societies show typically higher levels of income inequality. Trust is
undermined by things that run against people’s sense of fairness. Since, at least in many
countries, there is a general sense that income is inequitably distributed, it is not a
surprise that economic inequality is consistently identified as one of the strongest
predictors of generalised trust, and that countries with highest levels of trust rank highest
on economic equality (e.g. Nordic countries, the Netherlands, Canada; OECD, 2018a).
The adverse impacts on trust are among the “hidden costs” of inequality, which deepen
fault lines in societies. It is undoubtedly one of the reasons behind the argument that
income inequality has adverse effects on economic performance. Societies pay a high
price for inequality, including through a loss of trust in each other and in institutions
(Stiglitz, 2012a).
While the patterns described here hold true within and across the majority of OECD
countries, it is important to study the drivers of trust in the context of countries’ specific
circumstances.
3.10.2. The role of trust in our economy and the consequences of a lack of trust
A growing literature has traced the growth of modern capitalism to trust (Greif, 1993,
1994). The modern financial system, arguably, would not have arisen without the high
levels of trust that existed in the different Italian city-states, such as Florence.
For reasons that have been well described by Arrow (1972), trust matters a great deal in a
market economy. It makes it unnecessary for market participants to engage in the
impossible task of attempting to write contracts covering all types of future contingencies,
and thus it improves the functioning of the economy. Arrow’s intuition was
straightforward. In the absence of informal rules like trusting behaviour, markets are
missing, gains from economic exchanges are lost and resources are misallocated. In that
respect, trust and the informal rules shaping co-operation can explain differences in
economic development.
Responses to survey-based questions on trust are good predictors of macro-economic
outcomes, but there is very little understanding of the microeconomic mechanisms
involved, save the Arrow analysis.
Not surprisingly, trust is related to subjective well-being. For instance, co-operative social
relationships with others, which are facilitated by trust and give rise to trust, affect
people’s health and happiness above and beyond the monetary gains derived from co-
operation.
A lack of trust also has political consequences. Growing economic insecurity and higher
unemployment lower trust in political institutions and this in turn leads to higher voting
96 │ 3. THE NEED TO FOLLOW UP ON THE STIGLITZ-SEN-FITOUSSI COMMISSION
BEYOND GDP: MEASURING WHAT COUNTS FOR ECONOMIC AND SOCIAL PERFORMANCE © OECD 2018
for populist parties. Trust is also rooted in places and closely-knit communities whose
members behave in a trustworthy manner towards other members of the same community
(taking into account the well-being of others). Diversity, if not supported by integration
policies, may erode this sense of communal trust and, more broadly, support for
redistributive policies.
In turn, low trust in institutions leads to fewer people voting (this is especially true among
the less educated and those with lower income)38
or participating in policy in other forms.
The growing gulf in the occupational background and economic circumstances between
voters and their elected representatives also breeds mistrust. In a sample of OECD
countries, manual workers and people in other elementary occupations make up 44% of
the voting age population, but only around 10% of the elected members of parliament
(OECD, 2017a). In the United States, the median net worth of members of Congress was
above USD 1 million in 2013, while the median net worth of American households was
around USD 60 000 (Sitaraman, 2017). One implication is that less than 30% of all
people in OECD countries feel that they have a say in what the government does.39
The
2009 Commission report emphasised the importance of “political voice” for well-
functioning democracies and for people’s well-being. Judging from the current wave of
populist votes in many developed countries, this is an area where we seem to be moving
backwards rather than forward.40,41
3.10.3. Policy
As trust plays a key role in explaining economic and social outcomes, it is urgent to
identify the institutions and policies needed for it to develop. In particular, policy-makers
need to pay attention to those actions which might erode it.
Actions and processes that are perceived to be “unfair” (for instance, in how people are
treated in the processes by which decisions get made) undermine trust. In the United
States, as we noted, the seemingly favourable treatment given to bankers relative to
homeowners, undermined trust in government. So too in Europe, where the austerity
measures imposed on crisis countries – with particularly adverse effects on the poor –
were widely perceived as unfair, undermining trust in the key European institutions. At a
minimum, governments engaged in policies that are so perceived have a duty to do a
better job in persuading citizens that there is an underlying “just” rationale for the
policies.42
More generally, measures of people’s trust in various institutions, its causes and
consequences, provide a point of entry for developing metrics of “how government
functions” from the perspective of the people they serve. This is an important area for
future statistical work. There are some obvious candidates for important determinants:
when citizens’ preferences do not get reflected in legislations, it undermines trust that the
institutions are acting in any way consonant with democracy. So too actions that limit
democratic participation and enhance the influence of money should be expected to
undermine trust in democratic institutions. These are all empirical questions which can be
tested, with results that might shape a “trust building” agenda.
There has only been limited progress in identifying policies that most effectively promote
trust. As shown by Algan in his chapter, the evidence that exists is mainly limited to the
importance of education, including early interventions, with a focus on social (non-
cognitive) skills and teaching methods.43
If this is so, it implies that we need to routinely
measure those non-cognitive skills that impact on trust through instruments like PISA and
PIAAC (the OECD Survey of Adult Skills).
3. THE NEED TO FOLLOW UP ON THE STIGLITZ-SEN-FITOUSSI COMMISSION │ 97
BEYOND GDP: MEASURING WHAT COUNTS FOR ECONOMIC AND SOCIAL PERFORMANCE © OECD 2018
3.10.4. Further work
We need to improve existing measures of trust. As we noted, trust metrics (either trust in
others or trust in institutions) are typically derived from household surveys, but most
evidence stems from non-official surveys with small and non-representative samples that
do not allow to see which parts of the population face the largest trust deficits. Advances
in experimental economics and psychology have made it possible to verify correlations
between trust as reported by respondents in surveys and trust and other co-operative
norms observed in laboratory experiments. The results suggest that survey measures,
especially those of generalised trust, produce valid measures. In the future, it will hence
be important to include these questions in the routine, large-scale, data collection
activities of National Statistical Offices. The OECD Guidelines on Measuring Trust
(OECD, 2017b) provide information on various facets of statistical quality of existing
trust measures, as well as practical recommendations on the type of questions that could
be included in official statistics.
At the same time, efforts should continue to extend the complementary measures of trust
that lab experiments can offer using representative population samples. Yann Algan
describes in his chapter how these types of measures are already being implemented by
researchers, as in the case of the Trustlab project, jointly managed by the OECD and
Sciences-Po, Paris. Evidence from Trustlab can be used to assess the statistical quality of
survey data (with evidence showing that people who report high trust in surveys also
display more trusting behaviours in experimental games) but also to investigate what are
the key drivers of trust. Results from Trustlab indicate that government integrity, its
responsiveness, openness, and access to quality services are the most important
determinants of people’s trust in government (Murtin et al. 2018). The same tools could
also be used to explore other aspects of people’s behaviours, such as discounting of future
benefits, aversion to risks and uncertainties, and how (perceived) inequalities shape
behaviours. But we also need stronger evidence that how people behave in games and
experiments is a good guide to how they behave in real life situations.
While research on the causes and consequences of trust is still in its infancy, it is proving
to be a rich field of endeavour, with promising insights into our understandings of
economic performance and social progress. This is especially important in the context of
concerns about “fake news” and of the decline in trust in the media observed in many
countries. There are profound consequences for any society if the sources of information
cannot be trusted. The ability to have a rational discussion about alternative policies is
undermined when there is no minimal agreement about what the “facts” are.
Earlier in this chapter, we identified several correlates of trust. But, to date, we still have
an imperfect understanding of causality, and indeed, causality may often run in both
directions. A lack of trust in public institutions may hamper their ability to engage in
redistribution because there may be a fear that redistribution will go the wrong way, i.e.
from the poor to the rich. But high levels of inequality, especially when they cannot be
justified, also undermine trust in institutions. Similarly, a well-functioning legal system
may enhance trust, while a lack of trust may lead to an overly rule-bounded legal system
in which, in the process of following detailed rules, miscarriages of justice may end up
undermining trust.
Because trust plays such an important role in economic and social performance, it is
urgent to identify the institutions and public policies that will foster its growth.
Developing better metrics would enable us to measure our successes in these endeavours.

98 │ 3. THE NEED TO FOLLOW UP ON THE STIGLITZ-SEN-FITOUSSI COMMISSION
BEYOND GDP: MEASURING WHAT COUNTS FOR ECONOMIC AND SOCIAL PERFORMANCE © OECD 2018
3.11. Conclusions
All the areas discussed above will require greater research and better data in the years to
come. Even for those areas that already feature prominently in ongoing statistical
collection – such as vertical inequalities in household economic resources – there are
important methodological challenges that stand in the way of adequately capturing
underlying realities. Other areas – such as subjective well-being or environmental
accounting – have only recently started to be covered by Statistical Offices, and
measurement initiatives will need to be strengthened to extend the evidence base needed
to improve the quality of these statistics. Other areas yet – such as economic insecurity,
inequality of opportunity, trust and resilience – currently lack a foundation in countries’
statistical system. Greater investment is needed in all these areas, as arguably lack of
more adequate metrics contributed to inadequate policy decisions.
Notes
1. USD 1.9 is the updated value of the earlier USD 1 a day standard for extreme poverty.
2. The OECD generally reports its measures of income poverty based on a threshold set at half of
median (equivalised) disposable income, i.e. around USD 82 per day for a single mother of two
children in the United States (i.e. USD 27 per day per capita). This does not imply that “extreme
poverty” (based on the conventional World Bank threshold) has been eradicated in developed
countries. Deaton (2018) argues, based on World Bank data, that of the 769 million people who
lived on less than USD 1.9 a day in 2013, 3.2 million were in the United States, and 3.3 million in
other OECD countries. Edin and Shaeffer (2016), based on data from the US Census Bureau
Survey of Income and Program Participation, report that 4.3% of American households with
children (and 5.1% of those without children) reported living on less than USD 2 a day per person
in 2011 based on their pre-tax money income; and that 1.6% (and 4.3%) were in the same
condition based on a welfare metric that included food stamps and other welfare benefits.
3. According to Milanovic (2016), the value of the global Gini coefficient (based on household
survey data for some 120 countries and 2005 PPP) declined from around 0.72 in 1988 to 0.67 in
1988. Historical estimates of the global Gini coefficient compiled by Bourguignon and Morrison
(2002) and by Moatsos et al. (2014) – based on measures of GDP per capita for countries’ mean
income, on 1990s PPPs and on measures of within-country inequalities from a variety of sources –
show a continuous increase from the 1820s (with Gini values of around 0.50) to the 1950s (0.67)
followed by broad stability thereafter.
4. As noted by Milanovic, measuring global income inequality is a recent endeavour, with
estimates affected by factors such as the quality of income distribution data available for
individual countries, the PPP wave used, and whether national-account based corrections for
differences in mean incomes between surveys and national accounts are applied or not.
5. See OECD Income Distribution Database www.oecd.org/social/income-distribution-
database.htm.
6. The Stolper-Samuelson theorem (Stolper and Samuelson, 1949) predicted that opening up trade
between developed and less developed countries would lower wages in the developed country,
especially those of unskilled workers, even taking into account the lower prices that consumers
would have to pay.
7. Whether these programmes directly improve the well-being of their parents is debatable. The
assumptions used in conventional incidence analysis imply that they do, as they consider the costs
of these programmes as an income stream accruing to the household participating in them.

3. THE NEED TO FOLLOW UP ON THE STIGLITZ-SEN-FITOUSSI COMMISSION │ 99
BEYOND GDP: MEASURING WHAT COUNTS FOR ECONOMIC AND SOCIAL PERFORMANCE © OECD 2018
8. The use of adjusted income as welfare metric raises its own interpretative problems. Poor
households in rural areas will not benefit from health and education services that are mainly
benefitting richer households in urban neighbourhoods, so that “attributing” these services to them
through inadequate techniques would simply overstate their economic well-being. The same
upward bias would result from analysis that attributes to end-users the higher costs of health-care
services.
9. The problems associated with discrepancies between macro (national accounts) and micro
measures of mean household income are discussed in the next section of this chapter.
10. Capital gains are excluded from the standard definition of household income provided by the
UN Canberra Group Handbook on Household Income Statistics, 2nd
edition. That said, in standard
economic analysis, capital gains would count as “income” in the same way as a dividend does.
11. This under-coverage of some hard-to-reach population groups is one explanation of the
difference between income measured from surveys and from the national accounts (see below).
12. In the System of National Accounts, all household expenditures on durables are recorded as
consumption at the time of the purchase.
13. Based on experiments carried out in Tanzania (with 8 random samples of 5 000 households
each drawn from the same population), Beegle et al. (2012) concluded that, relative to a
benchmark household budget survey with a 14-day recall period and a long list of consumption
items, reducing the recall period by a week lowered measured mean consumption by 12% percent,
while combining a lower recall period and a shorter list of commodity items reduced mean
consumption by 28%.
14. The OECD has started to collect data on wealth distribution based on its Guidelines for Micro
Statistics on Household Wealth (OECD, 2013e). The first wave of the OECD Wealth Distribution
Database included 17 countries, the second wave released in 2018 extended the coverage to
27 countries. See www.oecd.org/statistics/guidelines-for-micro-statistics-on-household-wealth-
9789264194878-en.htm; and https://stats.oecd.org/Index.aspx?DataSetCode=WEALTH.
15. Even the direction of change in wealth inequality may differ according to whether one captures
wealth not held directly by the individual. There is not only the problem of lack of disclosure.
Sometimes, the trust documents deliberately obscure who is the beneficiary, naming several
individuals who might benefit. Only the trustees know who is likely to benefit from the trust.
Nevertheless, Kopczuc and Saez (2004) have argued that wealth held in trust is small relative to
total household wealth and that its omission does not affect their results on wealth inequalities.
16. The OECD and Eurostat, in association with a number of National Statistical Offices, are
currently producing experimental estimates of the joint distribution of household income,
consumption and wealth, based on the OECD Framework for Statistics on the Joint Distribution of
Household Income, Consumption and Wealth www.oecd.org/statistics/framework-for-statistics-
on-the-distribution-of-household-income-consumption-and-wealth-9789264194830-en.htm.
17. While imputed rents are included in the 2011 “operational definition” of household income
proposed by the Canberra Group Handbook (UNECE, 2011), several Statistical Offices in OECD
countries (Canada, Korea, New Zealand and the United States) do not routinely include them in
their income distribution statistics. Even in countries that do include them, methodological
differences (e.g. on the residences included, methods of estimation, types of renters) are so large as
to prevent meaningful comparisons across countries.
18. This is partly because there are complex issues associated with assessing the general
equilibrium incidence of different taxes and subsidies. This is particularly relevant in assessing the
distributional impacts of different policies.
19. Assessments conducted by the IMF (and the World Bank) are based on the fiscal incidence
tools developed by the Commitment to Equity (CEQ) Institute. The CEQ, founded in 2015 at
100 │ 3. THE NEED TO FOLLOW UP ON THE STIGLITZ-SEN-FITOUSSI COMMISSION
BEYOND GDP: MEASURING WHAT COUNTS FOR ECONOMIC AND SOCIAL PERFORMANCE © OECD 2018
Tulane University, has so far developed tax and benefits models for 43 countries (with work in
progress for other 23) based on methodologies described in the CEQ Handbook. See
http://commitmentoequity.org/.
20. For instance, previous investments also benefitted from the tax cut, implying negative
distributional effects with no positive impact on incentives.
21. A large group of Keynes’ followers, led by Cambridge economist Nicholas Kaldor, did give
primacy to the importance of distribution in the determination of the macro-economic equilibrium.
This tradition survives, and in the aftermath of the 2008 crisis, the Commission of Experts on
Reforms of the International Monetary and Financial System appointed by the President of the
United Nations General Assembly emphasised the role of growing inequality in the crisis. The
Report is available as The Stiglitz Report: Reforming the International Monetary and Financial
Systems in the Wake of the Global Crisis, New York: The New Press (2010). Published in complex
Chinese by Commonwealth Magazine Company, in simplified Chinese by Xinhua, in French by
Odile Jacob, in India by Orient Black Swan (2011), in Korean by Dongnyok, in Russian by
International Relations Publishing, and in Spanish by RBA.
22. Stiglitz provides a theoretical investigation of the relationship between inequality and macro-
stability (Stiglitz, 2012a and 2012b). Other empirical and theoretical studies have shown that,
other things being equal, more inequality undermines economic performance, leading to lower
growth and more instability. Cingano (2014), for example, shows that more inequality is
associated with greater inequality of opportunity, which means that children at the bottom are less
likely to get the human capital they need to live up to their potential. Of course, some countries,
like China, have grown very fast in spite of high levels of inequality; indeed, the high GDP growth
rate, with parts of the country “pulling ahead” of the rest, contributed to higher inequality.
23. Luck also plays an important role in determining people’s life beyond either “circumstances”
and “effort”. Frank (2016) shows how the role of luck becomes more important in winner-takes-all
societies, arguing that the tendency for “successful people… to understate luck’s role in their
success” makes them less willing to invest in achieving public goods.
24. Krueger, statement delivered (in his capacity as Chairman of the Council of Economic
Advisors to US President Obama) on 12 January 2012 at the Centre for American Progress.
https://milescorak.files.wordpress.com/2012/01/34af5d01.pdf
25. Krueger, in his 2012 statement, labelled this the “Great Gatsby” relationship. Chetty and his
co-authors have shown that a similar relationship holds when looking across countries in the
United States (Chetty et al., 2018).
26. A simple interpretation of this relationship is that when the rungs of the ladder are further apart
(as they are in societies with greater inequality of outcomes), it is harder to move up the ladder.
27. Such long time series are especially important if we want to establish whether income
dynamics are Markovian, i.e. whether there are effects that stretch across generations. In the case
of Sweden, for which there is some data, there is evidence of such effects (Adermon, Lindhal and
Palme, 2016).
28. A major determinant of economic insecurity is economic volatility; but the effects on
insecurity of a given variability in say GDP may differ, depending not just on the buffers available
but also on the structure of the economy. Germany, for example, responded to the 2008 financial
crisis with more work-sharing, so that the risks were more effectively shared among workers than
in other countries.
29. In practice however, the indicators that may be used to monitor some aspects of sustainability
(e.g. measures of people’s health status or education to measure human capital) may be the same
as those used to monitor current well-being.
3. THE NEED TO FOLLOW UP ON THE STIGLITZ-SEN-FITOUSSI COMMISSION │ 101
BEYOND GDP: MEASURING WHAT COUNTS FOR ECONOMIC AND SOCIAL PERFORMANCE © OECD 2018
30. A recent international commission reviewed the evidence and noted that, if the world is to
attain the goals it has set for itself of limiting global warming to between 1.5 and 2 degrees
Celsius, a tax of at least USD 50 to USD 100 per ton of carbon will have to be imposed (CPLC,
2017).
31. One could even say that, along with the theory, they also delivered “its complete mode of use”.
32. Within the system of national accounts, output at current prices of financial intermediaries is
measured through an indirect measure of the value of intermediation services with no explicit
charge provided by banks (FISIM). In practice, this is done by applying the difference between the
observed interest rates on loans and a risk-free “reference rate” to the amount of outstanding bank
loans, and the difference between the observed interest rates on deposit and the risk-free rate to the
amount of bank deposits (Lequiller and Blades, 2014).
33. By applying the SEEA framework, monetary and physical data can be combined in a
consistent manner for calculating intensity and productivity ratios. Macro-level indicators can also
be broken down by industry, allowing to analyse environmental pressures exerted by different
industries and consumption behaviours, and to distinguish government responses from those of the
business sector or private households.
34. See, for example, the physical supply table for air emissions that reports emissions (in tonnes)
of 14 substances (ranging from carbon dioxide to ammonia and particulates) from industries (by
sector), households (by activity) and landfills. Similarly, the physical asset account for mineral and
energy resources reports opening stocks, additions (discoveries, upward reappraisals,
reclassifications), reductions (extractions, catastrophic losses, downward reappraisals,
reclassifications) and closing stocks of five types of natural resources (oil, natural gas, coal and
peat, non-metallic and metallic minerals), with information separately provided for “commercially
recoverable resources”, “potentially commercially recoverable resources” and “non-commercial
and other known deposits” (United Nations et al., 2014).
35. The SEEA Ecosystem Accounts define ecosystems as a “dynamic complex of plant, animal
and micro-organism communities and their living environment interacting as functional unit”
(United Nations et al., 2014).
36. For an overview of the treatment of mineral and energy resources in the SEEA framework and
of the challenges related to the valuation of these resources, see www.oecd-
ilibrary.org/docserver/3fcfcd7f-
en.pdf?expires=1533647411&id=id&accname=guest&checksum=5887745A4C5EC338EABCF35
528EFE5B1.
37. In the sense of Bourdieu and Passeron (1990).
38. According to data from the Comparative Study of Electoral Preferences (CSES), reported in
OECD (2017a), the gap in voter turnout, based on self-reports, between people in the bottom and
top income quintile across 25 OECD countries, is around 15 points. These measures are likely to
underestimate differentials in voting behaviour, as those who did not vote are less likely to report it
in surveys.
39. Based on data from the OECD Survey of Adult Skills (OECD, 2013f) reported in OECD
(2017a).
40. So too, the “Voices of the Poor” exercise, to which we referred earlier in this chapter: lacking
voice in decisions that affect their lives was one of the important deprivations reported by the poor
(Narayan et al., 2000).
41. A process is currently in place to develop metrics for monitoring progress in attaining Goal 16
of the UN 2030 agenda, which is about “effective and accountable institutions”. A UN City Group
on Governance Statistics (Praia) has also been created to move forward statistical work in this
field.

102 │ 3. THE NEED TO FOLLOW UP ON THE STIGLITZ-SEN-FITOUSSI COMMISSION
BEYOND GDP: MEASURING WHAT COUNTS FOR ECONOMIC AND SOCIAL PERFORMANCE © OECD 2018
42. Some policy-makers argued that saving banks, bankers and their shareholders was necessary to
keep the flow of credit going, and that this could be done even without imposing conditions of
“good behavior” (e.g. lending) on the banks. Such policies – protecting bankers rather than
ordinary citizens – only undermined further trust in government.
43. Careful attention, however, needs to be given to the mechanisms by which education builds
trust. To the extent that it enhances citizens’ ability to understand the rationale for government
actions – a particular policy can be understood as more than a special measure advancing the
interest of some group – it is natural that more education enhances trust. But if government
policies largely serve the interests of elites, moving more individuals into the elites through
education may increase the number of people who support the government, but will do little to
improve trust amongst the non-elites. Thus, as we have emphasized throughout this book, a
“Beyond GDP” analysis requires more granular data than just “averages”. More generally,
correlation is not causation, and there are often multiple interpretations for why one might expect a
particular correlation, with markedly different policy implications.
4. COUNTRY-EXPERIENCES WITH USING WELL-BEING INDICATORS TO STEER POLICIES │ 103
BEYOND GDP: MEASURING WHAT COUNTS FOR ECONOMIC AND SOCIAL PERFORMANCE © OECD 2018
Chapter 4. Country-experiences with using well-being indicators to steer
policies
This chapter evaluates what is different when policy is approached through a well-being
lens. It describes the different ways in which well-being indicators could be used in the
different stages of the policy cycle, from identifying priorities for action, to assessing the
pros and cons of different strategies to achieve policy goals, to allocate the resources
(budgetary, human, political) needed to implement the selected strategy, to monitor
interventions in real time as they are implemented, and to assess the results achieved and
take decisions on how to change policies in the future. The chapter argues that a broad
framework encompassing the most important dimensions of people’s lives, paying
attention not just to average outcomes but to how policies affect each of the segments of
society, and giving a balanced consideration to well-being today, tomorrow and in other
parts of the world, holds the promise of delivering better results and bridging the divide
that separates policy-makers and ordinary people today.
104 │ 4. COUNTRY-EXPERIENCES WITH USING WELL-BEING INDICATORS TO STEER POLICIES
BEYOND GDP: MEASURING WHAT COUNTS FOR ECONOMIC AND SOCIAL PERFORMANCE © OECD 2018
4.1. Introduction
As shown in the Annex of this book, the development of better indicators of economic
performance and social progress has played an important role in developing a shared
evidence-based understanding of what makes for better lives.1 However, while
broadening and improving metrics is needed to better assess countries’ performance and
the problems that may lay ahead, they do not, in themselves, lead to a change in the
setting and framing of policy In all countries, there is always the risk that the newly
developed indicators become “just another report”, rather than leading to a new approach
to policy making. Many of the well-being indicators included in the dashboards adopted
by countries are already well-established, and they do play a role in orienting policies
(e.g. unemployment). However, beyond the fact that, as argued in previous chapters,
many such indicators still require improvement to help avoid some of policy mistakes of
the past, what is also important is that institutional mechanisms are in place to foster the
use of these indicators by governments when taking decisions.
This chapter asks, what is different when policy is approached through a well-being lens?
4.2. Using well-being indicators in policy-making
Box 4.1 describes the different ways in which well-being indicators could be used in the
different stages in the policy cycle, from identifying priorities for action, to assessing the
pros and cons of different strategies to achieve policy goals, to allocate the resources
(budgetary, human, political) needed to implement the selected strategy, to monitor
interventions in real time as they are implemented and, finally, to assess the results
achieved and take decisions on how to change policies in the future (Figure 4.1). The
argument made in this section is that a broad framework – encompassing the most
important dimensions of people’s lives, paying attention not just to average outcomes but
to how policies affect each of the segments of society, and giving a balanced
consideration to well-being today, tomorrow and in other parts of the world – holds the
promise of delivering better results and filling the chasm that separates policy-makers and
ordinary people today.
Using well-being metrics in a policy context can deliver many advantages. These include:
Providing a more complete picture of people’s conditions in any given
jurisdiction (e.g. a country, region or city) and drawing attention to outcomes that
matter to people’s lives but are not routinely considered in policy analysis simply
because of a lack of suitable metrics. In a sense, this was where the “Beyond
GDP” agenda began; as we noted, GDP simply did not capture key aspects of
people’s conditions.
Supporting the strategic alignment of outcomes across government
departments. Throughout the policy cycle, co-operation and cohesion across
government is essential. Government agencies often operate in silos, focusing on
the resources and outputs for which they are directly responsible (housing, health,
education, employment, etc.) and without reference to the wider impacts of their
actions. For example, crime and justice agencies will focus on the direct impacts
of their actions in reducing crime and enforcing safety measures, despite the fact
that spill-overs from other policy areas and society-wide patterns (such as
poverty, housing, or lack of public health and education services) may be large.
Policy spill-overs also operate in the other direction, with personal safety as a
4. COUNTRY-EXPERIENCES WITH USING WELL-BEING INDICATORS TO STEER POLICIES │ 105
BEYOND GDP: MEASURING WHAT COUNTS FOR ECONOMIC AND SOCIAL PERFORMANCE © OECD 2018
major determinant of outcomes in other policy areas, e.g. as a driver of education
outcomes and social connections. Similar spill-overs occur in all policy areas. By
identifying the range of outcomes to be considered by all policies, frameworks for
measuring people’s well-being can promote consistency across government and
provide a common language for agencies to discuss these impacts. Additionally, a
multi-dimensional well-being framework (i.e. a framework that encompasses the
range of aspects that matter to people’s lives) can generate positive interactions
between government agencies, pushing them to co-ordinate their actions and
programmes to achieve some higher level objective and helping them to do so.
These frameworks can also assist in clarifying responsibilities across and within
different levels of government and different groups of stakeholders, increasing co-
ordination among policies.
Highlighting the diversity of people’s experiences through more granular data. In contrast to many aggregate measures which focus on the performance of the
economic system as a whole, metrics informing on outcomes at the individual and
household level enable us to focus on inequalities, pockets of deprivation and
vulnerability, and/or on groups whose outcomes are failing to keep pace with
country-wide developments. The notions of “inclusive growth” at the OECD or of
“shared prosperity” at the World Bank are attempts to put more focus on
assessing how the benefits of economic growth are distributed.
Considering both well-being outcomes today and resources for tomorrow. As
we highlighted in the previous chapter, a key limit of GDP is that it doesn’t take
sustainability into account, either in terms of whether economic growth is itself
sustainable over time or whether growth is being achieved with environmental
and social costs that offset part (or most) of its economic benefits. The broad
coverage (i.e. economic, environmental and social) of well-being measures is here
a key advantage. In addition, most approaches to measuring well-being include
forward-looking elements, such as indicators of natural, human, social and
economic capital stocks that will support well-being in the future (although, as
seen above, much progress still remains in measuring these capitals). This
balances out the short-term focus of most policy decisions (on the “here and
now”) and enables governments to examine whether progress on well-being today
is being achieved at the expense of depleting stocks of resources for future
generations (“later”) or in other countries (“elsewhere”).2
Promoting more comprehensive evaluations of the impact of specific policies on
people’s lives. Encouraging different government departments to consider the
wide range of well-being outcomes and impacts of their programmes has the
potential to help policy-makers identify impacts of programmes, and articulate
trade-offs and spill-overs more explicitly and transparently. Accountability for
results is fundamental to efficient and effective governance. It is the ultimate
rationale for evaluating policy interventions ex post, and is an important input into
strategic priority setting. Well-being frameworks can form the basis for the
accountability procedures of government agencies. In defining the set of desired
outcomes expected from policy interventions through a range of indicators
relating to people’s well-being, ex post policy evaluation can increase
accountability for a wider range of outcomes than previously considered.
Agreement on the dimensions and indicators of people’s well-being can also
streamline external accountability measures, such those exercised through
parliamentary oversight, audit agencies and by civil society, creating a common
106 │ 4. COUNTRY-EXPERIENCES WITH USING WELL-BEING INDICATORS TO STEER POLICIES
BEYOND GDP: MEASURING WHAT COUNTS FOR ECONOMIC AND SOCIAL PERFORMANCE © OECD 2018
language and a consensus on the types of benefits expected from various policies
and programmes.
Fostering public debate. Regular reporting, monitoring and evaluation using
well-being metrics allows a country-wide discussion, based on a common concept
of what makes for a good life, between all stakeholders, from politicians to civil
society, businesses and ordinary citizens.
4.2.1. Mechanisms for integrating well-being indicators in policy decision-
making
Routine reporting of well-being statistics can, in itself, help to highlight issues and inform
policy decisions in the agenda-setting phase of the policy cycle. Simply making available
data on levels, inequalities and trends in well-being to a wide range of stakeholders (e.g.
civil society, politicians, business and the media) can shift opinion, inform debate, and
influence priority-setting. For example, availability of credible data on students’ skills,
based on standardised assessment of their competencies through the OECD PISA
programme, has had a huge impact in shifting the focus of educational policies beyond
attendance and graduation to what is actually learned by students in schools.
Nevertheless, to unleash some of the potential benefits of well-being metrics outlined
above, it is necessary to go beyond simply making indicators available to wide audiences.
For example, integrating well-being metrics in policy formulation and evaluation requires
a conscious decision on the part of those performing or commissioning this research and
analysis, as well as a demand from decision-makers for a more comprehensive evidence
base on which to draw. It also requires an established set of tools, models and techniques
recognised across the analyst profession within governments (such as the methods set out
in the United Kingdom Treasury’s Green Book: Appraisal and Evaluation in Central
Government (HM Treasury, 2018), to evaluate the costs and benefits, monetary and non-
monetary, of all government programmes).
Several OECD countries have developed formal and/or structured mechanisms to ensure
that well-being or “Beyond GDP” indicators are integrated into their policy processes.
These mechanisms can target a specific stage of the policy cycle depicted in Figure 4.1 or
encompass several. These specific mechanisms or procedures provide a good point of
entry for a “Beyond GDP” analysis, for they allow to ascertain whether they give
adequate weight or attention to the various other dimensions of well-being beyond
aggregate economic output. For instance, many countries require a cost-benefit analysis,
say for energy programmes, with the impacts in the future discounted. Current procedures
used in many countries effectively imply that negligible weight is given to the impacts of
climate change 40 years from now; in short, the procedures do not ensure sustainability.
Table 4.1 provides an overview of such experiences in 10 countries that have adopted
well-being policy frameworks, identifying the leading agency and the stage of the policy
cycle addressed by the mechanism put in place (see Exton and Shinwell (2018) which
describes the settings in which the policy mechanisms and frameworks were developed in
these countries). From these case studies, it is possible to identify some common themes,
differences and challenges that arise when implementing well-being frameworks into
policy settings. Common themes relate to the measurement framework itself, the process
used to reach consensus on its features, and the political context of each country.

4. COUNTRY-EXPERIENCES WITH USING WELL-BEING INDICATORS TO STEER POLICIES │ 107
BEYOND GDP: MEASURING WHAT COUNTS FOR ECONOMIC AND SOCIAL PERFORMANCE © OECD 2018
Box 4.1. Stages in the policy cycle at which well-being indicators and evidence can be used
One way to characterise the various opportunities for metrics to influence policy
decisions is to consider the different stages of the policy cycle (Figure 4.1). Building on
the various approaches described in the literature (e.g. Jann et al., 2006; Cairney, 2013), it
is possible to distinguish among the following stages:
1. Priority/Agenda setting. Based on a strategic analysis of the current situation,
including trends over time, and inequalities, a strategic review of policy goals
may lead to identifying areas which require government intervention, followed by
prioritisation and agenda setting. This stage typically involves national
governments, national planning agencies and/or parliaments, as well as citizens,
often acting through civil society, bringing to the attention of policy-makers
perceived deficiencies in outcomes and processes.
2. Policy formulation (ex ante). This stage includes the investigation of policy
options, the evaluation of their costs, benefits and feasibility, and finally the
selection of relevant policy instruments and levers. This stage usually involves the
national planning agency, government agencies responsible for designing and
delivering the policy interventions, allocation of financial resources among
government agencies, and government or parliament decisions on budgeting.
3. Implementation. This phase involves executing programmes and policy
interventions by the government agencies responsible for implementation, and
providing them with the necessary resources, in accordance with prioritisation and
policy formulation.
4. Monitoring. A prerequisite for evaluating policy impacts is that the policy
interventions are monitored, both during and after implementation. Monitoring
involves taking stock of the inputs used for the policy intervention, the outputs
generated and the outcomes observed; a comprehensive evaluation can also
benefit from monitoring the counterfactual of the policy intervention. At this
stage, both the national planning agency, the government agency implementing
the policy, as well as external stakeholders, may be involved to monitor the
impacts of policy interventions.
5. Evaluation (ex post). This stage requires assessing the results of the policy
intervention in view of their goals, and deciding on either termination or
continuation. This stage of policy-making can involve the national planning
agency, the various potential stakeholders as well as central auditors’ offices.
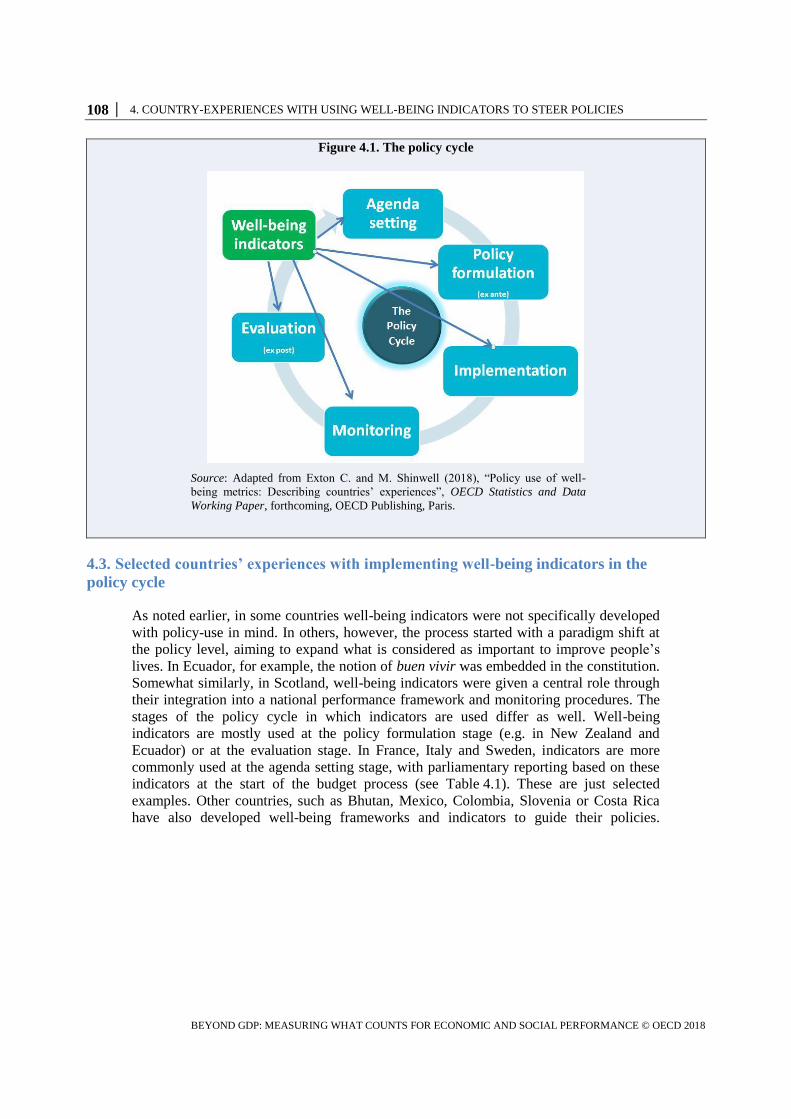
108 │ 4. COUNTRY-EXPERIENCES WITH USING WELL-BEING INDICATORS TO STEER POLICIES
BEYOND GDP: MEASURING WHAT COUNTS FOR ECONOMIC AND SOCIAL PERFORMANCE © OECD 2018
Figure 4.1. The policy cycle
Source: Adapted from Exton C. and M. Shinwell (2018), “Policy use of well-
being metrics: Describing countries’ experiences”, OECD Statistics and Data
Working Paper, forthcoming, OECD Publishing, Paris.
4.3. Selected countries’ experiences with implementing well-being indicators in the
policy cycle
As noted earlier, in some countries well-being indicators were not specifically developed
with policy-use in mind. In others, however, the process started with a paradigm shift at
the policy level, aiming to expand what is considered as important to improve people’s
lives. In Ecuador, for example, the notion of buen vivir was embedded in the constitution.
Somewhat similarly, in Scotland, well-being indicators were given a central role through
their integration into a national performance framework and monitoring procedures. The
stages of the policy cycle in which indicators are used differ as well. Well-being
indicators are mostly used at the policy formulation stage (e.g. in New Zealand and
Ecuador) or at the evaluation stage. In France, Italy and Sweden, indicators are more
commonly used at the agenda setting stage, with parliamentary reporting based on these
indicators at the start of the budget process (see Table 4.1). These are just selected
examples. Other countries, such as Bhutan, Mexico, Colombia, Slovenia or Costa Rica
have also developed well-being frameworks and indicators to guide their policies.
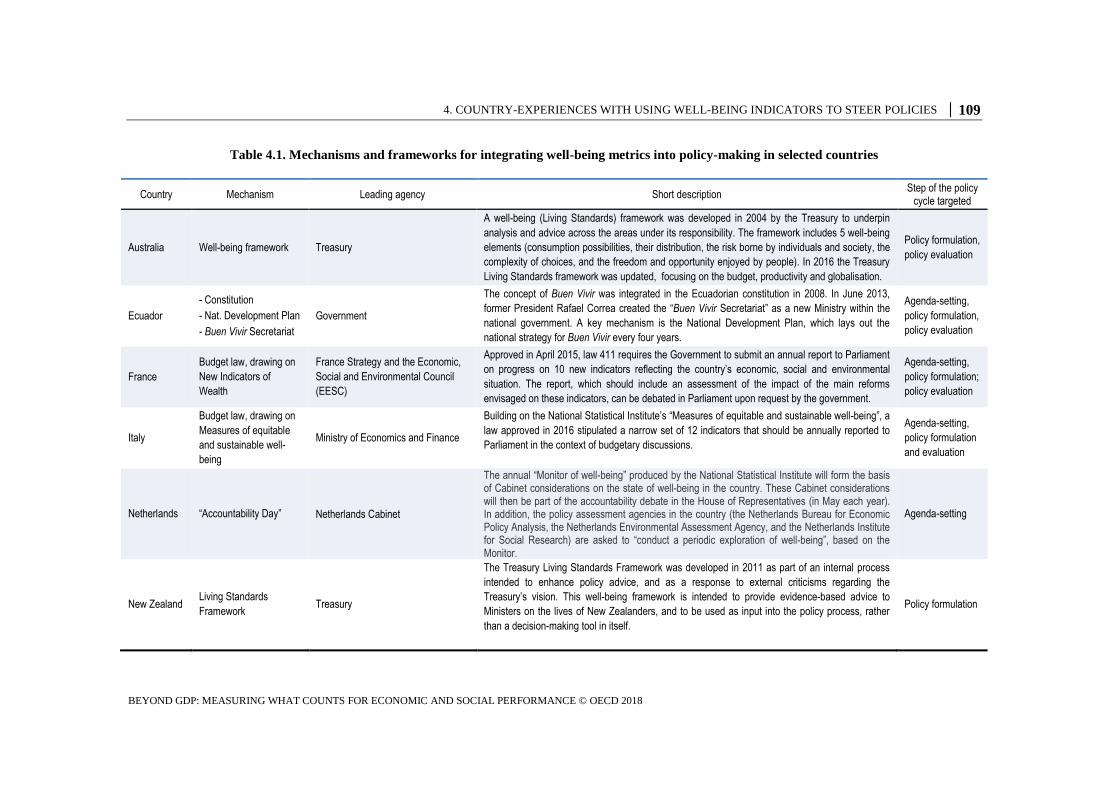
4. COUNTRY-EXPERIENCES WITH USING WELL-BEING INDICATORS TO STEER POLICIES │ 109
BEYOND GDP: MEASURING WHAT COUNTS FOR ECONOMIC AND SOCIAL PERFORMANCE © OECD 2018
Table 4.1. Mechanisms and frameworks for integrating well-being metrics into policy-making in selected countries
Country Mechanism Leading agency Short description Step of the policy
cycle targeted
Australia Well-being framework Treasury
A well-being (Living Standards) framework was developed in 2004 by the Treasury to underpin
analysis and advice across the areas under its responsibility. The framework includes 5 well-being
elements (consumption possibilities, their distribution, the risk borne by individuals and society, the
complexity of choices, and the freedom and opportunity enjoyed by people). In 2016 the Treasury
Living Standards framework was updated, focusing on the budget, productivity and globalisation.
Policy formulation,
policy evaluation
Ecuador
- Constitution
- Nat. Development Plan
- Buen Vivir Secretariat
Government
The concept of Buen Vivir was integrated in the Ecuadorian constitution in 2008. In June 2013,
former President Rafael Correa created the “Buen Vivir Secretariat” as a new Ministry within the
national government. A key mechanism is the National Development Plan, which lays out the
national strategy for Buen Vivir every four years.
Agenda-setting,
policy formulation,
policy evaluation
France
Budget law, drawing on
New Indicators of
Wealth
France Strategy and the Economic,
Social and Environmental Council
(EESC)
Approved in April 2015, law 411 requires the Government to submit an annual report to Parliament
on progress on 10 new indicators reflecting the country’s economic, social and environmental
situation. The report, which should include an assessment of the impact of the main reforms
envisaged on these indicators, can be debated in Parliament upon request by the government.
Agenda-setting,
policy formulation;
policy evaluation
Italy
Budget law, drawing on
Measures of equitable
and sustainable well-
being
Ministry of Economics and Finance
Building on the National Statistical Institute’s “Measures of equitable and sustainable well-being”, a
law approved in 2016 stipulated a narrow set of 12 indicators that should be annually reported to
Parliament in the context of budgetary discussions.
Agenda-setting,
policy formulation
and evaluation
Netherlands “Accountability Day” Netherlands Cabinet
The annual “Monitor of well-being” produced by the National Statistical Institute will form the basis of Cabinet considerations on the state of well-being in the country. These Cabinet considerations will then be part of the accountability debate in the House of Representatives (in May each year). In addition, the policy assessment agencies in the country (the Netherlands Bureau for Economic Policy Analysis, the Netherlands Environmental Assessment Agency, and the Netherlands Institute for Social Research) are asked to “conduct a periodic exploration of well-being”, based on the Monitor.
Agenda-setting
New Zealand Living Standards
Framework Treasury
The Treasury Living Standards Framework was developed in 2011 as part of an internal process
intended to enhance policy advice, and as a response to external criticisms regarding the
Treasury’s vision. This well-being framework is intended to provide evidence-based advice to
Ministers on the lives of New Zealanders, and to be used as input into the policy process, rather
than a decision-making tool in itself.
Policy formulation
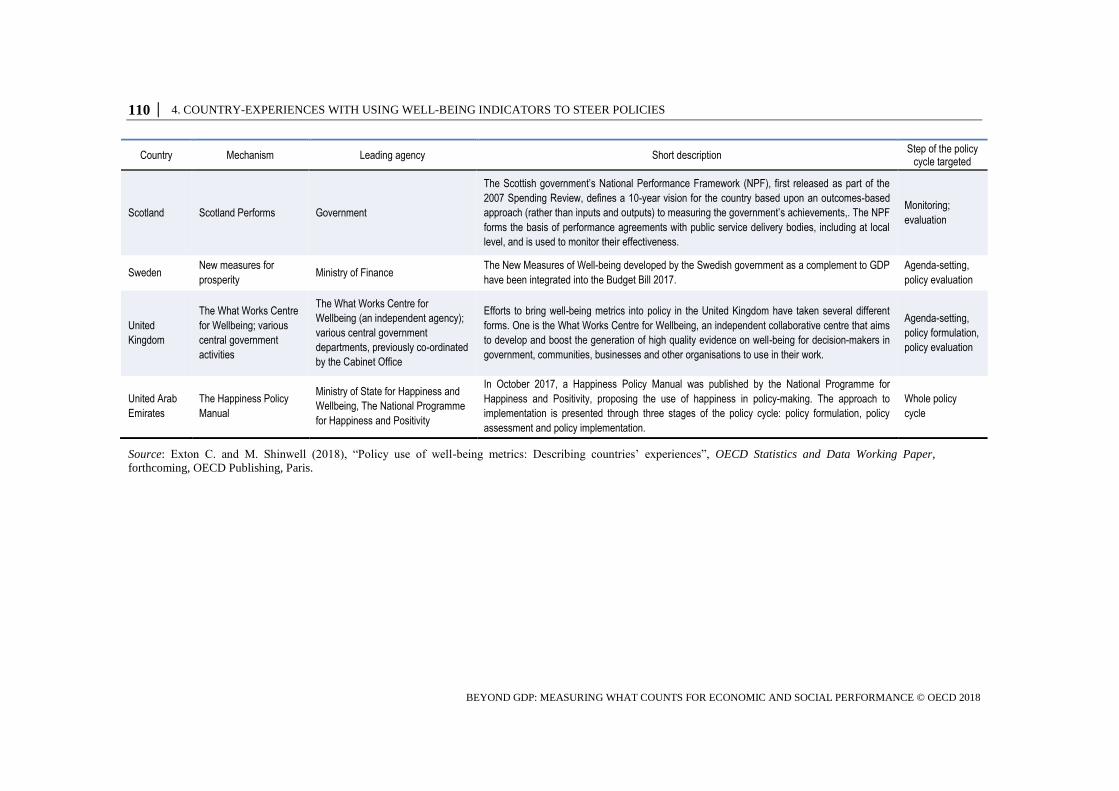
110 │ 4. COUNTRY-EXPERIENCES WITH USING WELL-BEING INDICATORS TO STEER POLICIES
BEYOND GDP: MEASURING WHAT COUNTS FOR ECONOMIC AND SOCIAL PERFORMANCE © OECD 2018
Country Mechanism Leading agency Short description Step of the policy
cycle targeted
Scotland Scotland Performs Government
The Scottish government’s National Performance Framework (NPF), first released as part of the
2007 Spending Review, defines a 10-year vision for the country based upon an outcomes-based
approach (rather than inputs and outputs) to measuring the government’s achievements,. The NPF
forms the basis of performance agreements with public service delivery bodies, including at local
level, and is used to monitor their effectiveness.
Monitoring;
evaluation
Sweden New measures for
prosperity Ministry of Finance
The New Measures of Well-being developed by the Swedish government as a complement to GDP
have been integrated into the Budget Bill 2017.
Agenda-setting,
policy evaluation
United
Kingdom
The What Works Centre
for Wellbeing; various
central government
activities
The What Works Centre for
Wellbeing (an independent agency);
various central government
departments, previously co-ordinated
by the Cabinet Office
Efforts to bring well-being metrics into policy in the United Kingdom have taken several different
forms. One is the What Works Centre for Wellbeing, an independent collaborative centre that aims
to develop and boost the generation of high quality evidence on well-being for decision-makers in
government, communities, businesses and other organisations to use in their work.
Agenda-setting,
policy formulation,
policy evaluation
United Arab
Emirates
The Happiness Policy
Manual
Ministry of State for Happiness and
Wellbeing, The National Programme
for Happiness and Positivity
In October 2017, a Happiness Policy Manual was published by the National Programme for
Happiness and Positivity, proposing the use of happiness in policy-making. The approach to
implementation is presented through three stages of the policy cycle: policy formulation, policy
assessment and policy implementation.
Whole policy
cycle
Source: Exton C. and M. Shinwell (2018), “Policy use of well-being metrics: Describing countries’ experiences”, OECD Statistics and Data Working Paper,
forthcoming, OECD Publishing, Paris.
4. COUNTRY-EXPERIENCES WITH USING WELL-BEING INDICATORS TO STEER POLICIES │ 111
BEYOND GDP: MEASURING WHAT COUNTS FOR ECONOMIC AND SOCIAL PERFORMANCE © OECD 2018
The number and type of indicators used in policy settings varies significantly across
countries. In Sweden, Italy and France, where policy use is mainly through reporting to
parliament, the number of indicators is very limited (from six/ten in France, to 12 in Italy
and 15 in Sweden) in order to facilitate parliamentary discussion. At the other extreme, in
New Zealand and the United Kingdom a very wide variety of indicators are provided by
the National Statistical Office and used for cost-benefit analysis or ex post evaluation of a
range of policy interventions (in the United Kingdom, through the What Works for Well-
being Centre)3 or for ex ante policy design (in New Zealand). Ecuador and Scotland lie
between these two extremes, with a defined number of indicators and well-defined
monitoring procedures (through the National Development Plan in Ecuador, and a
National Performance Framework in Scotland).
The type of high-level outcome indicators also varies across countries depending on their
specific use in the policy process. For example, in Italy one of the criteria for selecting
indicators for the budget law was the ability to forecast trends in these indicators in the
near future (the three years ahead). Because of this criterion, subjective well-being
indicators were excluded from the list on account of their limited data collection,
concerns about data quality, and limited evidence on how budgetary decisions could
impact on their evolution. By contrast, the What Works for Well-Being Centre in the
United Kingdom puts a strong emphasis on subjective well-being measures, and has
identified a number of policies that should be changed when such a framework (rather
than conventional cost benefit analysis) is used.
In some countries, well-being policy frameworks have engaged the Parliament, whether
or not they were first initiated by parliament or government. In France, Italy and the
Netherlands (as well as, to a lesser extent, in Sweden), the goal is that Parliament should
have the evidence base needed to hold government accountable for its decisions, through
annual reporting of the impacts of their policies on (selected) well-being indicators. In
other cases, a central government agency has taken the lead, as in New Zealand, where
the Treasury is in charge of the Living Standard Framework, and Ecuador, where the
Buen Vivir Secretariat and the Planning Ministry (SENPLADES) were in the lead.
More generally, some of the initiatives presented in Table 4.1 have benefited from strong
leadership, often involving a prominent political figure promoting the concept of well-
being. A notable example is Ecuador, where former president Rafael Correa initiated a
revision of the constitution to incorporate the concept of Buen Vivir. This was also the
case in France (with the introduction of a law by a member of the Senate, Eva Sas), in the
United Kingdom (with the launch of the Measuring National Well-Being Programme by
former Prime Minister David Cameron) and in Scotland (following the accession to
power of the Scottish National Party in 2007).
Most of these initiatives are quite recent, however, implying that adjustments and
modifications are to be expected, and that it is too early to draw lessons. A crucial
challenge is whether initiatives taken by one government can survive the election of the
next government, especially when the latter comes from a different party or coalition. For
this reason, ensuring continuity in political engagement with respect to well-being
concepts is essential. This in turn may require using extensive forms of public
consultations, so as to build a consensus and coalition in support of the framework that
could outlive the incumbent government, or embed the framework in a multi-year
development plan. Difficulties can also be compounded when the initiatives are strongly
associated with a political figure – i.e. can the actions to implement well-being
frameworks outlast their instigator? This most likely depends on whether a “Beyond
112 │ 4. COUNTRY-EXPERIENCES WITH USING WELL-BEING INDICATORS TO STEER POLICIES
BEYOND GDP: MEASURING WHAT COUNTS FOR ECONOMIC AND SOCIAL PERFORMANCE © OECD 2018
GDP” approach is strongly supported by the public and mainstreamed within the civil
service.
The development of well-being evidence-based policies will also require a continued
iterative progress in data collection, dissemination, analysis and policy experimentation.
Sustaining the use of “Beyond GDP” metrics over time is, therefore, a challenge. What
steps are necessary in order to mainstream the use of metrics in policy and assure their
longevity? What tools are most effective in widening the interest across stakeholders?
Here we highlight one challenge, that of attributing changes in one or more well-being
variables to a given set of policies.
Demonstrating causality in a public policy context is always difficult. Prime experimental
conditions for establishing cause and effect are extremely rare when trying to improve
people’s lives in a fair and balanced way through policy decisions. Collection of the right
kinds of data, at the right time, and use of the most appropriate models and tools can help
in building the necessary evidence base. Policies targeted at specific outcomes may
inadvertently affect several other outcomes, or generate unintended effects. In the case of
well-being metrics, additional challenges for policy are the multi-dimensional nature of
well-being and, as discussed in the previous chapter, the difficulty in identifying inter-
linkages between different well-being metrics. For many well-being indicators that have
only recently been introduced in large-scale and high-quality data collections in
countries’ national statistics, it will take time to build the time series needed to investigate
policy questions of interest, to enable analytical work and forecasting. Routine inclusion
of well-being metrics in studies to evaluate policy impacts is needed to build up the
evidence base required.
An additional challenge in the use of a broad well-being framework in developing
countries is the concern that this agenda may divert attention away from what is often
viewed as fundamental, namely economic growth. A government failing to produce
economic growth, an increase in GDP, may be tempted to defend its failure by arguing
that it was pursuing a broader agenda. This critique needs to be addressed head on. GDP
growth may be necessary to provide the resources needed for strengthening well-being,
but it is not sufficient; growth that does not benefit most of the population and that is not
sustainable, is not “good growth”, and it is only within our broader framework that one
can ascertain whether growth is, in fact, of the kind that is leading to enhanced societal
well-being. As we noted above, short-term growth that is achieved in ways which lead to
more inequality, greater environmental degradation and lower trust, is not sustainable.
4.4. Use of subjective well-being data in policy analysis
Most of the well-being frameworks described in Table 4.1 include measures of people’s
subjective well-being as one among other types of indicators covered. In other terms, how
people evaluate and experience their life is considered as an important element for
describing their own well-being, but not as the single variable encompassing the influence
of all others.
Subjective well-being, however, has features that lend it to specific use in policy analysis.
In particular, it has proved responsive to a wide range of objective circumstances, such as
income, health, social relations and political voice. Because of this feature, analysis of the
drivers of people’s subjective well-being (when based on large samples of respondents
and covering many aspects of people’s circumstances) can improve policy design and

4. COUNTRY-EXPERIENCES WITH USING WELL-BEING INDICATORS TO STEER POLICIES │ 113
BEYOND GDP: MEASURING WHAT COUNTS FOR ECONOMIC AND SOCIAL PERFORMANCE © OECD 2018
evaluation by highlighting those impacts that are not captured (or only partially so) by
standard income or other more objective measures.
Subjective well-being measures are also relevant to determine the non-monetary costs and
benefits of projects and policies, making subjective well-being an important part of the
design and evaluation of policy impacts.
Some public programmes have collected subjective well-being data among participants to
highlight the impact of the policy intervention on programme participants. Such
evaluations have often highlighted impacts that would have otherwise been missed
(Ludwig et al., 2013). Subjective well-being data are also being used in cost-benefit
analysis undertaken by public agencies to value non-monetary costs and benefits
(Fujiwara and Campbell, 2011). The approach of the UK Treasury provides an example.
Subjective well-being can also be relevant for policies directed at more-specific
outcomes, like health. In their Chapter in the accompanying volume, Krueger and Stone
provide evidence, for instance, that subjective well-being is an important “mediator” for
improving outcomes in other fields: it predicts people’s morbidity and mortality. Policies
that enhance people’s subjective well-being indirectly achieve a multiplicity of other
outcomes. It even affects childbearing and fertility decisions, and the self-esteem of
cancer patients. As knowledge on the determinants of subjective well-being progresses,
this research will provide policy-makers with additional tools for affecting both
subjective well-being and those outcomes that are mediated by it. Even without a full
understanding of the determinants of trust and of the multiple and complex relationships
that determine outcomes in our complex social/economic/environmental system, there are
things that can be done to enhance the likelihood of better societal outcomes.
4.5. Conclusions
From the very beginning in our research programme, we argued that better and different
data and information inevitably shape the political debate. The politics today is different
from what it was when we began our work more than a decade ago. It demands
information about aspects of our society that were at the time little studied and
understood. Our statistical systems need to reflect the concerns of our society – and to the
extent possible anticipate future concerns. At the time we began our work, there was too
little focus either on sustainability or on inequality. Some politicians may have hoped that
if we just didn’t measure inequality, no one would know the extent to which it was
growing. That was naïve and foolish. But now that we know that so little of the fruits of
growth over the past decades have gone to the bottom 90%, we can’t ignore it. It is part of
the political reality that has to be dealt with.
The very progress that has been achieved on measuring well-being following the release
in 2009 of the Commission report has contributed to a change in the question that we
face, from “how to develop credible metrics of people’s lives?” to “how to use these
metrics in the policy process once you have developed them?”. This is a new and more
difficult question, but also one that many governments are starting to confront in their
day-to-day operations. It is our hope that these applications be pursued and extended to
other countries in the future, to allow us to identify best practices of what works best in
this field.
114 │ 4. COUNTRY-EXPERIENCES WITH USING WELL-BEING INDICATORS TO STEER POLICIES
BEYOND GDP: MEASURING WHAT COUNTS FOR ECONOMIC AND SOCIAL PERFORMANCE © OECD 2018
Notes
1. As we complete this report, the discussion in several countries on “fake news” presents a
challenge to the concept of evidence-based research. Years of statistical research (both
methodological and applied) have provided a sound foundation for judging the quality of empirical
research, including ascertaining the extent to which something more than correlation has been
established. All research, particularly in social sciences, is tentative and potentially refutable by
subsequent studies, and good science provides indicators of the confidence by which a given result
is held. Thus, we know few things with absolute certainty, while we know some things with a high
degree of confidence. One of the contributors to the current lack of trust in the elite is that many
made policy pronouncements that were well beyond those that could be made with a reasonable
degree of confidence, e.g. that globalization would lead most, if not all, citizens to be better off in
a relatively short period of time. This is a case where economic theory had provided a strong
argument to the contrary, and where insufficient efforts were made to reconcile empirical studies
based on limited data with these broader theoretical perspectives.
2. “Here and now” (current well-being), “later” (capital) and “elsewhere” (transboundary impacts)
are the three dimensions drawn from the seminal Brundtland report (United Nations, 1987)
underpinning the conceptual categorisation of sustainable development indicators put forward by
the Conference of European Statisticians (UNECE, 2014).
3. https://whatworkswellbeing.org/.
5. TWELVE RECOMMENDATIONS ON THE WAY AHEAD IN MEASURING WELL-BEING │ 115
BEYOND GDP: MEASURING WHAT COUNTS FOR ECONOMIC AND SOCIAL PERFORMANCE © OECD 2018
Chapter 5. Twelve recommendations on the way ahead in measuring well-
being
This chapter argues that the success of the 2009 Stiglitz-Sen-Fitoussi Commission report
reflected its capacity to give expression to concerns that were widely shared on the
inadequacies of the metrics that are currently used to guide policies, and to provide a
vocabulary for linking streams of research that had, until then, been perceived as
disconnected. While much remains to be done to translate the recommendations made by
the Stiglitz-Sen-Fitoussi report in statistical practice, this short chapter provides a set of
12 new recommendations building on the work done by the HLEG over the past 5 years.
116 │ 5. TWELVE RECOMMENDATIONS ON THE WAY AHEAD IN MEASURING WELL-BEING
BEYOND GDP: MEASURING WHAT COUNTS FOR ECONOMIC AND SOCIAL PERFORMANCE © OECD 2018
We want to conclude this short book with three general considerations.
First, as we noted already, the range of initiatives that have been put in place since the
release of the Commission report in 2009 has gone far beyond the expectations of all of
us. We have moved from a “niche”, where the assumptions and value judgements hidden
in our measurement system were noted in footnotes and quickly forgotten, to a
“movement” that is today engaging researchers, policy analysts, Statistical Offices,
international organisations and Treasuries (the traditional gatekeeper of financial
orthodoxy). We believe that, beyond any specific argument or recommendation that was
included in the Commission’s report, this success reflected the capacity of our report to
“catch a mood” that was latent in society, giving expression to concerns that were widely
shared. The 2009 Commission report also provided a vocabulary through which various
people could approach this agenda, connecting streams of research that had up to then
been perceived as disconnected and sometimes in conflict with each other. It also
reconnected academic research and statistical practice, a relation that needs to be
maintained in the future.
Second, while the “Beyond GDP” agenda is sometimes characterised as “anti-growth”,
this is not the philosophy underlying this book. As argued above, the use of a more
comprehensive but parsimonious dashboard of indicators reflecting what we value as a
society, would have led, most likely, to stronger GDP growth than that actually achieved
by most countries in the aftermath of the crisis. What we are arguing is that growth that
increases a GDP number but does not reflect an increase in the well-being of most
citizens does not reflect the degradation of the environment and the depletion of natural
resources, makes the economy and its citizens more insecure, erodes trust in our
institutions and society, opens up conflicts because of disparate treatment of those of
different ethnic or racial groups, is not “real” growth. We should not be mesmerized by a
number that cannot reflect all of these dimensions. The real growth that should be our
focus is growth that is equitable and sustainable.
This means too that we are arguing against the narrow view of the economic system as
separate from the social and natural environment where it operates, a system where
factors of production are always fully used, and where the only policy concern is that of
maximising economic efficiency, i.e. “doing more with less”. Standard economic theory
almost took it as an axiom that we should be maximising GDP, conflating that number
with societal well-being, ignoring the massive market failures that advances in economic
theory over the past century have taught us about. It ignored our planetary boundaries,
and the many dimensions of well-being that are not well captured by GDP, that might
actually go down as GDP goes up. The “Beyond GDP” agenda has had such global
resonance because citizens, and now, at last, economists, have widely understood that
GDP in itself is not a good measure of well-being, and that our economy is a means to an
end, an end of enhancing well-being for all of our citizens today and tomorrow. Perhaps
the 2008 financial crisis and the 2016 political crisis have taught a lesson about what
happens with too narrow a vision: even GDP may be harmed, but without question, so too
will economic performance and social progress rightly understood. Our statistical
indicators – the dashboard that we have advocated, based on a national dialogue
reflecting the values and circumstances of the country – can play an important role in
helping ensure a broader vision. Table A.2 in the Annex provides an example of the type
of indicators that could be included in this dashboard, based on the OECD’s How’s Life?
report (OECD, 2017a).
5. TWELVE RECOMMENDATIONS ON THE WAY AHEAD IN MEASURING WELL-BEING │ 117
BEYOND GDP: MEASURING WHAT COUNTS FOR ECONOMIC AND SOCIAL PERFORMANCE © OECD 2018
Third, despite the progress achieved, we are still far from being able to conclude with a
“mission accomplished”. Researchers, practitioners, statisticians, opinion shapers and
policy-makers will have to keep up the argument and advance this agenda in concrete and
practical ways. Despite progress, most of the recommendations included in the 2009
report of the Stiglitz-Sen-Fitoussi Commission remain relevant today, and we hope that
further progress in their implementation could be achieved in the future. In the light of the
work pursued by the HLEG, we present in Box 5.1 a set of 12 recommendations that, we
believe, could provide additional directions for future work.
Box 5.1. Recommendations by the Chairs of the HLEG
1. No single metric will ever provide a good measure of the health of a country, even
when the focus is limited to the functioning of the economic system. Policies need
to be guided by a dashboard of indicators informing about people’s material
conditions and the quality of their lives, inequalities thereof, and sustainability.
This dashboard should include indicators that allow us to assess people’s
conditions over the economic cycle. Arguably, policy responses to the Great
Recession might have been different had such a dashboard been used.
2. Developing better metrics of people’s well-being is important for all countries,
whatever their level of development. National Statistical Offices should be given
the resources and independence needed to pursue this task in effective ways,
including through harnessing the potential of big data. The international
community should invest more in upgrading the statistical capacities of poorer
countries.
3. The quality and comparability of existing metrics of economic inequality related
to income and, particularly, wealth should be further improved, including by
allowing Statistical Offices to use tax records to capture developments at the top
end of the distribution, and by developing measures of the joint distribution of
household income, consumption and wealth.
4. Data should be disaggregated by age, gender, disability status, sexual orientation,
education and other markers of social status in order to describe group differences
in well-being outcomes; and metrics to describe within-household inequalities,
such as those related to asset ownership and the sharing of resources and financial
decisions within the household, should be developed.
5. Efforts to integrate information on economic inequalities within the System of
National Accounts should be pursued, in the perspective of achieving
convergence between micro- and macro-approaches, and of understanding how
the benefits of GDP growth are shared in society.
6. Assessing equality of opportunity is important. Measures of a broad range of
people’s circumstances should be developed, including by linking administrative
records across generations and by including retrospective questions on parental
conditions in household surveys, so as to allow comparison of measures of
inequality of opportunity across countries and over time.
7. Regular, frequent and standardised collection of both evaluative and experiential
measures of subjective well-being should be pursued, based on large
representative samples with a view to shedding light on their drivers and on the
118 │ 5. TWELVE RECOMMENDATIONS ON THE WAY AHEAD IN MEASURING WELL-BEING
BEYOND GDP: MEASURING WHAT COUNTS FOR ECONOMIC AND SOCIAL PERFORMANCE © OECD 2018
directions of causality.
8. Policies should be routinely assessed for their effects on people’s economic
insecurity, measured through a dashboard of indicators that inform about people’s
experiences in the face of economic shocks, the buffers that are available to them,
the adequacy of social insurance against key risks, and subjective evaluations of
insecurity.
9. Better measures of sustainability are needed. This requires developing full
balance sheets for various institutional sectors, covering all their assets and
liabilities, measuring the rents implicit in asset valuations, as well as improved
metrics of human and environmental capital and of the vulnerability and
resilience of systems.
10. The measurement of trust and other social norms should be improved, through
both general and specialised household surveys as well as more experimental
tools administered to representative samples of respondents that rely on insights
from psychology and behavioural economics.
11. Access to statistical data and administrative records by academics and policy
analysists should be facilitated, in ways that preserve the confidentiality of the
information disseminated and that ensure a level playing field across different
research teams and theoretical perspectives.
12. To deliver “better policies for better lives”, well-being metrics should be used to
inform decisions at all stages of the policy process, from identifying priorities for
action and aligning programme objectives to investigating the benefits and costs
of different policy options; from making budgeting and financing decisions to
monitoring policies, programme implementation and evaluation.
BIBLIOGRAPHY │ 119
BEYOND GDP: MEASURING WHAT COUNTS FOR ECONOMIC AND SOCIAL PERFORMANCE © OECD 2018
Bibliography
Abramovitz, M. (1959), “The Welfare interpretation of secular trends in national income and product”, in
Abramovitz, M. (ed.), The Allocation of Economic Resources – Essays in Honor of Bernard Francis
Haley, Stanford University Press, Stanford, CA.
Adermon, A., M. Lindhal and M. Palme (2016), “Dynastic human capital, inequality and
intergenerational mobility”, IFAU Working Paper, No. 2016/19, Institute for Evaluation of Labour
Market and Education Policy, Uppsala, Sweden, www.ifau.se/en/Press/Abstracts/dynastic-human-
capital-inequality-and-intergenerational-mobility/.
Ahmad, N., J. Ribarsky and M. Reinsdorf (2017), “Can potential mismeasurement of the digital economy
explain the post-crisis slowdown in GDP and productivity growth?”, OECD Statistics Working
Papers, No. 2017/09, OECD Publishing, Paris, http://dx.doi.org/10.1787/a8e751b7-en.
Ahmad, N. and P. Schreyer (2016), “Measuring GDP in a digitalised economy”, OECD Statistics
Working Papers, No. 2016/07, OECD Publishing, Paris, https://doi.org/10.1787/5jlwqd81d09r-en.
Algan, Y. and P. Cahuc (2014), “Trust, growth and well-being: New evidence and policy implications”,
in Aghion, P. and S. Durlauf (eds.), Handbook of Economic Growth, Vol. 2, Elsevier, North Holland,
Amsterdam, pp. 49-120.
Allen, F. and D. Gale (2000), Comparing Financial Systems, MIT Press, Boston.
Altimir, O. (1987), “Income distribution statistics in Latin America and their reliability”, The Review of
Income and Wealth, Vol. 33(2), pp. 111-155.
Anand, S., P. Segal and J.E. Stiglitz (eds.) (2010), Debates on the Measurement of Global Poverty,
Oxford University Press, Oxford.
Antolin-Diaz, J., T. Drechsel and I. Petrella (2017), The Review of Economics and Statistics, Vol. 99(2),
pp. 343-356, www.mitpressjournals.org/doi/pdf/10.1162/REST_a_00646.
Arrow, K.J. (1972), “Gifts and exchanges”, Philosophy & Public Affairs, Vol. 1(4), pp. 343-362.
Arrow, K.J. and G. Debreu (1954), “Existence of an equilibrium for a competitive economy”,
Econometrica, Vol. 22(3), pp. 265-290, www.jstor.org/stable/1907353.
Atkinson, A.B. (2016), Monitoring Global Poverty: Report of the Commission on Global Poverty, The
World Bank, Washington, D.C.
Atkinson, A.B. (2015), Inequality – What can be Done?, Harvard University Press, Boston.
Atkinson, A.B. (1970), “On the measurement of inequality”, The Journal of Economic Theory, Vol. 2(3),
pp. 244-263.
Atkinson, A.B. and T. Piketty (eds.) (2007), Top Incomes over the Twentieth Century – A Contrast
Between Continental European and English-Speaking Countries, Oxford University Press, Oxford
and New York.
Baily, M.N., J. Manyika and S. Gupta (2013), “U.S. productivity growth: An optimistic perspective”,
International Productivity Monitor, No. 25.
120 │ BIBLIOGRAPHY
BEYOND GDP: MEASURING WHAT COUNTS FOR ECONOMIC AND SOCIAL PERFORMANCE © OECD 2018
Balestra, C. and R. Tonkin (2018), “Inequalities in household wealth across OECD countries: Evidence
from the OECD Wealth Distribution Database”, OECD Statistics Working Papers, No. 2018/01,
OECD Publishing, Paris, https://doi.org/10.1787/7e1bf673-en.
Barnes, S. and D. Smyth (2013), “The Government’s balance sheets after the crisis: A comprehensive
perspective”, Irish Fiscal Advisory Council, Dublin.
Bartik, T.J. and B. Hershbein (2018), “Degrees of poverty: The relationship between family income
background and the returns to education”, Upjohn Institute Working Paper, No. 18/284, W.E. Upjohn
Institute for Employment Research, Kalamazoo, MI, https://doi.org/10.17848/wp18-284.
Battiston, S. et al. (2013), “Complex derivatives”, Nature Physics, Vol. 9, pp. 123-125.
Battiston, S. et al. (2012), “Liaisons dangereuses: Increasing connectivity, risk sharing, and systemic
risk”, The Journal of Economic Dynamics and Control, Vol. 36(8), pp. 1121-1141.
Beegle, K. et al. (2012), “Methods of household consumption measurement through surveys:
Experimental results from Tanzania”, The Journal of Development Economics, Vol. 98 (1), pp. 3-18.
Bernake, B.S. (2014), The Federal Reserve and the Financial Crisis, Princeton University Press,
Princeton.
Blanchard, O.J. (2009), “The state of macro”, The Annual Review of Economics, Annual Reviews,
Vol. 1(1), pp. 209-228.
Blanchard, O.J. and D. Leigh (2013), “Growth forecast errors and fiscal multipliers”, The American
Economic Review, Vol. 103(3), Papers And Proceedings of the One Hundred Twenty-Fifth Annual
Meeting of the American Economic Association, pp. 117-120.
Bourdieu, P. and J.C. Passeron (1990), Reproduction in Education, Society and Culture, 2nd edition,
Sage Publications, Thousand Oaks, CA.
Bourguignon, F. (2012a), La mondialisation des inégalités, Seuil, Paris.
Bourguignon, F. (2012b), “Inequality, globalization, and technical change in advanced countries: A brief
synopsis”, in Catao, L. and M. Obstfeld (eds.), Globalization’s Challenges, Princeton University
Press, Princeton.
Bourguignon, F. and C. Morrisson (2002), “Inequality among world citizens: 1820-1992”, The American
Economic Review, Vol. 92(4), pp. 727-744.
Browning, M., P.-A. Chiappori and Y. Weiss (2014), Economics of the Family, Cambridge Surveys of
Economic Literature, Cambridge University Press, Cambridge,
https://doi.org/10.1017/CBO9781139015882.
Brynjolfsson, E. and A. Mac Afee (2011), Race against the Machine: How the Digital Revolution is
Accelerating Innovation, Driving Productivity, and Irreversibly Transforming Employment and the
Economy, Digital Frontier Press, Lexington, MA.
Buono, D. et al. (2017), “Big data types for macroeconomic nowcasting”, Eurona – Eurostat Review of
National Accounts and Macroeconomic Indicators, pp. 94-144,
https://ec.europa.eu/eurostat/cros/system/files/euronaissue1-2017-art4.pdf.
Burkhauser, R.V., J. Larrimore and K.I. Simon (2012), “A ‘second opinion’ on the economic health of
the American middle class”, The National Tax Journal, Vol. 65(1), pp. 7-32.
Caggiano, G. et al. (2015), “Estimating fiscal multipliers: News from a nonlinear world”, The Economic
Journal, Vol. 125(584), pp. 746-776.
BIBLIOGRAPHY │ 121
BEYOND GDP: MEASURING WHAT COUNTS FOR ECONOMIC AND SOCIAL PERFORMANCE © OECD 2018
Case, A. and A. Deaton (2015), “Rising morbidity and mortality in midlife among white non-Hispanic
Americans in the 21st century”, PNAS (Proceedings of the National Academy of Sciences of the
United States of America), Vol. 112(49), pp. 15078-83, https://doi.org/10.1073/pnas.1518393112.
CEA (2016), “The long-term decline in prime-age male labor force participation”, The Council of
Economic Advisers, Washington D.C.
Cerra, V. and S.C. Saxena (2008), “Growth dynamics: The myth of economic recovery”, The American
Economic Review, Vol. 98(1), pp. 439-57, www.aeaweb.org/articles?id=10.1257/aer.98.1.439.
Chetty, R. et al. (2018), “Race and economic opportunity in the United States: An intergenerational
perspective”, NBER Working Paper, No. 24441, www.nber.org/papers/w24441.
Cingano, F. (2014), “Trends in income inequality and its impact on economic growth”, OECD Social,
Employment and Migration Working Papers, No. 163, OECD Publishing, Paris,
https://doi.org/10.1787/5jxrjncwxv6j-en.
Corak, M. (2013), “Income inequality, equality of opportunity, and intergenerational mobility”, The
Journal of Economic Perspectives, Vol. 27(3), pp. 79-102.
Coyle, D. (2013), “The cost of mistrust”, in OECD Yearbook 2013, OECD Publishing, Paris,
https://doi.org/10.1787/observer-v2012-5-en.
CPLC (2017), Report of the High-Level Commission in Carbon Prices, Carbon Pricing Leadership
Coalition, The World Bank, Washington D.C.
Currie, J. (2009), “Healthy, wealthy, and wise: Socioeconomic status, poor health in childhood, and
human capital development”, The Journal of the Economic Literature, Vol. 47(1), pp. 87-122.
Dasgupta, P. and I. Serageldin (eds.) (2000), Social Capital: A Multifaceted Perspective, World Bank,
Washington D.C.
Deaton, A. (2018), “The U.S. can no longer hide from its deep poverty problem”, The New York Times,
www.nytimes.com/2018/01/24/opinion/poverty-united-states.html (accessed on 18 September 2018).
Deaton, A. (2013), The Great Escape: Health, Wealth and the Origins of Inequality, Princeton
University Press, Princeton.
Deaton, A. (2005), “Measuring poverty in a growing world (or Measuring growth in a poor world)”, The
Review of Economics and Statistics, Vol. 87(1), pp. 1-19.
Deaton, A. (1997), The Analysis of Household Surveys: A Microeconometric Approach to Development
Policy, The World Bank, Washington D.C.
Deepa, N. et al. (2000), Voices of the Poor: Can Anyone Hear us?, Oxford University Press, New York,
http://documents.worldbank.org/curated/en/131441468779067441/Voices-of-the-poor-can-anyone-
hear-us.
de Neve, J.-E. (2018), “Work and well-being: A global perspective”, in Global Happiness Policy Report,
Global Happiness Council, UAE, https://s3.amazonaws.com/ghc-2018/UAE/GHPR_Ch5.pdf.
Doyle, M. and J.E. Stiglitz (2014), “Eliminating extreme inequality: A sustainable development goal,
2015-2030”, Ethics and International Affairs, Vol. 28(1),
www.ethicsandinternationalaffairs.org/2014/eliminating-extreme-inequality-a-sustainable-
development-goal-2015-2030/.
Easterlin, R.A. (1974), “Does economic growth improve the human lot? Some empirical evidence”, in
David, P.A. and M.W. Reder (eds.), Nations and Households in Economic Growth: Essays in Honor
of Moses Abramovitz, Academic Press, New York.

122 │ BIBLIOGRAPHY
BEYOND GDP: MEASURING WHAT COUNTS FOR ECONOMIC AND SOCIAL PERFORMANCE © OECD 2018
Edin, K.J. and H.L. Shaefer (2016), $2.00 a Day: Living on Almost Nothing in America, Houghton
Mifflin Harcourt, New York.
European Commission (2018), Pension Adequacy Report 2018 – Volume 1: Current and Future Income
Adequacy in Old Age in the EU, European Commission, Brussels,
http://ec.europa.eu/social/main.jsp?catId=738&langId=en&pubId=8084&furtherPubs=yes.
EuroMOMO (2018), “European mortality bulletin week 22, 2018”, European Monitoring of Excess
Mortality for Public Health Action, Copenhagen.
Eurostat (2017), Final report of the expert group on quality of life indicators,
https://publications.europa.eu/en/publication-detail/-/publication/1c2fee3e-15d5-11e7-808e-
01aa75ed71a1/language-en.
Eurostat (2016), Handbook on prices and volume measures in national accounts – 2016 edition,
Publication Office of the European Union, Luxembourg
http://ec.europa.eu/eurostat/documents/3859598/7152852/KS-GQ-14-005-EN-N.pdf.
Exton C. and M. Shinwell (2018), “Policy use of well-being metrics: Describing countries’ experiences”,
OECD Statistics and Data Working Paper, forthcoming, OECD Publishing, Paris.
Exton, C., C. Smith and D. Vandendriessche (2015), “Comparing happiness across the world: Does
culture matter?”, OECD Statistics Working Papers, No. 2015/04, OECD Publishing, Paris,
http://dx.doi.org/10.1787/5jrqppzd9bs2-en.
Fernald, J.G. et al. (2017), “The disappointing recovery of output after 2009”, NBER Working Paper,
No. 23543, National Bureau of Economic Research, www.nber.org/papers/w23543.
Fisher, J. et al. (2016), “Inequality in 3D: Income, consumption and wealth”, Working Paper Series,
No. 2016-09, Washington Center for Equitable Growth, Washington, DC,
http://cdn.equitablegrowth.org/wp-content/uploads/2017/12/21123945/122117-WP-Inequality-in-
3D.pdf.
Fitoussi, J.-P and P. Rosanvallon, (1996), Le nouvel âge des inégalités, Seuil, Paris.
Fitoussi, J.-P. and F. Saraceno (2014), “Drivers of inequality: Past and present challenges for Europe”,
Sciences Po publications,
http://spire.sciencespo.fr/hdl:/2441/2q6hk56t1k8o6qje4l40fj5s9t/resources/2014-fitoussi-saraceno-
drivers-of-inequality.pdf.
Fitoussi, J.-P. and J.E. Stiglitz (2013), “On the measurement of social progress and wellbeing: Some
further thoughts”, Global Policy, Vol. 4(3), pp. 290-293.
Fitoussi, J.-P. and X. Timbeau (2011), “Financial sustainability of an economy: exploratory remarks”,
OFCE Working Paper, No. 2011-14, Centre de recherche en économie de Sciences Po,
http://spire.sciencespo.fr/hdl:/2441/5l6uh8ogmqildh09h561k0hj4/resources/wp2011-14.pdf.
Frank, R.H. (2016), Success and Luck: Good Fortune and the Myth of Meritocracy, Princeton University
Press, Princeton.
Frank, R.H. (2011), “Supplementing per-capita GDP as measure of well-being”, paper presented at the
American Economic Association meeting in Denver, CO.
Fujiwara, D. and R. Campbell (2011), “Valuation techniques for social cost-benefit analysis: Stated
preference, revealed preference and subjective well-being approaches”, Department for Work and
Pensions, HM Treasury, London.
Garrouste, C. and M. Godard (2016), “The lasting health impact of leaving school in a bad economy:
Britons in the 1970s recession”, Health Economics, Vol. 25(2), pp. 70-92.
BIBLIOGRAPHY │ 123
BEYOND GDP: MEASURING WHAT COUNTS FOR ECONOMIC AND SOCIAL PERFORMANCE © OECD 2018
Gordon, R. (2016), The Rise and Fall of American Growth – The U.S. Standard of Living since the Civil
War, Princeton University Press, Princeton.
Greif, A. (1994), “Cultural beliefs and the organization of society: A historical and theoretical reflection
on collectivist and individualist societies”, The Journal of Political Economy, Vol. 102, pp. 912-950.
Greif, A. (1993), “Contract enforceability and economic institutions in early trade: The maghribi
traders’s coalition”, The American Economic Review, Vol. 83(3), pp. 525-548.
Hacker, J. (2018), “Economic security”, in Stiglitz, J.E., J.-P. Fitoussi and M. Durand (eds.) (2018), For
Good Measure: Advancing Research on Well-being Metrics Beyond GDP, OECD Publishing, Paris.
Haldar, A. and J.E. Stiglitz (2016), “Group lending, joint liability, and social capital: Insights from the
Indian microfinance crisis”, Columbia Business School Research Paper, No. 17-19,
https://ssrn.com/abstract=2905302.
Heckman, J. and D.V. Masterov (2004), “The productivity argument for investing in young children”,
Working Paper, No. 5, Committee for Economic Development, Washington D.C.
Helliwell, J.F., R. Layard and J.D. Sachs (eds.) (2018), World Happiness Report 2018, Sustainable
Development Solutions Network, New York, http://worldhappiness.report/ed/2018/.
HM Treasury (2018), The Green Book: Appraisal and Evaluation in Central Government,
www.gov.uk/government/publications/the-green-book-appraisal-and-evaluation-in-central-governent.
ILO (2013), Resolution concerning statistics of work, employment and labour underutilization, adopted
by the Nineteenth International Conference of Labour Statisticians, October 2013,
www.ilo.org/global/statistics-and-databases/standards-and-guidelines/resolutions-adopted-by-
international-conferences-of-labour-statisticians/WCMS_230304/lang--en/index.htm.
IMF (2017), Fiscal Monitor – Tacking Inequality, International Monetary Fund, Washington D.C.
IMF (2013), “Ex post evaluation of exceptional access under the 2010 Stand-By Arrangement”, IMF
Country Report, No. 13/156, Washington D.C.
Inchauste, G. and N. Lustig (eds.) (2017), The Distributional Impact of Taxes and Transfers. Evidence
from Eight Low- and Middle-Income Countries, World Bank, Washington, D.C.
Inglehart, R.F. and P. Norris (2016), “Trump, Brexit, and the rise of populism: Economic have-nots and
cultural backlash”, HKS Faculty Research Working Paper, No. 16-026, Harvard Kennedy School,
Cambridge, MA.
Kahn, L.B. (2010), “The long-term labor market consequences of graduating from college in a bad
economy”, Labour Economics, Vol. 17, pp. 303-316.
Kahneman, D. and A. Deaton (2010), “High income improves evaluation of life but not emotional well-
being”, Proceedings of the National Academy of Sciences, Vol. 107(38), pp. 16489-16493.
Kahneman, D. and A. Tversky (1984), “Choice, values, and frames”, American Psychologist, Vol. 39(4),
pp. 341-350, http://dx.doi.org/10.1037/0003-066X.39.4.341.
Kentikelenis, A. et al. (2014), “Greece’s health crisis: From austerity to denialism”, The Lancet,
Vol. 383(9918), pp. 748-753.
Kharas, H. and B. Seidel (2018), “What’s happening to the world income distribution? The Elephant
chart revisited”, Global Economy and Development Working Paper, No. 114, Brookings, Washington
D.C.
Kopczuk, W. and E. Saez (2004), “Top wealth shares in the United States, 1916-2000: Evidence from
estate tax returns”, National Bureau of Economic Research Working Paper, No. 10399.
124 │ BIBLIOGRAPHY
BEYOND GDP: MEASURING WHAT COUNTS FOR ECONOMIC AND SOCIAL PERFORMANCE © OECD 2018
Krueger, A.B. (2017), “Where have all the workers gone? An inquiry into the decline of the U.S. labor
force participation rate”, Brookings Paper Economic Activity Conference Draft, Washington D.C.
Kuznets, S. (1962), “How to judge quality”, The New Republic, Vol. 147. pp. 29-32.
Layard, R. et al. (2014), “What predicts a successful life? A life‐course model of well‐being”, The
Economic Journal, Vol. 124(580), pp. F720-F738.
Lequiller, F. and D. Blades (2014), Understanding National Accounts: Second Edition, OECD
Publishing, Paris, https://doi.org/10.1787/9789264214637-en.
López-Calva, L.F. and N. Lustig (eds.) (2010), Declining Inequality in Latin America: A Decade of
Progress?, Brookings Institution Press and UNDP, Washington, D.C.
Lucas, R. (2004), “The industrial revolution – Past and future, 2003 annual report essay”, Federal
Reserve Bank of Minneapolis, May Issue, pp. 5-20.
Ludwig, J. et al. (2013), “Long-term neighbourhood effects on low-income families: Evidence from
moving to opportunity”, The American Economic Review, Vol. 103(3), pp. 226-31.
Lustig, N. (2018), “The sustainable development goals, domestic resource mobilization, and the poor”, in
Ocampo, J.A. and J.E. Stiglitz (eds.), The Welfare State Revisited, Columbia University Press, New
York.
Meadows, D.H et al. (1972), The Limits to Growth – A Report for the Club of Rome’s Project on the
Predicament of Mankind, Universe Books, New York.
Milanovic, B. (2016), Global Inequality: A New Approach for the Age of Globalization, Harvard
University Press, Cambridge, MA.
Moatsos, M. et al. (2014), “Income inequality since 1820”, in van Zanden, J. et al. (eds.), How Was
Life?: Global Well-being since 1820, OECD Publishing, Paris,
https://doi.org/10.1787/9789264214262-15-en.
Murtin, F. et al. (2018), “Trust and its determinants: Evidence from the Trustlab experiment”, OECD
Statistics Working Papers, No. 2018/02, OECD Publishing, Paris, https://doi.org/10.1787/869ef2ec-
en.
Narayan, D. et al. (2000), Can Anyone Hear Us?, The World Bank, Washington D.C.
OECD (2018a), OECD Economic Outlook, Volume 2018, Issue 1, OECD Publishing, Paris,
https://doi.org/10.1787/eco_outlook-v2018-1-en.
OECD (2018b), The Role and Design of Net Wealth Taxes in the OECD, OECD Tax Policy Studies,
No. 26, OECD Publishing, Paris, https://doi.org/10.1787/9789264290303-en.
OECD (2018c), A Broken Social Elevator? How to Promote Social Mobility, OECD Publishing, Paris,
https://doi.org/10.1787/9789264301085-en.
OECD (2018d), OECD Labour Force Statistics 2017, OECD Publishing, Paris,
https://doi.org/10.1787/oecd_lfs-2017-en.
OECD (2018e), OECD Compendium of Productivity Indicators 2018, OECD Publishing, Paris,
https://doi.org/10.1787/pdtvy-2018-en.
OECD (2018f), OECD Productivity Statistics (database), http://dx.doi.org/10.1787/pdtvy-data-en.
OECD (2017a), How’s Life? 2017: Measuring Well-being, OECD Publishing, Paris,
https://doi.org/10.1787/how_life-2017-en.
BIBLIOGRAPHY │ 125
BEYOND GDP: MEASURING WHAT COUNTS FOR ECONOMIC AND SOCIAL PERFORMANCE © OECD 2018
OECD (2017b), OECD Guidelines on Measuring Trust, OECD Publishing, Paris,
http://dx.doi.org/10.1787/9789264278219-en.
OECD (2017c), “Education database: Educational expenditure by source and destination”, OECD
Education Statistics (database), https://doi.org/10.1787/1c1c86c4-en (accessed on 16 October 2018).
OECD (2017d), “Health expenditure and financing: Health expenditure indicators (Edition 2017)”,
OECD Health Statistics (database), https://doi.org/10.1787/828a6dbd-en (accessed on 16 October
2018).
OECD (2015a), In It Together: Why Less Inequality Benefits All, OECD Publishing, Paris,
http://dx.doi.org/10.1787/9789264235120-en.
OECD (2015b), How’s Life? 2015: Measuring Well-being, OECD Publishing, Paris,
https://doi.org/10.1787/how_life-2015-en.
OECD (2013a), New Sources of Growth: Knowledge-Based Capital – Synthesis Report, OECD
Publishing, Paris, www.oecd.org/sti/inno/knowledge-based-capital-synthesis.pdf.
OECD (2013b), PISA 2012 Results: Excellence through Equity (Volume II): Giving Every Student the
Chance to Succeed, PISA, OECD Publishing, Paris, https://doi.org/10.1787/9789264201132-en.
OECD (2013c), OECD Guidelines on Measuring Subjective Well-being, OECD Publishing, Paris,
http://dx.doi.org/10.1787/9789264191655-en.
OECD (2013d), “Well‑being and the global financial crisis”, in How’s Life? 2013: Measuring Well-
being, OECD Publishing, Paris, https://doi.org/10.1787/how_life-2013-7-en.
OECD (2013e), OECD Guidelines for Micro Statistics on Household Wealth, OECD Publishing, Paris,
https://doi.org/10.1787/9789264194878-en.
OECD (2013f), OECD Skills Outlook 2013: First Results from the Survey of Adult Skills, OECD
Publishing, Paris, https://doi.org/10.1787/9789264204256-en.
OECD (2008), Growing Unequal?: Income Distribution and Poverty in OECD Countries, OECD
Publishing, Paris, https://doi.org/10.1787/9789264044197-en.
OECD (2001), The Well-being of Nations: The Role of Human and Social Capital, OECD Publishing,
Paris, http://dx.doi.org/10.1787/9789264189515-en.
ONS (2011), Measuring What Matters: National Statistician’s Reflections on the National Debate on
Measuring National Well-being, The Office for National Statistics, London.
Oreopoulos, P., T. von Wachter and A. Heisz (2012), “The short-and long-term career effects of
graduating in a recession”, The American Economic Journal: Applied Economics, Vol. 4, pp. 1-29.
Ostry, J., A. Berg and C.G. Tsangarides (2014), “Redistribution, inequality, and growth”, IMF Staff
Discussion Note 14/02, www.imf.org/external/pubs/ft/sdn/2014/sdn1402.pdf.
Palma, J. (2016), “Do nations just get the inequality they deserve? The ‘Palma Ratio’ re-examined”,
Cambridge Working Papers in Economics, No. 1627, University of Cambridge, Cambridge,
https://doi.org/10.17863/CAM.1089.
Pew Research Center (2017), Historical trends of public trust, www.people-press.org/2017/12/14/public-
trust-in-government-1958-2017.
Pew Research Center (2015), Historical trends of public trust, www.people-press.org/2015/11/23/1-trust-
in-government-1958-2015.
Piketty, T. (2014), Capital in the 21st Century, Harvard University Press, Cambridge, MA.
126 │ BIBLIOGRAPHY
BEYOND GDP: MEASURING WHAT COUNTS FOR ECONOMIC AND SOCIAL PERFORMANCE © OECD 2018
Putnam, R. (2000), Bowling Alone: The Collapse and Revival of American Community, Simon and
Schuster, New York.
Putnam, R., R. Leonardi and R.Y. Nanetti (1993), Making Democracy Work. Civic Traditions in Modern
Italy, Princeton University Press, Princeton.
Rockström, J. et al. (2009), “Planetary boundaries: Exploring the safe operating space for humanity”,
Ecology and Society, Vol. 14(2), p. 32, www.ecologyandsociety.org/vol14/iss2/art32/.
Roukny, T., S. Battiston and J.E. Stiglitz (2017) “Interconnectedness as a source of uncertainty in
systemic risk”, The Journal of Financial Stability, Vol. 35, pp. 93-106,
https://doi.org/10.1016/j.jfs.2016.12.003.
Saez, E. (2016), “Striking it richer: The evolution of top incomes in the United States (updated with 2015
preliminary estimates)”, https://eml.berkeley.edu/~saez/saez-UStopincomes-2015.pdf.
Schreyer, P. and M. Reinsdorf (2018), “Measuring consumer inflation in a digital economy”, OECD
Statistics and Data Working Papers, forthcoming, OECD Publishing, Paris.
Sitaraman, G. (2017), The Crisis of the Middle-Class Constitution: Why Economic Inequality Threatens
Our Republic, Alfred A. Knopf, New York.
Steffen, W. et al. (2015), “Planetary boundaries: Guiding human development on a changing planet”,
Science, Vol. 347(6223), http://science.sciencemag.org/content/347/6223/1259855.full.
Steptoe, A., A. Deaton and A.A. Stone (2015), “Subjective wellbeing, health, and ageing”, The Lancet,
Vol. 385(9968), pp. 640-648.
Stern, N. (2006), The Economics of Climate Change – The Stern Review, Cambridge University Press,
Cambridge.
Stevenson, B. and J. Wolfers (2012), “Subjective well-being and income: Is there any evidence of
satiation?”, The American Economic Review, Vol. 103, pp. 598-604.
Stiglitz, J.E. (2016a), “America’s great malaise and what to do about it”, The Journal of Policy
Modelling, Vol. 38, pp. 639-648, paper presented at the American Economic Association Annual
Meetings, San Francisco, www.sciencedirect.com/science/article/pii/S0161893816300412.
Stiglitz, J.E. (2016b), “An agenda for sustainable and inclusive growth for emerging markets”, The
Journal of Policy Modelling, Vol. 38, pp. 693-710, paper presented at the American Economic
Association Annual Meetings, San Francisco,
www.sciencedirect.com/science/article/pii/S0161893816300503.
Stiglitz, J.E. (2015), Rewriting the Rules of the American Economy: An Agenda for Growth and Shared
Prosperity, Roosevelt Institute, New York, https://community-wealth.org/sites/clone.community-
wealth.org/files/downloads/report-stiglitz.pdf.
Stiglitz, J.E. (2014), “The measurement of wealth: Recessions, sustainability and inequality”, in Stiglitz,
J.E. and M. Guzman (eds.), Contemporary Issues in Macroeconomics: Lessons from The Crisis and
Beyond, IEA Conference Volume, No. 155-II, Houndmills, UK, and Palgrave Macmillan, New York
(Paper presented at a special session of the International Economic Association World Congress,
Dead Sea, Jordan, June 2014).
Stiglitz, J.E. (2012a), The Price of Inequality: How Today’s Divided Society Endangers Our Future,
W.W. Norton and Company, New York.
Stiglitz, J.E. (2012b), “Macroeconomic fluctuations, inequality, and human development”, The Journal
of Human Development and Capabilities, Vol. 13(1), pp. 31-58.
BIBLIOGRAPHY │ 127
BEYOND GDP: MEASURING WHAT COUNTS FOR ECONOMIC AND SOCIAL PERFORMANCE © OECD 2018
Stiglitz, J.E. (2010), The Stiglitz Report: Reforming the International Monetary and Financial Systems in
the Wake of the Global Crisis, The New Press, New York.
Stiglitz, J.E. (2009), “Simple formulae for optimal income taxation and the measurement of inequality”,
in Basu, K. and R. Kanbur (eds.), Arguments for a Better World: Essays in Honor of Amartya Sen,
Volume I: Ethics, Welfare, and Measurement, Oxford University Press, Oxford, pp. 535-566.
Stiglitz, J.E. (1994), “Endogenous growth and cycles”, in Shionoya, Y. and M. Perlman (eds.),
Innovation in Technology, Industries, and Institutions, The University of Michigan Press, pp. 121-56.
Stiglitz, J.E., J.-P. Fitoussi and M. Durand (eds.) (2018), For Good Measure: Advancing Research on
Well-being Metrics Beyond GDP, OECD Publishing, Paris.
Stiglitz, J.E. and B.C. Greenwald (2016), Creating a Learning Society – A New Approach to Growth,
Development, and Social Progress, Columbia University Press, New York.
Stiglitz, J. E. and B.C. Greenwald (2003), Towards a New Paradigm in Monetary Economics, Cambridge
University Press, Cambridge.
Stiglitz, J.E., A. Sen and J.-P. Fitoussi (2009), Mismeasuring Our Lives: Why GDP Doesn’t Add Up, The
New Press, New York.
Stiglitz, J.E., A. Sen and J.-P. Fitoussi (2009), Report by the Commission on the Measurement of
Economic and Social Progress,
http://ec.europa.eu/eurostat/documents/118025/118123/Fitoussi+Commission+report.
Stolper, W.F. and P.A. Samuelson (1949), “Protection and real wages”, The Review of Economic Studies,
Vol. 9(1), pp. 58-73, https://doi.org/10.2307/2967638.
Stone, A.A. and C. Mackie (2015), Subjective Well-Being: Measuring Happiness, Suffering, and Other
Dimensions of Experience, The National Academies Press, Washington, D.C.
UNECE (2014), “Conference of European Statisticians recommendations on measuring sustainable
development”, Geneva, www.unece.org/fileadmin/DAM/stats/publications/2013/CES_SD_web.pdf.
UNECE (2013), Guidelines for harmonizing Time-use Surveys, United Nations, New York and Geneva,
www.unece.org/fileadmin/DAM/stats/publications/2013/TimeUseSurvey_Guidelines.pdf.
UNECE (2011), The Canberra Group Handbook on Household Income Statistics, Second Edition,
Geneva, UN, www.unece.org/fileadmin/DAM/stats/groups/cgh/Canbera_Handbook_2011_WEB.pdf.
United Nations (2015), Report of the Secretary-General: A promotion of sustained economic growth and
sustainable development, www.un.org/sg/en/content/sg/report-secretary-general-promotion-sustained-
economic-growth-and-sustainable-0.
United Nations (1987), Our Common Future – Report of the World Commission on Environment and
Development, United Nations, New York.
United Nations et al. (2014), System of Environmental-Economic Accounting 2012 – Central
Framework, https://unstats.un.org/unsd/envaccounting/seearev/seea_cf_final_en.pdf.
United Nations et al. (2014), System of Environmental-Economic Accounting 2012 – Experimental
Ecosystem Accounting, https://unstats.un.org/unsd/envaccounting/seeaRev/eea_final_en.pdf.
UNODC (2015), “International classification of crime for statistical purposes”, United Nations, Vienne,
www.unodc.org/documents/data-and-analysis/statistics/crime/ICCS/ICCS_English_2016_web.pdf.
US Congress (1934), “National income, 1929-32”, 73rd Congress, 2d session, S. Doc. 124.
128 │ BIBLIOGRAPHY
BEYOND GDP: MEASURING WHAT COUNTS FOR ECONOMIC AND SOCIAL PERFORMANCE © OECD 2018
Weichselbaumer, D. and R. Winter-Ebmer (2005), “A Meta-analysis of the international gender wage
gap”, The Journal of Economic Surveys, Vol. 19(3), pp. 479-511.
Woolley, F. (2004), “Why pay child benefits to mothers?”, Canadian Public Policy / Analyse de
Politiques, Vol. 30(1), University of Toronto Press, pp. 47-69.
Zucman, G. (2015), The Hidden Wealth of Nations. The Scourge of Tax Havens, The University of
Chicago Press, London.
ANNEX │ 129
BEYOND GDP: MEASURING WHAT COUNTS FOR ECONOMIC AND SOCIAL PERFORMANCE © OECD 2018
Annex A. Taking stock of progress in the “Beyond GDP” measurement
agenda since the 2009 Commission report
Since its release in 2009, the Stiglitz-Sen-Fitoussi Commission report has had much
resonance within the statistical community, spurring a large number of measurement
initiatives worldwide. It has also acted as a catalyst for research, and for communicating
on the “Beyond GDP” agenda to the general public. Some of the key initiatives are
described below, distinguishing between those undertaken by individual countries at the
national level and those carried out by international agencies with a more global
perspective.
National initiatives
Many countries have breathed life into the well-being measurement agenda advocated by
the Stiglitz-Sen-Fitoussi Commission in 2009 by launching initiatives with frameworks
and dashboards of indicators that are now published and updated regularly. While a few
of these initiatives pre-date the release of the Commission report, the report surely
accelerated the trend. Table A.1 details the key features of 15 prominent national
measurement initiatives explicitly related to the recommendations of the Commission,
listing, for each initiative, the type of framework used and the leading agency responsible
for compiling the indicators. Although the motivations underlying the development of
well-being measurement frameworks differed across countries, some features are notably
similar:
First, all of the frameworks have used a multi-dimensional approach, typically
combining data about people’s economic circumstances and material living
conditions with indicators that consider a wide range of quality of life factors.
Second, consulting with wide audiences was often part of these national
initiatives. While these consultations were done with varying levels of intensity,
focusing on either the indicators or the dimensions included in the framework,
they contributed to build the “legitimacy” of the indicator sets, and to ensure the
longevity of the reporting (Box A.1).
Third, most of these indicator sets have included measures of people’s subjective
well-being as one of their key components. Life satisfaction featured most
commonly in these national indicators sets, but other types of subjective measures
were also sometimes included, such as measures of experiential well-being and
eudemonia. However, in all cases these subjective measures were used as a
complement to, rather than as a replacement for, objective indicators.
130 │ ANNEX
BEYOND GDP: MEASURING WHAT COUNTS FOR ECONOMIC AND SOCIAL PERFORMANCE © OECD 2018
Box A.1. Public consultations within national measurement initiatives
Several countries have undertaken public consultations as part of the process of
developing measurement frameworks relating to well-being. These consultations were
held at different stages of the process of establishing the well-being framework, and their
inputs have shaped the framework in different ways. While public consultations require
time and resources, and can significantly extend the time needed to complete the process
of selecting indicators, they also contribute meaningful insight into what matters the most
to people in different countries and regions. Examples of consultations undertaken in the
context of the well-being initiatives include:
In Italy, as part of the process launched in 2010 by the Italian Statistical Office
(ISTAT) of establishing the BES (“equitable and sustainable well-being”)
framework, a steering group was established on the “Measurement of Progress in
Italian Society”, made up of 33 representatives of business, professional
associations, trade unions, environmental groups, cultural heritage groups, women
groups, consumer protection groups and civil society networks. The steering
group developed a multi-dimensional approach to measuring well-being. In
addition, a Scientific Commission with 80 researchers and experts from ISTAT,
universities and other institutions was established to consult on this process.
Further, a survey representative of the Italian population was conducted (with
about 45 000 people interviewed), inquiring which dimensions are most important
for well-being. This was supported by a dedicated website, a blog and an online
survey to consult the public on the committee’s decisions (with approximately
2 500 respondents). After presentation of the first report, the initiative was
presented in a series of meetings in different regions. Since then, ISTAT
publishes an annual publication on BES indicators, including composite measures
for different thematic domains.
In New Zealand, the Treasury conducted targeted workshops when developing its
Living Standards Framework. In the first round of consultation, held in 2009,
workshops (with some 200 participants) were held with government, business,
academia and community groups to get feedback on the proposed framework, on
the best ways to communicate about it, and on what themes were most important.
An advisory group, including representatives from government and civil society,
was created to consult on the framework.1
In Germany a national dialogue (spread over a period of 6 months) was launched
in 2015 to identify the issues that are most important for quality of life in the
country and the measures that could be used to describe them.2 The dialogue,
which included several types of public consultation (meetings, online surveys,
postcards), involved about 200 meetings held throughout the country with over
8 000 participants. The Chancellor, members of government and Cabinet
Ministers participated in 50 of these meetings. Civil society, representative
organisations, business associations and trade unions also supported the dialogue.
Over 7 000 people responded through the online survey and postcards. Results
from this dialogue, together with international comparison and research projects,
informed the framework (with 12 dimensions and 46 indicators) that was finally
adopted by the government. The framework will be updated on a regular basis.
In the United Kingdom, the Measuring National Well-being programme,

ANNEX │ 131
BEYOND GDP: MEASURING WHAT COUNTS FOR ECONOMIC AND SOCIAL PERFORMANCE © OECD 2018
launched in November 2010, started with a 6-month National Debate on “what
matters”, in order to understand what should count as measures of national well-
being. The National Debate was carried out by the Office of National Statistics
(ONS) and included 175 events held across the country, involving around
7 000 people and more than 34 000 responses, as well as responses from
organisations representing many more people. Meetings were also held with
citizens, hard-to-reach groups, organisations, charities, experts, the National
Statistician’s Advisory Forum and a Technical Advisory Group (ONS, 2011).
Following the National Debate, the ONS carried out public consultation on
several other well-being measurement issues, including proposals of domains,
headline measures, as well as on measures of human and natural capital.
In Israel, the process for selecting indicators to monitor “Well-being,
Sustainability and Resilience” included a public consultation process held in
parallel with the work of expert groups on each of 9 domains covered by the
framework. Following the consultation, two additional domains were added to the
framework. The consultation included an online survey (which garnered
responses from around 1 600 respondents) and workshops with people lacking
access to the internet (which included some 400 participants). Analyses of the
responses from these two elements led to a mapping highlighting the dimensions
that are most important for quality of life according to respondents. Expert groups
comprising representatives of government, the private sector, civil society, labour
unions, academia and other organisations were also set up for each domain.
In France, following the enactment of a law on “New Wealth Indicators” in 2015,
the process of selecting indicators involved a two-fold process of consultation.
The first part was the establishment of a working group of around 60 people
(researchers, representatives of civil society, international organisations and
experts) which established an initial list of themes and indicators. The second part
of the process was a wider public consultation, intended to assess the adequacy of
the indicators and to prioritise the themes and indicators in order to narrow down
the final set. Three types of consultations were held: an online survey, where over
4 000 respondents were asked to order the themes according to their importance; a
telephone survey with a representative sample of the total population, where
respondents were asked to rank the themes and indicators; and four focus groups
set up with ten participants in each, where the approach, themes and indicators
selected were debated.
Conversely, one notable difference among these national initiatives concerned their
leadership and motivation. In some countries, responsibility was with National Statistical
Office or similar agencies (e.g. Austria, the Netherlands), suggesting that the underlying
rationale of these initiatives was mainly that of providing additional metrics beyond GDP,
without necessarily embedding these measures into policy. In other cases, however,
measurement frameworks were developed by a centre-of-government agency (e.g. the
Prime Minister’s office in Israel and Sweden; the Federal Chancellery in Germany) or by
a combination of policy-related agencies (e.g. Slovenia, Italy, France, Finland), with a
clear ambition to use these metrics in policy settings (see Chapter 4).
1. www.stats.govt.nz/browse_for_stats/environment/environmental-economic-accounts/public-sustainable-
development-workshop-summary.aspx.
2. https://buergerdialog.gut-leben-in-deutschland.de/DE/Home/home_node.html.
132 │ ANNEX
BEYOND GDP: MEASURING WHAT COUNTS FOR ECONOMIC AND SOCIAL PERFORMANCE © OECD 2018
International initiatives
Work undertaken at the international level has mainly focused on mobilising existing
statistical information and on providing the basis for improving well-being statistics in
the future. For example, in 2011, the OECD presented a framework on measuring well-
being, largely based on the Commission domains and dimensions (Box A.2), populated
with a number of comparable indicators, for monitoring and benchmarking the
performances of its member countries (i.e. to identify strengths and weaknesses). The
indicators used were mainly sourced from official statistics but also relied on comparable
measures drawn from non-official sources (used as “place holders”) for those areas where
high-quality official statistics were not yet available. The OECD also released in 2016 a
dashboard of indicators of household economic well-being to describe short-term
developments in household conditions that could be contrasted to those in quarterly GDP;
this comparison highlighted the significant differences over the business cycle between
household-level and economy-wide measures.1
Similarly, in Europe, the Statistical Office of the European Union (Eurostat) engaged in a
process (in the context of a broader “INSEE-Eurostat” Sponsorship Group on measuring
progress, well-being and sustainable development, launched to respond to the
Commission recommendations)2 that led to the development of a set of Quality of Life
Indicators (17 headlines indicators pertaining to 9 dimensions) that are regularly used to
monitor conditions in EU member countries (Eurostat, 2017).
The UN SDG process that led to the adoption of the 2030 Agenda (with its associated
goals, targets and indicators for global monitoring) by the UN General Assembly in 2015
also referred to the importance of building on ongoing efforts to develop measures of
progress complementing GDP.3
Box A.2. The OECD Better Life Initiative
In 2011, the OECD presented its framework for measuring well-being, developed in
consultation with the Statistical Offices of its member countries. The framework
(Figure A.1) was largely based upon the recommendations of the Stiglitz-Sen-Fitoussi
Commission as well as on a variety of other national and international initiatives. It
conceptualises well-being as a multi-dimensional construct, distinguishing between
current well-being and its sustainability over time and, within the former, between
material conditions and quality of life. Most of the 11 dimensions of current well-being
are those discussed by the Commission report, ranging from health status to education
and skills, quality of the local environment, personal security and subjective well-being,
although excluding the dimension of “economic insecurity” (due to lack of suitable
indicators), and detailing “material conditions” in terms of three more specific
dimensions (income and wealth, jobs and earnings, and housing). As in the Stiglitz-Sen-
Fitoussi report, the OECD framework describes sustainability in terms of resources that
are critical for future well-being (natural, human, economic and social capital).
The biennial OECD report How’s Life? presents a set of internationally comparable well-
being indicators for OECD and partner countries pertaining to current well-being,
resources for future well-being, and well-being inequalities (describing “vertical
inequalities”, i.e. the gaps between people at the top and people at the bottom of the
distribution; “horizontal inequalities”, i.e. gaps between groups of people by gender, age
and education level; and well-being deprivations, i.e. the share of the population falling
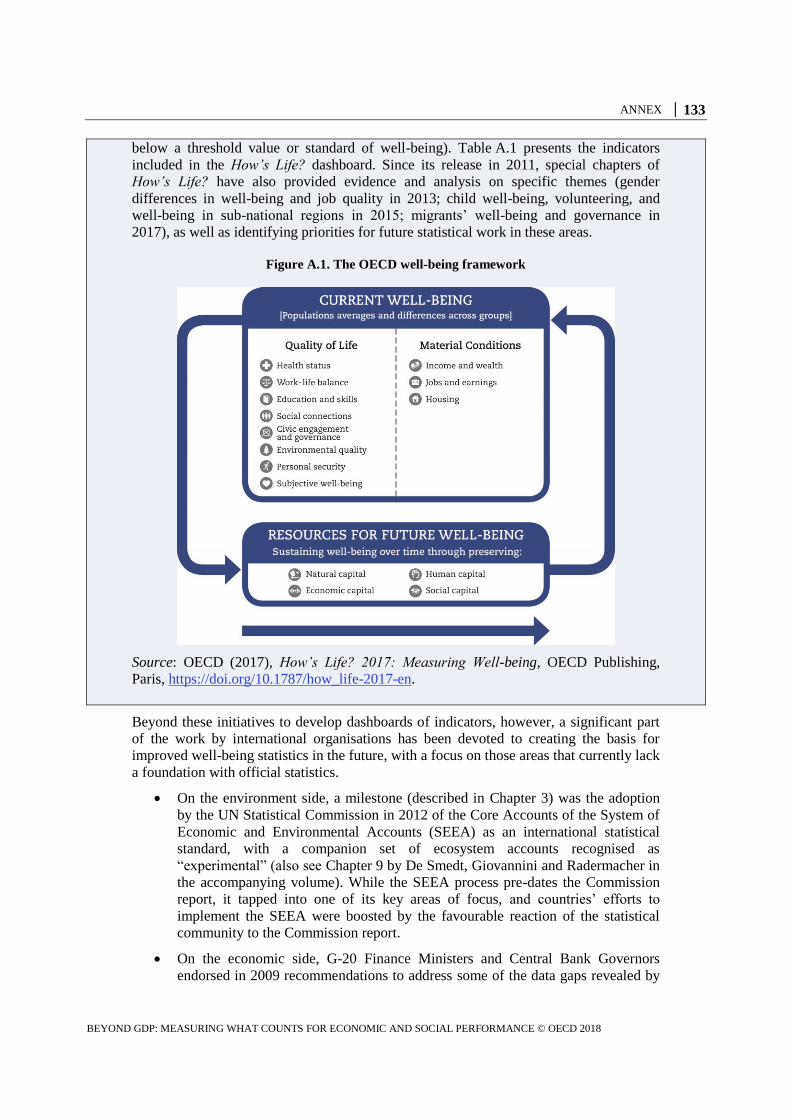
ANNEX │ 133
BEYOND GDP: MEASURING WHAT COUNTS FOR ECONOMIC AND SOCIAL PERFORMANCE © OECD 2018
below a threshold value or standard of well-being). Table A.1 presents the indicators
included in the How’s Life? dashboard. Since its release in 2011, special chapters of
How’s Life? have also provided evidence and analysis on specific themes (gender
differences in well-being and job quality in 2013; child well-being, volunteering, and
well-being in sub-national regions in 2015; migrants’ well-being and governance in
2017), as well as identifying priorities for future statistical work in these areas.
Figure A.1. The OECD well-being framework
Source: OECD (2017), How’s Life? 2017: Measuring Well-being, OECD Publishing,
Paris, https://doi.org/10.1787/how_life-2017-en.
Beyond these initiatives to develop dashboards of indicators, however, a significant part
of the work by international organisations has been devoted to creating the basis for
improved well-being statistics in the future, with a focus on those areas that currently lack
a foundation with official statistics.
On the environment side, a milestone (described in Chapter 3) was the adoption
by the UN Statistical Commission in 2012 of the Core Accounts of the System of
Economic and Environmental Accounts (SEEA) as an international statistical
standard, with a companion set of ecosystem accounts recognised as
“experimental” (also see Chapter 9 by De Smedt, Giovannini and Radermacher in
the accompanying volume). While the SEEA process pre-dates the Commission
report, it tapped into one of its key areas of focus, and countries’ efforts to
implement the SEEA were boosted by the favourable reaction of the statistical
community to the Commission report.
On the economic side, G-20 Finance Ministers and Central Bank Governors
endorsed in 2009 recommendations to address some of the data gaps revealed by
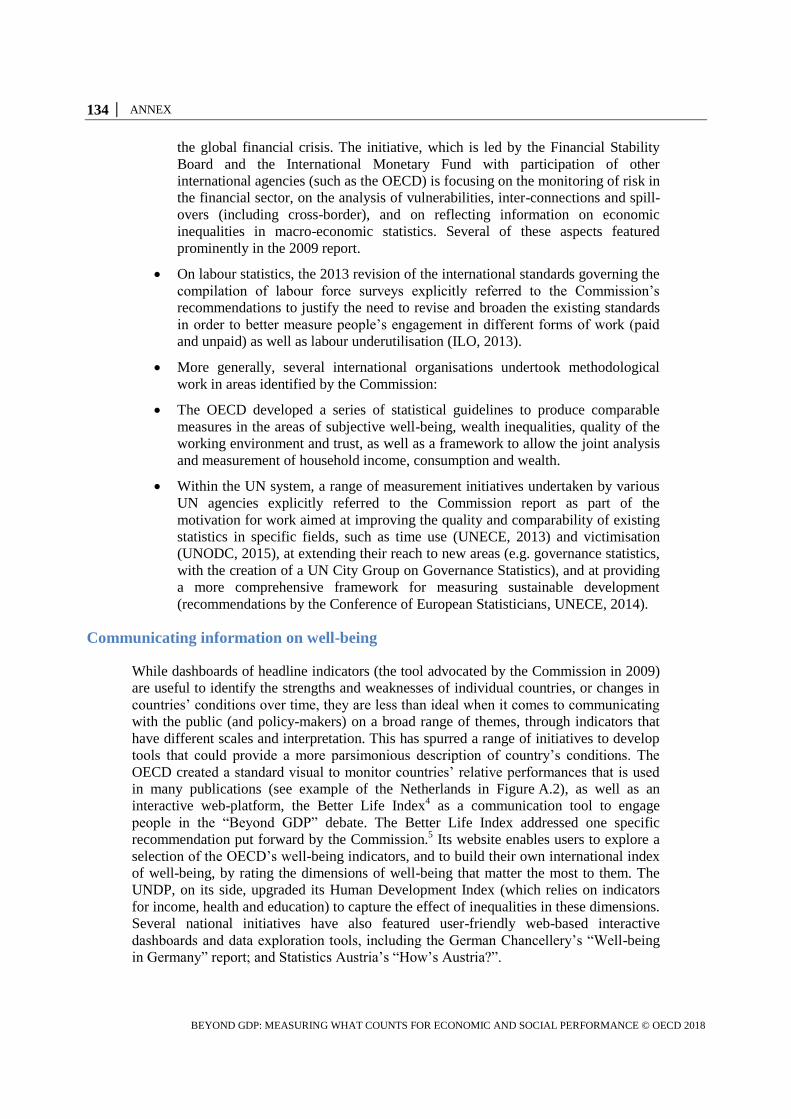
134 │ ANNEX
BEYOND GDP: MEASURING WHAT COUNTS FOR ECONOMIC AND SOCIAL PERFORMANCE © OECD 2018
the global financial crisis. The initiative, which is led by the Financial Stability
Board and the International Monetary Fund with participation of other
international agencies (such as the OECD) is focusing on the monitoring of risk in
the financial sector, on the analysis of vulnerabilities, inter-connections and spill-
overs (including cross-border), and on reflecting information on economic
inequalities in macro-economic statistics. Several of these aspects featured
prominently in the 2009 report.
On labour statistics, the 2013 revision of the international standards governing the
compilation of labour force surveys explicitly referred to the Commission’s
recommendations to justify the need to revise and broaden the existing standards
in order to better measure people’s engagement in different forms of work (paid
and unpaid) as well as labour underutilisation (ILO, 2013).
More generally, several international organisations undertook methodological
work in areas identified by the Commission:
The OECD developed a series of statistical guidelines to produce comparable
measures in the areas of subjective well-being, wealth inequalities, quality of the
working environment and trust, as well as a framework to allow the joint analysis
and measurement of household income, consumption and wealth.
Within the UN system, a range of measurement initiatives undertaken by various
UN agencies explicitly referred to the Commission report as part of the
motivation for work aimed at improving the quality and comparability of existing
statistics in specific fields, such as time use (UNECE, 2013) and victimisation
(UNODC, 2015), at extending their reach to new areas (e.g. governance statistics,
with the creation of a UN City Group on Governance Statistics), and at providing
a more comprehensive framework for measuring sustainable development
(recommendations by the Conference of European Statisticians, UNECE, 2014).
Communicating information on well-being
While dashboards of headline indicators (the tool advocated by the Commission in 2009)
are useful to identify the strengths and weaknesses of individual countries, or changes in
countries’ conditions over time, they are less than ideal when it comes to communicating
with the public (and policy-makers) on a broad range of themes, through indicators that
have different scales and interpretation. This has spurred a range of initiatives to develop
tools that could provide a more parsimonious description of country’s conditions. The
OECD created a standard visual to monitor countries’ relative performances that is used
in many publications (see example of the Netherlands in Figure A.2), as well as an
interactive web-platform, the Better Life Index4 as a communication tool to engage
people in the “Beyond GDP” debate. The Better Life Index addressed one specific
recommendation put forward by the Commission.5 Its website enables users to explore a
selection of the OECD’s well-being indicators, and to build their own international index
of well-being, by rating the dimensions of well-being that matter the most to them. The
UNDP, on its side, upgraded its Human Development Index (which relies on indicators
for income, health and education) to capture the effect of inequalities in these dimensions.
Several national initiatives have also featured user-friendly web-based interactive
dashboards and data exploration tools, including the German Chancellery’s “Well-being
in Germany” report; and Statistics Austria’s “How’s Austria?”.
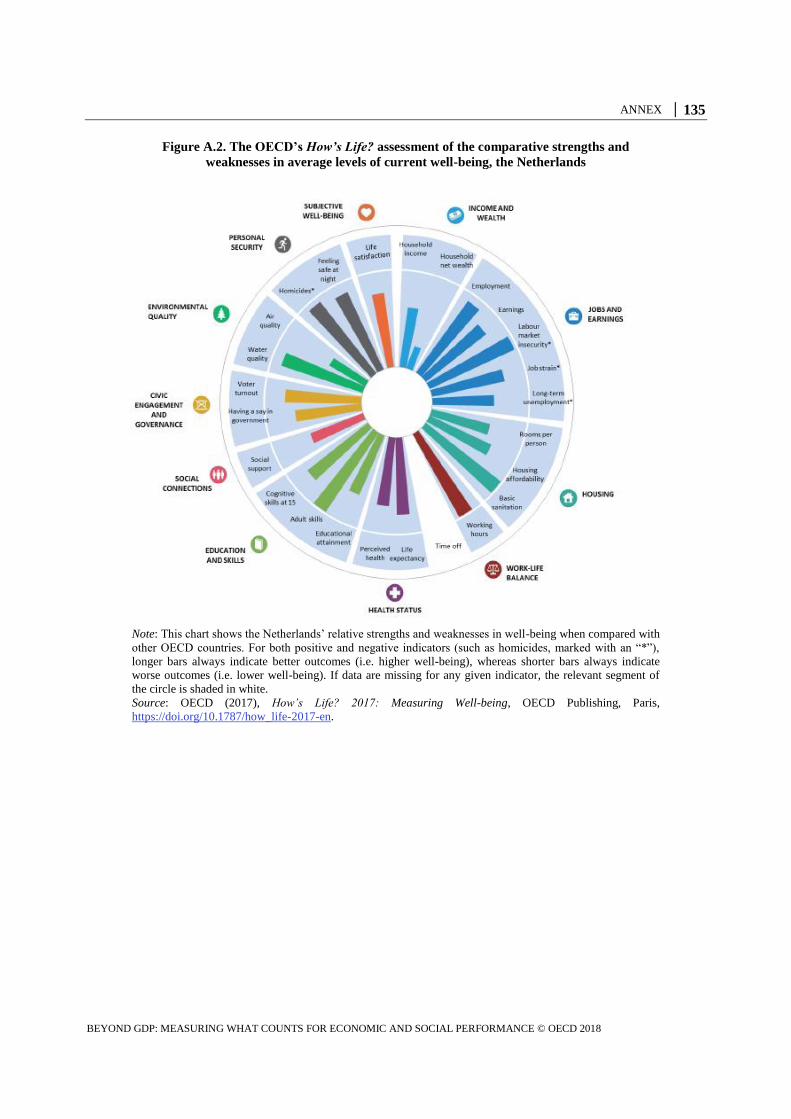
ANNEX │ 135
BEYOND GDP: MEASURING WHAT COUNTS FOR ECONOMIC AND SOCIAL PERFORMANCE © OECD 2018
Figure A.2. The OECD’s How’s Life? assessment of the comparative strengths and
weaknesses in average levels of current well-being, the Netherlands
Note: This chart shows the Netherlands’ relative strengths and weaknesses in well-being when compared with
other OECD countries. For both positive and negative indicators (such as homicides, marked with an “*”),
longer bars always indicate better outcomes (i.e. higher well-being), whereas shorter bars always indicate
worse outcomes (i.e. lower well-being). If data are missing for any given indicator, the relevant segment of
the circle is shaded in white.
Source: OECD (2017), How’s Life? 2017: Measuring Well-being, OECD Publishing, Paris,
https://doi.org/10.1787/how_life-2017-en.
136 │ ANNEX
BEYOND GDP: MEASURING WHAT COUNTS FOR ECONOMIC AND SOCIAL PERFORMANCE © OECD 2018
Table A.1. Selected national well-being measurement initiatives and indicator sets
Country Measurement
initiative/ indicator set Leading agency Short description
Austria How’s Austria Statistics Austria Statistics Austria publishes since 2010 an annual report on 30 key indicators categorised into three dimensions: material wealth, quality of life and
environmental sustainability. An interactive tool allows users to explore historical trends and compare across indicators.1
Belgium Complementary
indicators to GDP
National Accounts
Institute
A law adopted In 2014 stipulates that an annual report be published by the National Accounts Institute on Complementary Indicators to GDP, aimed at
measuring people’s well-being and societal development at the federal level. The report was published in 2016 and 2017, reporting trends for 67 indicators
grouped in 13 themes and covering three dimensions: current generation (here and now), future generation (later) and other countries (somewhere else).
Ecuador Buen Vivir INEC (Ecuador
Statistics Office) In support of wider work on Buen Vivir, the Ecuador Statistics Office (INEC) compiled a set of indicators to monitor progress.
Finland Findicator
Statistics Finland
and the Prime
Minister’s Office
Findicator, launched in 2009 by Finland’s Prime Minister’s Office and Statistics Finland, is an online compendium of over 100 indicators on social progress.
A specific category on well-being indicators includes 23 indicators across eight dimensions.2
Germany Gut Leben in
Deutschland Federal government
The German federal government launched the “Wellbeing in Germany – what matters to us” initiative in response to a commitment of the December 2013
coalition agreement that “We wish to align our policies more closely with the values and hopes of German citizens and we will therefore conduct a dialogue
with them in order to gain an understanding of their views on wellbeing issues…”. Building on a national consultation and based on the findings of other
national and international research projects, the initiative includes 46 indicators grouped in 12 dimensions to measure the current status and trends in well-
being in Germany. The indicators will be updated on a regular basis.3
Italy
Measures of equitable
and sustainable well-
being
National Council for
the Economy and
Labour (CNEL) and
National Institute of
Statistics (ISTAT)
The “Equitable and Sustainable Well-Being” (BES) initiative led to the creation of a well-being framework based on the recommendation of a committee
convened by the Italian Prime Minister, which is monitored through a set of indicators and an annual report by ISTAT. A law approved in 2016 stipulated
that a narrower framework be developed for reporting to parliament in the context of budgetary discussions.
Israel
Well-being,
Sustainability and
National Resilience
Indicators
Central Bureau of
Statistics
A government resolution approved in April 2015 asked the Central Bureau of Statistics to publish a set of well-being, sustainability, and national resilience
indicators. The 2015 resolution included indicators in 10 domains (quality of employment; personal security; health; housing and infrastructure; education;
higher education and skills; personal and social well-being; environment; civic engagement and governance; and material standard of living) and called for
the development of indicators in two additional domains (information technology; and leisure, culture, and community). For each domain, 8 indicators were
selected.4
Japan Commission on
Measuring Well-Being
Commissioned by
government
A Commission on Measuring Well-Being was established in 2010, under the government’s Cabinet Office and with participation of experts, to promote
research and studies on new growth and well-being, and to develop and improve statistics in these fields as a part of the government’s “New Growth
Strategy”. In December 2011, the Commission released the report “Measuring National Well-Being - Proposed Well-being Indicators”, whose framework
(based on the three domains socio-economic conditions, health, and relatedness) was populated through subjective and objective indicators.5
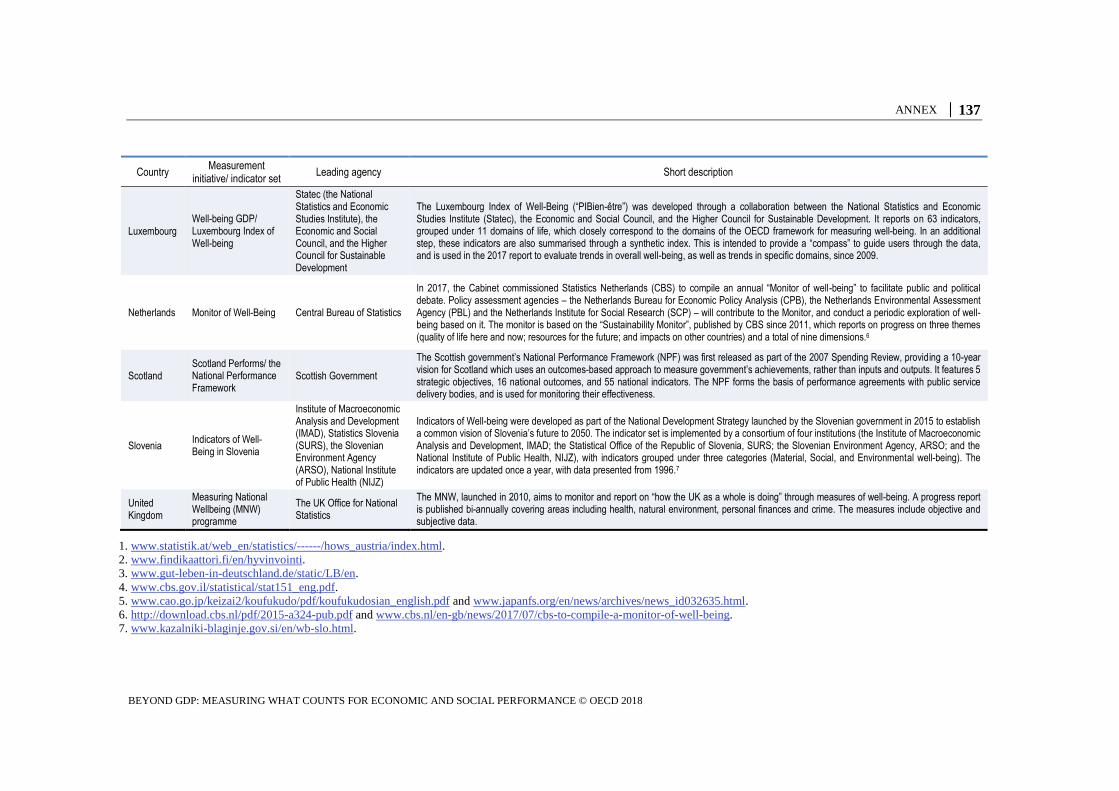
ANNEX │ 137
BEYOND GDP: MEASURING WHAT COUNTS FOR ECONOMIC AND SOCIAL PERFORMANCE © OECD 2018
Country Measurement
initiative/ indicator set Leading agency Short description
Luxembourg Well-being GDP/ Luxembourg Index of Well-being
Statec (the National Statistics and Economic Studies Institute), the Economic and Social Council, and the Higher Council for Sustainable Development
The Luxembourg Index of Well-Being (“PIBien-être”) was developed through a collaboration between the National Statistics and Economic Studies Institute (Statec), the Economic and Social Council, and the Higher Council for Sustainable Development. It reports on 63 indicators, grouped under 11 domains of life, which closely correspond to the domains of the OECD framework for measuring well-being. In an additional step, these indicators are also summarised through a synthetic index. This is intended to provide a “compass” to guide users through the data, and is used in the 2017 report to evaluate trends in overall well-being, as well as trends in specific domains, since 2009.
Netherlands Monitor of Well-Being Central Bureau of Statistics
In 2017, the Cabinet commissioned Statistics Netherlands (CBS) to compile an annual “Monitor of well-being” to facilitate public and political debate. Policy assessment agencies – the Netherlands Bureau for Economic Policy Analysis (CPB), the Netherlands Environmental Assessment Agency (PBL) and the Netherlands Institute for Social Research (SCP) – will contribute to the Monitor, and conduct a periodic exploration of well-being based on it. The monitor is based on the “Sustainability Monitor”, published by CBS since 2011, which reports on progress on three themes (quality of life here and now; resources for the future; and impacts on other countries) and a total of nine dimensions.6
Scotland Scotland Performs/ the National Performance Framework
Scottish Government
The Scottish government’s National Performance Framework (NPF) was first released as part of the 2007 Spending Review, providing a 10-year vision for Scotland which uses an outcomes-based approach to measure government’s achievements, rather than inputs and outputs. It features 5 strategic objectives, 16 national outcomes, and 55 national indicators. The NPF forms the basis of performance agreements with public service delivery bodies, and is used for monitoring their effectiveness.
Slovenia Indicators of Well-Being in Slovenia
Institute of Macroeconomic Analysis and Development (IMAD), Statistics Slovenia (SURS), the Slovenian Environment Agency (ARSO), National Institute of Public Health (NIJZ)
Indicators of Well-being were developed as part of the National Development Strategy launched by the Slovenian government in 2015 to establish a common vision of Slovenia’s future to 2050. The indicator set is implemented by a consortium of four institutions (the Institute of Macroeconomic Analysis and Development, IMAD; the Statistical Office of the Republic of Slovenia, SURS; the Slovenian Environment Agency, ARSO; and the National Institute of Public Health, NIJZ), with indicators grouped under three categories (Material, Social, and Environmental well-being). The indicators are updated once a year, with data presented from 1996.7
United Kingdom
Measuring National Wellbeing (MNW) programme
The UK Office for National Statistics
The MNW, launched in 2010, aims to monitor and report on “how the UK as a whole is doing” through measures of well-being. A progress report is published bi-annually covering areas including health, natural environment, personal finances and crime. The measures include objective and subjective data.
1. www.statistik.at/web_en/statistics/------/hows_austria/index.html.
2. www.findikaattori.fi/en/hyvinvointi.
3. www.gut-leben-in-deutschland.de/static/LB/en.
4. www.cbs.gov.il/statistical/stat151_eng.pdf.
5. www.cao.go.jp/keizai2/koufukudo/pdf/koufukudosian_english.pdf and www.japanfs.org/en/news/archives/news_id032635.html.
6. http://download.cbs.nl/pdf/2015-a324-pub.pdf and www.cbs.nl/en-gb/news/2017/07/cbs-to-compile-a-monitor-of-well-being.
7. www.kazalniki-blaginje.gov.si/en/wb-slo.html.
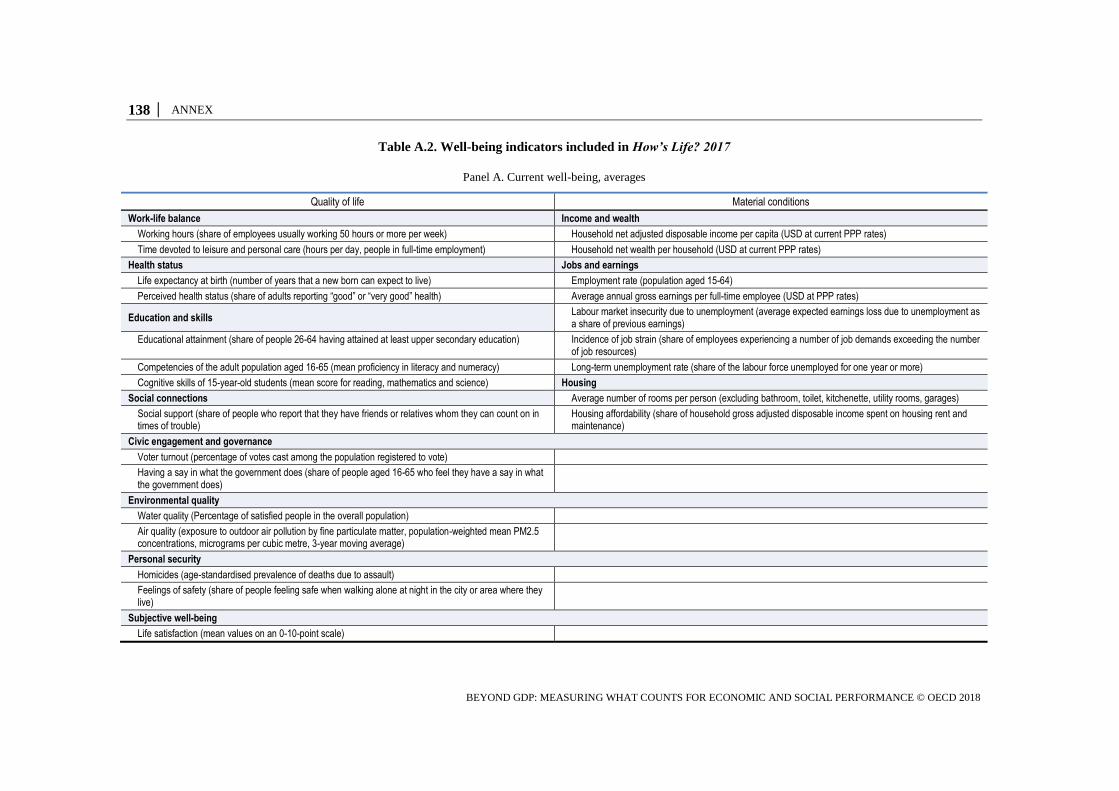
138 │ ANNEX
BEYOND GDP: MEASURING WHAT COUNTS FOR ECONOMIC AND SOCIAL PERFORMANCE © OECD 2018
Table A.2. Well-being indicators included in How’s Life? 2017
Panel A. Current well-being, averages
Quality of life Material conditions
Work-life balance Income and wealth
Working hours (share of employees usually working 50 hours or more per week) Household net adjusted disposable income per capita (USD at current PPP rates)
Time devoted to leisure and personal care (hours per day, people in full-time employment) Household net wealth per household (USD at current PPP rates)
Health status Jobs and earnings
Life expectancy at birth (number of years that a new born can expect to live) Employment rate (population aged 15-64)
Perceived health status (share of adults reporting “good” or “very good” health) Average annual gross earnings per full-time employee (USD at PPP rates)
Education and skills Labour market insecurity due to unemployment (average expected earnings loss due to unemployment as a share of previous earnings)
Educational attainment (share of people 26-64 having attained at least upper secondary education) Incidence of job strain (share of employees experiencing a number of job demands exceeding the number of job resources)
Competencies of the adult population aged 16-65 (mean proficiency in literacy and numeracy) Long-term unemployment rate (share of the labour force unemployed for one year or more)
Cognitive skills of 15-year-old students (mean score for reading, mathematics and science) Housing
Social connections Average number of rooms per person (excluding bathroom, toilet, kitchenette, utility rooms, garages)
Social support (share of people who report that they have friends or relatives whom they can count on in times of trouble)
Housing affordability (share of household gross adjusted disposable income spent on housing rent and maintenance)
Civic engagement and governance
Voter turnout (percentage of votes cast among the population registered to vote)
Having a say in what the government does (share of people aged 16-65 who feel they have a say in what the government does)
Environmental quality
Water quality (Percentage of satisfied people in the overall population)
Air quality (exposure to outdoor air pollution by fine particulate matter, population-weighted mean PM2.5 concentrations, micrograms per cubic metre, 3-year moving average)
Personal security
Homicides (age-standardised prevalence of deaths due to assault)
Feelings of safety (share of people feeling safe when walking alone at night in the city or area where they live)
Subjective well-being
Life satisfaction (mean values on an 0-10-point scale)

ANNEX │ 139
BEYOND GDP: MEASURING WHAT COUNTS FOR ECONOMIC AND SOCIAL PERFORMANCE © OECD 2018
Panel B. Current well-being, inequalities
Vertical inequalities Horizontal inequalities (by age, gender and educational level) Deprivations
Income and wealth
S80/S20 household disposable income ratio Gaps in average household disposable income Relative income poverty
Share of household net wealth of the top 10% Gaps in average household net wealth Asset-based poverty
Jobs and earnings
P90/P10 gross earnings ratio Gaps in average hourly earnings Risk of low pay
Gaps in employment rate Unemployment rate
Gaps in unemployment rate
Gaps in risk of low pay
Housing conditions
Share of people spending more than 40% of disposable income on housing
Share of households living in overcrowded dwellings
Health status
Standard deviation of age at death Gaps in self-reported health status Share of people rating their health status as fair, bad, or very bad
Difference in life expectancy (years) at age 25 by education level, for men and women
Work-life balance
S80/S20 hours worked ratio Gaps in average time devoted to personal care and leisure Share of employees usually working 50 hours or more per week
S80/S20 ratio in time devoted to personal care and leisure Gaps in incidence of long working hours
Education and skills
P90/P10 PISA scores ratio Gaps in share of adults aged 25-64 with upper secondary or
tertiary education Share of adults aged 25-64 with below upper secondary education
P90/P10 PIAAC scores ratio Gaps in average PISA scores across all fields Share of 15-year-old students who score at or below Level 2 in
science, reading and mathematics (PISA)
Gaps in average PISA scores across all fields by the parents’ education level
Share of adults who score at or below Level 1 in both literacy and numeracy (PIAAC)
Gaps in average PIAAC scores across both fields
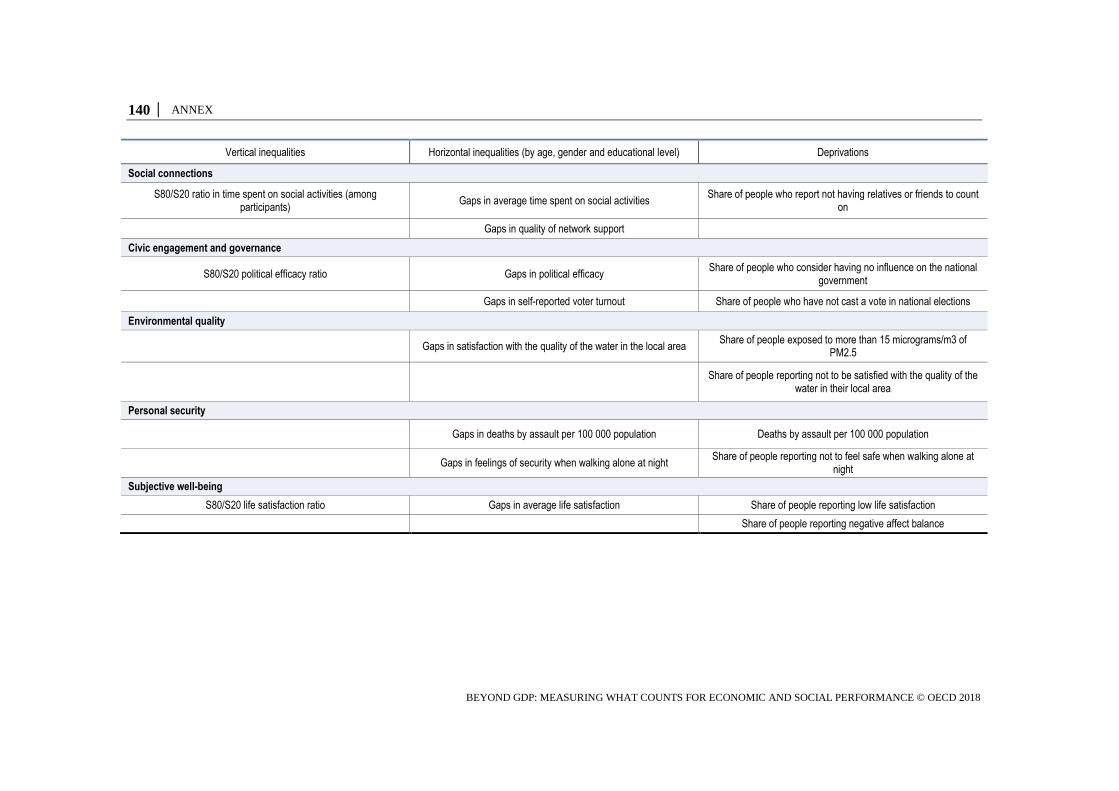
140 │ ANNEX
BEYOND GDP: MEASURING WHAT COUNTS FOR ECONOMIC AND SOCIAL PERFORMANCE © OECD 2018
Vertical inequalities Horizontal inequalities (by age, gender and educational level) Deprivations
Social connections
S80/S20 ratio in time spent on social activities (among participants)
Gaps in average time spent on social activities Share of people who report not having relatives or friends to count
on
Gaps in quality of network support
Civic engagement and governance
S80/S20 political efficacy ratio Gaps in political efficacy Share of people who consider having no influence on the national
government
Gaps in self-reported voter turnout Share of people who have not cast a vote in national elections
Environmental quality
Gaps in satisfaction with the quality of the water in the local area
Share of people exposed to more than 15 micrograms/m3 of PM2.5
Share of people reporting not to be satisfied with the quality of the water in their local area
Personal security
Gaps in deaths by assault per 100 000 population Deaths by assault per 100 000 population
Gaps in feelings of security when walking alone at night
Share of people reporting not to feel safe when walking alone at night
Subjective well-being
S80/S20 life satisfaction ratio Gaps in average life satisfaction Share of people reporting low life satisfaction
Share of people reporting negative affect balance

ANNEX │ 141
BEYOND GDP: MEASURING WHAT COUNTS FOR ECONOMIC AND SOCIAL PERFORMANCE © OECD 2018
Panel C. Resources for future well-being
Stocks Flows Risks
Natural capital
Greenhouse gas emissions from domestic production (CO2 equivalent, tonnes per capita)
Carbon dioxide emissions embodied in domestic final demand (tonnes per capita)
Population exposure to outdoor air pollution by fine particulate matter (Population-weighted mean PM2.5 concentrations, micrograms per cubic metre, 3-year moving average)*
Forest area in square kilometres, per thousand people
Renewable freshwater resources (1 000m3 per capita, long-term annual average)
Freshwater abstractions (gross abstraction from groundwater or surface water bodies, cubic metres, per capita)
Threatened species (share of all knows species, separately for birds, mammal and vascular plants)
Human capital
Share of people 25-24 who have attained at least upper secondary education*
Educational expectancy (average number of years in education that a child aged 5 can expect to undertake before age 39)
Cognitive skills of 15-year-old students (mean score for reading, mathematics and science)*
Adult skills (mean proficiency in literacy and numeracy of the population, aged 16-65)*
Long-term unemployment (share of the labour force unemployed for 1 year or more)*
Life expectancy at birth (number of years that a new born can expect to live)*
Prevalence of smoking (share of people aged 15 and over who report smoking every day)
Prevalence of obesity
(share of the population aged 15 and older)

142 │ ANNEX
BEYOND GDP: MEASURING WHAT COUNTS FOR ECONOMIC AND SOCIAL PERFORMANCE © OECD 2018
Stocks Flows Risks
Social capital
Trust in others (mean score, on a scale from 0 to 10)
Trust in the police (mean score, on a scale from 0 to 10)
Trust in the national government
(mean score, on a scale from 0 to 10)
Voter turnout (percentage of votes cast among the population registered to vote)*
Government stakeholder engagement when developing primary laws and subordinate regulations
Volunteering (share of the working-age population who declared having volunteered through an organisation at least once a month,
over the preceding year)
Economic capital
Produced fixed assets (USD per capita, at 2010 PPPs)
Gross fixed capital formation (annual growth rates)
Financial net worth of the total economy (USD per capita, at current PPPs)
Intellectual property assets (USD per capita, at 2010 PPPs)
Investment in R&D (percentage of GDP)
Household debt (percentage of net household disposable income)
Household net wealth (USD at current PPPs, per household)*
Financial net worth of general government (percentage of GDP)
Leverage of the banking sector
(ratio of selected assets to banks’ own equity)*
* Denotes indicators that are also considered headline measures of current well-being.
Source: OECD (2017a), How’s Life? 2017: Measuring Well-being, OECD Publishing, Paris, https://doi.org/10.1787/how_life-2017-en.
ANNEX │ 143
BEYOND GDP: MEASURING WHAT COUNTS FOR ECONOMIC AND SOCIAL PERFORMANCE © OECD 2018
Notes
1. The quarterly indicators used by the OECD refer to real household disposable income, net cash
transfers from governments to households, real household consumption expenditure, consumer
confidence, households’ savings rate, households’ indebtedness, financial net worth,
unemployment and labour under-utilisation rates. See www.oecd.org/sdd/na/household-
dashboard.htm.
2. The final report of the Sponsorship Group, released in November 2011 following its adoption by
the European Statistical System Committee, identified around 50 actions to be taken by the
European Statistical System. The report stressed the need for the European Statistical System to
use a multi-dimensional approach when defining quality of life, to develop indicators measuring
sustainability and to use complementary indicators coming from National Accounts that would
better reflect the situation of households. Since 2012, these actions have been integrated and
gradually implemented in the European Statistical Programme.
3. Article 38 of the final resolution of the United Nations Conference on Sustainable Development,
held in Rio de Janeiro in June 2012, “recognize(s) the need for broader measures of progress to
complement gross domestic product in order to better inform policy decisions… In this regard we
request the United Nations Statistical Commission, in consultation with relevant United Nations
system entities and other relevant organizations, to launch a programme of work in this area,
building on existing initiatives”.
4. www.oecdbetterlifeindex.org.
5. Recommendation 8 was that “Statistical Offices should provide the information needed to
aggregate across quality of life dimensions, allowing the construction of different indexes”.