Nordic Cities Beyond Digital Disruption – Updating the Smart City paradigm


Beyond Edgeless Cities: Office Geography in the New Metropolis
Robert E. Lang, Thomas Sanchez and Jennifer LeFurgy Virginia Tech
Key Findings:
• This study uses spatial analysis within a Geographic Information System (GIS) to track over 3 billion square feet of office space in 13 large US markets. The office patterns revealed do not fit a downtown versus edge city development model. The findings confirm those presented in Robert Lang’s 2003 book Edgeless Cities. Although new office location categories are added to this analysis, the breakdown of space is roughly approximate with the results in the earlier work.
• Edgeless cities, a small-scale and scattered form of commercial development,
account for almost 40 percent of the total office space in this survey. Downtowns follow with nearly 33 percent of space, while edge cities have just over 14 percent. The remaining office space falls into three minor categories: “urban envelopes,” “corridors,” and “secondary downtowns.” These places hold 5.2, 3.8, and 1.2 percent of all office space respectively.
• About half the edgeless city office space mapped in this study sits in higher
density “urban” residential areas that have more than 3,000 people per square mile. “Suburban” areas, or places with densities between 1,000 and 3,000 residents per square mile, account for just over a third of the edgeless cities office space. Areas below 1,000 people per square mile, or “exurbs” hold just 12.4 percent of total space.
• The relatively large share of urban edgeless city office space is encouraging. This
study finds that an emerging form of urbanity in denser parts of the metropolis that mixes smaller-scale edgeless city office development with multifamily housing and local retail. In a few cases, the mix is even served by light rail. This is an important trend because it shows that quasi-urban development does not require a large-scale edge city to exist.

February 2006 2
Introduction This report extends the analysis of office geography begun by Robert Lang in his 2003 book Edgeless Cities. Lang found that the distribution of office development in 13 of the largest US markets was more complicated than commonly assumed. Observers such as Joel Garreau (1991), author of the influential book Edge City, speculated that virtually all the office space found outside downtown was grouped in large, mixed-use clusters that he termed “edge cities.” The reality is that edge cities capture a modest share of non-central business district space. Lang showed that what he termed “edgeless cities,” a smaller scale and dispersed commercial form, had almost double the office space found in edge cities. Edgeless cities are not easy to map. They come in multiple shapes, sizes, and densities; and they lie in equally diverse settings. Lang noted that edgeless cities exist throughout the metropolis—from a region’s edge to near its core. They also exist in multiple residential contexts. This study seeks to better understand edgeless cities. Further, it establishes a new geography for all metropolitan office locations through an analytic use of Geographic Information Systems (GIS)1. Downtowns, edge cities, and edgeless cities are redefined using a method that tracks the intensity and environment for office development. These methods, and the new geographic categories they produce, offer a more precise commercial map of large US regions. The findings in this study present numerous opportunities and challenges to planners, real estate professionals, and developers. A “new metropolis” exists with a tremendous diversity of commercial forms (Lang et al 2005). The market potentials of most places outside downtowns are not well understood. Many larger edge cities are approaching buildout and have no where to go but up. But adding density to edge cities often produces congestion that discourages businesses from locating and investing in these places (Lang 2003a). Edgeless cities play a major role in the new metropolis—both positive and negative. Some edgeless cities anchor moderately dense mixed-use development that includes housing and retail. Others scatter at the edge of the region and are the poster child for sprawl critics. There is also a substantial dissimilarity in the location of office space by region. While all metropolitan areas have some offices located in downtown, edge cities and edgeless cities, the distributions across these places vary. Some places have just one edge city, while other have several. Three regions have more than half their office total space in edgeless cities, while one has less than a quarter. The downtowns of New York and Chicago still dominate their regions, while the central business districts in Detroit and Miami contain a small share of their metropolitan areas office space. This study addresses the nature and the causes of office location diversity. It documents the variation in precise terms, and offers a region-by-region explanation for how real
1 GIS is a specialized, database-driven computer information system. The database contains observations of spatially distributed features, activities or events, which can be defined in space as points, lines or areas. The GIS allows users to capture, store, display, manipulate, and analyze geographically referenced data.

February 2006 3
estate development played out at the local level. It also considers the context for office development by focusing on the types of environments where it is found. The context is an important element in determining the impact of commercial growth. The New Suburban Metropolis The largest share of new office space is now in the suburbs (Lang 2000a).2 But as the suburbs gained, they also changed. And like any space that contains half of the US population, or roughly 150 million people as of 2004, the suburbs are diverse. At this scale, the suburbs are no longer just a part of the metropolis—they are essentially becoming the metropolis. The “suburbs” now even have downtowns that rival cities, as in the case of Southfield, MI, which has more office space than downtown Detroit (Lang 2003). To say there is a new suburban metropolis is not to assume that some 1950s’ subdivision suddenly holds sway in the region. Rather, as suburbs boomed they at least quasi-urbanized to become a new kind of city—or more accurately a “new metropolis.” The suburbs are now a good deal more urban than they were just a generation ago (Lang et al. 2005). The suburbs are now home to one in two Americans (Census 2005). Suburbs also contain the majority of the nation’s poverty (Swanstrom et al., 2004). Their share of single-person-households continues to grow (Frey and Berube, 2003), and they increasingly house seniors (Frey, 2003). Yet while many suburbs have essentially all of the elements that make a place urban, it is often arrayed in a form that differs enough from traditional cities to sustain the popular depiction of suburbia as home to wealthy white people. Researchers can document profound change, but the way suburbs have urbanized in a looser and more auto-dependent manner than cities means it may take some time until their true state registers in the popular culture.3 But real estate professionals, developers, and planners must recognize the new suburban reality right now. The problem is that we must tackle 2025 planning problems with a 1975 model of suburban geography. We hope that this study can help re-image the suburbs in the minds of experts. The new metropolis is urban in function, but not in form (Fishman 1990, Lang 2003). It has all the elements of traditional urban areas, but they are assembled in a way that appears suburban. There is a mixture of land uses, but almost never at a fine enough grain to encourage pedestrians. As the new metropolis evolves, making the mixed-use pieces better fit together is a holy grail for the smart growth and New Urbanism movements (Duany et al 2000). Some places, including several cases highlighted below, will become more walkable. But the question remains whether these pedestrian-friendly environments will be islands of urbanity in a sea of sprawl or the dominant suburban form.
2 The U.S. Census Bureau provides no official definition for a “suburb.” Those who use the term have conventionally assumed that suburbs comprise the portions of metropolitan areas that lie outside central cities (Katz and Lang, 2003). 3 Witness the Fox Network TV show “The OC,” which depicts the now half minority Orange County, CA as essentially all white.

February 2006 4
For the moment, the new metropolis is mostly low-to-mid density, automobile dependent, and dispersed. It may have large-scale Edge Cities (Garreau 1991), but more often it contains smaller and more sprawling Edgeless Cities (Ding et al 2000, Gordon and Richardson 1996, Lang 2003, Pivo 1990). It is the America of the beltway, the shopping strip, the subdivision, the garden apartment, and the low-rise office cube. The new metropolis sprawls in so many complicated ways that it needs a “Field Guide” according to Hayden (2004). To Fishman (1987), the new metropolis (or his analogous “technoburb”) “lacks any definable borders, a center or a periphery, or clear distinctions between residential, industrial, or commercial zones” (p. 189). Fishman (1987) further notes that technoburbs spill over vast space and that they “can best be measured in counties rather than city blocks” (p. 203). The 13 Office Markets The study tracks office space in 13 large markets. The regions are located throughout the United States: six are in the Northeast and Midwest and seven are in the South and the West. The regions studied are: Atlanta, Boston, Chicago, Dallas, Denver, Detroit, Houston, Los Angeles, Miami, New York, Philadelphia, San Francisco, and Washington, DC. The offices documented in Edgeless Cities are leased multi-tenanted buildings that exclude other such major employment facilities as government offices, warehouses, flex space (offices combined with light manufacturing), hospitals, and universities. The analysis did not include small office buildings, but instead zeros in on the type of office buildings almost exclusively found in large commercial centers and that house businesses such as advertising and finance. Together these 13 regions have over 88 million residents, representing 30 percent of the US population. Why Follow Office Space? Following office space trends provides a good method for understanding metropolitan change because offices are where a large percentage of job growth occurs. In some metropolitan areas, nearly half of all newly hired employees go to work in office buildings (Bureau of Labor Statistics 2003). Office buildings were the last major element of central cities to suburbanize, following residences and retail (Leinberger 1996; Muller 1980). The rapid growth of suburban office development is so significant a trend, that it sparked a series of books and articles in the late 1980s and early 1990s that sought to explain how it reshaped the American metropolis (Baldassare 1986; Bruegmann and Davis 1992; Cervero 1986, 1989; Erickson 1985; Fishman 1987, 1990; Fulton 1986; Garreau 1991; Hartshorn and Muller 1986, 1989; Leinberger and Lockwood 1986; Pivo 1990; Romanos, Chifos and Fenner 1989). Some understood the meaning of this trend as early as the 1970s (Breckenfeld 1972; Greenhouse 1971; Herbers 1971; Kneeland 1971; Vance 1977).

February 2006 5
The location of office space is critical in a number of public policy areas. For example, the distribution of new office space can help determine the extent to which there is a jobs/housing mismatch in a region (Cervero 1986). It can also influence the spatial mismatch between economic opportunity and the concentration of minority households (Kain 1991). Office location also impacts urban sprawl. If most new office space is constructed at the regional edge, it extends commuter sheds for many miles into undeveloped rural areas and thereby fuels sprawl (Ding and Bingham 2000). Finally, the geography of office location figures prominently in transportation analysis. If most new space is built in areas with no public transit access, then reliance on automobiles will continue to grow (Cervero 1989). While office data is an important indicator of metropolitan change, it cannot convey the whole picture. This study reports on only a portion of the white-collar employment (albeit a significant share) in 13 of the nation's largest metropolitan areas. While retail space is not specifically tracked, the presence or absence of large regional malls amid office development was noted. Mapping the distribution of office space helps identify new submarkets. Most commercial real estate firms have delineated office markets; however, most still are unsystematically derived from traditional categories. The metropolitan submarkets many real estate firms use in their research often reflect local convention and typically mix edge cities and edgeless cities together. Given that suburban property is now the target of most real estate investment, it makes sense to have updated categories to gauge suburban investment opportunities. The only current market indicator that separates types of non-CBD office development is the Urban Land Institute’s “Suburban High-Rise and Low-Rise Office Rent Forecasts.” The Meaning of Downtowns, Edge Cities, and Edgeless Cities Charting the new metropolis is not simply a geographic exercise. There is significance in how office space is arrayed. One longstanding concern is the loss of office space from downtown to the suburbs and the role that this shift plays in promoting a more decentralized metropolis (Muller 1980, 1981, Hartshorn and Muller 1986, 1989). Advocates and critics of edge cities have long battled over what their emergence means for the future of the city (Garreau 1991, Barnett 1992, Peirce 1991). But more recently even some critics of the suburbs accept a polycentric urban form (i.e., many nodes), as evidenced by the theme of the 2005 Congress for New Urbanism (CNU) annual meeting on the “polycentric city.”4 But Lang (2003a, 2003b) shows that office development in many places can be more accurately described as “post-polycentric,” (i.e., no longer falling into defined nodes; scattered).5 4 The meeting was held in June 2005 in Pasadena, CA. In the 2000 version of its “Charter,” the CNU described edge cities as “a term which (sic) implies urbanism but is in fact only a statistical agglomeration of housing, subdivisions, shopping centers, and office parks.” 5Descriptions of post-polycentric urban form have an extensive literature. For example, see Lessiner (1962), Lewis (1983, 1995), Lynch (1961), Pressman (1985), and Webber (1967).

February 2006 6
A key assumption made by both sides in the edge city debate is that size—meaning a large concentration of office and retail space—is a prerequisite for city building (Bruegmann and Davis 1992, Cevero 1989, Garreau 1991, Goldberger 1987). The minimum for edge cities, established by real estate analyst Chris Leinberger (1988, 1996, 1998) has been 5 million square feet of office space and 600,000 in retail in a mostly cohesive cluster. Garreau (1991) popularized these criteria, and this definition has taken hold in the literature. In fact, Lang (2003) and this study use the same criterion for an edge city based on just office space. But the edge city requirements are hardly definitive, and more importantly they may be deceptive and needlessly discouraging. Only in a limited number of places outside a downtown do the elements of a full-rigged edge city actually come together. Lang estimated in Edgeless Cities that the amount of office space that lies in a true office/retail-defined edge city is well under 5 percent of all space nationwide. Yet, that is not necessarily reason for the CNU and others to despair. Commercial clusters in the suburbs may require much less office and retail space to actually function as urban places. In fact, the smaller scale may also help office and retail mix more successfully with residential development. This study explores the issue of making urban situated edgeless cities more traditional city-like environments. This includes some data and case analyses of the conditions that foster this outcome. The New Office Geography The subtitle of Lang’s 2003 book was “exploring the elusive metropolis.” In this study the elusive metropolis becomes far better known–and better mapped. Lang developed four basic categories to depict office location: downtowns, secondary downtowns, edge cities, and edgeless cities. We now add several subtypes to the mix. Downtowns and secondary downtowns are supplemented with an “urban envelope” category that captures the zone of office development that does not quite fit in downtown, but lies nearby. Edge cities also feature a subtype—the “corridor,” which captures offices that line freeways. Finally, edgeless cities now come in three sub-varieties—high, medium, and low density, depending on the intensity of adjacent residential development. The illustration below shows the spatial differences among (left to right) downtowns, secondary downtowns, Edge Cities, and Edgeless Cities that Lang developed in 2003:

February 2006 7
Illustration 1. The table below compares the office location categories between Lang 2003 and this current study: Table 1.
Comparing Office Location Categories Office Location Lang 2003 Current Study Downtowns Primary Downtown Downtown Secondary Downtown Secondary Downtown Urban Envelope Edge Cities Edge City Edge City Corridor Edgeless City Edgeless City Edgeless City Urban Suburban Exurban Note: Lang (2003) typology is from Edgeless Cities.
The four categories developed by Lang in Edgeless Cities were tested using spatial analysis. The categories mostly accounted for the office space in the 13 markets, but needed some adjustment. The important additions are the edge city corridors and downtown urban envelopes. In both the downtown and edge city categories, office

February 2006 8
development spilled out of the clusters and needed to be classified in a new way. This space does not belong in an edgeless city, but lies proximate to large clusters. Downtowns Downtowns can be found throughout older parts of metropolitan areas. The “primary downtown,” or Central Business District (CBD), lies at the center of the region and is the original site of significant commercial development. In some cases, such as Manhattan, the CBD may be split between an original downtown and a midtown that emerged in the 20th century. In such instances, the two downtowns are combined into one general primary downtown. What are referred to here as “secondary downtowns,” form the centers of major suburbs and uptowns within a central city, that developed a relatively modest, though focused, commercial center early in the 20th century. Secondary downtowns are scaled-down, slightly less dense version of primary downtowns. They have their origin in the streetcar and early auto era and as such support some pedestrian presence. Urban Envelopes Urban envelopes ring downtown. In some regions these form a tight band of space that only slightly extends the downtown office market. In other places the envelope makes a wide circle around the core that takes in much of the principal city and some close in suburbs. Several metropolitan areas exhibit no urban envelope, which is to say that office development falls neatly in a downtown with no spillover. The residential areas that lie within urban envelopes are densely populated—often with over 5,000 people per square mile. The term “urban envelope” is now most commonly used in Canadian planning circles and typically referees to the residential areas that surround downtown. But it has its origins in 1960s and early 1970s “factorial ecology” analysis (Berry and Horton 1970), which created a typology for all urban neighborhoods using multivariate methods. Urban envelopes are specifically defined in this study as being contiguous to primary downtowns extending outward to edge city office space densities averaging 2 million square feet per square mile. Edge Cities Edge cities have a specific definition that appears in the literature on suburban office development. Joel Garreau first used the term “edge city” in his 1991 publication Edge City: Life on the New Frontier. While Garreau developed a unique term, real estate consultant Christopher Leinberger (1984) earlier used the same criteria to identify what he referred to as “urban villages.” Because Garreau uses Leinberger’s criteria for his own research, this study draws on both their descriptions for a common definition for edge Cities. Edge cities as defined by Garreau (1991: 6-7) are places that:

February 2006 9
• Have 5 million square feet or more of office space. • Have 600,000 square feet or more of retail space. • Have more jobs than bedrooms. • Are perceived by the population as one place. • Were nothing like a “city” as recently as thirty years ago. Garreau asserts that edge cities are dense relative to their suburban surroundings. Leinberger also emphasizes density when describing urban villages. He depicts urban villages as: “business, retail and entertainment focal points amid a low-density cityscape,” adding that “each Urban Village has a core—a kind of new downtown—where the buildings are the tallest, the daytime population largest, and the traffic congestion the most severe” (Leinberger and Lockwood 1986: 43). The number of edge cities varies per metropolitan areas, with larger office markets typically containing several. In this study, we define edge cities as non-CBD clusters with 5 million square feet (with some exceptions) of office space. Edge City Corridors Edge city corridors have long been noted in the literature (Baerwald 1982, Sternlieb and Hughes 1988). Not every region featured these corridors. We technically define corridors for the purposes of this study as linear clusters usually following major transportation routes (highways or major arterials), averaging edge city office densities, and also being anchored by one or more secondary downtowns or edge cities. Edgeless Cities Edgeless cities, along with edge cities, identify a major subset of non-CBD office space. Edgeless cities, as the term implies, lack a well-defined boundary or edge. Edgeless cities extend over tens, if not hundreds of square miles of urban space. Individual components of edgeless cities often have an identity (as “so-and-so” office park), but collectively these places seldom strike a casual observer as unified in any meaningful way. Thus, unlike edge cities, edgeless cities are not perceived as one place. Edgeless cities scatter far and wide around the region. Some ring the metropolitan edge, while others lie between edge cities, or cover the outskirts of cities. Edgeless cities are more diffuse, less glamorous cousins of Edge Cities. To say edgeless cities are cities refers to function and not form. They possess all of the elements of a city but are structured in a way that few would recognize as a city. In this study, edgeless cities are specifically defined as the balance of a metro region’s office space outside of primary downtowns, secondary downtowns, urban envelopes, edge cities, and corridors. The table below summarizes the characteristics of all six categories of office location that are used in this study:

February 2006 10
Table 2 Metropolitan Form Characteristics Category Scale Office Density Basic Units Boundary Downtown A Mile or a Few
Square Miles Very High to High City Blocks Sharp, Well
Delineated Secondary Downtown
A Mile or a Few Square Miles
High to Medium City Blocks Mostly Well Delineated, but some Soft Edge
Urban Envelope
A Mile up to Dozens of Square Miles
Low Neighborhoods Fuzzy, but with a Recognizable Edge
Edge City
Several Square Miles
Medium to Low Freeway Interchanges
Fuzzy, but with a Recognizable Edge
Corridor
Several to Dozens of Square Miles
Low Freeway Frontage Road
Fuzzy, but with a Recognizable Edge
Edgeless Cities
Tens or Even Hundreds of Square Miles
Very Low Municipalities or Counties
Indeterminate, Very Hard to Delineate
Methods Mapping Methods Density maps were created within a GIS to identify the clustering of office space in the 13 selected metropolitan areas. To do this, office building locations were first geocoded (address-matched) using street address information obtained from Black’s Guide. Address-matching was performed using Tele Atlas Geocoding Server (see http://www.geocode.com/), an on-line batch geocoding service. After geocoding the office buildings information as point locations, density maps were generated for each of the 13 metros. Density maps represent point data as continuous value surfaces which show the distribution of office space such that areas of high concentration (i.e., density) appear as clusters relative to the entire metro region. The density maps were then converted to contour maps with isolines of office density delineating office concentrations at predefined thresholds. For our analysis, thresholds were as follows: Primary downtowns are distinct clusters central to a metro region that have office space densities averaging 7.5 million square feet per square mile. Office space numbers did not cluster above this amount in downtown Miami and Detroit, but because downtowns do indeed exist in these places, an exception was made and they were counted as downtowns. In the case of New York, Black’s Guide did not provide complete data for Manhattan, so a raw number for Class A and B office space was provided from Collier’s February 2005 estimates.

February 2006 11
Secondary downtowns are office clusters geographically distinct from primary downtowns that have office space densities averaging 3.5 millions square feet per square mile. Edge cities are office clusters geographically distinct from primary or secondary downtowns averaging office space densities of 2 million square feet per square mile. Urban envelopes are contiguous to primary downtowns extending outward to edge city office space densities averaging 2 million square feet per square mile Corridors are linear clusters usually following major transportation routes (highways or major arterials), averaging edge city office densities, and also being anchored by one or more secondary downtown or edge city. Office corridors exist in Washington, DC (along I-270 and the Dulles toll road), Dallas (from the primary downtown to the secondary downtown to the north), Houston (along the Katy Freeway) and Los Angeles (along Wilshire Blvd). Edgeless cities are the balance of metro regions outside of primary downtowns, secondary downtowns, urban envelopes, edge cities, and corridors. Edgeless cities had office densities averaging approximately 20,000 square feet per square mile. New York and Los Angeles had the highest densities (greater than 30,000 square feet per square mile) while Dallas and Denver had the lowest (less than 7,000 square feet per square mile). These areas do not cluster and therefore are not indicated on the maps. Data Source This study’s data source is Black’s Guide to Office Leasing, a directory of office space published by a company based in Gaithersburg, Maryland. Black’s Guide lists buildings by address and those 15,000 square feet or more that are identified as existing, under construction, or proposed. Black’s Guide surveys even the smallest suburban office markets, making it possible to compare data across regions. Buildings are listed in the publication at no cost to owners or developers, and the guide is distributed free to companies and institutions involved in office leasing. Black’s Guide lists A, B, and some C class office space. The offices surveyed in this the study are leased multi-tenanted buildings that exclude such other major employment facilities as government offices, warehouses, flex space (offices combined with light manufacturing), hospitals, and universities. The analysis does not include small office buildings, but office buildings that used to be exclusively found in large commercial centers and housed businesses such as advertising and finance. Urban Form/Street Grid Indicator To compare the urban context of office space clusters we used an indicator of street network “griddedness” in which each cluster was situated. We derived our indicator from an analysis of street intersection spacing, estimating the degree to which the spacing of

February 2006 12
intersections had a regularized pattern (having little variation) or randomized pattern (having high variation). Gridded street networks are characterized by a pattern of consistent spacing as in the case of traditional downtowns versus inconsistent spacing as in the case of typical suburban office campuses6. Office Density Measure This measure is for all office development above the edgeless cities threshold. It shows the amount of office space per square mile in a zone of contiguous development. The highest office density measures are in the downtowns, which generally have several million square feet of office space per square mile. Secondary downtowns and most edge cities maintain at least a million square feet of office space per square mile, except in corridors where the density figures are generally lower. Urban envelopes generally have less density, but edgeless cities exhibit by far the lowest office density, often dropping below 20,000 feet per square mile. Residential Density Measure Residential density was calculated for all office locations in the study. As expected, downtowns, secondary downtowns, and urban envelopes maintained the highest density. The residential density in edge cities varied considerably between regions, and even between individual locations within the same metropolitan area. The residential density measure most importantly applies to edgeless cities and was developed to show the context for dispersed office development. Lang (2003) notes that many regions that maintained a high share of edgeless city office space, such as Miami, also feature an overall densely built environment characterized by high population density (Lang 2002, Galster et al 2001). Thus office space could be scattered, but fit into a relatively dense urban fabric. That also means that this office space could conceivably anchor mixed-use developments at a sub-edge city threshold. The calculations of population density for edgeless cities are done at the census track level using estimated population data for 2004. The breakpoints in the population densities are based on a geography developed by Nelson and Sanchez (2005) to track land use change and settlement patterns in the nation’s fifty largest metropolitan areas. Nelson and Sanchez determined that 3,000 people per square mile—or three times the population density of the census’s “urbanized area” measure is sufficiently dense to support urban services, and is thus “urban.” For example, light rail projects are viable at this threshold. Note that much of the area that qualifies as urban in this study is actually
6 Our analysis utilized the “average nearest neighbor” function within ArcGIS 9.0. The nearest neighbor index is the ratio of the observed distance (intersection spacing) divided by the expected distance. (hypothetical random distribution). The index is less than one when the pattern exhibits clustering and greater than one when the trend is toward dispersion.

February 2006 13
suburbs (or in census definition terms in areas “outside primary cities.”). Lang et al (2005) show that many of these areas essentially function as cities, despite being labeled suburban. An example of an area that exceeds 3,000 is the eastern half of Fairfax County, Virginia along the Washington Beltway. Land pressures in such built up, and often built out, older suburbs are changing the pattern of land development resulting in a greater share of high density multifamily housing. Such housing, mixed with office and retail, especially when combined with light rail (as in the north side of the Dallas metro) represents, as we argue, a nascent and small scale form of urbanity. Edgeless city office space that lies in residential areas that have from 1,000 to 3,000 people per square mile, are labeled “suburban” in this study. This density range still represents a moderately intense development level, especially compared to still developing parts of the metropolitan edge. Yet most housing developments in this range are comprised of single-family detached dwellings. As noted above, the census uses the 1,000 person per square mile threshold as the basis for its urbanized measure. There are region in this study, such as Los Angeles and Miami, where virtually the entire population lives at greater density than the urbanized minimum (Lang 2002). Other metropolitan areas, especially Atlanta, have a significant share of people residing outside the urbanized zone. Edgeless city office development found within suburbs as defined by this study, are not likely to anchor small urban islands as is possible at higher residential density. Finally, edgeless city offices found in places having less than 1,000 residents per square mile fall in the “exurbs.” Fulton (1986) dubbed such developments “the office in the dell.” Edgeless cities on the suburban fringe sit amid large lot subdivisions and agricultural lands. Not only is there no prospect for establishing an urban feel in these office environments, they may further extend decentralized development by extending commuter sheds deep into rural areas. Data and Analysis: National Summary The 13 markets in this study contain over 3 billion square feet of office space. Downtowns maintain close to a billion square feet of this space. Their urban envelopes grab over 150 million additional square feet, while secondary downtowns add another 33.5 million square feet. Edge cities have a total of 376 million square feet of office space, with corridors an extra 108 million. Edgeless cities have a massive 1.2 billion square feet of office space, with about half at “urban” residential densities. Thus about 600 million square feet of office space lies in low-density suburbs and exurbs. As Table 3 illustrates, edgeless cities account for almost 40 percent of the total office space in this survey. Downtowns follow with nearly 33 percent of space, while edge cities have just over 14 percent. The remaining office space falls into three minor categories: urban envelopes, corridors, and secondary downtowns. These places hold 5.1, 3.9, and 4.4 percent of all office space respectively. In total there are 13 downtowns, 12 secondary downtowns, eight urban envelopes, 41 edge cities, and five corridors among the 13 metropolitan areas in this study.

February 2006 14
Table 3. Total Distribution of Office Space in Thirteen Metropolitan Areas, 2005
In Lang’s 2003 book (based on 1999 data), downtowns maintained the largest share of office space, with 38 percent of the total (Table 4). Edgeless cities followed close behind with 37 percent. Edge cities contained a fifth of the space in the nation’s major office markets. Secondary downtowns comprised the smallest share of the region with just 6 percent of office space. The study identified 13 primary downtowns, 23 secondary downtowns, 58 edge cities, with all other space counted as edgeless cities (This report studied the same markets as the 2003 publication). Table 4. Comparison of 1999 and 2005 data.
Comparison of 1999 and 2005 data
Location 1999 2005 Difference Percent ChangeDowntowns 1,175,546,637 1,112,326,898 -63,219,739 -5.4%Primary 1,013,603,948 981,167,601 -32,436,347 -3.2%Secondary 161,942,689 131,159,297 -30,783,392 -19.0%Urban Envelope 0 153,788,481 153,788,481Edge City 532,944,733 423,975,978 -108,968,755 -20.4%Corridor 0 116,832,371 116,832,371Edgeless City 980,993,488 1,196,557,572 215,564,084 22.0%
Urban 0 617,202,152Suburban 0 418,461,925Exurban 0 148,587,938
TOTAL 2,689,484,858 3,003,481,300 313,996,442 11.7% Downtown, Secondary Downtowns, and Urban Envelopes The New York and Chicago metropolitan areas have by far the biggest downtowns, and the largest share of their regional space located in central business districts (Table 5). The third largest downtown is in Los Angeles, a city that is often derided for lacking a center. The smallest downtowns are found in Detroit and Miami. Atlanta technically has the smallest downtown, but that result is due in part to a statistical artifact of our method. Atlanta has one dense cluster at the core of its central business district that our GIS analysis determined to be its “downtown.” But in fact, a string of quasi-downtown spaces extend through Atlanta’s urban envelope, reaching all the way north to the upscale Buckhead district. By contrast, the downtowns in Detroit and Miami more accurately reflect the actual space in the central business district.
Total Distribution of Office Space in Thirteen Metropolitan Areas, 2005Location Square Feet PercentDowntowns 981,167,601 32.7%Urban Envelope 153,788,481 5.1%Secondary Downtowns 131,159,297 4.4%Edge Cities 423,975,978 14.1%Corridors 116,832,371 3.9%Edgeless Cities 1,196,557,572 39.8%
Urban 617,202,152 51.6%Suburban 418,461,925 35.0%Exurban 148,587,938 12.4%
TOTAL 3,003,481,300

February 2006 15
Table 5. Summary of Office Space In Thirteen Metropolitan Areas, 2005.
Summary of Office Space in Thirteen Metropolitan Areas, 2005
Downtown Urban Envelope Secondary Downtown Edge City Corridor EdgelessMetropolitan Area Percent Percent Percent Percent Percent PercentAtlanta 6.7% 38.6% 0% 16.4% 0% 38.4%Boston 38.7% 4.6% 0% 6.7% 0% 50.1%Chicago 49.2% 0.8% 0% 10.7% 0% 39.4%Dallas 20.6% 0.0% 6.5% 17.3% 21.7% 33.9%Denver 27.3% 0.0% 0% 21.9% 0.0% 50.8%Detroit 17.2% 1.6% 0% 27.1% 0% 54.1%Houston 22.8% 3.3% 0% 33.9% 5.4% 34.7%Los Angeles 16.1% 0.0% 13.6% 15.6% 8.7% 46.0%Miami 8.7% 0.0% 5.0% 14.2% 0% 72.1%New York 54.5% 0.0% 6.8% 6.3% 0% 32.3%Philadelphia 29.6% 2.1% 4.0% 10.1% 0% 54.3%San Francisco 39.2% 0.3% 6.7% 14.4% 0% 39.4%Washington, DC 22.7% 18.4% 1.5% 23.3% 11.6% 24.0% Only four regions in this study have secondary downtowns. In Lang’s 2003 book, there were more secondary downtowns found, but in this analysis many of these places were determined to exist within the downtown urban envelope. Los Angeles and San Francisco have the most substantial secondary downtowns. Urban envelopes vary tremendously by region as noted above. The Atlanta and Washington regions have by far the largest urban envelopes, and account for the overwhelming proportion of this space found in the study. Five metropolitan areas lack an urban envelope altogether. The Washington, DC urban envelope encompasses much of the District, and extends into Arlington and Alexandria, VA. Arlington’s Wilson Corridor—with nodes at Rosslyn, Clarendon, Court House, and Ballston—falls within this zone. Old Town Alexandria, which has see a recent construction boom near the Eisenhower Avenue station on the Washington Metro, also forms part of DC’s urban envelope. Edge Cities and Corridors The biggest share of edge city office space is found in Detroit, followed by Washington DC and Dallas. Only three metropolitan areas in this survey had office corridors--Dallas and Washington having the biggest share of space in corridors. Washington has the most actual space located in both categories, with about 125 million square feet combined. New York and Boston have the lowest share of edge city space, with 6.7 percent and 4.8 percent respectively. As shown in both this study and in Lang 2003, Edge Cities are not that common in much of the Northeast and Midwest, with the notable exception being Detroit. Ranking the Edge Cities by size indicates that Washington, DC has three Edge Cities in the top 10.

February 2006 16
Table 6. Top 10 Edge Cities by Square Feet of Office Space
Edge City Square Feet Metro Area
1 Post Oak, TX 36,620,044 Houston
2 Tyson's Corner, VA 22,645,275 Washington, DC
3 Denver Tech Ctr/Greenwood Village, CO 21,270,124 Denver
4 Southfield, MI 19,692,739 Detroit
5 Greenspoint, TX 18,734,413 Houston
6 Cumberland, GA 17,377,134 Atlanta
7 Herndon/Reston, VA 17,279,291 Washington, DC
8 Chantilly/Dulles, VA 14,772,419 Washington, DC
9 John Wayne Airport/Southcoast, CA 14,771,546 Los Angeles
10 Irving/Las Colinas, TX 13,379,596 Dallas Note: Not including corridors Edgeless Cities While New York has the largest amount of square footage in edgeless city space, the biggest regional share of edgeless city office space is found in Miami. Washington, DC has the smallest share, which indicates the clustered nature of office development in the region. Table 7. Ranking of Edgeless Cities Space by Square Feet Ranking of Edgeless City Space by Square Feet
Location Square Feet Percent of Regional Office Space
New York 222,052,423 32.3%
Los Angeles 144,779,382 46.0%
Chicago 107,776,326 39.4%
Boston 101,051,915 50.1%
Philadelphia 98,260,477 54.3%
Washington, DC 86,113,714 24.0%
Miami 77,293,650 72.1%
San Francisco 68,790,444 39.4%
Atlanta 64,775,200 38.4%
Dallas 61,306,527 33.9%
Detroit 58,351,987 54.1%
Houston 56,679,390 34.7%
Denver 49,326,137 50.8%
TOTAL 1,196,557,572

February 2006 17
Nearest Neighbor As explained in the methods section, the nearest neighbor feature of GIS indicates how gridded and regularized a particular area’s street pattern is. Three examples are shown below: Highest – Manhattan
Ratio = 0.027 Middle – DC Dulles
Ratio = 0.285

February 2006 18
Lowest – Atlanta North Fulton
Ratio = 0.539 When all of the ratios are put together and ranked from highest to lowest, it is clear that the traditional downtowns are the highest, then the streetcar suburbs/secondary downtowns, followed by the automobile-era edge cities. This is not absolute—some secondary downtowns, such as Silver Spring, Maryland rank below edge cities, while some edge cities, such a Post Oak, are as gridded as traditional downtowns.

February 2006 19
Table 8. Ranking of Average Nearest Neighbor Ratios Ranking of Average Nearest Neighbor RatiosLocation Metro Nearest Neighbor
Manhattan New York 0.027Downtown Houston 0.030Downtown Miami 0.053Downtown Philadelphia 0.055Downtown Atlanta 0.055Downtown Chicago 0.057Downtown Washington, DC 0.062Downtown Los Angeles 0.066Downtown Dallas 0.066Post Oak Houston 0.070Secondary Downtown - West LA/Bev Hills/Santa Monica Los Angeles 0.074Secondary Downtown - Oakland San Francisco 0.075Downtown Boston 0.086Downtown Detroit 0.086Troy Detroit 0.086Downtown San Francisco 0.090Secondary Downtown - Wilmington, DE Philadelphia 0.093Secondary Downtown - Pasedena Los Angeles 0.094Downtown Denver 0.097Secondary Downtown - Brooklyn New York 0.099Secondary Downtown - Ft. Worth Dallas 0.108O'Hare Chicago 0.109Southbay/LAX Los Angeles 0.111Iriving/Las Colinas Dallas 0.114Secondary Downtwon - Glendale Los Angeles 0.114Santa Ana Los Angeles 0.116Secondary Downtown - Newark New York 0.116Secondary Downtown - Ft. Lauderdale Miami 0.119West Palm Beach Miami 0.121Corridor - LBJ Freeway Dallas 0.123Secondary Downtown - Jersey City New York 0.123Southfield Detroit 0.128Lombard Chicago 0.144Boca Raton Miami 0.147Schaumburg Chicago 0.155Woodland Hills Los Angeles 0.162Metro Park New York 0.167John Wayne Airport/Southcoast Los Angeles 0.172Cumberland Atlanta 0.173Duluth Atlanta 0.175Secondary Downtown - Silver Spring Washington, DC 0.175Lauderdale Lakes Miami 0.177Denver Tech Center Denver 0.179Secondary Downtown - Oaklawn Dallas 0.182Oakbrook Chicago 0.183Sherman Oaks Los Angeles 0.183Fremont San Francisco 0.193Fairfax Center Washington, DC 0.196King of Prussia Philadelphia 0.201White Plains New York 0.204I-78/I-287 New York 0.205Pleasanton San Francisco 0.211Greenspoint Houston 0.214Gaithersburg Washington, DC 0.214Morristown/Parsippany New York 0.222Tyson's Corner Washington, DC 0.233Leesburg Washington, DC 0.248Tinton Falls New York 0.261Herndon/Reston Washington, DC 0.265Rt. 128 Burlington Boston 0.266Paoli Philadelphia 0.270Chantilly/Dulles Washington, DC 0.285Walnut Creek San Francisco 0.288Rt. 128 Waltham Boston 0.304San Ramon San Francisco 0.323North Fulton Atlanta 0.539

February 2006 20
Data and Analysis: The 13 Regions Atlanta Table 9. Atlanta Metropolitan Office Space
• More than two-thirds of Atlanta’s edgeless cities are at suburban or exurban
densities. • Cumberland, an edge city, has 6 million more square feet of office space than
downtown Atlanta. • North Fulton has the most irregular street pattern in this study, which may prove
problematic if increasing built density or adding light rail.
Atlanta has the largest urban envelope of all 13 markets studied. The downtown core comprises a small defined area, but an extended downtown runs north along Peachtree Street (Atlanta’s Broadway) through Midtown and on to Buckhead. This dense urban core forms the heart of the Atlanta region. In this zone, office density runs from over 7 million square feet of office space per square mile in the downtown, to just over 1 million in the larger urban envelope. This area is also densely populated, with nearly 8,000 people per square mile in the downtown, and well over 3,000 in the urban envelope. Together the downtown and its urban envelope form the urban core of metropolitan Atlanta. But outside this core, Atlanta’s urban environments diminish considerably. More than two-thirds of the region’s edgeless city office space falls below the urban threshold. None of Atlanta’s census tracts that held edgeless city office space has population densities above 8,000 people per square mile—a number considered optimal for mass transit. However, most of it exists at suburban residential densities and only a small percentage exists at exurban densities. Atlanta may sprawl and prove too low density to implement more mass transit, but office development has not established itself very far into the region’s hinterlands. North Fulton, an edge city, has the highest nearest average neighbor value in the study, indicating a non-gridded street pattern and consequently a very low level of cohesiveness.
Metropolitan Atlanta Office Space, 2005 Average Residential
Area Density Nearest Density
Location Square Ft. Percent (sq mi) (OS/sq. mi) Neighbor (per sq. mi)
Downtowns 76,304,599 45.2% 63.06 1,210,032
Downtown 11,221,650 6.7% 1.57 7,147,548 0.055 7,963
Urban Envelope - Buckhead 65,082,949 38.6% 61.49 1,058,431 3,335
Edge Cities 27,660,523 16.4% 16.76 1,650,882
Cumberland 17,377,134 10.3% 15.79 1,100,515 0.173 2,170
Duluth 5,013,193 3.0% 0.97 5,195,019 0.175 1,995
North Fulton 5,270,196 3.1% 1.88 2,803,296 0.539 529
Edgeless Cities 64,775,200 38.4% 8,399.02 7,712
Urban 21,021,253 32.5% 3,000+
Suburban 37,629,923 58.1% 1,000-3,000
Exurban 6,124,024 9.5% <300-1,000
TOTAL 168,740,322 8,497.47 19,858

February 2006 21
The irregular street pattern could prove problematic if the area hopes to increase densities or add light rail access. Atlanta’s other two edge cities, Cumberland (ranks as the sixth largest edge city in this study and has 6 million square feet more office space than downtown Atlanta) and Duluth, have a higher levels of griddedness than North Fulton and are, in this respect, close to the average for edge cities in this study. Boston Table 10. Boston Metropolitan Office Space
• Most of Boston’s office space is in downtown or in low-density edgeless cities. • Boston has almost three times as much office space at low exurban densities than
Atlanta. • Boston’s two edge cities contain only 7 percent of the region’s office space.
When it comes to office space, Boston is a region of extremes. Its office space is concentrated mostly in its downtown or in its edgeless cities. Thirty-nine percent of its office space is located downtown, while over 50 percent exists in edgeless cites. And the vast majority—over 70 percent—of this space exists amongst low residential densities. Although Atlanta may be known for sprawl and Boston known for its compact, walkable neighborhoods, Boston has almost three times as much office space at low exurban densities than does Atlanta. This could be due to decades of high-tech office booms, whose client’s preferred large suburban campuses and build-to-suit space. Brookline and Cambridge, due to their contiguous location to downtown Boston, are included as part of the Urban Envelope rather than considered secondary downtowns. Despite the location of Harvard, MIT and associated commercial uses in this area, Boston’s Urban Envelope contains only 5 percent of the region’s office space. Boston’s two edge cities, Burlington and Waltham, lie along US 95/Rt. 128, Boston’s inner beltway. Despite being the home to many of Boston’s knowledge industries, these areas contain only 7 percent of the region’s office space. Like North Fulton outside of Atlanta, these two areas rank low on the nearest neighbor scale, which indicates very disparate street patterns. Downtown Boston, as one would expect from a traditional, pre-automobile city center, is very gridded and connected, while its post-automobile era edge
Metropolitan Boston Office Space, 2005 Average Residential
Area Density Nearest Density
Location Square Ft. Percent (sq mi) (OS/sq. mi) Neighbor (per sq. mi)
Downtowns 87,360,798 43.3% 43.61 2,003,137
Downtown 78,094,079 38.7% 12.41 6,291,821 0.086 12,111
Urban Envelope - Brookline/Cambridge 9,266,719 4.6% 31.20 297,010 11,609
Edge Cities 13,449,815 6.7% 10.15 1,325,105
Rt. 128 Burlington 4,861,823 2.4% 1.86 2,613,883 0.266 4,736
Rt. 128 Waltham 8,587,992 4.3% 8.29 1,035,946 0.304 1,767
Edgeless Cities 101,051,915 50.1% 3,564.84 28,347
Urban 29,497,871 29.2% 3,000+
Suburban 53,684,072 53.1% 1,000-3,000
Exurban 17,869,972 17.7% <300-1,000
TOTAL 201,862,528 3,618.60 55,785

February 2006 22
cities are so loose in their street patterns that infill or “suburban retro-fitting” may prove difficult. Chicago Table 11. Chicago Metropolitan Office Space Metropolitan Chicago Office Space, 2005 Average Residential
Area Density Nearest Density
Location Square Ft. Percent (sq mi) (OS/sq. mi) Neighbor (per sq. mi)
Downtown 136,633,955 49.9% 34.54 3,955,818
Downtown 134,533,476 49.2% 13.64 9,863,158 0.057 14,179
Urban Envelope 2,100,479 0.8% 20.90 100,501 14,626
Edge Cities 29,248,730 10.7% 18.12 1,614,168
Naperville 5,347,205 2.0% 1.79 2,993,956 0.144 2,014Oakbrook 4,615,041 1.7% 2.07 2,229,488 0.183 1,693
O'Hare 7,127,052 2.6% 5.16 1,381,212 0.109 2,480
Schaumburg 12,159,432 4.4% 9.10 1,336,201 0.155 2,665
Edgeless Cities 107,776,326 39.4% 7,250.25 14,865
Urban 47,405,330 44.0% 3,000+
Suburban 46,461,374 43.1% 1,000-3,000
Exurban 13,909,630 12.9% <300-1,000
TOTAL 273,659,011 7,321.03 37,380
• Chicago ranks second to New York City in the amount of downtown office space. • Like Boston, most of Chicago’s office space is located in downtown or in
edgeless cities. • Five percent of Chicago’s office space is at exurban densities.
Chicago’s downtown is second only to New York’s in the percentage of downtown office space it holds. Despite the emergence of sizeable edge cities, the downtown is still the focus of much of the region’s business trade. Also like New York, Chicago’s densely clustered neighborhoods have exploded with new businesses and housing over the last 10 years. Chicago is one of the few large cities in the United States to so strongly sustain its center. Chicago’s edge cities make up only 11 percent of the region’s office space. Its largest edge city is Schaumburg, with 12 million square feet of office space spread over 9 miles. The area surrounding O’Hare International airport also supports a significant amount of office space—7.1 million square feet. The clustering around these areas is, in part, due to the fact that both are served by the airport as well several major highways and suburban commuter rail. The same could be said of Oak Brook (with office space square footage coming in just under 5 million) and Naperville to the south. The edge city clusters have relatively well connected street patterns and fairly typical suburban office space and residential densities. This is evident by comparing downtown Chicago’s residential density—14,000 people per square mile—and Schaumburg’s relatively roomy 2,665 people per square mile. The non-CBD, non-clustering office space in metropolitan Chicago is almost 3 and a half times larger than the amount of office space in its edge cities and is the third largest amount of edgeless space among the 13 markets studied. Most of it is divided between urban and suburban residential densities. This means that office space is built near transit

February 2006 23
stops and in suburban downtowns (urban density) or located in suburban office campuses or along a highway (suburban densities). Thirteen percent of the edgeless office space lies in exurban areas—which is 5 percent of the area’s total office space and slightly more than the amount of space contained in Schaumburg. As Chicago’s suburbs continue to grow, NIMBYism may become more of a factor as residents seek to preserve the suburban idyll and work to limit the amount of new and/or denser commercial uses in these areas. Consequently, office uses may be pushed further out into the exurbs. Dallas Table 12. Dallas Metropolitan Office Space
• Dallas does not have a lot of edge cities, instead they have edge “city corridors”—
office space clustering along highways rather than at interchanges. • Although downtown Dallas is dense and has tightly gridded-street pattern, more
space lies along the North Dallas corridor • Most of Dallas’s office space lies in edge cities and most of that space is along
two corridors: the LBJ Freeway and the North Dallas tollway/Central Expressway.
Conventional wisdom would dictate that the Dallas-Ft. Worth metroplex would have a lot of big “Texan-sized” edge cities. However, this is not the case. When it comes to the number of traditional edge cities in Texas, Houston surpasses Dallas. What Dallas does have is large amounts of office space clustering along freeway corridors. Although corridors are classified as edge cities for the purposes of this study, they are really a new type of urban form all together. Traditional edge cities cluster up and around highway exit ramps, while corridor edge cities are a string of low-slung office buildings that stretch on for miles along a major roadway. In Texas, especially around Dallas, office development occurs along freeway corridors (Lang 2003). The freeway system features long stretches of frontage road running parallel to the highway, which has facilitated this type of growth. These roads function as local lanes to the freeway’s express lanes, allowing motorists to leave the freeway and drive along side it for miles (as people do at times to avoid traffic). In most of metropolitan America, a location at the intersection of a freeway and a major arterial road is a prime location for large-scale commercial
Metropolitan Dallas Office Space, 2005 Average Residential
Area Density Nearest Density
Location Square Ft. Percent (sq mi) (OS/sq. mi) Neighbor (per sq. mi)
Downtowns 48,931,282 27.1% 11.99 4,082,029
Downtown 37,204,314 20.6% 5.91 6,298,343 0.066 2,425
Secondary Downtown - Ft. Worth 6,776,820 3.7% 4.28 1,583,369 0.108 1,608
Secondary Downtown - Oaklawn 4,950,148 2.7% 1.80 2,750,082 0.182 773
Edge Cities 70,508,871 39.0% 104.37 675,573
Iriving/Las Colinas 13,379,596 7.4% 13.13 1,019,398 0.114 1,996
Corridor - LBJ Freeway 17,973,880 9.9% 12.67 1,418,169 0.123 4,252
North Dallas Corridor 39,155,395 21.7% 78.57 498,350 4,462
Edgeless Cities 61,306,527 33.9% 9,167.85 6,687
Urban 25,431,638 41.5% 3,000+
Suburban 26,672,457 43.5% 1,000-3,000
Exurban 9,202,532 15.0% <300-1,000
TOTAL 180,746,680 9,284.21

February 2006 24
development. The space along the highway between these intersections, however, is at a distinct disadvantage for edge city development because one would have to enter the local street system to access the space. But that is not the case in Texas. The frontage road is an adjunct to the highway; location along its length only slightly diminishes the access available at a major intersection. Along many stretches of the freeway network the frontage road functions as a quasi-extra lane and has multiple points of entry to the highway. Most of Dallas’s office space lies in edge cities and most of that space is along two corridors: the LBJ Freeway and the North Dallas tollway/Central Expressway. Frontage roads were not the only catalyst for office development around Dallas. The mid-1970s consolidation of Dallas and Ft. Worth’s airports into one large airport (DFW) created an explosion of office and business park development, with Las Colinas as a notable example. Las Colinas has over 21 million square feet of office space total7, 1.3 million square feet of retail and 25,000 residents. Interestingly, the residential densities along the North Dallas corridor and the LBJ freeway exceed those of downtown Dallas. Downtown Dallas has had a slight renaissance over the past 10 years through the addition of boutique housing and retail. The amount of office space in downtown Dallas is sizable, but more space actually lies along the North Dallas corridor. When it comes to office space density, downtown Dallas is as dense as Boston, Houston and Philadelphia. Downtown Dallas’s street pattern is as gridded as that of Los Angeles and slightly less so than downtown Washington, DC. Oaklawn, breaks away from downtown Dallas and is considered a secondary downtown (rather than part of the Urban Envelope) as is Ft. Worth. Both these areas contain only 6 percent of the regions office space. Like Chicago, Dallas’s edgeless office space is split between urban and suburban residential densities, with over 10 percent in exurban areas. Previously, Lang (2003) found that edgeless cities contained the newest office space in metropolitan Dallas and that they may be gaining on its edge cities. As the Dallas suburbs leap frog out, past Plano to places like Frisco, office space may find itself constrained by residential development. The Dallas suburbs fiercely compete with each other and the newer exurban suburbs often have the advantages. Newer suburbs have lured business from older suburbs by promising tax breaks and land deals; thus succeeding in pushing office development towards the metropolitan fringes.
7 Black’s Guide indicates 13 million square feet of leasable space for both Irving and Las Colinas. It does not take into account owner occupied space, which would add millions of more square feet.

February 2006 25
Denver Table 13. Denver Metropolitan Office Space
Metropolitan Denver Office Space, 2005 Average Residential
Area Density Nearest Density
Location Square Ft. Percent (sq mi) (OS/sq. mi) Neighbor (per sq. mi)
Downtown 26,509,449 27.3% 3.41 7,783,162 0.097 6,684
Edge City - Denver Tech Ctr/Greenwood Village 21,270,124 21.9% 9.08 2,342,525 0.179 2,029
Edgeless Cities 49,326,137 50.8% 8,374.71 5,890
Urban 36,072,345 73.1% 3,000+
Suburban 11,155,608 22.6% 1,000-3,000
Exurban 2,098,184 4.3% <300-1,000
TOTAL 97,105,710 8,387.20 11,578
• Denver, like Boston, has just over 50 percent of its office space in edgeless cities. • Denver has only one edge city. • Denver is second only to Los Angeles in edgeless office space at urban densities
and has the least amount of edgeless space at exurban residential densities. Denver, like Boston, has just over 50 percent of its office space in edgeless cities. However, unlike Boston, it has less office space in its downtown (27 percent) and more in its one edge city (22 percent). Although Denver has only one edge city, Denver Tech Center/Greenwood Village, it is the third largest in this study (excluding corridors). Its 21 million square feet, mostly dedicated to high-tech uses, clusters in 9 square miles around US I-25 and has an average, suburban street pattern—neither hopelessly diffuse nor regularized. Downtown Denver, the smallest in square mileage of the thirteen markets, contains almost 27 million square feet of office space. It experienced renewed interest in residential uses, especially in LoDo, but its office market has remained relatively cool over the past four years. Despite being an older, traditionally planned city, Denver has the least regularized street pattern of all of the primary downtowns. Although built on a grid system, the spaces between blocks and the intensity of uses is much lower than Chicago, Philadelphia and Houston. Most of Denver’s edgeless cities growth is south of the downtown and located in urban residential densities. Denver is second only to Los Angeles in the amount of edgeless office space in urban densities and has the least amount of edgeless space in exurban residential densities. This situation could remain the same into the future as residential and commercial densities will most likely increase, especially around new light rail stations that will be built under the recent, voter approved $4.7 FasTracks mass transit project. When the project is completed in 2017, trains are expected to take an estimated 150,000 commuters a day into and out of downtown. Plans for FasTracks include at least six new light-rail and commuter-rail lines, which could create development and redevelopment of several new mixed-use hubs along its path. Much like some of the inner suburbs of Washington, DC and Dallas, Denver’s suburbs have welcomed transit-oriented development.

February 2006 26
Detroit Table 14. Detroit Metropolitan Office Space
Metropolitan Detroit Office Space, 2005 Average Residential
Area Density Nearest Density
Location Square Ft. Percent (sq mi) (OS/sq. mi) Neighbor (per sq. mi)
Downtowns 20,296,332 18.8% 14.93 3,816,393
Downtown 18,565,739 17.2% 5.10 3,640,341 0.086 4,443
Urban Envelope 1,730,593 1.6% 9.83 176,052 3,894
Edge Cities 29,289,930 27.1% 27.74 1,055,950
Southfield 19,692,739 18.2% 16.74 1,176,529 0.128 2,976
Troy 9,597,191 8.9% 11.00 872,472 0.086 2,498
Edgeless Cities 58,351,987 54.1% 3,909.85 14,819
Urban 19,165,509 32.8% 3,000+
Suburban 27,078,680 46.4% 1,000-3,000
Exurban 12,107,798 20.7% <300-1,000
TOTAL 107,938,249 3,980.26 27,118
• Southfield exceeds downtown in the amount of leaseable office space. • Detroit’s amount of edgeless city space is almost 3 times bigger than the office
space located in the core. • Detroit’s market has the lowest percentage of office space at urban residential
densities. Detroit has the Big Three—General Motors, Ford and Daimler Chrysler and it also has another big three when it comes to office space: Downtown, Southfield and Troy, the three office clusters that dominate the Detroit area. Southfield is one of three suburban areas in this study that actually exceed its downtown in office space.8 Historically, Detroit has been known for racial problems and white flight. Following the urban riots of the 1960s, many businesses and people left the city for its suburbs, reducing its population by half. The region’s suburban/urban split is perhaps the starkest in the nation, and many suburban residents do not treat Detroit as the center of the region. The region’s suburbanites instead have supported the emergence of large edge cities. Detroit, like Denver, is a relatively small office market, but has an edge city (Southfield) that ranks in the top 10. Its edge cities, along with the edgeless city space, make up over 84 percent of the region’s office market. Detroit can be thought of as having a “dispersed” metropolitan form due to the fact that its edgeless city space is almost three times bigger than the office space located in the core. Not surprisingly, most of Detroit’s edgeless cities are located in suburban residential densities and Detroit has the lowest percentage of office space at urban residential densities. Although downtown Detroit has almost twice the residential density and four times the office space density of its edge city Troy, they have the same nearest neighbor ratio of .086, indicating a similar cohesiveness.
8 Cumberland, outside of Atlanta, and the North Dallas corridor also exceed their downtowns in square footage of office space.
February 2006 27
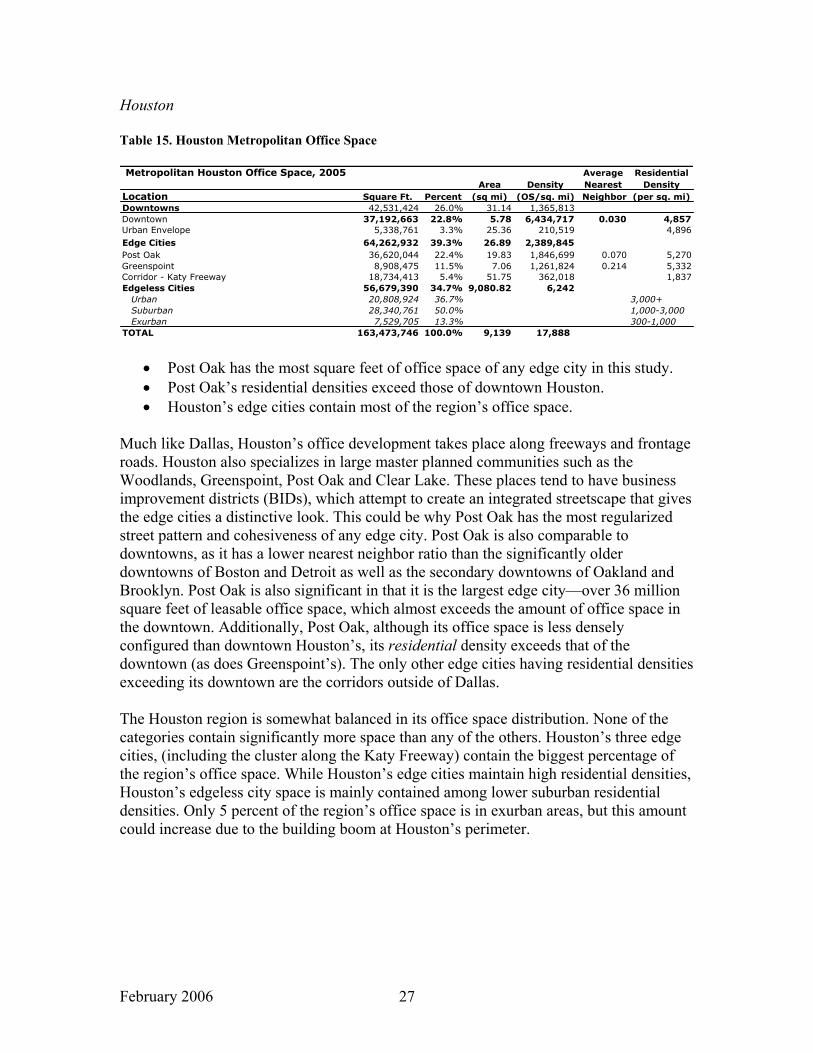
Houston Table 15. Houston Metropolitan Office Space Metropolitan Houston Office Space, 2005 Average Residential
Area Density Nearest DensityLocation Square Ft. Percent (sq mi) (OS/sq. mi) Neighbor (per sq. mi)Downtowns 42,531,424 26.0% 31.14 1,365,813Downtown 37,192,663 22.8% 5.78 6,434,717 0.030 4,857Urban Envelope 5,338,761 3.3% 25.36 210,519 4,896Edge Cities 64,262,932 39.3% 26.89 2,389,845Post Oak 36,620,044 22.4% 19.83 1,846,699 0.070 5,270Greenspoint 8,908,475 11.5% 7.06 1,261,824 0.214 5,332Corridor - Katy Freeway 18,734,413 5.4% 51.75 362,018 1,837Edgeless Cities 56,679,390 34.7% 9,080.82 6,242
Urban 20,808,924 36.7% 3,000+Suburban 28,340,761 50.0% 1,000-3,000Exurban 7,529,705 13.3% 300-1,000
TOTAL 163,473,746 100.0% 9,139 17,888
• Post Oak has the most square feet of office space of any edge city in this study. • Post Oak’s residential densities exceed those of downtown Houston. • Houston’s edge cities contain most of the region’s office space.
Much like Dallas, Houston’s office development takes place along freeways and frontage roads. Houston also specializes in large master planned communities such as the Woodlands, Greenspoint, Post Oak and Clear Lake. These places tend to have business improvement districts (BIDs), which attempt to create an integrated streetscape that gives the edge cities a distinctive look. This could be why Post Oak has the most regularized street pattern and cohesiveness of any edge city. Post Oak is also comparable to downtowns, as it has a lower nearest neighbor ratio than the significantly older downtowns of Boston and Detroit as well as the secondary downtowns of Oakland and Brooklyn. Post Oak is also significant in that it is the largest edge city—over 36 million square feet of leasable office space, which almost exceeds the amount of office space in the downtown. Additionally, Post Oak, although its office space is less densely configured than downtown Houston’s, its residential density exceeds that of the downtown (as does Greenspoint’s). The only other edge cities having residential densities exceeding its downtown are the corridors outside of Dallas. The Houston region is somewhat balanced in its office space distribution. None of the categories contain significantly more space than any of the others. Houston’s three edge cities, (including the cluster along the Katy Freeway) contain the biggest percentage of the region’s office space. While Houston’s edge cities maintain high residential densities, Houston’s edgeless city space is mainly contained among lower suburban residential densities. Only 5 percent of the region’s office space is in exurban areas, but this amount could increase due to the building boom at Houston’s perimeter.

February 2006 28
Los Angeles Table 16. Los Angeles Metropolitan Office Space Metropolitan Los Angeles Office Space, 2005 Average Residential
Area Density Nearest DensityLocation Square Ft. Percent (sq mi) (OS/sq. mi) Neighbor (per sq. mi)Downtowns 93,779,455 29.8% 34.57 2,712,662
Downtown 50,838,105 16.1% 11.26 4,516,534 0.066 14,718Secondary Downtown - West LA/Bev Hills/Santa Monica 31,417,983 10.0% 16.39 1,917,484 0.074 8,673Secondary Downtwon - Glendale 5,717,284 1.8% 2.77 2,064,001 0.114 15,968Secondary Downtown - Pasedena 5,806,083 1.8% 4.16 1,395,693 0.094 8,311
Edge Cities 76,419,308 24.3% 109.72 696,481John Wayne Airport/Southcoast 14,771,546 4.7% 6.68 2,210,647 0.172 2,475Woodland Hills 7,945,879 2.5% 6.03 1,317,725 0.162 5,150Sherman Oaks 5,460,843 1.7% 3.50 1,560,241 0.183 3,343Southbay/LAX 11,539,848 3.7% 10.66 1,082,537 0.111 3,548Santa Ana 9,370,206 3.0% 8.72 1,074,565 0.116 9,559Corridor - Wilshire/Santa Monica Blvd 27,330,986 8.7% 74.13 368,690 11,009
Edgeless Cities 144,779,382 46.0% 4,740.84 30,539Urban 115,986,351 80.1% 3,000+Suburban 14,810,235 10.2% 1,000-3,000Exurban 13,982,796 9.7% 300-1,000
TOTAL 314,978,145 4,885.13 64,477
• The LA basin contains a significant share of the region’s office space, but most of the office development has taken place in non-clustering, edgeless areas.
• Downtown Los Angeles, along with West Los Angeles, has more square footage than any of its edge cities.
• Most (80 percent) of Los Angeles’ edgeless cities space is located in urban densities.
Los Angeles is a big, complex, and dispersed, yet dense region. It is really several regions, or what James Vance calls “urban realms,” folded into one.9 The realms bump up against one another and may even overlap somewhat, but their cores are largely autonomous. Orange County, south of Los Angeles, constitutes one of the region’s realms. Others include the Inland Empire, anchored by the cities of San Bernardino and Riverside to the east and the valley stretching north and west to Ventura. The Los Angeles basin is the oldest and densest of these realms. New York, the nation’s other gigantic region has realms as well. But Manhattan is so strong a core that it holds the region together; the same is true for Chicago’s Loop. But Los Angeles, as Robert Fishman argues, was born decentralized (Fishman 1987). Los Angeles may be the most fractured region in the nation (as the number of categories in the table indicates). The LA basin contains a significant share of the region’s office space, but most of the office development has taken place in non-clustering, edgeless areas. This could be due to Los Angeles’s sizable and ever present freeway network, which provides for some clustering, in areas such as Costa Mesa and John Wayne airport in Orange County, but is dotted mostly with low-slung office buildings. Downtown Los Angeles, along with West Los Angeles, has more square footage than any of its edge cities. The Wilshire corridor, although not at the city’s “edge”, has the next highest 9 To Vance (1964), urban realms are a natural function of the growth of cities; the city has changed structurally, becoming a collection of realms that has grown “one stage beyond that of a metropolis” (p.78). The core-periphery relationship weakens as realms become more equal. The basic organization of the region becomes more cooperative as the shared urban and cultural identity of the urban realms creates what Vance calls a “sympolis” rather than a metropolis.

February 2006 29
amount and at 27 million square feet, contains more office space than Garreau’s prototypical edge city of Tyson’s Corner outside of Washington, DC. Los Angeles has been portrayed as a sprawling, low-density suburban wasteland (Kunstler 1993, p 213), but the US Census Bureau recently declared Los Angeles as the most densely populated places in the continental US. While cities in the Northeast and Midwest use up increasingly more land at low densities with little population growth, the opposite is true in the West. New residents stream in, but the geographic constraints of Los Angeles (ocean, mountains) limit places to build. The secondary downtown of Glendale, has very high residential density that exceeds downtown Los Angeles. The city of Santa Ana’s residential densities are also high. This is due, in large part, to the city’s foreign immigrants living in overcrowded conditions. It then stands to reason that most (80 percent) of Los Angeles’ edgeless cities space is located in urban densities. The table confirms this finding, showing over 53 million feet of edgeless space located in census tracts having over 8,000 people per square mile. The Inland Empire has captured much of Los Angeles boom, but does not, as of yet, have any edge cities. Miami Table 17. Miami Metropolitan Office Space
Area Density Nearest Density
Location Square Ft. Percent (sq mi) (OS/sq. mi) Neighbor (per sq. mi)
Downtowns 14,693,142 13.7% 13.44 1,093,240
Downtown - Miami 9,314,741 8.7% 9.98 933,341 0.053 5,038
Secondary Downtown - Ft. Lauderdale 5,378,401 5.0% 3.46 1,554,451 0.119 5,024
Edge Cities 15,225,255 14.2% 8.80 1,730,143
Lauderdale Lakes 5,551,140 5.2% 2.56 2,168,414 0.177 2,706
Boca Raton 4,676,870 4.4% 4.59 1,018,926 0.147 2,305
West Palm Beach 4,997,245 4.7% 1.65 3,028,633 0.121 3,833
Edgeless City 77,293,650 72.1% 5,402.75 14,306
Urban 50,256,833 65.0% 3,000+
Suburban 22,863,134 29.6% 1,000-3,000
Exurban 4,173,683 5.4% 300-1,000
TOTAL 107,212,047 5,424.99 19,763
• Miami has the most amount of edgeless cities space. • The Miami region is relatively dense because of geographical constraints. • Miami has the least amount of office space of any downtown in this study.
Miami is a realm of edgeless cities—it is the most centerless large region in the nation. As with Los Angeles, Miami is geographically constrained. The Atlantic Ocean and the Everglades hold its sprawl in check, but within the urbanized space there are few major centers. For example, Miami has the least office space of any downtown and the cities of Boca Raton and West Palm Beach, although considered edge cities for the purposes of this study, do not reach the official edge city threshold of 5 million square feet. Moreover, Miami has almost three-quarters (77 million square feet) of its office space in edgeless cities; the rest is split evenly between its downtowns and edge cities. However, having such a large percentage of office space outside the downtown presents challenges. Instead of commuting into a central core, office workers must drive over stretches of the

February 2006 30
metropolitan region. Business decentralization also provides little prospect for integrating people and commercial uses into mass transit systems. Yet there is hope. The geographical constraints keep Miami’s edgeless space in mostly urban densities. Ten million of Miami’s edgeless space exists in census tracts with residential densities of 8,000 people or more, indicating a critical mass for public transit. Adding to this, the street patterns in Miami’s edge cities have a moderate amount of cohesion, which also bodes well for future infill development. New York Table 18. New York Metropolitan Office Space
Average Residential
Area Density Nearest Density
Location Square Ft. Percent (sq mi) (OS/sq. mi) Neighbor (per sq. mi)
Downtowns 421,212,315 61.4% 26.0 16,171,862
Manhattan 374,345,143 54.5% 11.0 33,938,816 n/a 50,525
Secondary Downtown - Jersey City 19,619,237 2.9% 8.65 2,268,120 0.027 17,159
Secondary Downtown - Brooklyn 12,704,176 1.9% 2.52 5,041,340 0.123 21,051
Secondary Downtown - Newark 14,543,759 2.1% 3.85 3,781,529 0.099 14,429
Edge Cities 43,293,909 6.3% 19.15 21,931,233
White Plains 10,599,792 1.5% 9.20 1,152,151 0.116 985
Morristown/Parsippany 10,949,214 1.6% 1.13 9,732,635 0.204 2,046
Tinton Falls 5,572,854 0.8% 2.20 2,533,115 0.222 4,044
Metro Park 4,562,488 0.7% 1.11 4,110,350 0.261 1,860
I-78/I-287 6,482,204 0.9% 3.50 1,852,058 0.167 3,170
Melville 5,127,357 0.7% 2.01 2,550,924 0.205 14,603
Edgeless Cities 222,052,423 32.3% 6,852.33 31,235
Urban 108,875,637 49.0% 3,000+
Suburban 76,916,576 34.6% 1,000-3,000
Exurban 28,241,435 12.7% 300-1,000
TOTAL 686,558,647 6,916 99,271
Metropolitan New York Office Space, 2005
• New York’s edgeless office space is more than the total office space in other markets in this study.
• New York has only 6 percent of its office space in edge cities. • 28 million square feet of office space is located at exurban densities—most likely
in exurban New Jersey. The New York region has over 100 million square feet of edgeless city office space that falls below the urban threshold. That is the equivalent space to smaller total markets in places such as Detroit and Denver. The center holds in New York, as it does in Chicago. New York’s edgeless space (222 million square feet), while not a majority percentage of the region (32 percent), also dwarfs other region’s markets in sheer size. New York’s edge cities make up a surprisingly small percentage of the region—only 6 percent. None of its edge cities rank in the top 10, although the secondary downtowns of Brooklyn, Newark and Jersey City, with their connected street networks and high residential densities, are among the largest in this study.

February 2006 31
Over 28 million square feet of edgeless office space exists in exurban residential densities. Most of the exurban office space can be found in Northern New Jersey. The office space around Princeton is a prime example. Although Garreau identified Princeton as an edge city, it is really more of a low-density, non-clustering, far-flung edgeless city that winds through the hills and dales of Mercer County. Philadelphia Table 19. Philadelphia Metropolitan Office Space
Average ResidentialArea Density Nearest Density
Location Square Ft. Percent (sq mi) (OS/sq. mi) Neighbor (per sq. mi)Downtowns 64,544,348 35.6% 36.99 1,745,008
Downtown 53,612,971 29.6% 8.49 6,316,326 0.055 15,671Urban Envelope - Camden 3,722,512 2.1% 23.29 159,833 11,365Secondary Downtown - Wilmington, DE 7,208,865 4.0% 5.21 1,383,659 0.093 2,684
Edge Cities 18,249,319 10.1% 12.86 1,419,076King of Prussia 11,975,601 6.6% 9.93 1,206,002 0.201 1,942Paoli 6,273,718 3.5% 2.93 2,141,201 0.270 899
Edgeless City 98,260,477 54.3% 4,713.36 20,847Urban 36,806,316 37.5% 3,000+Suburban 42,712,377 43.5% 1,000-3,000Exurban 18,741,784 19.1% 300-1,000
TOTAL 181,054,144 4,763.21 38,011
Metropolitan Philadelphia Office Space, 2005
• Philadelphia has over half of its office space in edgeless cities. • It has the highest percentage of edgeless office space in exurban areas . • Philadelphia’s edge cities have low densities and low cohesion.
Like New York and Boston, Philadelphia is proof that the edgeless metropolis is not just a Sunbelt phenomenon. Philadelphia not only has over half of its office space in edgeless cities, but it has the highest percentage of edgeless office space in exurban areas. Only 37 percent of the edgeless office space exists below the urban threshold. However, the overall office space density in these areas is relatively high, averaging 20,847 square feet per square mile. Camden, New Jersey, which has been through several resuscitation attempts, is included as part of Philadelphia’s urban envelope, which although residentially dense, has relatively little office space. Wilmington, Delaware, in yet a third state, serves as Philadelphia’s secondary downtown. Wilmington, as a center of the banking industry, has relatively dense office clustering and, as an older, traditionally planned city, has a well-connected street grid. Philadelphia’s edge cities, however, are well inside Pennsylvania. They are not dense nor do they have a high level of cohesion. Paoli, the smaller of the two, is along Philadelphia’s Main Line, a commuter line that runs through the region’s older affluent suburbs. The King of Prussia edge city is built around a regional mall, near the intersection of major interstate highways.

February 2006 32
San Francisco Table 20. San Francisco Metropolitan Office Space Metropolitan San Francisco Office Space, 2005 Average Residential
Area Density Nearest Density
Location Square Ft. Percent (sq mi) (OS/sq. mi) Neighbor (per sq. mi)
Downtown 80,817,501 46.3% 24.34 3,320,221
Downtown 68,449,408 39.2% 7.05 9,711,891 0.090 22,436
Secondary Downtown - Oakland 11,790,775 6.7% 4.27 2,759,367 0.075 9,438
Urban Envelope 577,318 0.3% 13.02 44,341 16,382
Edge Cities 25,071,921 14.4% 15.79 1,587,835
Fremont 7,135,053 4.1% 4.85 1,471,145 0.193 1,829
Pleasanton 6,405,404 3.7% 5.99 1,069,350 0.211 3,139
San Ramon 6,123,992 3.5% 2.25 2,721,774 0.323 1,973
Walnut Creek 5,407,472 3.1% 2.70 2,002,767 0.288 3,949
Edgeless Cities 68,790,444 39.4% 2,475.17 27,792
Urban 46,685,322 67.9% 3,000+
Suburban 11,728,564 17.0% 1,000-3,000
Exurban 6,089,668 8.9% 300-1,000
TOTAL 174,679,866 2,517.86 69,376
• Data limitations may explain why San Francisco has slightly more office space than its edgeless cities.
• Oakland has more office space than either the downtowns of Miami or Atlanta. • Geographic constraints keep densities relatively high.
Like Los Angeles, San Francisco is made up of several realms. If one were to draw a line around the urbanized areas of a typical metropolitan area it would most likely form a circle. But in tracing San Francisco’s urbanized areas, one would not draw a circle, but something resembling a claw. Its urban space rings a large bay, and it slips around mountains—it has many breaks. The Bay Area’s physical reality produced an early polycentrism, as secondary downtowns such as Oakland and San Jose grew along with San Francisco. Black’s Guide no longer provides data for the Silicon Valley and therefore that area was not included in the analysis. This may account for why there is less edgeless city space outside of San Francisco in this study as compared to Edgeless Cities. Lang previously found that edgeless city space surpassed downtown office space in San Francisco. However, without including areas such as San Jose (where much of the recent, low density office space was built), San Francisco’s downtown contains only slightly less office space than its edgeless cities. Oakland, one of San Francisco’s satellite cities, contains over 11 million square feet of leaseable office space, more than downtown Atlanta or Miami. Oakland also has a higher residential density than both these places and maintains a highly gridded and connected street pattern. Oakland’s layout had little influence on San Ramon and Walnut Creek–two edge cities with some of the most disparate street patterns in the study. San Francisco’s edge cities are relatively small and moderately dense. Like Los Angeles and Miami, San Francisco’s geographic constraints force density (many of San

February 2006 33
Francisco’s suburbs are at or near build out). This probably explains why most of San Francisco’s non-clustering office space exists at the urbanized threshold. Washington, DC Table 21. Washington, DC Metropolitan Office Space Metropolitan Washington, DC Office Space, 2005
Area Density Average Residential
Location Square Ft. Percent (sq mi) (OS/sq. mi) Nearest Neighbor Density (per sq. mi)
Downtowns 147,255,013 41.1% 70.85 2,078,347
Downtown 81,285,863 22.7% 7.37 11,026,297 0.062 9,587
Secondary Downtown - Silver Spring 5,245,766 1.5% 1.18 4,445,564 0.175 7,678
Urban Envelope - Alex/Arlington 65,969,150 18.4% 62.30 1,058,895 7,479
Edge Cities 124,831,592 34.8% 120.71 1,034,110
Tyson's Corner 22,645,275 6.3% 10.28 2,203,062 0.233 2,386
Herndon/Reston 17,279,291 4.8% 9.48 1,823,095 0.265 3,640
Chantilly/Dulles 14,772,419 4.1% 6.74 2,192,079 0.285 1,868
Gaithersburg 10,496,150 2.9% 2.69 3,904,818 0.214 2,699
Leesburg 10,941,394 3.1% 9.23 1,185,416 0.248 1,024
Fairfax Center 7,259,548 2.0% 5.36 1,354,393 0.196 2,147
I-270 Corridor 24,885,994 6.9% 32.90 756,413 3,657
Rt. 28 Corridor 16,551,521 4.6% 44.04 375,829 2,815
Edgeless Cities 86,113,714 24.0% 5,635.75 15,280
Urban 59,188,823 68.7% 3,000+
Suburban 18,408,164 21.4% 1,000-3,000
Exurban 8,516,727 9.9% 300-1,000
TOTAL 358,200,319 5,827.32 61,469
• Washington, DC has the least amount of edgeless office space of all the regions studied.
• Washington’s urban envelope has more office space than downtown Philadelphia. • Despite this push ever further out into the Washington region, only 9 percent of
the edgeless city space exists in exurbia. Washington arguably supports the most organized polycentric form in the nation. It is therefore not surprising that Garreau, who started his edge city work as a reporter for the Washington Post looking at local development, was inclined to focus on edge cities elsewhere. Washington has the least amount of edgeless office space of any region studied—most of its office space lies in its massive edge cities. Washington’s downtown is sizable at 81 million square feet. However, Washington’s eight edge cities (including two corridors) add up to over 124 million square feet—almost three times more space than New York has in its edge cities. Washington’s urban envelope, which includes Alexandria and Arlington, also holds a substantial amount of space: 65 million square feet, which is more office space than is in downtown Philadelphia. Tyson’s Corner has become the prototypical edge city. It is the second largest edge city with over 22 million square feet. Yet, the Los Angeles-style I-270 corridor running through suburban Maryland, has more–24 million square feet. However, Northern Virginia has been the beneficiary of much of the region’s economic boom over the last two decades. Tyson’s may be one of the biggest, but as it ages, areas even further west such as Chantilly and Leesburg are now becoming the preferred address for many companies. Despite this push ever further out into the Washington region, only 9 percent of the edgeless city space exists in exurbia.
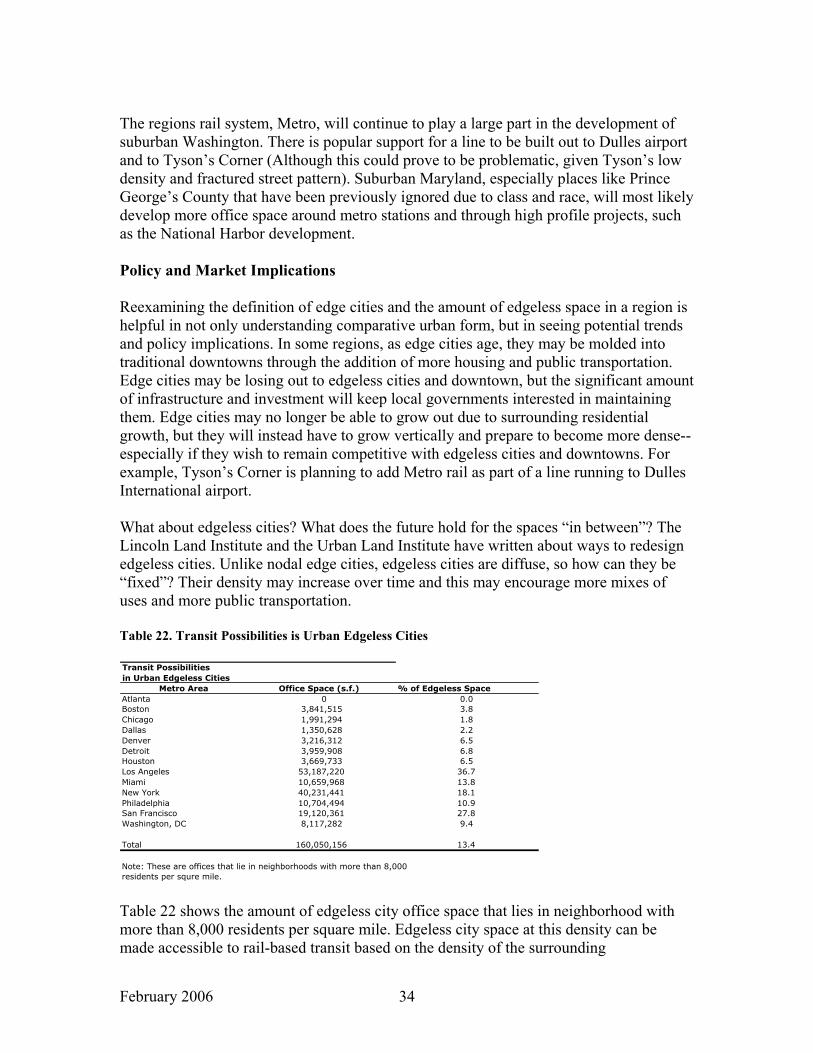
February 2006 34
The regions rail system, Metro, will continue to play a large part in the development of suburban Washington. There is popular support for a line to be built out to Dulles airport and to Tyson’s Corner (Although this could prove to be problematic, given Tyson’s low density and fractured street pattern). Suburban Maryland, especially places like Prince George’s County that have been previously ignored due to class and race, will most likely develop more office space around metro stations and through high profile projects, such as the National Harbor development. Policy and Market Implications Reexamining the definition of edge cities and the amount of edgeless space in a region is helpful in not only understanding comparative urban form, but in seeing potential trends and policy implications. In some regions, as edge cities age, they may be molded into traditional downtowns through the addition of more housing and public transportation. Edge cities may be losing out to edgeless cities and downtown, but the significant amount of infrastructure and investment will keep local governments interested in maintaining them. Edge cities may no longer be able to grow out due to surrounding residential growth, but they will instead have to grow vertically and prepare to become more dense--especially if they wish to remain competitive with edgeless cities and downtowns. For example, Tyson’s Corner is planning to add Metro rail as part of a line running to Dulles International airport. What about edgeless cities? What does the future hold for the spaces “in between”? The Lincoln Land Institute and the Urban Land Institute have written about ways to redesign edgeless cities. Unlike nodal edge cities, edgeless cities are diffuse, so how can they be “fixed”? Their density may increase over time and this may encourage more mixes of uses and more public transportation. Table 22. Transit Possibilities is Urban Edgeless Cities Transit Possibilities in Urban Edgeless Cities
Metro Area Office Space (s.f.) % of Edgeless SpaceAtlanta 0 0.0Boston 3,841,515 3.8Chicago 1,991,294 1.8Dallas 1,350,628 2.2Denver 3,216,312 6.5Detroit 3,959,908 6.8Houston 3,669,733 6.5Los Angeles 53,187,220 36.7Miami 10,659,968 13.8New York 40,231,441 18.1Philadelphia 10,704,494 10.9San Francisco 19,120,361 27.8Washington, DC 8,117,282 9.4
Total 160,050,156 13.4
Note: These are offices that lie in neighborhoods with more than 8,000residents per squre mile. Table 22 shows the amount of edgeless city office space that lies in neighborhood with more than 8,000 residents per square mile. Edgeless city space at this density can be made accessible to rail-based transit based on the density of the surrounding

February 2006 35
environment. The 8,000 people per square mile metric was developed by Pushkarev and Zupan (1977) in a study that looked at the urban densities needed for public transportation in the New York region. They found that that threshold was the minimum requirement for transit. This is a high intensity of residential development and requires a large share of multifamily dwellings. Neighborhoods at this density are often urban, but may include examples from inner suburbs, such as the Clarendon section of Arlington. In total, over 160 million square feet of edgeless city office space lies in “transit-possible” neighborhoods. This is an enormous amount of space, which exceeds Chicago’s downtown Loop area in size. But the distribution of this space varies tremendously by metropolitan area. Big markets such as New York, Los Angeles, and San Francisco account for a large percentage of the transit-possible edgeless city office space. In the case of Los Angeles, well over a third of its edgeless city office development fits in this category, followed by San Francisco at 28 percent and New York at 18 percent. By contrast, none of Atlanta’s nearly 65 million square feet of edgeless city office space lies in transit-possible neighborhoods. Likewise, only very small shares of such space exits in Boston, Chicago, and Dallas. Regions such as Miami and Philadelphia fall in the middle in this quality. This is not to say that all places with the potential for rail-based transit will develop such infrastructure. Rather the 8,000 people per square mile figure represents a potential for rail systems. Interestingly, a significant share of edgeless city space nationwide meets this criterion. The fairly common pairing of edgeless city space and dense neighborhoods was not an expected outcome given the common assumption that scattered offices are mostly in “sprawling places.” This study also addresses categories of market data. Rarely is office data broken out into such specific categories as “edgeless”, “urban envelope” or “corridor”–typically the data is divided between suburban and downtown, high-rise versus low rise. The majority of office space is located in the suburbs, so it makes sense to have more detailed labels with which to track suburban investment opportunities and growth. Indices could be developed to track the contraction or expansion of these categories, as well as their investment performance. Conclusion This report is a step in a greater understanding of the “new metropolis.” No longer is there a simple urban/suburban dichotomy. Suburbs have become increasingly complex, yet are understudied. This study not only examines part of the impact that commercial real estate has on a region, but looks to what the future may hold. The categories (urban envelope, corridor, edgeless city) developed and refined in this study will hopefully give commercial real estate practitioners a new way of looking at metropolitan regions. We hope to give the suburban office market a “finer grain” through our explanation of this type of urban form.

February 2006 36
This study will also assist real estate professionals prepare for the impending “densification” of suburban office locations. More suburban jurisdictions are embracing density and light rail. Many edge cities have limited ability to grow and, in order to stay competitive, are increasingly considering not just face-lifts but infill. The “nearest neighbor” ratio tool that was used in this study can aid in predicting an area’s potential for successful infill development. The future of ageing edge cities is a subject of increasing interest and hopefully, this report sheds light on what certain regions face. The New Metropolis will keep evolving and have to accommodate 94 million people over the next twenty-five years10. This will require a tremendous effort on the part of planners and developers. The restructuring and reordering of our regions is the great project of the 21st century. Acknowledgements The authors wish to thank Kurt Kaiser for his assistance with the GIS mapping and Stacy Johnson for his data gathering.
10 http://www.usatoday.com/news/nation/2004-12-13-housing-side_x.htm

February 2006 37
References Abbott, Carl. 1991. To Boldly Go Where No Data Have Gone Before. Journal of the Urban History 19(3):139-145. Baerwald, Thomas. 1982. Land Use Change in Suburban Clusters and Corridors. Transportation Research Record 861:7-12. Baldassare, Mark. 1986. Trouble in Paradise: The Suburban Transformation of America. New York: Columbia University Press. Barnett, Jonathan. 1992. Accidental Cities: The Deadly Grip of Outmoded Zoning. Architectural Record 180(2):94-101. Berry, Brian J.L. and Frank E. Horton. 1970. Geographical Perspectives on Urban Systems. Englewood Cliffs, NJ: Prentice-Hall Black’s Guide. 2005. Black’s Guide to Office Leasing: Atlanta Office Space Market. Gaithersburg, MD: Black’s Guide Publishing. Black’s Guide. 2005. Black’s Guide to Office Leasing: Boston Office Space Market. Gaithersburg, MD: Black’s Guide Publishing. Black’s Guide. 2005. Black’s Guide to Office Leasing: Chicago Office Space Market. Gaithersburg, MD: Black’s Guide Publishing. Black’s Guide. 2005. Black’s Guide to Office Leasing: Connecticut/New York Suburbs Office Space Market. Gaithersburg, MD: Black’s Guide Publishing. Black’s Guide. 2005. Black’s Guide to Office Leasing: Dallas/Fort Worth Office Space Market. Gaithersburg, MD: Black’s Guide Publishing. Black’s Guide. 2005. Black’s Guide to Office Leasing: Denver Office Space Market. Gaithersburg, MD: Black’s Guide Publishing. Black’s Guide. 2005. Black’s Guide to Office Leasing: Detroit Office Space Market. Gaithersburg, MD: Black’s Guide Publishing. Black’s Guide. 2005. Black’s Guide to Office Leasing: Houston Office Space Market. Gaithersburg, MD: Black’s Guide Publishing. Black’s Guide. 2005. Black’s Guide to Office Leasing: Los Angeles/Orange County Office Space Market. Gaithersburg, MD: Black’s Guide Publishing. Black’s Guide. 2005. Black’s Guide to Office Leasing: New Jersey Office Space Market. Gaithersburg, MD: Black’s Guide Publishing.

February 2006 38
Black’s Guide. 2005. Black’s Guide to Office Leasing: Philadelphia Office Space Market. Gaithersburg, MD: Black’s Guide Publishing. Black’s Guide. 2005. Black’s Guide to Office Leasing: San Francisco Office Space Market. Gaithersburg, MD: Black’s Guide Publishing. Black’s Guide. 2005. Black’s Guide to Office Leasing: South Florida Office Space Market. Gaithersburg, MD: Black’s Guide Publishing. Black’s Guide. 2005. Black’s Guide to Office Leasing: Washington, DC Metro Area Office Space Market. Gaithersburg, MD: Black’s Guide Publishing. Danielsen, Karen A., Robert Lang and William Fulton. 1999. Retracting Suburbia: Smart Growth and the Future of Housing. Housing Policy Debate 10(3):513-540. Breckenfeld, Gurney. 1972. “Downtown” Has Fled to the Suburbs. Fortune (October): 80-87, 158, 162. Bruegmann, Robert and Tim Davis. 1992. New Centers on the Periphery. Center: A Journal for Architecture in America 7(1):25-43. Bureau of Labor Statistics. 2003. The Employment Situation: September 2003. Washington DC: US Department of Labor. U.S. Census Bureau. (2005). Table SUB-EST2002-03 - City and Town Population Estimates: April 1, 2000 to July 1, 2004. Population Division, July 10. Cervero, Robert. 1986. America’s Suburban Center: The Land Use Transportation Link. Boston: Unwin. Congress for the New Urbanism. 2000. Charter of the New Urbanism. New York: McGraw Hill. Ding, Chengri and Richard D. Bingham. 2000. Beyond Edge Cities: Job Decentralization and Urban Sprawl. Urban Affairs Review 35(6):837-855. Erickson, Rodney A. 1985. Multinucleation in Metropolitan Economies. Annals of the Association of American Geographers 76(3):331-346. Fishman, Robert. 1990. America’s New City: Megalopolis Unbound. Wilson Quarterly 14(1):24-45. Fishman, Robert. 1987. Bourgeois Utopias: The Rise and Fall of Suburbia. New York: Basic Books.

February 2006 39
Frey, William. 2003. “Boomers and Seniors in the Suburbs: Aging Patterns in Census 2000.” The Living Census Series. Brookings Institution. January. Frey, William and Alan Berube. 2003. City Families and Suburban Singles: An Emerging Household Story. In Katz, Bruce and Robert E. Lang. eds. 2003. Redefining Cities and Suburbs: Evidence from Census 2000. Volume I. Washington, DC: Brookings Institution Press, pp. 257-288. Fulton, William. 1996. Are Edge Cities Losing Their Edge? Planning 60(5):4-7. Fulton, William. 1986. The Once and Future Suburbs. Planning 52(7):13-17. Galster, George, Royce Hanson, Hal Wolman, Stephen Coleman and Jason Freihage. 2001. Wrestling Sprawl to the Ground: Defining and Measuring an Elusive Concept. Housing Policy Debate 12(3): Garreau, Joel. 1991. Edge City: Life on the New Frontier. New York: Doubleday. Garreau, Joel. 1987. The Emerging Cities of Washington: From Suburbs, Cities are Springing Up in Our Backyards. Washington Post (March 8): A1, A26,27. Goldberger, Paul. 1987. When Suburban Sprawl Meets Upward Mobility. New York Times (July 26):2,30:1. Gordon, Peter and Harry W. Richardson. 1996. Beyond Polycentricity: The Dispersed Metropolis, Los Angeles, 1970-1990. Journal of the American Planning Association 62:289-285. Greenhouse, Linda. 1971. The Outer City: Growth Turing Into a Menace. New York Times (June 3):1,1:2, 1,28:1 Hartshorn, Truman and Peter Muller. 1989. Suburban Downtowns and the Transformation of Metropolitan Atlanta’s Business Landscape. Urban Geography 10: 375-379. Hartshorn, Truman A and Peter Muller. 1986. Suburban Business Centers: Employment Implications. Washington, DC: Association of American Geographers. Lane, Robert. 2002. Redesigning the Edgeless City. New York: Regional Plan Association. Hayden, Dolores. 2004. A Field Guide to Sprawl. New York: WW Norton and Company. Herbers, John. 1971. The Outer City: Uneasiness over the Future. New York Times (June 2):1,1:4, 1,20:1.

February 2006 40
Katz, Bruce and Robert E. Lang. eds. 2003. Redefining Cities and Suburbs: Evidence from Census 2000. Volume I. Washington, DC: Brookings Institution Press. Editors’ Introduction. Kneeland, Douglas E. 1971. The Outer City: There is No Firm Stereotype. New York Times (May 31):1,1:4, 1,8:1. Kunstler, James Howard. 1993. The Geography of Nowhere: The Rise and Decline of America's Man-Made Landscape. New York. Touchstone. Lang, Robert E. 2003a. Edgeless Cities: Exploring the Elusive Metropolis. Washington, DC: Brookings Institution Press. Lang, Robert E. 2003b. Beyond Edge Cities: Office Sprawl in South Florida. Washington, DC: Brookings Institution Center on Urban and Metropolitan Policy Survey Series. (March) Lang, Robert E. 2002a. Open Spaces, Bounded Places: Does the American West’s Arid Landscape Yield Dense Metropolitan Growth? Housing Policy Debate 13(4): 755-778. Lang, Robert E. 2002b. Office Sprawl in Philadelphia. Regional Review (fall), pp. 4-9. Lang, Robert E. 2000a. Office Sprawl: The Evolving Geography of Business. Washington, DC: Brookings Institution Center on Urban and Metropolitan Research. Brookings Survey Series. Lang, Robert E. 2000b. The Store Next Door. Urban Land 59(7):50-51. Lang, Robert E. 1994. Beyond the Office Park: A Typology of New Jersey's Business Centers. New Brunswick, NJ: Report for Rutgers University-Center for Urban Policy Research. Lang, Robert E and Jennifer LeFurgy. 2006. Boomburbs: The Rise of America’s Accidental Cities. Washington, DC: Brookings Institution Press. Lang, Robert E., Edward J. Blakely and Meghan Gough. 2005. Keys to the New Metropolis: America’s Big, Fast-Growing Suburban Counties. Journal of the American Planning Association. 71(3): forthcoming Lang, Robert E., James W. Hughes and Karen A. Danielsen. 1997. Targeting the Suburban Urbanites: Marketing Central City Housing. Housing Policy Debate 8(2):437-470.

February 2006 41
Lang, Robert E. and Patrick A. Simmons. 2003. Boomburbs: The Emergence of Large,Fast-Growing Cities in the United States, in Bruce Katz and Robert E. Lang. eds. Redefining Cities and Suburbs: Evidence from Census 2000. Washington, DC: Brookings Institution Press, pp. 51-62. Leinberger, Christopher B. 1996. Metropolitan Development Trends of the Late 1990s: Social and Environmental Implications. In Land Use in America, Henry L. Diamond and Patrick F. Noonan eds. Cambridge MA: Lincoln Institute of Land Policy, pp., 203-222. Leinberger, Christopher B. 1990. Urban Cores: Development Trends and Real Estate Opportunities in the 1990s. Urban Land 49(12):4-9. Leinberger, Christopher B. 1988. The Six Types of Urban Village Cores. Urban Land 47(5):24-27 Leinberger, Christopher B. and Charles Lockwood. 1986. How Business is Reshaping America. The Atlantic 258(10):43-52. Leinberger, Christopher B. 1984. New Shape of Cities Will Impact Corporate Locations. National Real Estate Investor 26(14):40,140. Lessinger, Jack. 1962. The Case for Scatteration.” Journal of the American Institute of Planners 28 (3): 159-69. Lewis, Pierce F. 1983. “The Galactic Metropolis.” In Beyond the Urban Fringe, edited by R.H. Pratt and G. Macinko. Minneapolis: University of Minnesota Press. Lewis, Pierce F. 1995. “The Urban Invasion of Rural America: The Emergence of the Glactic City.” In The Changing American Countryside: Rural People and Places, edited by Emery N. Castle, 39-62. Lawrence, Kans.: University Press of Kansas. Lockwood, Charles. 1997. Putting the Urb in the Suburbs. Planning 63(6):18-21. Lynch, Kevin. 1961. “The Dispersed Sheet, Urban Galaxy, and the Multinucleanted Net.” In the Pattern of the New Metropolis, edited by Lloyd Rodwin. New York: George Braziller. Muller, Peter O. 1980. The Outer City: Geographical Consequences of the Urbanization of the Suburbs. Resource Paper number 75-2. Washington, DC: American Association of Geographers. Muller, Peter O. 1981. Contemporary Suburban America. Englewood Cliffs, NJ: Prentice Hall. Nelson, Authur C. and Thomas Sanchez. 1999. Debunking the Exurban Myth: A Comparison of Suburban Households. Housing Policy Debate 10(3):652-673.
February 2006 42
Nelson, Arthur C., and Thomas W. Sanchez. 2005. The Effectiveness of Urban Containment Regimes in Reducing Exurban Sprawl, NSL Network City and Landscape, 160: 42-47.
Peirce, Neal. 1991. Edge City: The Best America Can Do? Nation’s Cities Weekly 14(40):5. Pivo, Gary. 1990. The Net of Mixed Beads: Suburban Office Development in Six Regions. Journal of the American Planning Associations 56(4):457-469. Pressman, Neil. 1985. “Forces for Spatial Change.” In The Future of Urban Form: The Impact of New Technology, edited by John Brotchie. London: Croom Helm Pushkarev, Boris and Jefferey M. Zupan. 1977. Public Transportation and Land Use Policy. Indiana University Press. Bloomington and London. Romanos, Michael C., Carla Chifos and Tony Fenner. 1989. Emergence of Metrotowns in the American Metropolitan Scene: Definitition and Evolution of the Concept. In Michael C. Romanos, ed. The City of the 21st Century. Cincinnati, OH: University of Cincinnati. Sharpe, William and Leonard Wallock. 1994. Bold New City of Built-Up “Burb?” American Quarterly 46(1):1-30. Sternlieb, George and James W. Hughes. 1988. The Suburban Growth Corridor. in America’s New Market Geography, ed. George Sternlieb. New Brunswick, NJ: Center for Urban Policy Research. Swanstrom, Todd, Colleen Casey, Robert Flack, and Peter Dreier. 2004. Pulling Apart: Economic Segregation among Suburbs and Central Cities in Major Metropolitan Areas. Washington DC: Brookings Institution Metropolitan Policy Program. Living Cities Census Series. (October). Vance, James E. Jr. 1977. This Scene of Man: Role and Structure of the City in the Geography of Western Civilization. New York: Harper Press. Webber, Melvin M. 1967. “The Urban Place and the Non-Place Urban Realm.” In Explorations in Urban Structure, edited by Melvin M. Webber. University of Pennsylvania Press.


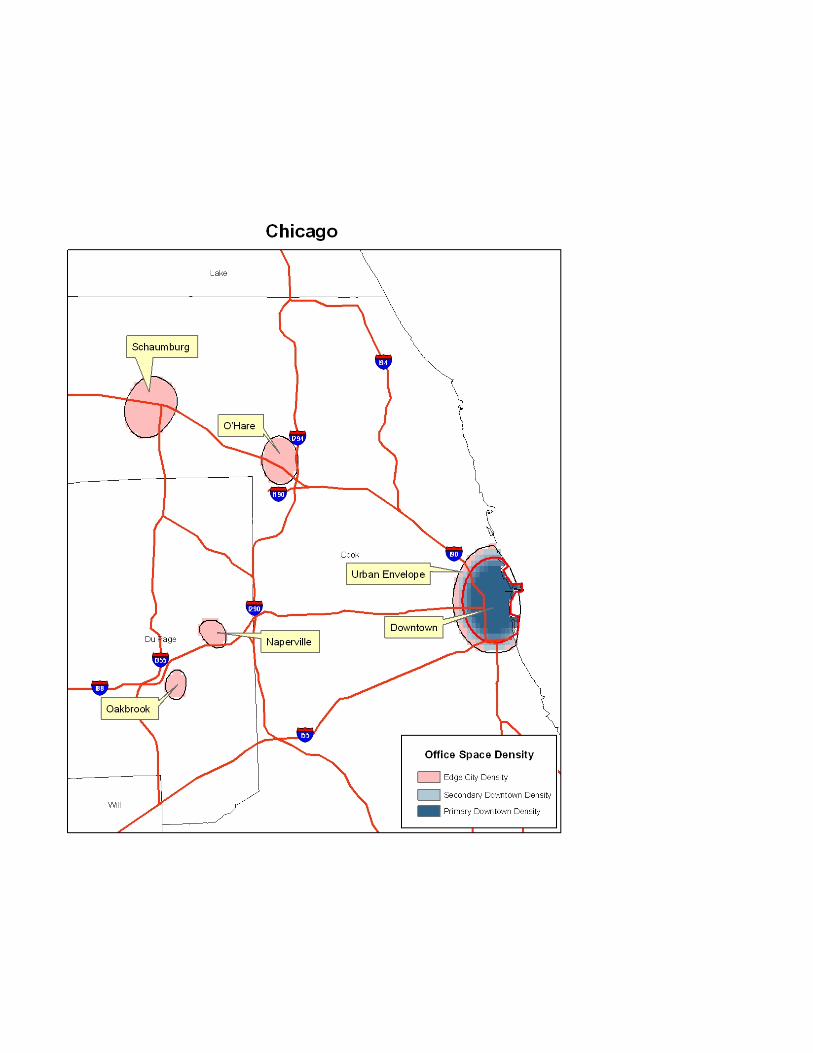

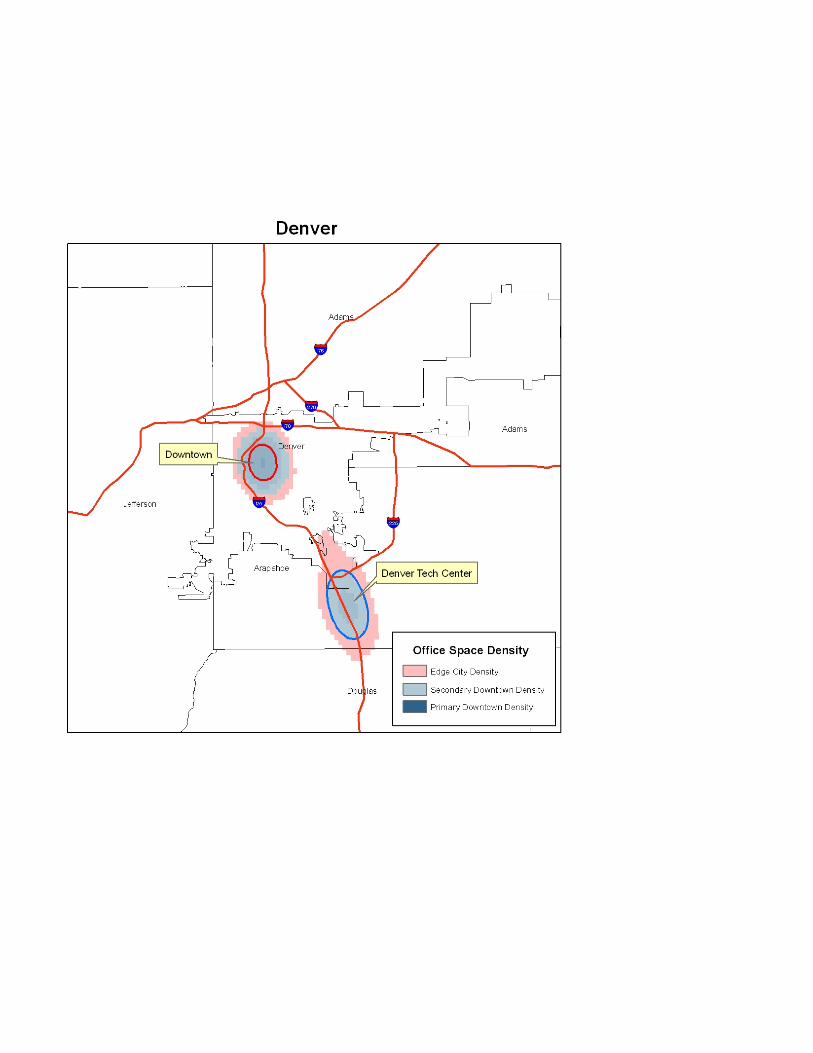
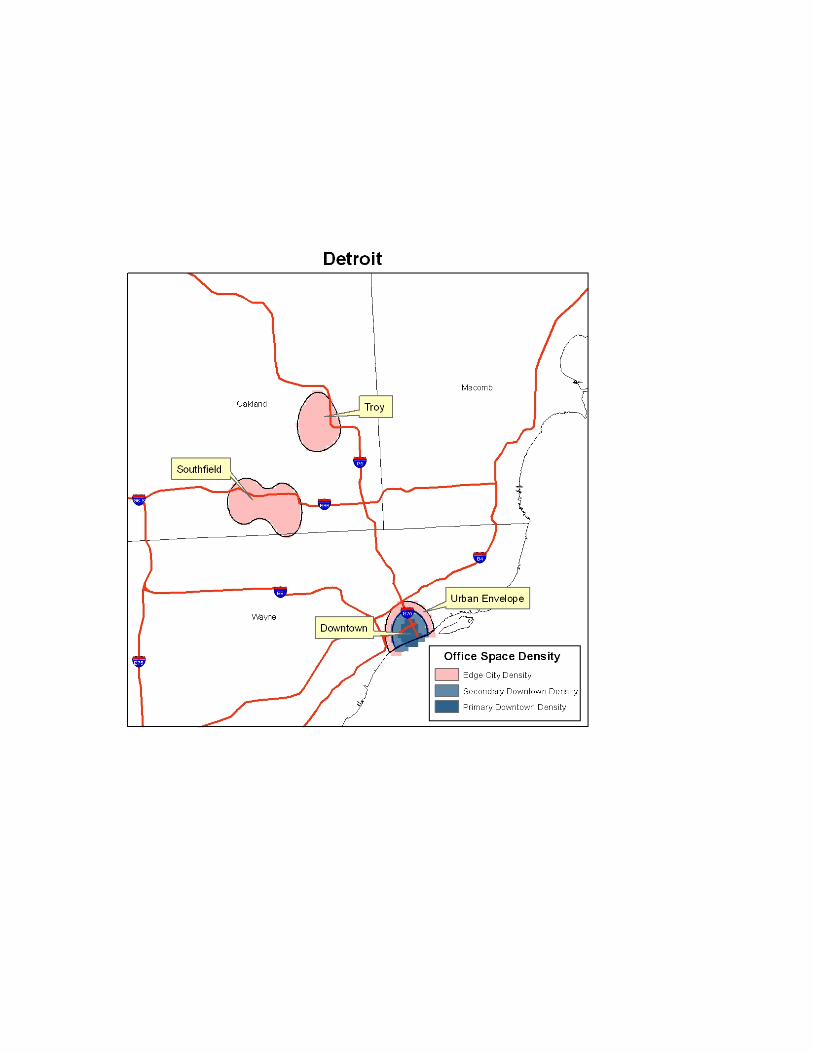


The NATIONAL ASSOCIATION OF REALTORS® National Center for RealEstate Research supports original, high quality research which contributesto a greater understanding of the real estate industry, the real estate business, housing and homeownership.
Topics of primary interest include, but are not limited to:
■ Real estate brokerage■ Real estate brokerage
business models■ Real estate markets■ Housing policy■ Housing markets■ Real estate wealth effect■ New economy / technology
■ Cost and impact of regulation■ Land use controls■ Multifamily■ Retail■ Office■ Industrial■ Commercial property finance
For further information, contact Paul C. Bishop, Director, NationalCenter for Real Estate Research, NATIONAL ASSOCIATION OF REALTORS®
at 202-383-1246 or via e-mail at [email protected]