BETTER RATES - IPPR
54
Institute for Public Policy Research Alfie Stirling and Spencer Thompson June 2016 © IPPR 2016 REPORT BETTER RATES HOW TO ENSURE THE NEW BUSINESS RATES REGIME PROMOTES GROWTH EVERYWHERE
Transcript of BETTER RATES - IPPR

Institute for Public Policy Research
Alfie Stirling and Spencer Thompson
June 2016 © IPPR 2016
REPORT
BETTERRATES
HOW TO ENSURE THE NEW BUSINESS RATES REGIME PROMOTES GROWTH EVERYWHERE

NEW IDEASfor CHANGE
ABOUT IPPRIPPR, the Institute for Public Policy Research, is the UK’s leading progressive thinktank. We are an independent charitable organisation with more than 40 staff members, paid interns and visiting fellows. Our main office is in London, with IPPR North, IPPR’s dedicated thinktank for the North of England, operating out of offices in Manchester and Newcastle, and IPPR Scotland, our dedicated thinktank for Scotland, based in Edinburgh.
Our purpose is to conduct and promote research into, and the education of the public in, the economic, social and political sciences, science and technology, the voluntary sector and social enterprise, public services, and industry and commerce.
IPPR 4th Floor 14 Buckingham Street London WC2N 6DF T: +44 (0)20 7470 6100 E: [email protected] www.ippr.org Registered charity no: 800065 (England and Wales), SC046557 (Scotland).
This paper was first published in June 2016. © 2016 The contents and opinions in this paper are the author(s) only.
IPPR | Better rates: How to ensure the new business rates regime promotes growth everywhere1
CONTENTS
Summary ................................................................................................ 3
1. Introduction ........................................................................................ 6
What are business rates? ..................................................................... 6
2. Understanding business rates retention: the BRRS and 50-per-cent retention .......................................................................... 9
Setting the terms of the scheme: baselines, tariffs and top-ups .......... 9
Different types of local government: billing authorities and precept authorities .......................................................................................... 10
Mitigating winners and losers: the safety net and levy ...................... 12
3. Modelling the changes to come: methodology and technical note ... 13
Interpreting 100-per-cent retention: new game, same rules ............... 13
Modelling and methodology .............................................................. 14
4. The impact of 100-per-cent business rates retention ......................... 17
Our core projection: distributional effects for local authorities ........... 17
Our core projection: effects on spending power at the LEP level ....... 19
Further scenario testing: levies and the safety net ............................. 20
The impact of additional reforms and other perverse incentives ........ 24
5. Spreading the incentives: an IPPR alternative ................................. 26
Growth first: an alternative form of 100-per-cent retention ................ 26
Assessing the pros and cons of a different approach ........................ 28
6. Conclusions and recommendations: Four alternatives, and beyond ....................................................................................... 31
Alternative measure 1: the ‘growth first’ scheme ............................... 31
Alternative measure 2: ‘growth first’ plus cap-and-collar ................... 32
Alternative measure 3: retaining a levy ............................................... 32
Alternative measure 4: risk-pooling across LEP areas........................ 32
Beyond business rates ...................................................................... 32
References ........................................................................................... 34
Appendix 1: Full details of local authority retained income analysis ... 36
Appendix 2: Full details of LEP-level spending power analysis .......... 50
IPPR | Better rates: How to ensure the new business rates regime promotes growth everywhere2
ABOUT THE AUTHORSAlfie Stirling is a research fellow at IPPR.
Spencer Thompson is a senior economic analyst at IPPR.
ACKNOWLEDGMENTSThe authors would like to thank their IPPR colleagues Ed Cox and Josh Goodman in particular for their comments on various versions of this report – their contributions improved this paper immeasurably. We would also like to thank colleagues Bill Davies and Izzy Hatfield, as well as Matt Dykes at the TUC, for their invaluable comments throughout the work. However, responsibility for any errors within this report lies solely with the authors alone.
DownloadThis document is available to download as a free PDF and in other formats at:
http://www.ippr.org/publications/better-rates
CitationIf you are using this document in your own writing, our preferred citation is:
Stirling A and Thompson S (2016) Better rates: How to ensure the new business rates regime promotes growth everywhere, IPPR. http://www.ippr.org/publications/better-rates
Permission to shareThis document is published under a creative commons licence: Attribution-NonCommercial-NoDerivs 2.0 UK http://creativecommons.org/licenses/by-nc-nd/2.0/uk/ For commercial use, please contact [email protected]
SUPPORTED BY THE TUC

IPPR | Better rates: How to ensure the new business rates regime promotes growth everywhere3
SUMMARY
The government has announced that it will allow the local government sec-tor in England to keep all of the money it collectively raises through taxing businesses (‘business rates’). The intention is to give local authorities a stronger incentive to support economic growth. This is very welcome.
The big question remaining is how the total pot of business rates collected nationally will be distributed between different local authorities. The government has not yet formally consulted on this question, but it has said two important things. First, the amount of funding that every local authority will get in the first year of the new scheme will be determined by its need for funding (‘funding need’). Second, in subsequent years, every local authority will be able to keep every extra pound of business rates that it collects.
Our analysis shows that this approach fails on its own terms. Richer1 councils will have much stronger incentive to grow their economies than poorer councils. Over time, this would also lead to greater concen-trations of public investment and resources in richer areas of the country.
We propose an alternative system – the ‘growth first’ scheme – which gives all local authorities an equal incentive to increase their retained income, irrespective of whether they are rich or poor. Under ‘growth first’, the increase in an authority’s funding would be calculated by multiplying its economic growth rate by its funding need, not by the amount of business rates it collects. This would guarantee a strong economic growth incentive for the local authorities that most need it.
KEY ARGUMENTS AND FINDINGSThe question of how to distribute the pot of overall business rates in a way that meets the government’s objectives involves addressing a fundamen-tal trade-off: between ensuring sufficient funds for service provision while also providing financial incentives to grow the local economy.
The government has said that the new scheme will retain the same basic framework as the current 50-per-cent retention scheme. This includes the use of a similar system of tariffs and top-ups to distribute revenue between councils, and a safety net (at an as-yet unspecified rate) to guard against some losses. However, the government has indicated that the levy on disproportionate growth in the current system will be removed. This means that after the first year of the new scheme, local authorities will receive 100 per cent of the growth in their business rates, irrespective of how much money they need to fund services.
1 We describe what are classified as ‘tariff’ and ‘top-up’ authorities in the present 50 per cent retention scheme as ‘richer’ and ‘poorer’ councils respectively. This is on the basis that any top-up authority has been classified as such by government because its local business rates are insufficient to meet its funding need, hence the need for a top-up. These local authorities have low economic activity relative to their social liabilities and are therefore ‘poor’. The inverse is true for tariff authorities, whose tax receipts from the value of local commercial assets exceed the value of their funding need, and are therefore ‘rich’.

IPPR | Better rates: How to ensure the new business rates regime promotes growth everywhere4
Taking these announcements together, our modelling has shown that such a scheme would likely fail on the government’s own terms. Richer local authorities will receive strong incentives to grow their economies, but for many poorer authorities the rewards are dampened by the likely design of the system. As a result, geographical imbalances in economic growth and public service investment will be exacerbated.
To illustrate with an example, a poorer local authority such as Barnsley, with a funding need of around £120 million in 2019/20, and local business rates collection worth around £50 million, will receive their full funding need of £120 million in the first year of the scheme. Of this, £70 million will come from a ‘top-up’, which is then frozen in real terms annually. This means that a 2 per cent increase in their business rates will yield a reward of just 0.8 per cent in additional retained income. Conversely, for a richer authority like South Bucks in Buckinghamshire, with business rates worth around £30 million and a funding need worth around £1 million, a 2 per cent increase in business rates would see retained income rise by more than 50 per cent in a single year.
Moreover, there is also increased risk of excessive losses for some local authorities. Cancelling the levy on disproportionate growth could cost the government £170 million a year. If the equivalent amount of funds were also withdrawn from the safety net, the implication would be a minimum funding floor of less than 70 per cent of funding need, rather than 92.5 per cent in the current system.
In total, around 130 local authorities are likely to require a safety net payment under the government’s implied plans. However, we find that there may be scope for risk-pooling by local authorities at a sub-regional level. Using LEP areas as a proxy, we find that aggregated local authorities at this level are unlikely to see their funding fall in real terms under the government’s proposals.
RECOMMENDATIONSWe therefore recommend the ‘growth first’ system, which retains many of the design fundamentals of the current proposals but performs better against the government’s own objectives. Under our scheme, the increase in a council’s funding after the first year would be calculated by multiplying their business rates growth rate by their funding need. This gives all local authorities an equal incentive to grow: for example, both Barnsley and South Bucks would see a 2 per cent rise in business rates receipts translate into a 2 per cent rise in their retained income.
A further advantage of ‘growth first’ scheme is that it is more likely to provide funds for a safety net, without the need for an additional levy. This makes it much more likely that central government could provide adequate protection for key services in poor performing councils.
If the government does not adopt our preferred ‘growth first’ model, we s recommend one of two alternative options.• Cap and collar: An amendment to our preferred system would see
limits on the potential gains for poorer councils (by capping increases in retained income to £2 for every £1 in increased business rates)

IPPR | Better rates: How to ensure the new business rates regime promotes growth everywhere5
and give a minimum rate of return for the richest authorities (of 50p in every £1 in increased business rates). The balance of incentives would not be as good as our preferred system, but would still be better than those implied by the government’s current proposals.
• Retain the levy: If the government adopts neither of our suggested alternative systems, we recommend that they do not abolish the levy. A levy on excessive growth for richer authorities, either at 50p or 80p in the pound, would not only mitigate extreme gains and losses but also provide funds for a more effective safety net.
Whether the government adopts on any of our above proposals or not, we recommend one further reform for the consultation• Risk-pooling across sub-regional geographies areas: We
recommend exploring innovations that allow for risk-pooling at the level of LEP areas or similar, whether inside or outside the retention scheme itself.
BEYOND BUSINESS RATESAlthough further devolution of tax and spending power is to be welcomed, our analysis shows that a system of fiscal devolution based on business rates alone has significant limitations. This is not to say that it should not be done, but that it cannot be done in isolation. Retaining a higher proportion of tax revenues derived from a wide variety of different revenue streams builds in greater flexibility and resilience.
IPPR | Better rates: How to ensure the new business rates regime promotes growth everywhere6
1. INTRODUCTION
At the 2015 Conservative party conference, the chancellor of the exchequer announced that, by the end of this parliament, local government in England would retain 100 per cent of receipts raised from business rates, a property tax paid by the occupants of non-domestic dwellings (Osborne 2015). This follows a similar reform of partial devolution in 2012, which saw local government retaining half of business rate receipts under the Business Rates Retention Scheme (BRRS). Before that, business rates receipts were part of general taxation, retained entirely by central government.
The continuing trend towards hypothecation of business rates can be seen as part of a general direction of travel towards greater devolution. To this point, policy on devolution has tended to focus on giving local government more powers over economic development and public services. The move to devolve business rates shifts this emphasis towards fiscal devolution, granting local government powers over revenue streams and therefore greater flexibility in managing public spending.
The move to 100-per-cent retention was confirmed in both the 2015 autumn statement and the March 2016 budget; we are now awaiting publication of the government’s consultation to find out the exact nature of the reform and details of its implementation. What is clear is that many of the principles underlying the previous move to 50-per-cent retention will remain, with the government confirming the continuation of a system of redistributing receipts from authorities that collect more business rates than they need to those that collect less, similar to that which exists now.
This paper sets out an initial assessment of what a move from 50-per-cent to 100-per-cent retention could mean for local government. Under any new scheme of retention, the experience from one local council to the next will be driven by the specific circumstances in the local area and local economy. The results presented in this paper, therefore, do not represent a forecast for individual local authorities. Instead, using moderate assumptions and recent historical trends, our findings are designed to show outcomes at the whole-system level. This enables us to project the likely scale of distributional effects of 100-per-cent retention across the system as a whole and, in general terms, to describe the types of characteristics that indicate which local authorities may be winners and losers under the new scheme.
WHAT ARE BUSINESS RATES?The current system of business rates in England, which came into being in 1988, is a property tax on the ‘rateable value’ of non-residential property. The rateable value of a property is assessed by the Valuation Office Agency (VOA), and is usually based on the amount of annual rent
IPPR | Better rates: How to ensure the new business rates regime promotes growth everywhere7
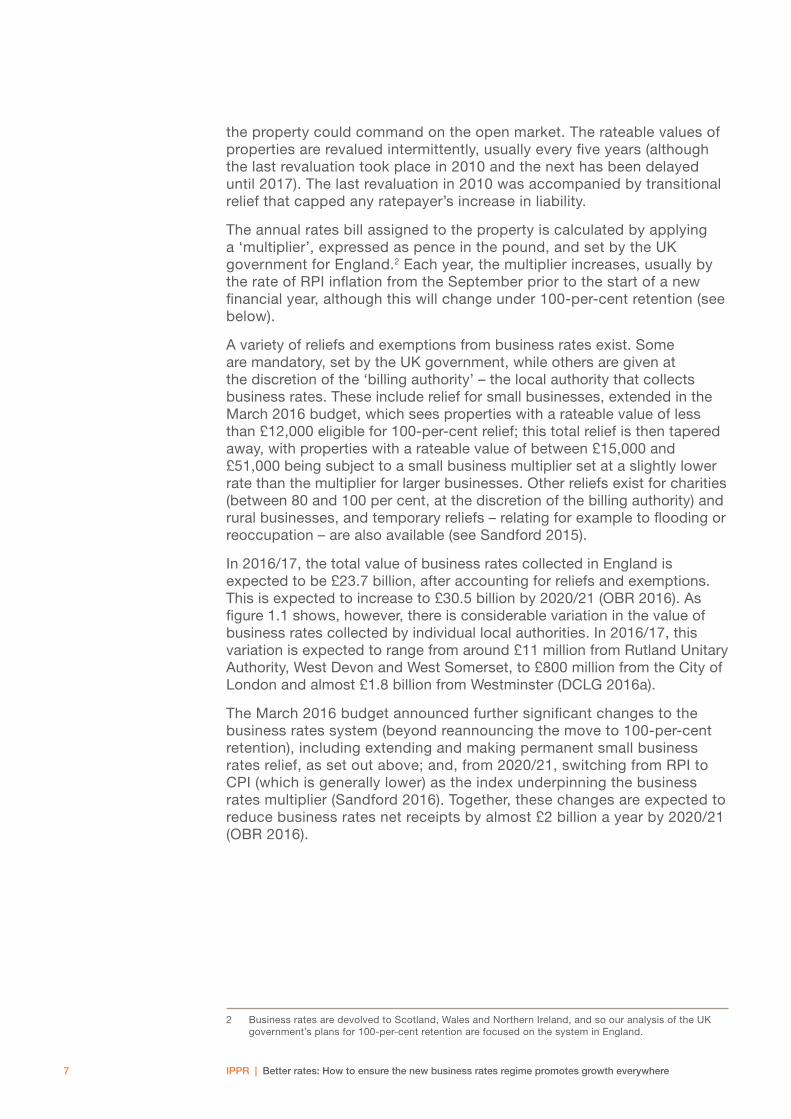
the property could command on the open market. The rateable values of properties are revalued intermittently, usually every five years (although the last revaluation took place in 2010 and the next has been delayed until 2017). The last revaluation in 2010 was accompanied by transitional relief that capped any ratepayer’s increase in liability.
The annual rates bill assigned to the property is calculated by applying a ‘multiplier’, expressed as pence in the pound, and set by the UK government for England.2 Each year, the multiplier increases, usually by the rate of RPI inflation from the September prior to the start of a new financial year, although this will change under 100-per-cent retention (see below).
A variety of reliefs and exemptions from business rates exist. Some are mandatory, set by the UK government, while others are given at the discretion of the ‘billing authority’ – the local authority that collects business rates. These include relief for small businesses, extended in the March 2016 budget, which sees properties with a rateable value of less than £12,000 eligible for 100-per-cent relief; this total relief is then tapered away, with properties with a rateable value of between £15,000 and £51,000 being subject to a small business multiplier set at a slightly lower rate than the multiplier for larger businesses. Other reliefs exist for charities (between 80 and 100 per cent, at the discretion of the billing authority) and rural businesses, and temporary reliefs – relating for example to flooding or reoccupation – are also available (see Sandford 2015).
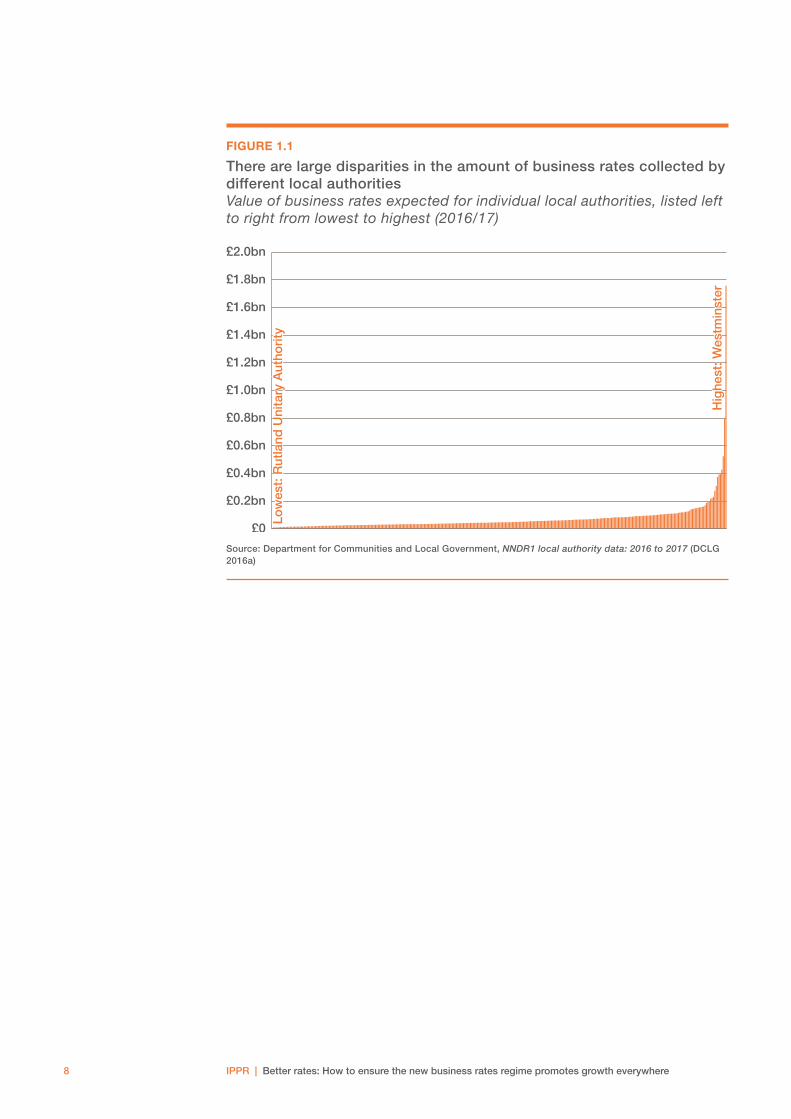
In 2016/17, the total value of business rates collected in England is expected to be £23.7 billion, after accounting for reliefs and exemptions. This is expected to increase to £30.5 billion by 2020/21 (OBR 2016). As figure 1.1 shows, however, there is considerable variation in the value of business rates collected by individual local authorities. In 2016/17, this variation is expected to range from around £11 million from Rutland Unitary Authority, West Devon and West Somerset, to £800 million from the City of London and almost £1.8 billion from Westminster (DCLG 2016a).
The March 2016 budget announced further significant changes to the business rates system (beyond reannouncing the move to 100-per-cent retention), including extending and making permanent small business rates relief, as set out above; and, from 2020/21, switching from RPI to CPI (which is generally lower) as the index underpinning the business rates multiplier (Sandford 2016). Together, these changes are expected to reduce business rates net receipts by almost £2 billion a year by 2020/21 (OBR 2016).
2 Business rates are devolved to Scotland, Wales and Northern Ireland, and so our analysis of the UK government’s plans for 100-per-cent retention are focused on the system in England.
IPPR | Better rates: How to ensure the new business rates regime promotes growth everywhere8
FIGURE 1.1
There are large disparities in the amount of business rates collected by different local authorities Value of business rates expected for individual local authorities, listed left to right from lowest to highest (2016/17)
£0
£0.2bn
£0.4bn
£0.6bn
£0.8bn
£1.0bn
£1.2bn
£1.4bn
£1.6bn
£1.8bn
£2.0bn
Low
est:
Rut
land
Uni
tary
Aut
hori
ty
Hig
hest
: Wes
tmin
ster
Low
est:
Rut
land
Uni
tary
Aut
hori
ty
Hig
hest
: Wes
tmin
ster
Source: Department for Communities and Local Government, NNDR1 local authority data: 2016 to 2017 (DCLG 2016a)
IPPR | Better rates: How to ensure the new business rates regime promotes growth everywhere9
2. UNDERSTANDING BUSINESS RATES RETENTION: THE BRRS AND 50-PER-CENT RETENTION
In April 2013, a new system of business rates retention among English local authorities was instituted. Prior to this, local government had been funded by a system of formula grants; since 2013, local government has been able to retain half of all collected business rates, taken in aggregate. In this scheme, total collected business rates across England make up the ‘estimated business rates aggregate’ (EBRA). The 50 per cent of EBRA that is retained by local authorities through the system is known as the ‘local share’, and is used to fund services and benefits previously financed through specific government grants. The remaining 50 per cent of the EBRA, the ‘central share’, is used to fund a revenue support grant (RSG), which operates on a similar basis to the previous formula grants. The justification for the 50-per-cent retention plan was to incentivise local areas to stimulate growth in their business rates bases by allowing them to retain some of the fiscal proceeds of such growth.
The current system is complex, but it provides a guide as to how 100-per-cent retention may operate in the future. There are two key aspects to the current scheme, as set out in the April 2013 reforms: a system of tariffs and top-ups assigned to local authorities by comparing their expected business rates receipts with their estimated funding need; and an annual levy and safety net to curb excessive rises or falls in business rates income. It is also important to understand the different categories of local authority that exist, and how these relate to the current scheme.
SETTING THE TERMS OF THE SCHEME: BASELINES, TARIFFS AND TOP-UPSIn the first year of the new scheme, the government calculated the funding need for each local authority, known as the ‘start-up funding assessment’. While based on the previous system of formula grants, this calculation also incorporated the government’s strategy for deficit reduction by reflecting the total figure made available for allocation to local government (DCLG 2013a). In all years other than in those where the scheme is being reset, the start-up funding assessment is known as the ‘settlement funding assessment’ (SFA).
The SFA for every local authority is met through a combination of two funding streams: retained business rates and the RSG. The ratio between these two respective streams was set at 10.1 to 15.2 (Keep and Berman 2013). The ratio was formulated to reflect two constraints that shape
IPPR | Better rates: How to ensure the new business rates regime promotes growth everywhere10
the size of the overall spending envelope for local government: the total local share in collected business rates across England,3 and the amount of money to be allocated to authorities through the RSG during a time of austerity and under the ‘local government spending control’.4
The portion of the start-up funding assessment met by retained business rates is known as the ‘baseline funding level’. In the first year of the scheme, DCLG also estimated a ‘business rates baseline’ for every local authority, equal to the portion of the local share expected to be raised by that authority. To ensure that all local authorities are able to receive sufficient income from retained business rates irrespective of their contribution to the local share, a system of tariffs and top-ups is used to redistribute income among local authorities.
Tariffs and top-ups for individual local authorities are set by DCLG to reflect the difference between an authority’s expected business rates baseline and its baseline funding level. If a local authority’s expected business rates are worth more than its baseline funding level, they pay a tariff, equal to the difference. Conversely, an authority with a business rates baseline that is lower than its baseline funding level gets an equivalent top-up.
An important attribute of the scheme is that baseline funding levels, tariffs and top-ups are fixed for up to 10 years, and for a minimum of five. In the intervening years, the value of each is uprated in line with RPI inflation for September that year. This means that the system is largely unresponsive to change in the outside world, such as increased demand for local services or reduced business rates revenue. If a local authority’s business rates receipts fall, or rise more slowly than RPI, then they become net losers from the scheme, in cash terms. If the value of their liabilities (social securities and services) increase faster than inflation, then their resources will fall short of their funding need, unless business rates receipts increase at the same rate or more (subject to levy and safety net payments, see below). There are, therefore, powerful incentives for local authorities to expand their business rates revenue, or at the very least prevent it from declining.
DIFFERENT TYPES OF LOCAL GOVERNMENT: BILLING AUTHORITIES AND PRECEPT AUTHORITIESAll local authorities, and most major precept authorities (excluding police and crime commissioners), are funded through the BRRS. Authorities are treated either as ‘billing authorities’ (including London boroughs, metropolitan districts, shire districts and all-purpose authorities) or ‘precept authorities’. Billing authorities are responsible for business rates collection, while precept authorities are entitled to a share of one or more billing authorities’ retained business rates income.
The distinction between billing authorities and precept authorities largely only matters when calculating respective business rates baselines – thereafter, and in almost all other respects, they are treated the same under the BRRS. The business rates baseline for both precept and billing
3 Minus payments made to GLA transport funding and London bus service operators. 4 In this way, the scheme incorporated macro-level government plans for fiscal tightening.
IPPR | Better rates: How to ensure the new business rates regime promotes growth everywhere11
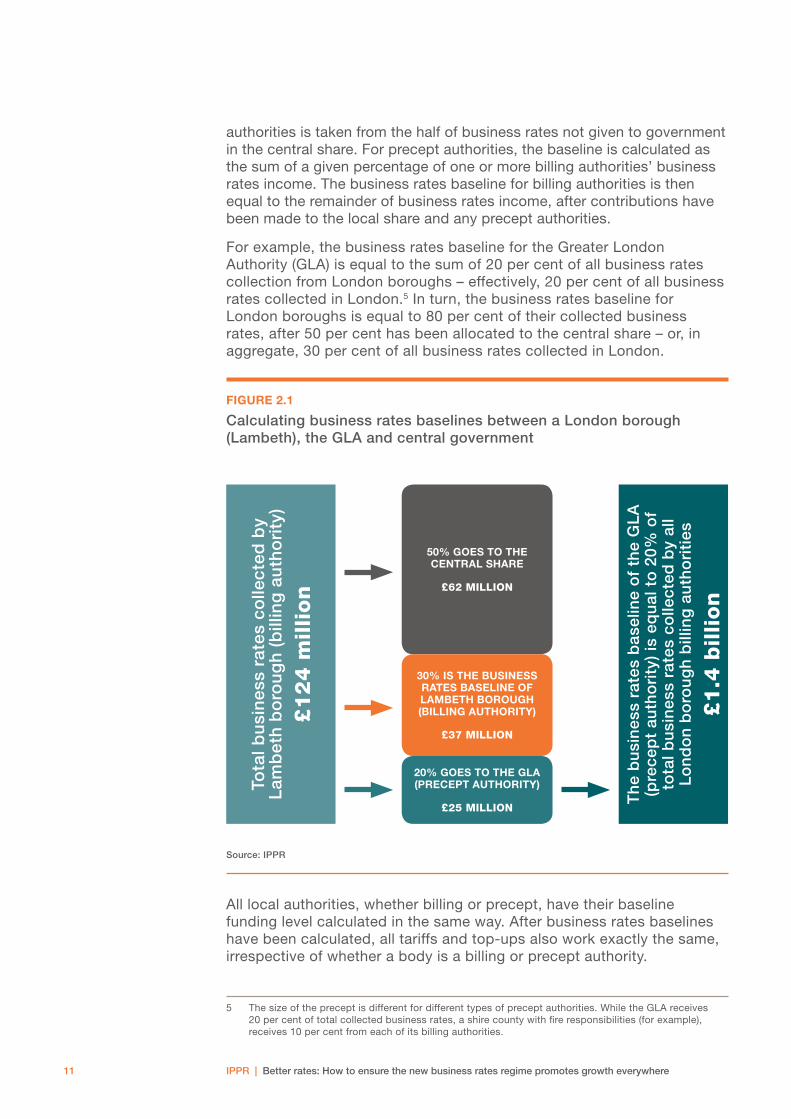
authorities is taken from the half of business rates not given to government in the central share. For precept authorities, the baseline is calculated as the sum of a given percentage of one or more billing authorities’ business rates income. The business rates baseline for billing authorities is then equal to the remainder of business rates income, after contributions have been made to the local share and any precept authorities.
For example, the business rates baseline for the Greater London Authority (GLA) is equal to the sum of 20 per cent of all business rates collection from London boroughs – effectively, 20 per cent of all business rates collected in London.5 In turn, the business rates baseline for London boroughs is equal to 80 per cent of their collected business rates, after 50 per cent has been allocated to the central share – or, in aggregate, 30 per cent of all business rates collected in London.
FIGURE 2.1
Calculating business rates baselines between a London borough (Lambeth), the GLA and central government
Tota
l bu
sin
ess
rate
s co
llect
ed b
y
Lam
bet
h b
oro
ug
h (
bill
ing
au
tho
rity
)
£1
24
mil
lio
n
Th
e b
usi
nes
s ra
tes
bas
elin
e o
f th
e G
LA
(p
rece
pt
auth
ori
ty)
is e
qu
al t
o 2
0% o
f to
tal b
usi
nes
s ra
tes
colle
cted
by
all
Lo
nd
on
bo
rou
gh
bill
ing
au
tho
riti
es
£1
.4 b
illi
on
50% GOES TO THE CENTRAL SHARE
£62 MILLION
20% GOES TO THE GLA (PRECEPT AUTHORITY)
£25 MILLION
30% IS THE BUSINESS RATES BASELINE OF LAMBETH BOROUGH (BILLING AUTHORITY)
£37 MILLION
Source: IPPR
All local authorities, whether billing or precept, have their baseline funding level calculated in the same way. After business rates baselines have been calculated, all tariffs and top-ups also work exactly the same, irrespective of whether a body is a billing or precept authority.
5 The size of the precept is different for different types of precept authorities. While the GLA receives 20 per cent of total collected business rates, a shire county with fire responsibilities (for example), receives 10 per cent from each of its billing authorities.

IPPR | Better rates: How to ensure the new business rates regime promotes growth everywhere12
MITIGATING WINNERS AND LOSERS: THE SAFETY NET AND LEVY Two separate systems, involving a ‘levy’ and a ‘safety net’, are designed to mitigate the risk of excessive winners and excessive losers arising from the scheme of tariffs and top-ups.
A levy is charged to all local authorities that would otherwise receive ‘disproportionate benefit’ from business rates growth in their area (Keep and Berman 2013). According to the rules of the scheme, disproportionate growth in business rates is only possible when a 1 per cent increase in a local authority’s business rates baseline is greater than a 1 per cent increase in its baseline funding level. In other words, only those authorities who collect large amounts of business rates but have relatively smaller service responsibilities – otherwise known as tariff authorities – can be subject to the levy.
The value of the levy is taken as a percentage of the growth in retained business rates income, after tariffs and precept authorities have been taken into account. This percentage, or levy rate, varies depending on the disproportionate benefit a local authority stands to gain, and is calculated as the product of the following formula:
1 – [baseline funding level / business rates baseline]
If the formula yields a negative number, such as in the case of top-up authorities, then no levy is applied. The levy is also capped at a maximum of 50 per cent. If the calculation returns a figure larger than 0.5 then the rate remains at 0.5. In this way, even those tariff authorities receiving disproportionate benefit will always keep at least half of any growth in their retained business rates income.
The safety net operates as a separate system designed to mitigate extreme loss from the system of tariffs and top-ups. The system prevents retained business rates income from falling below a minimum floor, set at 92.5 per cent of an authority’s baseline funding level. If an authority’s retained business rates fall below this threshold, they receive a payment such that their income is brought back to the threshold. Safety net payments are part-funded from the receipts brought in from the levy. Where total levy payments fall short of the aggregate cost of maintaining the safety net, levy income is supplemented from central government funds – this has been the case for the BRRS in all years since 2013/14.

IPPR | Better rates: How to ensure the new business rates regime promotes growth everywhere13
3. MODELLING THE CHANGES TO COME: METHODOLOGY AND TECHNICAL NOTE
The details of 100-per-cent retention are currently under discussion, and we await a consultation on implementation in summer 2016. The 2015 spending review did, however, give some details on the mechanics of the new scheme (HMT 2015), including: • The entirety of business rates revenue, estimated at around
£30 billion by the end of the parliament, will be under the control of local authorities by 2020/21.
• ‘The main local government grant [the RSG] will be phased out.’• ‘The system of top-ups and tariffs which redistributes revenues
between local authorities will be retained.’
In addition, we learned from the March 2016 budget and supporting documents that: • The government has indicated its intention to abolish the levy on
disproportionate growth (HMT 2016b), however this has yet to be finally confirmed (CLCG 2016)
• Manchester and Liverpool will get full business rates retention early, from April 2017 (HMT 2016a).
• London authorities will get a greater share of their business rates, in return for funding Transport for London capital projects, from April 2017 (ibid).
• The annual indexation of business rates will switch from RPI to CPI (ibid).
INTERPRETING 100-PER-CENT RETENTION: NEW GAME, SAME RULESOther than the suggested abolition of the levy and the switch to CPI, all the indications are that the government is unlikely to depart significantly from the principles of the current BRRS. For this reason, in modelling future changes, our approach has been to follow the spirit, where possible, of the previous reforms that introduced 50-per-cent retention in 2013. This means that, as with 50-per-cent retention, 100-per-cent retention is defined at the aggregate level. The current system of tariffs and top-ups will continue to redistribute national business rates income across local authorities.
Under the current BRRS, the settlement funding assessment is met in its entirety through the local share and the RSG (see chapter 2). However, forecasts for business rates revenue over the current parliament show that total receipts will equal considerably more than both the local share
IPPR | Better rates: How to ensure the new business rates regime promotes growth everywhere14
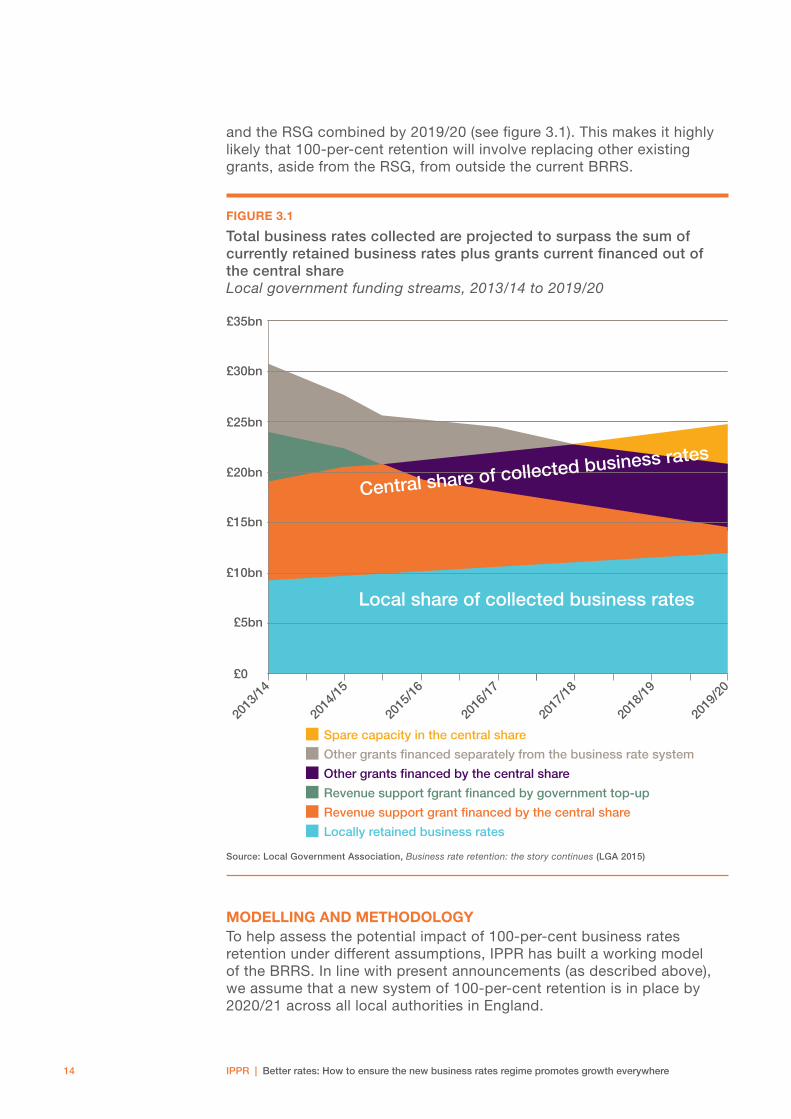
and the RSG combined by 2019/20 (see figure 3.1). This makes it highly likely that 100-per-cent retention will involve replacing other existing grants, aside from the RSG, from outside the current BRRS.
FIGURE 3.1
Total business rates collected are projected to surpass the sum of currently retained business rates plus grants current financed out of the central share Local government funding streams, 2013/14 to 2019/20
Other grants financed by the central share
Other grants financed separately from the business rate system
Spare capacity in the central share
Locally retained business rates
Revenue support grant financed by the central share
Revenue support fgrant financed by government top-up
£35bn
£30bn
£25bn
£20bn
£15bn
£10bn
£5bn
£0
2013
/14
2014
/15
2015
/16
2016
/17
2017
/18
2018
/19
2019
/20
Local share of collected business rates
Central share of collected business rates
Source: Local Government Association, Business rate retention: the story continues (LGA 2015)
MODELLING AND METHODOLOGYTo help assess the potential impact of 100-per-cent business rates retention under different assumptions, IPPR has built a working model of the BRRS. In line with present announcements (as described above), we assume that a new system of 100-per-cent retention is in place by 2020/21 across all local authorities in England.
IPPR | Better rates: How to ensure the new business rates regime promotes growth everywhere15
Our results are not designed to be a forecast of the likely impact of 100-per-cent retention on individual regions or local authorities. Under any new scheme of retention, the experience from one local council to the next will be driven by the specific circumstances in the local area and local economy. Rather, the objective of our model is to use realistic assumptions for regional variance in economic dynamics to capture the likely shape and spread of effects that 100-per-cent retention could have on the resources of local authorities at a system-wide level.
Current estimates for business rates revenue by local authority only exist out to 2016/17. To estimate a baseline for business rates collected in 2020/21, we apportion billing authorities with a share of the OBR forecast for total business rates across England, according to their average share during the seven years from 2010/11 to 2016/17.6
To calculate a new business rates baseline for each local authority under the new system, we no longer need to subtract 50 per cent for the central share. We therefore apply the present system of precepts to the full amount of collected business rates, to come up with a new business rates baseline for each authority in 2020/21.
To account for the fact that total business rates collected in 2020/21 are expected to be worth £10 billion more than the sum of all local authority SFAs for that year, we uprate the aggregate SFA to bring it into line with total collected business rates and in turn increase SFAs for each local authority proportionately. This should be interpreted as either other grants being cut, with responsibility for funding subsumed into the new 100-per-cent retention scheme, or else new responsibilities being granted to local authorities (as appears to have already been proposed for London, see above). Under this new system, given that the aggregate SFA is now entirely financed from business rates, the new baseline funding level for each local authority is now equal to that authority’s SFA, allowing top-ups and tariffs to continue working as they do under the present system. The one exception to this is that we assume, in line with announcements made at the 2016 budget, that tariffs, top-ups and baseline funding levels are uprated in line with CPI, as opposed with RPI.
To simulate the range of economic growth rates across different local authorities during the first five years of the 100-per-cent retention scheme, we take the average annual growth in business rates7 collected by local authorities for the period 2013/14 to 2016/17,8 and apply it to the period 2020/21 to 2025/26.
In the absence of any concrete announcements on the implementation of a safety net, we model options with and without. We also model one further scenario in which retained income for a local authority grows or shrinks as a proportion of their funding need, rather than as a proportion of their business rates baseline (see chapter 5 for a further explanation of this scheme and the reasons for running it as a scenario).
6 Net of reliefs and other adjustments and revised downwards to take account of the switch from RPI to CPI in the business rates multiplier.
7 This includes actual out-turns data as well as official expected receipts for 2015/16 and 2016/17.8 These years are selected on the grounds that they are the most recent years of relatively strong
economic growth since the financial crisis for which data is available.

IPPR | Better rates: How to ensure the new business rates regime promotes growth everywhere16
Finally, we also review the significance of 100-per-cent business retention in the context of wider local authority resources. To do this, we project local authority ‘core spending power’9 out to 2025/26, uprating council tax by 2 per cent a year and by a further 2 per cent for councils with social care responsibilities (in line with the respective maximum increases allowed under current central government policy without a referendum). Other grants included in core spending power are held constant in real terms.
We publish all results in 2016/17 prices.10
9 This is made up of the SFA, council tax, the Better Care Fund, the New Homes Bonus and the Rural Service Delivery Grant – by implication we have assumed that these latter grants have not been subsumed into the new 100-per-cent BRRS.
10 Using the GDP deflator series (HMT 2016c).
IPPR | Better rates: How to ensure the new business rates regime promotes growth everywhere17
4. THE IMPACT OF 100-PER-CENT BUSINESS RATES RETENTION
In the absence of further information pending the government summer consultation, our core assumption is that the new 100-per-cent retention scheme will reflect the current system as closely as possible, with a system of tariffs and top-ups based on the BRRS and a safety net set at 92.5 per cent of the baseline funding level. However, for our core projection we assume there will be no levy on disproportionate growth (in line with present government announcements).
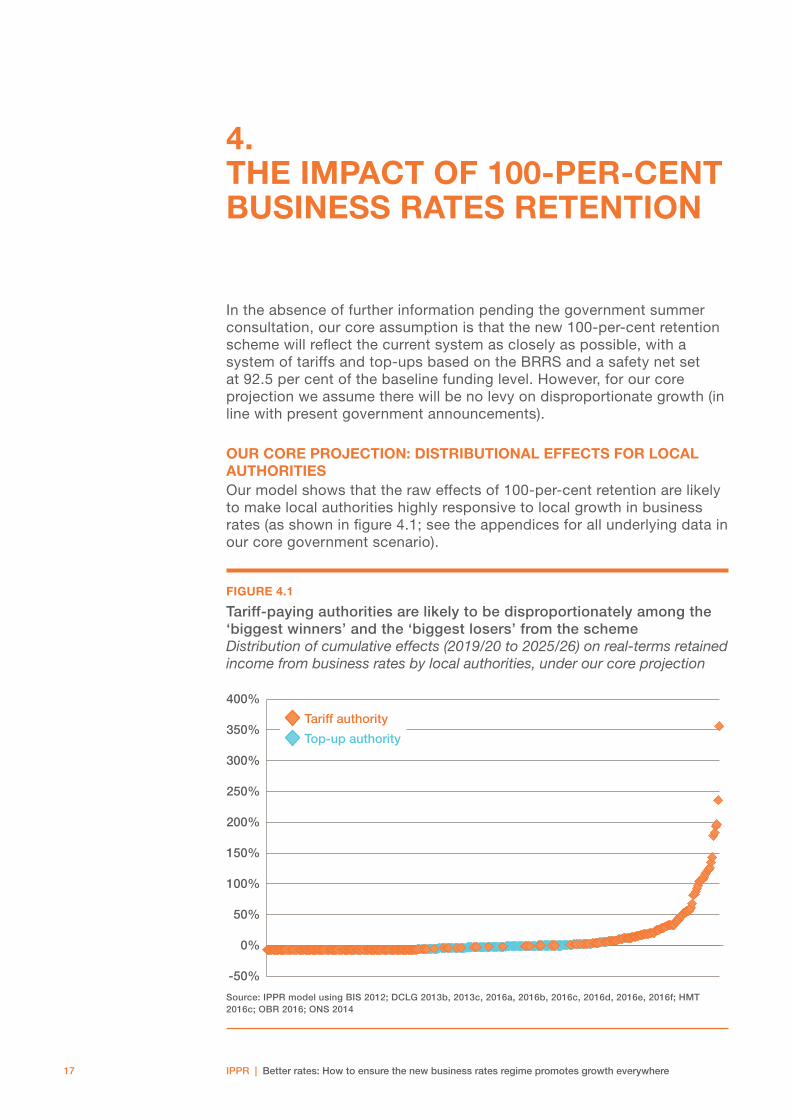
OUR CORE PROJECTION: DISTRIBUTIONAL EFFECTS FOR LOCAL AUTHORITIESOur model shows that the raw effects of 100-per-cent retention are likely to make local authorities highly responsive to local growth in business rates (as shown in figure 4.1; see the appendices for all underlying data in our core government scenario).
FIGURE 4.1
Tariff-paying authorities are likely to be disproportionately among the ‘biggest winners’ and the ‘biggest losers’ from the scheme Distribution of cumulative effects (2019/20 to 2025/26) on real-terms retained income from business rates by local authorities, under our core projection
-50%
0%
50%
100%
150%
200%
250%
300%
350%
400%
Top-up authority
Tariff authority
Source: IPPR model using BIS 2012; DCLG 2013b, 2013c, 2016a, 2016b, 2016c, 2016d, 2016e, 2016f; HMT 2016c; OBR 2016; ONS 2014
IPPR | Better rates: How to ensure the new business rates regime promotes growth everywhere18
Taking forward the OBR’s projections for inflation, a safety net set at the current rate would ensure that no local authority will lose out by more than around 7 per cent cumulatively between 2019/20 and 2025/26. If recent patterns in local growth continue, this could mean almost a quarter of councils requiring income from the safety net scheme across the period. Such a safety net would cost £290 million per year by 2025/26 (in 2016/17 prices).
At the other end of the spectrum, there are strong rewards for an expanding business rates base. Around 80 local authorities could see their retained income rise by 10 per cent or more in real terms, providing strong incentives to grow local business activity. Around 30 local authorities that are growing fastest and which have baseline funding levels much smaller than their business rates baselines, could see their retained income rise by between 50 and 400 per cent.
Top-up authoritiesTop-up authorities – councils with business rate baselines that are lower than their baseline funding levels at the time the scheme is set – are far more resilient to deteriorating business rates collection than tariff authorities. The use of a top-up to reach the baseline funding level in the first year of the scheme acts as a guaranteed income, uprated with inflation, and reduces the potential for heavy gains or losses from retained income. The larger the top-up relative to the funding level baseline, the stronger this effect becomes – and therefore so too do the incentives for a local authority to grow their local economy.
As a consequence, more top-up authorities (compared with tariff) are clustered around the middle of the distribution, with retained income changing by between -5 per cent and 3 per cent across the period. This is because, in many cases, retained income from the scheme is dominated by the top-up rather than underlying changes in business rates collection. This makes top-up authorities less likely to see significant gains, or to require a safety net payment. In effect, this also significantly reduces the incentives for poorer councils to grow their business rates base.
Richer and poorer local authoritiesIn summarised the results, we describe what are classified as ‘tariff’ and ‘top-up’ authorities in the present 50 per cent retention scheme as ‘richer’ and ‘poorer’ councils respectively. This is on the basis that any top-up authority has been classified as such by government because its local business rates are insufficient to meet its funding need, hence the need for a top-up. These local authorities have low economic activity relative to their social liabilities and are therefore ‘poor’. The inverse is true for tariff authorities, whose tax receipts from the value of local commercial assets exceed the value of their funding need, and are therefore ‘rich’.
IPPR | Better rates: How to ensure the new business rates regime promotes growth everywhere19
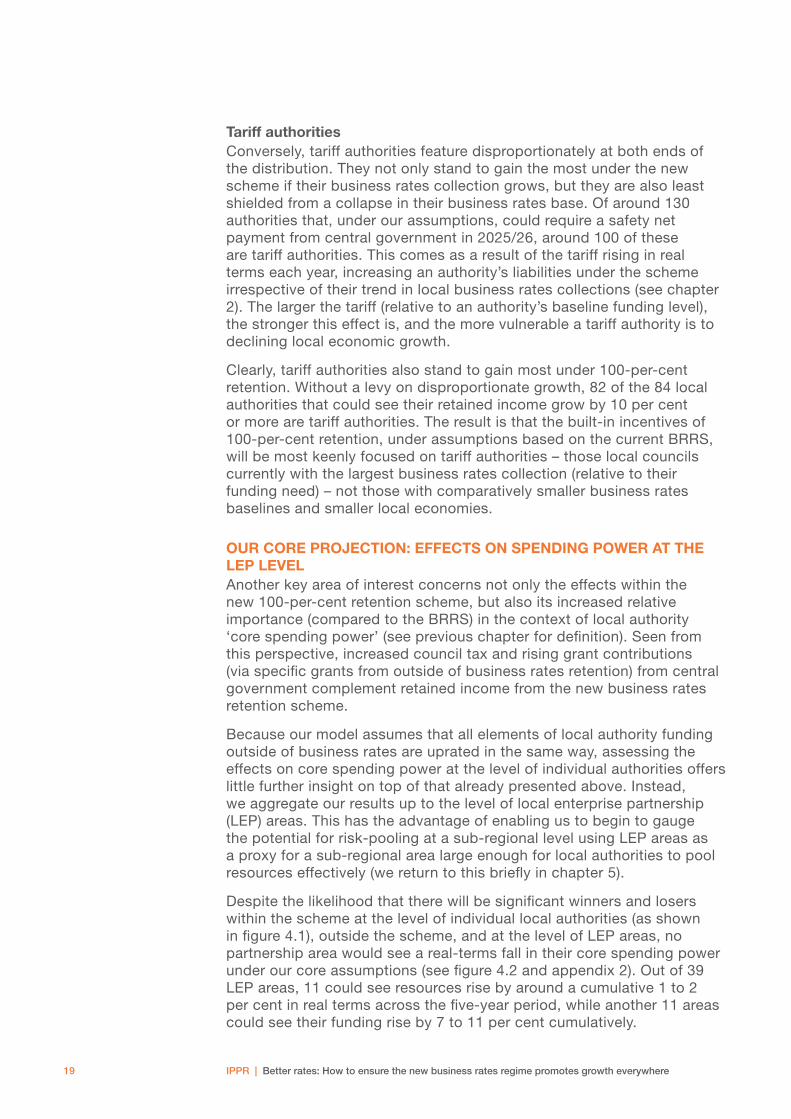
Tariff authoritiesConversely, tariff authorities feature disproportionately at both ends of the distribution. They not only stand to gain the most under the new scheme if their business rates collection grows, but they are also least shielded from a collapse in their business rates base. Of around 130 authorities that, under our assumptions, could require a safety net payment from central government in 2025/26, around 100 of these are tariff authorities. This comes as a result of the tariff rising in real terms each year, increasing an authority’s liabilities under the scheme irrespective of their trend in local business rates collections (see chapter 2). The larger the tariff (relative to an authority’s baseline funding level), the stronger this effect is, and the more vulnerable a tariff authority is to declining local economic growth.
Clearly, tariff authorities also stand to gain most under 100-per-cent retention. Without a levy on disproportionate growth, 82 of the 84 local authorities that could see their retained income grow by 10 per cent or more are tariff authorities. The result is that the built-in incentives of 100-per-cent retention, under assumptions based on the current BRRS, will be most keenly focused on tariff authorities – those local councils currently with the largest business rates collection (relative to their funding need) – not those with comparatively smaller business rates baselines and smaller local economies.
OUR CORE PROJECTION: EFFECTS ON SPENDING POWER AT THE LEP LEVELAnother key area of interest concerns not only the effects within the new 100-per-cent retention scheme, but also its increased relative importance (compared to the BRRS) in the context of local authority ‘core spending power’ (see previous chapter for definition). Seen from this perspective, increased council tax and rising grant contributions (via specific grants from outside of business rates retention) from central government complement retained income from the new business rates retention scheme.
Because our model assumes that all elements of local authority funding outside of business rates are uprated in the same way, assessing the effects on core spending power at the level of individual authorities offers little further insight on top of that already presented above. Instead, we aggregate our results up to the level of local enterprise partnership (LEP) areas. This has the advantage of enabling us to begin to gauge the potential for risk-pooling at a sub-regional level using LEP areas as a proxy for a sub-regional area large enough for local authorities to pool resources effectively (we return to this briefly in chapter 5).
Despite the likelihood that there will be significant winners and losers within the scheme at the level of individual local authorities (as shown in figure 4.1), outside the scheme, and at the level of LEP areas, no partnership area would see a real-terms fall in their core spending power under our core assumptions (see figure 4.2 and appendix 2). Out of 39 LEP areas, 11 could see resources rise by around a cumulative 1 to 2 per cent in real terms across the five-year period, while another 11 areas could see their funding rise by 7 to 11 per cent cumulatively.

IPPR | Better rates: How to ensure the new business rates regime promotes growth everywhere20
A caveat to this, however, is that changing demographics will also bring new increased demand for local government services. The UK’s growing population, with a significantly increasing proportion moving into retirement age throughout the 2020s, is likely to increase demand for local government services, such as old-age care, far faster than the rate of inflation (Roberts et al 2015). Our analysis shows that despite real-terms growth in aggregate core spending power at the LEP area level, a per-capita reading (which accounts only for population growth and not for its changing composition) shows that cumulative financial resources for services are likely to fall in some areas of England.
FIGURE 4.2
No LEP area need see core spending fall in real terms but it may decline on a per-capita basis Cumulative (2019/20 to 2025/26) percentage increase in local authority spending power by LEP area, real-terms and real-terms per capita
-5%
0%
5%
10%
15%
20%
Ent
erp
rise
M3
Cum
bri
aN
ort
ham
pto
nshi
reO
xfo
rdsh
ire L
EP
Buc
king
ham
shire
Tha
mes
Val
ley
Lanc
ashi
reN
ew A
nglia
Glo
uces
ters
hire
Tha
mes
Val
ley
Ber
kshi
reC
oas
t to
Cap
ital
Wes
t o
f E
ngla
ndS
out
h E
ast
Mid
land
sS
heff
ield
City
Reg
ion
So
lent
Her
tfo
rdsh
ireYo
rk &
No
rth
York
shire
Sw
ind
on
& W
iltsh
ireB
lack
Co
untr
yS
out
h E
ast
Gtr
Cam
bri
dg
e &
Gtr
Pet
erb
oro
ugh
Sto
ke-o
n-Tr
ent
& S
taff
ord
shire
Hea
rt o
f th
e S
out
h W
est
Do
rset
Che
shire
& W
arri
ngto
nD
erb
y, D
erb
yshi
re, N
ott
ing
ham
& N
ott
sH
umb
erT
he M
arch
esC
ove
ntry
& W
arw
icks
hire
Tees
Val
ley
Gtr
Bir
min
gha
m &
So
lihul
lW
orc
este
rshi
reLe
ices
ter
& L
eice
ster
shire
Leed
s C
ity R
egio
nC
orn
wal
l & t
he Is
les
of
Sci
llyG
tr M
anch
este
rLi
verp
oo
l City
Reg
ion
Lond
on
Gtr
Lin
coln
shire
No
rth
Eas
tern
Real % change per capita
Real % change
Source: IPPR model using BIS 2012; DCLG 2013b, 2013c, 2016a, 2016b, 2016c, 2016d, 2016e, 2016f; HMT 2016c; OBR 2016; ONS 2014
IPPR | Better rates: How to ensure the new business rates regime promotes growth everywhere21
FURTHER SCENARIO TESTING: LEVIES AND THE SAFETY NETPending the government’s consultation and aside from indications that the government plans to abolish the levy, there have been few further details or commitments on the future of the safety net in the new scheme. To cast further light on the implications for government policy decisions in this area, particularly with regards to the implications of discontinuing the levy, we model three further versions of 100-per-cent retention.• without a levy or a safety net• with a safety net and a levy set at a maximum rate of 50p in the
pound (as in the current BRRS)• with a safety net and a levy set at a maximum rate of 80p in the
pound.
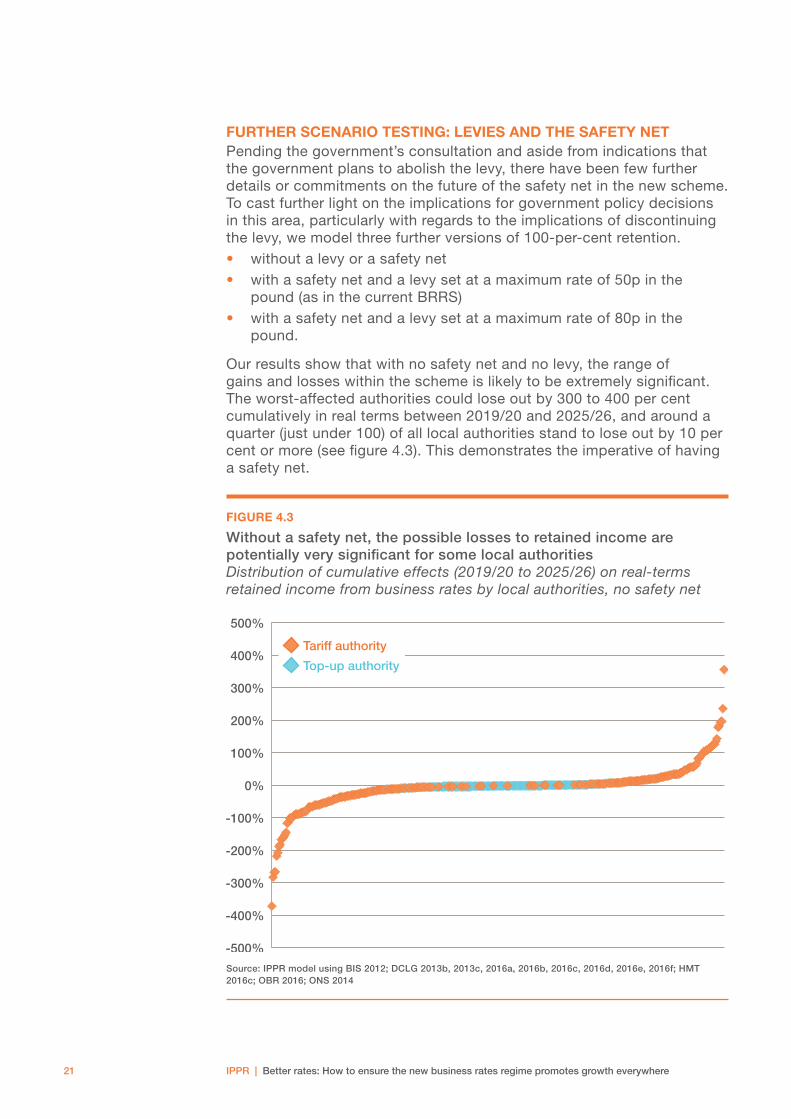
Our results show that with no safety net and no levy, the range of gains and losses within the scheme is likely to be extremely significant. The worst-affected authorities could lose out by 300 to 400 per cent cumulatively in real terms between 2019/20 and 2025/26, and around a quarter (just under 100) of all local authorities stand to lose out by 10 per cent or more (see figure 4.3). This demonstrates the imperative of having a safety net.
FIGURE 4.3
Without a safety net, the possible losses to retained income are potentially very significant for some local authorities Distribution of cumulative effects (2019/20 to 2025/26) on real-terms retained income from business rates by local authorities, no safety net
-500%
-400%
-300%
-200%
-100%
0%
100%
200%
300%
400%
500%
Top-up authority
Tariff authority
Source: IPPR model using BIS 2012; DCLG 2013b, 2013c, 2016a, 2016b, 2016c, 2016d, 2016e, 2016f; HMT 2016c; OBR 2016; ONS 2014

IPPR | Better rates: How to ensure the new business rates regime promotes growth everywhere22
Introducing a safety net to this scenario (but without a levy, as per our core government scenario) affects only the bottom end of the distribution. As discussed in our core projection above, around 130 local authorities will require an annual safety net payment during the next parliament to bring their retained income up to 92.5 per cent of their real-terms baseline funding level (see appendix 1).
As one might expect, introducing a levy on disproportionate growth affects tariff authorities near the top end of the distribution (see figures 4.4 and 4.5). A levy set at a maximum rate of 50 pence in the pound would affect 105 tariff authorities. It would also raise £170 million a year by 2025/26 (in 2016/17 prices) and reduce the maximum observed cumulative growth in retained income across the period to just under 200 per cent (down from nearly 400 per cent). In the absence of a levy, if the equivalent £170 million were to be found from the costs of the safety net, this would imply a minimum funding floor of less than 70 per cent of funding need, rahter than 92.5 per cent the system.
A maximum levy rate of 80 pence, on the other hand, could ensure that no local authority sees their retained income rise by more than 100 per cent. This would raise £250 million and would mean that those affected authorities would make a significant contribution to funding the annual cost of the safety net, which we estimate at £290 million a year by 2025/26 (see above).
FIGURE 4.4
A 50p levy on growth in retained incomes for tariff authorities could limit maximum gains to around 200 per cent Distribution of cumulative effects (2019/20 to 2025/26) on real-terms retained income from business rates by local authorities, with safety net and 50p levy
-50%
0%
50%
100%
150%
200%
250%
300%
350%
400%
Top-up authority
Tariff authority
Source: IPPR model using BIS 2012; DCLG 2013b, 2013c, 2016a, 2016b, 2016c, 2016d, 2016e, 2016f; HMT 2016c; OBR 2016; ONS 2014
IPPR | Better rates: How to ensure the new business rates regime promotes growth everywhere23
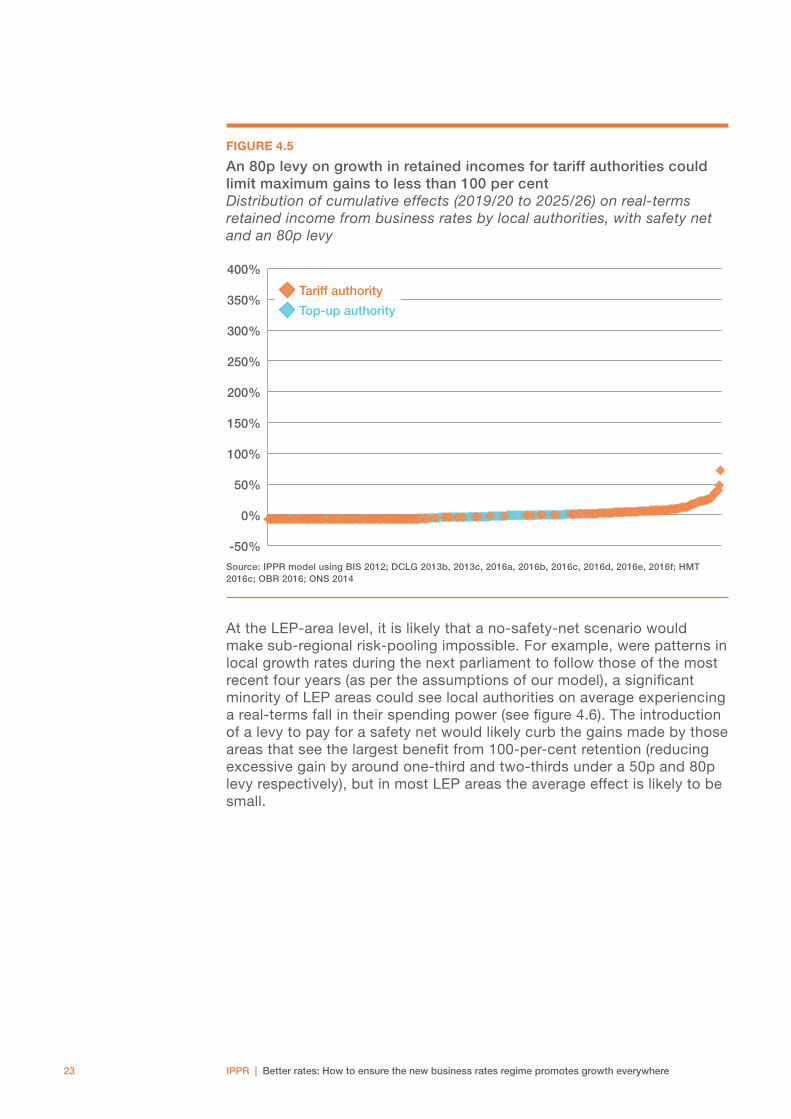
FIGURE 4.5
An 80p levy on growth in retained incomes for tariff authorities could limit maximum gains to less than 100 per cent Distribution of cumulative effects (2019/20 to 2025/26) on real-terms retained income from business rates by local authorities, with safety net and an 80p levy
-50%
0%
50%
100%
150%
200%
250%
300%
350%
400%
Top-up authority
Tariff authority
Source: IPPR model using BIS 2012; DCLG 2013b, 2013c, 2016a, 2016b, 2016c, 2016d, 2016e, 2016f; HMT 2016c; OBR 2016; ONS 2014
At the LEP-area level, it is likely that a no-safety-net scenario would make sub-regional risk-pooling impossible. For example, were patterns in local growth rates during the next parliament to follow those of the most recent four years (as per the assumptions of our model), a significant minority of LEP areas could see local authorities on average experiencing a real-terms fall in their spending power (see figure 4.6). The introduction of a levy to pay for a safety net would likely curb the gains made by those areas that see the largest benefit from 100-per-cent retention (reducing excessive gain by around one-third and two-thirds under a 50p and 80p levy respectively), but in most LEP areas the average effect is likely to be small.

IPPR | Better rates: How to ensure the new business rates regime promotes growth everywhere24
FIGURE 4.6
Mapping the effects of local authority changes at the LEP-area level
Without safety net With safety net:core government scenario
With safety net & levy (50p limit) With safety net & levy (80p limit)
3–6%
6–9%
>9%
-6–-3%
-3–0%
0–3%
<-6%
Source: IPPR model using BIS 2012; DCLG 2013b, 2013c, 2016a, 2016b, 2016c, 2016d, 2016e, 2016f; HMT 2016c; OBR 2016; ONS 2014
THE IMPACT OF ADDITIONAL REFORMS AND OTHER PERVERSE INCENTIVESThere are also significant problems with rolling out 100-per-cent retention in combination with two other planned reforms, which risk creating perverse side-effects in the local tax system. Along with outlining its plans for 100-per-cent retention, the government also set out its intention to (all HMT 2016b):

IPPR | Better rates: How to ensure the new business rates regime promotes growth everywhere25
• Give all local authorities ‘the power to reduce business rates to support business and jobs in their area’.
• Give full business rates relief to firms with rateable property values of £12,000 or less, and give tapered relief to firms with rateable value between £12,000 and £15,000. Government estimates that together this will benefit 650,000 businesses.
• Increase the threshold for the standard business rates multiplier to a rateable value of £51,000. This could take 250,000 commercial properties out of the higher rate and, in particular, reduce business rates for smaller businesses such as high-street shops.
The combined effect of these proposed measures will mean that the potential for reward for local authorities under 100-per-cent retention (in the form of higher retained income from business rates) will depend even more heavily on the composition of an area’s local economy. In particular, the proposed reforms to business rates incentivise the flow of public investment towards larger firms over smaller ones, as the latter will be contributing less to business rates receipts under the new system. In addition to the fact that incentives are likely to be felt most keenly by tariff authorities, this too could result in poor targeting of public investment.
A move to 100-per-cent retention is also likely to increase the trade-off between residential and commercial investment, with the former likely to lose out. The increased reliance on local business rates, relative to council tax and government grants, could see a reordering of priorities among local authority spending initiatives, which may adversely affect non-commercial projects, such as affordable housing and the development of residential and non-commercial amenities.
IPPR | Better rates: How to ensure the new business rates regime promotes growth everywhere26
5. SPREADING THE INCENTIVES: AN IPPR ALTERNATIVE
A central message for all local authorities is that the question of whether they stand to win or lose from any future system is contingent on their local economic growth. In whatever way the government designs the scheme, any measures that a local authority can take to stimulate local growth are likely to be more significant than any fine-tuning of the new business rates scheme. The results presented in this paper, therefore, do not represent a forecast for any individual local authority or LEP area.
That said, there are weaknesses in the current BRRS that look likely to be brought forward into the new 100-per-cent retention scheme, and therefore risk undermining the potential of the government’s proposed reforms.
GROWTH FIRST: AN ALTERNATIVE FORM OF 100-PER-CENT RETENTIONAs has been shown, the mechanics of the BRRS produce incentives that are focused most intensely upon tariff authorities – as a result of standing both to gain and to lose the most through 100-per-cent retention. The application of a levy – even at 80p in the pound – does little to reverse this. It curbs excessive growth at the top, but it does not address the problem of structural diminished incentives for top-up authorities due to the design of the scheme (see chapter 4). The sharpest incentives to invest in local economic development are aimed, therefore, at those local authorities who by definition already have a lot of local business activity relative to their funding level baseline. The system is, in this sense, backing those who are already ‘winning’.
If left unaddressed, this could represent poor targeting of resources and result in deadweight loss (or else a much lower return) on public investment in local economies than might otherwise be the case in other local authorities.
In effect, the existing architecture of the BRRS is likely to fail against the government’s own stated objectives for the scheme, namely, to provide incentives for all local authorities to grow their local economies. Instead, the current design produces unbalanced incentives, with tariff authorities standing to win and lose to a disproportionate degree, while incentives for top-up authorities are limited by the extent to which their retained income is decoupled from local business rates collection.

IPPR | Better rates: How to ensure the new business rates regime promotes growth everywhere27
However, our modelling has shown that an alternative system design – the ‘growth first’ scheme – which still follows all the principles of 100-per-cent retention as set out by government so far, could help to realign these incentives. The scheme would be similar to the government’s proposals in most respects. The processes of ‘setting’ the scheme would be identical to our core scenario for the government’s own proposals, with SFAs, tariffs and top-ups all calculated on the same basis as under the BRRS (see chapter 3). The difference, then, is that retained income after the first year of the scheme is calculated by applying the rate of growth (or contraction) in business rates collection to a local authority’s baseline funding level. This means that retained income for a local authority grows or shrinks as a proportion of their funding need, rather than by the cash change in their business rates baseline.
Under our core scenario, for example, a top-up authority with a business rates baseline of £5 million, and a baseline funding level of £50 million, can only ever gain or lose from a rise or fall in that £5 million in business rates. The significant majority of its retained income is made up of a top-up of £45 million, and this top-up remains unchanged in real terms irrespective of what happens to local business rates.
Under our alternative scenario, however, this changes. Instead, the percentage decline or increase in the £5 million in business rates is applied to the full baseline funding level of £50 million. For example, an increase in business rates collection of 2 per cent (in real terms) would mean that the top-up authority would increase its retained income by the same proportion of 2 per cent. This is far higher than under our core government proposal scenario, where the same local authority would see a 2 per cent rise in business rates yield an increase of just 0.2 per cent in their total retained income.
This scenario is made affordable by the opposite effect on tariff authorities. Their retained income also grows as a proportion of their baseline funding level, as opposed to their business rates baseline. As such, excessive gains are curbed. Under the present system, a local tariff authority – let’s assume the inverse of our top-up example above, with a baseline funding level of £5 million and a business rates baseline of £50 million – that saw its business rates grow by 2 per cent in real terms would see its retained income grow by 20 per cent in a single year. Under our alternative system – just as would be the case for top-up authorities – a real-terms increase of 2 per cent in collected business rates would lead to a 2 per cent rise in retained income.
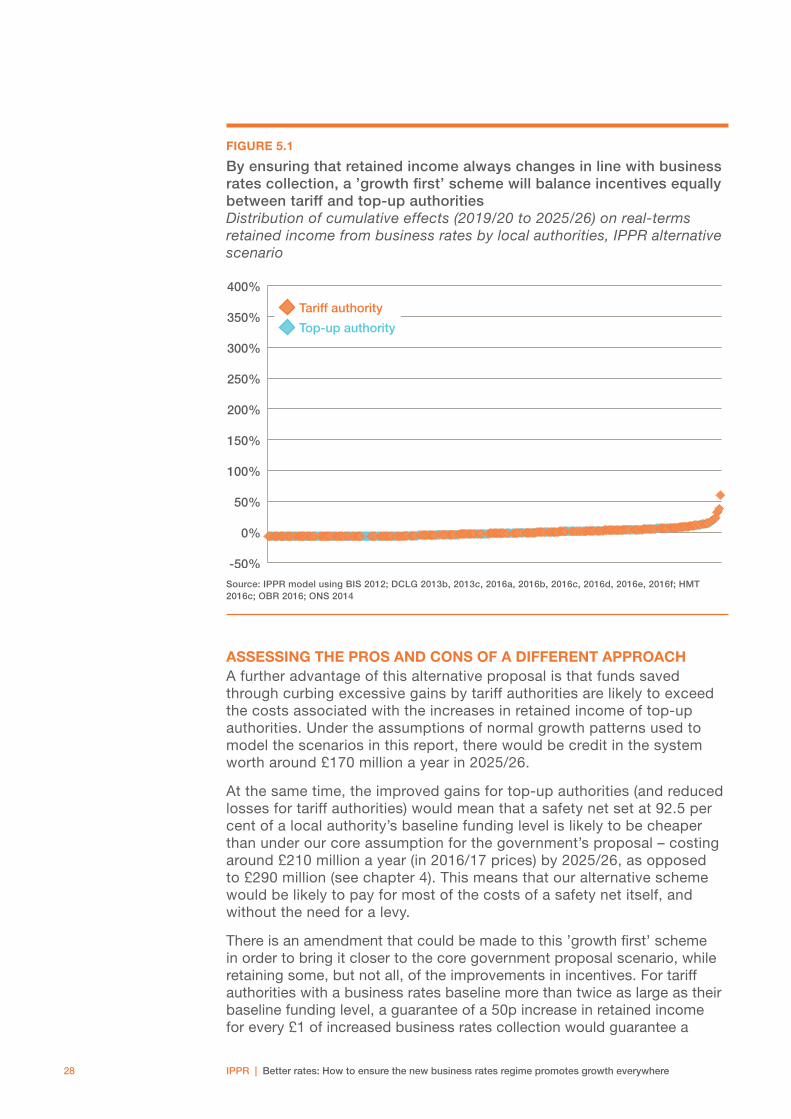
This alternative system would rebalance incentives between tariff and top-up authorities. In effect, the opportunity to see meaningful growth in retained income is made equal for all. As figure 5.1 shows, assuming that historical patterns of growth remain constant, this would see a much more even distribution of winners and losers between top-up and tariff authorities under the scheme, compared with all the scenarios modelled above.
IPPR | Better rates: How to ensure the new business rates regime promotes growth everywhere28
FIGURE 5.1
By ensuring that retained income always changes in line with business rates collection, a ’growth first’ scheme will balance incentives equally between tariff and top-up authorities Distribution of cumulative effects (2019/20 to 2025/26) on real-terms retained income from business rates by local authorities, IPPR alternative scenario
-50%
0%
50%
100%
150%
200%
250%
300%
350%
400%
Top-up authority
Tariff authority
Source: IPPR model using BIS 2012; DCLG 2013b, 2013c, 2016a, 2016b, 2016c, 2016d, 2016e, 2016f; HMT 2016c; OBR 2016; ONS 2014
ASSESSING THE PROS AND CONS OF A DIFFERENT APPROACHA further advantage of this alternative proposal is that funds saved through curbing excessive gains by tariff authorities are likely to exceed the costs associated with the increases in retained income of top-up authorities. Under the assumptions of normal growth patterns used to model the scenarios in this report, there would be credit in the system worth around £170 million a year in 2025/26.
At the same time, the improved gains for top-up authorities (and reduced losses for tariff authorities) would mean that a safety net set at 92.5 per cent of a local authority’s baseline funding level is likely to be cheaper than under our core assumption for the government’s proposal – costing around £210 million a year (in 2016/17 prices) by 2025/26, as opposed to £290 million (see chapter 4). This means that our alternative scheme would be likely to pay for most of the costs of a safety net itself, and without the need for a levy.
There is an amendment that could be made to this ’growth first’ scheme in order to bring it closer to the core government proposal scenario, while retaining some, but not all, of the improvements in incentives. For tariff authorities with a business rates baseline more than twice as large as their baseline funding level, a guarantee of a 50p increase in retained income for every £1 of increased business rates collection would guarantee a

IPPR | Better rates: How to ensure the new business rates regime promotes growth everywhere29
minimum reward for new business rates above what they would receive in the ‘growth first’ scheme. This could be paid for by building in a maximum increase for top-up authorities of £2 in retained income for every £1 in increased business rates collection. Under historical patterns of growth, the distributional effect would be similar to that of the 50p levy scenario presented above (see figure 4.4), but while the balance of incentives would not be as good as with the ‘growth first’ scheme, they would still be an improvement on the government scenarios presented in chapter 4.
TABLE 5.1
Pros and cons of different scenarios for 100-per-cent retention
Core governmentCore government
plus levy‘Growth first’
scheme‘Growth first’ scheme with
cap and collar
Pros Cons Pros Cons Pros Cons Pros Cons
Ince
ntiv
es
There are
strong
incentives for
some local
authorities
Incentives felt
more acutely
by all tariff
authorities
over all top-up
authorities
There are
strong
incentives for
some local
authorities
Incentives felt
more acutely
by all tariff
authorities
over all top-up
authorities
Strong
incentives
for local
authorities are
equal for both
tariff and top-
up authorities
Strong
incentives
for local
authorities
are more
balanced for
both tariff
and top-up
authorities
Incentives felt
more acutely
by some tariff
authorities
over some
top-up
authorities
Exc
essi
ve g
ains
The potential
for excessive
growth in
retained
income for
some tariff
authorities is
left uncurbed
The potential
for excessive
growth in
retained
income for
some tariff
authorities is
capped (at
50p in the
pound or 80p
in the pound
respectively)
There are no
excessive
gains. Gains
are always
proportionate
to a local
authorities
funding need
Excessive
gains are
capped at 50p
in the pound
Exc
essi
ve lo
sses
Safety net
prevents
excessive
losses in
retained
income
Safety net
is entirely
unfunded
Safety net
prevents
excessive
losses in
retained
income
The safety net
is part funded
by the levy
(this becomes
closer to being
cost neutral
with a levy
of 80p in the
pound)
Safety net
prevents
excessive
losses in
retained
income
The safety net
is partly or
fully funded
by the curbs
on excessive
gains for tariff
authorities
Safety net
prevents
excessive
losses in
retained
income
The safety
net is partly
funded by
the curbs on
excessive
gains for tariff
authorities
Co
sts
to g
ove
rnm
ent
The system
of tariffs
and top-ups
means that
the retention
scheme is
necessarily
cost neutral
(prior to the
application of
a safety net)
The system
of tariffs
and top-ups
means that
the retention
scheme is
necessarily
cost neutral
(prior to the
application of
a safety net)
Assuming
historical
patterns of
growth, the
scheme costs
less than
expected
aggregate
business rates
collection
The scheme
is not
necessarily
cost neutral,
and under
different
patterns
of growth
could cost
more than
aggregate
business rates
collection
Assuming
historical
patterns of
growth, the
scheme costs
less than
expected
aggregate
business rates
collection
The scheme
is not
necessarilly
cost neutral,
and under
different
patterns
of growth
could cost
more than
aggregate
business rates
collection
Source: IPPR

IPPR | Better rates: How to ensure the new business rates regime promotes growth everywhere30
It needs to be noted that, unlike the present system of tariffs and top-ups, neither our ‘growth first’ scheme nor the cap-and-collar variation on it is a mathematical zero-sum game. Aggregate retained income does not necessarily have to equal aggregate business rates collection. In the years modelled for this report, the costs of the scheme fall below the total collected business rates – such that it could in fact pay for a 92.5 per cent safety net (unlike our core government proposal scenario, where this is not paid for). But this is sensitive to patterns of growth across the country, and thus could change – although the ‘growth first’ scheme is unlikely to cost more than aggregated business rates while there are far more tariff authorities than top-up authorities. If required, however, it would be easy to mitigate against such a change in growth patterns in advance by grossing down retained income for all local authorities at a universal rate, such that the system comes back into fiscal balance.
IPPR | Better rates: How to ensure the new business rates regime promotes growth everywhere31
6. CONCLUSIONS AND RECOMMENDATIONS: FOUR ALTERNATIVES, AND BEYOND
Although we still await the details of the government’s plans for a new BRRS scheme, based on our best estimates of what a likely scheme might include, our modelling and analysis has demonstrated the following:
• The new 100-per-cent retention scheme, combined with the abolition of a levy, could see excessive gains for some areas of local government.
• Approximately 130 local authorities could rely on safety net payments in this period.
• Removing the levy on excessive growth could cost central government around £170 million a year by 2025/26 (in 2016/17 prices).
• For the reasons set out above, the incentives of 100-per-cent retention are likely to be felt most keenly by richer authorities, relative to poorer authorities.
This final point raises significant concerns about the extent to which the new BRRS will be ‘backing the winners’ rather than providing the desired incentives to all councils to stimulate local economic growth. Not only could this lead to significant amounts of deadweight cost to government, but it also stands to cost the government a significant amount of money to pay for the safety net. To the extent that many councils are left with weak incentives, the new system would appear to fail on its own terms.
For these reasons, IPPR would recommend that one of three alternative measures is adopted, ordered below in terms of their effectiveness at addressing the weaknesses of the government’s implied scheme.
ALTERNATIVE MEASURE 1: THE ‘GROWTH FIRST’ SCHEMEIPPR recommends an alternative system whereby retained income always rises and falls at exactly the same rate as changes in local business rates collection. This means that retained income for a local authority grows or shrinks as a proportion of its funding need, rather than by the cash change in their business rates baseline. Compared to the implied system under the government’s proposals, this system would provide much greater growth incentives for a larger number of top-up authorities, and it would pay for the costs of a safety net without the need for a levy.

IPPR | Better rates: How to ensure the new business rates regime promotes growth everywhere32
ALTERNATIVE MEASURE 2: ‘GROWTH FIRST’ PLUS CAP-AND-COLLARAn amendment to our preferred system would see limits on the potential gains for poorer councils (by capping increases in retained income to £2 for every £1 in increased business rates) and give a minimum rate of return for the richest authorities (of 50p in every £1 in increased business rates). The balance of incentives would not be as good as our preferred system, but would still be better than those implied by the government’s current proposals.
ALTERNATIVE MEASURE 3: RETAINING A LEVYIPPR recommends that government retains some form of levy on excessive growth, either at the 50p or 80p level, which would not only mitigate the extremes of any new BRRS but could also provide a means of paying for costs associated with the safety net.
Whether the government adopts any of our above proposals or not, we recommend one further reform for the consultation
ALTERNATIVE MEASURE 4: RISK-POOLING ACROSS LEP AREASIPPR recommends that an alternative redistributive mechanism could be considered by introducing risk-pooling at a sub-regional level. It is striking that the current reforms to business rates seek would represent ‘radical devolution’, yet occur within a centrally controlled and tightly defined system. Our analysis of the aggregated effects of 100-per-cent retention within LEP areas has shown that, under relatively modest assumptions, it is unlikely that any single LEP area will see a real-terms fall in core spending power among local authorities. This may open the door to exploring innovations that allow for risk-pooling at this geographic level, whether inside or outside the retention scheme itself. This might be a particularly attractive option for areas where combined authorities are in existence, and thus where a layer of governance already is in place spanning multiple local authorities.
BEYOND BUSINESS RATESThe UK has one of the most centralised and constrained systems of public finance in the developed world, and this is a key reason why it also has one of the most geographically imbalanced economies. There are clearly significant risks associated with pegging local authority spending capacity more closely to its local tax collection, as this could lock in and exacerbate existing disparities between London and the rest of England. Yet, as recent IPPR analysis has shown, current imbalances in public investment caused by centralised decision-making have tended to privilege the most economically prosperous regions of the country (Raikes 2015). Handing over the keys to local resources to local decision-makers could help to increase the fairness and effectiveness of public spending locally. For this reason, in principle, there are significant opportunities to further devolved taxation, including business rates.
But, as our analysis has shown, the ability to devise a system of fiscal devolution based on business rates alone has significant limitations. Balancing the importance of providing good incentives to drive local economic growth with the need for a system that is fair and transparent

IPPR | Better rates: How to ensure the new business rates regime promotes growth everywhere33
is an enormous challenge when there is such a high level of local and regional inequality. More fundamentally, tying the provision of vital public services directly to local economic composition and performance is a strange and risky combination.
This is not to say that it should not be done, but that it cannot be done in isolation. In most developed nations, local and sub-national authorities raise and retain a much higher proportion of tax revenues derived from a wide variety of different revenue streams including property taxes, tourist taxes, other local ‘sin’ taxes, and even a share of income tax. This enables much greater local freedom and more appropriate hypothecation than when these funds are limited to a single revenue stream. The fact that these taxes are often levied and pooled over wider geographies than English local authority areas also facilitates more regional redistribution, taking pressure off a nationally redistributive system.
This paper is not the place to make a detailed case for other possibilities for fiscal devolution in England, but it does point to the need to see business rates retention as the first step towards a much broader and more long-term approach to fiscal devolution.
IPPR | Better rates: How to ensure the new business rates regime promotes growth everywhere34
REFERENCES
Communities and Local Government Committee [CLGC] (2016) 100 per cent retention of business rates: issues for consideration, House of Commons. http://www.publications.parliament.uk/pa/cm201617/cmselect/cmcomloc/241/241.pdf
Department for Business, Innovation and Skills [BIS] (2012) Local authority (district/unitary) areas covered by LEPs. https://www.gov.uk/government/publications/local-enterprise-partnerships-local-authority-mapping
Department for Communities and Local Government [DCLG] (2013a) Business rates retention and the local government finance settlement: a practitioner’s guide (version 3). https://www.gov.uk/government/publications/business-rates-retention-and-the-local-government-finance-settlement-a-practitioners-guide
Department for Communities and Local Government [DCLG] (2013b) ‘Business Rates Baseline calculation model’, spreadsheet. http://webarchive.nationalarchives.gov.uk/20140505104649/http:/www.local.communities.gov.uk/finance/1314/settle.htm
Department for Communities and Local Government [DCLG] (2013c) Core spending power: supporting information. https://www.gov.uk/government/publications/core-spending-power-final-local-government-finance-settlement-2016-to-2017
Department for Communities and Local Government [DCLG] (2016a) NNDR1 local authority data: 2016 to 2017. https://www.gov.uk/government/statistical-data-sets/national-non-domestic-rates-local-authority-level-data
Department for Communities and Local Government [DCLG] (2016b) NNDR1 local authority data: 2015 to 2016. https://www.gov.uk/government/statistical-data-sets/national-non-domestic-rates-local-authority-level-data
Department for Communities and Local Government [DCLG] (2016c) NNDR1 local authority data: 2014 to 2015. https://www.gov.uk/government/statistical-data-sets/national-non-domestic-rates-local-authority-level-data
Department for Communities and Local Government [DCLG] (2016d) NNDR1 local authority data: 2013 to 2014. https://www.gov.uk/government/statistical-data-sets/national-non-domestic-rates-local-authority-level-data
Department for Communities and Local Government [DCLG] (2016e) NNDR1 local authority data: 2012 to 2013. https://www.gov.uk/government/statistical-data-sets/national-non-domestic-rates-local-authority-level-data
Department for Communities and Local Government [DCLG] (2016f) NNDR1 local authority data: 2011 to 2012. https://www.gov.uk/government/statistical-data-sets/national-non-domestic-rates-local-authority-level-data
HM Treasury [HMT] (2015) Spending Review and Autumn Statement. https://www.gov.uk/government/publications/spending-review-and-autumn-statement-2015-documents
HM Treasury [HMT] (2016a) Budget 2016. https://www.gov.uk/government/publications/budget-2016-documents
HM Treasury [HMT] (2016b) Business rates review: Summary of responses. https://www.gov.uk/government/uploads/system/uploads/attachment_data/file/510497/PU1925_Business_rates_review.pdf
HM Treasury [HMT] (2016c) ‘GDP deflators at market prices, and money GDP: March 2016 (Budget)’. https://www.gov.uk/government/uploads/system/uploads/attachment_data/file/509245/GDP_Deflators_Budget_2016_update.csv/preview
Keep M and Berman G (2013) The Local Government Finance Settlement 2013/14 and 2014/15, House of Commons Library research paper 13/10. http://researchbriefings.parliament.uk/ResearchBriefing/Summary/RP13-10
Local Government Association [LGA] (2015) Business rate retention: the story continues. http://www.local.gov.uk/documents/10180/11309/L15-127+Business+rates+retention_v03+(7).pdf/25da4d89-5a12-482a-a83c-69eac0555d9b

IPPR | Better rates: How to ensure the new business rates regime promotes growth everywhere35
Office for Budget Responsibility [OBR] (2016) Economic and fiscal outlook – March 2016. http://budgetresponsibility.org.uk/efo/economic-fiscal-outlook-march-2016/
Office for National Statistics [ONS] (2014) ‘Subnational population projections for England: 2012-based’, data. http://www.ons.gov.uk/peoplepopulationandcommunity/populationandmigration/populationprojections/bulletins/subnationalpopulationprojectionsforengland/2014-05-29
Osborne G (2015) speech, Conservative party conference, Birmingham, 5 October 2015. http://www.conservativehome.com/parliament/2015/10/george-osbornes-speech-in-full.html
Raikes L (2015) Tax, spend and northern productivity: A regional analysis of household income, taxation and public spending, IPPR North. http://www.ippr.org/publications/tax-spend-and-northern-productivity
Roberts A, Thompson S, Charlesworth A, Gershlick B and Stirling A (2015) Filling the gap: Tax and fiscal options for a sustainable UK health and social care system, Health Foundation. http://www.health.org.uk/publication/filling-gap
Sandford M (2015) Business rates, House of Commons Library briefing paper 06247. http://researchbriefings.parliament.uk/ResearchBriefing/Summary/SN06247
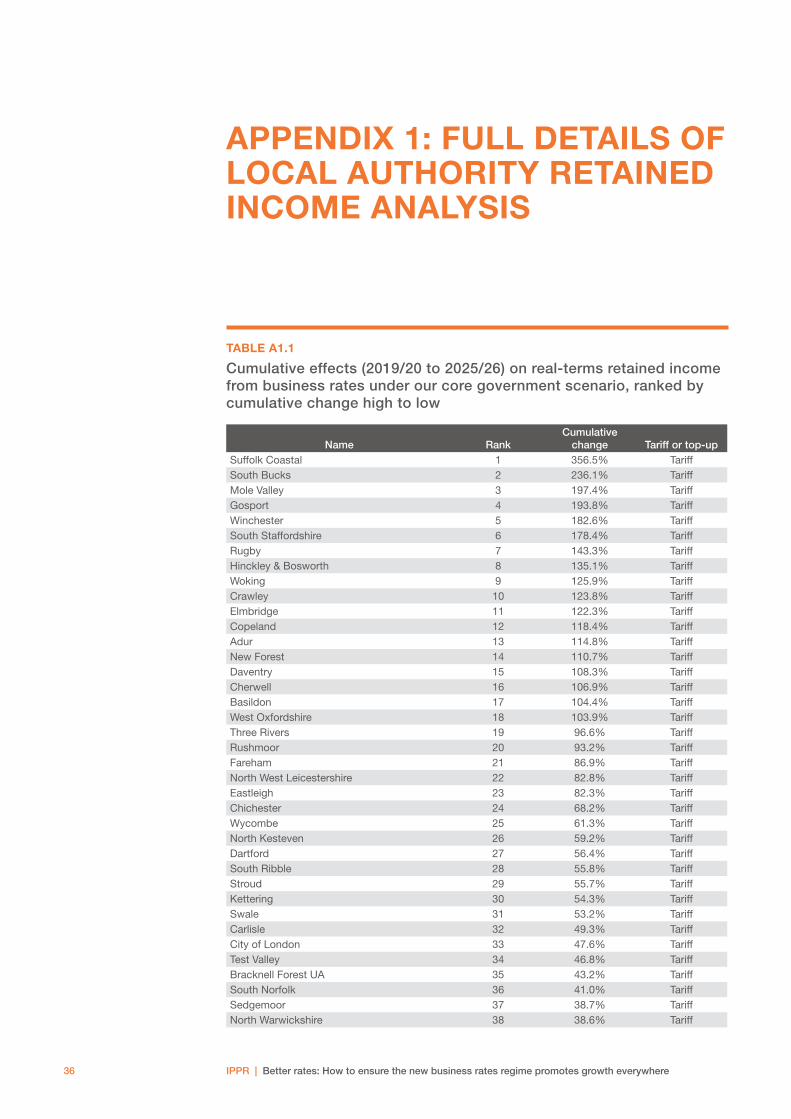
IPPR | Better rates: How to ensure the new business rates regime promotes growth everywhere36
APPENDIX 1: FULL DETAILS OF LOCAL AUTHORITY RETAINED INCOME ANALYSIS
TABLE A1.1
Cumulative effects (2019/20 to 2025/26) on real-terms retained income from business rates under our core government scenario, ranked by cumulative change high to low
Name RankCumulative
change Tariff or top-upSuffolk Coastal 1 356.5% TariffSouth Bucks 2 236.1% TariffMole Valley 3 197.4% TariffGosport 4 193.8% TariffWinchester 5 182.6% TariffSouth Staffordshire 6 178.4% TariffRugby 7 143.3% TariffHinckley & Bosworth 8 135.1% TariffWoking 9 125.9% TariffCrawley 10 123.8% TariffElmbridge 11 122.3% TariffCopeland 12 118.4% TariffAdur 13 114.8% TariffNew Forest 14 110.7% TariffDaventry 15 108.3% TariffCherwell 16 106.9% TariffBasildon 17 104.4% TariffWest Oxfordshire 18 103.9% TariffThree Rivers 19 96.6% TariffRushmoor 20 93.2% TariffFareham 21 86.9% TariffNorth West Leicestershire 22 82.8% TariffEastleigh 23 82.3% TariffChichester 24 68.2% TariffWycombe 25 61.3% TariffNorth Kesteven 26 59.2% TariffDartford 27 56.4% TariffSouth Ribble 28 55.8% TariffStroud 29 55.7% TariffKettering 30 54.3% TariffSwale 31 53.2% TariffCarlisle 32 49.3% TariffCity of London 33 47.6% TariffTest Valley 34 46.8% TariffBracknell Forest UA 35 43.2% TariffSouth Norfolk 36 41.0% TariffSedgemoor 37 38.7% TariffNorth Warwickshire 38 38.6% Tariff

IPPR | Better rates: How to ensure the new business rates regime promotes growth everywhere37
Hertsmere 39 34.4% TariffSouth Derbyshire 40 34.1% TariffWindsor & Maidenhead UA 41 33.3% TariffSouth Northamptonshire 42 33.0% TariffMaldon 43 32.9% TariffAllerdale 44 32.8% TariffBrighton and Hove 45 32.4% Top-upEpping Forest 46 31.0% TariffGuildford 47 30.3% TariffStafford 48 29.4% TariffWestminster 49 28.1% TariffBolsover 50 27.6% TariffHavant 51 26.6% TariffLewes 52 25.3% TariffBlaby 53 25.0% TariffChorley 54 24.7% TariffMaidstone 55 23.7% TariffBroxbourne 56 21.5% TariffSevenoaks 57 21.0% TariffTower Hamlets 58 20.2% Top-upColchester 59 20.1% TariffWokingham UA 60 20.1% TariffRossendale 61 19.3% TariffChesterfield 62 19.0% TariffEast Cambridgeshire 63 18.1% TariffGloucester 64 17.6% TariffSouth Kesteven 65 17.5% TariffGreat Yarmouth 66 17.4% TariffSouth Gloucestershire UA 67 17.1% TariffAshfield 68 17.1% TariffHillingdon 69 15.9% TariffEast Northamptonshire 70 15.8% TariffErewash 71 14.7% TariffWarrington UA 72 14.5% TariffMilton Keynes UA 73 14.4% TariffCannock Chase 74 13.5% TariffBraintree 75 12.6% TariffChristchurch 76 12.4% TariffTrafford 77 12.2% TariffSouth Lakeland 78 12.2% TariffMid Sussex 79 12.0% TariffEast Riding of Yorkshire UA 80 11.9% TariffDerby UA 81 11.7% Top-upBreckland 82 11.6% TariffIpswich 83 10.7% TariffFenland 84 10.4% TariffHounslow 85 10.1% TariffSouthwark 86 9.5% Top-upCentral Bedfordshire UA 87 8.8% TariffKings Lynn & West Norfolk 88 8.4% TariffNorth Lincolnshire UA 89 8.4% TariffRibble Valley 90 8.3% TariffBassetlaw 91 8.2% TariffTunbridge Wells 92 7.8% TariffSalford 93 7.5% Top-upWealden 94 7.4% TariffYork UA 95 7.0% TariffHammersmith & Fulham 96 6.4% Top-upForest of Dean 97 6.2% TariffGravesham 98 6.0% Tariff

IPPR | Better rates: How to ensure the new business rates regime promotes growth everywhere38
Stoke-on-Trent UA 99 5.8% Top-upNottingham UA 100 5.7% Top-upPeterborough UA 101 5.3% TariffMedway UA 102 5.0% Top-upHorsham 103 4.3% TariffNorth Norfolk 104 4.0% TariffMid Suffolk 105 4.0% TariffBristol 106 4.0% TariffSouthend-on-Sea UA 107 3.8% Top-upNorth Somerset UA 108 3.6% TariffDoncaster 109 3.4% Top-upKingston upon Hull UA 110 3.1% Top-upBath & North East Somerset 111 2.8% TariffEast Sussex CFA 112 2.7% Top-upGLA 113 2.7% TariffSheffield 114 2.5% Top-upSlough UA 115 2.5% TariffEaling 116 2.2% Top-upHampshire 117 2.1% Top-upDerbyshire Dales 118 2.0% TariffRoyal Berkshire CFA 119 1.9% Top-upGreenwich 120 1.8% Top-upBuckinghamshire CFA 121 1.8% Top-upKingston upon Thames 122 1.8% TariffReading UA 123 1.7% TariffLewisham 124 1.5% Top-upGateshead 125 1.5% Top-upWest Sussex 126 1.5% Top-upLeeds 127 1.4% TariffBolton 128 1.1% Top-upLeicester UA 129 1.1% Top-upAvon CFA 130 1.0% Top-upDerbyshire CFA 131 0.8% Top-upCoventry 132 0.8% Top-upManchester 133 0.8% Top-upBrent 134 0.5% Top-upLeicestershire 135 0.5% Top-upHumberside CFA 136 0.4% Top-upBradford 137 0.3% Top-upSuffolk 138 0.3% Top-upPlymouth UA 139 0.3% Top-upTendring 140 0.2% TariffCumbria 141 0.2% Top-upBedford UA 142 0.2% TariffBuckinghamshire 143 0.2% Top-upLeicestershire CFA 144 0.2% Top-upOxfordshire 145 0.0% Top-upWarwickshire 146 -0.1% Top-upStaffordshire CFA 147 -0.2% Top-upWigan 148 -0.3% Top-upBedfordshire CFA 149 -0.3% Top-upLambeth 150 -0.3% Top-upBexley 151 -0.3% Top-upBabergh 152 -0.4% TariffRother 153 -0.4% TariffTameside 154 -0.5% Top-upGreater Manchester Fire 155 -0.5% Top-upDerbyshire 156 -0.6% Top-upSandwell 157 -0.6% Top-upSouth Yorkshire Fire & CD Authority 158 -0.6% Top-up
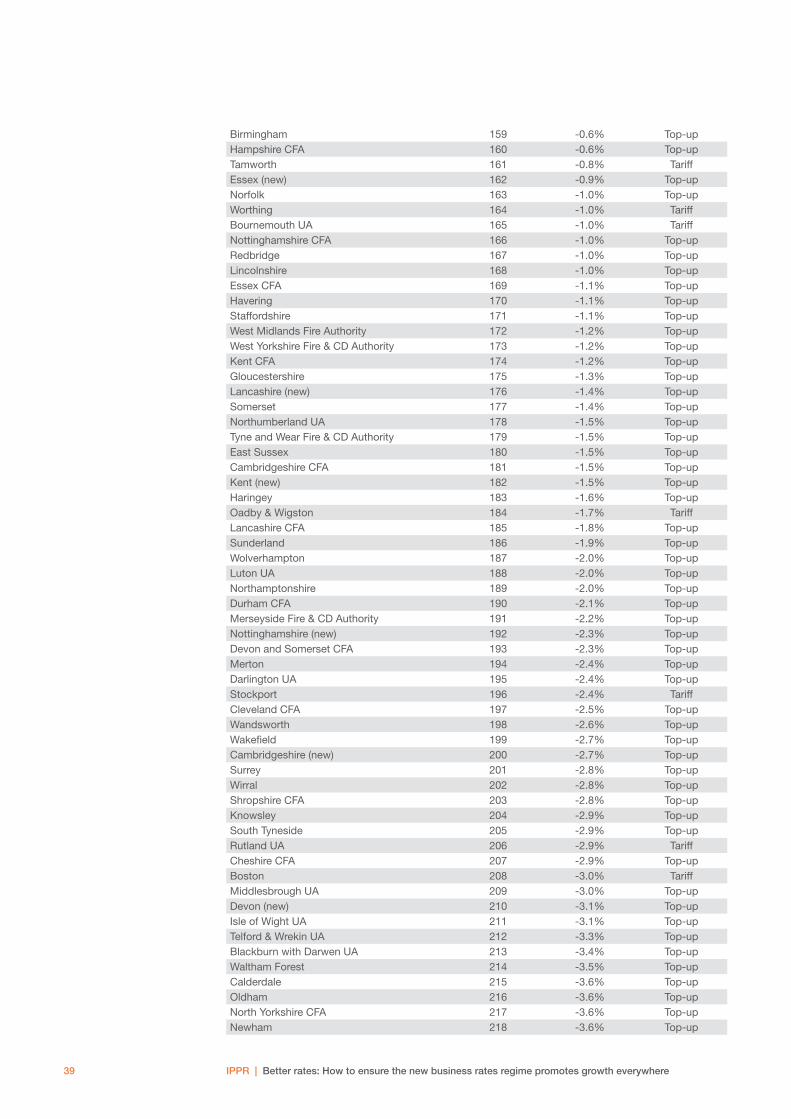
IPPR | Better rates: How to ensure the new business rates regime promotes growth everywhere39
Birmingham 159 -0.6% Top-upHampshire CFA 160 -0.6% Top-upTamworth 161 -0.8% TariffEssex (new) 162 -0.9% Top-upNorfolk 163 -1.0% Top-upWorthing 164 -1.0% TariffBournemouth UA 165 -1.0% TariffNottinghamshire CFA 166 -1.0% Top-upRedbridge 167 -1.0% Top-upLincolnshire 168 -1.0% Top-upEssex CFA 169 -1.1% Top-upHavering 170 -1.1% Top-upStaffordshire 171 -1.1% Top-upWest Midlands Fire Authority 172 -1.2% Top-upWest Yorkshire Fire & CD Authority 173 -1.2% Top-upKent CFA 174 -1.2% Top-upGloucestershire 175 -1.3% Top-upLancashire (new) 176 -1.4% Top-upSomerset 177 -1.4% Top-upNorthumberland UA 178 -1.5% Top-upTyne and Wear Fire & CD Authority 179 -1.5% Top-upEast Sussex 180 -1.5% Top-upCambridgeshire CFA 181 -1.5% Top-upKent (new) 182 -1.5% Top-upHaringey 183 -1.6% Top-upOadby & Wigston 184 -1.7% TariffLancashire CFA 185 -1.8% Top-upSunderland 186 -1.9% Top-upWolverhampton 187 -2.0% Top-upLuton UA 188 -2.0% Top-upNorthamptonshire 189 -2.0% Top-upDurham CFA 190 -2.1% Top-upMerseyside Fire & CD Authority 191 -2.2% Top-upNottinghamshire (new) 192 -2.3% Top-upDevon and Somerset CFA 193 -2.3% Top-upMerton 194 -2.4% Top-upDarlington UA 195 -2.4% Top-upStockport 196 -2.4% TariffCleveland CFA 197 -2.5% Top-upWandsworth 198 -2.6% Top-upWakefield 199 -2.7% Top-upCambridgeshire (new) 200 -2.7% Top-upSurrey 201 -2.8% Top-upWirral 202 -2.8% Top-upShropshire CFA 203 -2.8% Top-upKnowsley 204 -2.9% Top-upSouth Tyneside 205 -2.9% Top-upRutland UA 206 -2.9% TariffCheshire CFA 207 -2.9% Top-upBoston 208 -3.0% TariffMiddlesbrough UA 209 -3.0% Top-upDevon (new) 210 -3.1% Top-upIsle of Wight UA 211 -3.1% Top-upTelford & Wrekin UA 212 -3.3% Top-upBlackburn with Darwen UA 213 -3.4% Top-upWaltham Forest 214 -3.5% Top-upCalderdale 215 -3.6% Top-upOldham 216 -3.6% Top-upNorth Yorkshire CFA 217 -3.6% Top-upNewham 218 -3.6% Top-up

IPPR | Better rates: How to ensure the new business rates regime promotes growth everywhere40
Burnley 219 -3.7% TariffDorest and wiltshire 220 -3.7% Top-upDorset 221 -3.7% Top-upWalsall 222 -3.7% Top-upArun 223 -3.7% TariffBarnsley 224 -3.7% Top-upNewcastle upon Tyne 225 -3.7% Top-upIsles of Scilly 226 -3.8% Top-upHertfordshire 227 -4.0% Top-upRochdale 228 -4.0% Top-upWorcestershire 229 -4.1% Top-upCheltenham 230 -4.1% TariffStockton-on-Tees UA 231 -4.1% TariffHackney 232 -4.2% Top-upIslington 233 -4.3% Top-upWyre 234 -4.3% TariffEnfield 235 -4.3% Top-upSt Helens 236 -4.4% Top-upHereford & Worcester CFA 237 -4.4% Top-upDurham UA 238 -4.4% Top-upNorth Tyneside 239 -4.8% Top-upNorth Yorkshire (new) 240 -4.8% Top-upHalton UA 241 -4.9% Top-upRichmond upon Thames 242 -5.0% TariffSutton 243 -5.1% Top-upLiverpool 244 -5.2% Top-upBarking & Dagenham 245 -5.3% Top-upDudley 246 -5.4% Top-upNorth East Lincolnshire UA 247 -5.5% Top-upPendle 248 -5.5% TariffSefton 249 -5.7% Top-upStratford-on-Avon 250 -5.9% TariffCamden 251 -6.1% TariffBlackpool UA 252 -6.1% Top-upRotherham 253 -6.3% Top-upTorridge 254 -6.3% TariffTorbay UA 255 -6.4% Top-upSolihull 256 -6.4% TariffShepway 257 -6.6% TariffHambleton 258 -6.6% TariffHarborough 259 -6.6% TariffCambridge 260 -6.6% TariffChiltern 261 -6.6% TariffHarlow 262 -6.6% TariffVale of White Horse 263 -6.6% TariffWeymouth & Portland 264 -6.6% TariffAylesbury Vale 265 -6.6% TariffBarnet 266 -6.6% Top-upBasingstoke & Deane 267 -6.6% TariffEast Lindsey 268 -6.6% TariffEastbourne 269 -6.6% TariffEden 270 -6.6% TariffHastings 271 -6.6% TariffNewcastle-under-Lyme 272 -6.6% TariffRedcar & Cleveland UA 273 -6.6% Top-upReigate & Banstead 274 -6.6% TariffSelby 275 -6.6% TariffSouth Hams 276 -6.6% TariffSouth Somerset 277 -6.6% TariffSpelthorne 278 -6.6% Tariff

IPPR | Better rates: How to ensure the new business rates regime promotes growth everywhere41
St Albans 279 -6.6% TariffStaffordshire Moorlands 280 -6.6% TariffTaunton Deane 281 -6.6% TariffThurrock UA 282 -6.6% TariffWelwyn Hatfield 283 -6.6% TariffWest Somerset 284 -6.6% TariffWorcester 285 -6.6% TariffWychavon 286 -6.6% TariffWyre Forest 287 -6.6% TariffAshford 288 -6.6% TariffBrentwood 289 -6.6% TariffBromley 290 -6.6% Top-upBromsgrove 291 -6.6% TariffBury 292 -6.6% Top-upCanterbury 293 -6.6% TariffChelmsford 294 -6.6% TariffCheshire East UA 295 -6.6% TariffCotswold 296 -6.6% TariffDover 297 -6.6% TariffEast Devon 298 -6.6% TariffExeter 299 -6.6% TariffFylde 300 -6.6% TariffGedling 301 -6.6% TariffHerefordshire UA 302 -6.6% Top-upHyndburn 303 -6.6% TariffKirklees 304 -6.6% Top-upLichfield 305 -6.6% TariffLincoln 306 -6.6% TariffMalvern Hills 307 -6.6% TariffMansfield 308 -6.6% TariffMendip 309 -6.6% TariffMid Devon 310 -6.6% TariffNewark & Sherwood 311 -6.6% TariffNorth Devon 312 -6.6% TariffNorth Dorset 313 -6.6% TariffNuneaton & Bedworth 314 -6.6% TariffPortsmouth UA 315 -6.6% Top-upRedditch 316 -6.6% TariffRochford 317 -6.6% TariffRushcliffe 318 -6.6% TariffRyedale 319 -6.6% TariffScarborough 320 -6.6% TariffShropshire UA 321 -6.6% Top-upSouth Cambridgeshire 322 -6.6% TariffSouth Oxfordshire 323 -6.6% TariffSouthampton UA 324 -6.6% Top-upSt Edmundsbury 325 -6.6% TariffSurrey Heath 326 -6.6% TariffTeignbridge 327 -6.6% TariffUttlesford 328 -6.6% TariffWarwick 329 -6.6% TariffWatford 330 -6.6% TariffWaveney 331 -6.6% TariffWaverley 332 -6.6% TariffWellingborough 333 -6.6% TariffWest Dorset 334 -6.6% TariffWest Lancashire 335 -6.6% TariffWiltshire UA 336 -6.6% TariffAmber Valley 337 -6.6% TariffBarrow-in-Furness 338 -6.6% Tariff
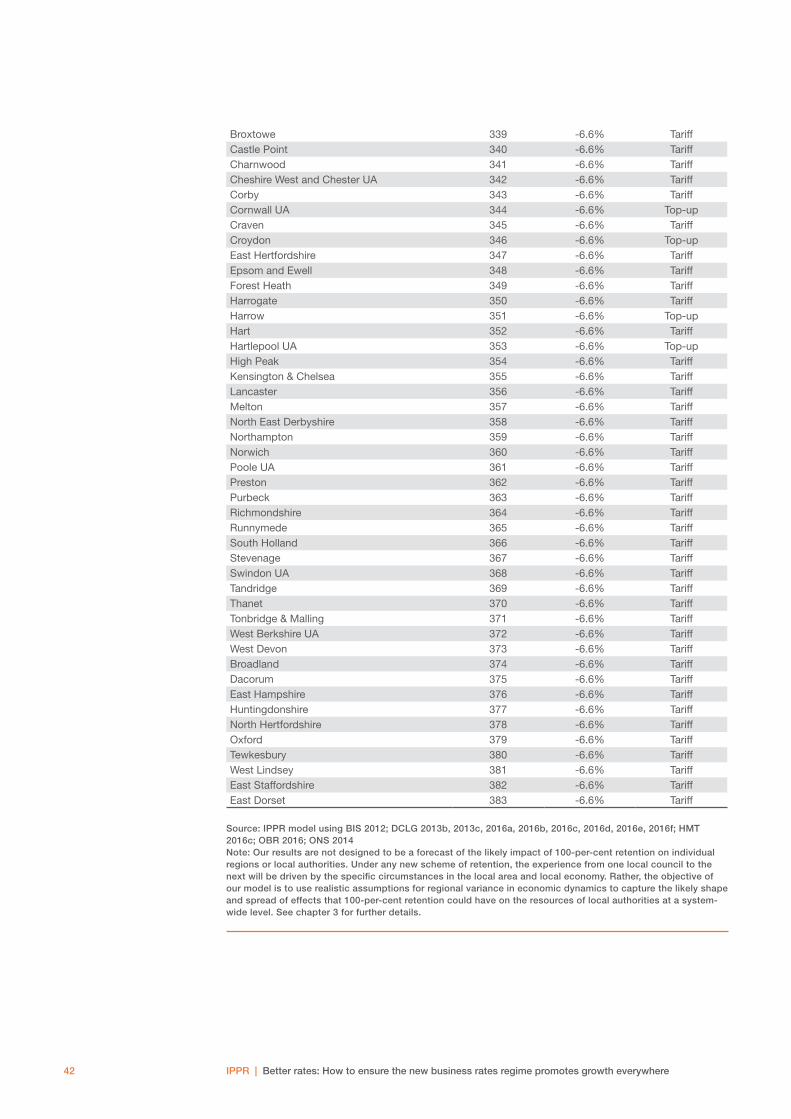
IPPR | Better rates: How to ensure the new business rates regime promotes growth everywhere42
Broxtowe 339 -6.6% TariffCastle Point 340 -6.6% TariffCharnwood 341 -6.6% TariffCheshire West and Chester UA 342 -6.6% TariffCorby 343 -6.6% TariffCornwall UA 344 -6.6% Top-upCraven 345 -6.6% TariffCroydon 346 -6.6% Top-upEast Hertfordshire 347 -6.6% TariffEpsom and Ewell 348 -6.6% TariffForest Heath 349 -6.6% TariffHarrogate 350 -6.6% TariffHarrow 351 -6.6% Top-upHart 352 -6.6% TariffHartlepool UA 353 -6.6% Top-upHigh Peak 354 -6.6% TariffKensington & Chelsea 355 -6.6% TariffLancaster 356 -6.6% TariffMelton 357 -6.6% TariffNorth East Derbyshire 358 -6.6% TariffNorthampton 359 -6.6% TariffNorwich 360 -6.6% TariffPoole UA 361 -6.6% TariffPreston 362 -6.6% TariffPurbeck 363 -6.6% TariffRichmondshire 364 -6.6% TariffRunnymede 365 -6.6% TariffSouth Holland 366 -6.6% TariffStevenage 367 -6.6% TariffSwindon UA 368 -6.6% TariffTandridge 369 -6.6% TariffThanet 370 -6.6% TariffTonbridge & Malling 371 -6.6% TariffWest Berkshire UA 372 -6.6% TariffWest Devon 373 -6.6% TariffBroadland 374 -6.6% TariffDacorum 375 -6.6% TariffEast Hampshire 376 -6.6% TariffHuntingdonshire 377 -6.6% TariffNorth Hertfordshire 378 -6.6% TariffOxford 379 -6.6% TariffTewkesbury 380 -6.6% TariffWest Lindsey 381 -6.6% TariffEast Staffordshire 382 -6.6% TariffEast Dorset 383 -6.6% Tariff
Source: IPPR model using BIS 2012; DCLG 2013b, 2013c, 2016a, 2016b, 2016c, 2016d, 2016e, 2016f; HMT 2016c; OBR 2016; ONS 2014 Note: Our results are not designed to be a forecast of the likely impact of 100-per-cent retention on individual regions or local authorities. Under any new scheme of retention, the experience from one local council to the next will be driven by the specific circumstances in the local area and local economy. Rather, the objective of our model is to use realistic assumptions for regional variance in economic dynamics to capture the likely shape and spread of effects that 100-per-cent retention could have on the resources of local authorities at a system-wide level. See chapter 3 for further details.
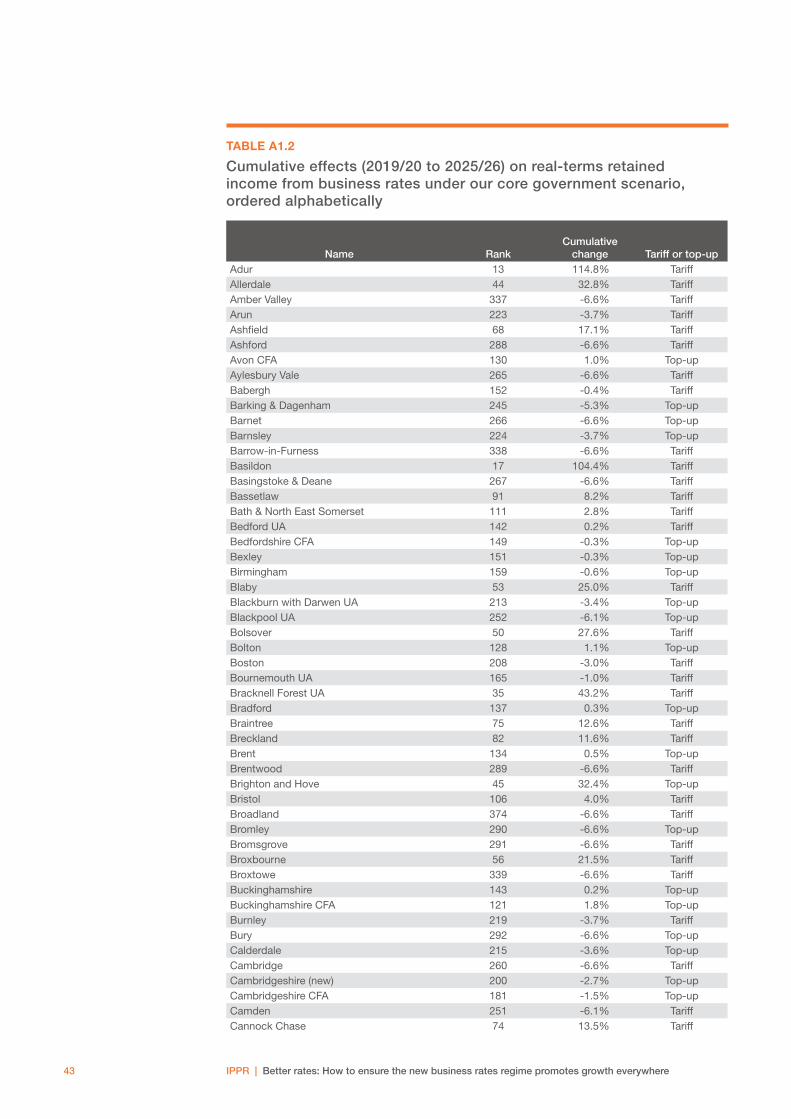
IPPR | Better rates: How to ensure the new business rates regime promotes growth everywhere43
TABLE A1.2
Cumulative effects (2019/20 to 2025/26) on real-terms retained income from business rates under our core government scenario, ordered alphabetically
Name RankCumulative
change Tariff or top-upAdur 13 114.8% TariffAllerdale 44 32.8% TariffAmber Valley 337 -6.6% TariffArun 223 -3.7% TariffAshfield 68 17.1% TariffAshford 288 -6.6% TariffAvon CFA 130 1.0% Top-upAylesbury Vale 265 -6.6% TariffBabergh 152 -0.4% TariffBarking & Dagenham 245 -5.3% Top-upBarnet 266 -6.6% Top-upBarnsley 224 -3.7% Top-upBarrow-in-Furness 338 -6.6% TariffBasildon 17 104.4% TariffBasingstoke & Deane 267 -6.6% TariffBassetlaw 91 8.2% TariffBath & North East Somerset 111 2.8% TariffBedford UA 142 0.2% TariffBedfordshire CFA 149 -0.3% Top-upBexley 151 -0.3% Top-upBirmingham 159 -0.6% Top-upBlaby 53 25.0% TariffBlackburn with Darwen UA 213 -3.4% Top-upBlackpool UA 252 -6.1% Top-upBolsover 50 27.6% TariffBolton 128 1.1% Top-upBoston 208 -3.0% TariffBournemouth UA 165 -1.0% TariffBracknell Forest UA 35 43.2% TariffBradford 137 0.3% Top-upBraintree 75 12.6% TariffBreckland 82 11.6% TariffBrent 134 0.5% Top-upBrentwood 289 -6.6% TariffBrighton and Hove 45 32.4% Top-upBristol 106 4.0% TariffBroadland 374 -6.6% TariffBromley 290 -6.6% Top-upBromsgrove 291 -6.6% TariffBroxbourne 56 21.5% TariffBroxtowe 339 -6.6% TariffBuckinghamshire 143 0.2% Top-upBuckinghamshire CFA 121 1.8% Top-upBurnley 219 -3.7% TariffBury 292 -6.6% Top-upCalderdale 215 -3.6% Top-upCambridge 260 -6.6% TariffCambridgeshire (new) 200 -2.7% Top-upCambridgeshire CFA 181 -1.5% Top-upCamden 251 -6.1% TariffCannock Chase 74 13.5% Tariff

IPPR | Better rates: How to ensure the new business rates regime promotes growth everywhere44
Canterbury 293 -6.6% TariffCarlisle 32 49.3% TariffCastle Point 340 -6.6% TariffCentral Bedfordshire UA 87 8.8% TariffCharnwood 341 -6.6% TariffChelmsford 294 -6.6% TariffCheltenham 230 -4.1% TariffCherwell 16 106.9% TariffCheshire CFA 207 -2.9% Top-upCheshire East UA 295 -6.6% TariffCheshire West and Chester UA 342 -6.6% TariffChesterfield 62 19.0% TariffChichester 24 68.2% TariffChiltern 261 -6.6% TariffChorley 54 24.7% TariffChristchurch 76 12.4% TariffCity of London 33 47.6% TariffCleveland CFA 197 -2.5% Top-upColchester 59 20.1% TariffCopeland 12 118.4% TariffCorby 343 -6.6% TariffCornwall UA 344 -6.6% Top-upCotswold 296 -6.6% TariffCoventry 132 0.8% Top-upCraven 345 -6.6% TariffCrawley 10 123.8% TariffCroydon 346 -6.6% Top-upCumbria 141 0.2% Top-upDacorum 375 -6.6% TariffDarlington UA 195 -2.4% Top-upDartford 27 56.4% TariffDaventry 15 108.3% TariffDerby UA 81 11.7% Top-upDerbyshire 156 -0.6% Top-upDerbyshire CFA 131 0.8% Top-upDerbyshire Dales 118 2.0% TariffDevon (new) 210 -3.1% Top-upDevon and Somerset CFA 193 -2.3% Top-upDoncaster 109 3.4% Top-upDorest and wiltshire 220 -3.7% Top-upDorset 221 -3.7% Top-upDover 297 -6.6% TariffDudley 246 -5.4% Top-upDurham CFA 190 -2.1% Top-upDurham UA 238 -4.4% Top-upEaling 116 2.2% Top-upEast Cambridgeshire 63 18.1% TariffEast Devon 298 -6.6% TariffEast Dorset 383 -6.6% TariffEast Hampshire 376 -6.6% TariffEast Hertfordshire 347 -6.6% TariffEast Lindsey 268 -6.6% TariffEast Northamptonshire 70 15.8% TariffEast Riding of Yorkshire UA 80 11.9% TariffEast Staffordshire 382 -6.6% TariffEast Sussex 180 -1.5% Top-upEast Sussex CFA 112 2.7% Top-upEastbourne 269 -6.6% TariffEastleigh 23 82.3% TariffEden 270 -6.6% Tariff

IPPR | Better rates: How to ensure the new business rates regime promotes growth everywhere45
Elmbridge 11 122.3% TariffEnfield 235 -4.3% Top-upEpping Forest 46 31.0% TariffEpsom and Ewell 348 -6.6% TariffErewash 71 14.7% TariffEssex (new) 162 -0.9% Top-upEssex CFA 169 -1.1% Top-upExeter 299 -6.6% TariffFareham 21 86.9% TariffFenland 84 10.4% TariffForest Heath 349 -6.6% TariffForest of Dean 97 6.2% TariffFylde 300 -6.6% TariffGateshead 125 1.5% Top-upGedling 301 -6.6% TariffGLA 113 2.7% TariffGloucester 64 17.6% TariffGloucestershire 175 -1.3% Top-upGosport 4 193.8% TariffGravesham 98 6.0% TariffGreat Yarmouth 66 17.4% TariffGreater Manchester Fire 155 -0.5% Top-upGreenwich 120 1.8% Top-upGuildford 47 30.3% TariffHackney 232 -4.2% Top-upHalton UA 241 -4.9% Top-upHambleton 258 -6.6% TariffHammersmith & Fulham 96 6.4% Top-upHampshire 117 2.1% Top-upHampshire CFA 160 -0.6% Top-upHarborough 259 -6.6% TariffHaringey 183 -1.6% Top-upHarlow 262 -6.6% TariffHarrogate 350 -6.6% TariffHarrow 351 -6.6% Top-upHart 352 -6.6% TariffHartlepool UA 353 -6.6% Top-upHastings 271 -6.6% TariffHavant 51 26.6% TariffHavering 170 -1.1% Top-upHereford & Worcester CFA 237 -4.4% Top-upHerefordshire UA 302 -6.6% Top-upHertfordshire 227 -4.0% Top-upHertsmere 39 34.4% TariffHigh Peak 354 -6.6% TariffHillingdon 69 15.9% TariffHinckley & Bosworth 8 135.1% TariffHorsham 103 4.3% TariffHounslow 85 10.1% TariffHumberside CFA 136 0.4% Top-upHuntingdonshire 377 -6.6% TariffHyndburn 303 -6.6% TariffIpswich 83 10.7% TariffIsle of Wight UA 211 -3.1% Top-upIsles of Scilly 226 -3.8% Top-upIslington 233 -4.3% Top-upKensington & Chelsea 355 -6.6% TariffKent (new) 182 -1.5% Top-upKent CFA 174 -1.2% Top-upKettering 30 54.3% Tariff
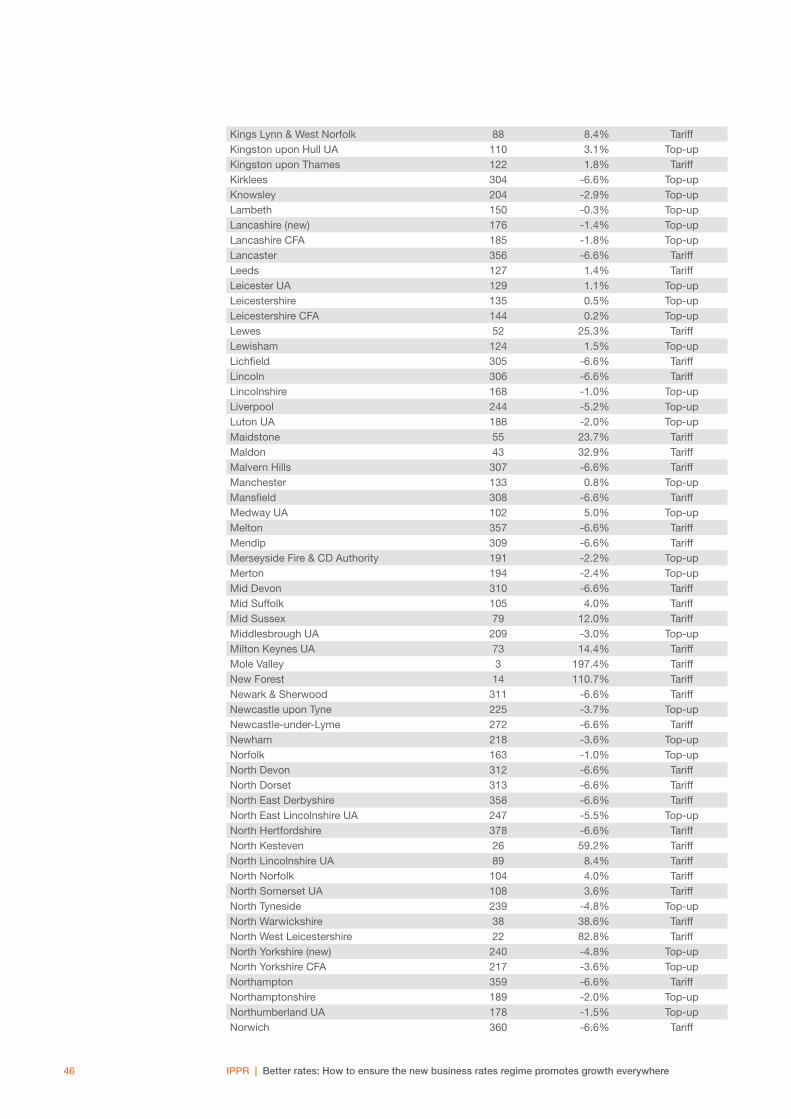
IPPR | Better rates: How to ensure the new business rates regime promotes growth everywhere46
Kings Lynn & West Norfolk 88 8.4% TariffKingston upon Hull UA 110 3.1% Top-upKingston upon Thames 122 1.8% TariffKirklees 304 -6.6% Top-upKnowsley 204 -2.9% Top-upLambeth 150 -0.3% Top-upLancashire (new) 176 -1.4% Top-upLancashire CFA 185 -1.8% Top-upLancaster 356 -6.6% TariffLeeds 127 1.4% TariffLeicester UA 129 1.1% Top-upLeicestershire 135 0.5% Top-upLeicestershire CFA 144 0.2% Top-upLewes 52 25.3% TariffLewisham 124 1.5% Top-upLichfield 305 -6.6% TariffLincoln 306 -6.6% TariffLincolnshire 168 -1.0% Top-upLiverpool 244 -5.2% Top-upLuton UA 188 -2.0% Top-upMaidstone 55 23.7% TariffMaldon 43 32.9% TariffMalvern Hills 307 -6.6% TariffManchester 133 0.8% Top-upMansfield 308 -6.6% TariffMedway UA 102 5.0% Top-upMelton 357 -6.6% TariffMendip 309 -6.6% TariffMerseyside Fire & CD Authority 191 -2.2% Top-upMerton 194 -2.4% Top-upMid Devon 310 -6.6% TariffMid Suffolk 105 4.0% TariffMid Sussex 79 12.0% TariffMiddlesbrough UA 209 -3.0% Top-upMilton Keynes UA 73 14.4% TariffMole Valley 3 197.4% TariffNew Forest 14 110.7% TariffNewark & Sherwood 311 -6.6% TariffNewcastle upon Tyne 225 -3.7% Top-upNewcastle-under-Lyme 272 -6.6% TariffNewham 218 -3.6% Top-upNorfolk 163 -1.0% Top-upNorth Devon 312 -6.6% TariffNorth Dorset 313 -6.6% TariffNorth East Derbyshire 358 -6.6% TariffNorth East Lincolnshire UA 247 -5.5% Top-upNorth Hertfordshire 378 -6.6% TariffNorth Kesteven 26 59.2% TariffNorth Lincolnshire UA 89 8.4% TariffNorth Norfolk 104 4.0% TariffNorth Somerset UA 108 3.6% TariffNorth Tyneside 239 -4.8% Top-upNorth Warwickshire 38 38.6% TariffNorth West Leicestershire 22 82.8% TariffNorth Yorkshire (new) 240 -4.8% Top-upNorth Yorkshire CFA 217 -3.6% Top-upNorthampton 359 -6.6% TariffNorthamptonshire 189 -2.0% Top-upNorthumberland UA 178 -1.5% Top-upNorwich 360 -6.6% Tariff
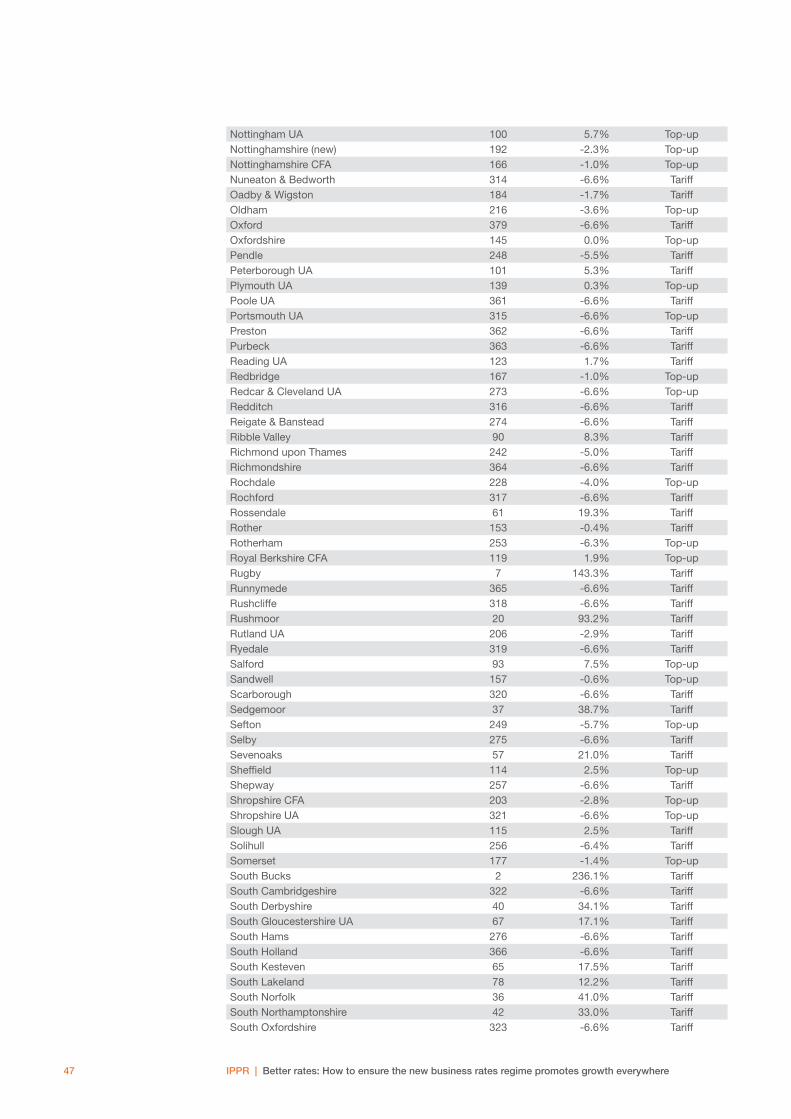
IPPR | Better rates: How to ensure the new business rates regime promotes growth everywhere47
Nottingham UA 100 5.7% Top-upNottinghamshire (new) 192 -2.3% Top-upNottinghamshire CFA 166 -1.0% Top-upNuneaton & Bedworth 314 -6.6% TariffOadby & Wigston 184 -1.7% TariffOldham 216 -3.6% Top-upOxford 379 -6.6% TariffOxfordshire 145 0.0% Top-upPendle 248 -5.5% TariffPeterborough UA 101 5.3% TariffPlymouth UA 139 0.3% Top-upPoole UA 361 -6.6% TariffPortsmouth UA 315 -6.6% Top-upPreston 362 -6.6% TariffPurbeck 363 -6.6% TariffReading UA 123 1.7% TariffRedbridge 167 -1.0% Top-upRedcar & Cleveland UA 273 -6.6% Top-upRedditch 316 -6.6% TariffReigate & Banstead 274 -6.6% TariffRibble Valley 90 8.3% TariffRichmond upon Thames 242 -5.0% TariffRichmondshire 364 -6.6% TariffRochdale 228 -4.0% Top-upRochford 317 -6.6% TariffRossendale 61 19.3% TariffRother 153 -0.4% TariffRotherham 253 -6.3% Top-upRoyal Berkshire CFA 119 1.9% Top-upRugby 7 143.3% TariffRunnymede 365 -6.6% TariffRushcliffe 318 -6.6% TariffRushmoor 20 93.2% TariffRutland UA 206 -2.9% TariffRyedale 319 -6.6% TariffSalford 93 7.5% Top-upSandwell 157 -0.6% Top-upScarborough 320 -6.6% TariffSedgemoor 37 38.7% TariffSefton 249 -5.7% Top-upSelby 275 -6.6% TariffSevenoaks 57 21.0% TariffSheffield 114 2.5% Top-upShepway 257 -6.6% TariffShropshire CFA 203 -2.8% Top-upShropshire UA 321 -6.6% Top-upSlough UA 115 2.5% TariffSolihull 256 -6.4% TariffSomerset 177 -1.4% Top-upSouth Bucks 2 236.1% TariffSouth Cambridgeshire 322 -6.6% TariffSouth Derbyshire 40 34.1% TariffSouth Gloucestershire UA 67 17.1% TariffSouth Hams 276 -6.6% TariffSouth Holland 366 -6.6% TariffSouth Kesteven 65 17.5% TariffSouth Lakeland 78 12.2% TariffSouth Norfolk 36 41.0% TariffSouth Northamptonshire 42 33.0% TariffSouth Oxfordshire 323 -6.6% Tariff

IPPR | Better rates: How to ensure the new business rates regime promotes growth everywhere48
South Ribble 28 55.8% TariffSouth Somerset 277 -6.6% TariffSouth Staffordshire 6 178.4% TariffSouth Tyneside 205 -2.9% Top-upSouth Yorkshire Fire & CD Authority 158 -0.6% Top-upSouthampton UA 324 -6.6% Top-upSouthend-on-Sea UA 107 3.8% Top-upSouthwark 86 9.5% Top-upSpelthorne 278 -6.6% TariffSt Albans 279 -6.6% TariffSt Edmundsbury 325 -6.6% TariffSt Helens 236 -4.4% Top-upStafford 48 29.4% TariffStaffordshire 171 -1.1% Top-upStaffordshire CFA 147 -0.2% Top-upStaffordshire Moorlands 280 -6.6% TariffStevenage 367 -6.6% TariffStockport 196 -2.4% TariffStockton-on-Tees UA 231 -4.1% TariffStoke-on-Trent UA 99 5.8% Top-upStratford-on-Avon 250 -5.9% TariffStroud 29 55.7% TariffSuffolk 138 0.3% Top-upSuffolk Coastal 1 356.5% TariffSunderland 186 -1.9% Top-upSurrey 201 -2.8% Top-upSurrey Heath 326 -6.6% TariffSutton 243 -5.1% Top-upSwale 31 53.2% TariffSwindon UA 368 -6.6% TariffTameside 154 -0.5% Top-upTamworth 161 -0.8% TariffTandridge 369 -6.6% TariffTaunton Deane 281 -6.6% TariffTeignbridge 327 -6.6% TariffTelford & Wrekin UA 212 -3.3% Top-upTendring 140 0.2% TariffTest Valley 34 46.8% TariffTewkesbury 380 -6.6% TariffThanet 370 -6.6% TariffThree Rivers 19 96.6% TariffThurrock UA 282 -6.6% TariffTonbridge & Malling 371 -6.6% TariffTorbay UA 255 -6.4% Top-upTorridge 254 -6.3% TariffTower Hamlets 58 20.2% Top-upTrafford 77 12.2% TariffTunbridge Wells 92 7.8% TariffTyne and Wear Fire & CD Authority 179 -1.5% Top-upUttlesford 328 -6.6% TariffVale of White Horse 263 -6.6% TariffWakefield 199 -2.7% Top-upWalsall 222 -3.7% Top-upWaltham Forest 214 -3.5% Top-upWandsworth 198 -2.6% Top-upWarrington UA 72 14.5% TariffWarwick 329 -6.6% TariffWarwickshire 146 -0.1% Top-upWatford 330 -6.6% TariffWaveney 331 -6.6% Tariff

IPPR | Better rates: How to ensure the new business rates regime promotes growth everywhere49
Waverley 332 -6.6% TariffWealden 94 7.4% TariffWellingborough 333 -6.6% TariffWelwyn Hatfield 283 -6.6% TariffWest Berkshire UA 372 -6.6% TariffWest Devon 373 -6.6% TariffWest Dorset 334 -6.6% TariffWest Lancashire 335 -6.6% TariffWest Lindsey 381 -6.6% TariffWest Midlands Fire Authority 172 -1.2% Top-upWest Oxfordshire 18 103.9% TariffWest Somerset 284 -6.6% TariffWest Sussex 126 1.5% Top-upWest Yorkshire Fire & CD Authority 173 -1.2% Top-upWestminster 49 28.1% TariffWeymouth & Portland 264 -6.6% TariffWigan 148 -0.3% Top-upWiltshire UA 336 -6.6% TariffWinchester 5 182.6% TariffWindsor & Maidenhead UA 41 33.3% TariffWirral 202 -2.8% Top-upWoking 9 125.9% TariffWokingham UA 60 20.1% TariffWolverhampton 187 -2.0% Top-upWorcester 285 -6.6% TariffWorcestershire 229 -4.1% Top-upWorthing 164 -1.0% TariffWychavon 286 -6.6% TariffWycombe 25 61.3% TariffWyre 234 -4.3% TariffWyre Forest 287 -6.6% TariffYork UA 95 7.0% Tariff
Source: IPPR model using BIS 2012; DCLG 2013b, 2013c, 2016a, 2016b, 2016c, 2016d, 2016e, 2016f; HMT 2016c; OBR 2016; ONS 2014 Note: Our results are not designed to be a forecast of the likely impact of 100-per-cent retention on individual regions or local authorities. Under any new scheme of retention, the experience from one local council to the next will be driven by the specific circumstances in the local area and local economy. Rather, the objective of our model is to use realistic assumptions for regional variance in economic dynamics to capture the likely shape and spread of effects that 100-per-cent retention could have on the resources of local authorities at a system-wide level. See chapter 3 for further details.

IPPR | Better rates: How to ensure the new business rates regime promotes growth everywhere50
APPENDIX 2: FULL DETAILS OF LEP-LEVEL SPENDING POWER ANALYSIS
TABLE A2.1
Change in core spending power for LEP areas, 2019/20 to 2025/26 (in 2016/17 prices)
Without safety-net
With safety-net
With safety net and
levy (50p limit)
With safety net and
levy (80p limit)
Enterprise M3 16.8% 18.3% 10.6% 6.2%
Cumbria 8.6% 16.0% 8.7% 4.3%
Northamptonshire 7.2% 14.8% 8.6% 4.9%
Oxfordshire LEP 8.4% 13.3% 7.8% 4.8%
Buckinghamshire Thames Valley 7.7% 11.9% 6.9% 3.9%
Lancashire -5.3% 9.6% 5.7% 3.3%
New Anglia 7.6% 9.1% 8.0% 7.4%
Gloucestershire 5.8% 8.7% 7.3% 6.5%
Thames Valley Berkshire 6.0% 7.8% 7.3% 7.1%
Coast to Capital 6.8% 6.8% 5.2% 4.6%
West of England 5.0% 6.6% 5.0% 4.5%
South East Midlands 5.7% 6.4% 5.2% 4.4%
Sheffield City Region 0.0% 6.3% 4.2% 3.0%
Solent 2.6% 6.1% 5.5% 5.5%
Hertfordshire 5.9% 5.9% 5.2% 5.1%
York and North Yorkshire 5.8% 5.8% 5.4% 5.4%
Swindon and Wiltshire 2.3% 5.6% 4.5% 3.8%
Black Country -16.3% 5.6% 3.8% 2.7%
South East 4.8% 5.3% 4.5% 3.9%
Greater Cambridge & Greater Peterborough 2.8% 5.3% 3.2% 1.9%
Stoke-on-Trent and Staffordshire 4.4% 4.6% 4.1% 3.8%
Heart of the South West 0.7% 4.5% 4.0% 3.9%
Dorset 3.5% 4.2% 3.3% 3.0%
Cheshire and Warrington 3.9% 3.9% 3.7% 3.7%
Derby, Derbyshire, Nottingham and Nottinghamshire
3.8% 3.9% 3.7% 3.7%
Humber 2.2% 3.0% 3.0% 3.0%
The Marches 0.4% 2.9% 2.4% 2.3%
Coventry and Warwickshire 2.1% 2.9% 2.8% 2.8%
Tees Valley -1.3% 2.3% 2.3% 2.3%
Greater Birmingham and Solihull -1.3% 2.2% 2.0% 1.9%
Worcestershire 2.0% 2.0% 2.0% 2.0%
Leicester and Leicestershire 2.0% 2.0% 2.0% 2.0%

IPPR | Better rates: How to ensure the new business rates regime promotes growth everywhere51
Leeds City Region 0.2% 1.7% 1.3% 1.1%
Cornwall and the Isles of Scilly -0.3% 1.2% 1.2% 1.2%
Greater Manchester 0.1% 1.1% 1.1% 1.1%
Liverpool City Region -19.1% 1.0% 1.0% 1.0%
London 0.7% 0.9% 0.9% 0.9%
Greater Lincolnshire 0.9% 0.9% 0.9% 0.9%
North Eastern -1.3% 0.5% 0.5% 0.5%
Source: IPPR model using BIS 2012; DCLG 2013b, 2013c, 2016a, 2016b, 2016c, 2016d, 2016e, 2016f; HMT 2016c; OBR 2016; ONS 2014 Note: Our results are not designed to be a forecast of the likely impact of 100-per-cent retention on individual regions or local authorities. Under any new scheme of retention, the experience from one local council to the next will be driven by the specific circumstances in the local area and local economy. Rather, the objective of our model is to use realistic assumptions for regional variance in economic dynamics to capture the likely shape and spread of effects that 100-per-cent retention could have on the resources of local authorities at a system-wide level. See chapter 3 for further details.
TABLE A2.2
Change in core spending power per capita for LEP areas, 2019/20 to 2025/26 (in 2016/17 prices)
Without safety-net
With safety-net
With safety net and
levy (50p limit)
With safety net and
levy (80p limit)
Cumbria 15.9% 17.8% 10.3% 5.9%
Oxfordshire LEP 6.9% 13.8% 6.4% 1.9%
Buckinghamshire Thames Valley 7.5% 11.5% 5.2% 1.4%
Enterprise M3 1.8% 10.9% 5.2% 1.8%
New Anglia 4.6% 9.6% 4.5% 1.7%
Stoke-on-Trent and Staffordshire 3.7% 8.1% 5.8% 4.5%
Northamptonshire -3.3% 7.7% 3.0% 0.2%
Coast to Capital 5.2% 7.6% 5.2% 3.8%
Leicester and Leicestershire 5.1% 6.4% 3.7% 2.1%
Solent 3.4% 5.4% 2.2% 0.2%
London 4.9% 5.1% 2.0% 0.1%
Derby, Derbyshire, Nottingham and Nottinghamshire
1.8% 5.1% 4.1% 3.6%
Cornwall and the Isles of Scilly 4.0% 4.4% 4.4% 4.4%
Coventry and Warwickshire 2.9% 3.9% 1.6% 0.2%
Humber 3.8% 3.8% 3.5% 3.5%
Thames Valley Berkshire 3.8% 3.8% 2.0% 1.4%
South East Midlands 0.7% 2.9% 0.8% -0.1%
Gloucestershire -4.4% 2.7% 0.9% -0.1%
York and North Yorkshire -6.0% 2.5% 2.1% 2.0%
West of England 2.4% 2.4% 1.6% 1.5%
Greater Lincolnshire 1.1% 2.2% 1.3% 0.9%
Sheffield City Region 2.2% 2.2% 1.7% 1.5%
Hertfordshire -19.0% 1.9% -0.2% -1.5%
Cheshire and Warrington -0.5% 1.7% 0.9% 0.8%
South East -2.4% 1.6% 0.4% -0.3%
Greater Manchester 1.2% 1.3% 1.1% 1.1%
Lancashire -1.0% 1.3% 0.8% 0.5%
North Eastern 0.9% 0.9% 0.9% 0.9%
Greater Cambridge & Greater Peterborough -3.1% 0.3% -0.1% -0.3%
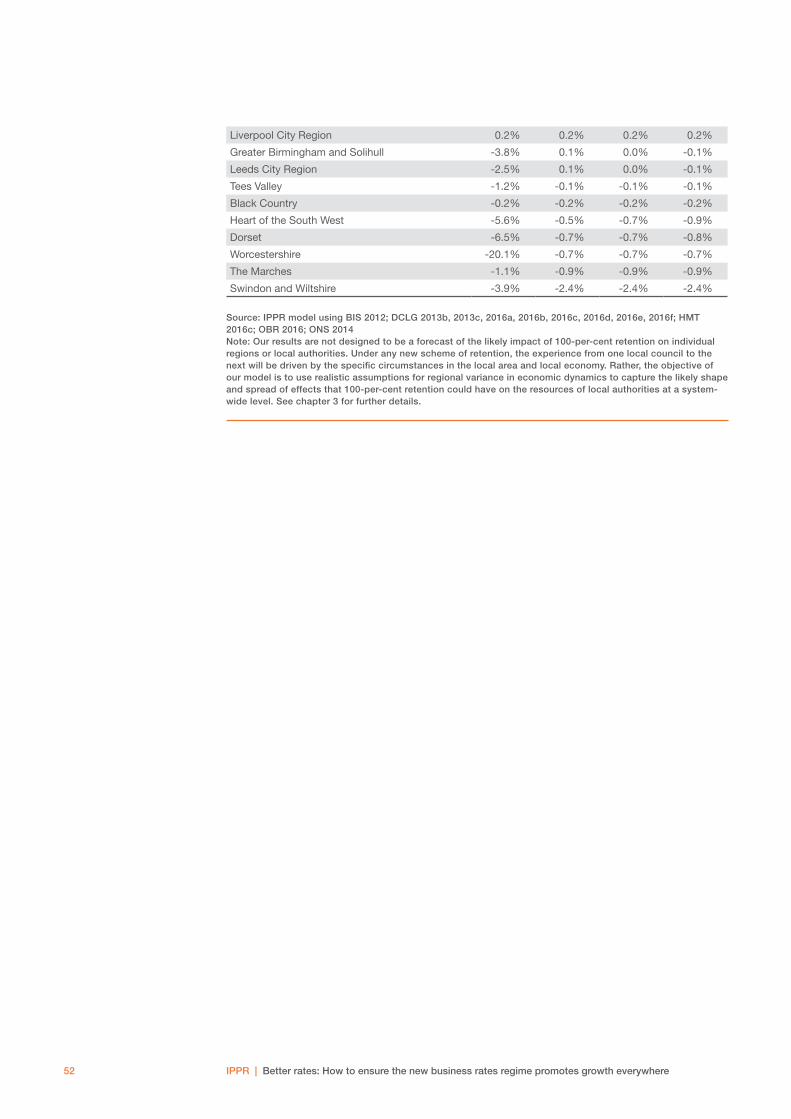
IPPR | Better rates: How to ensure the new business rates regime promotes growth everywhere52
Liverpool City Region 0.2% 0.2% 0.2% 0.2%
Greater Birmingham and Solihull -3.8% 0.1% 0.0% -0.1%
Leeds City Region -2.5% 0.1% 0.0% -0.1%
Tees Valley -1.2% -0.1% -0.1% -0.1%
Black Country -0.2% -0.2% -0.2% -0.2%
Heart of the South West -5.6% -0.5% -0.7% -0.9%
Dorset -6.5% -0.7% -0.7% -0.8%
Worcestershire -20.1% -0.7% -0.7% -0.7%
The Marches -1.1% -0.9% -0.9% -0.9%
Swindon and Wiltshire -3.9% -2.4% -2.4% -2.4%
Source: IPPR model using BIS 2012; DCLG 2013b, 2013c, 2016a, 2016b, 2016c, 2016d, 2016e, 2016f; HMT 2016c; OBR 2016; ONS 2014 Note: Our results are not designed to be a forecast of the likely impact of 100-per-cent retention on individual regions or local authorities. Under any new scheme of retention, the experience from one local council to the next will be driven by the specific circumstances in the local area and local economy. Rather, the objective of our model is to use realistic assumptions for regional variance in economic dynamics to capture the likely shape and spread of effects that 100-per-cent retention could have on the resources of local authorities at a system-wide level. See chapter 3 for further details.