BETTER CROPS–INDIA
32
BETTER CROPS–INDIA A Publication of the International Plant Nutrition Institute (IPNI) Vol. 1, No. 1 2007 In This Issue... www.ipni.net Soil Nutrient Balance Sheets in India Improving Nutrient Use Efficiency Fertiliser Use in India – An Eventful Half Century ...and much more -100 -80 -60 -40 -20 0 20 Gross balance sheet, kg/ha Net balance sheet, kg/ha Balance (net sown area), kg/ha N P 2 O 5 K 2 O NPK total N P 2 O 5 K 2 O NPK total
Transcript of BETTER CROPS–INDIA

BETTER CROPS–INDIAA Publication of the International Plant Nutrition Institute (IPNI) Vol. 1, No. 1 2007
In This Issue...
www.ipni.net
Soil Nutrient Balance Sheets in India
Improving Nutrient Use Efficiency
Fertiliser Use in India – An Eventful Half Century
...and much more
-100
-80
-60
-40
-20
0
20
Gross balance sheet, kg/ha Net balance sheet, kg/ha
Bal
ance
(net
sow
n ar
ea),
kg/h
a
NP
2O
5
K2O
NPK total
N P2O
5 K2O
NPK total

Volume 1, Number 1, December 2007
Our cover: A farmer and wife working in their paddy field in Andhra Pradesh, India.Photo by Dr. T. Nagendra Rao, IPNI
BETTER CROPS-INDIA is a publication of the International Plant Nutrition Institute (IPNI). The mission of IPNI is to develop and promote scientific information about the responsible management of plant nutrition for the benefit of the human family.
IPNI India Programme Staff Dr. K.N. Tiwari, Gurgaon, Director, North and West Zones Dr. T. Nagendra Rao, Hyderabad, Deputy Director, South Zone Dr. K. Majumdar, Kolkata (Calcutta), Deputy Director, East Zone
INTERNATIONAL PLANT NUTRITION INSTITUTE (IPNI) Patricio Contesse, Chairman of the Board (SQM) M.M. Wilson, Vice Chairman of the Board (Agrium Inc.) S.R. Wilson, Finance Comm. Chair (CF Industries Holdings, Inc.)
Administrators Dr. Terry L. Roberts, President, Norcross, Georgia, U.S.A. Dr. Adrian M. Johnston, Vice President and Asia Group Coordinator, Saskatoon, Saskatchewan, Canada Dr. Paul E. Fixen, Senior Vice President, Director of Research, and North American Group Coordinator, Brookings, South Dakota, U.S.A.
Staff for this edition of BETTER CROPS-INDIA Gavin Sulewski, Agronomic and Technical Support Specialist Donald L. Armstrong, Editor Katherine P. Griffin, Assistant Editor Kathy Hefner, Design
Note to readers: Articles which appear in this edition of BETTER CROPS-INDIA can be found as PDF files at the IPNI-India website: www.ipni.net/india/bcindia
The Government of Saskatchewan, Canada, helps make this publica-tion possible through its resource tax funding. We thank them for their support of this important project.
Correspondence related to this issue should be sent to: Dr. K.N. Tiwari, Director, IPNI India Programme, 133, Sector-23, Gurgaon-122 017 Haryana, India Phone: 91-124-246-1694 Fax: 91-124-246-17109 Website: www.ipni.net/india E-mail: [email protected]
Headquarters information: International Plant Nutrition Institute (IPNI) 655 Engineering Drive, Suite 110 Norcross, Georgia 30092 U.S.A. Phone: 770-447-0335 Fax: 770-448-0439 Website: www.ipni.net E-mail: [email protected]
Printed in India
C O N T E N T SBETTER CROPS–INDIA
IPNI Members: Agrium Inc. • Arab Potash Company • Belarusian Potash Company • Bunge Fertilizantes S.A. • CF Industries Holdings, Inc. • Groupe OCP • Intrepid Mining, LLC • K+S KALI GmbH • Mosaic • PotashCorp • Saskferco • Simplot • Sinofert Holdings Limited • SQM • Terra Industries Inc. • Uralkali
Introduction to this Special Edition 2Dr. Terry L. Roberts
Fertiliser Use in Indian Agriculture – An Eventful Half Century 3 H.L.S. Tandon and K.N. Tiwari
IPNI Scholar Award Announced 5
Improving Nutrient Use Efficiency 6 T. Nagendra Rao
Phosphorus Management in the Rice-Wheat Cropping System of the Indo-Gangetic Plains 8
Rajendra Prasad
Leaf Potassium Content Influences Photosynthesis Activity, Yield, and Fruit Quality of Litchi 12
P.K. Pathak, K. Majumdar, and S.K. Mitra
Soil Nutrient Balance Sheets in India: Importance, Status, Issues, and Concerns 15
H.L.S. Tandon
Optimizing Crop Nutrient Needs Using a Systematic Approach to Soil Fertility Evaluation and Improvement 20
T. Nagendra Rao, V. Murugappan, P. Malarvizhi, M.R. Latha, T. Balaji, and N. Prakashmany
Site-Specific Potassium Management for Rice Grown in Selected Alluvial Soils of West Bengal 22
Sourov Chatterjee and S.K. Sanyal
IPNI Crop Nutrient Deficiency Photo Contest – 2008 25
Diagnostic Tools for Citrus: Their Use and Implications in India 26
A.K. Srivastava, Shyam, and K.N. Tiwari
India Programme Publication Information 30
Balanced Fertilisation – What Does It Mean for India? 32 Adrian M. Johnston
Introduction to this Special Issue
Welcome…You are reading the first issue of BETTER CROPS-INDIA, published by the International Plant Nutrition Institute (IPNI). Following a similar style as our popular quarterly publication, Better Crops with Plant Food, this new publication is the result of considerable effort by the IPNI India Programme staff: Dr. K.N. Tiwari, Dr. T.N. Rao, and Dr. K. Majumdar. In these pages, you will learn of the many challenges and opportunities as well as the notable progress related to crop production, more balanced fertilisation, and best/beneficial management practices related to nutrient use in India. As outlined in the opening article by Dr. H.L.S. Tandon and Dr. Tiwari, much of the ability of the country to feed its growing population is due to the added productivity driven by improved fertiliser use. We at IPNI wish to congratulate and thank the many cooperators, researchers, govern-ment officials, farmers, industry representatives, and others who are working in a positive mode for progress.
— Dr. Terry L. Roberts, President, IPNI

Better C
rops – India / 2007
�
Abbreviations and notes for this article: N = nitrogen, P = phosphorus, K = potassium, S = sulphur, Z = zinc, B = boron, Fe = iron, Cu = copper, Mn = manganese.
The impact of fertiliser inputs on India’s food grain-driven agriculture remains of vital interest. At least 50% or more of recent increases in agricultural production are
credited to fertilisers (Randhawa and Tandon, 1982). Thus, the food needs of half the population increase are being met because fertilisers are being used, or that one out of every two chapatties, or rice servings, are fertiliser-born. India today is the world’s third largest producer and user of fertilisers, with an average annual consumption of 20.3 million metric tons (M t) N+P
2O
5+K
2O. Some recent developments in the fertiliser
sector are summarised in Table 1.However, nutrient removal by crops far exceeds nutrient
additions through fertilisers. For the past 40 years, a gap (re-movals less additions) of 8 to 10 M t N+P
2O
5+K
2O/year has
been documented (Tandon, 2004). This situation is akin to mining the soils of their nutrient capital. By adding up some recent state-level data on nutrient use, an illustrative balance sheet of NPK in Indian agriculture has been summarized in Table 2.
Fertilisers are meant to correct nutrient deficiencies and improve soil fertility so that higher crop productivity can be obtained and sustained as well. At the all-India level, soil deficiencies of N, P, K, S, Zn, and B are now of widespread importance. Nitrogen deficiency is common in the vast Indian plains. Potassium fertility of soils is not only neglected, but also under severe stress with the ongoing scenario where K
removals vastly exceed K input. Sulphur deficiencies are now estimated to occur in close to
250 districts and about 40% of soil samples have been found to be S deficient. Based on several years of data and 250,000 soil samples, 49% of soils were found to be deficient in Zn, 12% in Fe, and less than 5% for Cu and Mn. Boron deficien-cies now need to be taken seriously in several areas with 33% out of 36,800 soil samples analysed having been found to be B deficient (Singh, 2001).
Large yield gaps are observed not only between on-station and on-farm trials, but also at the farm level. For example, average cereal productivity in the states of Bihar and Uttar Pradesh (UP) is far below that in Punjab (Tiwari et al., 2006).
This yield gap is large and to a considerable extent, this can be attributed to differ-ences in fertiliser use levels (Table 3).
Thousands of on-station and on-farm trials have been conducted to study the re-sponse of crops to fertilisers. Some results from on-farm trials with rice and wheat are summarized in Table 4 (Leelawati et al., 1986, Rand-hawa and Tandon, 1982, Tak-kar et al., 1989). An overall response rate of 9 to 10 kg grain/kg N+P
2O
5+K
2O ap-
plied is still valid for rough
Fertiliser Use in Indian Agriculture — An Eventful Half CenturyBy H.L.S. Tandon and K.N. Tiwari
Starting with very small amounts of fertilisers in the 1950s, the past half century has been quite eventful for India and the next half century will not be any less. Future fertiliser use will be driven by the varied demands of its population on a nearly stable cultivated area which is in urgent need of soil fertility recapitalization.
Table 1. A summary of developments in fertiliser consumption in India.
1960-61 1970-71 1980-81 1990-91 2001-02 2004-05 2005-06
Consumption, ‘000 t
N 212 1,479 3,678 7,997 11,310 11,714 12,723
P2O5 53 514 1,214 3,221 4,382 4,624 5,204
K2O 29 236 624 1,328 1,667 2,061 2,413
Total 294 2,256 5,516 12,546 17,360 18,399 20,340
Consumption, kg/ha1
N 1.4 9 21 43 59 62 67
P2O5 0.4 3.3 7 17 23 24 27
K2O 0.2 1.4 4 7 9 11 13
Total 2 14 32 68 90 97 107
P2O5: K2O (N=1.0) 0.37: 0.16 0.37: 0.16 0.33: 0.17 0.40: 0.17 0.39: 0.14 0.39: 0.18 0.41: 0.18
Highest state-wise consumption, kg N + P2O5 + K2O/ha
6.6Kerala
0.2Punjab
117.9Punjab
161.9Punjab
173.4Punjab
195.7Punjab
212.7Punjab
Fertiliser sales points — 81,460 109,964 232,505 282,776 288,756 284,753
Source: The Fertiliser Association of India (FAI), 2006. 1Consumption, kg/ha numbers are rounded.
Table 2. An illustrative balance sheet of NPK in Indian agriculture (2001).
Gross balance sheet, ‘000 t Net1 balance sheet, ‘000 t
Additions Removal Balance Additions Removal Balance
N 10,923 9,613 1,310 5,461 7,690 -2,229
P2O5 4,188 3,702 486 1,466 2,961 -1,496
K2O 1,454 11,657 -10,202 1,018 6,994 -5,976
Total 16,565 24,971 -8,406 7,945 17,645 -9,7011Accounting for nutrient use efficiency.Source: Tandon, 2004.

�
Bet
ter
Cro
ps –
Ind
ia /
200
7
rice and wheat provided no other major nutrient deficiency exists. A recent analysis in agriculturally advanced Punjab estimates the response ratio to be 17 kg grain/kg N+P
2O
5+K
2O
in contrast to an all-India estimate of 8 kg grain/kg (Aulakh and Bahl, 2001). The higher productivity in Punjab is also due to widespread use of high yielding cultivars and better management practices than in many parts of India.
The Indian experience demonstrates that balanced fertil-ization is a dynamic rather than a static concept enshrined in a fixed NPK consumption ratio. As yield goals shift up, the “nutrient basket” demanded by the crops not only grows bigger, but also becomes more varied and complex. It is obsolete to maintain the view that top productivity can only be sustained with application of balanced ratios of N+P
2O
5+K
2O. The law of
the minimum cannot be escaped, thus the absence of secondary nutrients, or a mug full of a micronutrient, can withhold the performance of bagfuls of NPK.
Results of on-farm demonstrations conducted by the Indian Council of Agricultural Research (Singh, 1991) revealed an average increase in productivity due to S application to be 650 kg/ha (+24% over NPK) in cereals, 570 kg/ha (+32% over NPK) in oilseeds, and 357 kg/ha (+20% over NPK) in pulses. Results of 2,391 on-farm trials with Zn application (on top of “optimum” NPK) with wheat show increased grain production of 200 to 500 kg/ha in 35% of cases and 500 to 1,000 kg/ha in 16% of cases. Similarly, based on 2,154 on-farm trials with rice, Zn application increased paddy (rough rice) yield by 200 to 500 kg/ha in 39% of cases, and by more than 1,000 kg/ha in 11% of cases (Table 4).
Another development of consider-able interest in directing the course of balanced and efficient nutrient man-agement refers to site-specific nutri-ent management (SSNM). SSNM is a systematic agronomic approach which considers field-scale variability in soil fertility and crop responses to applied nutrients. In recognition of the poten-tial applicability of SSNM, the Project Directorate for Cropping Systems Re-search (PDCSR-ICAR) has established collaborative SSNM research with the International Plant Nutrition Institute (IPNI) on nutrient management in crop-ping systems. Replicated field trials were conducted at 10 locations with
the rice–wheat system and at 6 locations with the rice–rice system (Table 5). In the SSNM experiments, 4 to 8 nutrients were applied in a pre-planned manner to evaluate responses to each of these at one or more levels (except N). Both crops received N, P, and K. Only kharif rice also received S and micronutrients implying that the rabi crop, whether rice or wheat, benefited from the residual effect of these nutrients (Tiwari et al., 2006).
Rice-wheat data averaged over 2 years show that annual
Table 5. Experimental locations and the nutrients required to optimise yield in the SSNM plots in rice-wheat and rice-rice systems.
Location State Rice Wheat Rice Rice
Sabour Bihar NPK S NPK
Palampur Himachal Pradesh NPK S B Zn NPK
R. S Pura Jammu & Kashmir NPK S Mn Zn Cu NPK
Ranchi Jharkhand NPK S B Zn NPK
Ludhiana Punjab NPK S B Mn Zn Cu NPK
Faizabad Uttar Pradesh NPK S B Mn Zn NPK
Kanpur Uttar Pradesh NPK S Zn NPK
Modipuram Uttar Pradesh NPK S B Mn Zn NPK
Varanasi Uttar Pradesh NPK S B Mn Zn Cu NPK
Pantnagar Uttaranchal NPK S B NPK
Maruteru Andhra Pradesh NPK B NPK
Jorhat Assam NPK S B Mn Zn Cu NPK
Navsari Gujarat NPK S Fe Mn Zn NPK
Karjat Maharashtra NPK B Fe Zn NPK
Coimbatore Tamil Nadu NPK Fe NPK
Thanjavur Tamil Nadu NPK S Mn NPK
Source: Tiwari et al., 2006.
Table 4. Results of on-farm trials on balanced fertilisation and food grain yields.
Nutrients added, kg/ha Yield increase, Crop Trials N P2O5 K2O kg/ha
Wheat 10,133 120 0 0 890
10,133 120 60 0 590 (over N)
10,133 120 60 60 290 (over NP)
2,358 125 kg ZnSO4·7H2O 360 (over NPK)
Rice (Kharif) 5,955 120 0 0 1,236
3,231 120 60 0 636 (over N)
3,231 120 60 60 366 (over NP)
4,856 125 kg ZnSO4·7H2O 248 (over NPK)
Rice (Rabi) 4,179 120 0 0 1,116
1,979 120 60 0 624 (over N)
1,979 120 60 60 252 (over NP)
1,891 125 kg ZnSO4·7H2O 252 (over NPK)1Zinc was added along with optimum rate of NPK.Source: Leelawati et al., 1986; Randhawa and Tandon, 1982; and Takkar et al., 1989.
Table 3. Comparison between fertiliser use levels and cereal productivity in selected Indian states.
Cereal yield, Average application, kg/haState kg/ha N P2O5 K2O Total
Punjab 3,953 146 42 5 193
Uttar Pradesh 2,393 92 30 6 128
Bihar 1,684 79 6 3 88Source: Tiwari et al., 2006.

Better C
rops – India / 2007
�
grain yields of 15 to 17 t/ha were achievable. Average annual grain productivity of the system was 13.3 t/ha of which 60% was from rice and 40% from wheat. None of the SSNM locations had annual grain productivity less than 10 t/ha. Averaged over locations, SSNM caused a 3.4 t/ha annual advantage or 34% more yield than common farmers’ practices (FP). SSNM in-creased the expenditure on fertilisers by Rs.4,170/ha (US$104) compared to FP but generated additional produce valued at Rs.20,530 (US$513) – returning an extra net income per unit extra expenditure, or benefit-to-cost (BCR) ratio of 4.9. A frequency distribution of economic returns for the rice-wheat system (84 location x nutrient x rate combinations) found BCRs under 2 in 13% of cases, 2 to 5 in 17% of cases, 5 to 10 in 24% of cases, and above 10 in 46% of cases. The majority of cases with very high BCRs reflect very high grain yields achieved through high rates of response per unit applied nutrients.
Similarly, two years of rice-rice data revealed grain yields of 15 to 18 t/ha. Average annual grain productivity was 13.3 t/ha – the contribution of Kharif and Rabi rice being almost equal. The annual grain productivity under SSNM was more than 10 t/ha at all locations except one. Averaged over locations, SSNM brought a 2.5 t/ha advantage, or a 23% increase over FP.
SSNM also increased fertiliser expenditure by Rs.4,540/ha (US$114) over the FP but generated additional produce valued at Rs.11,900/ha (US$298) – a BCR of 2.6. The application of several nutrients was profitable at most sites.
Soil testing for fertiliser use started receiving attention in the mid 1950s. Close to 550 soil testing laboratories have been set up during the past 50 years to provide site- and crop-spe-cific fertiliser recommendations. Most of these are owned and operated by government departments, but for various reasons their ground-level impact on facilitating balanced nutrient application is small. The national soil testing system needs to be readily energized and made more farmer-friendly, under the SSNM approach.
The nutrient needs of Indian agriculture are so large and expanding such that no single input, be it fertiliser or organic material, can meet them alone. Integrated nutrient manage-ment (INM) is receiving increasing attention, and rightly so. However, most INM packages will continue to be fertiliser-driven. This is because of inadequate amounts of organic sources of nutrients and their competing usage. Available estimates indicate that organic materials available as nutri-ent sources can meet about 25% of the total nutrients needs in India. The rest must come from soil reserves and inorganic fertilisers. BC-INDIA
Dr. Tandon is Director, Fertiliser Development and Consultation Organization, New Delhi, India; e-mail: [email protected] or [email protected]. Dr. Tiwari is Director, IPNI India Programme, Gurgaon, India; e-mail: [email protected].
ReferencesAulakh, M.S. and G.S. Bahl. 2001. Fert. News 46(4),47-48,51-58 & 61.
FAI. 2006. Fertiliser statistics for 2005-2006. Fertiliser Association of India,
New Delhi.
Leelawati, C.R., et al. 1986. Indian Agricultural Statistical Research Institute,
New Delhi. pp.108
Randhawa, N.S. and H.L.S Tandon. 1982. Fert. News 26(2), 11-26
Singh, M.V. 2001. Fert. News 46(2), 25 – 42.
Takkar, P.N., et al. 1989. Twenty years of coordinated research on micronutrients
in soils and plants. Indian Institute of Soil Science, Bhopal.
Tandon, H.L.S. 2004. Fertilisers in Indian Agriculture – From 20th to 21st
Century. Fertiliser Development and Consultation Organization, New
Delhi, India. Pp 240.
Tiwari, K.N., et al. 2006. Site Specific Nutrient Management for Increasing Crop
Productivity in India. PDCSR (ICAR)–PPIC, India Programme, pp 92.
K. Vanitha
IPNI Scholar Award Announced
Miss K. Vanitha of Tamil Nadu Agricultural University (TNAU), Coimbatore, India, was one of only five recipients of the 2007 Scholar Award sponsored by IPNI. The awards of US$2500 (twenty-five hundred dollars) each are conferred to deserving graduate
students in sciences relevant to plant nutrition and management of crop nutrients. Funding for the awards is provided through support of IPNI member companies.
Miss Vanitha is a M.Sc. student in Crop Physiology at TNAU, with a thesis title of “Drip Fertigation and Its Nutrio-Physiological Impact in Aerobic Rice (Oryza sativa L.).” Rice production and water conservation are two major factors impacting food production in India. Aerobic rice is a new concept to further decrease the water requirements in rice production, which will have major consequences for both soil and plant nutrient dynamics.
A native of Bommidi in Tamil Nadu, Miss Vanitha completed her B.Sc. degree in 2006. Her career goals are to pursue a Ph.D. in abiotic stress management of crops.
The IPNI Scholar Awards are made directly to students and no specific duties are required of them. More information is available from IPNI staff or from the IPNI website: >www.ipni.net/awards<. BC-INDIA

�
Bet
ter
Cro
ps –
Ind
ia /
200
7
Abbreviations and notes for this article: N = nitrogen; P = phospho-rus; K = potassium; AE = agronomic efficiency; RE = recovery efficiency; PFP = partial factor productivity; C.D. = Critical Difference.
Nutrient use efficiency can be expressed in agronomic, physiologic, and economic terms, but so far in India this subject remains largely confined to the scientific
community. Because nutrient use in India is largely subsidy driven and not science-based, the practical benefits of high use efficiency are distorted since N, the cheapest or most subsidized nutrient, is used most while other nutrients are presently ignored. Although fertiliser consumption is increas-ing quantitatively, the corresponding yield increase per unit of nutrient input is substantially diminished compared to previous years. Ultimately, the blame goes to a perceived ineffective-ness of fertiliser.
It is important to understand that nutrient use efficiency is dependant on several agronomic factors including: soil degra-dation, land tillage, time of sowing, appropriate crop variety, proper planting or seeding, sufficient irrigation, weed control, pest/disease management, and balanced and proper nutrient use. These factors largely influence nutrient use efficiency, either individually or collectively. For example, selection of proper planting material, population density, and balanced fertilisation could collectively improve nutrient use efficiency by 25 to 50%.
Agronomic Efficiency of Applied NutrientsExperiments conducted at Tamil Nadu Agricultural Uni-
versity comparing hybrid and non-hybrid plant ability to use P and K nutrients indicate that although non-hybrids and hybrids of rice/cotton have large responses to P and K application, the degree of agronomic response is greater in hybrid crops. For
Improving Nutrient Use Efficiency: The Role of Beneficial Management PracticesBy T. Nagendra Rao
Several agronomic factors directly or indirectly affect nutrient use efficiency, including crop genetics, plant spacing, nutrient balance, and application rate, as well as placement and timing. Research projects in Southern India have generated valuable information show-ing the importance of beneficial management practices (BMPs) in improving nutrient use efficiency in important crops such as rice, cotton, banana, and mulberry.
Table 1. Agronomic efficiency of K for hybrid and non-hybrid cotton.
Non-hybrid (MCU5) Hybrid (TCHB 213)
N-P2O5-K2O, kg/ha Yield, kg/ha AE, kg grain/kg K2O Yield, kg/ha AE, kg grain/kg K2O
200-150-0 1,840 — 2,930 —
200-150-100 2,430 5.9 3,810 8.8
C.D. (5%) Fertiliser: Variety x Fertiliser:
138349
MYR Annual Report (1997-98), Department of Agronomy, TNAU, Coimbatore.
Table 2. Agronomic efficiency of P for hybrid and non-hybrid rice.
Non-hybrid (ASD 18) Hybrid (CORH -1)
N-P2O5-K2O, kg/ha Yield, kg/ha AE, kg grain/kg P2O5 Yield, kg/ha AE, kg grain/kg P2O5
200-0-200 6,010 — 6,120 —
200-75-200 6,180 2.3 6,510 5.2
200-150-200 6,720 4.7 7,890 11.8
C.D. (5%) Variety x Fertiliser 155
MYR Annual Report (1997-98), Department of Agronomy, TNAU, Coimbatore. Planted at 10 x 10 cm spacing.
Nutrient balance, plant population, genetics, and other factors affect nutri-ent use efficiency.
Split-application of N and K improves nutrient use efficiency in banana.

Better C
rops – India / 2007
�
instance, the cotton hybrid TCHB 213 produces more yield per unit of K fertilisation (Agronomic Efficiency of K or AEK) than the non-hybrid MCU 5 (Table 1). Similarly, the rice hybrid CORH-1 is more effective in utilising applied P compared to the non-hybrid ASD 18 (Table 2).
Simple Agronomic Practices Enhance Nutrient Use Efficiency in Crops
In addition to choosing the best genetics for the agro-ecological zone, nutrient use efficiency can also be improved by several other simple agronomic techniques. Researchers have found that changes in plant population per unit area and spacing have profound effects on improving P use efficiency (Table 3).
At the high rate of fertilisation, the hybrid effectively used applied P and produced higher yields per unit quantity of P, which was improved even further when closer spacing (more plant population density) per unit area was adopted. Contrary to this, conventional varieties were shown to be less efficient in using higher rates of P at close spacing. Although hybrids are efficient P users, low plant populations fail to show their fullest potential. While targeting for high yields, it is not only important to select the right plant type, but also to optimise plant population to improve nutrient use efficiency, especially at higher doses of nutrients.
Effect of K Application on N Recovery Potassium improves N use efficiency, as the rice and cotton
data in Table 4 clearly show.The simple agronomic practice of split-application of
nutrients does not increase production costs by much, but it significantly improves nutrient use efficiency. Experiments on horticultural crops such as banana and mulberry have shown that split application of nutrients, especially N and K, improved nutrient use efficiency (Table 5).
Table 3. Plant population and hybrid interaction on agronomic efficiency of P in rice.
AE, kg rice/kg P applied2
Non-hybrid (ASD 18)
Hybrid (CORH-1)
Non-hybrid (ASD 18)
Hybrid (CORH-1)
P2O5, kg/ha1 12.5 x 10 cm plant spacing 10 x 10 cm plant spacing
75 4.2 12.8 15.6 19.9
150 5.9 6.6 11.4 19.2MYR Annual Report (1997-98), Department of Agronomy, TNAU, Coimbatore.Yields at 0 kg P2O5/ha at 12.5 x 10 cm spacing: Non-hybrid = 5,010 kg/ha, Hybrid = 5,020 kg/ha.1N and K2O applied as blanket doses at 200 kg/ha each.2Efficiency values obtained over and above values at 0 level of P.
Table 4. Influence of K on N recovery efficiency (REN).
Nutrient dose, kg/ha Non-hybrid Hybrid
Crop N-P2O5-K2ON uptake,
kg/haREN, kg/kg
N uptake, kg/ha
REN, kg/kg
Rice 200-75-0 89 0.44 107 0.54
200-75-100 103 0.52 122 0.61
Cotton 200-150-0 68 0.34 71 0.36
200-150-100 97 0.48 98 0.49MYR Annual Report (1997-98), Department of Agronomy, TNAU, Coimbatore.
Table 5. Effect of split application of nutrients on partial factor productivity.
CropNutrient dose,
kg N-P2O5-K2O/haNumber of
splits
Yield level, t/ha
PFP, kg yield/kg N-P2O5-K2O
Banana1 510-162-1530 3 (all NPK) 93.1 42.3
510-162-1530 4 (all NPK) 97.7 44.4
Mulberry2 280-120-120 2 (K alone) 22.7 43.6
280-120-120 6 (K alone) 29.0 55.91Annual Report (2001-02), Department of Fruit Crops, Horticultural College and Research Institute, TNAU, Coimbatore. 2Shankar and Sriharsha ,1999.
ConclusionAlthough the Government is officially recommending P and
K, farmers often ignore the importance of applying balanced quantities of these nutrients in their crop production systems. In order to reap the agronomic benefits from nutrient applica-tion and target improved nutrient use efficiency, BMPs having sound agronomy must be adopted in the field. BC-INDIA
Dr. Rao is Deputy Director, IPNI India Programme (South Zone); e-mail: [email protected].
ReferencesMaximum Yield Research Annual Report: 1997-98. Department of Agronomy,
Tamil Nadu Agricultural University, Coimbatore.
Annual Report. 2001-02. PPIC Coordinated Reserach Project – Standardization
of Fertiliser Requirement for Tissue Cultured Banana cv. Robusta (AAA)
Department of Fruit Crops, Horticultural College and Research Institute,
TNAU, Coimbatore.
Shankar, M.A. and S.A. Sriharsha. 1999. Better Crops International, 13(2):
18-20.

�
Bet
ter
Cro
ps –
Ind
ia /
200
7
Abbreviations and notes for this article: P = phosphorus; Ca = calcium; C = carbon; N = nitrogen; K = potassium; Zn = zinc; Al = aluminum; Fe = iron; S = sulphur; DAP = diammonium phosphate; SSP = single superphosphate; C.D. = Critical Difference; M t = million metric tons.
The rice-wheat cropping system (RWCS) is the backbone of India’s food security. The magnitude of the contribu-tion of RWCS to the country’s food security can be gauged
from Punjab alone, which has less than 2% of the country’s cultivated land, and provides 60% of the wheat and 40% of the rice to the Public Distribution System and national buffer stocks (Swaminathan, 2007). As a matter of fact, the Punjab-Haryana-Western Uttar Pradesh (UP) crescent has been the heartland of the Green Revolution (GR). This non-traditional rice region, where wheat was the principal crop and money earner has seen rice emerge as the money maker. Further, a large number of farmers are now growing Basmati rice which fetches premium prices.
The Indo-Gangetic Plain (IGP) came into existence as a result of continuous deposition of alluvium from the hills and mountains from both sides of the plains – the Himalayas in the north and Deccan Plateau in the south. Soils of the IGP
are Ustochrepts, Aquents, Naturstalf, and Hapludolls (Tarai region). Soil texture varies from sandy loam at Ludiana to silty loam at Pusa (Bihar). There are large lowland patches of heavier soils (silty clay loam to clayey) in almost all states in the IGP where RWCS is practiced. The annual rainfall in the IGP varies from 650 mm at Ludhiana in the west to 1,666 mm at Barrackpore in the east (Table 1).
The RWCS is spread over five states in the IGP, namely, Punjab, Haryana, UP, Bihar, and West Bengal. These states are under four agro-climatic regions (ACRs) including: Trans-Gangetic Plain covering Punjab and Haryana (ACR VI); Upper-Gangetic Plain covering western UP (ACR V); Middle-Gangetic Plain covering eastern UP and Bihar (ACR IV); and Lower-Gangetic Plain covering West Bengal (ACR III). The area under RWCS in the IGP is about 9 million hectares (M ha). There is an additional 1.5 to 2 M ha outside the IGP in the states of Himachal Pradesh, Uttarakhand, Madhya Pradesh,
and Rajasthan.There was a trend for to-
tal P and Olsen P to increase moving eastwards within the IGP before the GR (Table 2). However, after the GR, and due to relatively higher fertiliser P application in Punjab and West Bengal, the Olsen P and P fertility index in the IGP shows a trough-like situation, being medium at both the ends and low in the centre…UP and
Bihar (Table 3) (Motsara, 2002). Organic P contin-ues to be higher a s one moves eastward due to higher organic C status in the east (Table 2). For inorganic P, Ca-P forms dominate,
Phosphorus Management in the Rice-Wheat Cropping System of the Indo-Gangetic PlainsBy Rajendra Prasad
Soils of the rice-wheat cropping system belt in the Indo-Gangetic Plains are mostly low to medium in P fertility. Inadequate P fertilisation is one of the major barriers to achieving targeted yields of rice and wheat. The general recommendation and practice of applying P to wheat and raising rice on residual P fertility is partly responsible for this. Research suggests 90 to 100 kg P
2O
5/ha/yr should be applied in the system, about two-thirds to
wheat and one-third to rice. This recommendation will go a long way in increasing rice and wheat production. Any future food production increases will require additional P use. The chance of a sizeable supplementation from other sources, such as manure and crop residues, appears rather limited at this time.
Table 1. SoilcharacteristicsatsomeresearchcentresinIGP.
Researchcentre(State) Soiltype Soiltexture Annualrainfall,mm OrganicC,% OlsenP,mg/kg
Ludhiana(Punjab) TypicUstochrept LS1 650 0.31 5
Karnal(Haryana) AquicNatrustalf 700 0.30 15
Pantnagar(UP) Hapludoll SiCL 1350 1.48 18
Kanpur(UP) UdicUstochrept SL 818 0.39 6
Faizabad(UP) UdicFluaquents SiL 1100 0.37 6
Pusa(Bihar) Ustochrept SiL 1100 0.42 20
Barrackpore(WB) Eutrochrept SL 1666 0.71 191LS=Loamysoil;SL=sandyloam,SiL=Siltyloam;SiCL=Siltyclayloam.Source:Ladhaetal.,2003.
Table 2. DistributionofdifferentformsofPinsomeIGPsoils.
Total, SaloidP Al-P Fe-P Ca-P OrganicP OccludedP OlsenP, P-fixing OrganicC,Location mg/kg ------------------%oftotalP------------------ mg/kg capacity %
Ludhiana(Punjab) 435 1.3 3.7 4.6 33.8 8.7 48.0 6 11.2 0.31
Kanpur(UP) 539 0 1.5 1.1 37.9 13.5 45.9 6 60.0 0.39
Pusa(Bihar) 583 0.5 0.7 0.3 59.8 21.4 17.2 9 30.9 0.45
Source:KhannaandDeDatta,1968.

Better C
rops – India / 2007
�
and again increase moving eastward. These generalizations do not hold true for Hapludolls in the tarai region of Uttarakhand, which have higher organic C and Olsen P content (Table 1).
Submergence of rice fields immediately after P applica-tion leads to a flush of available P (Kirk et al., 1990). How-ever, continued submergence can reverse the effect as P is precipitated in the oxidised rhizosphere and sorbed on the solid phases during reduction (Patrick and Mahapatra, 1968) and may further immobilise P (Simpson and Williams, 1970). Mandal (1979) also pointed out that increased availability of P on submergence is not uniform in all soils; it may be fairly high in some soils, while negligible in others. A number of factors are responsible for this differential behaviour of soils. These include inorganic P forms, pH, calcium carbonate, and organic C content. In general, submergence leads to increased availability of soil P due to dissolution of occluded P (Patrick and Mahapatra, 1968) and this has led to the general belief that on the same soil, rice responds to applied P lesser than upland crops. However, in the RWCS subsequent drying during the wheat season reduces P availability (Sah and Mikkelsen, 1989; Sah et al., 1989ab). Thus, repeated submergence and drying over the years leads to low P fertility and an increased response to applied fertiliser P as reported by Kumar and Yadav (2001).
Most information on source, method, and time of P appli-cation in India is available for the individual rice and wheat crops rather than for the RWCS. Experiments showed that 50 to 70% water soluble P product was required in P fertilisers for wheat (Hundal and Sekhon, 1980; Yadav and Verma, 1983) and 30 to 50% for rice (Sekhon, 1979). Broadcasting and in-corporation at final puddling is the only possible and practical application method for rice, while sub-surface placement is the proper method for P application in wheat (Sinha and Ray, 1969; Ray and Seth, 1975, Tandon, 1987). Most P in rice, as well as wheat, is applied at transplanting/sowing. Split applica-tion of P in rice or wheat has shown no advantage over a single application at transplanting/sowing (Shukla and Chaudhary, 1977; Katyal, 1978; Singh and Singh, 1979). However, if P is not available at sowing it can be topdressed at the first irriga-tion in wheat (Singh, 1985).
Besides being one of the most important major plant nu-trients for Indian agriculture, P is the costliest. For example, the recent price was Rs.16.22/kg P
2O
5 as DAP and Rs.16.25
to 26.88/kg as SSP, as compared to Rs.10.50/kg N as urea and
Rs.7.43/kg K2O for muriate of potash. Thus, a recommendation
of 100 kg P2O
5/ha amounts to an investment of Rs.1,622/ha for
P alone – a scenario which many farmers can not readily af-ford. These situations suggest a need to explore possibilities of supplementing P from the other sources. The available sources discussed briefly below highlight the constraints related to the use of other sources of P in Indian agriculture.
Direct application of finely ground phosphate rock (GPR) has received considerable attention (Prasad and Dixit, 1976; Mathur and Sarkar, 1998). Several strategies for increasing the efficiency of GPR have been suggested, including mix-ing of GPR with pyrites (Tiwari, 1979; Sharma and Prasad, 1997), inoculating with phosphate solubilising organisms (PSO) (Chhonkar and Subbarao, 1967), use of VAM (Baon and Wibawa, 1998), use of PSO with crop residues (Sharma and Prasad, 2003), and mixing with soluble P fertilisers (Mishra et al., 1980; Govil and Prasad, 1972). Application of GPR with PSO, with or without crop residues seems to be an acceptable technique. The only problem is, where is the indigenous GPR? During 2005-06 only 257,000 t of PR (Jhabua 137; Sagar 112; Purulia 8) was mined in India. These are poor quality phos-phate rocks containing 12 to 15% P
2O
5. Also, GPR has to be
applied at rates 2 to 3 times that of fertiliser P.Organic manures have also received considerable atten-
tion and integrated nutrient management (INM) has been widely discussed (Hegde, 1998; Prasad, 2002; Prasad et al., 2003; Gupta et al., 2006). The problems that remain are product availability, high costs with transportation, and low P contents.
Prasad et al. (2004) reported that about one-fourth of the P taken up by the rice crop remained in the straw, while it was one-fifth of the total P uptake in the case of wheat straw. Thus, a small part of the P requirement could be met by the incorporation of rice/wheat residue. Sharma and Prasad (2002) reported that the contribution of crop residue P to a growing crop can be further increased when the residue is applied with a culture of cellulolytic fungus as judged by the Olsen P in soil. Advantages of incorporation of rice/wheat residue in the RWCS have been reviewed by Samra et al. (2003).
Before mechanisation of agriculture set in on the RWCS belt (only in the western parts viz., Punjab, Haryana, and Western UP) humans, cattle, and cereal crops formed a unique agro-socio-ecosystem. However, after mechanisation, cattle are less common and residue management becomes a serious problem because of the very short period (about 2 to 3 weeks) between rice harvesting and wheat sowing – leading many farmers to burn rice residues in the field.
According to Sarkar et al. (1999) about 37.87 M t of rice and wheat residue is available for recycling in the RWCS - equivalent to about 69,000 t P
2O
5. However, incorporation of
rice/wheat residue involves an additional application of 15 to 20 kg N/ha to overcome the initial setback to the crop due to immobilisation of native soil N (Samra et al., 2003). The other alternative is to mix cereal and legume residues (Sharma and Prasad, 2001).
A sustainable P management strategy within the RWCS must ensure high and sustainable foodgrain production, high net profit, build-up of native available soil P, and avoidance of over fertilisation with P that may make nutrients such as Zn unavailable to crops.
Table 3. PhosphorusfertilitystatusofsoilsinRCWSstates.
StateSamplesanalysed
%samplesinthecategory Pfertility
index1 CategoryLow Medium High
Punjab 3,48,096 29 49 22 1.93 Medium
Haryana 2,73,459 81 18 01 1.20 Low
UP 8,07,424 71 26 03 1.32 Low
WestBengal 44,284 34 27 39 2.05 MediumNote:Dataoverseveralyears;Bihardatanotavailable.
1PfertilityIndex(forthestate)=(Slx1)+(Smx2)+(Shx3)
St
Where,‘St’isthetotalnumberofsamplesanalysed;Sl,Sm,andShstandforthenumberofsamplesanalysinglow,medium,andhigh.Source:Motsara,2002.

10
Bet
ter
Cro
ps –
Ind
ia /
200
7
The increased availability of native soil P under sub-mergence and some data generated by researchers (Table 4) led to the belief and recommenda-tion to RWCS farm-ers that 60 kg P
2O
5/
ha may be applied to wheat and rice could be well-grown on residual fertility (Singhania and Goswami, 1974; Meelu and Rekhi, 1981) This recommendation was made despite the fact that Formoli et al. (1977) reported that both rice and wheat responded to P application, and Kolar and Grewal (1989) reported that ap-plication of 30 kg P
2O
5/ha to both rice and wheat gave higher
total grain production than application of 60 kg P2O
5/ha to
wheat alone.A major factor responsible for recommending P to wheat
only in the RWCS was the fact that dwarf high yielding wheats were introduced before the introduction of high yielding rice varieties, and dwarf wheats showed a good and distinct response to P fertilisation which was not recorded for tall Indian wheats. There were three main factors responsible for this, including: high yields, a shorter root system at the initial growth stages (associated with shorter stems in dwarf wheats which limited their native soil P foraging capacity), and lower temperatures (optimum sowing date for dwarf wheats was mid-November, later than the traditional mid-October) reducing the rate of decomposition of soil organic matter, resulting in lesser availability of soil organic P. For example, the mean minimum temperatures at Delhi in mid-October and mid-November are 18 oC and 10 oC, respectively.
Interestingly, some recent (1999-2000) data on the re-sponse of rice and wheat (Table 5) conducted under the Proj-ect Directorate for Cropping Systems Research, Modipuram on farmer fields show that both rice and wheat respond well to P fertilisation. In fact, the response of rice to P was more than wheat in Punjab, UP, and Bihar. These data also show that response to P was better with NK fertilisation than with
N alone, highlighting the importance of balanced fertilisation (Prasad and Power, 1994; Tiwari, 2002; Prasad et al., 2004).
Using long-term RWCS experiment data at Ludhiana, Yadvinder-Singh et al. (2000) have concluded that the normal practice of applying 60 kg P
2O
5/ha to wheat only resulted
in lower P build-up in soil, a negative P balance, a decline in available Olsen P, lower agronomic efficiency, and lower recovery of P applied to wheat. They recommended an ap-plication of 74 kg P
2O
5/ha to wheat and 34.5 kg P
2O
5/ha to
rice for optimum productivity in the RWCS. These data thus support the conclusions drawn earlier by Yadav et al. (1998) and Kumar and Yadav (2001) from a long-term experiment on RWCS at Faizabad (UP) that over a long period both rice and wheat respond to P. Thus, the general recommendation for the IGP would be an application of 90 to 115 kg P2O5/ha/yr to RWCS…about two-thirds to wheat and one-third to rice.
Phosphorus management in the RWCS should therefore be considered as a long-term investment in soil fertility for sustained production. In contrast to N, it is more effective and practical to prevent P deficiency than to treat P deficient crops.
As per the current general recommendation of 95 to 115 kg P
2O
5/ha in the RWCS, the P need of 9 M ha works out to
0.85 to 1.03 M t of P2O
5. The estimated demand for foodgrain
for India is 294 M t/yr by 2020 (Kumar et al., 1998). Against the present production of about 210 M t, 84 M t/yr of ad-ditional foodgrain is required from the same cultivated area.
Depending upon the share designated from the RWCS belt in the IGP, the additional P requirement for this area may vary from 178,000 to 714,000 t of P
2O
5 (Table 6).
Thus, by 2020 the P require-ment of this RWCS is likely to be 0.9 to 1.7 M t of P
2O
5,
about one-third more P than is consumed currently.
Increased production in the RWCS is possible because potential yields are twice or more those currently grown, especially in ACRs III, IV, and V (Table 7).
Table 5. Response(kggrain/kgP2O5)ofkharifriceandwheattoPfertilisationinIGPonfarmers’fields(averageover3years1999-2002).
Rice Wheat
State Trial#Controlyield,
t/haResponseover
Trial#Controlyield,
t/haResponseover
OverN OverNK OverN OverNK
Punjab 48 4.1 15.6 16.3 48 3.1 11.2 11.7
Haryana 24 3.4 10.3 11.3 70 2.0 13.0 14.1
UP 147 1.2 5.9 5.9 137 0.9 4.2 5.3
Bihar 22 1.6 14.6 15.5 46 1.0 8.6 12.9
WestBengal 64 1.7 8.6 10.4 — — — —
Source:IndianAgriculturalStatisticsResearchInstitute,NewDelhi.
Table 6. AdditionalPfertiliserneedsofRWCSofIGPforfoodgrainproductionof294Mtby2020(additionalproductionof84Mt).
%share1expectedfromRWCSofIGP
Additionalproductionneeded,
Mt
AdditionalP2O5needed2,
‘000t
25 21 178.5
50 42 357.0
75 63 535.5
100 84 714.01%shareoftotal84mt2Prasadetal.(2004)basedonanumberofstudiesatNewDelhireportedanuptakeof8.2kgP2O5/tofriceand8.7kgP2O5/tofwheat.Anaveragevalueof8.5kgP2O5/tofgrainisthereforetakenforthesecalculations.
Table 4. EffectofapplicationofPtoriceorwheatorbothontheproductivityofRWCS.
kgP2O5/haapplied Grainyield,t/ha
Wheat Rice Rice Wheat Rice+Wheat
60 0 6.6 4.1 10.7
0 60 6.5 2.4 8.9
60 60 6.5 4.2 10.7
0 0 3.9 2.3 6.2
C.D.(5%) 0.39 0.30Source:GillandMeelu,1983.

Better C
rops – India / 2007
11
However, the trend in total RWCS productivity from 1985 to 1992 and beyond is negative. One of the causes for this situation is imbalanced NPK fertilisation (Tiwari, 2002; Prasad et al., 2004) and emerging deficiencies of micronutrients such as of Zn (Takkar et al., 1989; Prasad, 2006), and increas-ing S deficiency (Biswas et al., 2004; Tewatia et al., 2007). If adequate measures are taken to overcome these nutrient imbalances and deficiencies, the RWCS in the IGP can be sustained and ACR IV (Eastern UP and Bihar) can become another gra-nary similar to the Punjab-Haryana-Western UP crescent. BC-INDIA
Dr. Prasad is Indian National Science Academy Honor-ary Scientist & Ex ICAR National Professor, Division of Agronomy, Indian Agricultural Research Institute, New Delhi-110 012; e-mail: [email protected].
ReferencesAggarwal, P.K., et al. 2000. Rice-Wheat Consortium Paper Ser. 10. Rice-Wheat
Consortium for the Indo-Gangetic Plains, New Delhi and Centre for Ap-
plications Systems, Indian Agric. Res. Inst., New Delhi.
Baon, J.B. and A. Wibawa. 1998. In Nutrient Management for Sustainable
Agriculture (A.E. Johnston and J.K. Syres eds.) CAB I, Wallingford,
U.K. p. 357.
Biswas, B.C., et al. 2004. Fert. News 49(10):13-33.
Chhonkar, P.K. and N.S. Subbarao. 1967. Can. J. Microbiol. 13:749-753.
Formoli, G.N., et al. 1977. Fert. News 22(4):6-8.
Gill, H.S. and O.P. Meelu. 1983. Plant Soil 74:211-222.
Govil, B.P. and R. Prasad. 1972: J. Agric. Sci. (Camb.) 79:485-492.
Gupta, R.K. et al. 2006. Indian Fmg. 56(4):10-14.
Hegde, D.M. 1998. Indian J. Agron. 68:144-148.
Hundal, H.S. and G.S. Sekhon. 1980. J. Indian Soc. Soil Sci. 28:104-108.
Katyal, J.C. 1978. Phosphorus in Agric. 73:21-34.
Khanna, P.K. and N.P. De Datta. 1968. Indian J. Agric. Sci. 38:668-676.
Kirk, G.J.D., et al. 1990. In Phosphorus Requirements for Sustainable Agricul-
ture in Asia and Oceania, IRRI, Los Banos, Philippines. p. 211-223.
Kolar, J.S. and H.S. Grewal. 1989. Fert. Res. 20:27-32.
Kumar, A. and D.S. Yadav. 2001. J. Agron. Crop Sci. 186:47-54.
Kumar, P., et al. 1998. Economics and Political Weekly 33:A152-A158.
Ladha, J.K., et al. 2003. Field Crops Res. 81:159-180.
Mandal, L.N. 1979. Bull. Indian Soc. Soil Sci. 12:445-449.
Mathur, B.S. and A.K. Sarkar. 1998. In Nutrient Management for Sustainable
Agriculture (A.E. Johnson and J.K. Suyers eds.), CAB I, Wallingford,
U.K. p. 345.
Meelu, O.P. and R.S. Rekhi. 1981. Fert. News 26(9):16-22.
Mishra, B., et al. 1980. Indian J. Agric. Sc i. 50:691-697.
Motsara, M.R. 2002. Fert. News 47(8):15-21.
Narang, R.S. and S.M. Virmani. 2001. Rice-Wheat Consortium Paper Ser. 11,
Rice-Wheat Consortium for the Indo-Gangetic Plains, New Delhi and Int.
Crop Res. Inst. for the Semi-arid Tropics, Patancheru, India.
Patrick, Jr., W.H. and I.C. Mahapatra. 1968. Adv. Agron. 20:323-359.
Prasad, R. 2002. Souvenir 2nd Int. Agron. Congr., New Delhi. November 26-30,
2002. p. 57-66.
Prasad, R. 2006. Indian J. Fert. 2(9):103-119.
Prasad, R. and J.F. Power. 1994. Proc. FAI Ann. Sem. 514/4/12.
Prasad, R. and L.A. Dixit. 1976. Fertilisers containing partially water soluble
or no water soluble P. ICAR. pp. 34.
Prasad, R., et al. 2004. Fert. News 49(12):73-80.
Prasad, R., et al. 2003. Students Guide to Fertilisers and their Efficient Use in
India. PPIC-India Programme, Gurgoan. pp. 133.
Ray, A.N. and J. Seth. 1975. Indian J. Agron. 20:204.
Sah, R.N. and D.S. Mikkelsen. 1989. Soil Sci. Soc. Am. J. 53:1718-1722.
Sah, R.N., et al. 1989a. Soil Sci. Soc. Am. J. 53:1723-1729.
Sah, R.N., et al. 1989b. Soil Sci. Soc. Am. J. 53:1729-1732.
Samra, J.S., et al. 2003. In Improving the Productivity and Sustainability of
Rice-Wheat Systems: Issues and Impacts (J.K. Ladha et al. eds.). Am. Soc.
Agron. Special Pub. No. 65, p. 173-179.
Sarkar, A., et al. 1999. Crop Residues in India. Tech. Bull. Project Directorate
of Cropping Systems Research, Modipuram.
Sekhon, G.S. 1979. Bull. Indian Soc. Soil Sci. 12:193-201.
Sharma, S.N. and R. Prasad. 1997. Fert. Res. 45:187-191.
Sharma, S.N. and R. Prasad. 2001. Acta. Agron. Hung. 49:369-378.
Sharma, S.N. and R. Prasad. 2002. Arch. Acker. Pfl. Boden 48:363-370.
Sharma, S.N. and R. Prasad. 2003. J. Agric. Sci. 141:359-369.
Shukla, U.C. and M.L. Chaudhary, 1977. Proc. FAI/PAU Sem. Fertiliser Use
Efficiency through package of practices, Ludhiana.
Simpson, J.R. and C.H. Williams. 1970. Aust. J. Soil Res. 8:209-219.
Singh, M. and K.S. Singh. 1979. J. Indian Soc. Soil Sci. 27:314-320.
Singh, R.P. 1985. Rept. All India Wheat Improvement Project – Wheat
Agronomy 1984-85.
Singhania, R.A. and N.N. Goswami. 1974. Proc. Symp. Use of Radiation and
Radio isotopes in studies of Plant Productivity, Pantnagar, p. 437.
Sinha, R.N. and R.K. Ray. 1969. Indian J. Agron. 14:271.
Swaminathan, M.S. 2007. Presidential address, National Academy of Agricul-
tural Sciences, 6th January, 2007, New Delhi.
Takkar, P.N., et al. 1989. Twenty years of Coordinated Research on Micronu-
trients in Soils and Plants. Indian Inst. of Soil Sci., Bhopal, Bull. No. 1.
pp. 313.
Tandon, H.L.S. ed. 1987. Phosphorus Research and Agricultural Production in
India, FDCO, New Delhi.
Tewatia, R.K., et al. 2007. Proc. TSI-FAI-IFA Symp. Cum Workshop. Sulphur
in Balanced Fertilisation, Oct. 4-5, 2006, New Delhi. p. 15-25.
Tiwari, K.N. 1979. Indian Soc. Soil Sci. Bull. 12:519-526.
Tiwari, K.N. 2002. Fert. News 47(11):13-122.
Yadav, D.S. and L.P. Verma. 1983. Indian J. Agron. 28:137-140.
Yadav, R.L., et al. 1998. Nutr. Cycl. Agroecosystems 51:193-200.
Yadvinder-Singh, et al. 2000. Soil Sci. Soc. Am. J. 64:1413-1422.
Table 7. Presentandpotentialgrainyieldsofriceandwheatindifferentagro-climaticregions.
Agroclimaticregion
Presentyields,t/ha2 Potentialyields,t/ha3
Rice(R) Wheat(W) R+W Rice(R) Wheat(W) R+W
ACRVI1
Haryana 4.5-6.0 3.5-4.0 8.0-10.0 10-10.7 7-7.7 17-18.4
Punjab 5.2-6.7 3.5-4.5 8.7-11.2 10-11.7 7-8 17-19.7
ACRV 3.0-4.5 2.5-3.5 5.5-8 10-10.7 6.7-7.2 16.7-17.9
ACRIV 2.2-3.7 1.5-2.5 3.7-6.2 9-9.7 6.7-7.2 15.7-16.9
ACRIII 3.0-3.7 2-2.5 5.0-6.2 7.2-7.7 4.7-5.2 11.9-12.9
1Riceaspaddy(66%riceaftershelling).2Source:NarangandVirmani,2001.3Agarwal,etal.,2000.

12
Bet
ter
Cro
ps –
Ind
ia /
200
7
Grading of harvested litchi in the experimental orchard.
IndIa — West Bengal
Abbreviations and notes for this article: K = potassium; ATP = adenosine triphosphate; H+ = hydrogen ion; CO
2 = carbon dioxide.
Most fruit crops are heavy feeders of K and they usually carry high amounts of K in marketable parts. Among the several factors affecting fruit quality, adequate K
application is considered to be of utmost importance. Potas-sium is known to influence fruit yield in general and fruit quality in particular (Tandon and Sekhon, 1988). Fruit size, appearance, color, soluble solids, acidity, vitamin content, and taste, as well as shelf-life are all significantly influenced by adequate supply of K. These characteristics are in turn affected by photosynthesis, translocation of photosynthates, regulation of stomata, activation of enzymes, and many other processes (Tiwari, 2005). Shortage of K supply adversely affects most of the metabolic processes mentioned above (Marschner, 1995; Mengel, 1997).
Like other crops, K affects photosynthesis in litchi (Deng et al., 1994). Potassium influences the photosynthesis process at many levels namely, synthesis of ATP, activation of enzymes involved in photosynthesis, CO
2 uptake, balance of electric
charges needed for photophosphorylation in chloroplasts and is the counterion to the light-induced H+ flux across the thyla-koid membranes (Marschner, 1995). Photosynthesis requires adequate K levels in leaf tissue and lower K levels have been found to decrease photosynthesis rate sharply in corn (Smid and Peaslee, 1976). Debnath (2005) observed that net CO
2
assimilation in litchi, under high irradiance and high ambi-ent CO
2 concentrations, increased at high application rates
of K. The present study explores the effect of varying rates of applied K on leaf K content, photosynthesis activity, stomatal conductance, water use efficiency, yield, and fruit quality of litchi.
The experiment was conducted in 2004-2006 at the Horti-culture Research Station, Bidhan Chandra Krishi Viswavidya-laya, Mondouri, West Bengal, using 27-year-old litchi plants of the variety Bombai. The experiment was laid out in randomized block design having nine treatments with three replications. The nine combinations consisted of three different levels of K...400 (S
1), 600 (S
2 ), and 800 g/plant/year (S
3)...and three
application timings...15 days after fruit set and 15 days after harvesting (T
1), 15 days after fruit set and 30 days before flower-
ing (T2), and 15 days after fruit set and 60 days before flowering
(T3). Applications of N at 600 g and P
2O
5 at 400 g plant/year
were provided 15 days after fruit set and 15 days after harvest-ing. Potassium was applied in two equal splits at time intervals mentioned above. The field was irrigated regularly during fruit growth as well as after fertiliser application, except when fertiliser was applied before flowering. Plant protection mea-sures were taken as and when necessary. Leaf K content was
estimated by standard procedure (Piper, 1944) after randomly collecting 3rd and 4th pairs of leaves from the tip at the time of panicle initiation. Photosynthesis, stomatal conductance, and transpiration rate were measured weekly after fruit set for two leaves per leaf position on three trees at 1400 hours using a portable photosynthesis system (CI-310, CID, Inc. USA). The water use efficiency was calculated as photosynthetic activity (µmol CO
2/sq. meter/second) ÷ transpiration (Mmol H
2O/sq.
meter/second) and was expressed in mmol/mol (Veberic et al., 2005). The total soluble solids (TSS) were measured by hand refractometer and titratable acid content was estimated by the method described in AOAC (1990).
The average K content of leaf varied between 0.88 and 1.00% due to different levels and timings of K application (Table 1). Plants provided with 600 and 800 g K
2O at 15 days
after fruit set and 60 days before flowering showed maximum (1.00%) accumulation of K within the leaf (treatments S
2T
3 and
S3T
3, respectively). This was followed by K accumulation of
0.95% in treatments S2T
1 and S
3T
1. The lowest leaf K content
was recorded with 400 g K2O applied in two equal splits at 15
days after fruit set and 60 days before flowering. In general, higher levels of K application increased leaf K content. Menzel et al. (1995) from Australia reported that leaf K content of litchi was linearly related to K application rate. Higher accumula-tion of leaf K due to increased K application in litchi was also reported by Lal et al. (1999).
The average photosynthesis activity of leaves (Table 1) was
Leaf Potassium Content Influences Photosynthesis Activity, Yield, and Fruit Quality of LitchiBy P.K. Pathak, K. Majumdar, and S.K. Mitra
Application of 600 and 800 g K2O/plant/year in two equal splits at 15 days after fruit set
and 60 days before flowering increased leaf K content in litchi. Increased leaf K content improved photosynthesis rate, water use efficiency, and stomatal conductance of litchi plants and led to increased yield and improved fruit quality.

13
Better C
rops – India / 2007
highest (12.19 and 11.50 µmol CO2/sq. meter/second) when the
average leaf K content was 1.00% compared to 6.81 and 5.86 µmol CO
2/sq. meter/second when leaf K content was lowest at
0.89 and 0.88%, respectively. Thus, higher leaf K content cor-responded with increased photosynthetic activity. The highest photosynthesis activity recorded among treatments (17.30 µmol
CO2/sq. meter/second)
was found with 1.02% leaf K content (S
3T
3) in
the 1st week after fruit set (Figure 1). Pho-tosynthesis activity of leaves was highest dur-ing the first two weeks after fruit set and de-clined thereafter until harvest. Treatment S
2T
3
sustained the highest photosynthetic activity until the 4th week after fruit set.
The average sto-matal conductance of leaves varied between 16.50 and 27.86 mmol/sq. meter/second, and it appears that stomatal conductance also in-creased along with leaf K content (Table 1). Highest stomatal con-ductance correspond-ed with highest leaf K content (S
2T
3). Average
conductance was lowest under S
2T
2 where leaf K
content was 0.89%. In general, stomatal conductance was high during the first three weeks after fruit set, then it decreased until weeks 5 and 6, and increased once again at the later stages of fruit growth (Figure 2). Highest stomatal conductance was 35.20, 35.86, and 27.80 mmol/sq. meter/second in the 1st, 2nd, and 3rd week, respectively, under S
3T
3. This treatment
Table 1. Effect of treatment on average leaf K content, photosynthesis rate, stomatal conductance, water use efficiency of leaves, yield, and fruit quality of litchi.
Leaf K content,
%
Photosynthesis, µmol CO2 /sq. meter/second
Stomatal conductance,
mmol/sq. meter/ second
Water use efficiency, mmol/mol
Yield, kg/tree
Fruit weight,
g
Aril recovery,
%TSS/acid
ratio
S1T1 0.93 5.87 17.45 15.33 54.82 20.27 55.89 33.21
S1T2 0.93 6.02 18.62 16.34 71.50 23.47 62.21 46.13
S1T3 0.88 6.81 20.03 18.01 64.30 23.37 63.63 50.97
S2T1 0.95 8.70 21.22 20.43 77.28 20.94 60.46 38.70
S2T2 0.89 5.86 16.50 17.47 79.58 23.71 60.98 48.24
S2T3 1.00 12.19 27.86 26.45 78.91 24.03 62.42 62.07
S3T1 0.95 9.20 22.74 25.21 51.91 21.68 56.46 46.50
S3T2 0.92 7.71 22.01 20.78 78.69 22.50 59.56 52.22
S3T3 1.00 11.50 25.08 25.62 58.83 22.49 59.58 57.19
Std. Dev. 0.042 2.395 3.65 4.23 11.15 1.30 2.61 8.80
Std. Error 0.014 0.798 1.22 1.41 3.72 0.43 0.87 2.93
S1- 400g K2O/tree/year T1-15 days after fruit set and 15 days after harvestS2 - 600g K2O/tree/year T2-15 days after fruit set and 30 days before floweringS3 - 800g K2O/tree/year T3-15 days after fruit set and 60 days before floweringN at 600g and P2O5 at 400g/tree/year (fixed) were applied 15 days after fruit set and 15 days after harvest.
0
2
4
6
8
10
12
14
16
18
20
Week 1 Week 2 Week 3 Week 4 Week 5 Week 6 Week 7 Week 8
Weeks after Fruit Set
Phot
osyn
thes
is, µ
mol
CO
2/sq
. met
er/s
econ
d
S1T1
S1T2
S1T3
S2T1
S2T2
S2T3
S3T1
S3T2
S3T3
Figure 1. Leaf photosynthesis rate due to different treatments. Figure 2. Leaf stomatal conductance rate due to different treat-ments.
0
5
10
15
20
25
30
35
40
Week 1 Week 2 Week 3 Week 4 Week 5 Week 6 Week 7 Week 8
Weeks after Fruit Set
Stom
atal
con
duct
ance
, mm
ol/s
q. m
eter
/sec
ond S1T1
S1T2
S1T3
S2T1
S2T2
S2T3
S3T1
S3T2
S3T3

14
Bet
ter
Cro
ps –
Ind
ia /
200
7
was followed by S2T
3 (leaf K content was 0.99% and 1.04%
in the month of April and May) which continued to have high conductance in the rest of the fruit growth period.
Average water use efficiency was also found to be higher under S
2T
3 and S
3T
3 and was positively influenced by leaf K
content (Table 1). Water use efficiency was higher in all treat-ments during the first two weeks after fruit set and gradually decreased up to the 8th week.
Maximum average fruit weight (24.03g), TSS/acid ratio (62.07), and aril recovery (62.42%) were recorded under S
2T
3.
Maximum yield (79.58 kg/tree) was noted for the S2T
2 treat-
ment, which, however, was statistically at par with the yield achieved under S
2T
3.
Potassium not only promotes the translocation of newly synthesized photosynthates, but also has a beneficial effect on the mobilization of stored material (Mengel and Kirkby, 1987). We observed higher yield, fruit weight, aril recovery, and TSS/acid ratio of fruit with higher leaf K content. These characteristics are affected by photosynthesis, translocation of photosynthates, regulation of stomata, activation of enzymes and many other processes. Plants require K for the production of high-energy molecules (Wallingford, 1973). This energy is required for all synthetic processes involved in plant metabo-lism, resulting in production of carbohydrates, proteins, and lipids, which express the quality of the crops. BC-INDIA
Dr. Pathak is Subject Matter Specialist (Horticulture) at Krishi Vigyan Kendra Ashokenagar, West Bengal. Dr. Majumdar (e-mail: [email protected]) is Deputy Director, IPNI India Programme (East Zone). Dr. Mitra (e-mail: [email protected]) is Professor, Department of Fruits and Orchard Management, Faculty of Horticulture, Bidhan Chandra Krishi Viswavidyalaya, West Bengal.
AcknowledgmentsThe authors gratefully acknowledge the funding provided
by the IPNI India Programme.
ReferencesA.O.A.C. 1990. Official Methods of Analysis, 14th ed. Association of Official
Agricultural Chemist. Washington, D.C.
Debnath, S. 2005. Optimizing nutrition programme and irrigation for sustain-
able litchi production. Ph.D. Thesis submitted to Bidhan Chandra Krishi
Viswavidyalaya, Nadia, West Bengal.
Deng, Y.C., et al.1994. J. South China Agric. Univ., 15: 80-84.
Lal, R.L., et al.1999. Prog. Hort., 31:79-83.
Marschner, H. 1995. Mineral Nutrition of Higher Plants. 2nd Ed. Academic
Press. London.
Mengel, K. 1997. In Food Security in the WANA region, the essential need for
balance fertilization (ed: A.E. Johnston). Proceedings of the Regional
Workshop of the International Potash Institute, Bornova, Izmir, Turkey,
26-30 May 1997. IPI Bern, Switzerland. pp. 157-174.
Mengel, K. and E.A. Kirkby. 1987. Principles of Plant Nutrition. 4th Ed. Inter-
national Potash Institute, IPI, Bern, Switzerland. p. 685
Menzel, C.M., et al. 1995. J. South African Soc. Hort. Sci., 5: 97-99.
Piper, C.S. 1944. Soil and Plant Analysis. International Science Publications.
Inc. New York.
Smid, A.E. and D.E. Peaslee. 1976. Agron. J., 68: 904-908
Tandon, H.L.S. and G.S. Sekhon. 1988. Potassium research and agricultural
production in India Fer. Dev. Counsult Org., New Delhi.
Tiwari, K.N. 2005. Better Crops with Plant Food, 89(4): 29-31
Veberic, R., et al. 2005. Acta Agriculturae Slovenica, 85: 143-155.
Wallingford, W. 1973. In Potassium for agriculture. Potash & Phosphate Insti-
tute, Atlanta, GA. pp. 10-27.
Potassium is important for many key factors in litchi and other crops. Increased leaf K content in litchi increased yield and improved quality of fruit.

Better C
rops – India / 2007
15
Abbreviations and notes for this article: N = nitrogen; P = phosphorus; K = potassium; M t = million metric tons; S = sulphur; BNF = biological N fixation.
Many readers will recall the grave situation which India faced in the early 1990s when the country’s foreign exchange reserves were depleted to alarmingly low
levels. The concern for negative monetary balances triggered major economic reforms, the benefits of which are being wit-nessed today not only in India but the world over. The state of depletion of soil nutrient reserves reflected in negative nutrient balances is very similar to the macro-economic crisis of the early 1990s. The only difference being that while the economic reforms were put into place rapidly, the concern for deteriorating negative soil nutrient balances is largely limited to the scientific community and have not yet rung the alarm bell in the corridors of planning and policy-making.
It should be absolutely clear to those in the Government and its Planning Commission who are emphasising the need to step up the growth rate of agricultural production that poor quality and nutrient depleted soils cannot support any mod-erate to high agricultural production targets unless the soil nutrient reserves are improved substantially. A key factor in enabling the country to achieve future agricultural produc-tion targets will be how well and fast the depletion of soils is reduced and the nutrient balance sheet is moved from red towards green. This will not, and cannot, happen overnight or in a few years, but serious efforts to reverse the process must start right away.
Soil Nutrient Balance SheetsAn assessment of nutrient additions, removals, and bal-
ances in the agricultural production system generates useful, practical information on whether the nutrient status of a soil (or area) is being maintained, built up, or depleted. A simpli-fied depiction of nutrient additions and removals is given in Figure 1.
Estimates of nutrient input and output allow the calculation of nutrient balance sheets both for individual fields and for geographical regions. It is a book-keeping exercise, similar in many ways to keeping a bank account. A considerable amount of information on nutrient uptake and removal by crops and cropping system is now available. In most cases, different balance sheets are not comparable due to vastly different as-sumptions and computation methodologies. Several aspects of nutrient uptake, removal, and balances have been dealt with in detail elsewhere (Kanwar and Katyal, 1997; Tandon, 2004).
Nutrient balance sheets in most soils of India have been deficient and continue to be so. This is primarily because nutrient removals by crops far exceed the nutrient additions through manures and fertilisers. For the past 50 years the gap between removals and additions has been estimated at 8 to 10 M t N+P
2O
5+K
2O per year (Tandon, 2004). This has been the
case in the past, at present, and this will likely continue into the future. To this extent, the soils are becoming depleted – the situation is akin to mining soils of their nutrient capital, leading to a steady reduction in soil nutrient supplying capacity. On top of this deficit are the nutrient losses through various other means. For example, nutrient losses through soil erosion are alarmingly large, but are rarely taken into account.
Nutrient loss through soil erosion is second only to nutri-ent removal as a result of crop production. An annual loss of 8 M t plant nutrients has been mentioned through 5.3 billion t of soil lost by water erosion (Prasad and Biswas, 2000). Es-timates of removals through leaching and gaseous losses are not available.
Cropping system based scenario: In many cases, even the well managed cropping systems raised on currently recommended rates of nutrient application end up depleting soil fertility. The rice-wheat annual cropping system, the most intensive annual system practiced in India, is cited as one example (Tiwari et al., 2006). Productivity of the rice-wheat system was tested at 10 locations across India for 2 years. Crops received recommended rates of nutrients through fertilisers as per the site specific nutrient management (SSNM) plan. Aver-age annual grain productivity was 13.3 t/ha. In many cases, even when the nutrients were applied based on the requirement of individual fields, nutrient uptake exceeded nutrient input resulting in negative balances. The N and P balances were
Soil Nutrient Balance Sheets in India: Importance, Status, Issues, and ConcernsBy H.L.S. Tandon
Negative nutrient balances in most Indian soils not only mirror poor soil health, they also represent severe on-going depletion of the soil’s nutrient capital, degradation of the environ-ment, and vulnerability of the crop production system in terms of its ability to sustain high yields. In the prevailing regime of widespread negative nutrient balances, it is difficult to foresee positive nutrient balances in most parts of India, even when all available sources of plant nutrients are deployed, unless their quantity and efficiency is raised substantially. Depleted soils cannot be expected to support bumper crops or high growth rates.
Figure 1. Asimplifiedpresentationofnutrientadditionsandremov-alsinagriculturalsoils(Smaling,1993)
Plants
Inputs Outputs
Mineral fertilizers Harvested crop parts
Organic manures Crop residues
Atmospheric deposition Leaching
Sedimentation Water erosion
Biological nitrogen fixation Gaseous losses

16
Bet
ter
Cro
ps –
Ind
ia /
200
7
positive at 5 sites and negative in the other 5. The K and S balances were negative at all 10 sites; the K bal-ances were the most negative.
The dryland sce-nario: In addition to the intensively cropped irrigated lands, it is noteworthy that even in the vast non-irri-gated dry lands, overall nutrient balances are negative as removals exceed additions by 7 to 1 (Table 1). These lands are estimated to receive 10% of the fertiliser used in India, but account for 30% of the total nutrient re-moval. Expectation for
high levels of crop productivity would be unrealistic in such a scenario unless the nutrient depletion process is drastically reduced if not halted.
Plantation sector scenario: The fate of the supposedly well-managed plantation sector is not much different as the depletion of nutrients is rampant and increasing in intensity. Gross nutrient balances sum to -417,000 t N+P
2O
5+K
2O and
are much worse on a net basis after accounting for fertiliser use efficiency (Table 2).
Some segments where nutrient balances are expected to be positive are vineyards, intensively cultivated field under potato/vegetables, bananas, sugarcane, and cotton (N only).
State level scenario: A state-wise picture of nutrient additions, removals, and balances is provided in Table 3. The computations in many cases are based primarily on fertiliser input alone. In most cases, the nutrient balances are negative indicating that nutrient removals exceed nutrient additions.
The national scenario: By adding up recent state-level nutrient balance sheets computed earlier (Tandon, 2004), an illustrative balance sheet of NPK in Indian agriculture is sum-marised in Table 4 and Figure 2. The present scenario is based mostly on nutrient input through fertilisers for which data are available. The net figures have been arrived at by adjusting fertiliser input for use efficiencies of 50% for N, 35% for P
2O
5
(including residual effects), and 70% for K. On the removals side, 80% of crop uptake for N and P was considered along with 60% of crop K uptake.
On a gross basis, the balance is positive for N and P, but is negative for K. On a net basis, which is more realistic and use-ful for planning nutrient management, the balance is negative
Table 1. Summaryofnutrientbalancesheetindrylandagriculture.
N+P2O5+K2O,Mt
Estimatedadditions(fertilisers) 1.0
Estimatedremovals(crops) 7.4
Balance -6.4Source:Tandon(2004).
Table 2. Summarisednutrientbalancesheetoftheplantationsector.
NutrientGrossbalance,
‘000tNetbalance,
‘000t
N -179 -272to-284
P2O5 -52 -91to-97
K2O -186 -283to-298
Total -417 -643to-680Source:Tandon(2004).
Table 3. Nutrientadditionthroughfertilisers,nutrientremovalbycrops,andapparentbalanceinmajorstatesofIndia(‘000t).
State
N P2O5 K2O N+P2O5+K2O
Add Rem Bal Add Rem Bal Add Rem Bal Add Rem Bal
A.P. 1,256 477 779 576 497 79 191 817 -625 2,024 1,791 233
Assam 38 257 -219 15 74 -59 18 294 -277 71 625 -554
Bihar 618 481 137 101 102 -1 54 492 -438 774 1,075 -301
Chhattisgarh 67 156 -89 68 68 -0 13 137 -124 148 360 -212
Gujarat 691 340 351 268 121 147 61 426 -365 1,020 887 123
Haryana 597 362 235 201 145 56 5 490 -485 803 998 -195
H.P. 29 43 -14 5 8 -3 4 25 -21 39 76 -37
Jharkhand 40 165 -125 15 60 -45 5 20 -15 60 245 -185
Karnataka 681 473 209 374 239 135 216 604 -388 1,272 1,315 -43
Kerala 87 149 -62 44 53 -9 87 176 -89 219 377 -158
M.P. 519 696 -177 344 431 -87 24 849 -825 888 1,976 -1,088
Maharashtra 923 1,559 -636 450 608 -158 197 2,096 -1899 1,571 4,262 -2,692
NEStates 19 96 -77 5 17 -12 3 84 -81 41 198 -157
Orissa 196 227 -31 56 104 -48 40 282 -242 291 614 -323
Punjab 1,081 589 492 275 279 -4 19 764 -745 3,276 3,580 -304
Rajasthan 547 835 -288 147 235 -88 7 1,068 -1061 1,375 1,631 -256
TamilNadu 484 405 79 145 111 34 162 398 -236 791 914 -123
U.P. 2,387 1,497 889 776 305 471 114 1,777 -1664 3,276 3,580 -304
W.Bengal 562 764 -202 297 241 56 226 801 -575 1,085 1,806 -721
AllIndia 10,923 9,613 1,310 4,188 3702 486 1,454 11,657 -10,203 16,564 24,971 -8,406
Add=Additions,Rem=Cropuptake,Bal=Balances.SummarisedbyTandon(2004)fromvariousIndianpublishedsourcesfromFertiliserNews.

Better C
rops – India / 2007
17
for N, P, K, and S (not shown). The net negative NPK balance or annual depletion of 9.7 M t is 19% N, 12% P, and 69% K. The current estimated average net depletion per ha from India’s 143 M ha of net sown area comes to 16 kg N, 11 kg P
2O
5, and
42 kg K2O (69 kg N+P
2O
5+K
2O). The large proportion for K
is partly because crops remove an average of 1.5 times more K than N, and K application through fertiliser is much lower than that of N or P.
Thus the nutrient needs of crops and associated nutrient losses of Indian agriculture are so large (and growing each year) that no single source, be it fertiliser, organic manures, or crop residues can meet them by itself. The nutrient deficit can be reduced by putting all available sources of plant nutrients to use. However, Indian soils are still estimated to be losing close to 9 M t N+P
2O
5+K
2O annually even after harnessing
currently utilisable organic resources plus input through BNF on a gross basis (Table 5).
Some Issues and ConcernsConstruction of nutrient balance sheets is tempting, but
very challenging because of the many sources of nutrients involved and the range of efficiencies possible from a suite of nutrient sources. Thus nutrient balance sheets will stand modified (upwards or downwards) depending upon the assump-tions made, the reliability of the data available, the inclusion of inputs other than fertilisers (organics, BNF) and their ef-ficiency, and the inclusion of nutrient removals through various channels of loss in addition to crop uptake.
A major source of confusion and possible error while deal-ing with published literature is the question of whether pre-sented nutrient removal figures actually refer to net removals or total nutrient uptake. The other, rather commonly encountered problem concerns the units employed. Often it is not clearly stated whether data are presented on an elemental (P and K) or oxide (P
2O
5, K
2O) basis. Data presented as P or K can in
fact turn out to be on an oxide basis when cross checked with the authors.
Divergent assumptions made by various workers regard-ing nutrient use efficiency are another major problem while working out net nutrient balances (Tandon, 2004). Nutrient use efficiency for both organic and mineral sources have been equated, and is a questionable practice. Unrealistically high
and rarely cited efficiency figures (i.e., 100% for P and 100% for K) have been used in the calculation of nutrient balance sheets (Katyal, 2001). These have been justified by stating that whatever P and K are not taken up by a crop remain in the soil and are eventually used. However, even in case of P and K, there can be irreversible conversion into unavailable forms (reductant-soluble P) and also leaching of K in coarse textured soils under flood irrigation or heavy rainfall. Most workers use efficiency figures of 30 to 50% for N, 20 to 30% for P, and 70 to 80% for K.
The contribution of BNF can be either oversimplified or overlooked in many balance sheets for N. This is unjustified for a country like India in view of its 22 M ha under pulses and another 13 M ha under groundnut and soybean. At an assumed average BNF of 25 kg N/ha, a sizeable input of 875,000 t N is contained in these legumes (550,000 t N in pulses alone). When this N input is integrated into balance sheets and it is assumed that much of what is fixed stays in the plant, the net removal of N is reduced accordingly. In the process, the overall nutrient balance for N is positively altered. Indian researchers have employed figures varying from 50% to 90% as the proportion of BNF-derived N in legumes. But there are cases where researchers have completely ignored BNF while working out the nutrient balances in pulse production systems. In a recent analysis by ICAR scientists, it was concluded that the negative nutrient balances under pulses resulted in a net mining of 395,000 t N, 50,000 t P
2O
5 and 352,000 t K
2O (Ga-
neshamurthy et al. 2003). In this study, there was no mention of BNF or its contribution to N removal by pulses – as if the entire N removal came from the soil-fertiliser sector.
Nutrient Balances – More Complex Than Input and Output
Nutrient balance sheets are not just mathematical computa-tions, but will continue to be very important for gaining insight into the dynamics of soil fertility, nutrient budgeting, and practical nutrient management planning. However, a mean-ingful balance sheet requires comprehensive data, realistic assumptions, clear distinction between nutrient removal and nutrient uptake, the inclusion of various sources of nutrients, and their estimated efficiency factors, and accounting of nutri-ent losses through other routes including erosion. However, in
Table 4. SoilnutrientbalancesheetinIndia
Grossbalancesheet,‘000t
Netbalancesheet,‘000t
Nutrient Addition Removal Balance Addition Removal Balance
N 10,923 9,613 1,310 5,461 7,690 -2,229
P2O5 4,188 3,702 486 1,466 2,961 -1,496
K2O 1,454 11,657 -10,202 1,018 6,994 -5,976
NPKTotal 16,565 24,971 -8,406 7,945 17,645 -9,701
Figure 2. Theoverallnutrient(NPK)balanceinIndianagriculture.Source:Tandon(2004).
Table 5. Totalnutrientadditions,removalsandbalanceinIndianagriculture.
N+P2O5+K2O,Mt
Additions(fertilisers,organics,BNF) 24
Removals(harvestedcrops,erosion) 33
Balance 9
-100
-80
-60
-40
-20
0
20
Gross balance sheet, kg/ha Net balance sheet, kg/ha
Bal
ance
(net
sow
n ar
ea),
kg/h
a
NP
2O
5
K2O
NPK total
N P2O
5 K2O
NPK total
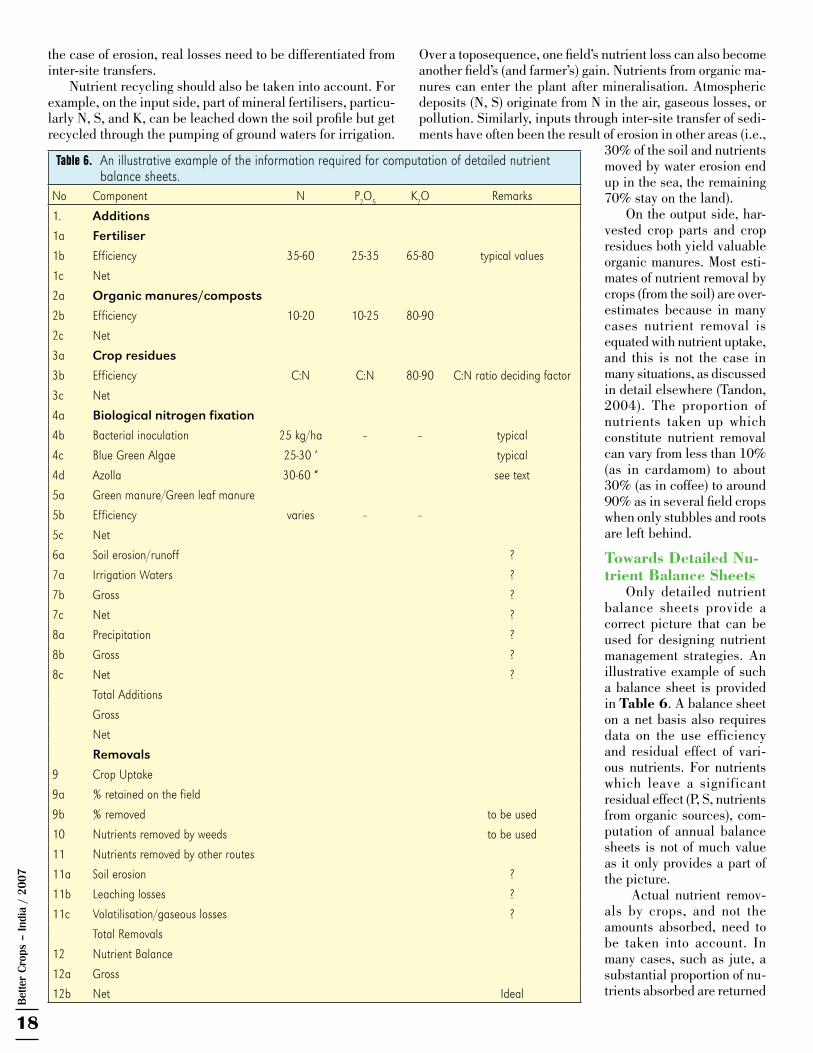
18
Bet
ter
Cro
ps –
Ind
ia /
200
7
Over a toposequence, one field’s nutrient loss can also become another field’s (and farmer’s) gain. Nutrients from organic ma-nures can enter the plant after mineralisation. Atmospheric deposits (N, S) originate from N in the air, gaseous losses, or pollution. Similarly, inputs through inter-site transfer of sedi-ments have often been the result of erosion in other areas (i.e.,
30% of the soil and nutrients moved by water erosion end up in the sea, the remaining 70% stay on the land).
On the output side, har-vested crop parts and crop residues both yield valuable organic manures. Most esti-mates of nutrient removal by crops (from the soil) are over-estimates because in many cases nutrient removal is equated with nutrient uptake, and this is not the case in many situations, as discussed in detail elsewhere (Tandon, 2004). The proportion of nutrients taken up which constitute nutrient removal can vary from less than 10% (as in cardamom) to about 30% (as in coffee) to around 90% as in several field crops when only stubbles and roots are left behind.
Towards Detailed Nu-trient Balance Sheets
Only detailed nutrient balance sheets provide a correct picture that can be used for designing nutrient management strategies. An illustrative example of such a balance sheet is provided in Table 6. A balance sheet on a net basis also requires data on the use efficiency and residual effect of vari-ous nutrients. For nutrients which leave a significant residual effect (P, S, nutrients from organic sources), com-putation of annual balance sheets is not of much value as it only provides a part of the picture.
Actual nutrient remov-als by crops, and not the amounts absorbed, need to be taken into account. In many cases, such as jute, a substantial proportion of nu-trients absorbed are returned
Table 6. Anillustrativeexampleoftheinformationrequiredforcomputationofdetailednutrientbalancesheets.
No Component N P2O5 K2O Remarks
1. Additions
1a Fertiliser
1b Efficiency 35-60 25-35 65-80 typicalvalues
1c Net
2a Organic manures/composts
2b Efficiency 10-20 10-25 80-90
2c Net
3a Crop residues
3b Efficiency C:N C:N 80-90 C:Nratiodecidingfactor
3c Net
4a Biological nitrogen fixation
4b Bacterialinoculation 25kg/ha – – typical
4c BlueGreenAlgae 25-30‘ typical
4d Azolla 30-60“ seetext
5a Greenmanure/Greenleafmanure
5b Efficiency varies – –
5c Net
6a Soilerosion/runoff ?
7a IrrigationWaters ?
7b Gross ?
7c Net ?
8a Precipitation ?
8b Gross ?
8c Net ?
TotalAdditions
Gross
Net
Removals
9 CropUptake
9a %retainedonthefield
9b %removed tobeused
10 Nutrientsremovedbyweeds tobeused
11 Nutrientsremovedbyotherroutes
11a Soilerosion ?
11b Leachinglosses ?
11c Volatilisation/gaseouslosses ?
TotalRemovals
12 NutrientBalance
12a Gross
12b Net Ideal
the case of erosion, real losses need to be differentiated from inter-site transfers.
Nutrient recycling should also be taken into account. For example, on the input side, part of mineral fertilisers, particu-larly N, S, and K, can be leached down the soil profile but get recycled through the pumping of ground waters for irrigation.

Better C
rops – India / 2007
19
ConclusionsFinally, in the absence of any quantum jump in fertiliser
use, large-scale nutrient recycling and adoption of IPNS, it is very likely that the nutrient balance sheet of Indian agricul-ture will continue to be negative and its soils will continue to get depleted for years to come. Poor people and poor soils co-exist.
The time has come to put a stop to further nutrient depletion of agricultural soils and take the severity of negative nutrient balances with the same urgency as the negative balance of payments and foreign exchange depletion was taken in the early 1990s for the country’s economic health. This calls for direct and serious intervention at the highest levels. Affirma-tive action is needed for improving soil fertility and hence soil nutrient balances on a very large scale. Sufficient scientific information is now available to undertake such measures and scientists can play a limited role by focusing on the problem and furnishing area specific guidelines. Major initiatives must come from the political leadership, planners, policy-makers, financial institutions, and the providers of plant nutrients.
We must be very clear that no amount of planning for higher agricultural production targets will bear fruit on impoverished, nutrient depleted soils whose nutrient balance sheets have been in the red for decades. Depleted soils will refuse to deliver the goods if not handled properly. The custodian of national wealth and well being is as much the soil bank of India as is the Reserve Bank of India. BC-INDIA
Dr. Tandon is the Director of Fertiliser Development and Consulta-tion Organisation, New Delhi, India, e-mail: [email protected], [email protected].
References Ganeshamurthy, A.N. et al. 2003. Fert. News, 48 (5) 23-24, 27-34, 37-41.
Kanwar, J.S. and J.C. Katyal (eds). 1997. Plant nutrients needs, supply, efficiency
and policy issues. 2000-2025, NAAS, New Delhi, pp329.
Katyal, J.C. 2001. J. Indian Society Soil Sci., 49, 570-592.
Prasad, R.N. and P.P. Biswas. 2000. In Singh, G.B. and Sharma, B.R. (eds).
50 years of natural resource management research, ICAR. New Delhi,
pp 644.
Smaling, E.M.A. 1993. In The role of plant nutrients for sustainable food
production in Sub – Saharan Africa, H. Van Reulen and W.H.Prins (Eds.)
Leidschendan, The Netherlands: VKP.
Tandon, H.L.S. 2004. Fertilizers in Indian Agriculture – from 20th to 21st century.
FDCO, New Delhi, India. pp. 240.
Tiwari, K.N., et al. 2006. Site-specific nutrient management for sustainable high
yield agriculture: Results of Rice–Wheat and Rice–Rice Systems. Potash &
Phosphate Institute of Canada–India Programme and Project Directorate
of Cropping Systems Research (ICAR). pp. 110.
to the fields through leaf-fall well before harvest. Likewise, nutrients removed by weeds and not only the main crop are also important. In the case of hand-weeding, where the plants are uprooted and removed from the field, removals equal uptake. However, in the case of chemical weeding, where plants die but stay in the fields, the absorbed nutrients get recycled and do not contribute to removals.
Where significant amounts of crop residues are returned to the field, these contribute significant quantities of K. Likewise, legume residues also contribute to the N input as does BNF through various systems such as N fixing bacteria, blue green algae, and Azolla. In the case of Azolla, the N input depends on the times Azolla is harvested when grown as a dual crop or whether its biomass is brought in from outside and ploughed in as a green manure. Traditional green manures bring in a significant amount of N (30 to 120 kg N/ha), but the other nutrients added by them are simply soil derived nutrients which have been taken up during growth. Green leaf manur-ing is another route of nutrient additions, which they have in all probability absorbed from another field or field bunds. The nutrients added through organic manures/composts generally last for more than a crop season.
Plant nutrients lost through erosion are important and should be taken into account. However, these constitute either net removals or inter-site transfers which need to be appreci-ated as all eroded material does not end up in rivers or the sea. It will also make a difference whether nutrient balances are computed for an individual field or for a larger landmass/region. In several cases, net nutrient removals from the soil can be substantial, along with the valuable topsoil.
In the case of nutrient input through irrigation waters, a significant amount of several nutrients can be brought in, but the net addition will depend upon the composition of water, volume and frequency of irrigation, quantities of nutrients retained in the root zone, and those removed from the soil with percolating waters. The same applies to precipitation where nutrient removals through leaching can exceed the nutrients brought in, which also depends on soil physical properties and the rainfall intensity.
For computing N balance sheets, inclusion of BNF is a must. The amounts of N added would depend on the popula-tion and effectiveness of the N fixing micro-organisms. Typi-cally, inoculation with N fixing microbes is associated with an N input of 25 to 30 kg/ha. Azolla can contribute 30 to 60 kg N/ha depending on whether one or two harvests are taken during rice growth. Some N fixation takes place even without inoculation where the native bacterial population is sizable and effective.
Finally, the amount of background research required to compute detailed nutrient balance sheets is large and expen-sive. As the volume of such data increases, the number and dependence on assumptions will decrease, thus providing dependable and realistic nutrient balance sheets which cor-rectly mirror the state of soil health and can be put to use for improving it on a medium to long-term basis. An illustrative example of the information required for computation of detailed nutrient balance sheets is provided in Table 6.

20
Bet
ter
Cro
ps –
Ind
ia /
200
7
The soil resource base is constantly under pressure as food, feed, fuel, and fiber demands are ever increasing, while per capita availability of cultivated land is declin-
ing. Annual loss of plant nutrients from Indian soils continues to be large at 5.4 to 8.4 M t, thus the spread of multiple nutrient deficiencies is commonly reported throughout India. Under these circumstances, monitoring soil fertility is a real challenge demanding rapid, reliable, and inexpensive techniques.
The SA method of evaluating soil fertility actually dates back to the mid 1960s, but modified procedures of the SA as outlined by Hunter (1980) and Portch and Hunter (2002) have been found to be useful to facilitate simultaneous evaluation of all essential mineral nutrients under rapidly changing and dynamic soil fertility environments.
The SA concept necessitates pre-screening of the prevail-ing soil nutrient disorders through laboratory sorption studies and greenhouse experiments prior to conducting any field study. This process allows for the flexibility of repeated use of relatively inexpensive greenhouse experiments in case there is any need for further clarification. When satisfied, this knowl-edge is extended to related field experiments for the confirma-tion of screening results and quick assessment of the nutrient requirements of various crops under field conditions.
Our experience has allowed the adoption of such research programs in South India and Sri Lanka in collaboration with State Agricultural Universities to quickly diagnose multiple nutrient disorders in soils and efficiently optimise nutrient ap-plication for a variety of crops grown under various field situa-tions. This paper presents results of experiments conducted on
three soil series, including the Kalathur (clay loams, a member of soil order Vertisols – Typic Haplusterts) and Palaviduthi (sandy clay loams of the order Ultisols – Typic Kandiustults) series from Tamil Nadu where rice and sugarcane were field tested, and the Vellayani series (sandy clay loams of the order Alfisols – Typic Haplustalfs) of Kerala where banana was the test crop.
The sorption and greenhouse experiments performed on the Kalathur series indicated that N, P, K, and Zn were the most limiting for crop growth. Relative yields were 61, 66, 75, and 75% of that of the optimum when N, P, K, and Zn were omitted, respectively (Figure 1). Relative yields were not affected dras-tically with other nutrients, indicating that those four nutrients need further investigation to establish nutrient requirement of crops under a field situation. Ultimately, by utilising soil sorption information for P, K, and Zn along with greenhouse experiments and field experiments with rice, researchers established the application of 170-55-42-6.5 kg N-P
2O
5-K
2O-
Zn/ha which produced yields close to 7 t/ha (Murugappan et al., 2001). Skipping any of these nutrients from the optimum dose drastically impacted crop yields (Figure 2) proving that those four nutrients are crucial to crop production. Here the researchers have used target yield equations and indigenous N supply to determine N rates in these conditions.
In the Palaviduthi series, sorption and greenhouse experi-ments established that in addition to N, P, K, and Zn, Fe was also an important nutrient. Omission of these nutrients from the optimum resulted in yields which were 62 to 84% of the optimum (Figure 3). This information was used in subsequent
Optimising Crop Nutrient Needs Using a Systematic Approach to Soil Fertility Evaluation and Improvement By T. Nagendra Rao, V. Murugappan, P. Malarvizhi, M.R. Latha, T. Balaji, and N. Prakashmany
Field experimentation on crops grown in soils with multiple nutrient limiting situations is a challenge in terms of cost and time. Soil testing programs are evolving towards more realistic decision support systems for nutrient recommendations. Examples of research are described here showing how a systematic approach (SA) to soil fertility evaluation and improvement is helpful in establishing nutrient needs for crops grown in various soil types.
Figure 2. Results of field studies establishing nutrient needs for rice (Kalathur Series, Tamil Nadu).
Figure 1. Results of greenhouse studies used to identify most limit-ing nutrients for rice prior to field experiments (Kalathur Series, Tamil Nadu).
Abbreviations and notes for this article: N = nitrogen; P = phosphorus; K = potassium; Mg = magnesium; Ca = calcium; Fe = iron; Zn = zinc; M t = million metric tons.
100
61 6675
97 91101
110
92 94 96103
75
0
20
40
60
80
100
120
OPTIMUM - N - P - K + Ca
+ Mg
+ S + Fe+ B + Cu
+ Mn
+ Mo
- Zn
Nutrient applications
Rel
ativ
e yi
eld,
%
4,000
4,500
5,000
5,500
6,000
6,500
7,000
7,500
Optimum Opt - N Opt - P Opt - K Opt - Zn
Optimum dose (kg/ha): N+P2O
5+K
2O+Zn = 170+55+42+6.5
Ric
e yi
elds
, kg/
ha
Model greenhouse experiments show variations in growing between + and – treatments (sorghum as indicator plant).

Better C
rops – India / 2007
21
field experiments conducted on sugarcane (Balaji et al., 2005). All five nutrients are needed to obtain good cane yields of up to 126 t/ha with the applications of N, P
2O
5, K
2O, Zn, and Fe
at the rates of 310, 160, 250, 31, and 72 kg/ha, respectively (Figure 4). Previous data collected from multi-locations with variable rates were used as the basis for N and sorption curves developed based on added levels of nutrients vs. levels ex-tracted for the other nutrients. The doses were calculated to bring a desired level of each nutrient decided optimum for crop growth. Four levels each of N, P, and K in selected com-binations along with two levels each for Fe and Zn were tested with three replications in randomized block design (complete data not shown here). This is a usual protocol established for selecting treatments and conducting field experiments to fine tune optimum nutrient doses.
For the Vellayani series, results were unusual since sorp-tion and greenhouse values were not significantly affected by P addition. However, addition of N, K, Ca, and Mg were considered crucial for obtaining good yields in those series (Figure 5). Since Mg is not a common nutrient considered under banana production, the investigator was interested in establishing the Mg needs of the crop. The corresponding field experiments found that a nutrient application of 180-240-380-120 kg N-K
2O-Ca-Mg/ha resulted in optimum productivity
(Prakashmany, 2002), a significantly higher response compared to the yield result from addition of N, K, and Ca (Figure 6).
ConclusionDeveloping an inventory of soil fertility information at the
soil series level using the SA has proven useful. Information obtained from sorption and greenhouse studies have predicted fairly well nutrient requirements, which were ultimately con-firmed through field studies. Fertility information at the soil series level could in most cases where past farmer management was relatively similar, be safely extrapolated to large areas, providing information which is applicable to a wide range of crops and cropping systems, and saving time and costs within soil fertility evaluation programs. BC-INDIA
Dr. Rao is IPNI India Programme Deputy Director (South Zone). Dr. Murugappan is former Director, Soil and Crop Management Studies, Tamil Nadu Agricultural University (TNAU). Dr. Malarvizhi is Profes-sor, Soil Science, TNAU. Dr. Latha is Research Associate, TNAU. Dr. Balaji is with Agricultural College and Research Institute, Madurai. Dr. Prakashmany is with Agricultural College, Vallayani, Kerala Agricultural University.
ReferencesBalaji, T., et al. 2006. Indian Sugar, 56(5): 43-50.
Hunter, A. 1980. Agro Services International, Inc., Orange City, Florida, USA.
Murugappan, V., et al. 2001. Final Report, PPIC supported research project,
Tamil Nadu Agricultural University, Coimbatore.
Prakashmany, N. 2002. M.Sc.(Ag.) Thesis, Dept. of Soil Science & Agril. Chem-
istry, COA, Vellayani, Kerala Agril. University.
Portch, S. and A. Hunter. 2002. Special Publication No. 5, PPI/PPIC China
Program. pp. 1-62.
Figure 5. Results of greenhouse studies used to identify most limiting nutrients for banana prior to field experiments (Vellayani Series, Kerala).
Figure 3. Results of greenhouse studies used to identify most limit-ing nutrients for sugarcane prior to field experiments (Palaviduthi Series, Tamil Nadu).
100
62 6678
103 10494
8091 95
106 104
84
0
20
40
60
80
100
120
OPTIMUM
- N - P - K + Ca+ M
g + S - Fe
+ B+ Cu
+ Mn
+ Mo
- Zn
Nutrient applications
Rel
ativ
e yi
eld,
%
100
6
111
20
55
74
10494
108116
97 93105
0
20
40
60
80
100
120
140
OPTIMUM - N + P - K - C
a- M
g - S + Fe - B + Cu+ M
n - M
o+ Zn
Nutrient applications
Rel
ativ
e yi
eld,
%
Figure 6. Results of field studies establishing nutrient needs for banana (Vellayani Series, Kerala).
Figure 4. Results of field studies establishing nutrient needs for sugarcane (Palaviduthi Series, Tamil Nadu).
101.2104.2
90.887.685.6
125.5
0
20
40
60
80
100
120
140
Optimum Opt -N Opt -P Opt -K Opt -Zn Opt -Fe
Optimum dose (kg/ha): N+P2O
5+K
2O+Zn+Fe = 310+160+250+31+72
Can
e yi
eld,
t/h
a
0
1
2
3
4
5
6
7
8
N K Ca N K Ca + Mg K Ca - N K Ca - K N K - Ca
Nutrient dose: N+K2O+Ca+Mg = 180-240-380-120 kg/ha
Wei
ght
of b
anan
a fi
nger
s, k
g
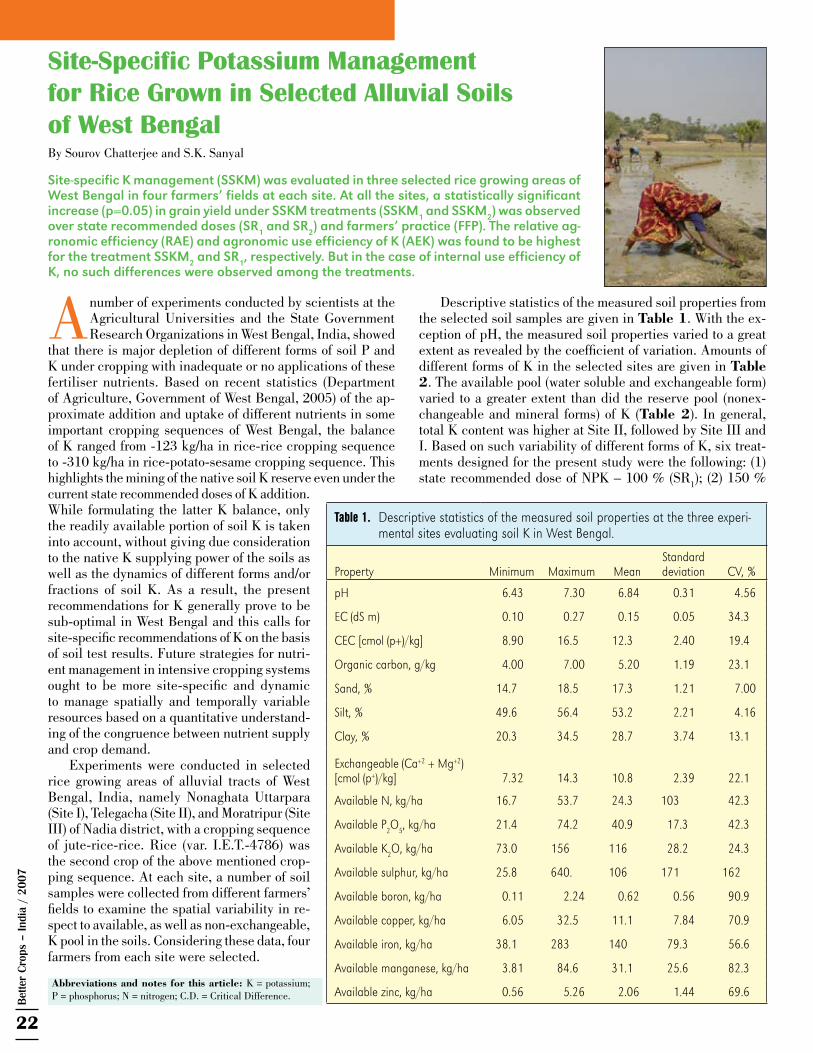
22
Bet
ter
Cro
ps –
Ind
ia /
200
7
Abbreviations and notes for this article: K = potassium; P = phosphorus; N = nitrogen; C.D. = Critical Difference.
A number of experiments conducted by scientists at the Agricultural Universities and the State Government Research Organizations in West Bengal, India, showed
that there is major depletion of different forms of soil P and K under cropping with inadequate or no applications of these fertiliser nutrients. Based on recent statistics (Department of Agriculture, Government of West Bengal, 2005) of the ap-proximate addition and uptake of different nutrients in some important cropping sequences of West Bengal, the balance of K ranged from -123 kg/ha in rice-rice cropping sequence to -310 kg/ha in rice-potato-sesame cropping sequence. This highlights the mining of the native soil K reserve even under the current state recommended doses of K addition. While formulating the latter K balance, only the readily available portion of soil K is taken into account, without giving due consideration to the native K supplying power of the soils as well as the dynamics of different forms and/or fractions of soil K. As a result, the present recommendations for K generally prove to be sub-optimal in West Bengal and this calls for site-specific recommendations of K on the basis of soil test results. Future strategies for nutri-ent management in intensive cropping systems ought to be more site-specific and dynamic to manage spatially and temporally variable resources based on a quantitative understand-ing of the congruence between nutrient supply and crop demand.
Experiments were conducted in selected rice growing areas of alluvial tracts of West Bengal, India, namely Nonaghata Uttarpara (Site I), Telegacha (Site II), and Moratripur (Site III) of Nadia district, with a cropping sequence of jute-rice-rice. Rice (var. I.E.T.-4786) was the second crop of the above mentioned crop-ping sequence. At each site, a number of soil samples were collected from different farmers’ fields to examine the spatial variability in re-spect to available, as well as non-exchangeable, K pool in the soils. Considering these data, four farmers from each site were selected.
Descriptive statistics of the measured soil properties from the selected soil samples are given in Table 1. With the ex-ception of pH, the measured soil properties varied to a great extent as revealed by the coefficient of variation. Amounts of different forms of K in the selected sites are given in Table 2. The available pool (water soluble and exchangeable form) varied to a greater extent than did the reserve pool (nonex-changeable and mineral forms) of K (Table 2). In general, total K content was higher at Site II, followed by Site III and I. Based on such variability of different forms of K, six treat-ments designed for the present study were the following: (1) state recommended dose of NPK – 100 % (SR
1); (2) 150 %
Site-Specific Potassium Management for Rice Grown in Selected Alluvial Soils of West BengalBy Sourov Chatterjee and S.K. Sanyal
Site-specific K management (SSKM) was evaluated in three selected rice growing areas of West Bengal in four farmers’ fields at each site. At all the sites, a statistically significant increase (p=0.05) in grain yield under SSKM treatments (SSKM
1 and SSKM
2) was observed
over state recommended doses (SR1 and SR
2) and farmers’ practice (FFP). The relative ag-
ronomic efficiency (RAE) and agronomic use efficiency of K (AEK) was found to be highest for the treatment SSKM
2 and SR
1, respectively. But in the case of internal use efficiency of
K, no such differences were observed among the treatments.
Table 1. Descriptivestatisticsofthemeasuredsoilpropertiesatthethreeexperi-mentalsitesevaluatingsoilKinWestBengal.
Property Minimum Maximum MeanStandarddeviation CV,%
pH 6.43 7.30 6.84 0.31 4.56
EC(dSm) 0.10 0.27 0.15 0.05 34.3
CEC[cmol(p+)/kg] 8.90 16.5 12.3 2.40 19.4
Organiccarbon,g/kg 4.00 7.00 5.20 1.19 23.1
Sand,% 14.7 18.5 17.3 1.21 7.00
Silt,% 49.6 56.4 53.2 2.21 4.16
Clay,% 20.3 34.5 28.7 3.74 13.1
Exchangeable(Ca+2+Mg+2)[cmol(p+)/kg] 7.32 14.3 10.8 2.39 22.1
AvailableN,kg/ha 16.7 53.7 24.3 103 42.3
AvailableP2O5,kg/ha 21.4 74.2 40.9 17.3 42.3
AvailableK2O,kg/ha 73.0 156 116 28.2 24.3
Availablesulphur,kg/ha 25.8 640. 106 171 162
Availableboron,kg/ha 0.11 2.24 0.62 0.56 90.9
Availablecopper,kg/ha 6.05 32.5 11.1 7.84 70.9
Availableiron,kg/ha 38.1 283 140 79.3 56.6
Availablemanganese,kg/ha 3.81 84.6 31.1 25.6 82.3
Availablezinc,kg/ha 0.56 5.26 2.06 1.44 69.6

Better C
rops – India / 2007
23
(SR2); (3) site-specific K management doses – 100% (SSKM
1);
(4) 150% of SSKM (SSKM2); (5) farmers’ fertiliser practice
(FFP); and (6) farmers’ fertiliser practice with K adjustment to state recommended doses (FFP
K). In SSKM treatments,
N and P were applied based on the soil testing and K was applied by computing a factor with respect to available and nonexchangeable pools of K to maintain the balance between K mining and a productivity target. The full quantities of P and K were applied at transplanting, while N was applied in splits between transplanting and 45 days after transplanting. Recommended cultural and plant protection measures were used throughout the experiment.
Mean grain yield of rice at each site under early treatment is given in Table 3. At all the sites, a statistically significant increase (p=0.05) in grain yield under site-specific K manage-ment treatment (SSKM
1) was observed over the state recom-
mended doses (SR1) (Table 3). Interestingly, there were also
significant yield differences between SR2 and SSKM
1 treat-
ment, which implies that even a 50% increment in the state recommendation was not sufficient to reach the level of yield achieved by the SSKM
1 treatment (Table 3). While the highest
average grain yield of the three sites (3.47 t/ha) was observed in the case of SSKM
2, the lowest was recorded under FFPs
(2.26 t/ha). There was also statistically significant response observed when farmers’ practice doses were adjusted upwards with respect to K to FFP
K (the average grain yield being 2.43
t/ha), which indicates that farmer practice doses for K were
Table 2. DistributionofdifferentformsofKininitialsoilsamplesfromthe0to20cmdepth.
Soils
FormsofK,cmol(p+)/kg
WSK1 EXK2 NEK3 MineralK4 TotalK
SiteI
F1 0.03 0.09 5.07 38.4 43.6
F2 0.03 0.05 3.83 33.5 37.4
F3 0.04 0.06 5.84 43.8 49.7
F4 0.05 0.12 4.36 37.8 42.2
SiteII
F5 0.03 0.14 5.32 44.6 50.0
F6 0.04 0.09 6.17 47.3 53.6
F7 0.02 0.06 4.53 42.7 47.4
F8 0.03 0.08 3.83 39.4 43.4
SiteIII
F9 0.04 0.12 5.17 43.5 48.8
F10 0.03 0.09 4.25 36.8 41.2
F11 0.04 0.08 6.07 47.6 53.8
F12 0.03 0.11 3.96 37.4 41.5
Min 0.02 0.05 3.83 33.50 37.40
Max 0.05 0.14 6.17 47.60 53.80
Min 0.03 0.091 4.89 41.00 45.50
S.D. 0.001 0.027 0.86 4.47 5.24
CV% 23.13 30.03 17.62 10.89 11.39
1WSK,2EXK,3NEKarethewatersoluble,exchangeable,andnonex-changeableformsofK,respectively.4Estimatedbysubtractingthesumofwatersoluble,exchangeable,andnonexchangeableKfromtotalKcontents.F1–F12denotethe12farmers’fieldsofthethreesites.
S1 S2 S3Treatments
0
100
200
300
400
500
RA
E, %
SR1
SR2 SSKM
2SSKM
1FFP
K
Figure 1. RelativeAgronomicEfficiency(RAE)ofriceasinfluencedbydifferentfertilisation.
0
4
8
12
16
S1 S2 S3
Treatments
AEK
, kg
grai
n/kg
K fe
rtili
zer
SR1
SR2 SSKM
2SSKM
1FFP
K
Figure 2. AgronomicUseEfficiencyofK(AEK)ofriceasinfluencedbydifferentfertilisation.
Figure 3. InternaluseefficiencyofK(IEK)ofriceasinfluencedbydifferentfertilisation.
0
5
10
15
20
25
S1 S2 S3
Treatments
IEK
, kg
grai
n yi
eld/
kg K
2O u
ptak
e
SR1
SR2 SSKM
2SSKM
1FFP
KFFP

24
Bet
ter
Cro
ps –
Ind
ia /
200
7
Table 3. Responseofsite-specificbalancedfertilisationonricecropattheexperimentalsitesinWestBengal.
Site Treatment
Meangrainyield,t/ha
MeanKuptake,kgK2O/ha Meanresidualcrop
availableK,kgK2O/hainsoilGrain Straw Grain Straw
SiteI
SR1 3.09 3.79 15.0 136 98.5
SR2 3.28 4.04 16.7 149 116
SSKM1 3.65 4.57 20.8 175 143
SSKM2 4.03 5.02 23.6 189 160
FFP 2.23 3.24 12.4 91.5 94.0
FFPK 2.39 3.65 13.4 107 96.8
S.E.m(±) 0.030 0.129 0.581 3.05 3.78
C.D.(p=0.05) 0.087 0.375 1.68 8.83 10.95
SiteII
SR1 3.34 4.11 16.3 138 109
SR2 3.54 4.39 17.5 147 129
SSKM1 3.86 4.86 21.3 173 142
SSKM2 4.16 5.08 22.6 186 159
FFP 2.38 3.38 13.3 94 100
FFPK 2.59 3.55 14.3 106 106
S.E.m(±) 0.041 0.038 0.460 1.82 5.05
C.D.(p=0.05) 0.122 0.111 1.33 5.29 14.64
SiteIII
SR1 2.51 3.42 12.7 111 124
SR2 2.63 3.57 13.5 118 140
SSKM1 2.89 3.73 15.1 129 164
SSKM2 3.23 3.93 17.8 139 180
FFP 2.18 3.28 11.1 83.3 117
FFPK 2.31 3.36 11.8 91.5 122
S.E.m(±) 0.072 0.073 0.472 2.41 1.48
C.D.(p=0.05) 0.209 0.210 1.37 6.98 4.29
sub-optimal (Table 3). The highest grain yield of 4.16 t/ha was recorded at Site II in treatment SSKM
2, whereas FFP produced
the lowest grain yield of 2.18 t/ha at Site-III (Table 3). Straw yields showed a similar response to treatment with a little less prominent change compared to grain yield.
The K uptake by rice straw and grain was also significantly influenced by fertiliser treatment (Table 3). The K uptake by rice straw was 3 to 8 times higher than that by rice grain at each site for the sown variety (IET-4786). This was much more than one would expect from the relative yields of such rice straw and grain, due obviously to preferential utilization of K in the build-up of mechanical tissues of the crop.
Potassium uptake was significantly greater in SSKM
1 and SSKM
2 than in
SSR1 and SR
2. The lowest K
uptake was recorded under the FFP
treatment, but a sig-
nificant increase in K uptake was found under the FFP
K
treatment. At site I and II, K uptake was at par, whereas at Site III, the yield suffered due to flash flooding which caused a reduction of yield, and thereby K uptake.
Data presented in Table 3 revealed that the build-up of the plant-available soil K pool at harvest of rice was significantly influenced by different levels of K appli-cation. The plant-available residual soil K was found to be higher at Site III than that at the other sites (Table 3). In general, the residual K status was higher in site-specific K management doses as compared to the farmers’ practice as well as the state recommended doses. The K-adjusted treatment FFP
K also
showed appreciable build-up of soil K (even in some cases at par with the state recom-mendation) as compared to FFP treatment.
The relative agronomic efficiency (RAE) values were calculated using the SR
1
treatments as the standard and the FFP as the control. Data for both crops at the three experimental sites is presented in Figure 1. The RAE values under SSKM
2
were highest (much in excess of 100%) at each site, while FFP
K exhibited the lowest
value. The RAE for SR2 was 30% higher than that in SR
1, while
RAE under SSKM2 was 74% higher than SSKM
1.
The agronomic use efficiency for K fertilizer (AEK) was found to be higher on average in treatment SR
1 and SSKM
1
(the averages being 10.3 and 9.24 kg grain/kg K fertiliser, respectively). These data suggest that (except for the FFP
K
treatment) with the increase of K rates, the imbalance of N and P against K may restrict agronomic use efficiency of K at the higher doses of application, namely SR
2 and SSKM
2.
Among the three sites, Site III showed comparatively higher AE
K values for the given rice crop (Figure 2). Despite slightly higher internal use efficiency (IE
K)

Better C
rops – India / 2007
25
for applied K (22.3 kg grain yield/kg K2O uptake) associ-
ated with farmers’ practice, there were no differences among treatments (Figure 3). This suggests that the sown variety of rice used K fertilizer with equal efficiency regardless of treatment. BC-INDIA
Shri Chatterjee is a Doctoral Fellow, Department of Agricultural Chemistry and Soil Science, B.C.K.V, West Bengal, India. Prof. Sanyal (e-mail: [email protected], [email protected]) is the Director of Research of Bidhan Chandra Krishi Viswavidyalaya (B.C.K.V), West Bengal, India.
AcknowledgmentThe authors thank the IPNI India Programme for support-
ing this study.
ReferenceDepartment of Agriculture, Government of West Bengal. 2005. Soil test based
fertilizer recommendations for principal crops and cropping sequences in
West Bengal.
While the classic symptoms of crop nutrient deficiencies are not as common in fields as they were in the past, they do still occur. To encourage field observation and increase understanding of crop nutrient deficiencies and other conditions, the International
Plant Nutrition Institute (IPNI) is sponsoring a photo contest during 2008.“We hope this competition will appeal to practitioners working in actual production fields,”
said IPNI President Dr. Terry Roberts. “Researchers working under controlled plot conditions are also welcome to submit entries. We encourage crop advisers, and others to photograph and document deficiencies in crops.”
Some specific supporting information is required for all entries, including:• The entrant’s name, affiliation, and contact information.• The crop and growth stage, location, and date of the photo.• Supporting and verification information related to plant tissue analysis, soil test, manage-
ment factors, and additional details that may be related to the deficiency.There are four categories in the competition: Nitrogen (N), Phosphorus (P), Potassium (K),
and Other. Entries are limited to one per category (one individual could have an entry in each of four categories). Cash prize awards are offered in each of the four categories as follows:
• First place = US$150• Second place = US$75• Third place = US$50
Photos and supporting information can be submitted until the end of calendar year 2008 (December 31, 2008) and winners will be announced in January of 2009. Winners will be noti-fied and results will be posted at the website.
Entries are encouraged from all regions of the world. However, entries can only be submit-ted electronically as high resolution digital files to the organization’s website, at >www.ipni.net/photocontest<.
For questions or additional information, please contact:
Mr. Gavin Sulewski, IPNIAgronomic and Technical Support Specialist102-411 Downey road Phone: 306-652-3535Saskatoon, SK S7N 4L8 Canada E-mail: [email protected]
Shown at right are some photos as examples of deficiency symptoms. BC-INDIA
IPNI Crop Nutrient Deficiency Photo Contest—2008
Nitrogendeficiencyincorn.
Phosphorusdeficiencyincotton.
Potassiumdeficiencyinsoybeans.
Sulphurdeficiencyincanola.

26
Bet
ter
Cro
ps –
Ind
ia /
200
7
Abbreviations and notes for this article: DRIS = Diagnosis and Recommendation Integrated System; SSNM = site-specific nutrient management; N = nitrogen; P = phosphorus; K = potassium; Ca = calcium; Mg = magnesium; S = sulphur; Fe = iron; Mn = manganese; Cu = copper; Zn = zinc; C = carbon; B = boron; Mo = molybdenum; TSS = total soluble solids.
In India, citrus research to date has had little success in identifying cultivar-specific soil or plant nutrient diagnostics
which can detect and monitor untimely declines in orchard longevity and productiv-ity. Various diagnostic techniques – such as visual symptoms, leaf analysis, and soil testing – hold great importance in defining SSNM techniques that can be integrated into improved citrus fertilisation programs. Leaf nutrient standards developed in a number of countries (U.S.A., Brazil, Australia, etc.) and applied under Indian conditions have yet to provide a precise means to streamline citrus nutritional problems. This could be related to differences in cultivar nutrient requirement, growth habit, existing cultural practices, soil type variation, climate, and yield levels.
The absence of suitable diagnostic refer-ences has resulted in misinterpretation and diagnosis of nutritional problems within citrus orchards, improper fertilisation schedules, and reduced orchard productivity. Thus, ex-isting diagnostics are failing to identify the real problems for commercial Indian citrus cultivars and are proving ineffective. This article highlights recent experiences in India to develop suitable diagnostic tools as part of more meaningful decision support systems.
Deficiency SymptomsThe development of visible symptoms is
attributed to metabolic disorders which cause changes in micro-morphology of plants before the characteristic deficiency is identifiable. The way in which the symptoms develop and manifest on leaves or fruits gives a reliable indication of the cause of the nutritional dis-orders. Both deficiency and excess of nutrients can lead to reduced crop yield with inferior fruit quality. To view images of various nutri-ent conditions in citrus, visit the website at: www.ipni.net/india/citrus.
Diagnostic Tools for Citrus: Their Use and Implications in IndiaBy A.K. Srivastava, Shyam Singh, and K.N. Tiwari
Constraint-based fertiliser scheduling is best achieved through using leaf nutrient DRIS indices supported by soil analysis and characteristic symptoms of nutrient deficiencies. A survey of citrus sites found multiple nutrient deficiencies – the most common being N, P, K, Mn, and Zn. Variations in soil types play an important role in regulating both production and quality. SSNM proved effective in achieving for high quality citrus production.
Table 1. Leaf nutrient indices for different commercial citrus cultivars of India.
IndicesDeficient Low Optimum High Excess
‘Nagpur’ Mandarin (Citrus reticulata Blanco)
N, % < 1.1 1.1 - 1.7 1.7 - 2.8 2.8 - 3.4 > 3.4P, % < 0.06 0.06 - 0.08 0.08 - 0.15 0.15 - 0.19 > 0.19K, % < 0.22 0.22 - 1.01 1.01 - 2.59 2.59 - 3.38 > 3.38Ca, % < 1.1 1.1 - 1.79 1.79 - 3.28 3.28 - 4.02 > 4.02Mg, % < 0.31 0.31 - 0.42 0.42 - 0.92 0.92 - 1.38 > 1.38Fe, ppm < 55 55 - 75 75 - 113 113 - 133 > 133Mn, ppm < 40 40 - 55 55 - 85 85 - 99 > 99Cu, ppm < 5.9 5.9 - 9.7 9.8 - 18 18 - 22 > 22Zn, ppm < 5.5 5.5 – 14 14 - 30 30 - 38 > 38Yield, kg/tree < 13 13 - 48 48 - 117 117 - 152 > 152
‘Mosambi’ Sweet orange (Citrus sinensis Osbeck)
N, % < 1.28 1.28 - 1.97 1.97 - 2.57 2.57 - 2.68 > 2.68P, % < 0.05 0.05 - 0.09 0.09 - 0.17 0.17 - 0.21 > 0.21K, % < 1.12 1.12 - 1.32 1.32 - 1.72 1.72 - 1.92 > 1.92Ca, % < 1.09 1.09 - 1.72 1.72 - 2.98 2.98 - 3.62 > 3.62Mg, % < 0.13 0.13 - 0.31 0.31 - 0.69 0.69 - 0.87 > 0.87Fe, mg/kg < 26 26 - 69 69 - 137 137 - 200 > 200Mn, mg/kg < 30 30 - 42 42 - 87 87 - 160 > 160Cu, mg/kg < 2.0 2.0 - 6.5 6.5 - 16 16 - 20 > 20Zn, mg/kg < 9.0 9.0 - 12 12 - 29 29 - 37 > 37B, mg/kg < 7.8 7.8 - 13 13 - 23 23 - 44 > 44Mo, mg/kg < 0.3 0.3 - 0.4 0.4 - 1.1 1.1 - 1.5 > 1.5Yield, kg/tree < 46 46 - 76 76 - 138 138 - 168 > 168
‘Khasi’ Mandarin (Citrus reticulata Blanco)
N, % < 1.67 1.67 - 1.96 1.96 - 2.56 2.56 - 2.85 > 2.85P, % < 0.06 0.06 - 0.08 0.08 - 0.10 0.10 - 0.13 > 0.13K, % < 0.52 0.52 - 0.98 0.98 - 1.93 1.93 - 2.40 > 2.40Ca, % < 1.72 1.72 - 1.96 1.96 - 2.49 2.49 - 2.75 > 2.75Mg, % < 0.14 0.14 - 0.23 0.23 - 0.48 0.48 - 0.54 > 0.54Fe, mg/kg < 23 23 - 84 84 - 249 249 - 331 > 331Mn, mg/kg < 19 19 - 42 42 - 88 88 - 111 > 111Cu, mg/kg < 1.8 1.8 - 2.1 2.1 - 14 14 - 21 > 21Zn, mg/kg < 11 11 - 16 16 - 27 27 - 32 > 32B, mg/kg < 7.8 7.8 - 13 13 - 23 23 - 44 > 44Mo, mg/kg < 0.3 0.3 - 0.4 0.4 - 1.1 1.1 - 1.5 > 1.5Yield, kg/tree < 19 19 - 32 32 - 56 56 - 69 > 69

Better C
rops – India / 2007
27
Meghalaya, and Assam; and in west-central India, seven sites within the Chindwara District of Madhya Pradesh, plus 79 sites within Nagpur, Amravati, Aurangabad, Jalna, Parbhani, and Nanded of Maharashtra (Figure 1). The most important orchard selection criterion was orchard age within peak pro-duction efficiency. This varied from 15 to 25 years for ‘Khasi’ mandarin sites in northeast India to 12 to 20 years for ‘Nagpur’ mandarin sites in central India. The orchards were further selected to represent low, optimum, and high performance orchards within the representative physiographic positions of both citrus regions.
The climate in northeast India (mostly humid in nature) is characterised by a mean annual rainfall of 180 cm with mean summer and winter temperature varying from 25 to 33 ºC and 10 to 25 ºC, respectively. Central India has a hot, sub-humid tropical climate, characterised by hot and dry pre-monsoon summer months (March to May), followed by the well-expressed monsoon months of June to September. Mean summer and winter temperatures vary from 35 to 45 ºC and 15 to 22 ºC, respectively. Mean annual rainfall is 900 mm, of which 80 to 90% is received during the monsoon months. The soils of the northeast sites belong to the Alfisol and Ultisol orders and soils in the west-central region are mainly Vertisols.
The DRIS model was used for determining leaf nutrient norms. Results found a large variation in leaf nutrient standard values depending upon the type of cultivar (Table 1).
Examples of most suitable sampling of index leaves were observed at 6 to 8 months of leaf age during the Ambia flush (February bloom) on Typic Haplustert soils (deep black soil), and 5 to 7 months during the Mrig flush (July bloom) on Typic Ustochrept soils (shallow red soil). An appraisal of nutrient composition of 6 to 8-month-old leaves collected at the 2nd, 3rd, and 4th leaf positions on a shoot found no significant varia-tion in the concentration of N, P, K, Ca, Mg, S, Fe, Mn, Cu, and Zn. Thus, all the leaf positions were equally effective as indexes for determination of the nutrient status of tree. Gener-ally, leaves from fruiting terminals had lower N, P, K, Zn, Cu, Mn, Fe, and B, but higher Ca and Mg than those sampled from non-fruiting terminals. The basis for sampling of leaves from non-fruiting terminals is that such shoots are more numerous,
can be sampled easily, and are less subject to stress from fruit produc-tion. These non-fruiting shoots are also likely to bear fruits in the follow-ing year so their nutrient composition is of more immediate interest.
Many studies across the world have recom-mended appropriate leaf sample size as low as 40 leaves and as high as 100 leaves. This study’s lack of variation in leaf macro- and micronutrient status while using a leaf sample size varying from 30 to 70 leaves covering
Leaf Analysis Leaf analysis integrates the effect of orchard soil and
climate, and can be used with great advantage within a citrus fertilisation program. The development of leaf sampling tech-nique is a pre-requisite to a reliable leaf nutrient standard. The accuracy of foliar analysis depends on proper attention to standardising leaf age under a given set of growing conditions, position of leaves on the terminal shoot, type of terminal shoot, and time of leaf sampling.
Leaf nutrient norms for different citrus cultivars are de-veloped through a combination of surveys, modeling, field response studies, and adoption of techniques and schedules implemented by elite orchards. This study employed a survey during 2002-05 of 11 citrus orchard-growing states including 55 sites in the north-eastern states of West Bengal, Sikkim, Arunachal Pradesh, Tripura, Mizoram, Nagaland, Manipur,
Table 2. Leaf nutrient constraints in citrus orchards of India.
NagpurMandarin
Nutrients found deficient and low (n = 27)
Nutrients found high and excess(n = 30)
Yield, kg/tree
Zn P N Fe Cu Mn Mg K Ca
Conc., mg/kg1 9.2 0.06 1.56 68.3 19.2 91.6 0.92 2.62 3.34 32DRIS indices -166 -60 -28 -20 16 42 55 63 98MosambiSweet orange
Nutrients found deficient and low (n = 32)
Nutrients found high and excess(n = 28)
Yield, kg/tree
N Zn K P Mg B Ca Mo Fe CuConc., mg/kg1 1.28 9.1 1.14 0.08 0.70 28.2 3.01 1.1 138.1 18.1 39DRIS indices -185 -111 -82 -58 38 40 48 74 92 144KhasiMandarin
Nutrients found deficient and low(n = 68)
Nutrients found high and excess (n = 40)
Yield, kg/tree
Zn P Ca N Mg Cu K Mn FeConc., mg/kg1 10.5 0.06 1.66 1.60 0.18 1.9 — — — 22
DRIS indices -201 -101 -91 -86 -78 -42 104 219 2761Values of N, P, K, Ca, and Mg are given in %.
Figure 1. Citrus belts in India (shaded portion shows the areas of investigation).

28
Bet
ter
Cro
ps –
Ind
ia /
200
7
deficiencies for N, Zn, K, and P. The Khasi mandarin orchards had significant deficiencies for Zn, P, Ca, N, Mg, and Cu.
Soil AnalysisSoil analysis-based guidelines for this
study were comprised of skirt belt sampling, or sampling at 0 to 15 cm depth around the tree perimeter (Table 3). The soil test method is based on the assumptions that roots would extract nutrients from the soil in a manner com-parable to chemical soil extractants, and that there is a simple, direct relationship between the extractable concentration of nutrients in the soil and uptake by plants. Often, the analysis has to be significantly modified in relation to soil type, particularly for calcareous and non-calcareous soils, and recommendations require adjustment in relation to a targeted yield.
Comparative DRIS analysis of soil data determined a much wider range of index values among the different commercial citrus cultivars (Table 4). DRIS-based analysis of soil fertility data from Nagpur mandarin found deficiencies for N, organic C, Zn, P, Fe, and K. Thus, if the first limiting factor was met by adequate soil amendment with organic manures, the remaining deficiencies could be addressed with fertiliser. In sweet orange, shortages were noted for organic C, N, Zn, P, Mn, and K. In Khasi mandarin, orchards were deficient in P, Ca, N, Mg, and Zn.
Implications for Fruit QualityPast studies have shown that quality of
citrus fruit is governed by the nature and properties of soil. This relationship was veri-fied in this study which found quite different fruit quality characteristics between the two dominant orchard soil types. Fruits from red soil types, especially those located at higher elevations, had characteristically tighter skins and better TSS levels than fruits harvested from orchards under deeper, black soil types. Data from Nagpur mandarin sites invariably showed better fruit quality characters, with the exception of fruit size, within red clay loam orchards compared to those from deeper
black clay orchards (Table 5). This can be primarily related to differences in available water capacity and nutrient avail-ability, particularly K. Water soluble K (24 to 53 mg/kg) and exchangeable K (188 to 291 mg/kg) were much higher in black soils than in red soils (i.e., water soluble K:3 to 13 mg/kg and exchangeable K:82 to 268 mg/kg) – the reverse being true for non-exchangeable K.
Higher availability of K coupled and good water holding capacity in black soils does provide for better hydration ca-pacity of fruits, which is relatively weak in red soil sites and is a common reason for sub-optimum fruit size and a major limitation for Nagpur mandarin orchards located on red soils. Higher availability of K in black soils also induces higher fruit
Table 3. Soil fertility standards for different commercial citrus cultivars of India.
IndicesDeficient Low Optimum High Excess
Nagpur Mandarin (Citrus reticulata Blanco)
Organic C, g/kg < 2.6 2.6 - 3.8 3.8 - 6.2 6.2 - 7.4 > 7.4N, mg/kg < 65 65 - 95 95 - 155 155 - 185 > 185P, mg/kg < 4.8 4.8 - 6.5 6.5 - 16 16 - 21 > 21K, mg/kg < 64 64 - 147 147 - 312 312 -395 > 395Ca, mg/kg < 306 306 - 408 408 - 616 616 - 718 > 718Mg, mg/kg < 43 43 - 85 85 - 163 163 - 203 > 203Fe, mg/kg < 4.6 4.6 -11 11 - 25 25 - 41 > 41Mn, mg/kg < 4.7 4.7 - 7.4 7.5 - 23 23 - 31 > 31Cu, mg/kg < 1.1 1.1 - 2.4 2.4 - 5.1 5.1 - 6.5 > 6.5Zn, mg/kg < 0.3 0.3 - 0.6 0.6 -1.3 1.3 -1.7 > 1.7Yield, kg/tree < 13 13 - 48 48 - 117 117 - 152 > 152
Mosambi Sweet Orange (Citrus sinensis Osbeck)
Organic C, g/kg < 3.0 3.0 - 4.9 4.9 - 6.9 7.0 - 8.2 > 8.2N, mg/kg < 62 62 - 107 107 - 197 197 - 242 > 242P, mg/kg < 4.9 4.9 - 8.5 8.5 - 16 16 - 20 > 20K, mg/kg < 85 85 - 186 186 - 389 389 - 491 > 491Fe, mg/kg < 1.6 1.6 - 4.7 4.7 - 17 17 - 24 > 24Mn, mg/kg < 3.7 3.7 - 7.6 7.6 - 16 16 - 20 > 20Cu, mg/kg < 0.3 0.3 - 1.8 1.8 - 4.7 4.7 - 6.2 > 6.2Zn, mg/kg < 0.1 0.1 - 0.4 0.4 - 1.0 1.0 - 1.3 > 1.3B, mg/kg < 0.2 0.2 - 0.3 0.3 - 0.6 0.6 - 0.7 > 0.7Mo, mg/kg < 0.05 0.05 - 0.1 0.1 - 0.16 0.17 - 0.19 > 0.2Yield, kg/tree < 46 46 - 76 77 - 138 138 - 168 >168
Khasi Mandarin (Citrus reticulata Blanco)
Organic C, g/kg < 8.6 8.6 - 15.6 15.6 - 32.5 32.5 - 50.2 > 50.2N, mg/kg < 82 82 - 161 161 - 419 419 - 548 > 548P, mg/kg < 2.3 2.3 - 4.4 4.5 - 8.7 8.8 - 11 > 11K, mg/kg < 20 20 - 82 82 - 288 288 - 390 > 390Ca, mg/kg < 80 80 - 149 149 - 285 285 - 354 > 354Mg, mg/kg < 4.7 4.7 - 31 31 - 84 84 - 111 > 111Fe, mg/kg < 31 31 - 39 39 - 181 181 - 252 > 252Mn, mg/kg < 8.9 8.9 - 27 27 - 80 80 - 116 > 116Cu, mg/kg < 0.5 0.5 - 0.7 0.7 - 2.9 2.9 - 4.1 > 4.1Zn, mg/kg < 2.2 2.2 - 2.8 2.8 - 5.1 5.1 - 8.7 > 8.7Yield, kg/tree < 19 19 - 31 31 - 56 56 - 69 > 69
2 to 10% of tree area validates the minimum in both cases, as an effective protocol for foliar analysis.
Data on proper height of sampling is also rather conflicting. However, the authors found that most positional effects can be avoided by ensuring that leaves are collected from around the entire periphery of the tree.
Multiple nutrient deficiencies were common to all orchards surveyed. Example plant sample data for Nagpur mandarin orchards found Zn, P, N, and Fe deficiencies (Table 2). Higher negative DRIS indices provide an indication of the proportion-ate scale of nutrient deficiency. Alternatively, a large positive index would be indicative of above optimal nutrient concentra-tions. Data from the group of sweet orange orchards indicated

Better C
rops – India / 2007
29
Table 4. Soil fertility constraints in citrus orchards of India.
Nagpur Mandarin Nutrients found deficient and low (n = 27) Nutrients found high and excess (n = 30) Yield,
kg/tree
Organic C Zn P Fe K Mg Ca Cu pH Mn
Conc., mg/kg1 3.2 0.31 5.0 4.8 143 172 678 5.8 7.9 22.8 32
DRIS indices -116 -104 -98 -92 -52 61 72 81 108 155
Mosambi Sweet Orange Nutrients found deficient and low (n = 32) Nutrients found high and excess (n = 28) Yield,
kg/tree
Organic C N Zn P Mn K Fe Cu Mo B
Conc., mg/kg1 4.1 106.8 0.38 7.8 6.2 183 22.8 5.8 0.19 0.60 39
DRIS indices -181 -106 -90 -72 -51 -21 61 89 162 209
Khasi Mandarin Nutrients found deficient and low (n = 68) Nutrients found high and excess (n = 40) Yield, kg/tree
P Ca N Mg Zn Org. C K Cu Mn Fe
Conc., mg/kg1 3.1 78 152 4.7 2.1 38.6 289 0.9 91 249 22
DRIS indices -110 -82 -78 -58 -49 58 62 70 78 1091Values of N, P, K, Ca, and Mg are given in % and Org. C in g/kg.
Table 5. Comparison of quality of Nagpur mandarin grown in two soil types (red versus black soil).
Fruit quality parameters, %Juice TSS Acidity
Red soil 43.2 10.8 0.64Black soil 42.4 9.2 0.78LSD (p = 0.05) 0.6 0.4 0.08
Table 6. SSNM fertiliser rates meeting targeted orchard productivity.
Fruit yield, t/ha
SSNM application rate, g/tree
N P K ZnSO4 B (borax) FeSO4 MnSO4
Red soil 14.7 1,200 600 600 300 100 300 300Black soil 19.0 600 400 300 300 100 300 300
acidity (0.78%) compared to red soil (0.64%), impairs the fruit sugar conversion process, and hampers the formation of a de-sired TSS: acid ratio. As a consequence, fruit maturity under black soils is delayed compared to that under red soils. Such an implication can be compensated by comparatively longer on-the-tree life for fruits on black soil orchards, and can be very well exploited to adjust the time of fruit harvesting to suit market demand/supply trends.
Implications for Site-Specific Nutrient Management
Fertiliser rates traditionally considered as “optimum” are increasingly being proven to be suboptimal as they fail to match soil nutrient depletion rates and high crop productivity levels. Under such circumstances, SSNM operates as a sys-tematic approach to rationalising fertiliser use under orchards of increased productivity.
The authors’ experiments on SSNM in central India have shown wide differences in optimum fertilisation to match the
targeted orchard productivity of 14.7 t/ha in shallow soil and 19 t/ha in deep soil (Table 6). SSNM will not only help tailor fertiliser applications for individual orchards but will begin to address a more complex problem of wide differences in fruit yield within orchards.
India has 320,000 ha of mandarin orchards presently producing 2.07 million metric tons of fruit annually. Although orchard productivity is highly variable within space and time, an average productivity per planted area of 6.5 t/ha is obviously low if compared to the international average of 30 to 35 t/ha. A major constraint is inadequate and imbalanced nutrient use. Proper diagnosis through soil and plant analysis and nutrient management in accordance with these diagnostic tools can improve crop productivity. BC-INDIA
Dr. Srivastava is Senior Scientist (Soil Science) and Dr. Singh is Direc-tor at the National Research Centre for Citrus, Nagpur, Maharashtra; e-mail: [email protected]. Dr. Tiwari is Director, IPNI India Programme, Gurgaon, Haryana; e-mail: [email protected].
Note: A photo gallery of images showing nutrient deficiency symp-toms in citrus is available at the IPNI India Programme website: www.ipni.net/india/citrus.

30
Bet
ter
Cro
ps –
Ind
ia /
200
7
Publications developed by the India Programme of IPNI are targeted to a wide range of end-users. These include policy-makers, researchers, government officials, indus-
try, extension and training personnel, fertiliser dealers, progres-sive farmers, and media representatives. Interested individuals and institutions can get more information by contacting any of our offices. Below is a listing of our publications.
1. Proceedings of Symposia/Group Discussions/Workshops:
• Maximum Yield Research • Potassium and Its Influence on Quality of Fruit and
Vegetable Crops • Plant Nutrition Effect on Production and Quality of
Tobacco • Phosphorus Research In India • Balanced Fertiliser Use for Increasing Food Grains
Production in Northern States • Balanced Fertiliser Use for Increasing Food Grains
Production in Southern States • Balanced Fertiliser Use for Increasing Food Grains
Production in Eastern States • Balanced Fertiliser Use for Increasing Food Grains
Production in Western States • Use of Potassium in Tamil Nadu Agriculture • Use of Potassium in Maharashtra Agriculture • Use of Potassium in Bihar Agriculture • Use of Potassium in Punjab Agriculture • Use of Potassium in Haryana Agriculture • Use of Potassium in Himachal Pradesh Agriculture • Use of Potassium in Uttar Pradesh Agriculture • Use of Potassium in North Eastern Hill States Agriculture • Use of Potassium in Assam Agriculture • Use of Potassium in West Bengal Agriculture • Use of Potassium in Kerala Agriculture • Review and Refinement of Fertiliser Recommendations
in Uttar Pradesh • Phosphorus in India Agriculture – Issues and Strategies • Review and Refinement of Fertiliser Recommendations
for Major Crops of Jharkhand• Review and Refinement of Fertiliser Recommendations
for Major Crops of West Bengal • Nutrient Status, Needs and Recommendations for Major
Fruit Crops of Uttar Pradesh and Uttaranchal • Review and Refinement of Nutrient Recommendations for
Major Crops of Rajasthan
2. Bulletins• Research Highlights 1998-99, 1999-2000, 2000-2001,
2001-2002, 2002-2003, 2003-2004 • Potassium Deficiency Symptoms in Important
Vegetable Crops of India: This bulletin contains de-scriptive text and color pictures of Cauliflower, Cabbage, Spinach, Tomato, Pea, Onion, Garlic, Radish, Lettuce, Okra, Brinjal, Bitter gourd, Bottle gourd, Chili, Cowpea
and Arum. • Statistics in Fertiliser Use Research • Balanced Use of Fertiliser for Sustainable Agriculture • Phosphorus Deficiency Symptoms in Important Vegetable
Crops: This bulletin contains descriptive text and color pictures of Cauliflower, Cabbage, Spinach, Tomato, Pea, Onion, Garlic, Radish, Lettuce, Okra, Brinjal (Egg plant), Bitter gourd, Serpent melon, Chili, Cowpea and Arum.
• Diagnosis and Correction of Potassium Deficiency in Major Crops: This bulletin in Hindi and English con-tains descriptive text and color pictures of Rice, Wheat, Sorghum, Maize, Mustard, Soybean, Groundnut, Cotton, Sweet potato, Potato, Beet root, Sugarcane, Tobacco, Tea, Rubber, Apple, Peach, Lime, Banana, Pineapple, Cocoa, Coffee, Coconut, Jute, Oil palm, and Sisal.
• Phosphorus Deficiency Symptoms in Major Pulse Crops of India: This bulletin contains descriptive text and color pictures of Chickpea (Cicer arietinum), Black gram (Vigna mungo), Green gram (Vigna radiata), Lentil (Lens culinaris), Pigeon pea (Cajanus cajan), Hyacinth bean (Dalico lablab), Cluster bean (Cyamposis psoraloides), Horse gram (Dolichos biflorus L.), Pea (Pisum sativum L.).
• Phosphorus Deficiency Symptoms in Major Oil-seed Crops of India. This bulletin contains descriptive text and color pictures of Mustard (Brassica campestris), Sunflower (Helianthus annus L.), Safflower (Carthamus tinctorius), Groundnut (Arachis hypogaea), Sesame (Sesa-mum indicum), Linseed (Linum usitatissimum), Rapeseed (Brassica campestris L.), Soybean (Glycine max).
• Potash in Indian Farming: For Balanced Efficiency, Quality and Top yields.
• Nutrient Deficiency Symptoms in Sugarcane• Citrus : A Practical Guide to Nutrient Management• Soil Fertility Evaluation: A Potential Tool for Balanced
Use of Fertilisers• Site-Specific Nutrient Management for Increasing Crop
Productivity in India — Results with Rice-Wheat and Rice-Rice Systems
• Balanced Fertilisation for Agricultural Sustainability in Uttar Pradesh
• Tikau Kheti heto Poshak Tatwa Prabandha• Diagnosis and Correction of Potassium Deficiency in Major
Crops• Fertiliser Guide• Bhartiya Krishi MEY Potash (in Hindi)
3. Brochures and Fact Sheets • Agri Fact Sheets (About 40 Topics)• Nutrient Deficiencies in Indian Soils • The Changing Face of Balanced Fertiliser Use • Nutrient Uptake and Removals • Potash: For Balance, Efficiency, Quality and Top yields • Potash for Uttar Pradesh Agriculture • Potash for Madhya Pradesh Agriculture
India Programme Publication Information

Better C
rops – India / 2007
31
• Potash for Rajasthan Agriculture • Potash for Haryana Agriculture • Potash for Gujarat Agriculture • Potash for Maharashtra Agriculture • Potash for Punjab Agriculture • Potash for Himachal Pradesh Agriculture • Potash for Tamil Nadu Agriculture • Potash for West Bengal Agriculture• Potash for High Yield, High Quality, High Profit and High
Efficiency: Results of Crop Demonstrations in Eastern States
• A Key to Diagnosing Nutrient Deficiency Symptoms in Crop Plants
4. Regional Language Publications• Potash – Its Need & Use in Modern Agriculture (in
Hindi)• Phosphorus for Agriculture (in Hindi)• Phosphorus: A Story in Assamese• International Soil Fertility Manual (in Hindi)• Balanced Fertilisation in Assamese• Balanced Use of Fertiliser for Sustainable Agriculture (in
Hindi)• Fun with Plant Nutrient Team (in Hindi)• Understanding Nitrogen in Our World (in Hindi)• Understanding Phosphorus in Our World (in Hindi)• Understanding Potassium in Our World (in Hindi)• Fertiliser Guide (in Hindi)• Facts From Our Environment (in Hindi)• Potash in Indian Farming : For Balance, Efficiency, Quality
and Top Yields (in Hindi)• Importance of Potash in Agriculture in English• Importance of Potash in Agriculture (in Hindi)• Uttar Pradesh Mey Krishi Ke Liye Potash (in Hindi and
English)• Madhya Pradesh Mey Krishi Ke Liye Potash i(in Hindi
and English)• Rajasthan Mey Krishi Ke Liye Potash (in Hindi and Eng-
lish) • Haryana Mey Krishi Ke Liye Potash (in Hindi and Eng-
lish)• Himachal Pradesh Mey Krishi Ke Liye Potash (in Hindi
and English) • Gujarat Mey Krishi Ke Liye Potash (in Gujarati and
English)• Maharashtra Mey Krishi Ke Liye Potash (in Marathi and
English)
• Punjab Mey Krishi Ke Liye Potash (in Punjabi and English)
• Tamil Nadu Mey Krishi Ke Liye Potash (in Tamil and English)
• Potash for West Bengal Agriculture (in Bengali)• Bihar Mey Krishi Ke Liye Potash (in Hindi and English)• Potash for Assam Agriculture (in Assamese)• Potash for Orissa Agriculture (in Oriya)
5. Pictorial Educational Charts:• Potassium Deficiency Symptoms in Major Plan-
tation Crops: Covers Tea, Rubber, Apple and Pears, Peaches, Citrus, Banana, Pineapple, Cocoa, Oil Palm, Coconut, Jute, Sisal
• Potassium Deficiency Symptoms in Major Food Crops: Covers Rice, Wheat, Barley, Potato, Sweat Potato, Soybean, Mustard, Maize, Tobacco, Cotton, Sugarcane, Groundnut, Sugar beat
• Potassium Deficiency Symptoms in Major Crops of Orissa: Covers Rice, Maize, Potato, Cotton, Sugarcane, Groundnut, Brinjal, Tomato, Chilli, Banana
• Diagnosing Potash Hunger in Fruit Crops: Covers Mango, Papaya, Banana, Guava, Pineapple, Citrus, Apple, Grape
• Diagnosing Potash Hunger in Fruit Crops: Covers Mango, Papaya, Guava, Banana, Pineapple, Apple, Citrus, Grapes
• Diagnosing Potash Hunger in Vegetable Crops: Covers Potato, Cucurbits, Radish, Okra, Amaranthus, Cabbage, Cauliflower, Brinjal, Onion, Capsicum
• Balanced Fertiliser Use in Sugarcane • Diagnosing Nutritional Disorders in Sugarcane• Potash: High Yield, High Quality Nutrient for Sug-
arcane• Potash for High Yield, High Quality, High Profit
and High Efficiency• Diagnosing Nutrient Deficiencies in Citrus• Diagnosing Potash in Major Crops• General Fertiliser Recommendations for Important
Crops of India • Removal of Major Nutrients by Important Crops
of India• Balanced Use of Fertilisers • Nutrient Removals by Fruit and Vegetables• All Crops Need Potash
Visit us at our website: www.ipni.net/india
India – North and West Zones
Dr. K.N. Tiwari, Director 133, Sector-23 Gurgaon-122 017 Haryana, IndiaPh: 91-124-246-1694E-mail: [email protected]
India – South Zone
Dr. T. Nagendra Rao, Deputy Director 33, Ashok Colony, Gowdapuri Kapra, ECIL Post Hyderabad – 500 062Ph: 91-40-2712-7377E-mail: [email protected]
India – East Zone
Dr. K. Majumdar, Deputy Director Space Town Block No 6, Flat No 1D, VIP Road Kolkata 700 052Ph: 91-33-2529-6135E-mail: [email protected]
Office contacts for IPNI India Programme staff:

Balanced Fertilisation – What does it Mean For india?
This first issue of Better Crops-INDIA demonstrates how balanced fer-tilisation benefits crop production, farmers’ profits, and the sustainability of the country’s farming systems. The International Plant Nutrition Institute (IPNI)
is continuing a long and proud history of working in the field of balanced fertilisation in crop management systems in India and around the world.
In Indian agriculture, as in many parts of the world, we continually see the nega-tive impacts of unbalanced nutrient use on crop production, soil fertility, and soil degradation. Degradation of soils through the inappropriate use of nutrient inputs is a real and pressing problem which all nations must address. Growing future food supplies with additional nitrogen is not a reality on most of these degraded soils. Properly balancing the nitrogen with other macronutrients, secondary nutrients, and micronutrients holds the keys to success.
It is our opinion that, like most issues facing society, changes will be required to ensure that Indian farmers can access the various nutrients they need to achieve
crop production and economic goals in the near future. These farmers are well aware of the benefits they obtain from the organic nutrients on their farms, but also realise that their survival depends on the addition of mineral fertiliser nutrients to optimize production and profits.
In 2007, I had the opportunity to meet a sugarcane grower in Meerut District of Uttar Pradesh while on tour in India. Not only did he proudly show us how balanced fertilisation was improving his cane production, but he also introduced us to his son – the first person in his family to attend University. While there was little doubt that our visit to his farm was a proud moment for him, I was truly moved by the power which our cooperative efforts had brought to this farm family and wondered how many other farmers have experienced such benefits.
Developing and presenting new technology can often be a frustrating experience for those who work in research and development. Often we feel that our efforts are being limited by factors outside of our control – policies, transportation, and product access, just to mention a few. However, the fact remains that we have the knowledge and experi-ence to bring increased production, and improved sustainability, to many Indian farmers, while at the same time increasing their income.
Balanced fertilisation is an achievement we continue to take pride in, and will continue to share with all who are interested in the future development of Indian agriculture.
Adrian M. JohnstonVice President and Asia Group Coordinator, IPNIE-mail: [email protected]
IPNI–India Program133, Sector-23
Gurgaon-122 017Haryana, India
Better Crops–INDIA