BETTER COTTON INITIATIVE 2014 HARVEST REPORT · around the world have been able to ... Better...
43
BETTER COTTON INITIATIVE 2014 HARVEST REPORT www.bettercotton.org
Transcript of BETTER COTTON INITIATIVE 2014 HARVEST REPORT · around the world have been able to ... Better...
BETTER COTTON INITIATIVE2014 HARVEST REPORT
www.bettercotton.org
www.bettercotton.org 2014 HARVEST REPORT 2014 HARVEST REPORT2013 HARVEST REPORT www.bettercotton.org
NOTE FROM THE CEO
Growth is Good (But how to Measure it?)
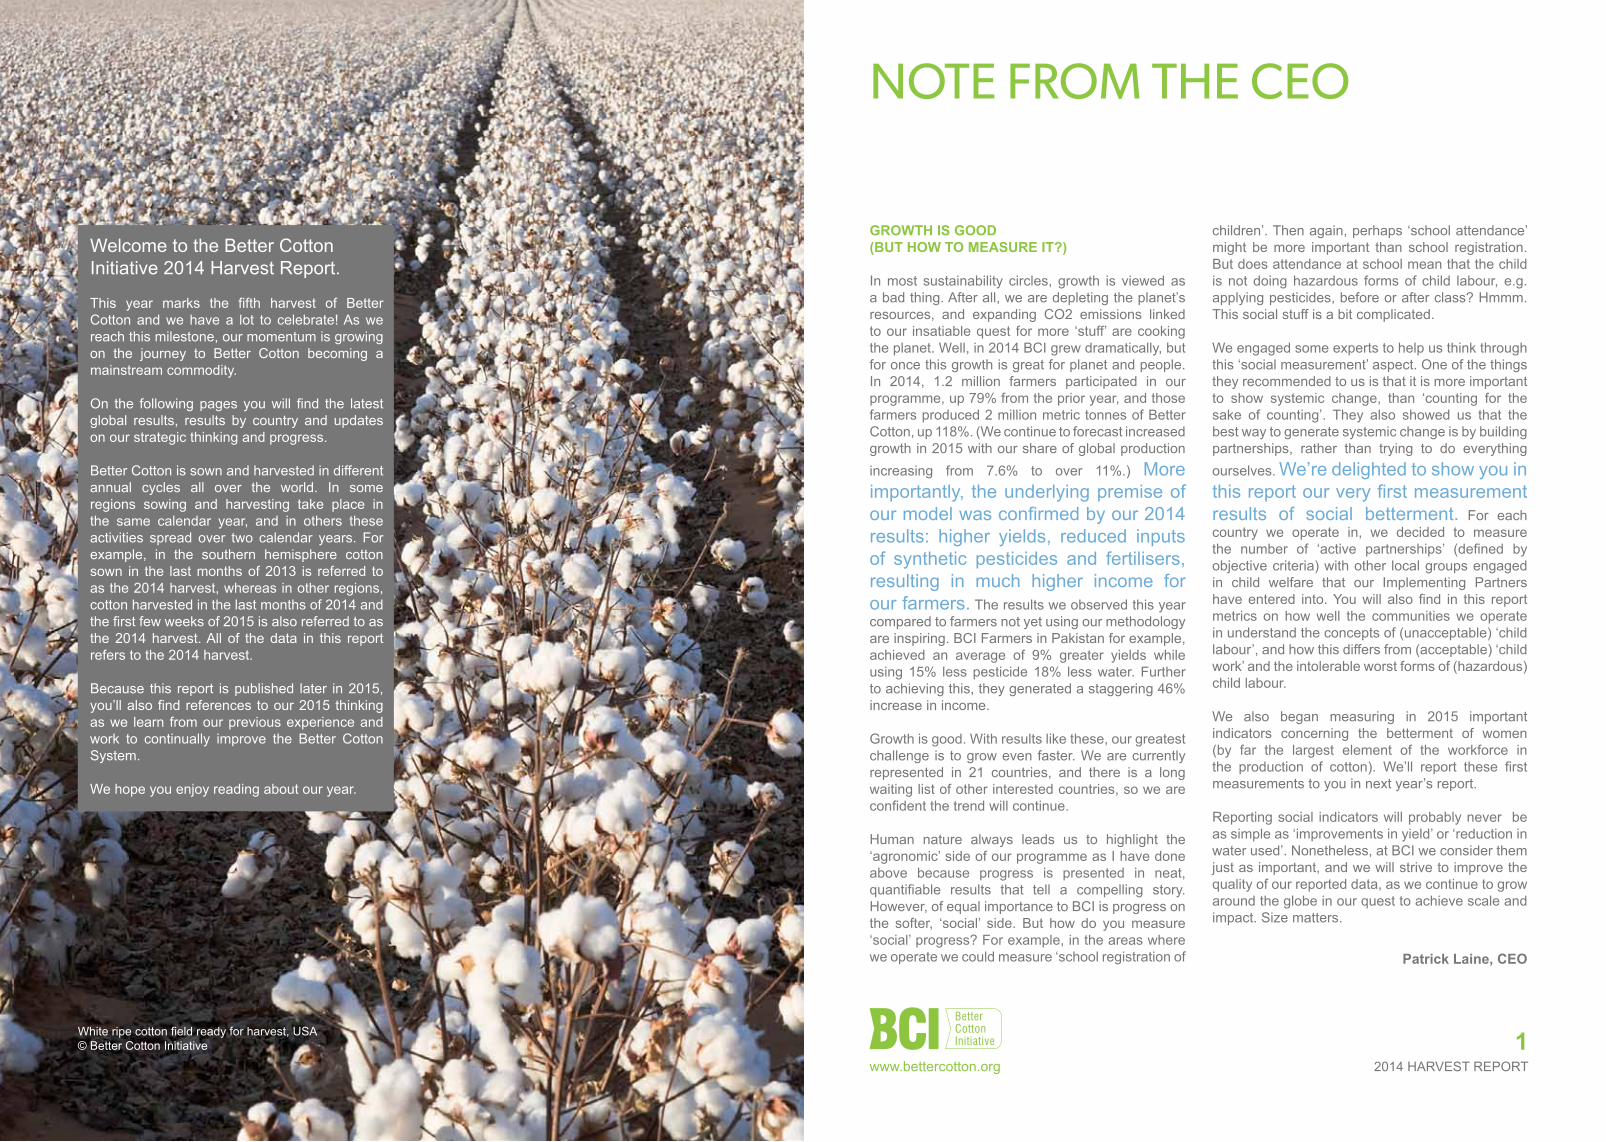
In most sustainability circles, growth is viewed as a bad thing. After all, we are depleting the planet’s resources, and expanding CO2 emissions linked to our insatiable quest for more ‘stuff’ are cooking the planet. Well, in 2014 BCI grew dramatically, but for once this growth is great for planet and people. In 2014, 1.2 million farmers participated in our programme, up 79% from the prior year, and those farmers produced 2 million metric tonnes of Better Cotton, up 118%. (We continue to forecast increased growth in 2015 with our share of global production increasing from 7.6% to over 11%.) More importantly, the underlying premise of our model was confirmed by our 2014 results: higher yields, reduced inputs of synthetic pesticides and fertilisers, resulting in much higher income for our farmers. The results we observed this year compared to farmers not yet using our methodology are inspiring. BCI Farmers in Pakistan for example, achieved an average of 9% greater yields while using 15% less pesticide 18% less water. Further to achieving this, they generated a staggering 46% increase in income.
Growth is good. With results like these, our greatest challenge is to grow even faster. We are currently represented in 21 countries, and there is a long waiting list of other interested countries, so we are confident the trend will continue.
Human nature always leads us to highlight the ‘agronomic’ side of our programme as I have done above because progress is presented in neat, quantifiable results that tell a compelling story. However, of equal importance to BCI is progress on the softer, ‘social’ side. But how do you measure ‘social’ progress? For example, in the areas where we operate we could measure ‘school registration of
children’. Then again, perhaps ‘school attendance’ might be more important than school registration. But does attendance at school mean that the child is not doing hazardous forms of child labour, e.g. applying pesticides, before or after class? Hmmm. This social stuff is a bit complicated.
We engaged some experts to help us think through this ‘social measurement’ aspect. One of the things they recommended to us is that it is more important to show systemic change, than ‘counting for the sake of counting’. They also showed us that the best way to generate systemic change is by building partnerships, rather than trying to do everything ourselves. We’re delighted to show you in this report our very first measurement results of social betterment. For each country we operate in, we decided to measure the number of ‘active partnerships’ (defined by objective criteria) with other local groups engaged in child welfare that our Implementing Partners have entered into. You will also find in this report metrics on how well the communities we operate in understand the concepts of (unacceptable) ‘child labour’, and how this differs from (acceptable) ‘child work’ and the intolerable worst forms of (hazardous) child labour.
We also began measuring in 2015 important indicators concerning the betterment of women (by far the largest element of the workforce in the production of cotton). We’ll report these first measurements to you in next year’s report.
Reporting social indicators will probably never be as simple as ‘improvements in yield’ or ‘reduction in water used’. Nonetheless, at BCI we consider them just as important, and we will strive to improve the quality of our reported data, as we continue to grow around the globe in our quest to achieve scale and impact. Size matters.
Patrick Laine, Ceo
White ripe cotton field ready for harvest, USA© Better Cotton Initiative 1
Welcome to the Better Cotton Initiative 2014 Harvest Report.
This year marks the fifth harvest of Better Cotton and we have a lot to celebrate! As we reach this milestone, our momentum is growing on the journey to Better Cotton becoming a mainstream commodity.
On the following pages you will find the latest global results, results by country and updates on our strategic thinking and progress.
Better Cotton is sown and harvested in different annual cycles all over the world. In some regions sowing and harvesting take place in the same calendar year, and in others these activities spread over two calendar years. For example, in the southern hemisphere cotton sown in the last months of 2013 is referred to as the 2014 harvest, whereas in other regions, cotton harvested in the last months of 2014 and the first few weeks of 2015 is also referred to as the 2014 harvest. All of the data in this report refers to the 2014 harvest.
Because this report is published later in 2015, you’ll also find references to our 2015 thinking as we learn from our previous experience and work to continually improve the Better Cotton System.
We hope you enjoy reading about our year.
www.bettercotton.org

2014 HARVEST REPORT2014 HARVEST REPORT
CONTENTS
OUR MISSION ............................................................................................................... 7BETTER COTTON GLOBALLY ...................................................................................... 8THE BETTER COTTON STANDARD SYSTEM ....................................................... 10 FROM FARM TO MARKET: FABRIC MILLS ............................................................... 11
3
REPORTING ON RESULTS ACHIEVED ON BETTER COTTON FARMS .................. 14ASIA CHINA .......................................................................................................................... 17INDIA ............................................................................................................................ 23PAKISTAN .................................................................................................................... 29TAJIKISTAN .................................................................................................................. 35TURKEY ........................................................................................................................ 41AFRICA MALI ............................................................................................................................. 47MOZAMBIQUE ............................................................................................................. 53SENEGAL ...................................................................................................................... 59NORTH AMERICA USA ............................................................................................................................. 63BENCHMARKED STANDARDS ................................................................................... 67AUSTRALIA .................................................................................................................. 69ALGODÃO BRASILEIRO RESPONSÁVEL (ABR), BRAZIL ........................................ 73COTTON MADE IN AFRICA ...................................................................................... 77
GLOSSARY .................................................................................................................... 4
FROM THE FIELD
BETTER COTTON IN 2014
2
A WORD OF THANKS
This year, over 1.2 million farmers around the world have been able to apply the continuous improvement methodologies promoted by the Better Cotton Standard. But the farmers do not work alone. From the Standard to the field, BCI operates with a wide variety of organisations who together contribute in time, funds, collaboration and know-how to help BCI Farmers bring about the results that are now in your hands.
NGOs, retailers and brands, manufacturers, spinners, ginners traders, governments, foundations and other donors - too numerous to list individually here - we would like to use this opportunity to recognise your contribution. Thank you.
See bettercotton.org for comprehensive coverage of BCI's Members’ and Partners’.
www.bettercotton.org www.bettercotton.org
2014 HARVEST REPORT
BETTER COTTON IN 2014
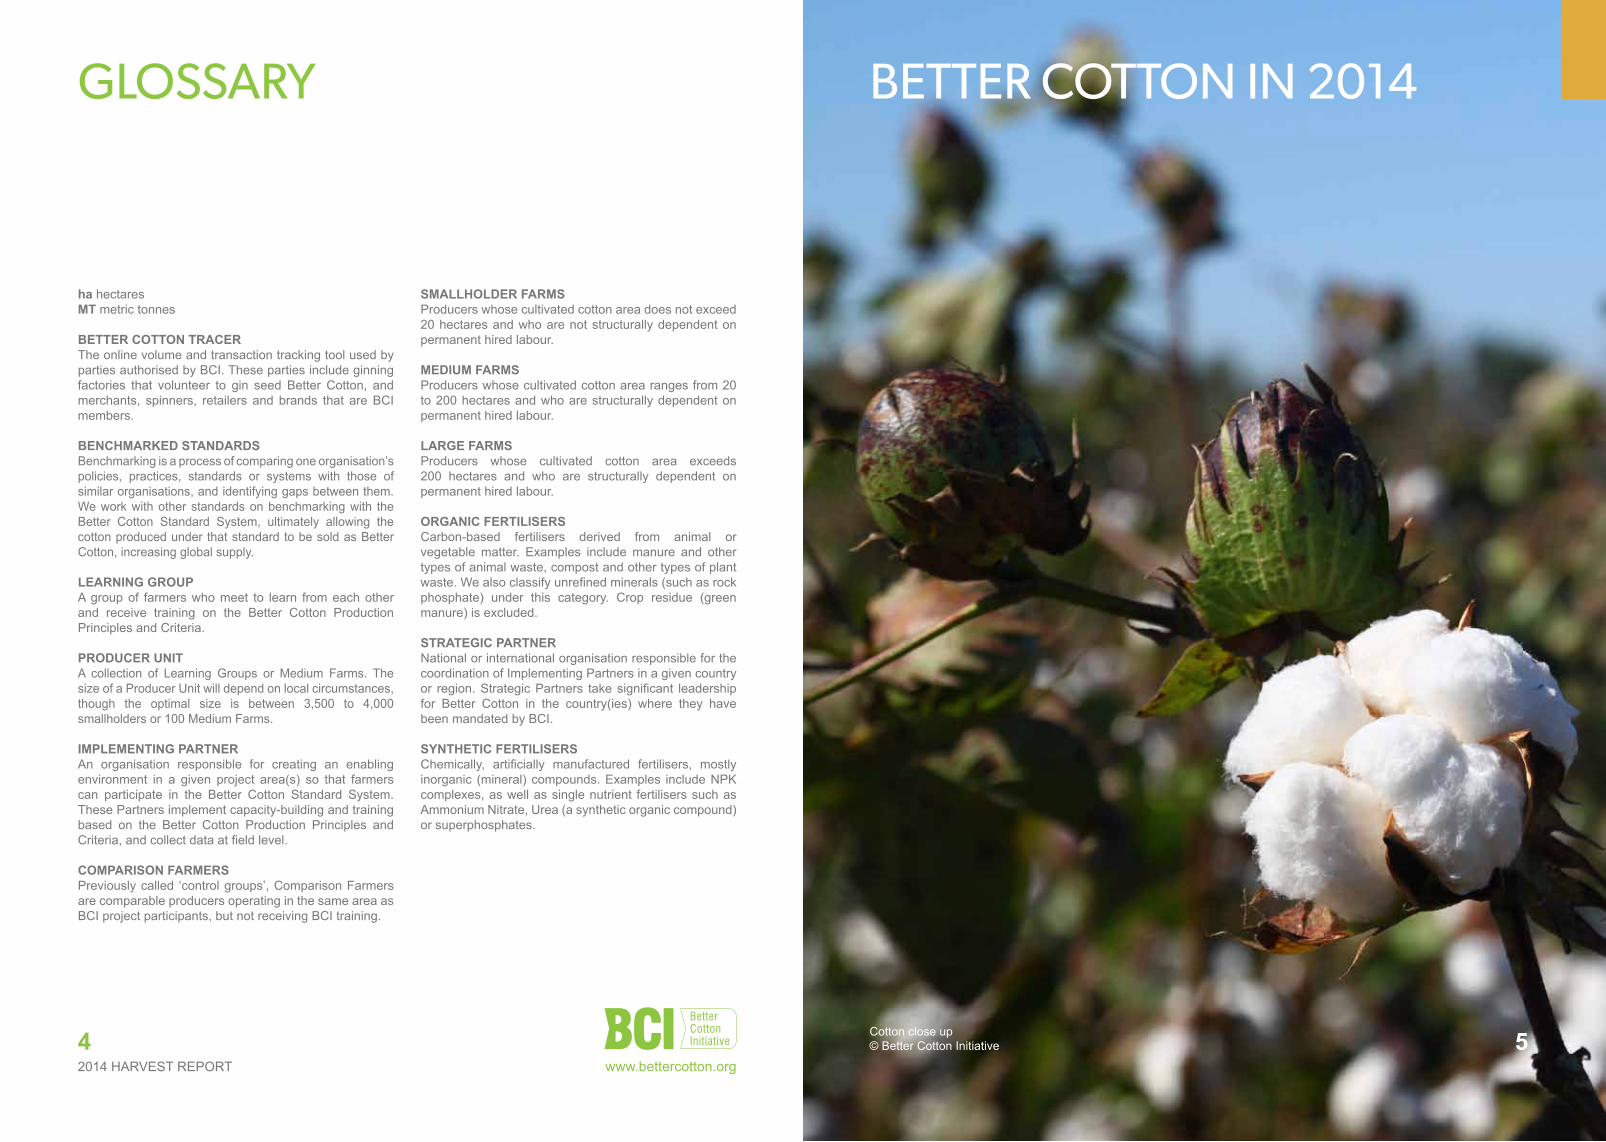
Cotton close up© Better Cotton Initiative 54
GLOSSARY
ha hectaresMt metric tonnes
Better CottoN traCer The online volume and transaction tracking tool used by parties authorised by BCI. These parties include ginning factories that volunteer to gin seed Better Cotton, and merchants, spinners, retailers and brands that are BCI members.
BeNChMarKed staNdards Benchmarking is a process of comparing one organisation’s policies, practices, standards or systems with those of similar organisations, and identifying gaps between them. We work with other standards on benchmarking with the Better Cotton Standard System, ultimately allowing the cotton produced under that standard to be sold as Better Cotton, increasing global supply.
LearNiNG GrouPA group of farmers who meet to learn from each other and receive training on the Better Cotton Production Principles and Criteria.
ProduCer uNitA collection of Learning Groups or Medium Farms. The size of a Producer Unit will depend on local circumstances, though the optimal size is between 3,500 to 4,000 smallholders or 100 Medium Farms.
iMPLeMeNtiNG PartNerAn organisation responsible for creating an enabling environment in a given project area(s) so that farmers can participate in the Better Cotton Standard System. These Partners implement capacity-building and training based on the Better Cotton Production Principles and Criteria, and collect data at field level.
CoMParisoN FarMersPreviously called ‘control groups’, Comparison Farmers are comparable producers operating in the same area as BCI project participants, but not receiving BCI training.
sMaLLhoLder FarMsProducers whose cultivated cotton area does not exceed 20 hectares and who are not structurally dependent on permanent hired labour.
MediuM FarMsProducers whose cultivated cotton area ranges from 20 to 200 hectares and who are structurally dependent on permanent hired labour.
LarGe FarMsProducers whose cultivated cotton area exceeds 200 hectares and who are structurally dependent on permanent hired labour.
orGaNiC FertiLisersCarbon-based fertilisers derived from animal or vegetable matter. Examples include manure and other types of animal waste, compost and other types of plant waste. We also classify unrefined minerals (such as rock phosphate) under this category. Crop residue (green manure) is excluded.
strateGiC PartNer National or international organisation responsible for the coordination of Implementing Partners in a given country or region. Strategic Partners take significant leadership for Better Cotton in the country(ies) where they have been mandated by BCI.
sYNthetiC FertiLisersChemically, artificially manufactured fertilisers, mostly inorganic (mineral) compounds. Examples include NPK complexes, as well as single nutrient fertilisers such as Ammonium Nitrate, Urea (a synthetic organic compound) or superphosphates.
www.bettercotton.org
2014 HARVEST REPORT 2014 HARVEST REPORT6 7
THE BETTER COTTON STORY
Look down. What are you wearing? Chances are that one or more of your clothes are made from cotton. Or maybe it’s your bed sheets, towels or the bank notes in your pocket. Nearly everyone on Earth uses or wears cotton products every day.
Cotton is a renewable natural resource but the future of cotton production is vulnerable to poor environmental management, poor working conditions and unstable markets. In 2005, a group of visionary organisations came together to work out a practical solution that would secure the sustainable future of the industry. The result was Better Cotton.
Better Cotton means producing cotton in a way that cares for the environment through processes that minimise the negative impact of fertilisers and pesticides, and cares for water, soil health and natural habitats. BCI Farmers can achieve better yields and more financial security through access to global markets, whilst improving the working conditions in their fields.
Cotton that is made in this way meets the Better Cotton Standard. The Standard has been developed by the Better Cotton Initiative (BCI), an independent, multi-stakeholder organisation whose members are committed to making Better Cotton a mainstream product. From NGO partners to garment manufacturers, from the farmers to household brand names, all BCI’s members are working to transform the way cotton is produced and safeguard the future of the sector.
The Standard gives assurance that more sustainable farming is happening on the ground. Every step of cotton production, from sowing and growing to picking and harvesting, adheres to six production principles. BCI Farmers are also expected to continually improve their production processes. The Standard can be applied to different scales of cotton production – from smallholder farms in Mali, Mozambique and Tajikistan to large, industrialised operations in Brazil, China and Australia.
Top international brands including adidas, H&M, IKEA, Levi Strauss & Co., M&S and Nike already use Better Cotton in their supply chains. Their support and that of all BCI’s members means that more and more Better Cotton is coming onto the market. In 2014, 7.6% of all the cotton produced globally was Better Cotton. By 2020, we want this figure to be 30%. We believe 30% will be a tipping point and lead to transformational change for the entire sector. That’s better for the farmers, the environment and the cotton sector, and that’s better for all of us.
OUR MISSION
The Better Cotton Initiative exists to make global cotton production better for the people who produce it, better for the environment it grows in and better for the sector’s future.
BCI works with a diverse range of stakeholders, connecting people and organisations across the cotton sector from field to store, to promote measurable and continuing improvements for the environment, farming communities and the economies of cotton-producing areas.
BCI aims to transform cotton production worldwide by developing Better Cotton as a sustainable mainstream commodity.
www.bettercotton.org www.bettercotton.org

BETTER COTTON GLOBALLYBCi projects
Benchmarked standards: – MyBMP, Cotton Australia – CmiA / SCS– ABR, Brazil
1.3 millionfarmers reached
Grown on 2.5 millionhectares
7.6% of global
cotton production
20 countries
5continents
1.2 million farmers licensed
2 million Mt of Better
Cotton lint
982014 HARVEST REPORT2014 HARVEST REPORT
www.bettercotton.org www.bettercotton.org
GLoBaL reaCh
2,584,000
BCI Farmers Area under Better Cotton
Cultivation (ha)
Better Cotton Production
(MT lint)
1,00
8,50
0
164,
000
90,0
00
28,5
00
683,
000
250,
000
65,0
00
155,
000
623,
000
200,
000
35,0
00
680,000
1,220,2231,350,000
905,000
1,969,700
440,
000
600,
000
750,
000
240,
000
733,
232
750,
000
1,16
7,50
083
4,50
0
1,55
4,00
01,
008,
500
201220112010 2013 2014
2014 Benchmarked Partners2013 Benchmarked Partners
Cotton made in Africa (CmiA) / Subsaharan Cotton Standard (SCS)733,000 Farmers972,000 hectares 346,000 MT lint
USA21 BCI Farmers7,400 Better Cotton hectares 12,000 Better Cotton MT lint
BRAZIL (ABR)190 BCI Farmers558,000 Better Cotton hectares 768,000 Better Cotton MT lint
SENEGAL3,600 BCI Farmers3,000 Better Cotton hectares 1,200 Better Cotton MT lint
MALI29,000 BCI Farmers80,000 Better Cotton hectares 35,000 Better Cotton MT lint
MOZAMBIQUE 75,000 BCI Farmers52,600 Better Cotton hectares 9,500 Better Cotton MT lint PAKISTAN
102,000 BCI Farmers353,000 Better Cotton hectares 310,000 Better Cotton MT lint
TURKEY530 BCI Farmers13,000 Better Cotton hectares 23,000 Better Cotton MT lint
AUSTRALIA (myBMP)22 BCI Farmers27,000 Better Cotton hectares 54,000 Better Cotton MT lint
TAJIKISTAN360 BCI Farmers 8,000 Better Cotton hectares7,000 Better Cotton MT lint
CHINA6,500 BCI Farmers54,500 Better Cotton hectares 121,000 Better Cotton MT lint
INDIA270,000 BCI Farmers456,000 Better Cotton hectares 283,000 Better Cotton MT lint
2014 HARVEST REPORT10
FROM FARM TO MARKET: FABRIC MILLS
11
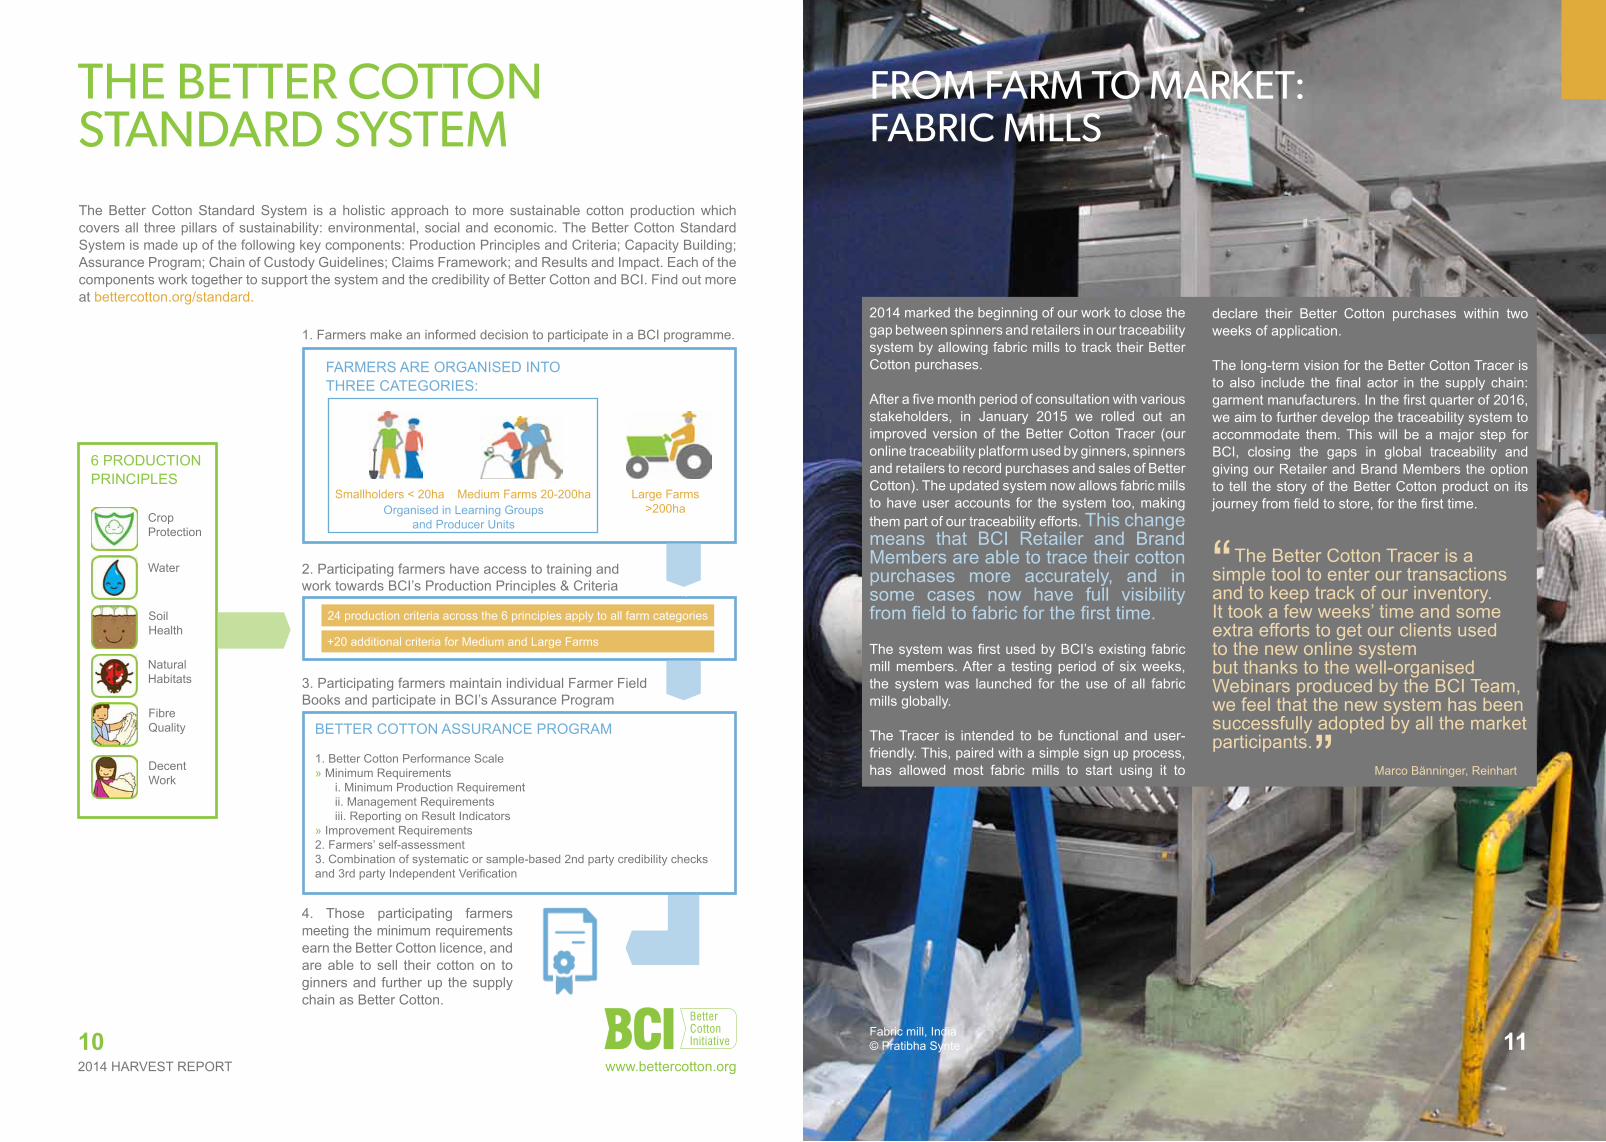
THE BETTER COTTON STANDARD SYSTEMThe Better Cotton Standard System is a holistic approach to more sustainable cotton production which covers all three pillars of sustainability: environmental, social and economic. The Better Cotton Standard System is made up of the following key components: Production Principles and Criteria; Capacity Building; Assurance Program; Chain of Custody Guidelines; Claims Framework; and Results and Impact. Each of the components work together to support the system and the credibility of Better Cotton and BCI. Find out more at bettercotton.org/standard.
Crop Protection
Natural Habitats
Fibre Quality
Water
Soil Health
Decent Work
FARMERS ARE ORGANISED INTO THREE CATEGORIES:
Smallholders < 20ha Medium Farms 20-200ha Large Farms >200haOrganised in Learning Groups
and Producer Units
24 production criteria across the 6 principles apply to all farm categories
+20 additional criteria for Medium and Large Farms
BETTER COTTON ASSURANCE PROGRAM
1. Better Cotton Performance Scale » Minimum Requirements i. Minimum Production Requirement ii. Management Requirements iii. Reporting on Result Indicators» Improvement Requirements2. Farmers’ self-assessment3. Combination of systematic or sample-based 2nd party credibility checks and 3rd party Independent Verification
1. Farmers make an informed decision to participate in a BCI programme.
2. Participating farmers have access to training and work towards BCI’s Production Principles & Criteria
3. Participating farmers maintain individual Farmer Field Books and participate in BCI’s Assurance Program
4. Those participating farmers meeting the minimum requirements earn the Better Cotton licence, and are able to sell their cotton on to ginners and further up the supply chain as Better Cotton.
6 PRODUCTION PRINCIPLES
Fabric mill, India© Pratibha Synte
2014 marked the beginning of our work to close the gap between spinners and retailers in our traceability system by allowing fabric mills to track their Better Cotton purchases. After a five month period of consultation with various stakeholders, in January 2015 we rolled out an improved version of the Better Cotton Tracer (our online traceability platform used by ginners, spinners and retailers to record purchases and sales of Better Cotton). The updated system now allows fabric mills to have user accounts for the system too, making them part of our traceability efforts. This change means that BCI Retailer and Brand Members are able to trace their cotton purchases more accurately, and in some cases now have full visibility from field to fabric for the first time.
The system was first used by BCI’s existing fabric mill members. After a testing period of six weeks, the system was launched for the use of all fabric mills globally.
The Tracer is intended to be functional and user-friendly. This, paired with a simple sign up process, has allowed most fabric mills to start using it to
declare their Better Cotton purchases within two weeks of application.
The long-term vision for the Better Cotton Tracer is to also include the final actor in the supply chain: garment manufacturers. In the first quarter of 2016, we aim to further develop the traceability system to accommodate them. This will be a major step for BCI, closing the gaps in global traceability and giving our Retailer and Brand Members the option to tell the story of the Better Cotton product on its journey from field to store, for the first time.
“ The Better Cotton Tracer is a simple tool to enter our transactions and to keep track of our inventory. It took a few weeks’ time and some extra efforts to get our clients used to the new online system but thanks to the well-organised Webinars produced by the BCI Team, we feel that the new system has been successfully adopted by all the market participants.
Marco Bänninger, Reinhart”
www.bettercotton.org
2014 HARVEST REPORT12
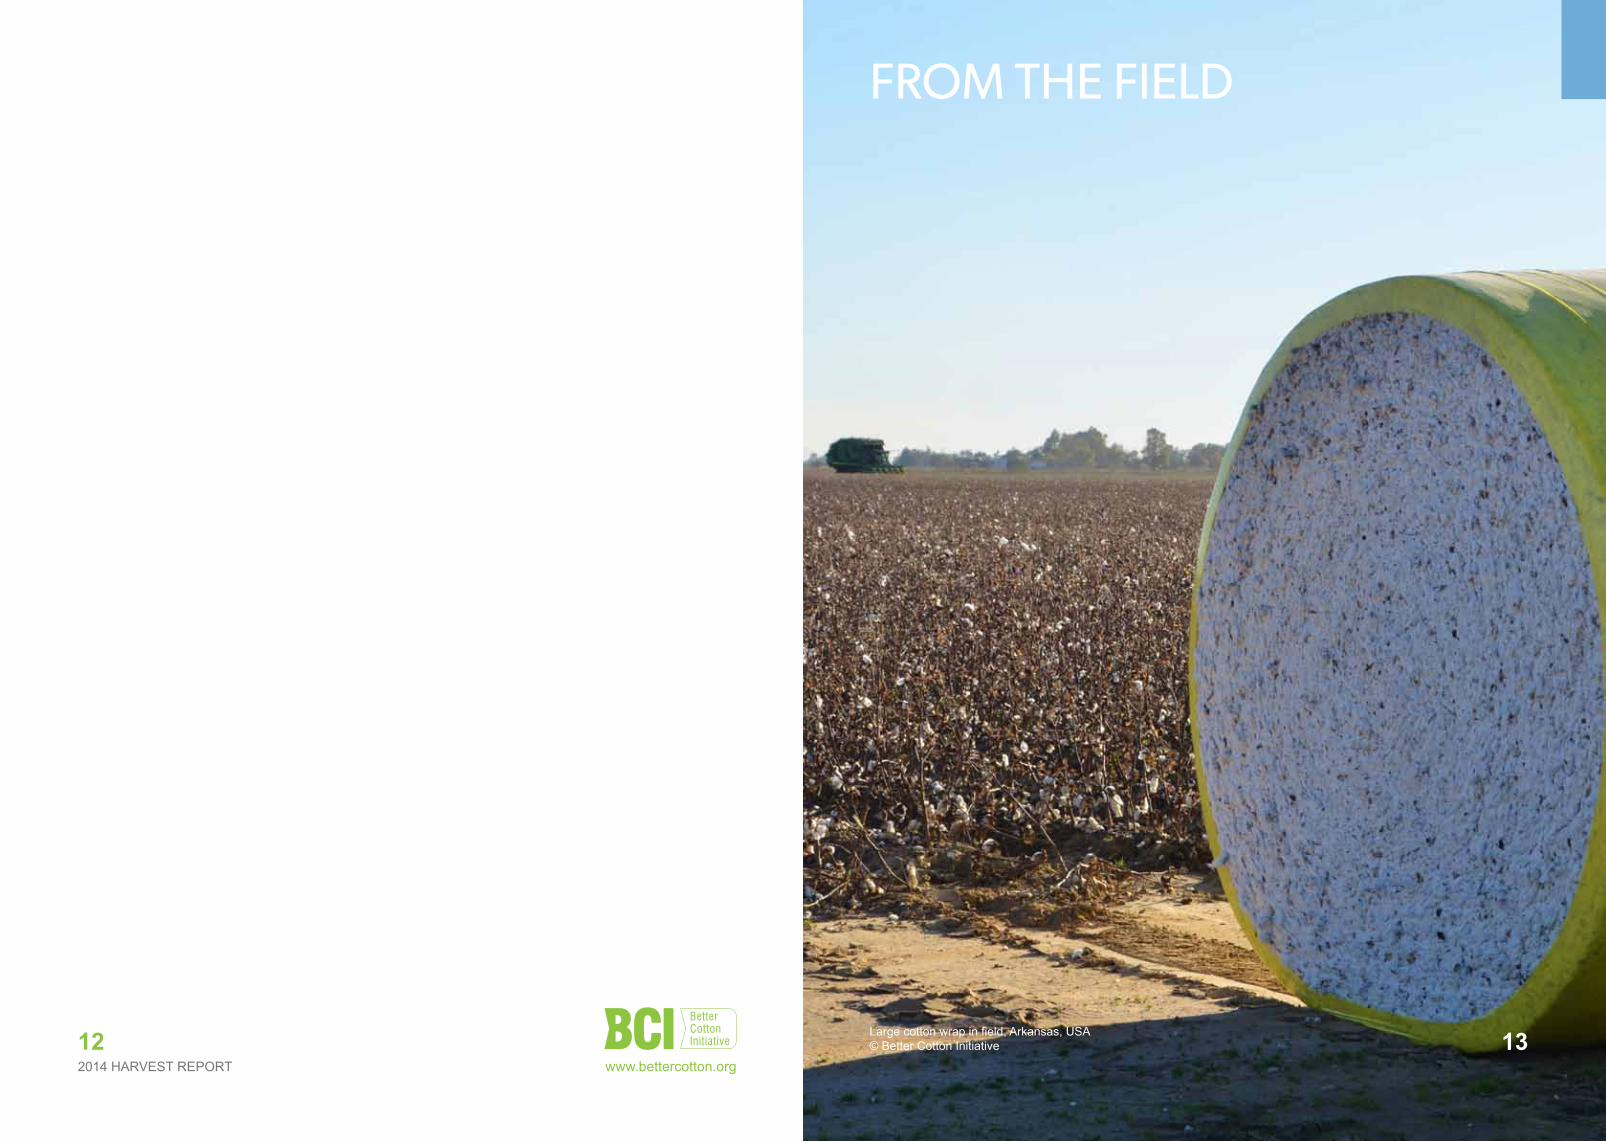
FROM THE FIELD
Large cotton wrap in field, Arkansas, USA© Better Cotton Initiative 13
www.bettercotton.org
2014 HARVEST REPORT2014 HARVEST REPORT15
REPORTING ON RESULTS ACHIEVED ON BETTER COTTON FARMS
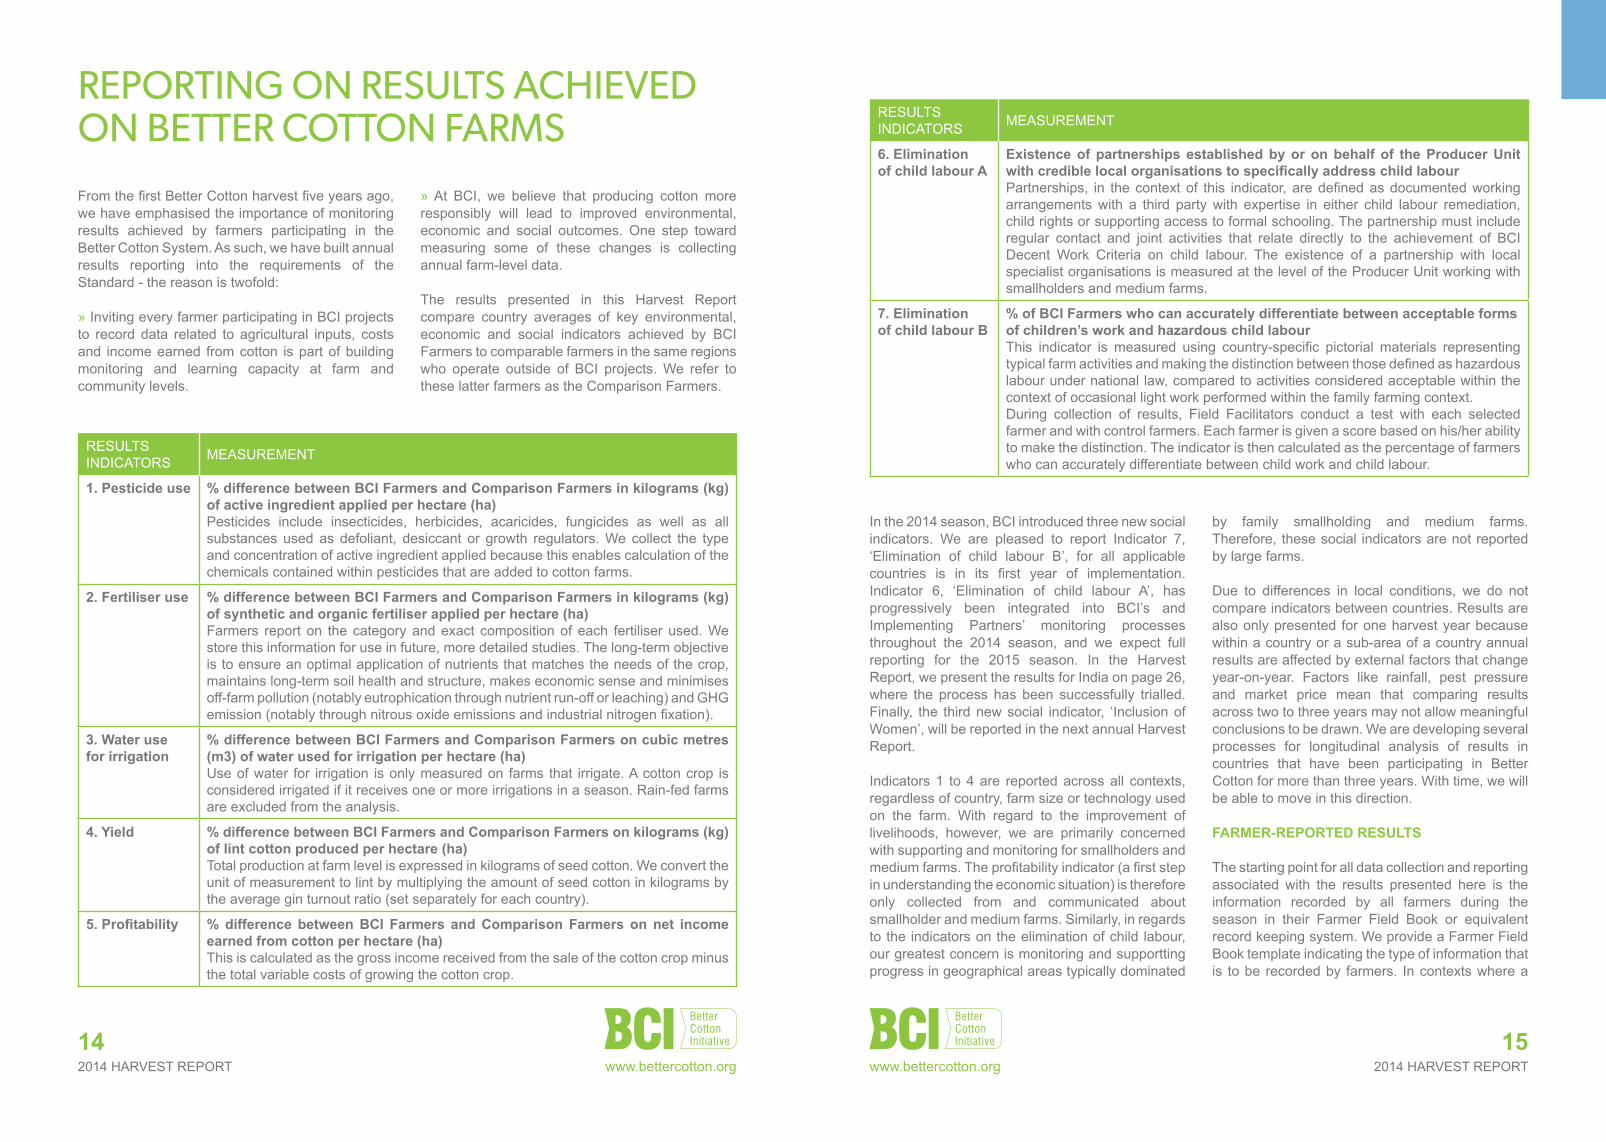
From the first Better Cotton harvest five years ago, we have emphasised the importance of monitoring results achieved by farmers participating in the Better Cotton System. As such, we have built annual results reporting into the requirements of the Standard - the reason is twofold:
» Inviting every farmer participating in BCI projects to record data related to agricultural inputs, costs and income earned from cotton is part of building monitoring and learning capacity at farm and community levels.
RESULTS INDICATORS MEASUREMENT
1. Pesticide use % difference between BCi Farmers and Comparison Farmers in kilograms (kg) of active ingredient applied per hectare (ha)Pesticides include insecticides, herbicides, acaricides, fungicides as well as all substances used as defoliant, desiccant or growth regulators. We collect the type and concentration of active ingredient applied because this enables calculation of the chemicals contained within pesticides that are added to cotton farms.
2. Fertiliser use % difference between BCi Farmers and Comparison Farmers in kilograms (kg) of synthetic and organic fertiliser applied per hectare (ha)Farmers report on the category and exact composition of each fertiliser used. We store this information for use in future, more detailed studies. The long-term objective is to ensure an optimal application of nutrients that matches the needs of the crop, maintains long-term soil health and structure, makes economic sense and minimises off-farm pollution (notably eutrophication through nutrient run-off or leaching) and GHG emission (notably through nitrous oxide emissions and industrial nitrogen fixation).
3. water use for irrigation
% difference between BCi Farmers and Comparison Farmers on cubic metres (m3) of water used for irrigation per hectare (ha)Use of water for irrigation is only measured on farms that irrigate. A cotton crop is considered irrigated if it receives one or more irrigations in a season. Rain-fed farms are excluded from the analysis.
4. Yield % difference between BCi Farmers and Comparison Farmers on kilograms (kg) of lint cotton produced per hectare (ha)Total production at farm level is expressed in kilograms of seed cotton. We convert the unit of measurement to lint by multiplying the amount of seed cotton in kilograms by the average gin turnout ratio (set separately for each country).
5. Profitability % difference between BCi Farmers and Comparison Farmers on net income earned from cotton per hectare (ha)This is calculated as the gross income received from the sale of the cotton crop minus the total variable costs of growing the cotton crop.
» At BCI, we believe that producing cotton more responsibly will lead to improved environmental, economic and social outcomes. One step toward measuring some of these changes is collecting annual farm-level data.
The results presented in this Harvest Report compare country averages of key environmental, economic and social indicators achieved by BCI Farmers to comparable farmers in the same regions who operate outside of BCI projects. We refer to these latter farmers as the Comparison Farmers.
In the 2014 season, BCI introduced three new social indicators. We are pleased to report Indicator 7, ‘Elimination of child labour B’, for all applicable countries is in its first year of implementation. Indicator 6, ‘Elimination of child labour A’, has progressively been integrated into BCI’s and Implementing Partners’ monitoring processes throughout the 2014 season, and we expect full reporting for the 2015 season. In the Harvest Report, we present the results for India on page 26, where the process has been successfully trialled. Finally, the third new social indicator, ‘Inclusion of Women’, will be reported in the next annual Harvest Report.
Indicators 1 to 4 are reported across all contexts, regardless of country, farm size or technology used on the farm. With regard to the improvement of livelihoods, however, we are primarily concerned with supporting and monitoring for smallholders and medium farms. The profitability indicator (a first step in understanding the economic situation) is therefore only collected from and communicated about smallholder and medium farms. Similarly, in regards to the indicators on the elimination of child labour, our greatest concern is monitoring and supportting progress in geographical areas typically dominated
by family smallholding and medium farms. Therefore, these social indicators are not reported by large farms. Due to differences in local conditions, we do not compare indicators between countries. Results are also only presented for one harvest year because within a country or a sub-area of a country annual results are affected by external factors that change year-on-year. Factors like rainfall, pest pressure and market price mean that comparing results across two to three years may not allow meaningful conclusions to be drawn. We are developing several processes for longitudinal analysis of results in countries that have been participating in Better Cotton for more than three years. With time, we will be able to move in this direction.
FarMer-rePorted resuLts
The starting point for all data collection and reporting associated with the results presented here is the information recorded by all farmers during the season in their Farmer Field Book or equivalent record keeping system. We provide a Farmer Field Book template indicating the type of information that is to be recorded by farmers. In contexts where a
14
RESULTS INDICATORS MEASUREMENT
6. elimination of child labour a
existence of partnerships established by or on behalf of the Producer unit with credible local organisations to specifically address child labourPartnerships, in the context of this indicator, are defined as documented working arrangements with a third party with expertise in either child labour remediation, child rights or supporting access to formal schooling. The partnership must include regular contact and joint activities that relate directly to the achievement of BCI Decent Work Criteria on child labour. The existence of a partnership with local specialist organisations is measured at the level of the Producer Unit working with smallholders and medium farms.
7. elimination of child labour B
% of BCi Farmers who can accurately differentiate between acceptable formsof children’s work and hazardous child labour This indicator is measured using country-specific pictorial materials representing typical farm activities and making the distinction between those defined as hazardous labour under national law, compared to activities considered acceptable within the context of occasional light work performed within the family farming context.During collection of results, Field Facilitators conduct a test with each selected farmer and with control farmers. Each farmer is given a score based on his/her ability to make the distinction. The indicator is then calculated as the percentage of farmers who can accurately differentiate between child work and child labour.
www.bettercotton.org www.bettercotton.org
2014 HARVEST REPORT
CHINAmajority of participants have limited literacy skills, Field Facilitators assist farmers in tracking and recording the relevant information. The Farmer Field Book can also be in the form of a computerised record keeping system in the case of large farms.
saMPLiNG aPProaCh For dataCoLLeCtioN
During the harvest years between 2010 and 2012, BCI collected Results Indicator data from all farmers participating in the Better Cotton System. As Better Cotton expands–and the number of smallholders rapidly increases–the costs and effort associated with collection and management of data from hundreds of thousands of farmers become increasingly complex.
Data from all medium and large farms is still collected. For smallholders, we developed a sampling methodology, which was reviewed and endorsed by researchers at Wageningen University in the Netherlands. The methodology includes the collection of data from a representative sample of Learning Groups that are randomly selected by BCI on a yearly basis at the end of the season. The Farmer Field Book is maintained by all farmers for learning purposes.
On occasion, data was excluded from the analysis because it was assessed to be incomplete or because no comparison data was available for a Producer Unit. These instances have been noted on each of the country results pages with a percentage that indicates how representative the data is with respect to the BCI Farmer population.
CoMParisoN data
Each Producer Unit and large farm we work with is responsible for collecting data from Comparison Farmers. These farmers can live in the same community as BCI Farmers, in neighbouring communities or in other nearby locations. Their key characteristics make them as similar to project farmers as possible. Comparison Farmers should present similar socio-economic characteristics as BCI Farmers. The characteristics of their farm should also be taken into account:
» number and type of labourers» size » irrigation system » general soil fertility » crops grown » experience in growing cotton
a Note oN data PreParatioN
The results presented in this report are weighted national averages of farm-level results, comparing the averages of BCI Farmers to those of Comparison Farmers. The weighting is a standard statistical analysis method, done so that the proportions of each sub-country region represented in Better Cotton projects are similar in both the BCI Farmer group and the Comparison Farmer group at the country level.
outCoMe evaLuatioNs aNd iMPaCt assessMeNts
In addition to the data reported by farmers, BCI annually contracts researchers or consultants to conduct independent Outcome Evaluations in two or more countries. These studies allow for a deeper investigation of the results using a sample of Comparison Farmers coupled with additional qualitative assessments, focus group discussions and other approaches. The findings of these independent studies allow us to corroborate–or not–the data we receive from farmers via our partners, and leads to a deeper understanding of how BCI interventions, coupled with the particular local context, lead to outcomes and results. Two such studies will be conducted in 2015.
Furthermore, BCI encourages and supports long-term, scientific impact assessment studies conducted by expert researchers on an independent basis. We are currently collaborating on two multi-year impact assessment projects. A first study led and conducted by researchers from the Copenhagen Business School started in 2014 and will yield its first results in 2016. A second research study, commissioned by ISEAL, is conducted by a consortium of research organisations under the leadership of the Natural Resource Institute of the University of Greenwich. This study, which started in 2015, will extend to 2017.
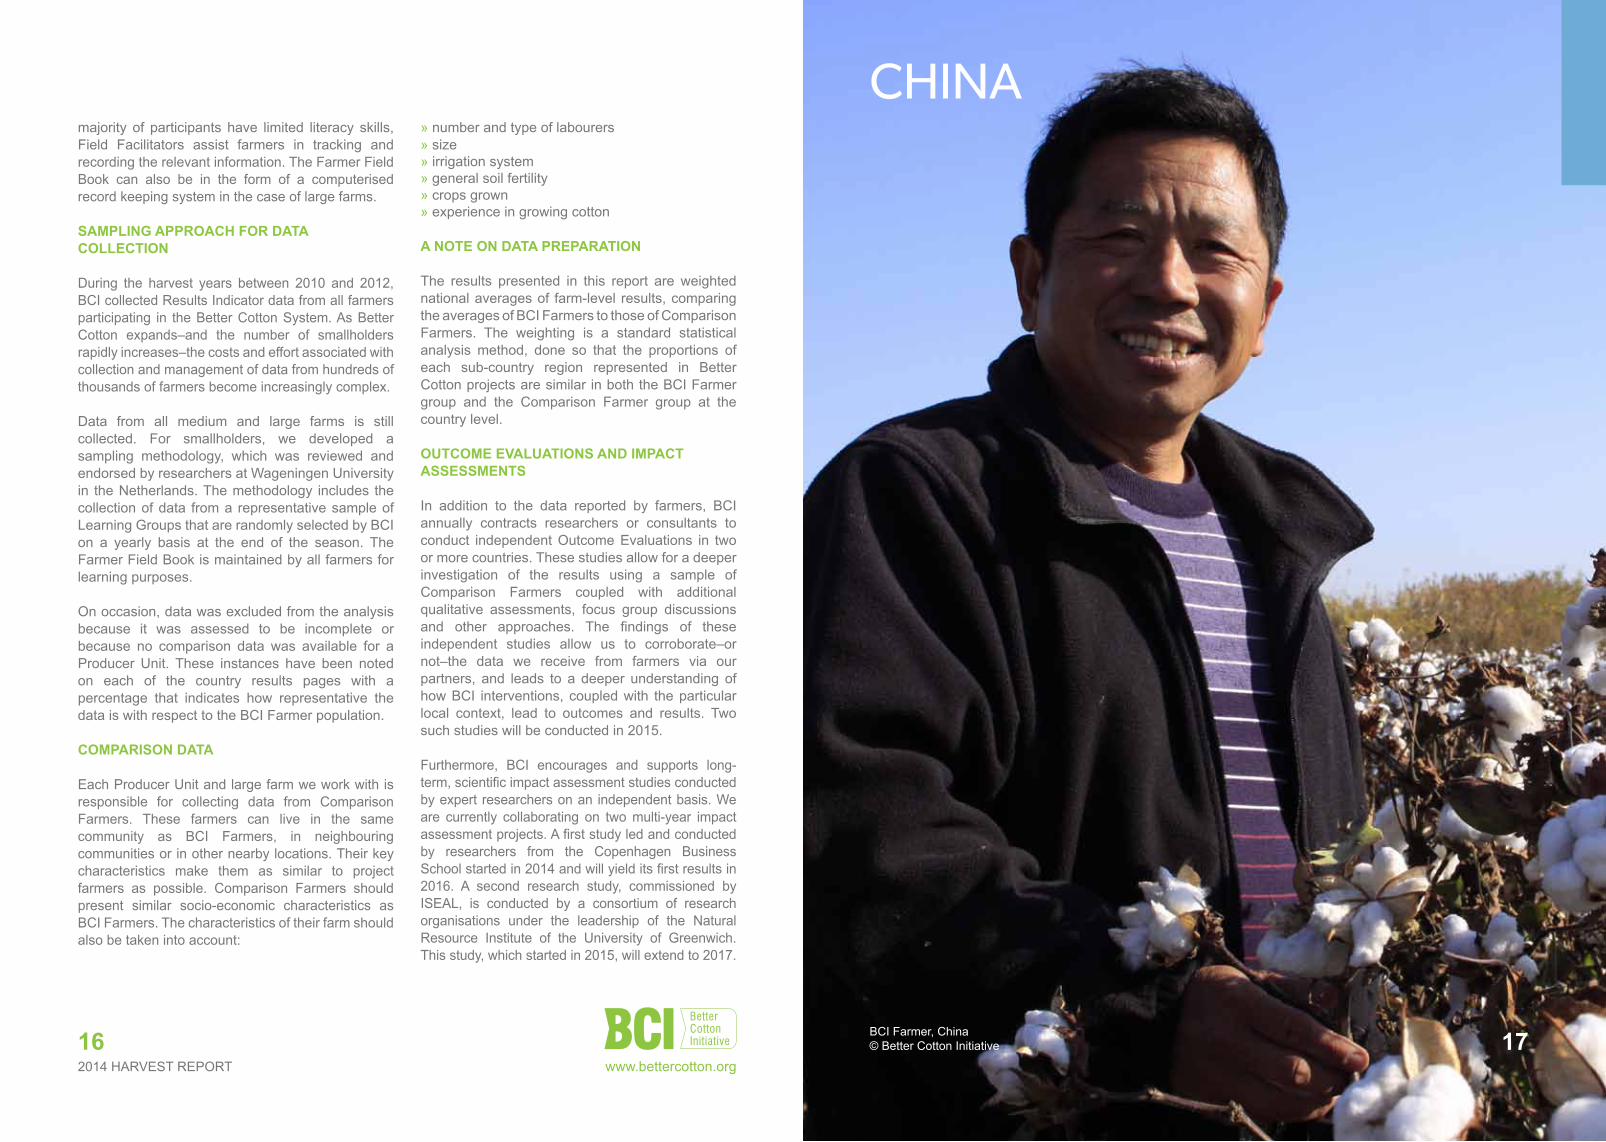
16 17BCI Farmer, China© Better Cotton Initiative
www.bettercotton.org

2014 HARVEST REPORT2014 HARVEST REPORT18
CHINA
JANSowing
MAR – MAYHarvest
SEP – NOV
DEC
orGaNisatioN In 2014, BCi’s implementing Partners worked with 7,028 farmers organised into 10 Producer units and 9 large farms. 6,458 farmers in China earned a Better Cotton licence.
iMPLeMeNtiNG PartNers
Better CottoN ProJeCts Growth
Collection of farmers = Learning Group
ProduCer uNit
Collection of Learning Groups = Producer Unit
19
CHINA
For the last three years, the Chinese government have stockpiled large quantities of cotton with the intention of protecting farmers and the market from international trade and fluctuating prices. This policy was terminated in 2014, although the country still has upwards of 50 million bales of cotton in reserves.* This year, in the Xinjiang province of China, the government piloted a ‘target price programme,’ with the intention of guaranteeing farmers incomes whilst moving away from stockpiling cotton.
In 2014, China was the
world’s largest cotton producer producing around 24% of the world’s cotton.*
Not only is China the world’s largest producer of cotton, it’s the
world’s largest consumer of cotton too.
© Better Cotton Initiative
Shandong
Xinjiang
Hebei
China
61%Advanced
34%Basic
5%Low
BCI Farmers Awareness aboutChild Labour Issues
Yield
Water
Pesticide -16%
-16%
11%
BCI Farmers vs Compari-son Farmers Performance
Organic Fertiliser
Synthetic Fertiliser -10%
276%
BCI Farmers ComparisonFarmers
3491,355
Number of Farmers
Profit 30%
0.0 0.5 1.0 1.5 2.0
BCI Farmers
Comparison Farmers
11%
0%
Yield (Lint Cotton MT/ha)
0K 1K 2K 3K 4K 5K 6K 7K
BCI Farmers
Comparison Farmers
-16%
0%
Water (m3/ha)
0K 2K 4K 6K 8K 10K 12K
BCI Farmers
Comparison Farmers
30%
0%
Profit (per ha)
0.0 0.5 1.0 1.5 2.0 2.5 3.0
BCI Farmers
Comparison Farmers
-16%
0%
Pesticide (kg/ha)
0 200 400 600 800 1000 1200 1400 1600
BCI Farmers
Comparison Farmer
276%
0%
Organic Fertiliser (kg/ha)
0 200 400 600 800 1000 1200 1400 1600
BCI Farmers
Comparison Farmer
-10%
0%
Synthetic Fertiliser (kg/ha)
Harvest Report - China
3rd HARVEST 3rd HARVEST
BCI Farmers Area under Better Cotton
Cultivation (ha)
Better Cotton Production
(MT lint)
2012 2013 2014
6,50
0
54,0
00
121,
000
6,00
0 27,0
00
53,0
00
3,50
0 15,0
00 28,0
00
akesu Jintian Farm Co. LTD.
As a BCI manager and husband, I recognised the
need to raise awareness of women’s status
and influence in our community.
BCI Farmer and PU Manager in China, running
training on empowering women
In the Shandong and Hebei regions, favourable weather conditions enabled farmers to achieve greateryields than the previous season.
(*source ICAC)
(*source ICAC)
www.bettercotton.org www.bettercotton.org
2014 HARVEST REPORT2014 HARVEST REPORT20
CHINA: results
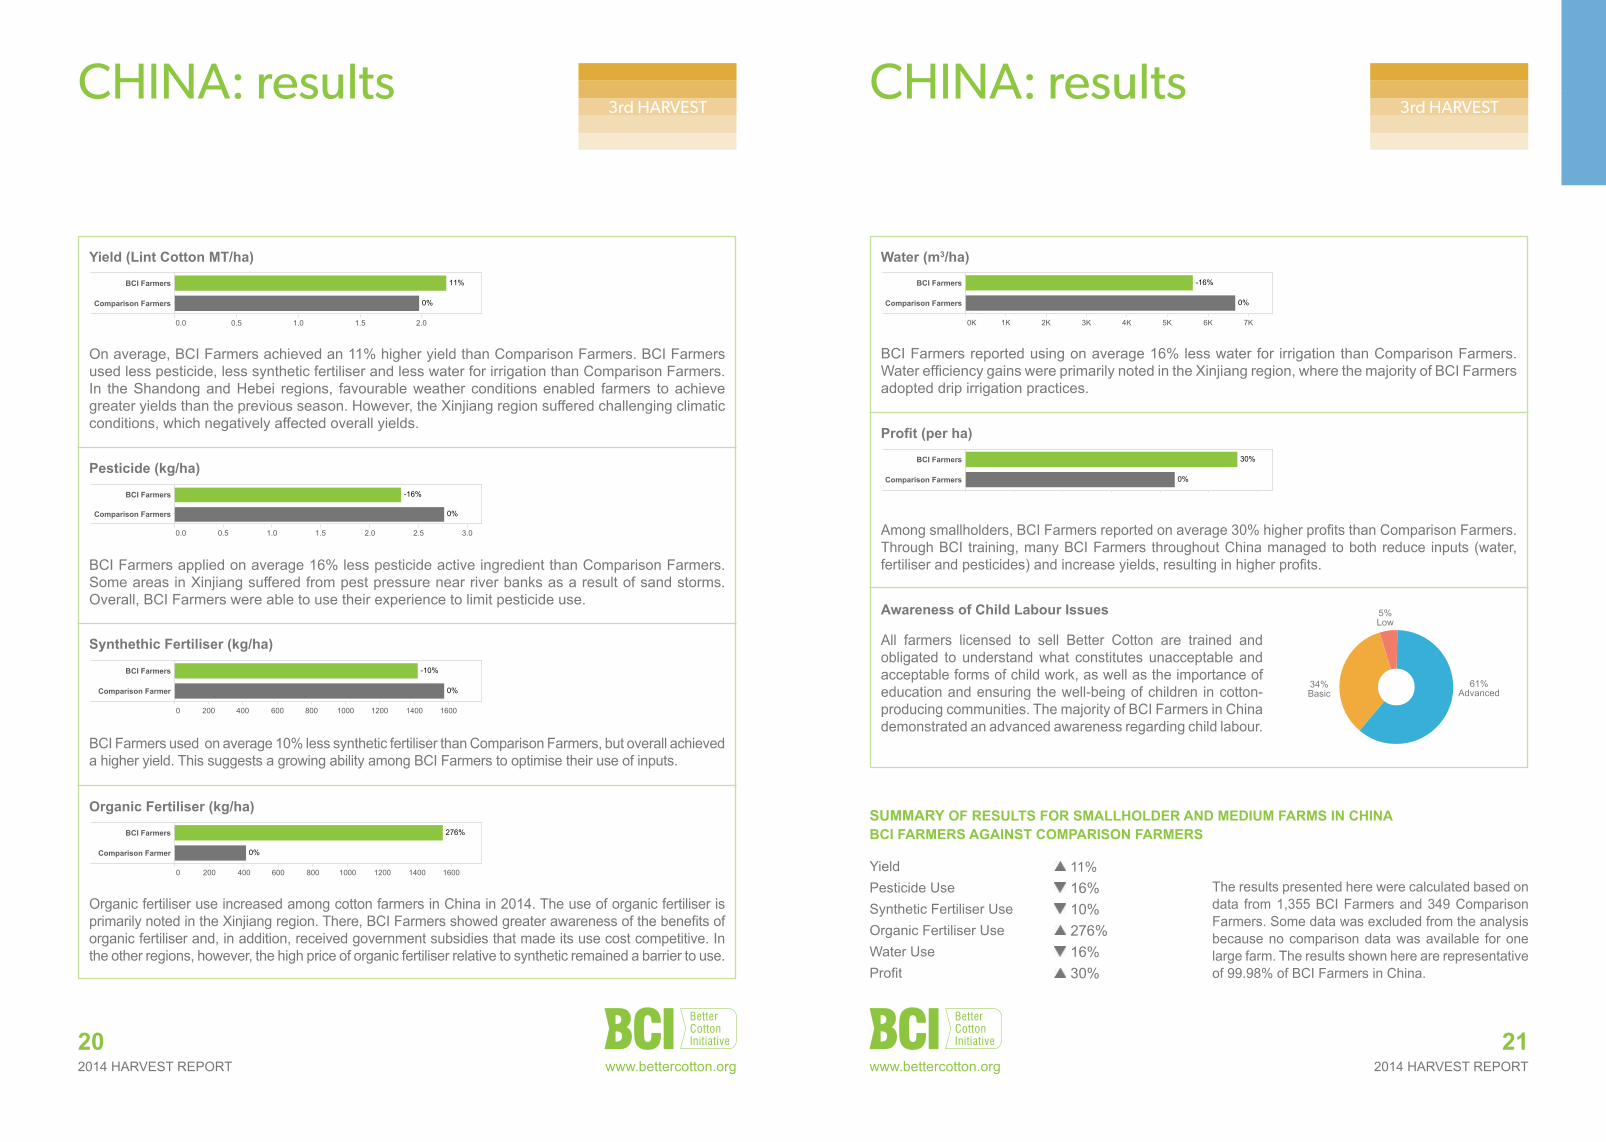
On average, BCI Farmers achieved an 11% higher yield than Comparison Farmers. BCI Farmers used less pesticide, less synthetic fertiliser and less water for irrigation than Comparison Farmers. In the Shandong and Hebei regions, favourable weather conditions enabled farmers to achieve greater yields than the previous season. However, the Xinjiang region suffered challenging climatic conditions, which negatively affected overall yields.
21
CHINA: results
Shandong
Xinjiang
Hebei
China
61%Advanced
34%Basic
5%Low
BCI Farmers Awareness aboutChild Labour Issues
Yield
Water
Pesticide -16%
-16%
11%
BCI Farmers vs Compari-son Farmers Performance
Organic Fertiliser
Synthetic Fertiliser -10%
276%
BCI Farmers ComparisonFarmers
3491,355
Number of Farmers
Profit 30%
0.0 0.5 1.0 1.5 2.0
BCI Farmers
Comparison Farmers
11%
0%
Yield (Lint Cotton MT/ha)
0K 1K 2K 3K 4K 5K 6K 7K
BCI Farmers
Comparison Farmers
-16%
0%
Water (m3/ha)
0K 2K 4K 6K 8K 10K 12K
BCI Farmers
Comparison Farmers
30%
0%
Profit (per ha)
0.0 0.5 1.0 1.5 2.0 2.5 3.0
BCI Farmers
Comparison Farmers
-16%
0%
Pesticide (kg/ha)
0 200 400 600 800 1000 1200 1400 1600
BCI Farmers
Comparison Farmer
276%
0%
Organic Fertiliser (kg/ha)
0 200 400 600 800 1000 1200 1400 1600
BCI Farmers
Comparison Farmer
-10%
0%
Synthetic Fertiliser (kg/ha)
Harvest Report - China
3rd HARVEST 3rd HARVEST
Yield (Lint Cotton Mt/ha)
BCI Farmers applied on average 16% less pesticide active ingredient than Comparison Farmers. Some areas in Xinjiang suffered from pest pressure near river banks as a result of sand storms. Overall, BCI Farmers were able to use their experience to limit pesticide use.
BCI Farmers used on average 10% less synthetic fertiliser than Comparison Farmers, but overall achieved a higher yield. This suggests a growing ability among BCI Farmers to optimise their use of inputs.
Shandong
Xinjiang
Hebei
China
61%Advanced
34%Basic
5%Low
BCI Farmers Awareness aboutChild Labour Issues
Yield
Water
Pesticide -16%
-16%
11%
BCI Farmers vs Compari-son Farmers Performance
Organic Fertiliser
Synthetic Fertiliser -10%
276%
BCI Farmers ComparisonFarmers
3491,355
Number of Farmers
Profit 30%
0.0 0.5 1.0 1.5 2.0
BCI Farmers
Comparison Farmers
11%
0%
Yield (Lint Cotton MT/ha)
0K 1K 2K 3K 4K 5K 6K 7K
BCI Farmers
Comparison Farmers
-16%
0%
Water (m3/ha)
0K 2K 4K 6K 8K 10K 12K
BCI Farmers
Comparison Farmers
30%
0%
Profit (per ha)
0.0 0.5 1.0 1.5 2.0 2.5 3.0
BCI Farmers
Comparison Farmers
-16%
0%
Pesticide (kg/ha)
0 200 400 600 800 1000 1200 1400 1600
BCI Farmers
Comparison Farmer
276%
0%
Organic Fertiliser (kg/ha)
0 200 400 600 800 1000 1200 1400 1600
BCI Farmers
Comparison Farmer
-10%
0%
Synthetic Fertiliser (kg/ha)
Harvest Report - China
Pesticide (kg/ha)
synthethic Fertiliser (kg/ha)Shandong
Xinjiang
Hebei
China
61%Advanced
34%Basic
5%Low
BCI Farmers Awareness aboutChild Labour Issues
Yield
Water
Pesticide -16%
-16%
11%
BCI Farmers vs Compari-son Farmers Performance
Organic Fertiliser
Synthetic Fertiliser -10%
276%
BCI Farmers ComparisonFarmers
3491,355
Number of Farmers
Profit 30%
0.0 0.5 1.0 1.5 2.0
BCI Farmers
Comparison Farmers
11%
0%
Yield (Lint Cotton MT/ha)
0K 1K 2K 3K 4K 5K 6K 7K
BCI Farmers
Comparison Farmers
-16%
0%
Water (m3/ha)
0K 2K 4K 6K 8K 10K 12K
BCI Farmers
Comparison Farmers
30%
0%
Profit (per ha)
0.0 0.5 1.0 1.5 2.0 2.5 3.0
BCI Farmers
Comparison Farmers
-16%
0%
Pesticide (kg/ha)
0 200 400 600 800 1000 1200 1400 1600
BCI Farmers
Comparison Farmer
276%
0%
Organic Fertiliser (kg/ha)
0 200 400 600 800 1000 1200 1400 1600
BCI Farmers
Comparison Farmer
-10%
0%
Synthetic Fertiliser (kg/ha)
Harvest Report - China
Organic fertiliser use increased among cotton farmers in China in 2014. The use of organic fertiliser is primarily noted in the Xinjiang region. There, BCI Farmers showed greater awareness of the benefits of organic fertiliser and, in addition, received government subsidies that made its use cost competitive. In the other regions, however, the high price of organic fertiliser relative to synthetic remained a barrier to use.
organic Fertiliser (kg/ha) suMMarY oF resuLts For sMaLLhoLder aNd MediuM FarMs iN ChiNa BCi FarMers aGaiNst CoMParisoN FarMers
Yield 11%Pesticide Use 16%Synthetic Fertiliser Use 10%Organic Fertiliser Use 276%Water Use 16%Profit 30%
The results presented here were calculated based on data from 1,355 BCI Farmers and 349 Comparison Farmers. Some data was excluded from the analysis because no comparison data was available for one large farm. The results shown here are representative of 99.98% of BCI Farmers in China.
BCI Farmers reported using on average 16% less water for irrigation than Comparison Farmers. Water efficiency gains were primarily noted in the Xinjiang region, where the majority of BCI Farmers adopted drip irrigation practices.
Among smallholders, BCI Farmers reported on average 30% higher profits than Comparison Farmers. Through BCI training, many BCI Farmers throughout China managed to both reduce inputs (water, fertiliser and pesticides) and increase yields, resulting in higher profits.
All farmers licensed to sell Better Cotton are trained and obligated to understand what constitutes unacceptable and acceptable forms of child work, as well as the importance of education and ensuring the well-being of children in cotton-producing communities. The majority of BCI Farmers in China demonstrated an advanced awareness regarding child labour.
water (m3/ha)
Profit (per ha)
awareness of Child Labour issues
China India Pakistan Tajikistan Turkey Mali Mozambique
5%Low
34%Basic
61%Advanced
www.bettercotton.org www.bettercotton.org

2014 HARVEST REPORT
INDIA
23Training, India© Better Cotton Initiative22
Managing chemical use in China is resulting in strengthened ecosystems and the return of native species to agricultural land.
The Yellow River alluvial plain is home to a 5,000 year old civilisation and is a traditional farming region in eastern China. Cotton grows well in the area’s alkaline soil, and as a major commercial crop, it’s an important source of revenue for local farmers. In recent decades, the overuse of commercial fertilisers contributed to soil depletion and negatively impacted the area’s ecosystem. BCI Implementing Partner, Huitong, trained local farmer Mr Wang Jianjun and others to grow cotton while caring for the health of the soil and protecting native plants and animals. After BCI training, Mr Wang Jianjun abandoned highly toxic pesticides and began applying natural fertiliser. He soon noticed soil conditions improve with earthworms and birds returning to his farm. For two years now, larks have lived on Mr Wang Jianjun’s farm building nests in his cotton field.
“BCI trained farmers to test the soil and save water in temporary channels. We also learned to plant trees as habitat for birds and beneficial insects,” said Mr Wang Jianjun.
The BCI Standard helped Mr Wang Jianjun cut the use of costly and dangerous chemicals while repairing the natural ecosystem. Systematic training has helped improve management practices in the region throughout the pre-season, growing and harvest seasons. Thanks to these efforts, traditional farming communities in the Yellow River alluvial plain are enjoying the return of native species like the lark.
The BCI Implementing Partner invited experts to improve our farming in a scientific way. Mr Wang Jianjun, BCI Farmer in China.
“”
© Better Cotton Initiative
www.bettercotton.org
2014 HARVEST REPORT2014 HARVEST REPORT24
INDIA
JANHarvest
OCT – FEB
DEC
iMPLeMeNtiNG PartNers
Growth
SowingMAY – SEP
HarvestOCT – FEB
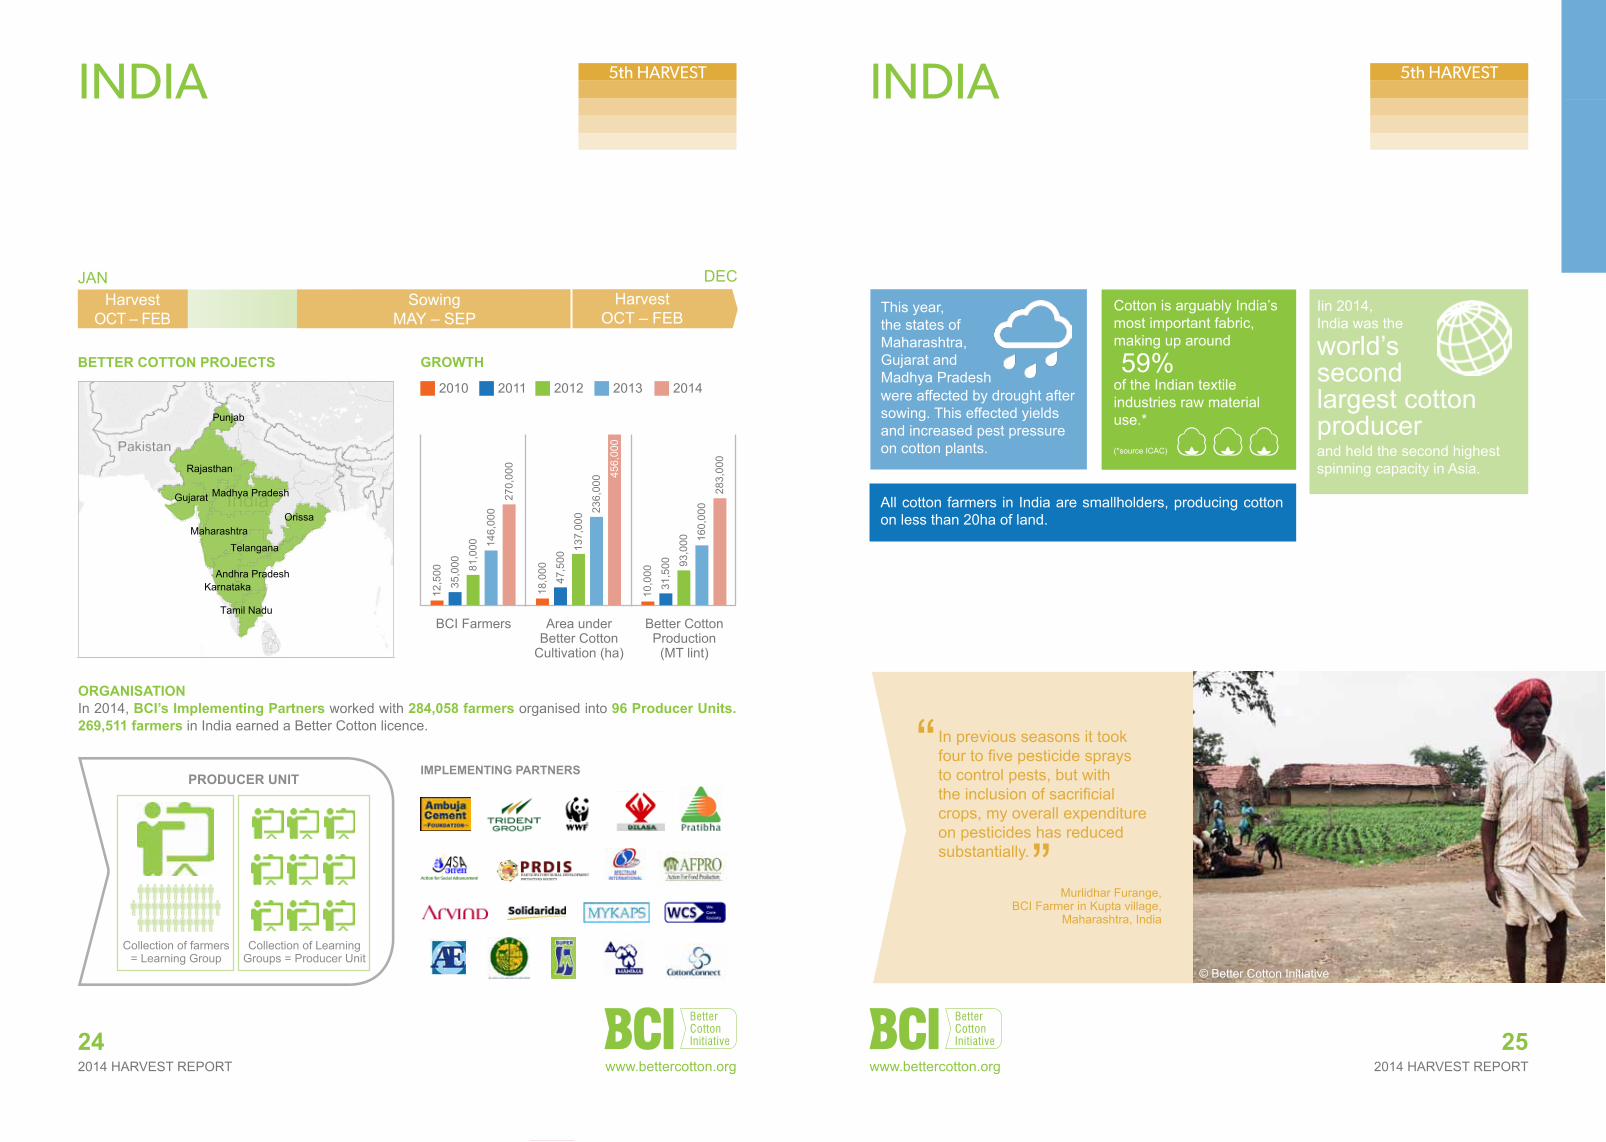
orGaNisatioN In 2014, BCi’s implementing Partners worked with 284,058 farmers organised into 96 Producer units. 269,511 farmers in India earned a Better Cotton licence.
25
INDIA
This year, the states of Maharashtra, Gujarat and Madhya Pradesh
All cotton farmers in India are smallholders, producing cotton on less than 20ha of land.
© Better Cotton Initiative
Iin 2014, India was the
world’s second largest cotton producerand held the second highest spinning capacity in Asia.
5th HARVEST 5th HARVEST
In previous seasons it took four to five pesticide sprays to control pests, but with the inclusion of sacrificial crops, my overall expenditure on pesticides has reduced substantially.
Murlidhar Furange, BCI Farmer in Kupta village,
Maharashtra, India
“
”Collection of farmers
= Learning Group
ProduCer uNit
Collection of Learning Groups = Producer Unit
Madhya Pradesh
Andhra Pradesh
Maharashtra
Tamil Nadu
Telangana
Karnataka
Rajasthan
Gujarat
Punjab
Orissa
India
55%Advanced33%
Basic
12%Low
BCI Farmers Awareness aboutChild Labour Issues
Yield
Water
Profit
Pesticide -20%
32%
-5%
10%
BCI Farmers vs Com-parison Farmers Perfor-mance
Organic Fertiliser
Synthetic Fertiliser -35%
73%
BCI Farmers ComparisonFarmers
7,19623,769
Number of Farmers
0.0 0.1 0.2 0.3 0.4 0.5 0.6 0.7
BCI Farmers
Comparison Farmers
10%
0%
Yield (Lint Cotton MT/ha)
0 500 1000 1500 2000 2500 3000 3500
BCI Farmers
Comparison Farmers
-5%
0%
Water (m3/ha)
0K 5K 10K 15K 20K 25K 30K 35K 40K 45K
BCI Farmers
Comparison Farmers
32%
0%
Profit (per ha)
0.0 0.2 0.4 0.6 0.8 1.0 1.2 1.4 1.6 1.8
BCI Farmers
Comparison Farmers
-20%
0%
Pesticide (kg/ha)
0 100 200 300 400 500 600 700 800 900 1000
BCI Farmers
Comparison Farmers
73%
0%
Organic Fertiliser (kg/ha)
0 100 200 300 400 500
BCI Farmers
Comparison Farmers
-35%
0%
Synthetic Fertiliser (kg/ha)
Harvest Report - IndiaBetter CottoN ProJeCts
BCI Farmers Area under Better Cotton
Cultivation (ha)
Better Cotton Production
(MT lint)
146,
000
270,
000
35,0
00 81,0
00
12,5
00
236,
000
47,5
00
137,
000
18,0
00
160,
000
283,
000
31,5
00 93,0
00
10,0
00
201220112010 2013 2014
456,
000
were affected by drought after sowing. This effected yields and increased pest pressure on cotton plants.
Cotton is arguably India’s most important fabric, making up around
59% of the Indian textile industries raw material use.*
(*source ICAC)
www.bettercotton.org www.bettercotton.org
2014 HARVEST REPORT2014 HARVEST REPORT26
INDIA: results
27
INDIA: results
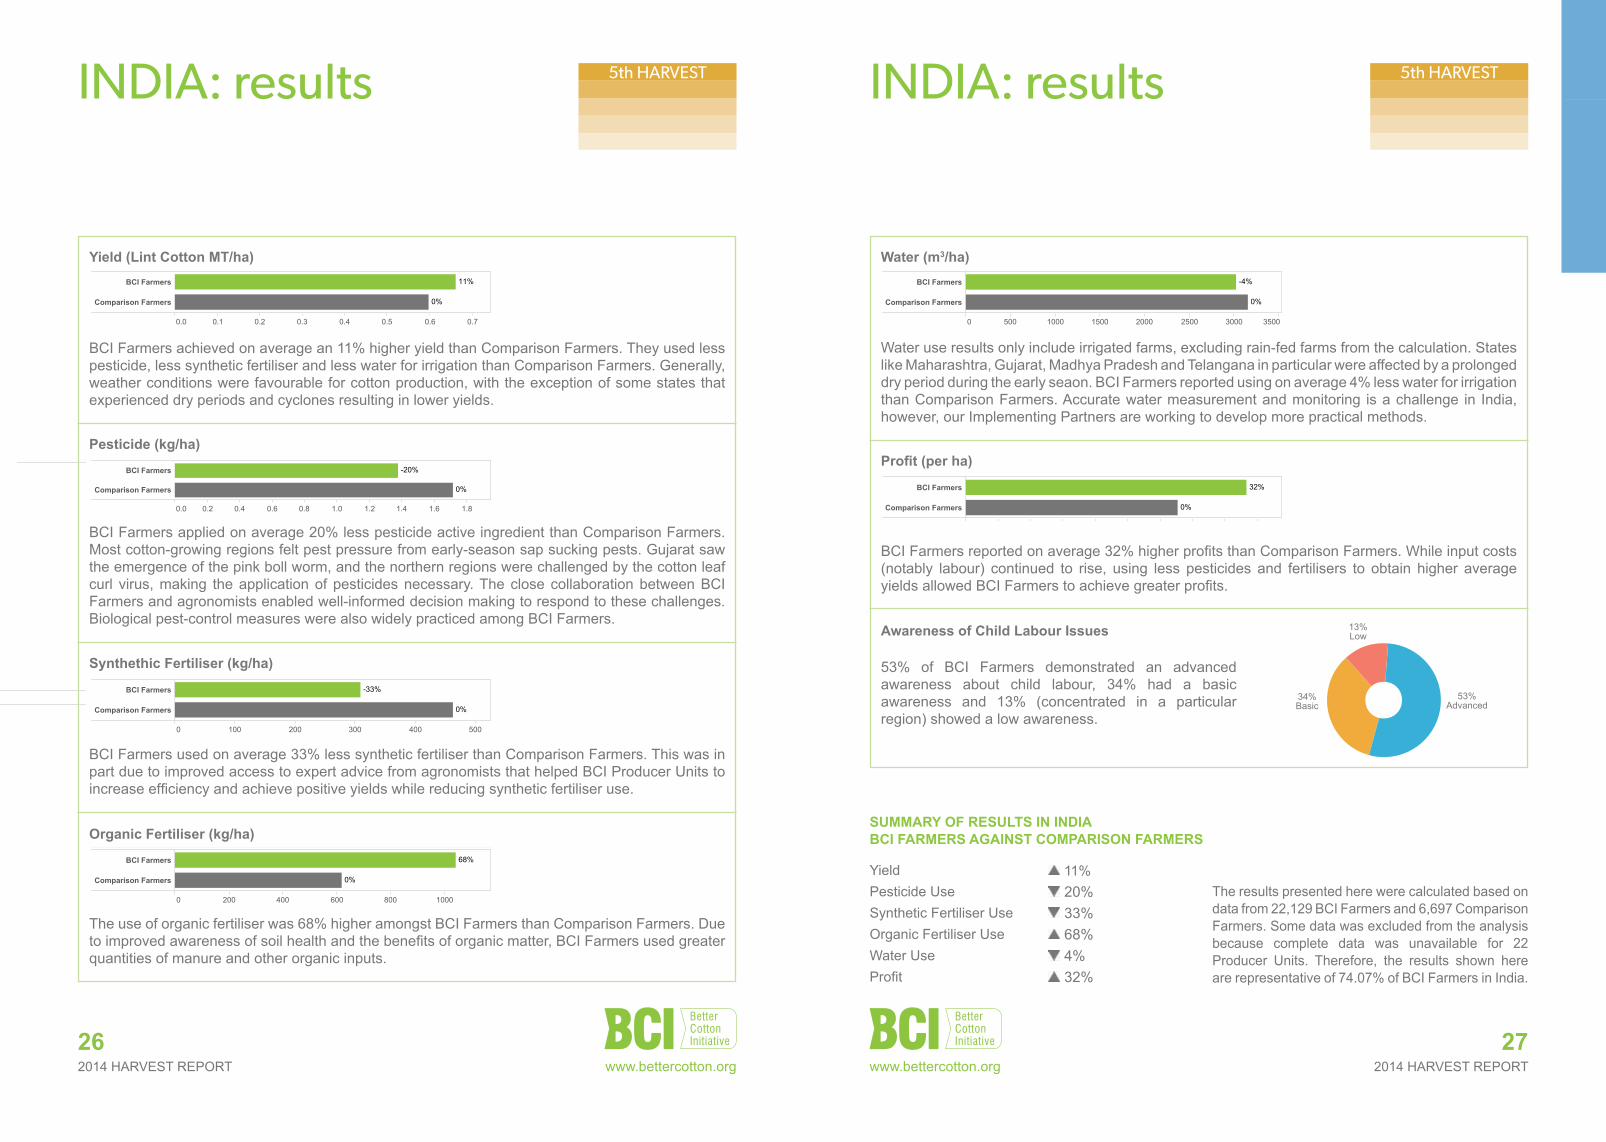
suMMarY oF resuLts iN iNdiaBCi FarMers aGaiNst CoMParisoN FarMers
Yield 11%Pesticide Use 20%Synthetic Fertiliser Use 33%Organic Fertiliser Use 68%Water Use 4%Profit 32%
The results presented here were calculated based on data from 22,129 BCI Farmers and 6,697 Comparison Farmers. Some data was excluded from the analysis because complete data was unavailable for 22 Producer Units. Therefore, the results shown here are representative of 74.07% of BCI Farmers in India.
5th HARVEST 5th HARVEST
BCI Farmers achieved on average an 11% higher yield than Comparison Farmers. They used less pesticide, less synthetic fertiliser and less water for irrigation than Comparison Farmers. Generally, weather conditions were favourable for cotton production, with the exception of some states that experienced dry periods and cyclones resulting in lower yields.
Yield (Lint Cotton Mt/ha)
Madhya Pradesh
Andhra Pradesh
Maharashtra
Tamil Nadu
Telangana
Karnataka
Rajasthan
Gujarat
Punjab
Orissa
India
53%Advanced34%
Basic
13%Low
BCI Farmers Awareness aboutChild Labour Issues
Yield
Water
Profit
Pesticide -20%
32%
-4%
11%
BCI Farmers vs Com-parison Farmers Perfor-mance
Organic Fertiliser
Synthetic Fertiliser -33%
68%
BCI Farmers ComparisonFarmers
6,69722,128
Number of Farmers
0.0 0.1 0.2 0.3 0.4 0.5 0.6 0.7
BCI Farmers
Comparison Farmers
11%
0%
Yield (Lint Cotton MT/ha)
0 500 1000 1500 2000 2500 3000 3500
BCI Farmers
Comparison Farmers
-4%
0%
Water (m3/ha)
0K 5K 10K 15K 20K 25K 30K 35K 40K 45K
BCI Farmers
Comparison Farmers
32%
0%
Profit (per ha)
0.0 0.2 0.4 0.6 0.8 1.0 1.2 1.4 1.6 1.8
BCI Farmers
Comparison Farmers
-20%
0%
Pesticide (kg/ha)
0 200 400 600 800 1000
BCI Farmers
Comparison Farmers
68%
0%
Organic Fertiliser (kg/ha)
0 100 200 300 400 500
BCI Farmers
Comparison Farmers
-33%
0%
Synthetic Fertiliser (kg/ha)
Harvest Report - India
Water use results only include irrigated farms, excluding rain-fed farms from the calculation. States like Maharashtra, Gujarat, Madhya Pradesh and Telangana in particular were affected by a prolonged dry period during the early seaon. BCI Farmers reported using on average 4% less water for irrigation than Comparison Farmers. Accurate water measurement and monitoring is a challenge in India, however, our Implementing Partners are working to develop more practical methods.
water (m3/ha)
Madhya Pradesh
Andhra Pradesh
Maharashtra
Tamil Nadu
Telangana
Karnataka
Rajasthan
Gujarat
Punjab
Orissa
India
53%Advanced34%
Basic
13%Low
BCI Farmers Awareness aboutChild Labour Issues
Yield
Water
Profit
Pesticide -20%
32%
-4%
11%
BCI Farmers vs Com-parison Farmers Perfor-mance
Organic Fertiliser
Synthetic Fertiliser -33%
68%
BCI Farmers ComparisonFarmers
6,69722,128
Number of Farmers
0.0 0.1 0.2 0.3 0.4 0.5 0.6 0.7
BCI Farmers
Comparison Farmers
11%
0%
Yield (Lint Cotton MT/ha)
0 500 1000 1500 2000 2500 3000 3500
BCI Farmers
Comparison Farmers
-4%
0%
Water (m3/ha)
0K 5K 10K 15K 20K 25K 30K 35K 40K 45K
BCI Farmers
Comparison Farmers
32%
0%
Profit (per ha)
0.0 0.2 0.4 0.6 0.8 1.0 1.2 1.4 1.6 1.8
BCI Farmers
Comparison Farmers
-20%
0%
Pesticide (kg/ha)
0 200 400 600 800 1000
BCI Farmers
Comparison Farmers
68%
0%
Organic Fertiliser (kg/ha)
0 100 200 300 400 500
BCI Farmers
Comparison Farmers
-33%
0%
Synthetic Fertiliser (kg/ha)
Harvest Report - India
BCI Farmers reported on average 32% higher profits than Comparison Farmers. While input costs (notably labour) continued to rise, using less pesticides and fertilisers to obtain higher average yields allowed BCI Farmers to achieve greater profits.
53% of BCI Farmers demonstrated an advanced awareness about child labour, 34% had a basic awareness and 13% (concentrated in a particular region) showed a low awareness.
Profit (per ha)
awareness of Child Labour issues
China India Pakistan Tajikistan Turkey Mali Mozambique
13%Low
34%Basic
53%Advanced
Pesticide (kg/ha)
Madhya Pradesh
Andhra Pradesh
Maharashtra
Tamil Nadu
Telangana
Karnataka
Rajasthan
Gujarat
Punjab
Orissa
India
53%Advanced34%
Basic
13%Low
BCI Farmers Awareness aboutChild Labour Issues
Yield
Water
Profit
Pesticide -20%
32%
-4%
11%
BCI Farmers vs Com-parison Farmers Perfor-mance
Organic Fertiliser
Synthetic Fertiliser -33%
68%
BCI Farmers ComparisonFarmers
6,69722,128
Number of Farmers
0.0 0.1 0.2 0.3 0.4 0.5 0.6 0.7
BCI Farmers
Comparison Farmers
11%
0%
Yield (Lint Cotton MT/ha)
0 500 1000 1500 2000 2500 3000 3500
BCI Farmers
Comparison Farmers
-4%
0%
Water (m3/ha)
0K 5K 10K 15K 20K 25K 30K 35K 40K 45K
BCI Farmers
Comparison Farmers
32%
0%
Profit (per ha)
0.0 0.2 0.4 0.6 0.8 1.0 1.2 1.4 1.6 1.8
BCI Farmers
Comparison Farmers
-20%
0%
Pesticide (kg/ha)
0 200 400 600 800 1000
BCI Farmers
Comparison Farmers
68%
0%
Organic Fertiliser (kg/ha)
0 100 200 300 400 500
BCI Farmers
Comparison Farmers
-33%
0%
Synthetic Fertiliser (kg/ha)
Harvest Report - India
BCI Farmers applied on average 20% less pesticide active ingredient than Comparison Farmers. Most cotton-growing regions felt pest pressure from early-season sap sucking pests. Gujarat saw the emergence of the pink boll worm, and the northern regions were challenged by the cotton leaf curl virus, making the application of pesticides necessary. The close collaboration between BCI Farmers and agronomists enabled well-informed decision making to respond to these challenges. Biological pest-control measures were also widely practiced among BCI Farmers.
The use of organic fertiliser was 68% higher amongst BCI Farmers than Comparison Farmers. Due to improved awareness of soil health and the benefits of organic matter, BCI Farmers used greater quantities of manure and other organic inputs.
organic Fertiliser (kg/ha)
Madhya Pradesh
Andhra Pradesh
Maharashtra
Tamil Nadu
Telangana
Karnataka
Rajasthan
Gujarat
Punjab
Orissa
India
53%Advanced34%
Basic
13%Low
BCI Farmers Awareness aboutChild Labour Issues
Yield
Water
Profit
Pesticide -20%
32%
-4%
11%
BCI Farmers vs Com-parison Farmers Perfor-mance
Organic Fertiliser
Synthetic Fertiliser -33%
68%
BCI Farmers ComparisonFarmers
6,69722,128
Number of Farmers
0.0 0.1 0.2 0.3 0.4 0.5 0.6 0.7
BCI Farmers
Comparison Farmers
11%
0%
Yield (Lint Cotton MT/ha)
0 500 1000 1500 2000 2500 3000 3500
BCI Farmers
Comparison Farmers
-4%
0%
Water (m3/ha)
0K 5K 10K 15K 20K 25K 30K 35K 40K 45K
BCI Farmers
Comparison Farmers
32%
0%
Profit (per ha)
0.0 0.2 0.4 0.6 0.8 1.0 1.2 1.4 1.6 1.8
BCI Farmers
Comparison Farmers
-20%
0%
Pesticide (kg/ha)
0 200 400 600 800 1000
BCI Farmers
Comparison Farmers
68%
0%
Organic Fertiliser (kg/ha)
0 100 200 300 400 500
BCI Farmers
Comparison Farmers
-33%
0%
Synthetic Fertiliser (kg/ha)
Harvest Report - India
synthethic Fertiliser (kg/ha)
Madhya Pradesh
Andhra Pradesh
Maharashtra
Tamil Nadu
Telangana
Karnataka
Rajasthan
Gujarat
Punjab
Orissa
India
53%Advanced34%
Basic
13%Low
BCI Farmers Awareness aboutChild Labour Issues
Yield
Water
Profit
Pesticide -20%
32%
-4%
11%
BCI Farmers vs Com-parison Farmers Perfor-mance
Organic Fertiliser
Synthetic Fertiliser -33%
68%
BCI Farmers ComparisonFarmers
6,69722,128
Number of Farmers
0.0 0.1 0.2 0.3 0.4 0.5 0.6 0.7
BCI Farmers
Comparison Farmers
11%
0%
Yield (Lint Cotton MT/ha)
0 500 1000 1500 2000 2500 3000 3500
BCI Farmers
Comparison Farmers
-4%
0%
Water (m3/ha)
0K 5K 10K 15K 20K 25K 30K 35K 40K 45K
BCI Farmers
Comparison Farmers
32%
0%
Profit (per ha)
0.0 0.2 0.4 0.6 0.8 1.0 1.2 1.4 1.6 1.8
BCI Farmers
Comparison Farmers
-20%
0%
Pesticide (kg/ha)
0 200 400 600 800 1000
BCI Farmers
Comparison Farmers
68%
0%
Organic Fertiliser (kg/ha)
0 100 200 300 400 500
BCI Farmers
Comparison Farmers
-33%
0%
Synthetic Fertiliser (kg/ha)
Harvest Report - India
BCI Farmers used on average 33% less synthetic fertiliser than Comparison Farmers. This was in part due to improved access to expert advice from agronomists that helped BCI Producer Units to increase efficiency and achieve positive yields while reducing synthetic fertiliser use.
www.bettercotton.org www.bettercotton.org
www.bettercotton.org 2014 HARVEST REPORT28 29
PAKISTAN
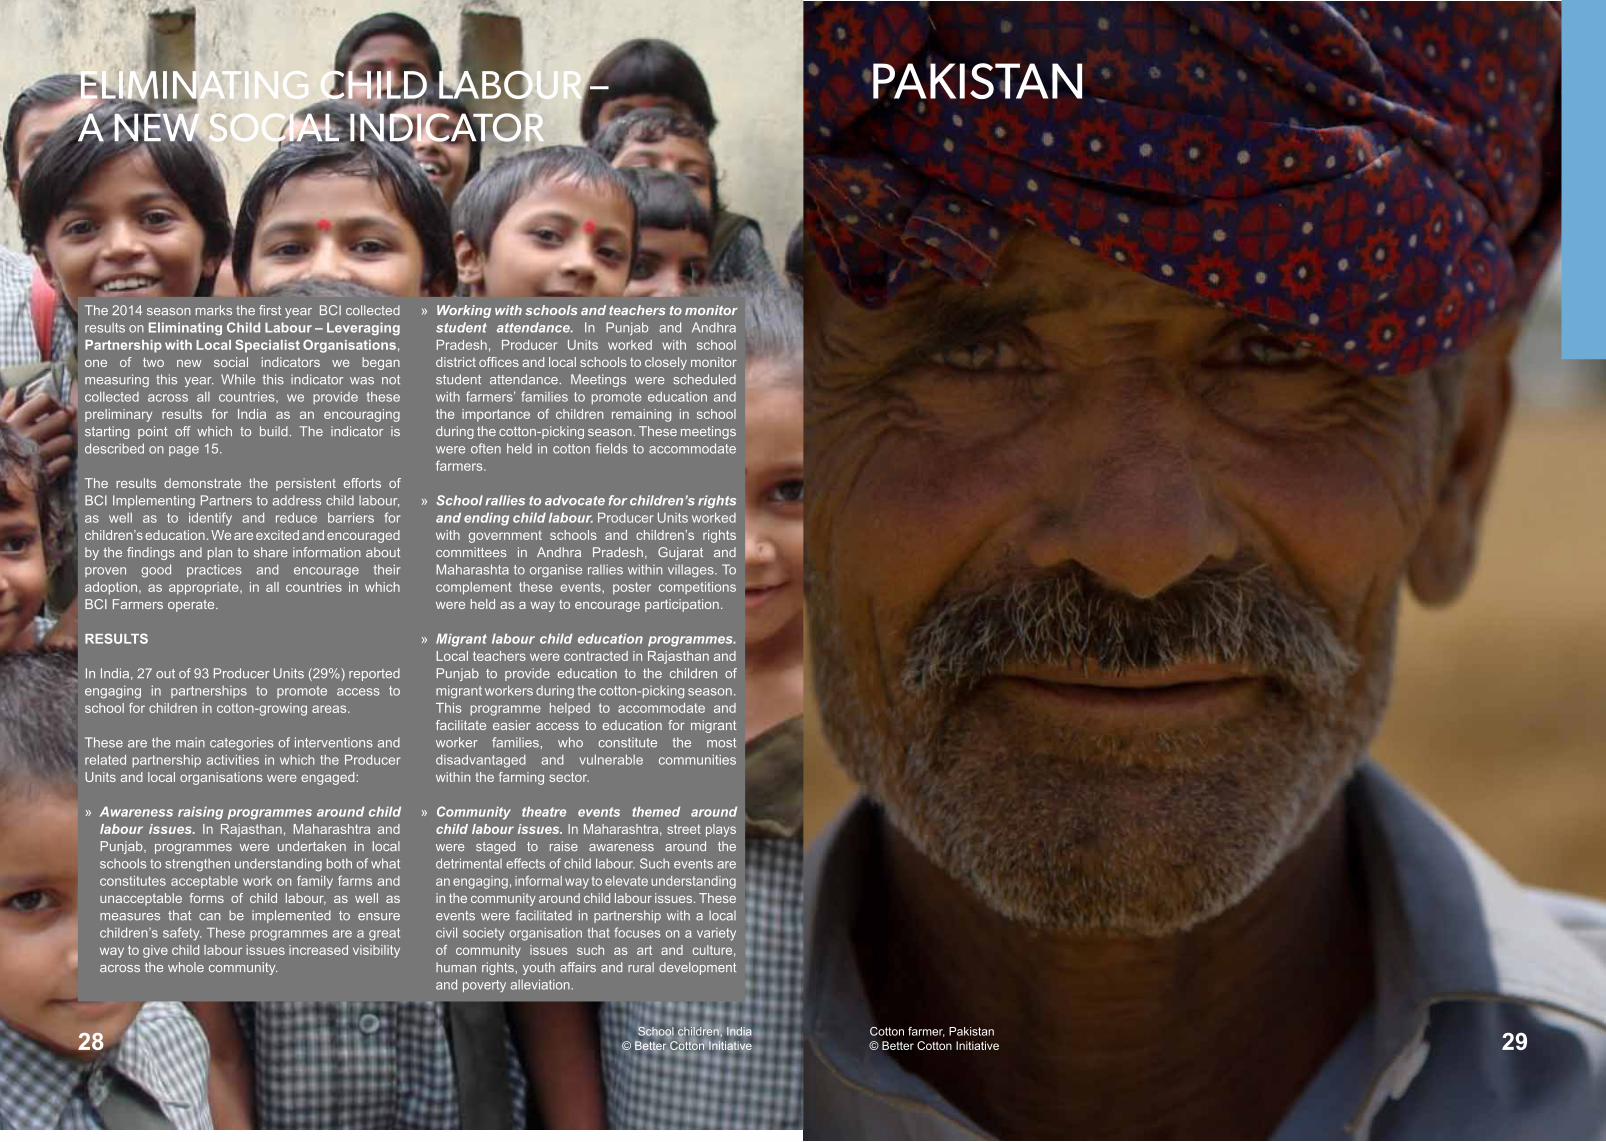
Cotton farmer, Pakistan © Better Cotton Initiative
School children, India © Better Cotton Initiative
ELIMINATING CHILD LABOUR – A NEW SOCIAL INDICATOR
The 2014 season marks the first year BCI collected results on eliminating Child Labour – Leveraging Partnership with Local specialist organisations, one of two new social indicators we began measuring this year. While this indicator was not collected across all countries, we provide these preliminary results for India as an encouraging starting point off which to build. The indicator is described on page 15.
The results demonstrate the persistent efforts of BCI Implementing Partners to address child labour, as well as to identify and reduce barriers for children’s education. We are excited and encouraged by the findings and plan to share information about proven good practices and encourage their adoption, as appropriate, in all countries in which BCI Farmers operate.
resuLts
In India, 27 out of 93 Producer Units (29%) reported engaging in partnerships to promote access to school for children in cotton-growing areas.
These are the main categories of interventions and related partnership activities in which the Producer Units and local organisations were engaged:
» Awareness raising programmes around child labour issues. In Rajasthan, Maharashtra and Punjab, programmes were undertaken in local schools to strengthen understanding both of what constitutes acceptable work on family farms and unacceptable forms of child labour, as well as measures that can be implemented to ensure children’s safety. These programmes are a great way to give child labour issues increased visibility across the whole community.
» Working with schools and teachers to monitor student attendance. In Punjab and Andhra Pradesh, Producer Units worked with school district offices and local schools to closely monitor student attendance. Meetings were scheduled with farmers’ families to promote education and the importance of children remaining in school during the cotton-picking season. These meetings were often held in cotton fields to accommodate farmers.
» School rallies to advocate for children’s rights and ending child labour. Producer Units worked with government schools and children’s rights committees in Andhra Pradesh, Gujarat and Maharashta to organise rallies within villages. To complement these events, poster competitions were held as a way to encourage participation.
» Migrant labour child education programmes. Local teachers were contracted in Rajasthan and Punjab to provide education to the children of migrant workers during the cotton-picking season. This programme helped to accommodate and facilitate easier access to education for migrant worker families, who constitute the most disadvantaged and vulnerable communities within the farming sector.
» Community theatre events themed around child labour issues. In Maharashtra, street plays were staged to raise awareness around the detrimental effects of child labour. Such events are an engaging, informal way to elevate understanding in the community around child labour issues. These events were facilitated in partnership with a local civil society organisation that focuses on a variety of community issues such as art and culture, human rights, youth affairs and rural development and poverty alleviation.
2014 HARVEST REPORT2014 HARVEST REPORT30
PAKISTAN
JANHarvest
JULY – DEC
DEC
iMPLeMeNtiNG PartNers
Better CottoN ProJeCts Growth
SowingMAR – JUN
31
PAKISTAN
The
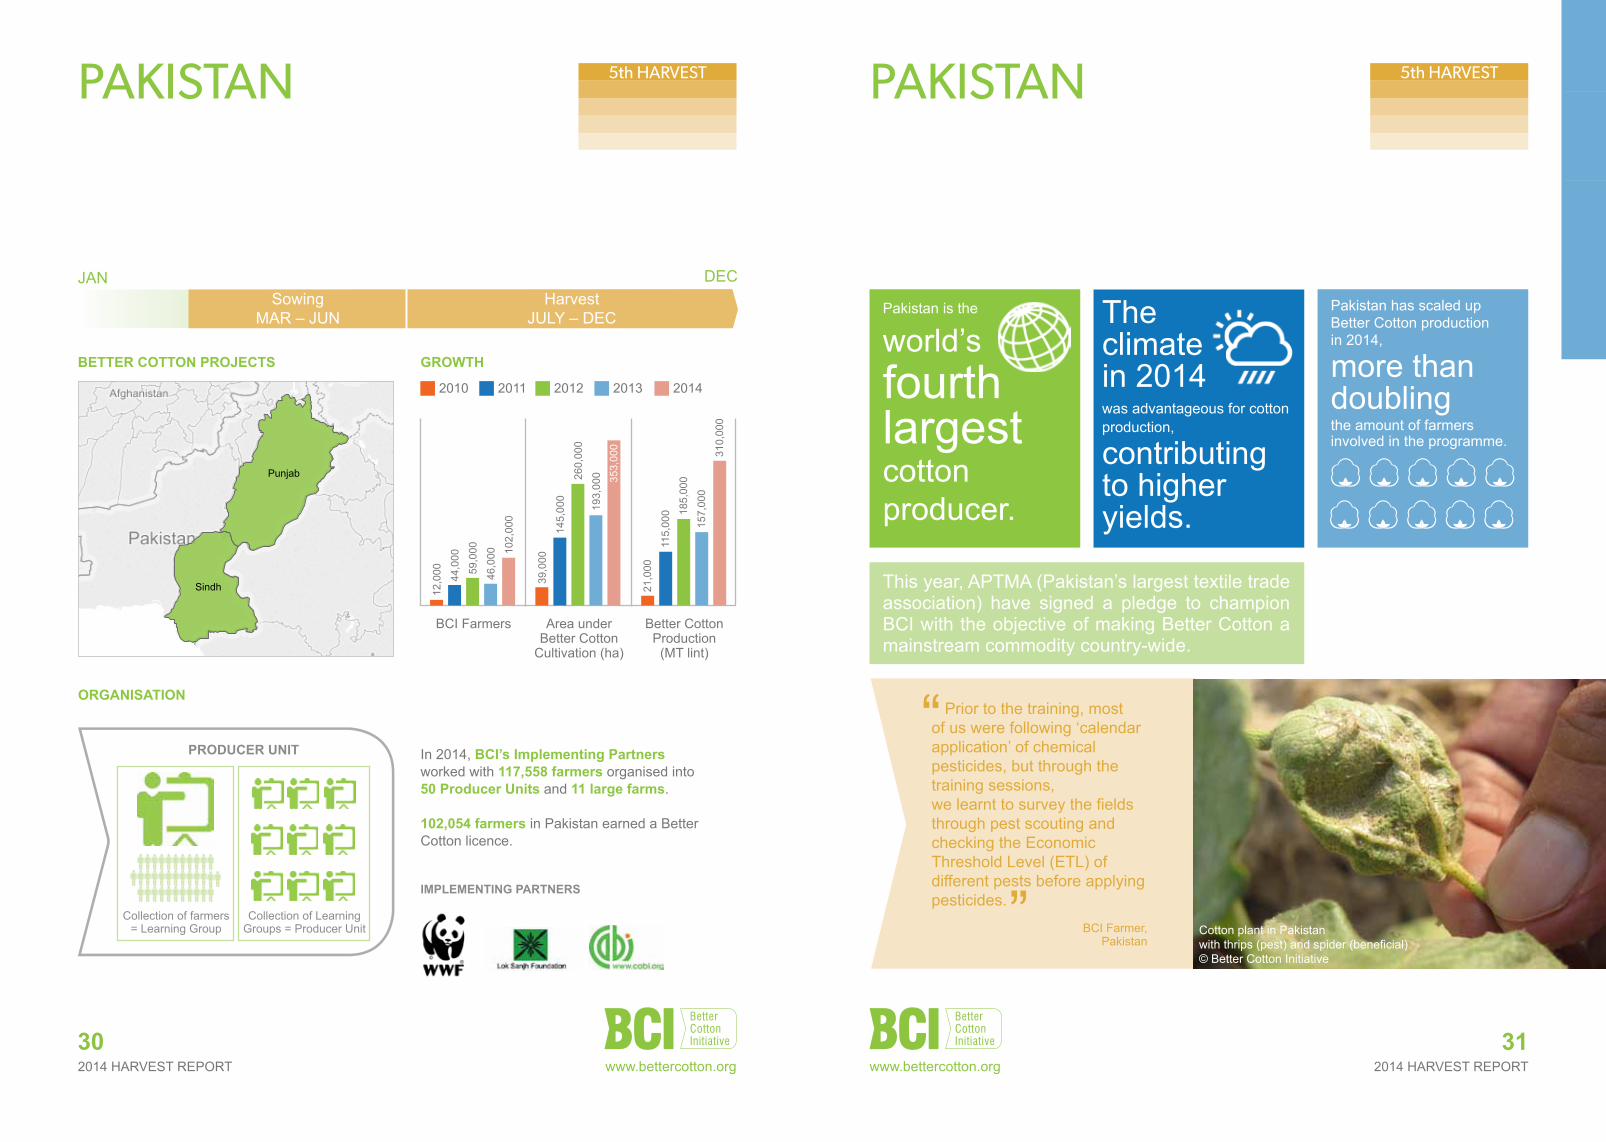
climate in 2014
was advantageous for cotton production,
contributing to higher yields.
Pakistan is the
world’s fourth largest cotton producer.
Pakistan has scaled up Better Cotton production in 2014,
more than doubling the amount of farmers involved in the programme.
5th HARVEST 5th HARVEST
Collection of farmers = Learning Group
ProduCer uNit
Collection of Learning Groups = Producer Unit
Punjab
Sindh
Pakistan
71%Advanced
28%Basic
1%Low
BCI Farmers Awareness aboutChild Labour Issues
Yield
Water Use
Profit
Pesticide -15%
46%
-18%
9%
BCI Farmers vs Com-parison Farmers Perfor-mance
Organic Fertiliser
Synthetic Fertiliser -19%
87%
BCI Farmers ComparisonFarmers3,50012,284
Number of Farmers
0.0 0.2 0.4 0.6 0.8
BCI Farmers
Comparison Farmers
9%
0%
Yield (Lint Cotton MT/ha)
0 500 1000 1500 2000 2500 3000 3500 4000 4500 5000
BCI Farmers
Comparison Farmers
-18%
0%
Water (m3/ha)
0K 10K 20K 30K 40K 50K 60K 70K 80K 90K
BCI Farmers
Comparison Farmers
46%
0%
Profit (per ha)
0.0 0.5 1.0 1.5 2.0 2.5
BCI Farmers
Comparison Farmers
-15%
0%
Pesticide (kg/ha)
0 50 100 150 200 250 300
BCI Farmer
Comparison Farmer
87%
0%
Organic Fertiliser (kg/ha)
0 100 200 300 400 500 600
BCI Farmer
Comparison Farmer
-19%
0%
Synthetic Fertiliser (kg/ha)
Harvest Report - Pakistan
orGaNisatioN
In 2014, BCi’s implementing Partners worked with 117,558 farmers organised into 50 Producer units and 11 large farms.
102,054 farmers in Pakistan earned a Better Cotton licence.
BCI Farmers Area under Better Cotton
Cultivation (ha)
Better Cotton Production
(MT lint)
46,0
00 102,
000
44,0
00
59,0
00
12,0
00
193,
000
145,
000
260,
000
39,0
00
157,
000
310,
000
115,
000 18
5,00
0
21,0
00
201220112010 2013 2014
353,
000
Cotton plant in Pakistan with thrips (pest) and spider (beneficial) © Better Cotton Initiative
Prior to the training, most of us were following ‘calendar application’ of chemical pesticides, but through the training sessions, we learnt to survey the fields through pest scouting and checking the Economic Threshold Level (ETL) of different pests before applying pesticides.
BCI Farmer, Pakistan
“
”
This year, APTMA (Pakistan’s largest textile trade association) have signed a pledge to champion BCI with the objective of making Better Cotton a mainstream commodity country-wide.
www.bettercotton.org www.bettercotton.org

2014 HARVEST REPORT2014 HARVEST REPORT32
PAKISTAN: results
33
PAKISTAN: results5th HARVEST 5th HARVEST
suMMarY oF resuLts iN PaKistaNBCi FarMers aGaiNst CoMParisoN FarMers
Yield 9%Pesticide Use 15%Synthetic Fertiliser Use 19%Organic Fertiliser Use 87%Water Use 18%Profit 46%
The results presented here were calculated based on data from 12,284 BCI Farmers and 3,500 Comparison Farmers. Some data was excluded from the analysis because complete data was unavailable for 1 Producer Unit. Therefore, the results shown here are representative of 97.23% of BCI Farmers in Pakistan.
BCI Farmers achieved on average a 9% higher yield than Comparison Farmers. In general, the climate in 2014 was advantageous for cotton production, with the exception of some regions that were adversely affected by flooding. Expert agronomic advice from Implementing Partners enabled BCI Farmers to use less pesticide, less synthetic fertiliser and less water for irrigation than Comparison Farmers, while still maintaining positive yields.
Yield (Lint Cotton Mt/ha)
Punjab
Sindh
Pakistan
71%Advanced
28%Basic
1%Low
BCI Farmers Awareness aboutChild Labour Issues
Yield
Water Use
Profit
Pesticide -15%
46%
-18%
9%
BCI Farmers vs Com-parison Farmers Perfor-mance
Organic Fertiliser
Synthetic Fertiliser -19%
87%
BCI Farmers ComparisonFarmers3,50012,284
Number of Farmers
0.0 0.2 0.4 0.6 0.8
BCI Farmers
Comparison Farmers
9%
0%
Yield (Lint Cotton MT/ha)
0 500 1000 1500 2000 2500 3000 3500 4000 4500 5000
BCI Farmers
Comparison Farmers
-18%
0%
Water (m3/ha)
0K 10K 20K 30K 40K 50K 60K 70K 80K 90K
BCI Farmers
Comparison Farmers
46%
0%
Profit (per ha)
0.0 0.5 1.0 1.5 2.0 2.5
BCI Farmers
Comparison Farmers
-15%
0%
Pesticide (kg/ha)
0 50 100 150 200 250 300
BCI Farmer
Comparison Farmer
87%
0%
Organic Fertiliser (kg/ha)
0 100 200 300 400 500 600
BCI Farmer
Comparison Farmer
-19%
0%
Synthetic Fertiliser (kg/ha)
Harvest Report - PakistanPunjab
Sindh
Pakistan
71%Advanced
28%Basic
1%Low
BCI Farmers Awareness aboutChild Labour Issues
Yield
Water Use
Profit
Pesticide -15%
46%
-18%
9%
BCI Farmers vs Com-parison Farmers Perfor-mance
Organic Fertiliser
Synthetic Fertiliser -19%
87%
BCI Farmers ComparisonFarmers3,50012,284
Number of Farmers
0.0 0.2 0.4 0.6 0.8
BCI Farmers
Comparison Farmers
9%
0%
Yield (Lint Cotton MT/ha)
0 500 1000 1500 2000 2500 3000 3500 4000 4500 5000
BCI Farmers
Comparison Farmers
-18%
0%
Water (m3/ha)
0K 10K 20K 30K 40K 50K 60K 70K 80K 90K
BCI Farmers
Comparison Farmers
46%
0%
Profit (per ha)
0.0 0.5 1.0 1.5 2.0 2.5
BCI Farmers
Comparison Farmers
-15%
0%
Pesticide (kg/ha)
0 50 100 150 200 250 300
BCI Farmer
Comparison Farmer
87%
0%
Organic Fertiliser (kg/ha)
0 100 200 300 400 500 600
BCI Farmer
Comparison Farmer
-19%
0%
Synthetic Fertiliser (kg/ha)
Harvest Report - Pakistan
Punjab
Sindh
Pakistan
71%Advanced
28%Basic
1%Low
BCI Farmers Awareness aboutChild Labour Issues
Yield
Water Use
Profit
Pesticide -15%
46%
-18%
9%
BCI Farmers vs Com-parison Farmers Perfor-mance
Organic Fertiliser
Synthetic Fertiliser -19%
87%
BCI Farmers ComparisonFarmers3,50012,284
Number of Farmers
0.0 0.2 0.4 0.6 0.8
BCI Farmers
Comparison Farmers
9%
0%
Yield (Lint Cotton MT/ha)
0 500 1000 1500 2000 2500 3000 3500 4000 4500 5000
BCI Farmers
Comparison Farmers
-18%
0%
Water (m3/ha)
0K 10K 20K 30K 40K 50K 60K 70K 80K 90K
BCI Farmers
Comparison Farmers
46%
0%
Profit (per ha)
0.0 0.5 1.0 1.5 2.0 2.5
BCI Farmers
Comparison Farmers
-15%
0%
Pesticide (kg/ha)
0 50 100 150 200 250 300
BCI Farmer
Comparison Farmer
87%
0%
Organic Fertiliser (kg/ha)
0 100 200 300 400 500 600
BCI Farmer
Comparison Farmer
-19%
0%
Synthetic Fertiliser (kg/ha)
Harvest Report - Pakistan
BCI Farmers applied on average 15% less pesticide active ingredient than Comparison Farmers. Due in part to favourable weather conditions, overall pest pressure was generally low in Pakistan. However, the emergence of pink bolworm late in the season posed a significant threat in some areas. Under the guidance of our Implementing Partners, BCI Farmers were able to control this pest pressure while still reducing overall pesticide use.
Pesticide (kg/ha)
Punjab
Sindh
Pakistan
71%Advanced
28%Basic
1%Low
BCI Farmers Awareness aboutChild Labour Issues
Yield
Water Use
Profit
Pesticide -15%
46%
-18%
9%
BCI Farmers vs Com-parison Farmers Perfor-mance
Organic Fertiliser
Synthetic Fertiliser -19%
87%
BCI Farmers ComparisonFarmers3,50012,284
Number of Farmers
0.0 0.2 0.4 0.6 0.8
BCI Farmers
Comparison Farmers
9%
0%
Yield (Lint Cotton MT/ha)
0 500 1000 1500 2000 2500 3000 3500 4000 4500 5000
BCI Farmers
Comparison Farmers
-18%
0%
Water (m3/ha)
0K 10K 20K 30K 40K 50K 60K 70K 80K 90K
BCI Farmers
Comparison Farmers
46%
0%
Profit (per ha)
0.0 0.5 1.0 1.5 2.0 2.5
BCI Farmers
Comparison Farmers
-15%
0%
Pesticide (kg/ha)
0 50 100 150 200 250 300
BCI Farmer
Comparison Farmer
87%
0%
Organic Fertiliser (kg/ha)
0 100 200 300 400 500 600
BCI Farmer
Comparison Farmer
-19%
0%
Synthetic Fertiliser (kg/ha)
Harvest Report - Pakistan
BCI Farmers used on average 19% less synthetic fertiliser than Comparison Farmers, but overall achieved a slightly greater yield. Many Implementing Partners used soil testing to ensure the optimal application of synthetic fertiliser.
synthethic Fertiliser (kg/ha)
Punjab
Sindh
Pakistan
71%Advanced
28%Basic
1%Low
BCI Farmers Awareness aboutChild Labour Issues
Yield
Water Use
Profit
Pesticide -15%
46%
-18%
9%
BCI Farmers vs Com-parison Farmers Perfor-mance
Organic Fertiliser
Synthetic Fertiliser -19%
87%
BCI Farmers ComparisonFarmers3,50012,284
Number of Farmers
0.0 0.2 0.4 0.6 0.8
BCI Farmers
Comparison Farmers
9%
0%
Yield (Lint Cotton MT/ha)
0 500 1000 1500 2000 2500 3000 3500 4000 4500 5000
BCI Farmers
Comparison Farmers
-18%
0%
Water (m3/ha)
0K 10K 20K 30K 40K 50K 60K 70K 80K 90K
BCI Farmers
Comparison Farmers
46%
0%
Profit (per ha)
0.0 0.5 1.0 1.5 2.0 2.5
BCI Farmers
Comparison Farmers
-15%
0%
Pesticide (kg/ha)
0 50 100 150 200 250 300
BCI Farmer
Comparison Farmer
87%
0%
Organic Fertiliser (kg/ha)
0 100 200 300 400 500 600
BCI Farmer
Comparison Farmer
-19%
0%
Synthetic Fertiliser (kg/ha)
Harvest Report - Pakistan
organic Fertiliser (kg/ha)
Punjab
Sindh
Pakistan
71%Advanced
28%Basic
1%Low
BCI Farmers Awareness aboutChild Labour Issues
Yield
Water Use
Profit
Pesticide -15%
46%
-18%
9%
BCI Farmers vs Com-parison Farmers Perfor-mance
Organic Fertiliser
Synthetic Fertiliser -19%
87%
BCI Farmers ComparisonFarmers3,50012,284
Number of Farmers
0.0 0.2 0.4 0.6 0.8
BCI Farmers
Comparison Farmers
9%
0%
Yield (Lint Cotton MT/ha)
0 500 1000 1500 2000 2500 3000 3500 4000 4500 5000
BCI Farmers
Comparison Farmers
-18%
0%
Water (m3/ha)
0K 10K 20K 30K 40K 50K 60K 70K 80K 90K
BCI Farmers
Comparison Farmers
46%
0%
Profit (per ha)
0.0 0.5 1.0 1.5 2.0 2.5
BCI Farmers
Comparison Farmers
-15%
0%
Pesticide (kg/ha)
0 50 100 150 200 250 300
BCI Farmer
Comparison Farmer
87%
0%
Organic Fertiliser (kg/ha)
0 100 200 300 400 500 600
BCI Farmer
Comparison Farmer
-19%
0%
Synthetic Fertiliser (kg/ha)
Harvest Report - Pakistan
All Pakistani farmers practice irrigation, predominantly through the use of canals and tube wells. BCI Farmers used water scouting strategies and land levelling in order to apply water more efficiently and uniformly.
BCI Farmers reported on average 46% higher profits than Comparison Farmers. Overall, prices for key inputs remained stable compared to 2013 prices, while the cost of some pesticides rose slightly. Using less inputs in combination with a higher average yield contributed to this positive result.
A large majority of BCI Farmers demonstrated an advanced awareness regarding child labour issues, 28% had a basic awareness and only 1% showed a low awareness.
water (m3/ha)
Profit (per ha)
awareness of Child Labour issues
China India Pakistan Tajikistan Turkey Mali Mozambique
1%Low
28%Basic
71%Advanced
Generally, organic fertiliser use is low among cotton farmers in Pakistan. Farmers with smaller plots who also grow food crops and may have access to nearby animal manure are more likely to use it to boost soil fertility.
www.bettercotton.org www.bettercotton.org

2014 HARVEST REPORT34 35
TAJIKISTAN
Field worker, Tajikistan© Better Cotton Initiative
In the 2006-2007 growing season, the mealy bug caused huge economic losses to the cotton crop in Pakistan. In most cases, pesticides were not effective in controlling the insect. In the district of Sanghar, Pakistan, staff from BCI Implementing Partner, CABI, worked with cotton farmers in an attempt to combat the problem. Researchers here set out to find a biological solution. Using cotton plants infested with the mealy bug, researchers successfully bred natural parasitoids and predators.
Staff placed mealy bug infested cotton shoots and leaves in trays under sheds in cotton fields. The trays attracted natural enemies of the mealy bug, which fed and reproduced on the infested plants. The parasitoids and predators produced in the trays naturally dispersed and were also manually collected and released in other fields. There is now a common saying among the cotton farmers of the region: “If you see kala jeet (a mealy bug parasitoid) in the cotton crop, there’s no worry”. Since its initial success, the project is being replicated in 80 more locations in the Sindh province.
Similar efforts to control bollworms, which have also become serious pests in Pakistan, are underway. Infested bolls that do not open during the harvest season are collected and stored in specially designed wire gauze or porous cloth bags. While the parasitoids can escape from the bags, the larger bollworm moths remain trapped. The biological method for controlling bollworms shows great promise, but still needs further development.
Sha Nawaz Mangsi, a BCI Farmer from Shadad Pur said, “I used to be unaware of how to identify beneficial insects - I even used to apply pesticides to them. The CABI facilitator helped me to distinguish between the harmful and beneficial insects on my farm. I established a facility to breed insects, rearing and releasing thousands of beneficial parasitoids in my field to control harmful insects such as mealy bugs and other sucking pests. Now I can easily identify and produce beneficial insects on my own.”
© Better Cotton Initiative
I established a facility to breed insects, rearing and releasing thousands of beneficial parasitoids in my field to control harmful insects such as mealy bugs and other sucking pests. Mr Sha Nawaz Mangsi, BCI Farmer in Pakistan
“
”
www.bettercotton.org
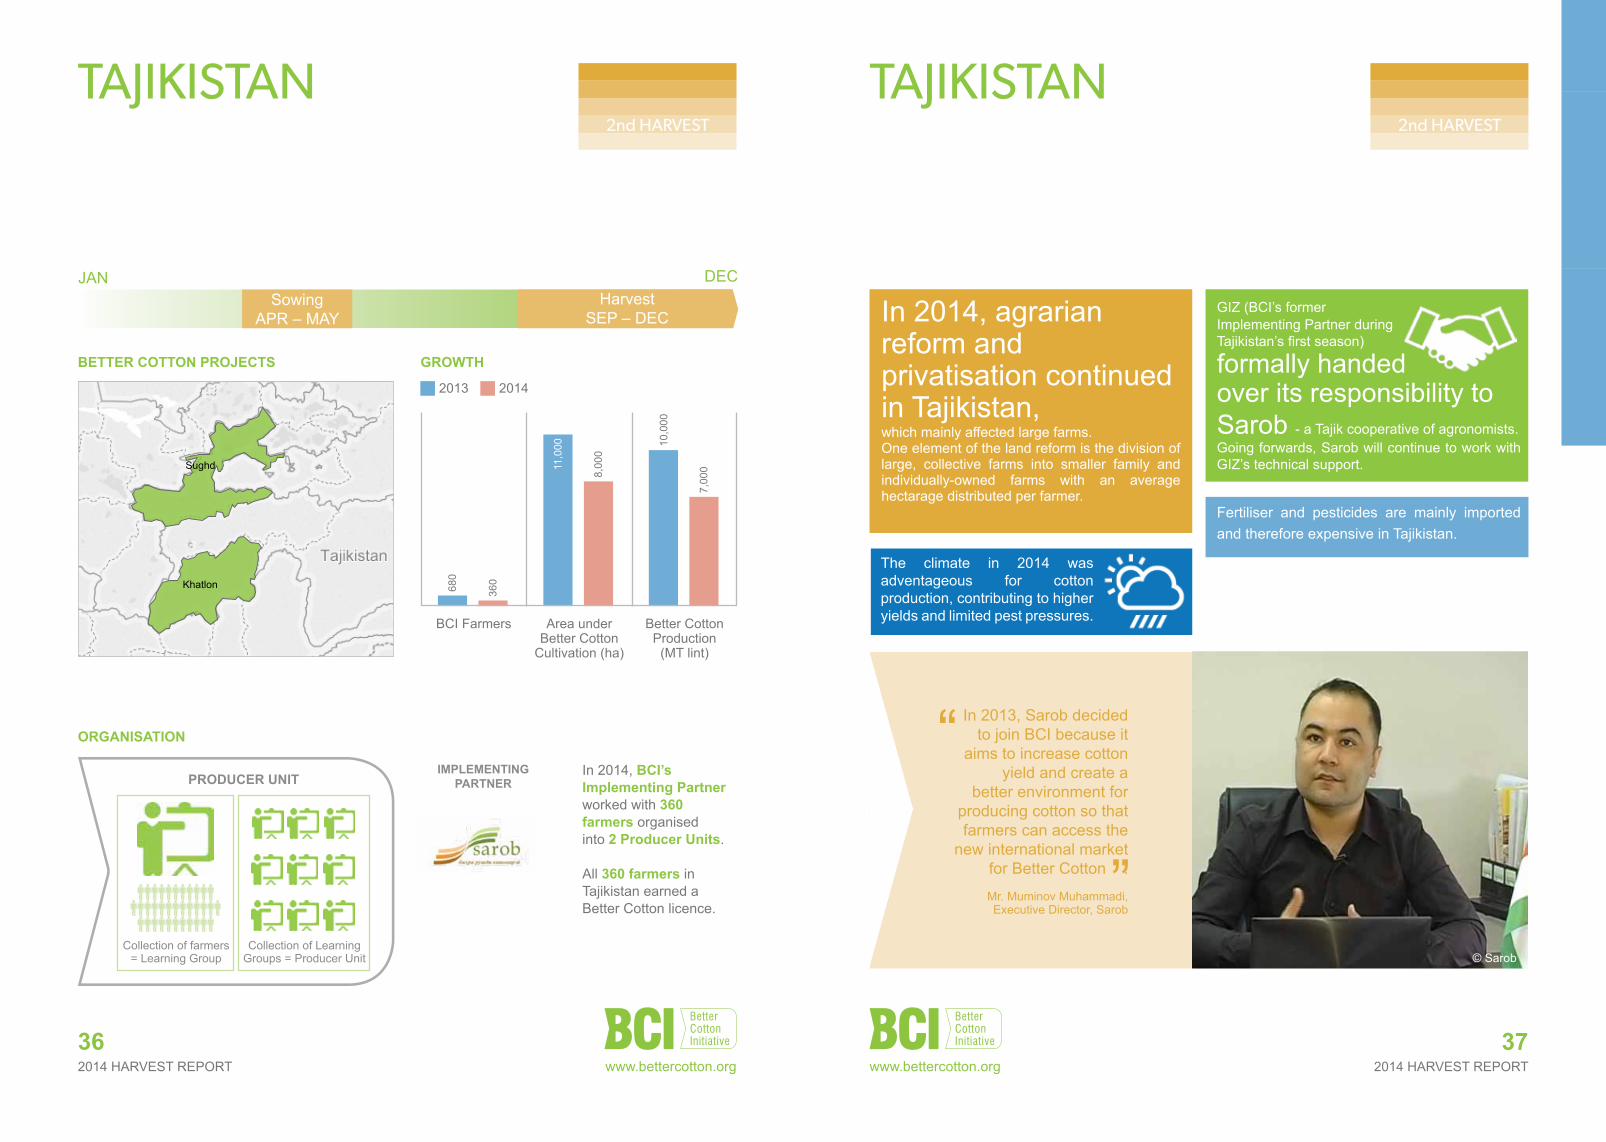
2014 HARVEST REPORT2014 HARVEST REPORT
TAJIKISTAN
JANHarvest
SEP – DEC
DEC
In 2014, BCi’s implementing Partner worked with 360 farmers organised into 2 Producer units.
All 360 farmers in Tajikistan earned a Better Cotton licence.
iMPLeMeNtiNG PartNer
Better CottoN ProJeCts
SowingAPR – MAY
orGaNisatioN
37
TAJIKISTAN
In 2013, Sarob decided to join BCI because it
aims to increase cotton yield and create a
better environment for producing cotton so that farmers can access the
new international market for Better Cotton .
Mr. Muminov Muhammadi,Executive Director, Sarob
36
In 2014, agrarian reform and privatisation continued in Tajikistan,which mainly affected large farms.One element of the land reform is the division of large, collective farms into smaller family and individually-owned farms with an average hectarage distributed per farmer.
GIZ (BCI’s former Implementing Partner during Tajikistan’s first season)
formally handed over its responsibility to Sarob - a Tajik cooperative of agronomists. Going forwards, Sarob will continue to work with GIZ’s technical support.
Khatlon
Sughd
Tajikistan
87%Advanced
13%Basic
BCI Farmer Awareness aboutChild Labour Issues
Yield
Water
Pesticide
Profit 239%
-73%
11%
53%
BCI Farmers vs Compari-son Farmers Performance
Organic Fertiliser
Synthetic Fertiliser 28%
230%
BCI Farmers ComparisonFarmers
20169
Number of Farmers
0.0 0.2 0.4 0.6 0.8 1.0
BCI Farmers
Comparison Farmers
53%
0%
Yield (Lint Cotton kg/ha)
0K 1K 2K 3K 4K 5K 6K
BCI Farmers
Comparison Farmers
11%
0%
Water (m3/ha)
0 500 1000 1500 2000 2500 3000
BCI Farmers
Comparison Farmers
239%
0%
Profit (per ha)
0.00 0.05 0.10 0.15 0.20 0.25
BCI Farmers
Comparison Farmers
-73%
0%
Pesticide (kg/ha)
0 10 20 30 40 50 60 70 80
BCI Farmers
Comparison Farmer
230%
0%
Organic Fertiliser (kg/ha)
0 100 200 300 400 500
BCI Farmers
Comparison Farmer
28%
0%
Synthetic Fertiliser (kg/ha)
Harvest Report - Tajikistan
“
”
2nd HARVEST 2nd HARVEST
Collection of farmers = Learning Group
ProduCer uNit
Collection of Learning Groups = Producer Unit
Growth
BCI Farmers Area under Better Cotton
Cultivation (ha)
Better Cotton Production
(MT lint)
2013 2014
360
7,00
0
680
10,0
00
8,00
0
28,0
00
11,0
00
© Sarob
The climate in 2014 was adventageous for cotton production, contributing to higher yields and limited pest pressures.
Fertiliser and pesticides are mainly imported and therefore expensive in Tajikistan.
www.bettercotton.org www.bettercotton.org
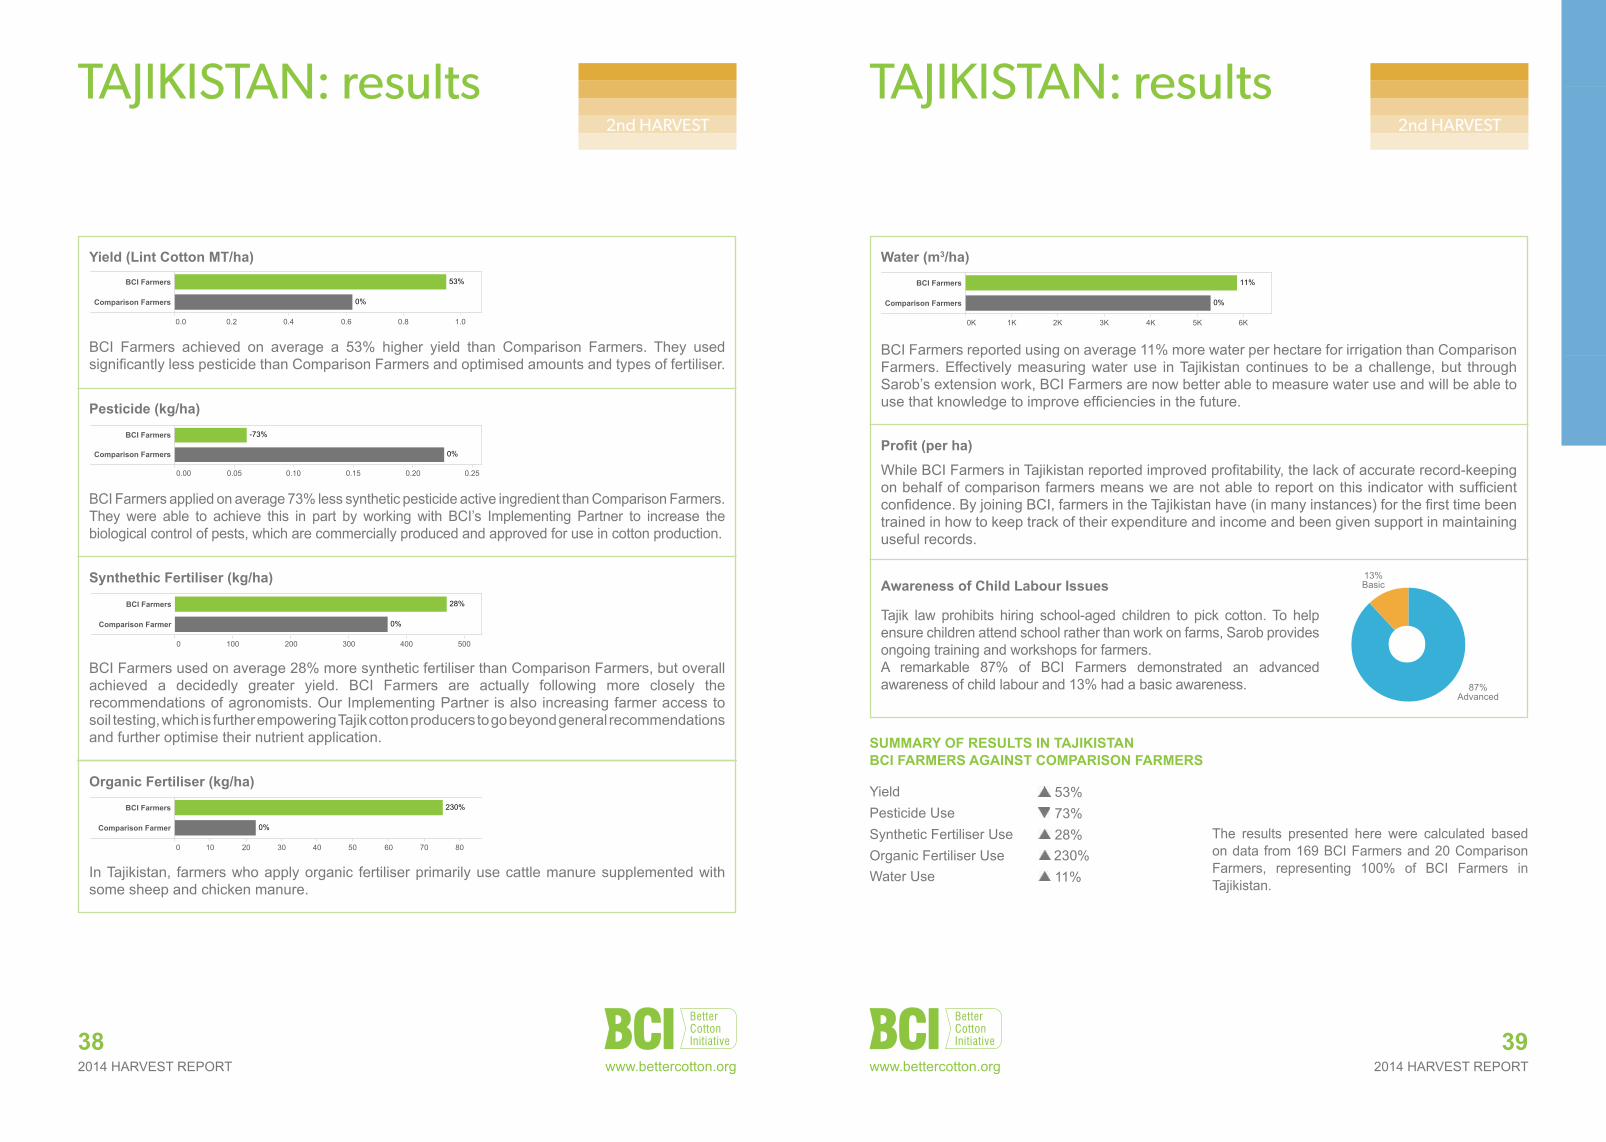
2014 HARVEST REPORT2014 HARVEST REPORT38
TAJIKISTAN: results
39
TAJIKISTAN: results
suMMarY oF resuLts iN taJiKistaNBCi FarMers aGaiNst CoMParisoN FarMers
Yield 53%Pesticide Use 73%Synthetic Fertiliser Use 28%Organic Fertiliser Use 230%Water Use 11%
The results presented here were calculated based on data from 169 BCI Farmers and 20 Comparison Farmers, representing 100% of BCI Farmers in Tajikistan.
2nd HARVEST 2nd HARVEST
BCI Farmers achieved on average a 53% higher yield than Comparison Farmers. They used significantly less pesticide than Comparison Farmers and optimised amounts and types of fertiliser.
BCI Farmers applied on average 73% less synthetic pesticide active ingredient than Comparison Farmers. They were able to achieve this in part by working with BCI’s Implementing Partner to increase the biological control of pests, which are commercially produced and approved for use in cotton production.
Yield (Lint Cotton Mt/ha)
Pesticide (kg/ha)Khatlon
Sughd
Tajikistan
87%Advanced
13%Basic
BCI Farmer Awareness aboutChild Labour Issues
Yield
Water
Pesticide
Profit 239%
-73%
11%
53%
BCI Farmers vs Compari-son Farmers Performance
Organic Fertiliser
Synthetic Fertiliser 28%
230%
BCI Farmers ComparisonFarmers
20169
Number of Farmers
0.0 0.2 0.4 0.6 0.8 1.0
BCI Farmers
Comparison Farmers
53%
0%
Yield (Lint Cotton kg/ha)
0K 1K 2K 3K 4K 5K 6K
BCI Farmers
Comparison Farmers
11%
0%
Water (m3/ha)
0 500 1000 1500 2000 2500 3000
BCI Farmers
Comparison Farmers
239%
0%
Profit (per ha)
0.00 0.05 0.10 0.15 0.20 0.25
BCI Farmers
Comparison Farmers
-73%
0%
Pesticide (kg/ha)
0 10 20 30 40 50 60 70 80
BCI Farmers
Comparison Farmer
230%
0%
Organic Fertiliser (kg/ha)
0 100 200 300 400 500
BCI Farmers
Comparison Farmer
28%
0%
Synthetic Fertiliser (kg/ha)
Harvest Report - Tajikistan
Khatlon
Sughd
Tajikistan
87%Advanced
13%Basic
BCI Farmer Awareness aboutChild Labour Issues
Yield
Water
Pesticide
Profit 239%
-73%
11%
53%
BCI Farmers vs Compari-son Farmers Performance
Organic Fertiliser
Synthetic Fertiliser 28%
230%
BCI Farmers ComparisonFarmers
20169
Number of Farmers
0.0 0.2 0.4 0.6 0.8 1.0
BCI Farmers
Comparison Farmers
53%
0%
Yield (Lint Cotton kg/ha)
0K 1K 2K 3K 4K 5K 6K
BCI Farmers
Comparison Farmers
11%
0%
Water (m3/ha)
0 500 1000 1500 2000 2500 3000
BCI Farmers
Comparison Farmers
239%
0%
Profit (per ha)
0.00 0.05 0.10 0.15 0.20 0.25
BCI Farmers
Comparison Farmers
-73%
0%
Pesticide (kg/ha)
0 10 20 30 40 50 60 70 80
BCI Farmers
Comparison Farmer
230%
0%
Organic Fertiliser (kg/ha)
0 100 200 300 400 500
BCI Farmers
Comparison Farmer
28%
0%
Synthetic Fertiliser (kg/ha)
Harvest Report - Tajikistan
BCI Farmers used on average 28% more synthetic fertiliser than Comparison Farmers, but overall achieved a decidedly greater yield. BCI Farmers are actually following more closely the recommendations of agronomists. Our Implementing Partner is also increasing farmer access to soil testing, which is further empowering Tajik cotton producers to go beyond general recommendations and further optimise their nutrient application.
In Tajikistan, farmers who apply organic fertiliser primarily use cattle manure supplemented with some sheep and chicken manure.
synthethic Fertiliser (kg/ha)
organic Fertiliser (kg/ha)
Khatlon
Sughd
Tajikistan
87%Advanced
13%Basic
BCI Farmer Awareness aboutChild Labour Issues
Yield
Water
Pesticide
Profit 239%
-73%
11%
53%
BCI Farmers vs Compari-son Farmers Performance
Organic Fertiliser
Synthetic Fertiliser 28%
230%
BCI Farmers ComparisonFarmers
20169
Number of Farmers
0.0 0.2 0.4 0.6 0.8 1.0
BCI Farmers
Comparison Farmers
53%
0%
Yield (Lint Cotton kg/ha)
0K 1K 2K 3K 4K 5K 6K
BCI Farmers
Comparison Farmers
11%
0%
Water (m3/ha)
0 500 1000 1500 2000 2500 3000
BCI Farmers
Comparison Farmers
239%
0%
Profit (per ha)
0.00 0.05 0.10 0.15 0.20 0.25
BCI Farmers
Comparison Farmers
-73%
0%
Pesticide (kg/ha)
0 10 20 30 40 50 60 70 80
BCI Farmers
Comparison Farmer
230%
0%
Organic Fertiliser (kg/ha)
0 100 200 300 400 500
BCI Farmers
Comparison Farmer
28%
0%
Synthetic Fertiliser (kg/ha)
Harvest Report - Tajikistan
water (m3/ha)
BCI Farmers reported using on average 11% more water per hectare for irrigation than Comparison Farmers. Effectively measuring water use in Tajikistan continues to be a challenge, but through Sarob’s extension work, BCI Farmers are now better able to measure water use and will be able to use that knowledge to improve efficiencies in the future.
Profit (per ha)
While BCI Farmers in Tajikistan reported improved profitability, the lack of accurate record-keeping on behalf of comparison farmers means we are not able to report on this indicator with sufficient confidence. By joining BCI, farmers in the Tajikistan have (in many instances) for the first time been trained in how to keep track of their expenditure and income and been given support in maintaining useful records.
Tajik law prohibits hiring school-aged children to pick cotton. To help ensure children attend school rather than work on farms, Sarob provides ongoing training and workshops for farmers. A remarkable 87% of BCI Farmers demonstrated an advanced awareness of child labour and 13% had a basic awareness.
awareness of Child Labour issues
China India Pakistan Tajikistan Turkey Mali Mozambique
13%Basic
87%Advanced
www.bettercotton.org www.bettercotton.org
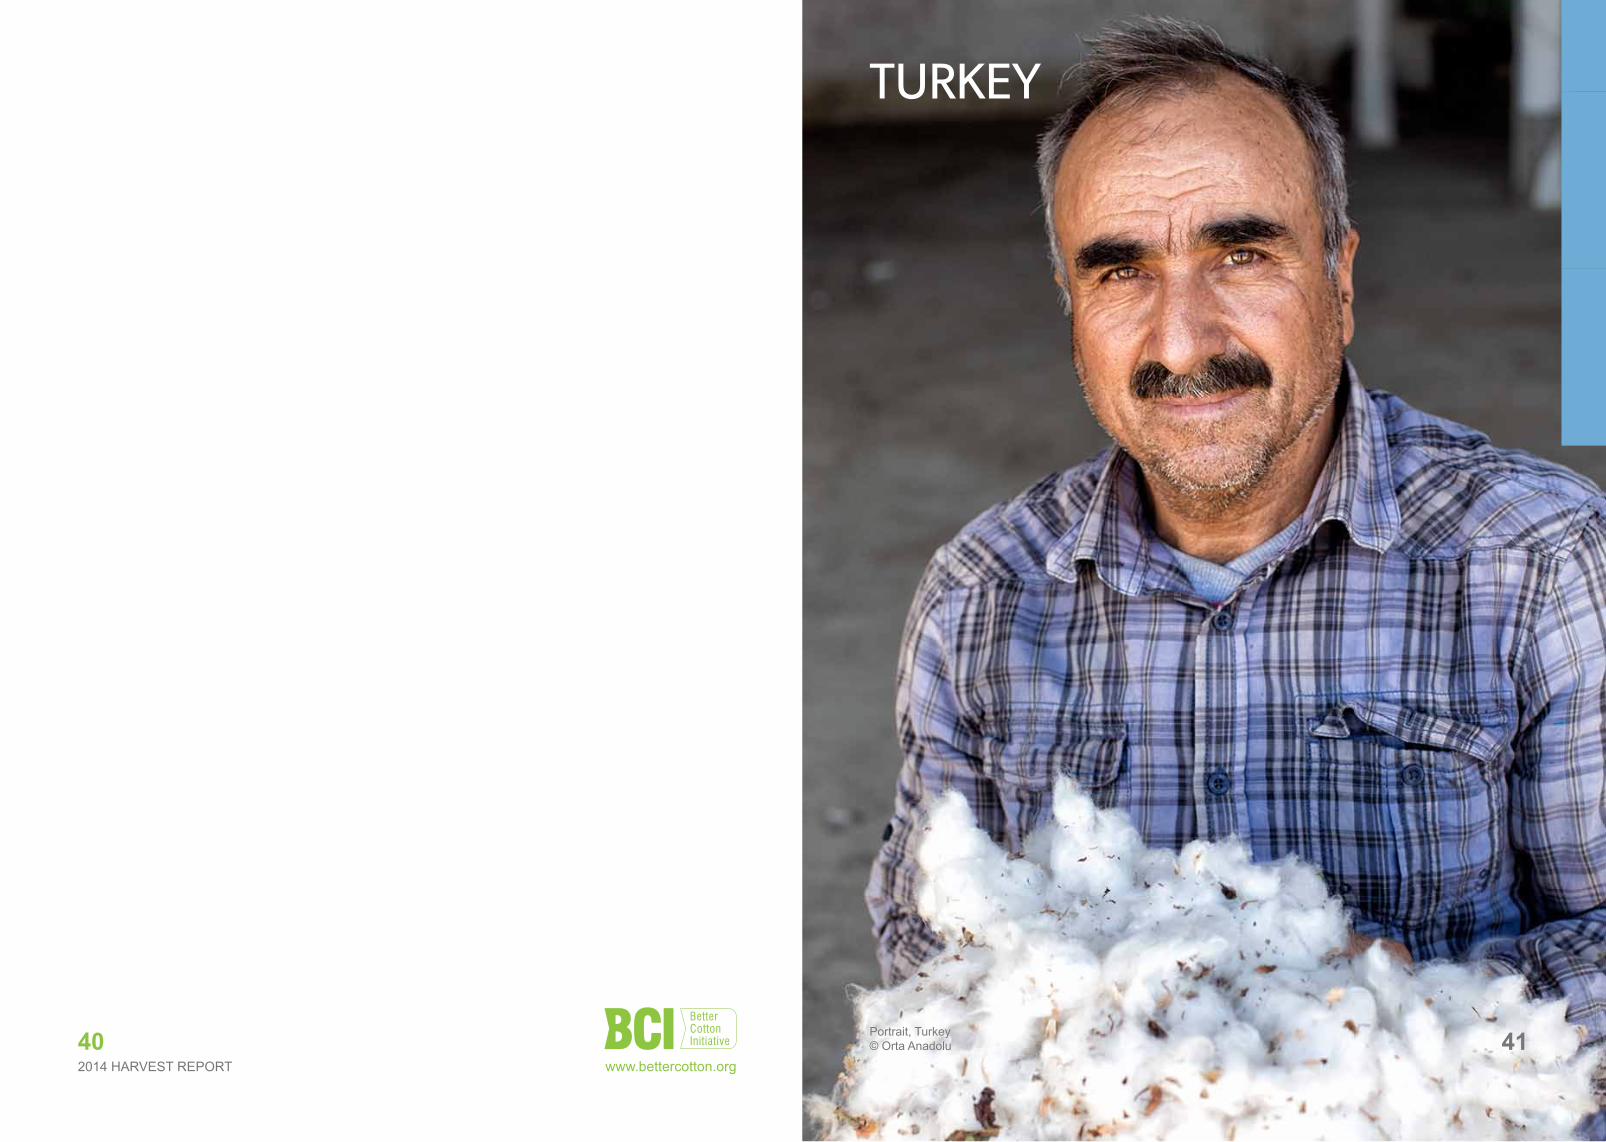
2014 HARVEST REPORT40
TURKEY
Portrait, Turkey© Orta Anadolu 41
www.bettercotton.org

2014 HARVEST REPORT2014 HARVEST REPORT42
TURKEY
JANHarvest
SEP – NOV
DEC
In 2014, BCi’s strategic Partner worked with 582 farmers organised into 16 Producer units and one large farm.
534 farmers in Turkey earned a Better Cotton licence.
strateGiC PartNer
Better CottoN ProJeCts
SowingAPR – JUN
orGaNisatioN
43
TURKEY
The Turkish government does not currently permit planting of Genetically Modified (GM) cotton.
As BCI’s Strategic Partner,
IPUD is responsible for the implementation of the Better Cotton Standard System and the production of Better Cotton in Turkey.
In most regions, harvests were delayed because of unseasonally heavy autumn rains. In the worst cases, the rain led to losses in yield and quality. In the Çukurova and GAP regions, some farmers couldn’t harvest at all.
© Orta Anadolu
ProduCer uNit
Collection of farmers = Producer Unit
Kahramanmaraş
Sanliurfa
Manisa
Denizli
Adana
Hatay
Aydin
İzmir
Turkey
Map based on Longitude (generated) and Latitude (generated). The marks are labeled by Province. Details are shown for Country and Province. The data is filtered on Action (Farm Category) and Action (PU Code). The Action (Farm Category) filter keeps 4 members. The Action (PU Code) filter keeps 7 members.
Cotton grown with this criteria is hugely sought after in the textile world because big brands want their products to be produced from a cotton produced in better conditions.
Fuat Tanman, BCI Farmer, Turkey
“
”
2nd HARVEST 2nd HARVEST
Growth
BCI Farmers Area under Better Cotton
Cultivation (ha)
Better Cotton Production
(MT lint)
2013 2014
28,0
00
530
280
13,0
00
13,0
00
7,00
0
23,0
00
This year, the Turkish government increased subsides for cotton farmers for fuel and fertiliser in an attempt to offset a drop in cotton prices and increased costs of inputs.
www.bettercotton.org www.bettercotton.org
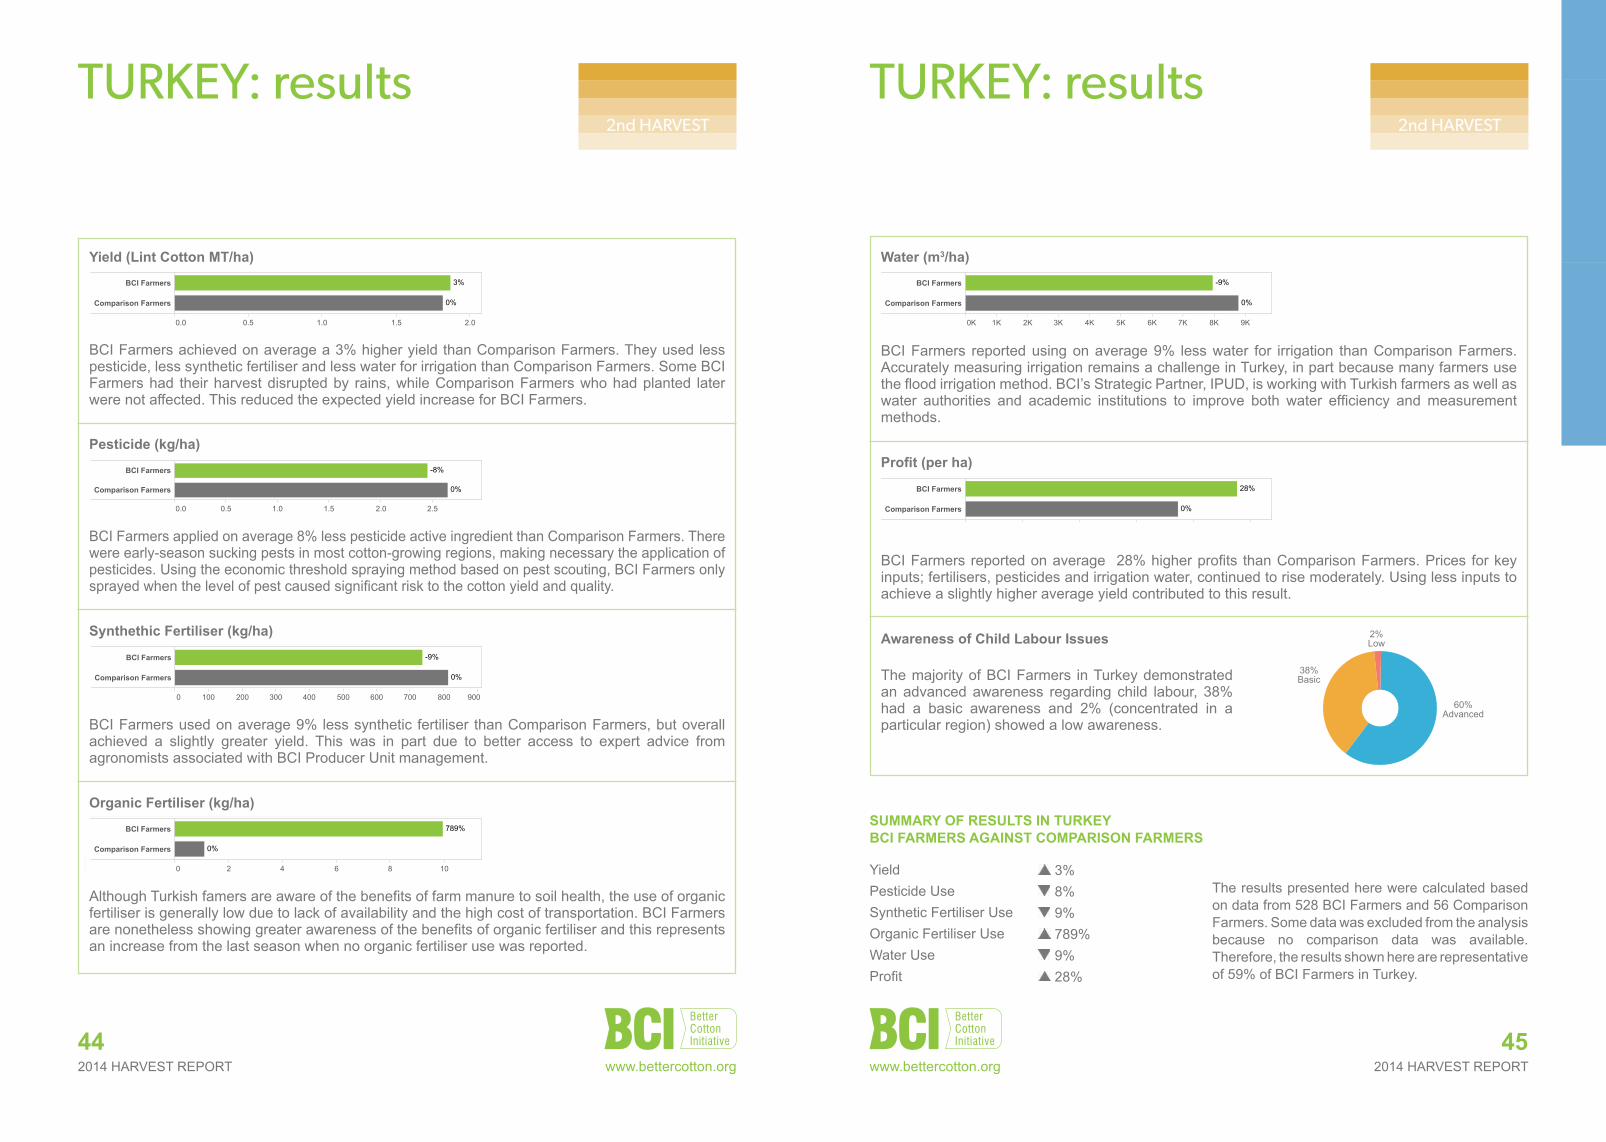
2014 HARVEST REPORT2014 HARVEST REPORT www.bettercotton.org44
TURKEY: results
45
TURKEY: results
The results presented here were calculated based on data from 528 BCI Farmers and 56 Comparison Farmers. Some data was excluded from the analysis because no comparison data was available. Therefore, the results shown here are representative of 59% of BCI Farmers in Turkey.
2nd HARVEST 2nd HARVEST
www.bettercotton.org
suMMarY oF resuLts iN turKeYBCi FarMers aGaiNst CoMParisoN FarMers
Yield 3%Pesticide Use 8%Synthetic Fertiliser Use 9%Organic Fertiliser Use 789%Water Use 9%Profit 28%
BCI Farmers achieved on average a 3% higher yield than Comparison Farmers. They used less pesticide, less synthetic fertiliser and less water for irrigation than Comparison Farmers. Some BCI Farmers had their harvest disrupted by rains, while Comparison Farmers who had planted later were not affected. This reduced the expected yield increase for BCI Farmers.
Yield (Lint Cotton Mt/ha)
Kahramanmaraş
AdanaHatay
Aydinİzmir
Urfa
Turkey
60%Advanced
38%Basic
2%Low
BCI Awareness about ChildLabour Issues
Yield
Water
Profit
Pesticide -8%
28%
-9%
3%
BCI Farmers vs Compar-ison Farmers Perfor-mance
Organic Fertiliser
Synthetic Fertiliser -9%
789%
BCI Farmers ComparisonFarmers
56528
Number of Farmers
0.0 0.5 1.0 1.5 2.0
BCI Farmers
Comparison Farmers
3%
0%
Yield (Lint Cotton MT/ha)
0K 1K 2K 3K 4K 5K 6K 7K 8K 9K
BCI Farmers
Comparison Farmers
-9%
0%
Water (m3/ha)
0K 1K 2K 3K 4K 5K
BCI Farmers
Comparison Farmers
28%
0%
Profit (per ha)
0.0 0.5 1.0 1.5 2.0 2.5
BCI Farmers
Comparison Farmers
-8%
0%
Pesticide (kg/ha)
0 2 4 6 8 10
BCI Farmers
Comparison Farmers
789%
0%
Organic Fertiliser (kg/ha)
0 100 200 300 400 500 600 700 800 900
BCI Farmers
Comparison Farmers
-9%
0%
Synthetic Fertiliser (kg/ha)
Harvest Report - Turkey
BCI Farmers reported using on average 9% less water for irrigation than Comparison Farmers. Accurately measuring irrigation remains a challenge in Turkey, in part because many farmers use the flood irrigation method. BCI’s Strategic Partner, IPUD, is working with Turkish farmers as well as water authorities and academic institutions to improve both water efficiency and measurement methods.
water (m3/ha)
Kahramanmaraş
AdanaHatay
Aydinİzmir
Urfa
Turkey
60%Advanced
38%Basic
2%Low
BCI Awareness about ChildLabour Issues
Yield
Water
Profit
Pesticide -8%
28%
-9%
3%
BCI Farmers vs Compar-ison Farmers Perfor-mance
Organic Fertiliser
Synthetic Fertiliser -9%
789%
BCI Farmers ComparisonFarmers
56528
Number of Farmers
0.0 0.5 1.0 1.5 2.0
BCI Farmers
Comparison Farmers
3%
0%
Yield (Lint Cotton MT/ha)
0K 1K 2K 3K 4K 5K 6K 7K 8K 9K
BCI Farmers
Comparison Farmers
-9%
0%
Water (m3/ha)
0K 1K 2K 3K 4K 5K
BCI Farmers
Comparison Farmers
28%
0%
Profit (per ha)
0.0 0.5 1.0 1.5 2.0 2.5
BCI Farmers
Comparison Farmers
-8%
0%
Pesticide (kg/ha)
0 2 4 6 8 10
BCI Farmers
Comparison Farmers
789%
0%
Organic Fertiliser (kg/ha)
0 100 200 300 400 500 600 700 800 900
BCI Farmers
Comparison Farmers
-9%
0%
Synthetic Fertiliser (kg/ha)
Harvest Report - Turkey
BCI Farmers reported on average 28% higher profits than Comparison Farmers. Prices for key inputs; fertilisers, pesticides and irrigation water, continued to rise moderately. Using less inputs to achieve a slightly higher average yield contributed to this result.
The majority of BCI Farmers in Turkey demonstrated an advanced awareness regarding child labour, 38% had a basic awareness and 2% (concentrated in a particular region) showed a low awareness.
Profit (per ha)
awareness of Child Labour issues
China India Pakistan Tajikistan Turkey Mali Mozambique
2%Low
38%Basic
60%Advanced
Pesticide (kg/ha)
Kahramanmaraş
AdanaHatay
Aydinİzmir
Urfa
Turkey
60%Advanced
38%Basic
2%Low
BCI Awareness about ChildLabour Issues
Yield
Water
Profit
Pesticide -8%
28%
-9%
3%
BCI Farmers vs Compar-ison Farmers Perfor-mance
Organic Fertiliser
Synthetic Fertiliser -9%
789%
BCI Farmers ComparisonFarmers
56528
Number of Farmers
0.0 0.5 1.0 1.5 2.0
BCI Farmers
Comparison Farmers
3%
0%
Yield (Lint Cotton MT/ha)
0K 1K 2K 3K 4K 5K 6K 7K 8K 9K
BCI Farmers
Comparison Farmers
-9%
0%
Water (m3/ha)
0K 1K 2K 3K 4K 5K
BCI Farmers
Comparison Farmers
28%
0%
Profit (per ha)
0.0 0.5 1.0 1.5 2.0 2.5
BCI Farmers
Comparison Farmers
-8%
0%
Pesticide (kg/ha)
0 2 4 6 8 10
BCI Farmers
Comparison Farmers
789%
0%
Organic Fertiliser (kg/ha)
0 100 200 300 400 500 600 700 800 900
BCI Farmers
Comparison Farmers
-9%
0%
Synthetic Fertiliser (kg/ha)
Harvest Report - Turkey
BCI Farmers applied on average 8% less pesticide active ingredient than Comparison Farmers. There were early-season sucking pests in most cotton-growing regions, making necessary the application of pesticides. Using the economic threshold spraying method based on pest scouting, BCI Farmers only sprayed when the level of pest caused significant risk to the cotton yield and quality.
synthethic Fertiliser (kg/ha)
Kahramanmaraş
AdanaHatay
Aydinİzmir
Urfa
Turkey
60%Advanced
38%Basic
2%Low
BCI Awareness about ChildLabour Issues
Yield
Water
Profit
Pesticide -8%
28%
-9%
3%
BCI Farmers vs Compar-ison Farmers Perfor-mance
Organic Fertiliser
Synthetic Fertiliser -9%
789%
BCI Farmers ComparisonFarmers
56528
Number of Farmers
0.0 0.5 1.0 1.5 2.0
BCI Farmers
Comparison Farmers
3%
0%
Yield (Lint Cotton MT/ha)
0K 1K 2K 3K 4K 5K 6K 7K 8K 9K
BCI Farmers
Comparison Farmers
-9%
0%
Water (m3/ha)
0K 1K 2K 3K 4K 5K
BCI Farmers
Comparison Farmers
28%
0%
Profit (per ha)
0.0 0.5 1.0 1.5 2.0 2.5
BCI Farmers
Comparison Farmers
-8%
0%
Pesticide (kg/ha)
0 2 4 6 8 10
BCI Farmers
Comparison Farmers
789%
0%
Organic Fertiliser (kg/ha)
0 100 200 300 400 500 600 700 800 900
BCI Farmers
Comparison Farmers
-9%
0%
Synthetic Fertiliser (kg/ha)
Harvest Report - Turkey
BCI Farmers used on average 9% less synthetic fertiliser than Comparison Farmers, but overall achieved a slightly greater yield. This was in part due to better access to expert advice from agronomists associated with BCI Producer Unit management.
Although Turkish famers are aware of the benefits of farm manure to soil health, the use of organic fertiliser is generally low due to lack of availability and the high cost of transportation. BCI Farmers are nonetheless showing greater awareness of the benefits of organic fertiliser and this represents an increase from the last season when no organic fertiliser use was reported.
organic Fertiliser (kg/ha)
Kahramanmaraş
AdanaHatay
Aydinİzmir
Urfa
Turkey
60%Advanced
38%Basic
2%Low
BCI Awareness about ChildLabour Issues
Yield
Water
Profit
Pesticide -8%
28%
-9%
3%
BCI Farmers vs Compar-ison Farmers Perfor-mance
Organic Fertiliser
Synthetic Fertiliser -9%
789%
BCI Farmers ComparisonFarmers
56528
Number of Farmers
0.0 0.5 1.0 1.5 2.0
BCI Farmers
Comparison Farmers
3%
0%
Yield (Lint Cotton MT/ha)
0K 1K 2K 3K 4K 5K 6K 7K 8K 9K
BCI Farmers
Comparison Farmers
-9%
0%
Water (m3/ha)
0K 1K 2K 3K 4K 5K
BCI Farmers
Comparison Farmers
28%
0%
Profit (per ha)
0.0 0.5 1.0 1.5 2.0 2.5
BCI Farmers
Comparison Farmers
-8%
0%
Pesticide (kg/ha)
0 2 4 6 8 10
BCI Farmers
Comparison Farmers
789%
0%
Organic Fertiliser (kg/ha)
0 100 200 300 400 500 600 700 800 900
BCI Farmers
Comparison Farmers
-9%
0%
Synthetic Fertiliser (kg/ha)
Harvest Report - Turkey
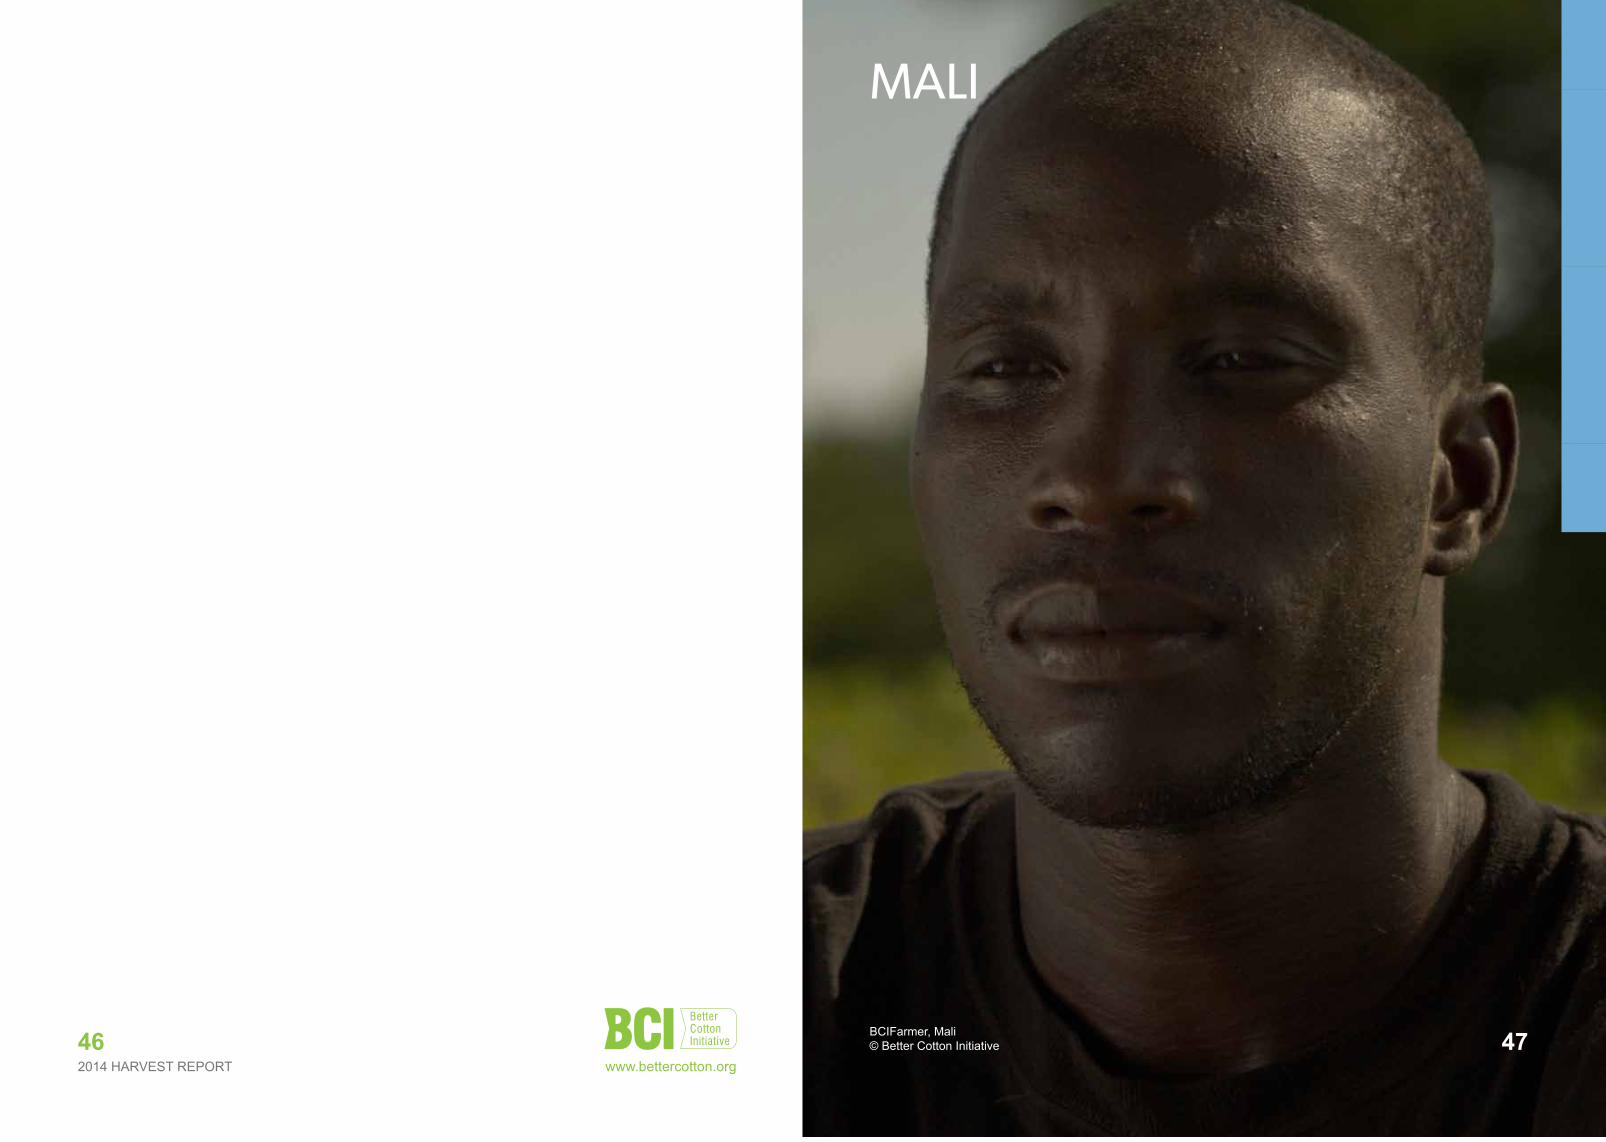
2014 HARVEST REPORT
MALI
BCIFarmer, Mali© Better Cotton Initiative 4746
www.bettercotton.org
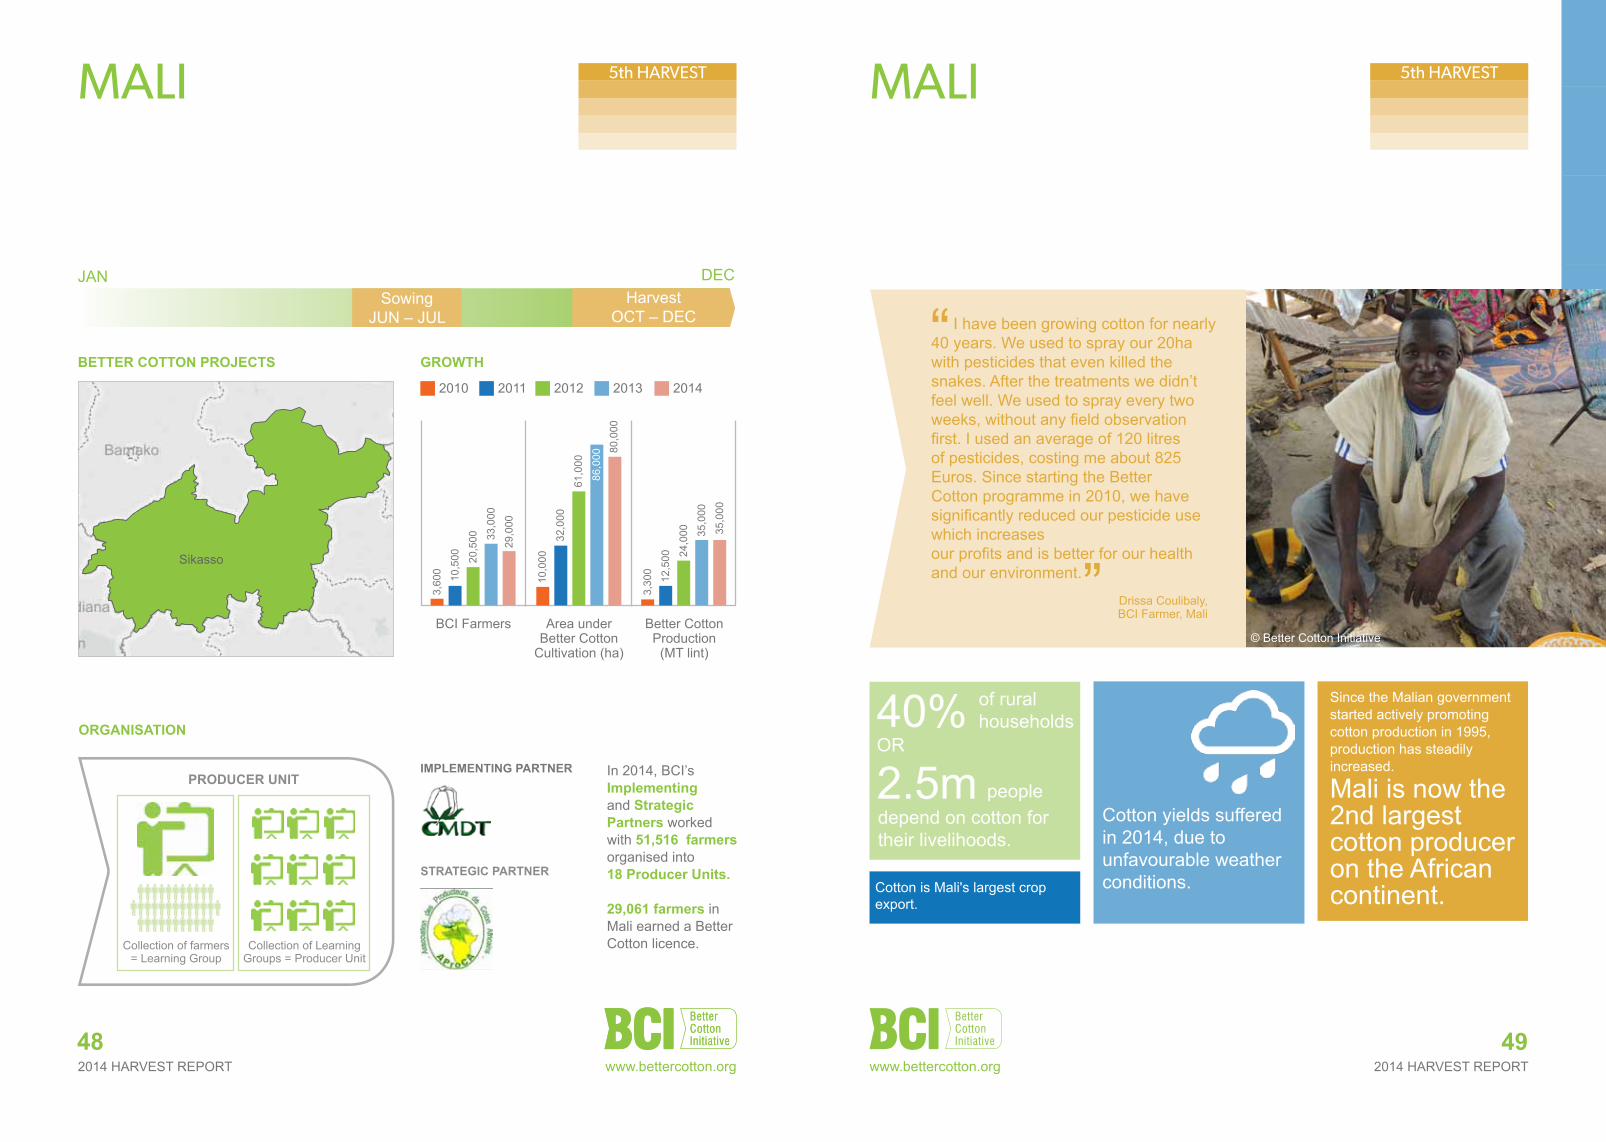
2014 HARVEST REPORT 2014 HARVEST REPORT48
MALI
JANSowing
JUN – JULHarvest
OCT – DEC
DEC
Better CottoN ProJeCts
In 2014, BCI’s implementing and strategic Partners worked with 51,516 farmers organised into 18 Producer units.
29,061 farmers in Mali earned a Better Cotton licence.
iMPLeMeNtiNG PartNer
strateGiC PartNer
orGaNisatioN
49
MALI5th HARVEST 5th HARVEST
Collection of farmers = Learning Group
ProduCer uNit
Collection of Learning Groups = Producer Unit
MALI
SENEGAL
Sikasso
Kolda
Growth
BCI Farmers Area under Better Cotton
Cultivation (ha)
Better Cotton Production
(MT lint)
201220112010 2013 2014
33,0
00
29,0
00
10,5
00 20,5
00
3,60
0
86,0
00
35,0
00
35,0
00
12,5
00 24,0
00
3,30
0
32,0
00
61,0
00
10,0
00
80,0
00
Cotton yields suffered in 2014, due to unfavourable weather conditions.
people
OR40% 2.5m
of rural households
depend on cotton for their livelihoods.
Since the Malian governmentstarted actively promotingcotton production in 1995,production has steadilyincreased.
Mali is now the 2nd largest cotton producer on the Africancontinent.
© Better Cotton Initiative
I have been growing cotton for nearly 40 years. We used to spray our 20ha with pesticides that even killed the snakes. After the treatments we didn’t feel well. We used to spray every two weeks, without any field observation first. I used an average of 120 litres of pesticides, costing me about 825 Euros. Since starting the Better Cotton programme in 2010, we have significantly reduced our pesticide use which increases our profits and is better for our health and our environment.
Drissa Coulibaly, BCI Farmer, Mali
“
”
Cotton is Mali's largest crop export.
www.bettercotton.org www.bettercotton.org
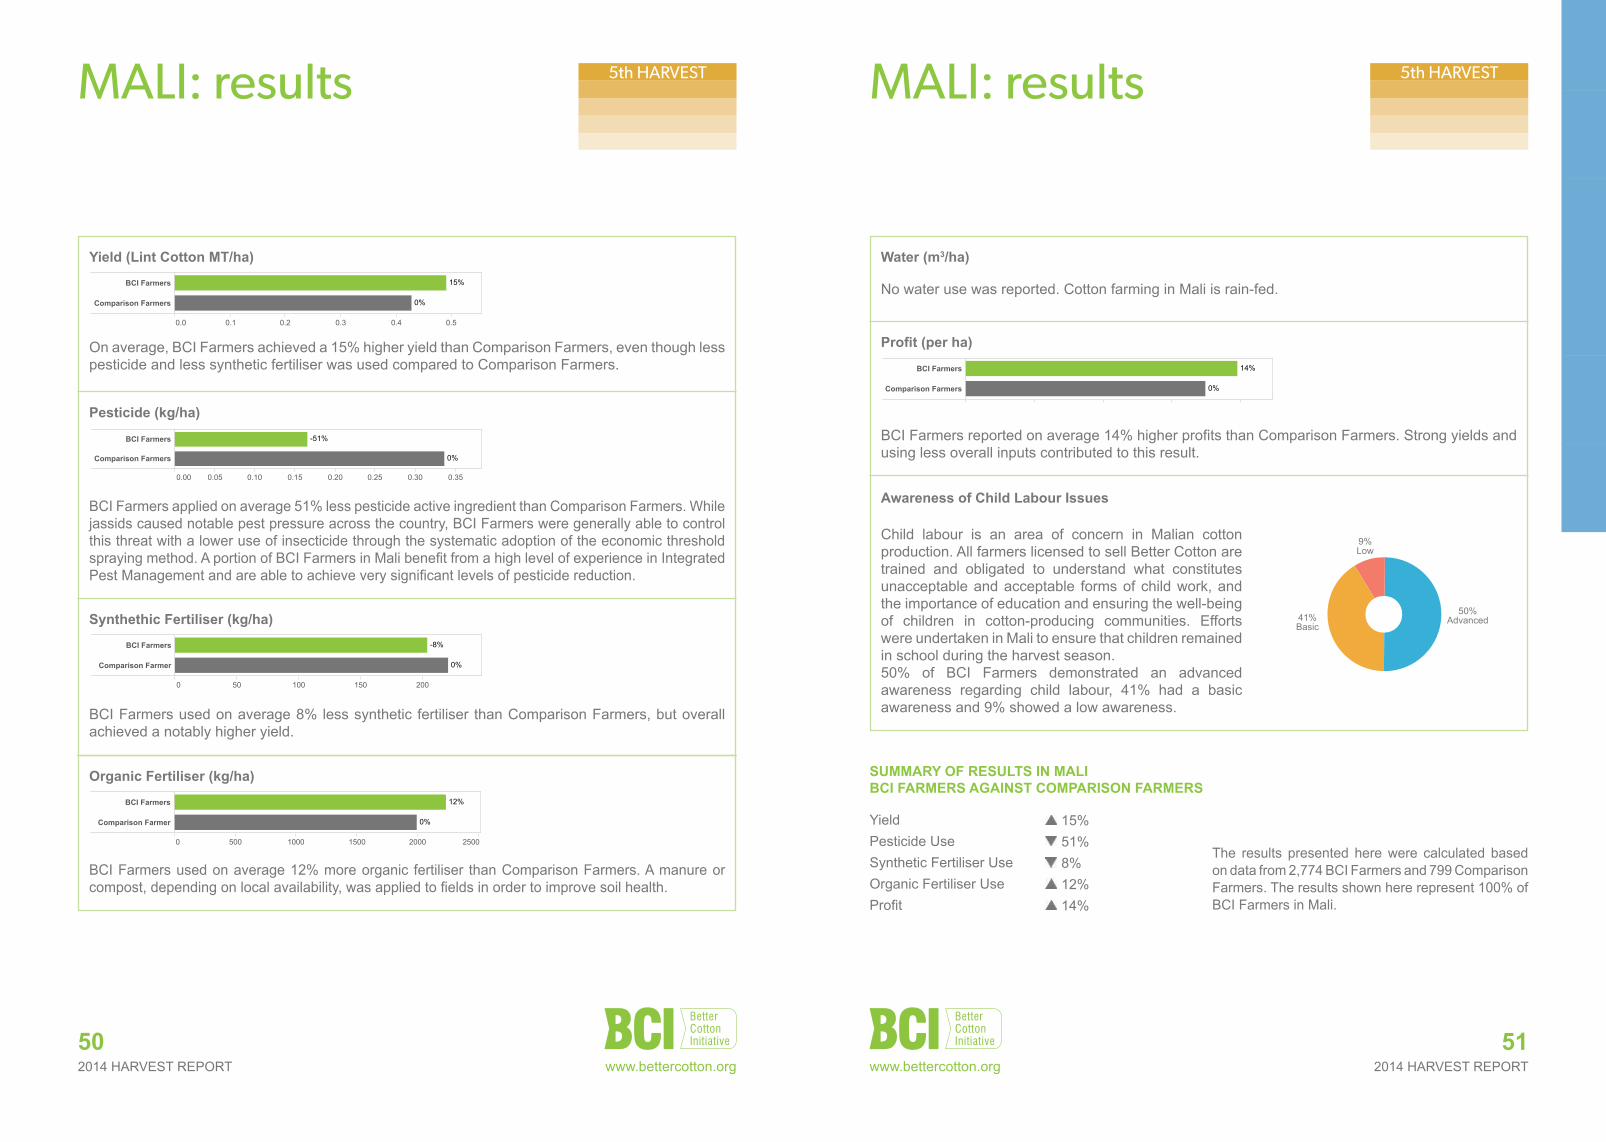
2014 HARVEST REPORT2014 HARVEST REPORT50
MALI: results
51
MALI: results
suMMarY oF resuLts iN MaLiBCi FarMers aGaiNst CoMParisoN FarMers
Yield 15%Pesticide Use 51%Synthetic Fertiliser Use 8%Organic Fertiliser Use 12%Profit 14%
The results presented here were calculated based on data from 2,774 BCI Farmers and 799 Comparison Farmers. The results shown here represent 100% of BCI Farmers in Mali.
5th HARVEST 5th HARVEST
On average, BCI Farmers achieved a 15% higher yield than Comparison Farmers, even though less pesticide and less synthetic fertiliser was used compared to Comparison Farmers.
BCI Farmers applied on average 51% less pesticide active ingredient than Comparison Farmers. While jassids caused notable pest pressure across the country, BCI Farmers were generally able to control this threat with a lower use of insecticide through the systematic adoption of the economic threshold spraying method. A portion of BCI Farmers in Mali benefit from a high level of experience in Integrated Pest Management and are able to achieve very significant levels of pesticide reduction.
Yield (Lint Cotton Mt/ha)
Pesticide (kg/ha)Sikasso
Mali
50%Advanced
41%Basic
9%Low
BCI Farmers Awareness aboutChild Labour Issues
Yield
Profit
Pesticides -51%
14%
15%
BCI Farmers vs Compari-son Farmers Performance
Organic Fertiliser
Synthetic Fertiliser -8%
12%
BCI Farmers ComparisonFarmers
7992,774
Number of Farmers
0.0 0.1 0.2 0.3 0.4 0.5
BCI Farmers
Comparison Farmers
15%
0%
Yield (Lint Cotton MT/ha)
0
BCI Farmers
Comparison Farmers
Water (m3/ha)
0K 50K 100K 150K 200K
BCI Farmers
Comparison Farmers
14%
0%
Profit (per ha)
0.0
BCI Farmers
Comparison Farmers
-51%
0%
Pesticide (kg/ha)
0 500 1000 1500 2000 2500
BCI Farmers
Comparison Farmer
12%
0%
Organic Fertiliser (kg/ha)
0 50 100 150 200
BCI Farmers
Comparison Farmer
-8%
0%
Synthetic Fertiliser (kg/ha)
Harvest Report - Mali
Sikasso
Mali
50%Advanced
41%Basic
9%Low
BCI Farmers Awareness aboutChild Labour Issues
Yield
Profit
Pesticides -51%
14%
15%
BCI Farmers vs Compari-son Farmers Performance
Organic Fertiliser
Synthetic Fertiliser -8%
12%
BCI Farmers ComparisonFarmers
7992,774
Number of Farmers
0.0 0.1 0.2 0.3 0.4 0.5
BCI Farmers
Comparison Farmers
15%
0%
Yield (Lint Cotton MT/ha)
0
BCI Farmers
Comparison Farmers
Water (m3/ha)
0K 50K 100K 150K 200K
BCI Farmers
Comparison Farmers
14%
0%
Profit (per ha)
0.00 0.05 0.10 0.15 0.20 0.25 0.30 0.35
BCI Farmers
Comparison Farmers
-51%
0%
Pesticide (kg/ha)
0 500 1000 1500 2000 2500
BCI Farmers
Comparison Farmer
12%
0%
Organic Fertiliser (kg/ha)
0 50 100 150 200
BCI Farmers
Comparison Farmer
-8%
0%
Synthetic Fertiliser (kg/ha)
Harvest Report - Mali
BCI Farmers used on average 8% less synthetic fertiliser than Comparison Farmers, but overall achieved a notably higher yield.
BCI Farmers used on average 12% more organic fertiliser than Comparison Farmers. A manure or compost, depending on local availability, was applied to fields in order to improve soil health.
synthethic Fertiliser (kg/ha)
organic Fertiliser (kg/ha)
Sikasso
Mali
50%Advanced
41%Basic
9%Low
BCI Farmers Awareness aboutChild Labour Issues
Yield
Profit
Pesticides -51%
14%
15%
BCI Farmers vs Compari-son Farmers Performance
Organic Fertiliser
Synthetic Fertiliser -8%
12%
BCI Farmers ComparisonFarmers
7992,774
Number of Farmers
0.0 0.1 0.2 0.3 0.4 0.5
BCI Farmers
Comparison Farmers
15%
0%
Yield (Lint Cotton MT/ha)
0
BCI Farmers
Comparison Farmers
Water (m3/ha)
0K 50K 100K 150K 200K
BCI Farmers
Comparison Farmers
14%
0%
Profit (per ha)
0.0
BCI Farmers
Comparison Farmers
-51%
0%
Pesticide (kg/ha)
0 500 1000 1500 2000 2500
BCI Farmers
Comparison Farmer
12%
0%
Organic Fertiliser (kg/ha)
0 50 100 150 200
BCI Farmers
Comparison Farmer
-8%
0%
Synthetic Fertiliser (kg/ha)
Harvest Report - Mali
Sikasso
Mali
50%Advanced
41%Basic
9%Low
BCI Farmers Awareness aboutChild Labour Issues
Yield
Profit
Pesticides -51%
14%
15%
BCI Farmers vs Compari-son Farmers Performance
Organic Fertiliser
Synthetic Fertiliser -8%
12%
BCI Farmers ComparisonFarmers
7992,774
Number of Farmers
0.0 0.1 0.2 0.3 0.4 0.5
BCI Farmers
Comparison Farmers
15%
0%
Yield (Lint Cotton MT/ha)
0
BCI Farmers
Comparison Farmers
Water (m3/ha)
0K 50K 100K 150K 200K
BCI Farmers
Comparison Farmers
14%
0%
Profit (per ha)
0.0
BCI Farmers
Comparison Farmers
-51%
0%
Pesticide (kg/ha)
0 500 1000 1500 2000 2500
BCI Farmers
Comparison Farmer
12%
0%
Organic Fertiliser (kg/ha)
0 50 100 150 200
BCI Farmers
Comparison Farmer
-8%
0%
Synthetic Fertiliser (kg/ha)
Harvest Report - Mali
BCI Farmers reported on average 14% higher profits than Comparison Farmers. Strong yields and using less overall inputs contributed to this result.
Child labour is an area of concern in Malian cotton production. All farmers licensed to sell Better Cotton are trained and obligated to understand what constitutes unacceptable and acceptable forms of child work, and the importance of education and ensuring the well-being of children in cotton-producing communities. Efforts were undertaken in Mali to ensure that children remained in school during the harvest season.50% of BCI Farmers demonstrated an advanced awareness regarding child labour, 41% had a basic awareness and 9% showed a low awareness.
Profit (per ha)
awareness of Child Labour issues
China India Pakistan Tajikistan Turkey Mali Mozambique
9%Low
41%Basic
50%Advanced
No water use was reported. Cotton farming in Mali is rain-fed.
water (m3/ha)
www.bettercotton.org www.bettercotton.org
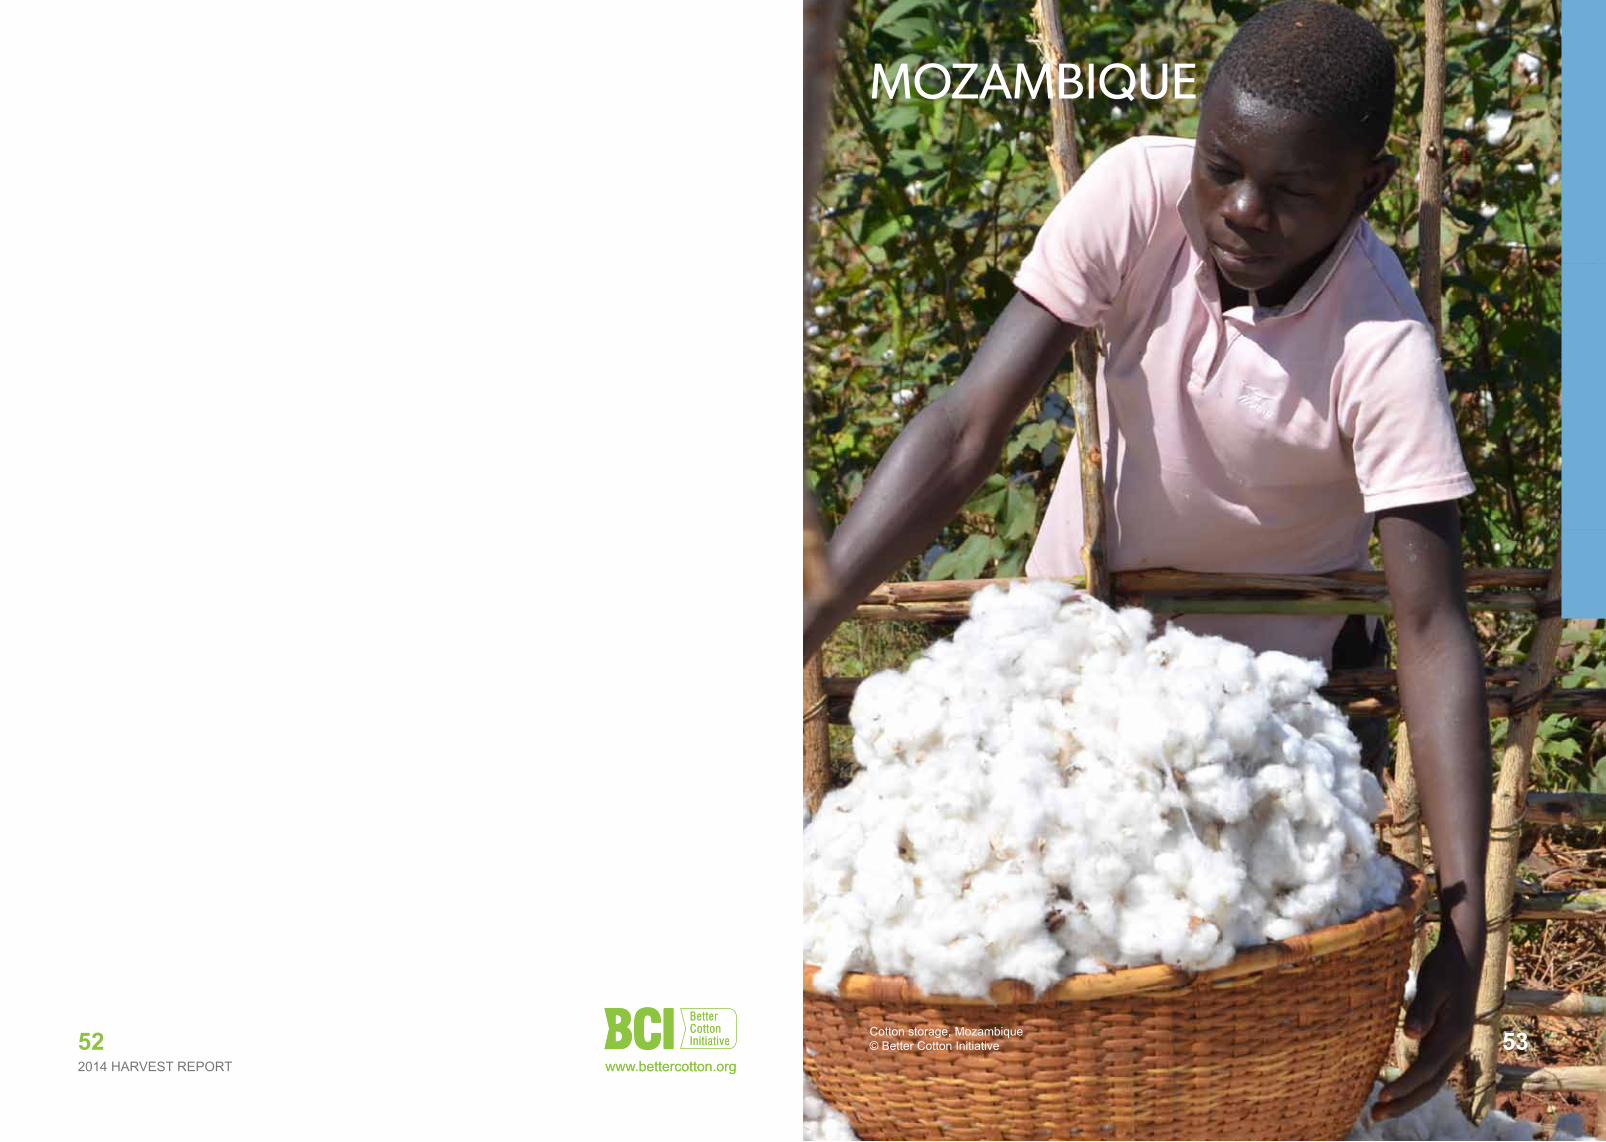
MOZAMBIQUE
Cotton storage, Mozambique© Better Cotton Initiative
2014 HARVEST REPORT www.bettercotton.org52 53
www.bettercotton.org

2014 HARVEST REPORT 2014 HARVEST REPORT54
MOZAMBIQUE
JANSowing
NOV – FEB
DEC
Better CottoN ProJeCts
orGaNisatioNIn 2014, BCi’s implementing Partners worked with 77,415 farmers organised into 26 Producer units. 74,824 farmers from 24 Pus in Mozambique earned a Better Cotton licence.
HarvestMAY – AUG
SowingNOV – FEB
55
MOZAMBIQUE 1st HARVEST
2nd HARVEST 2nd HARVEST
Zambezia
Nampula
Niassa
Mozambique
Map based on Longitude (generated) and Latitude (generated). The marks are labeled by Province. Details are shown for Country and Province. The data is filtered onAction (PU Code), which keeps 26 members.
strateGiC PartNers
iMPLeMeNtiNG PartNers
Growth
BCI Farmers Area under Better Cotton
Cultivation (ha)
Better Cotton Production
(MT lint)
2013 2014
1,30
0
75,0
00
6,30
0
9,50
0
52,6
00
6,00
0
Abnormally intense rainsacross Mozambique’scotton-growing regionsflooded many plantedareas in the 2014 season.BCI Farmers fared wellin the conditions, butcotton farming as a wholesuffered throughout thecountry.
© Better Cotton Initiative
IAM has become the first government organisation to adopt the Better Cotton Production Standard as its national cotton system. BCI is delighted by the leadership example the Mozambique government is setting in this field.
BCI CEO, Partrick Lane
“
”
Through an initial partnership with the government, which saw BCI’s Minimum Production Criteria embedded in the country’s cotton legislation, IAM, BCI’s Strategic Partner, is anticipating that
Mozambique will become the first country
to make 100% of its cotton production Better Cotton.
The price of cotton in Mozambique declined by 7% from the previous season.
$ $ $ $Synthetic fertilisers are generally not used in Mozambique due to lack of availibility.
Collection of farmers = Learning Group
ProduCer uNit
Collection of Learning Groups = Producer Unit
www.bettercotton.org www.bettercotton.org
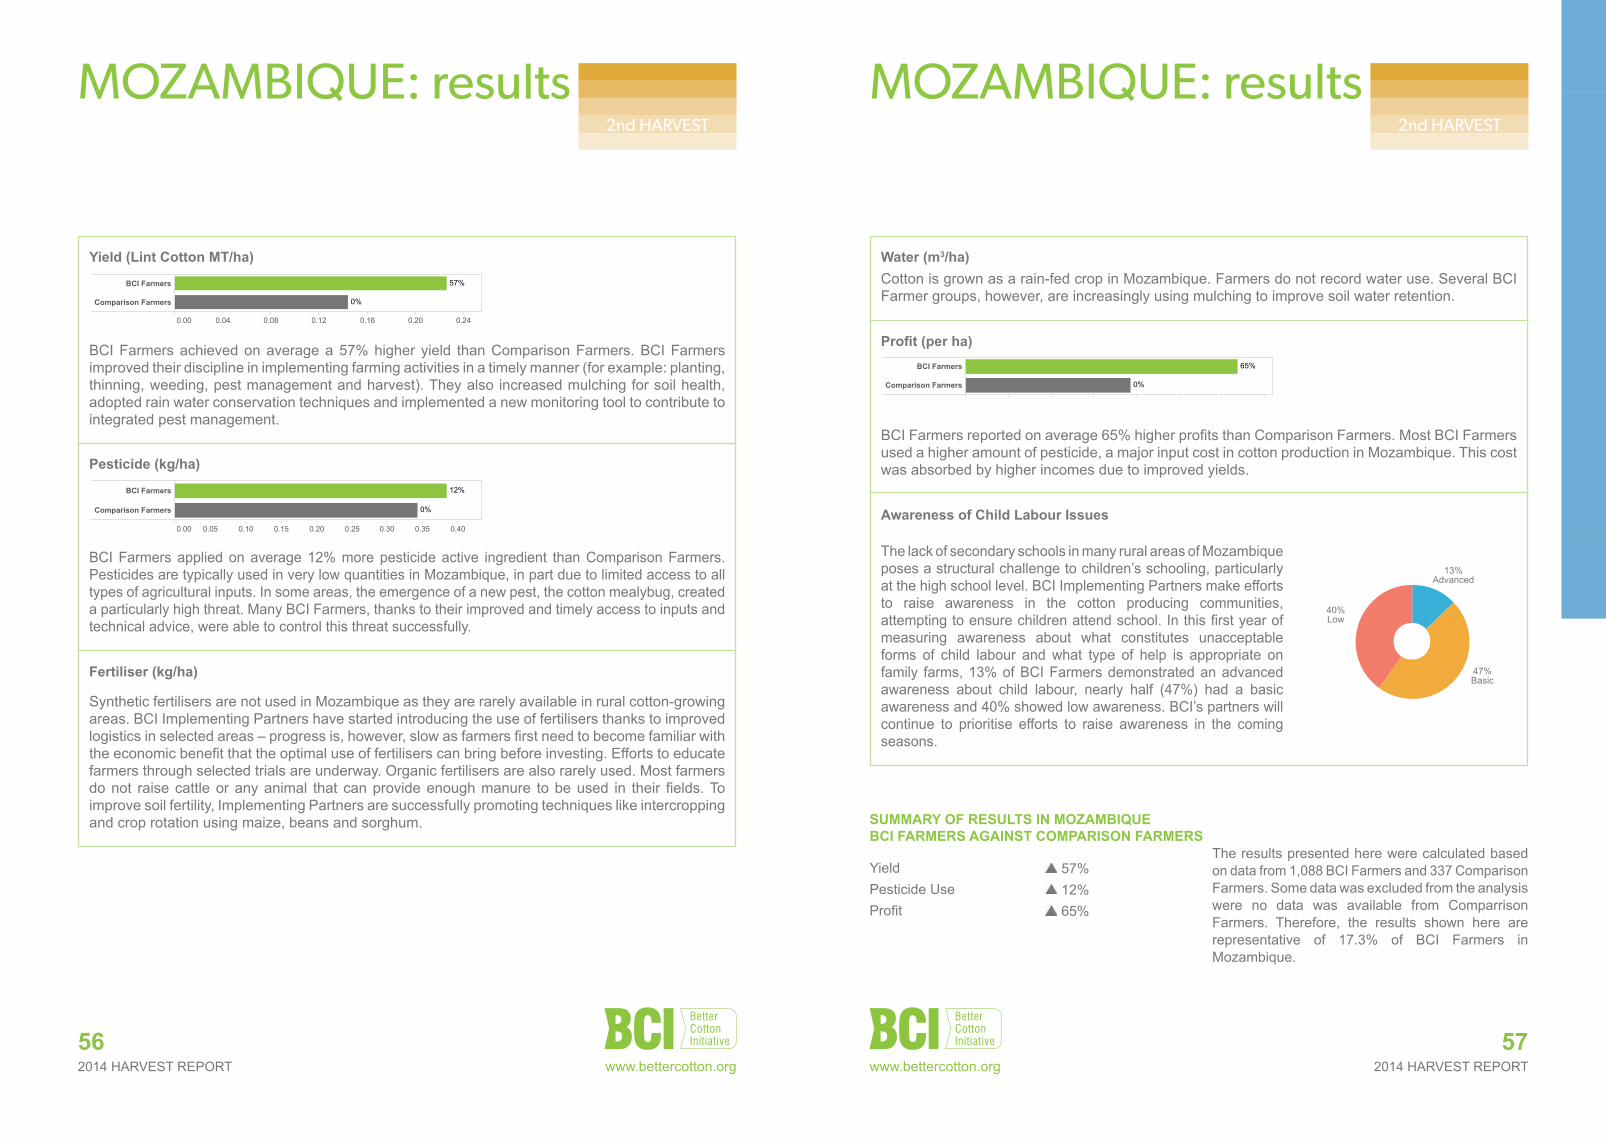
2014 HARVEST REPORT2014 HARVEST REPORT56
MOZAMBIQUE: results
57
MOZAMBIQUE: results2nd HARVEST 2nd HARVEST
Nampula
Mozambique
13%Advanced
47%Basic
40%Low
BCI Farmers Awareness aboutChild Labour Issues
Yield
Profit
Pesticide 12%
65%
57%
BCI Farmers vs Compar-ison Farmers Perfor-mance
BCI Farmers ComparisonFarmers
3371,088
Number of Farmers
0.00 0.04 0.08 0.12 0.16 0.20 0.24
BCI Farmers
Comparison Farmers
57%
0%
Yield (Lint Cotton MT/ha)
0K 1K 2K 3K 4K 5K 6K 7K
BCI Farmers
Comparison Farmers
65%
0%
Profit (per ha)
0.00 0.05 0.10 0.15 0.20 0.25 0.30 0.35 0.40
BCI Farmers
Comparison Farmers
12%
0%
Pesticide (kg/ha)
Harvest Report - Mozambique
suMMarY oF resuLts iN MoZaMBiQue BCi FarMers aGaiNst CoMParisoN FarMers
Yield 57%Pesticide Use 12%Profit 65%
The results presented here were calculated based on data from 1,088 BCI Farmers and 337 Comparison Farmers. Some data was excluded from the analysis were no data was available from Comparrison Farmers. Therefore, the results shown here are representative of 17.3% of BCI Farmers in Mozambique.
Nampula
Mozambique
13%Advanced
47%Basic
40%Low
BCI Farmers Awareness aboutChild Labour Issues
Yield
Profit
Pesticide 12%
65%
57%
BCI Farmers vs Compar-ison Farmers Perfor-mance
BCI Farmers ComparisonFarmers
3371,088
Number of Farmers
0.00 0.04 0.08 0.12 0.16 0.20 0.24
BCI Farmers
Comparison Farmers
57%
0%
Yield (Lint Cotton MT/ha)
0K 1K 2K 3K 4K 5K 6K 7K
BCI Farmers
Comparison Farmers
65%
0%
Profit (per ha)
0.00 0.05 0.10 0.15 0.20 0.25 0.30 0.35 0.40
BCI Farmers
Comparison Farmers
12%
0%
Pesticide (kg/ha)
Harvest Report - Mozambique
Profit (per ha)
BCI Farmers reported on average 65% higher profits than Comparison Farmers. Most BCI Farmers used a higher amount of pesticide, a major input cost in cotton production in Mozambique. This cost was absorbed by higher incomes due to improved yields.
China India Pakistan Tajikistan Turkey Mali Mozambique
40%Low
47%Basic
13%Advanced
The lack of secondary schools in many rural areas of Mozambique poses a structural challenge to children’s schooling, particularly at the high school level. BCI Implementing Partners make efforts to raise awareness in the cotton producing communities, attempting to ensure children attend school. In this first year of measuring awareness about what constitutes unacceptable forms of child labour and what type of help is appropriate on family farms, 13% of BCI Farmers demonstrated an advanced awareness about child labour, nearly half (47%) had a basic awareness and 40% showed low awareness. BCI’s partners will continue to prioritise efforts to raise awareness in the coming seasons.
awareness of Child Labour issues
Cotton is grown as a rain-fed crop in Mozambique. Farmers do not record water use. Several BCI Farmer groups, however, are increasingly using mulching to improve soil water retention.
water (m3/ha)
BCI Farmers achieved on average a 57% higher yield than Comparison Farmers. BCI Farmers improved their discipline in implementing farming activities in a timely manner (for example: planting, thinning, weeding, pest management and harvest). They also increased mulching for soil health, adopted rain water conservation techniques and implemented a new monitoring tool to contribute to integrated pest management.
Yield (Lint Cotton Mt/ha)
Pesticide (kg/ha)
BCI Farmers applied on average 12% more pesticide active ingredient than Comparison Farmers. Pesticides are typically used in very low quantities in Mozambique, in part due to limited access to all types of agricultural inputs. In some areas, the emergence of a new pest, the cotton mealybug, created a particularly high threat. Many BCI Farmers, thanks to their improved and timely access to inputs and technical advice, were able to control this threat successfully.
Fertiliser (kg/ha)
Synthetic fertilisers are not used in Mozambique as they are rarely available in rural cotton-growing areas. BCI Implementing Partners have started introducing the use of fertilisers thanks to improved logistics in selected areas – progress is, however, slow as farmers first need to become familiar with the economic benefit that the optimal use of fertilisers can bring before investing. Efforts to educate farmers through selected trials are underway. Organic fertilisers are also rarely used. Most farmers do not raise cattle or any animal that can provide enough manure to be used in their fields. To improve soil fertility, Implementing Partners are successfully promoting techniques like intercropping and crop rotation using maize, beans and sorghum.
Nampula
Mozambique
13%Advanced
47%Basic
40%Low
BCI Farmers Awareness aboutChild Labour Issues
Yield
Profit
Pesticide 12%
65%
57%
BCI Farmers vs Compar-ison Farmers Perfor-mance
BCI Farmers ComparisonFarmers
3371,088
Number of Farmers
0.00 0.04 0.08 0.12 0.16 0.20 0.24
BCI Farmers
Comparison Farmers
57%
0%
Yield (Lint Cotton MT/ha)
0K 1K 2K 3K 4K 5K 6K 7K
BCI Farmers
Comparison Farmers
65%
0%
Profit (per ha)
0.00 0.05 0.10 0.15 0.20 0.25 0.30 0.35 0.40
BCI Farmers
Comparison Farmers
12%
0%
Pesticide (kg/ha)
Harvest Report - Mozambique
www.bettercotton.org www.bettercotton.org

2014 HARVEST REPORT
SENEGAL
59© Better Cotton Initiative
angela anthony is 30 years old and a mother of eight children – six of which are twins.
Land allowances are managed by the government in Mozambique, and starting with just 0.5ha in 2000, as her family grew so did her land. With the help of her husband, she now earns her living farming cotton on 2ha of land in the Maratane community, Cuamba Province.
When JFSsan first approched the Maratane community there was resistance to following new crop management practices. Angela applied the new practices to a third of her land to test the results. That year the village suffered from a drought and poor crops were produced, however, the area used to test new practices was the salvation of the season. This experience served as an example for
her family and for the Maratane community as a whole, and the new practices were adopted in every area of cultivation.
“In the training, I learned about the risks of use and handling pesticides, the danger to pregnant women, nursing women and children. Because of this, no woman or child has contact with pesticides in the Maratane community anymore.” Angela says that in this season the yield was higher than the past season, and that with increased profits she wants to improve the conditions of their house and buy clothes and school materials for their children.
“The Maratane community sees a positive example in my family that they can follow. They see the benefit in adopting the farming practices that we learnt in Better Cotton training.” © Better Cotton Initiative
58www.bettercotton.org
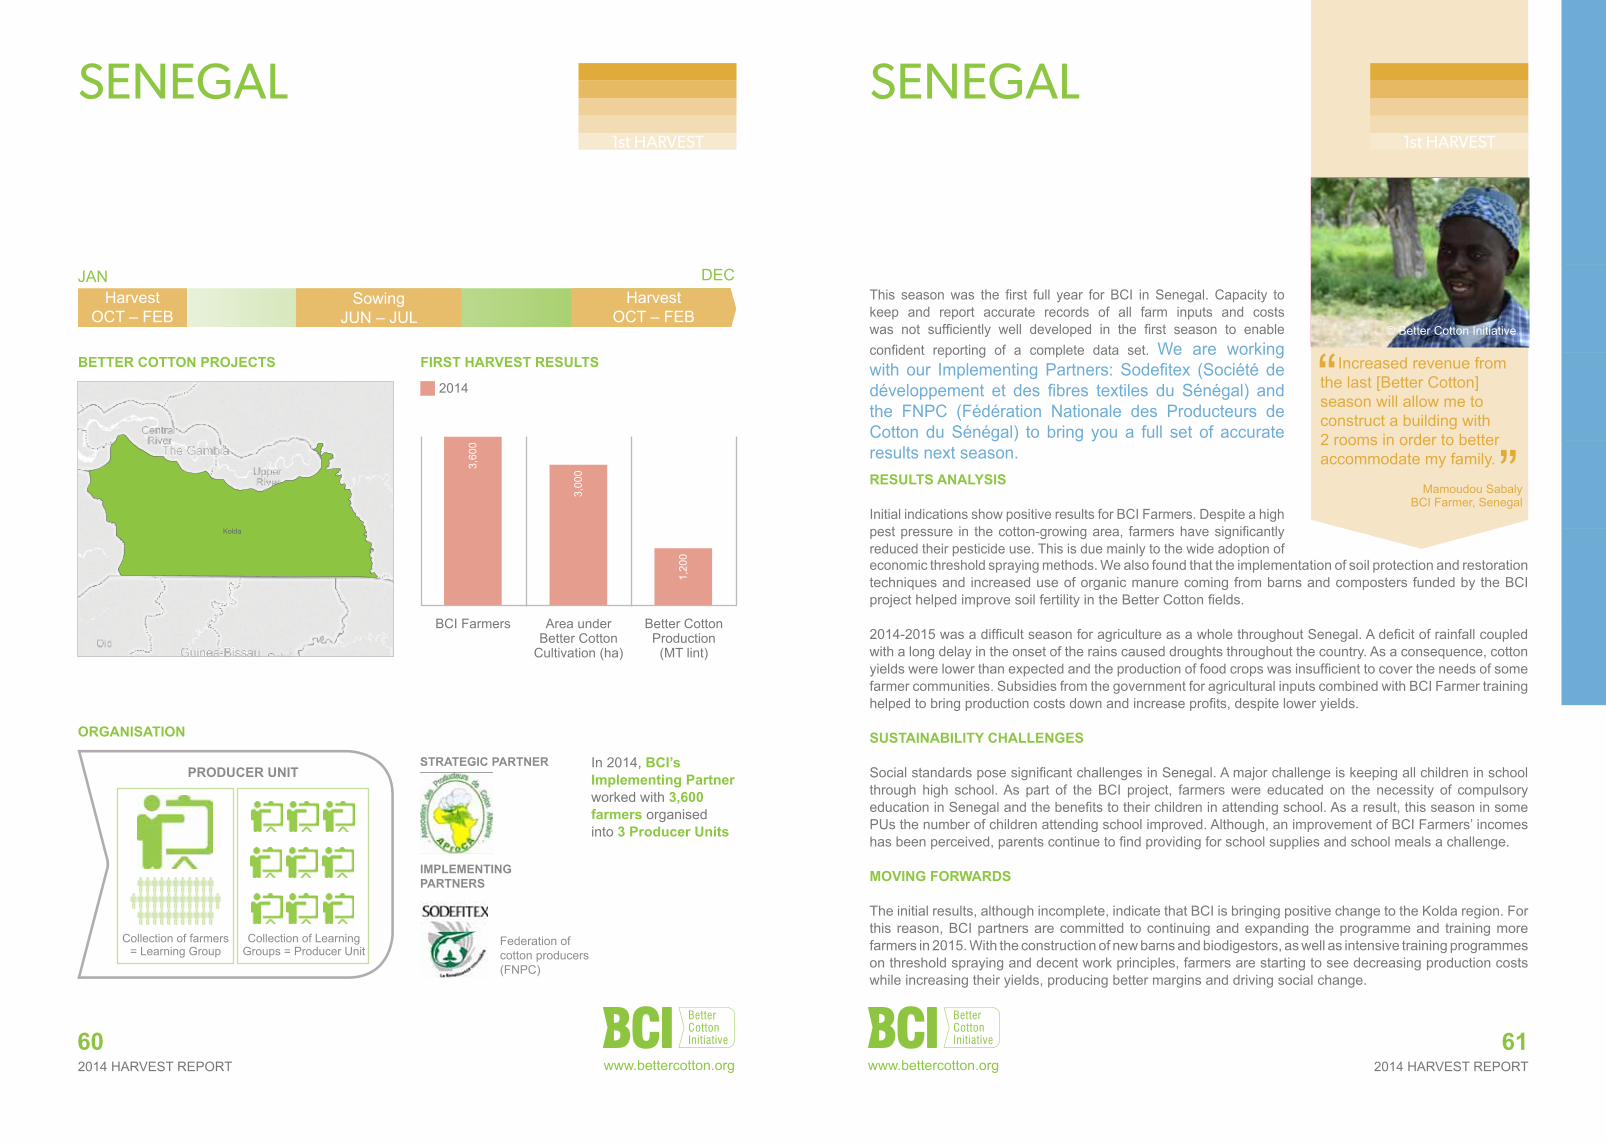
2014 HARVEST REPORT2014 HARVEST REPORT60
SENEGAL
Better CottoN ProJeCts
In 2014, BCi’s implementing Partner worked with 3,600 farmers organised into 3 Producer units
iMPLeMeNtiNG PartNers
orGaNisatioN
First harvest resuLts
61
SENEGAL 1st HARVEST
resuLts aNaLYsis
Initial indications show positive results for BCI Farmers. Despite a high pest pressure in the cotton-growing area, farmers have significantly reduced their pesticide use. This is due mainly to the wide adoption of
This season was the first full year for BCI in Senegal. Capacity to keep and report accurate records of all farm inputs and costs was not sufficiently well developed in the first season to enable confident reporting of a complete data set. We are working with our Implementing Partners: Sodefitex (Société de développement et des fibres textiles du Sénégal) and the FNPC (Fédération Nationale des Producteurs de Cotton du Sénégal) to bring you a full set of accurate results next season.
1st HARVEST
Increased revenue from the last [Better Cotton] season will allow me to construct a building with 2 rooms in order to better accommodate my family.
Mamoudou SabalyBCI Farmer, Senegal
“”
© Better Cotton Initiative
MALI
SENEGAL
Sikasso
Kolda
BCI Farmers Area under Better Cotton
Cultivation (ha)
Better Cotton Production
(MT lint)
2014
1,20
0
3,60
0
3,00
0
JANSowing
JUN – JULHarvest
OCT – FEBHarvest
OCT – FEB
DEC
1st HARVEST
economic threshold spraying methods. We also found that the implementation of soil protection and restoration techniques and increased use of organic manure coming from barns and composters funded by the BCI project helped improve soil fertility in the Better Cotton fields.
2014-2015 was a difficult season for agriculture as a whole throughout Senegal. A deficit of rainfall coupled with a long delay in the onset of the rains caused droughts throughout the country. As a consequence, cotton yields were lower than expected and the production of food crops was insufficient to cover the needs of some farmer communities. Subsidies from the government for agricultural inputs combined with BCI Farmer training helped to bring production costs down and increase profits, despite lower yields.
sustaiNaBiLitY ChaLLeNGes
Social standards pose significant challenges in Senegal. A major challenge is keeping all children in school through high school. As part of the BCI project, farmers were educated on the necessity of compulsory education in Senegal and the benefits to their children in attending school. As a result, this season in some PUs the number of children attending school improved. Although, an improvement of BCI Farmers’ incomes has been perceived, parents continue to find providing for school supplies and school meals a challenge.
MoviNG Forwards
The initial results, although incomplete, indicate that BCI is bringing positive change to the Kolda region. For this reason, BCI partners are committed to continuing and expanding the programme and training more farmers in 2015. With the construction of new barns and biodigestors, as well as intensive training programmes on threshold spraying and decent work principles, farmers are starting to see decreasing production costs while increasing their yields, producing better margins and driving social change.
strateGiC PartNer
Federation of cotton producers (FNPC)
Collection of farmers = Learning Group
ProduCer uNit
Collection of Learning Groups = Producer Unit
www.bettercotton.org www.bettercotton.org

2014 HARVEST REPORT62 63
USA
3rd party verification, USA© Better Cotton Initiative
www.bettercotton.org
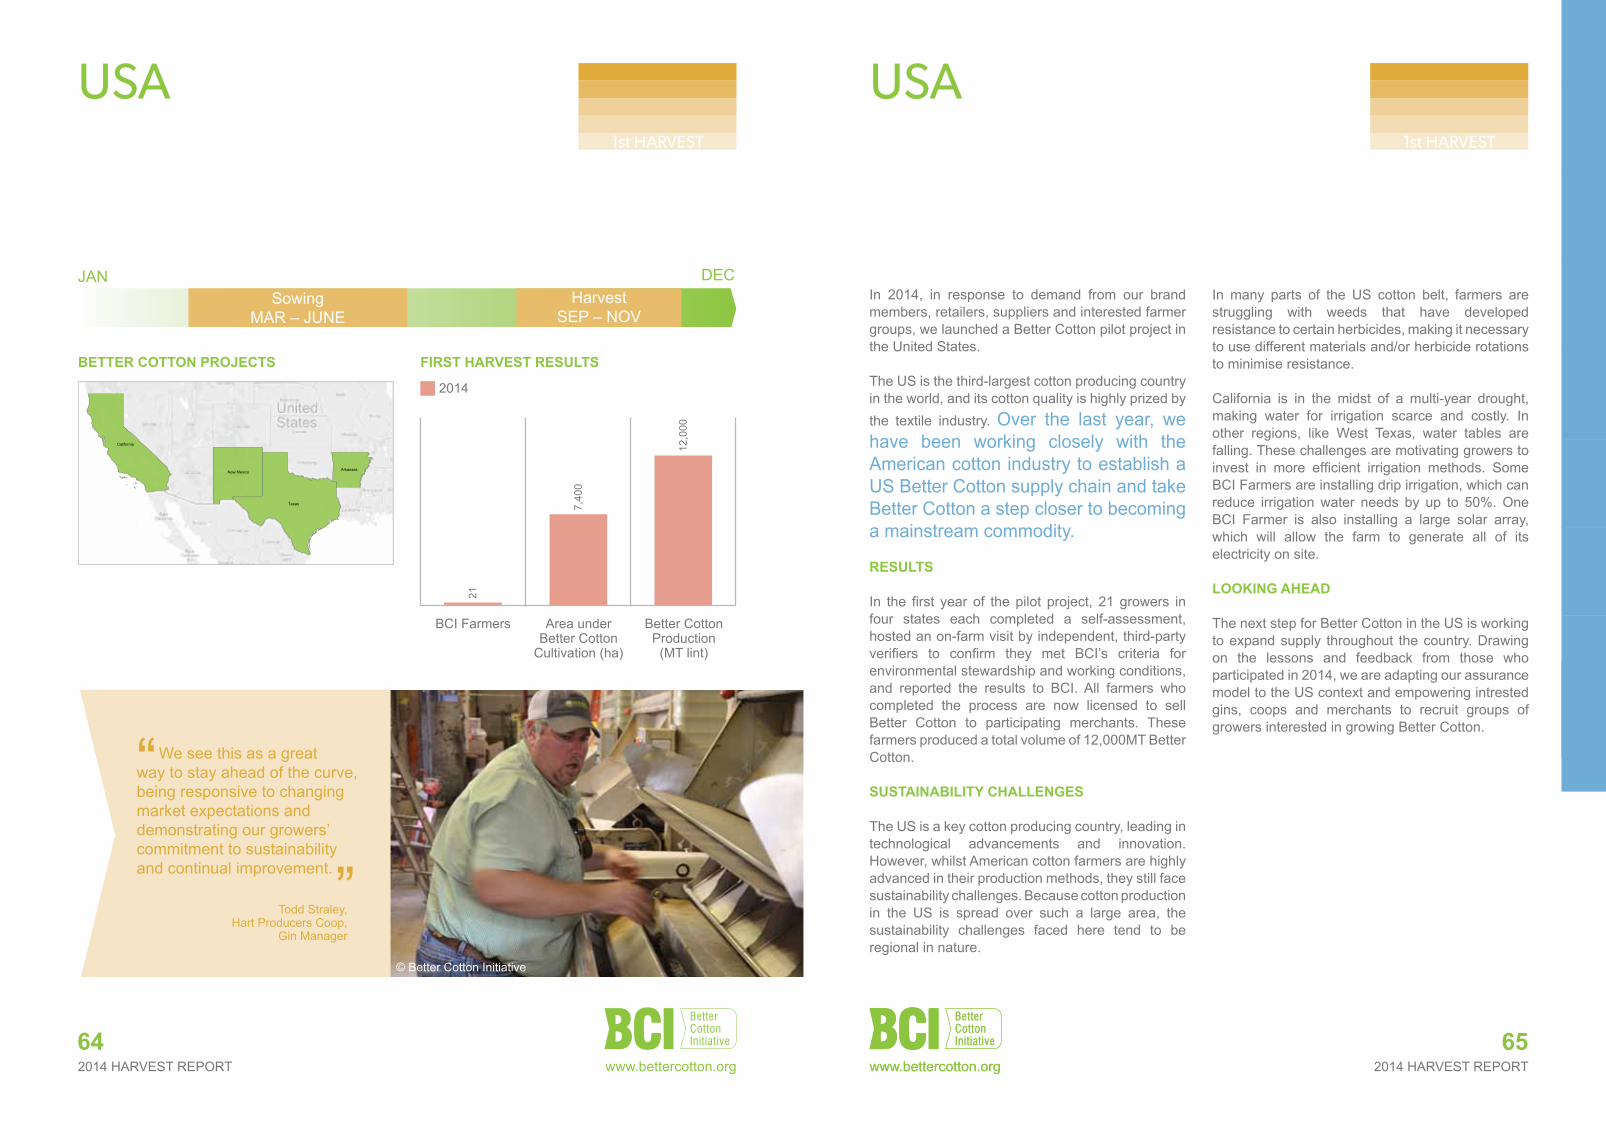
www.bettercotton.org 2014 HARVEST REPORT2014 HARVEST REPORT64
USA USA 1st HARVEST
New Mexico
California
Arkansas
Texas
United States
Map based on Longitude (generated) and Latitude (generated). The marks are labeled by Province. Details are shown for Country and Province. The data is filtered onAction (Farm Category), which keeps 1 member. The view is filtered on Latitude (generated) and Longitude (generated). The Latitude (generated) filter keeps non-Null values only. The Longitude (generated) filter keeps non-Null values only.
1st HARVEST 1st HARVEST
In 2014, in response to demand from our brand members, retailers, suppliers and interested farmer groups, we launched a Better Cotton pilot project in the United States.
The US is the third-largest cotton producing country in the world, and its cotton quality is highly prized by the textile industry. Over the last year, we have been working closely with the American cotton industry to establish a US Better Cotton supply chain and take Better Cotton a step closer to becoming a mainstream commodity.
resuLts
In the first year of the pilot project, 21 growers in four states each completed a self-assessment, hosted an on-farm visit by independent, third-party verifiers to confirm they met BCI’s criteria for environmental stewardship and working conditions, and reported the results to BCI. All farmers who completed the process are now licensed to sell Better Cotton to participating merchants. These farmers produced a total volume of 12,000MT Better Cotton.
sustaiNaBiLitY ChaLLeNGes
The US is a key cotton producing country, leading in technological advancements and innovation. However, whilst American cotton farmers are highly advanced in their production methods, they still face sustainability challenges. Because cotton production in the US is spread over such a large area, the sustainability challenges faced here tend to be regional in nature.
In many parts of the US cotton belt, farmers are struggling with weeds that have developed resistance to certain herbicides, making it necessary to use different materials and/or herbicide rotations to minimise resistance.
California is in the midst of a multi-year drought, making water for irrigation scarce and costly. In other regions, like West Texas, water tables are falling. These challenges are motivating growers to invest in more efficient irrigation methods. Some BCI Farmers are installing drip irrigation, which can reduce irrigation water needs by up to 50%. One BCI Farmer is also installing a large solar array, which will allow the farm to generate all of its electricity on site.
LooKiNG ahead
The next step for Better Cotton in the US is working to expand supply throughout the country. Drawing on the lessons and feedback from those who participated in 2014, we are adapting our assurance model to the US context and empowering intrested gins, coops and merchants to recruit groups of growers interested in growing Better Cotton.
Better CottoN ProJeCts First harvest resuLts
BCI Farmers Area under Better Cotton
Cultivation (ha)
Better Cotton Production
(MT lint)
2014
12,0
00
21
7,40
0
65
JANSowing
MAR – JUNEHarvest
SEP – NOV
DEC
We see this as a great way to stay ahead of the curve, being responsive to changing market expectations and demonstrating our growers’ commitment to sustainability and continual improvement.
Todd Straley,Hart Producers Coop,
Gin Manager
“
”© Better Cotton Initiative
www.bettercotton.org www.bettercotton.org
2014 HARVEST REPORT67
BENCHMARKED STANDARDS
Cotton close up, USA© Better Cotton Initiative66
www.bettercotton.org

2014 HARVEST REPORT68
what do we MeaN BY ‘BeNChMarKiNG’?
Benchmarking (or ‘recognition agreement’) refers to a process of comparing one organisation’s policies and practices with those of similar organisations in the same field. Within the field of sustainability initiatives, it tends to refer to comparing standards systems with a view to identifying gaps between them.
The Better Cotton Standard covers a number of dimensions, both normative (setting and implementing standards) and procedural (how things are done). So for us, the benchmarking process needs to pay careful attention to comparison of standards, but also needs to look further – to the way in which BCI and the entity or initiative in question make decisions, enable improvement of farmer performance, judge compliance, evaluate impact and collect data, finance themselves and track product through the supply chain.
This process is undertaken by an independent, competent third party. The benchmarking exercise needs to provide practical recommendations both to us and to the other entity or initiative so that, where necessary, amendments can be agreed that allow us to recognise an existing standard or programme as delivering Better Cotton: so-called ‘one-way recognition’.
wheN is a BeNChMarKiNG ProCess eNtered?
A benchmarking process is considered if a national standard for sustainable cotton production exists and is publicly available in a country. We initiate a benchmarking process only if a credible Stategic Partner is available in the country and the proposal is in line with our expansion strategy. Benchmarking can be an effective way to mainstream sustainability in cotton production, by building on existing knowledge and activities through meaningful partnerships.
where do we worK iN a BeNChMarKed CoNteXt?
2014 saw BCI successfully complete the benchmarking of Australia’s nationally-developed cotton standard, myBMP (My Best Management Practice), so that it is now aligned with the Better Cotton Standard. The original BMP programme
began in 1997 before being reviewed and redeveloped in 2006-07, leading to the launch of a new online myBMP system in 2010.
Recognition of the myBMP programme in Australia follows our achievement in 2013 when BCI finalised a benchmarking exercise with ABRAPA (Associação Brasileiro dos Produtores de Algodão). This alignment of ABRAPA’s own ABR (Algodão Brasileiro Responsável / Responsible Brazilian Cotton) programme with the Better Cotton Standard led to a large increase in the availability of Better Cotton in the market place. Complementing this, it’s now been two years since benchmarking the ‘Cotton made in Africa’ (CmiA) and ‘Subsaharan Cotton Standard’ (SCS) of Aid by Trade Foundation (AbTF) with the Better Cotton Standard. In this case, we have also seen a notable increase in the volume of CmiA and SCS cotton available for sale as Better Cotton to BCI members.
rePortiNG oN resuLts iNdiCators iN a BeNChMarKiNG CoNteXt
Reporting on Results Indicators is fully integrated into the Better Cotton requirements to ensure that sustainability improvements are measured everywhere Better Cotton is produced. We also develop results monitoring and data sharing agreements with the other standards and programmes with which we have benchmarking agreements. We believe it’s important to harmonise our efforts on a set of common indicators so that our measurement of results and impact in the future can be coherent across cotton sustainability initiatives with which we partner, ultimately working towards a more sustainable sector as a whole.
With this approach, we engage in joint results monitoring and learning with these standards and programmes while allowing them to publicly communicate their results when and how they choose. This is why we only present our global indicators – BCI Farmers, hectares under Better Cotton cultivation and MT lint of Better Cotton – for benchmarked standards in this report. In this report we share the exciting progress made in our partnerships during the 2014 season.
69Georgie Carberry, Australia © Cotton Australia
AUSTRALIA
www.bettercotton.org

www.bettercotton.org 2014 HARVEST REPORT2014 HARVEST REPORT70
AUSTRALIA
71
AUSTRALIA
Cotton Australia, the leading body for Australia’s cotton-growing industry, supports over 1,500 cotton farming families in the states of New South Wales and Queensland.
In 2012, Cotton Australia contacted BCI to begin discussions about producing Better Cotton in the country. This led to Cotton Australia joining BCI as a member organisation, and starting the benchmarking process to align myBMP (the Australian cotton industry’s voluntary farm and environmental management system) with the Better Cotton Standard System. We were proud to be able to recognise this through the signing of a formal Strategic Partnership with Cotton Australia in 2014. This partnership means that certified myBMP growers now have the opportunity to increase market awareness of their lint by offering it as Better Cotton.
resuLts
In the first year of our partnership, 22 certified myBMP growers opted-in to the Better Cotton programme, producing 54,000MT of Better Cotton lint that was sold to markets across the world.
sustaiNaBiLitY ChaLLeNGes
Due to Australia’s harsh climate, water usage is a major sustainability challenge throughout the country. However, Australia’s cotton industry is considered one of the most water-efficient in the world. Due to a drought, 2014 was a particularly challenging year for Australian cotton growers. The final area planted was only 50% compared to 2013. Through well-developed agronomic practices, however, growers were able to achieve record yields (of up to 2,953 kg [13 bales] /ha) which provided some degree of compensation.
The Australian cotton industry faces challenges in other areas, including sufficient access to additional pesticides that would improve resistance management options for weeds and insects. Availability is mainly limited due to the relatively small market size and regulatory costs for chemical registration. In 2015, Australia’s first ‘AgVet Chemical Priority List’ was developed and contains 400 cross-industry priorities for key weed, pest and disease challenges that can be addressed through improved access to agricultural (and veterinary) chemicals. The cost of energy and fertiliser is a key concern. Cotton Australia continues to advocate the government regarding electricty pricing whilst the farmers continue to fund research into energy and fertiliser use efficiency.
In relation to the safety of workers on cotton farms, Cotton Australia has recently upgraded this section of the myBMP programme. A series of workshops have been delivered to ensure farmers are up to date and that worker safety is the highest priority on every farm.
LooKiNG ahead
Over the coming year, the newly formed BCI-Cotton Australia Partnership is expected to encourage more Australian growers to get on board with the myBMP programme. This will continue to raise awareness of sustainability issues in Australia and it is anticipated that as this momentum grows, many more Australian growers will opt-in to become part of the Better Cotton Initiative.
New South Wales
Queensland
Australia
Map based on Longitude (generated) and Latitude (generated). The marks are labeled by Province. Details are shown for Country and Province. The data is filtered onAction (Farm Category), which keeps 1 member. The view is filtered on Latitude (generated) and Longitude (generated). The Latitude (generated) filter keeps non-Null values only. The Longitude (generated) filter keeps non-Null values only.
myBMP reGioNs First harvest resuLts
BCI Farmers Area under Better Cotton
Cultivation (ha)
Better Cotton Production
(MT lint)
2014
54,0
00
22
27,0
00
JAN DECHarvest
MAR – MAYSowing
SEP – NOV
1st HARVEST 1st HARVEST
Access to future growth markets is of tremendous importance to Australian cotton growers, particularly as they contend with competition from synthetic fibres. Within the global natural fibre market, demand for responsibly grown cotton is growing, and this agreement allows Australian cotton growers to participate more easily in that expanding market.
Adam Kay,Cotton Australia CEO
“
” © Better Cotton Initiative
www.bettercotton.org www.bettercotton.org

2014 HARVEST REPORT73Ginning facility, Brazil
© Better Cotton Initiative
© Cotton Austrailia
72
ALGODÃO BRASILEIRO RESPONSÁVEL (ABR), BRAZIL
Barb Grey and her husband, ralph, farm 2,170 hectares in south west Queensland, where 17% of the property is a strict farming and grazing exclusion zone to protect native plants and animals.
In summer 2015, Barb Grey and her husband, Ralph, became BCI Farmers after participating in Australia’s myBMP programme for 25 years. Barb and Ralph began farming in 1979 and as the industry expanded in the 1990’s, they and other Australian farmers realised the need to better manage cotton farming practices. Major changes and steady improvements over time have helped transform the way Barb and Ralph produce cotton. Since 1980, Barb and Ralph have reduced chemical sprays from 11 to just one or two per season. They’ve also improved water use efficiency by 300%.
The myBMP programme and participation in BCI have given Barb and Ralph confidence in their farming practices. The comprehensive suite of guidelines covering all aspects of production allow
Barb and Ralph to meet increasing demands for accountability in the textile supply chain. “It’s clear that brands and retailers now demand accountability and traceability in their cotton products, and part of this is delivered by BCI. These businesses seek to be far more informed around the ‘how’ in the production of Australia’s cotton, and want to be reassured of the care and consideration given to the environment and our community,” said Barb.
Barb, Ralph and their farm staff are proud to be producing cotton to myBMP and BCI standards. While conserving resources, caring for worker safety and protecting local flora and fauna, Barb and Ralph feel that BCI helps to connect their responsible farming practices to the global supply chain.
Australian cotton producers can be remote from the end-user, and vice-versa. BCI bridges the gap, bringing both ends of the supply chain closer together.
Barb Grey, BCI Farmer, Australia
“
”
www.bettercotton.org

2014 HARVEST REPORT2014 HARVEST REPORT74
ABR, BRAZIL
JANSowing
OCT – MAR
DECHarvest
APR – SEPSowing
OCT – MAR
75
ABR, BRAZIL
During this fourth year of Better Cotton production in Brazil, BCI’s Implementing Partner, ABRAPA (Associação Brasileiro dos Produtores de Algodão), evolve to become a Strategic Partner, taking the lead for Better Cotton in Brazil. This followed the benchmarking of ABRAPA’s own standard – ABR (Algodao Brasileiro Responsavel) – with the Better Cotton Standard System through a comprehensive exercise.
ABRAPA, the Brazilian Cotton Growers’ Association, was established in 1999 and consists of nine state associations: Abapa (Bahia), Acopar (Paraná), Agopa (Goiás), Amapa (Maranhão), Amipa (Minas Gerais), Ampa (Mato Grosso), Ampasul (Mato Grosso do Sul), Apipa (Piauí) and Appa (São Paulo). Today, ABRAPA represents growers that produce about 99% of Brazil’s cotton production mainly on large-scale mechanised farms with the aim of ‘assuring and improving the profitability of the cotton sector, while seeking a strategic level of sustainability’. ABRAPA says this will be achieved by ‘working together with the public and private sectors in order to foster improvements in production while being socially and environmentally responsible’.
resuLts
In 2014, 190 cotton farmers were licensed to grow Better Cotton, between them growing 768,000MT of Better Cotton lint. Six states are now part of the programme in Brazil, which has led to a dramatic increase in the number of growers participating and a record crop of Better Cotton.
Better Cotton currently accounts for more than 45% of the national cotton crop in Brazil, making Brazil the largest source of Better Cotton globally. The volumes achieved this year provided a major boost to the availability of Better Cotton in the market place and contributed significantly towards exceeding our global production targets.
sustaiNaBiLitY ChaLLeNGes
Brazilian cotton is mainly rain-fed, which presented significant challenges for some growers in 2014 due to disruptive weather patterns. In some states, sowing dates had to be shifted significantly, and in many cases the final planted area was considerably reduced, leading to a smaller crop than was anticipated earlier in the season. Such obstacles have been successfully countered by the growers’ high levels of expertise, combined with the adoption of developing technologies such as precision agriculture. This has helped to ensure the efficient utilisation of inputs and resultant yields that contribute towards the ongoing sustainability of cotton production in Brazil.
LooKiNG ahead
As brand awareness and demand for Better Cotton increase, so does interest from growers in being part of the programme. We expect that in 2015 growers from an additional state will be enrolled. This will likely lead to a further increase in the number of growers and the volume of Better Cotton being produced in Brazil.
Mato Grosso do Sul
Minas Gerais
Mato Grosso
Maranhão
Goiás
Bahia
Brazil
Map based on Longitude (generated) and Latitude (generated). The marks are labeled by Province. Details are shown for Country and Province. The data is filtered onAction (Farm Category) and Action (PU Code). The Action (Farm Category) filter keeps 1 member. The Action (PU Code) filter keeps 1 member. The view is filtered on Latitude (generated) and Longitude (generated). The Latitude (generated) filter keeps non-Null values only. The Longitude (generated) filter keeps non-Null values only.
4th HARVEST 4th HARVEST
aBr reGioNs Growth
BCI Farmers Area under Better Cotton
Cultivation (ha)
Better Cotton Production
(MT lint)
2012 20132011 2014
130
190
107
50
188,
000 32
1,00
0
558,
000
210,
000
295,
000
27,0
00
39,0
00
768,
000
The ABR certification gives credibility to all we do on the farm. It concerns not only environmental sustainability, but also the social component including security at work. It is an accrediation of all we do for the external market - it’s really positive.
Elaine Lourenco Coordinator of Environmental Managment,
Grupo Bom Futuro, Brazil
“
”
www.bettercotton.org www.bettercotton.org
2014 HARVEST REPORT76 77
COTTON MADE IN AFRICA (CmiA) and SMALLHOLDER COTTON STANDARD (SCS)
© Paul Hahn, Aid by Trade Foundation
www.bettercotton.org
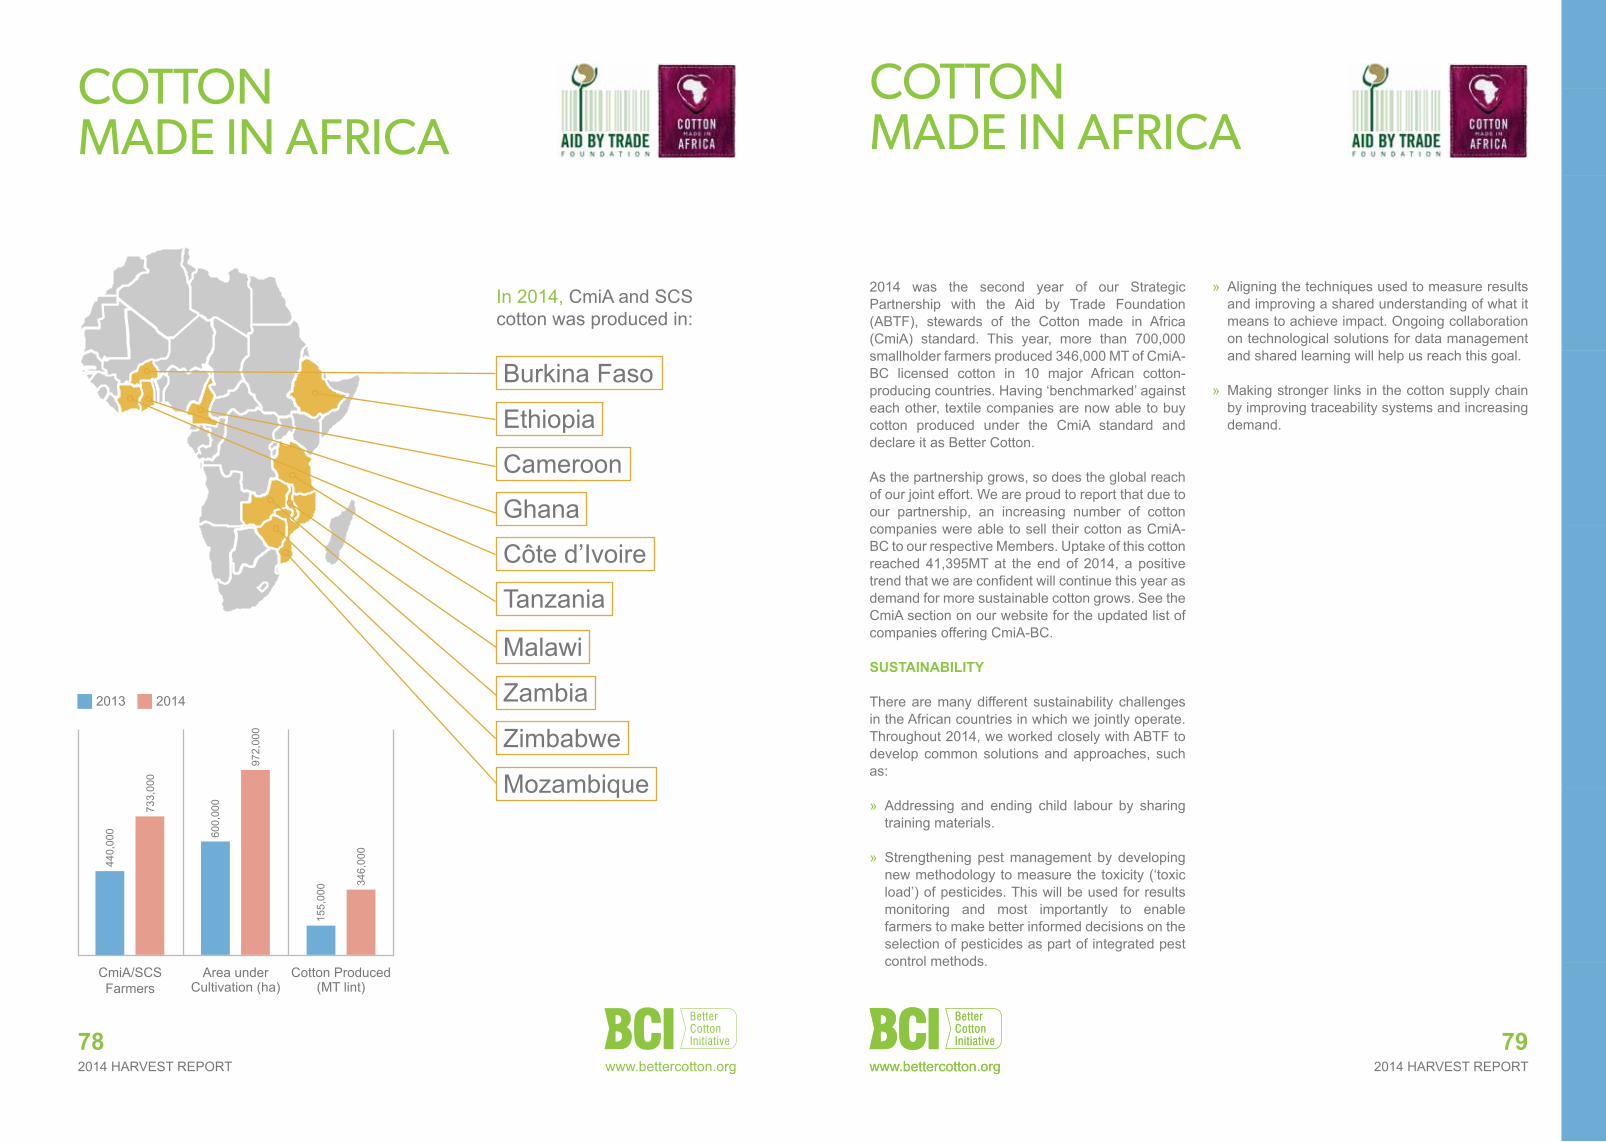
www.bettercotton.org 2014 HARVEST REPORT2014 HARVEST REPORT78
COTTON MADE IN AFRICA
2014 was the second year of our Strategic Partnership with the Aid by Trade Foundation (ABTF), stewards of the Cotton made in Africa (CmiA) standard. This year, more than 700,000 smallholder farmers produced 346,000 MT of CmiA-BC licensed cotton in 10 major African cotton-producing countries. Having ‘benchmarked’ against each other, textile companies are now able to buy cotton produced under the CmiA standard and declare it as Better Cotton.
As the partnership grows, so does the global reach of our joint effort. We are proud to report that due to our partnership, an increasing number of cotton companies were able to sell their cotton as CmiA-BC to our respective Members. Uptake of this cotton reached 41,395MT at the end of 2014, a positive trend that we are confident will continue this year as demand for more sustainable cotton grows. See the CmiA section on our website for the updated list of companies offering CmiA-BC.
sustaiNaBiLitY
There are many different sustainability challenges in the African countries in which we jointly operate. Throughout 2014, we worked closely with ABTF to develop common solutions and approaches, such as:
» Addressing and ending child labour by sharing training materials.
» Strengthening pest management by developing new methodology to measure the toxicity (‘toxic load’) of pesticides. This will be used for results monitoring and most importantly to enable farmers to make better informed decisions on the selection of pesticides as part of integrated pest control methods.
» Aligning the techniques used to measure results and improving a shared understanding of what it means to achieve impact. Ongoing collaboration on technological solutions for data management and shared learning will help us reach this goal.
» Making stronger links in the cotton supply chain by improving traceability systems and increasing demand.
79
COTTON MADE IN AFRICA
2013 2014
CmiA/SCS Farmers
Area under Cultivation (ha)
Cotton Produced (MT lint)
733,
000
440,
000
155,
000 34
6,00
0
972,
000
600,
000
In 2014, CmiA and SCS cotton was produced in:
www.bettercotton.org www.bettercotton.org
Zambia
Zimbabwe
Burkina Faso
Tanzania
Mozambique
Malawi
Ghana
Ethiopia
Côte d’Ivoire
Cameroon
Cotton flower close up, Brazil© Better Cotton Initiative
2014 HARVEST REPORT80 81
www.bettercotton.org

Better Cotton initiative
HEAD OFFICERue des Asters 221202 GenèveSwitzerland+41 (0) 22 93 91 250
Cotton flower © Better Cotton Initiative 100% Recycled Paper