Bethesda Health Community Health Needs … Health Needs Assessment 2015 . ... Bethesda Health...
172
Bethesda Health Community Health Needs Assessment 2015
Transcript of Bethesda Health Community Health Needs … Health Needs Assessment 2015 . ... Bethesda Health...
Bethesda Health
Community Health Needs Assessment
2015

Bethesda Hospital Community Health Needs Assessment ii | P a g e
Bethesda Health Community Health Needs Assessment
2015
Health Council of Southeast Florida 600 Sandtree Drive, Suite 101 Palm Beach Gardens, FL 33403 Phone: 561-844-4220

Bethesda Hospital Community Health Needs Assessment iii | P a g e
Table of Contents Acknowledgments .......................................................................................................................................................... x
Executive Summary ...................................................................................................................................................... xi
Bethesda Hospital ........................................................................................................................................................ xv
Bethesda Hospital by the Numbers ......................................................................................................................... xv
Community Service Area ........................................................................................................................................ xvi
Methodology .............................................................................................................................................................. xviii
Demographic and Socioeconomic Profile ...................................................................................................................... 1
Population .................................................................................................................................................................. 2
Population Growth ................................................................................................................................................... 21
Poverty .................................................................................................................................................................... 22
Income ..................................................................................................................................................................... 27
Homelessness ......................................................................................................................................................... 32
Education ................................................................................................................................................................. 35
Business and Employment ...................................................................................................................................... 40
Public Assistance Benefits ....................................................................................................................................... 46
Housing ................................................................................................................................................................... 48
Transportation ......................................................................................................................................................... 51
Crime ....................................................................................................................................................................... 52
Health Status Profile .................................................................................................................................................... 53
Maternal & Child Health ........................................................................................................................................... 53
Prenatal Care Access .............................................................................................................................................. 53
Birth Rates ............................................................................................................................................................... 56
Birth Weight ............................................................................................................................................................. 60
Infant Mortality ......................................................................................................................................................... 63
Immunization ........................................................................................................................................................... 65
Oral Health .............................................................................................................................................................. 66
Behavioral Health .................................................................................................................................................... 68
Domestic Violence ................................................................................................................................................... 68
Youth Bullying and Delinquent Behavior ................................................................................................................. 69
Sexual Behaviors ..................................................................................................................................................... 70
Mental Health .......................................................................................................................................................... 72
Alcohol Consumption and Substance Abuse ........................................................................................................... 73

Bethesda Hospital Community Health Needs Assessment iv | P a g e
Suicides ................................................................................................................................................................... 75
Hospital Utilization ................................................................................................................................................... 76
Emergency Department Utilization .......................................................................................................................... 90
Nursing Home Utilization ....................................................................................................................................... 103
Morbidity ................................................................................................................................................................ 104
Infectious Disease ................................................................................................................................................. 113
Mortality ................................................................................................................................................................. 119
Health Resource Availability and Access ................................................................................................................... 129
Licensed Facility Overview .................................................................................................................................... 129
Health Care Provider Supply ................................................................................................................................. 132
Federal Health Professional Shortage Areas (HPSA) ........................................................................................... 134
Medically Underserved Areas (MUAs)/Populations (MUPs) .................................................................................. 138
Health Insurance.................................................................................................................................................... 139
Safety Net .............................................................................................................................................................. 145
Community Perspective ............................................................................................................................................. 147
Community Focus Groups ..................................................................................................................................... 147
Key Informant Interviews ....................................................................................................................................... 151
Identification of Priority Strategic Health Issues ......................................................................................................... 153
Methodology .......................................................................................................................................................... 153
Results ................................................................................................................................................................... 153
Conclusion ................................................................................................................................................................. 154

Bethesda Hospital Community Health Needs Assessment v | P a g e
Table of Tables
Table 1: Total Population, Palm Beach County and Florida, 2013 ................................................................................. 2 Table 2: Total Population, Bethesda Hospital Primary and Secondary Service Areas ZIP Codes, 2013 ....................... 2 Table 3: Population by Gender, Palm Beach County and Florida, 2013 ........................................................................ 3 Table 4: Population by Gender, Bethesda Hospital Primary Service Areas ZIP Codes, 2013 ....................................... 3 Table 5: Population by Gender, Bethesda Hospital Secondary Service Area ZIP Codes, 2013 .................................... 4 Table 6: Population by Age, Palm Beach County and Florida, 2013 ............................................................................. 5 Table 7: Population by Age Group, Bethesda Hospital Primary Service Area ZIP Codes, 2013 ................................... 7 Table 8: Population by Age Group, Bethesda Hospital Secondary Service Area ZIP Codes, 2013 ............................... 8 Table 9: Median Age by Gender, Bethesda Hospital Primary Service Area ZIP Codes, 2013 ...................................... 9 Table 10: Median Age by Gender, Bethesda Hospital Secondary Service Area ZIP Codes, 2013 ................................ 9 Table 11: Population by Race and Ethnicity, Palm Beach County and Florida, 2013 .................................................. 10 Table 12: Population by Race, Bethesda Hospital Primary Service Area ZIP Codes, 2013 ........................................ 12 Table 13: Population by Race, Bethesda Hospital Secondary Service Area ZIP Codes, 2013 ................................... 13 Table 14: Population by Ethnicity, Bethesda Hospital Primary Service Area ZIP Codes, 2013 ................................... 14 Table 15: Population by Ethnicity, Bethesda Hospital Secondary Service Area ZIP Codes, 2013 .............................. 15 Table 16: Foreign-Born Population, Palm Beach County and Florida, 2013 ................................................................ 16 Table 17: Languages Spoken at Home, Palm Beach County and Florida, 2013 ......................................................... 17 Table 18: Languages Other Than English, Bethesda Hospital Primary Service Area ZIP Codes, 2013 ...................... 18 Table 19: Languages Other Than English, Bethesda Hospital Secondary Service Area ZIP Codes, 2013 ................. 19 Table 20: Population by Census County Division (CCD), Palm Beach County and Florida, 2013 ............................... 20 Table 21: Population Change by Age, Palm Beach County and Florida, 2012-2013 ................................................... 21 Table 22: 2015 Poverty Guidelines .............................................................................................................................. 22 Table 23: Poverty Status in the Past 12 Months by Age and Gender, Palm Beach County and Florida, 2013 ............ 23 Table 24: Poverty Status in the Past 12 Months by Age Group, Bethesda Hospital Primary Service Area ZIP Codes,
2013 ............................................................................................................................................................................. 24 Table 25: Poverty Status in the Past 12 Months by Age Group, Bethesda Hospital Secondary Service Area ZIP
Codes, 2013 ................................................................................................................................................................. 25 Table 26: Poverty Status in the Past 12 Months, Families, Palm Beach County and Florida, 2013 ............................ 26 Table 27: ALICE Population, Palm Beach County and Florida, 2012 .......................................................................... 26 Table 28: Per Capita Income and Earnings, Palm Beach County and Florida, 2013 ................................................... 27 Table 29: Household Income, Palm Beach County and Florida, 2013 ......................................................................... 28 Table 30: Family Income and Benefits, Palm Beach County and Florida, 2013 .......................................................... 29 Table 31: Household, Family and Per Capita Income, Bethesda Hospital Primary Service Area ZIP Codes, 2013 .... 30 Table 32: Household, Family and Per Capita Income, Bethesda Hospital Secondary Service Area ZIP Codes, 201331 Table 33: Homelessness by Gender, Age, Race and Ethnicity, Palm Beach County, 2015 ........................................ 32 Table 34: Homelessness by Disability Status, Veteran Status and Household Type, Palm Beach County, 2015 ....... 33 Table 35: Homelessness by Cause, Palm Beach County, 2015 .................................................................................. 34 Table 36: Homelessness, Palm Beach County and Florida, 2007-2014 ...................................................................... 34 Table 37: School Enrollment, Palm Beach County and Florida, 2013 ......................................................................... 35 Table 38: Educational Attainment, Palm Beach County and Florida, 2013 .................................................................. 36 Table 39: Educational Attainment, Bethesda Primary Service Area ZIP Codes, 2013 ................................................ 37 Table 40: Educational Attainment, Bethesda Secondary Service Area ZIP Codes, 2013 ............................................ 38 Table 41: High School Graduation Rates, Palm Beach County and Florida, 2009-2013 ............................................. 38 Table 42: School Grades, Palm Beach County, 2010-2014 ......................................................................................... 39 Table 43: Percentage of Students Passing (Score of 3 and Above), Palm Beach County, 2012-2014 ....................... 39

Bethesda Hospital Community Health Needs Assessment vi | P a g e
Table 44: Employment Status, Palm Beach County and Florida, 2013 ....................................................................... 40 Table 45: Employment Status, Bethesda Hospital Primary Service Area ZIP Codes, 2013 ........................................ 41 Table 46: Employment Status, Bethesda Hospital Secondary Service Area ZIP Codes, 2013 ................................... 42 Table 47: Unemployment Rate, Palm Beach County, 2009-2014 ................................................................................ 42 Table 48: Industry, Palm Beach County and Florida, 2013 .......................................................................................... 43 Table 49: Occupation, Palm Beach County and Florida, 2013 .................................................................................... 43 Table 50: Occupation, Bethesda Hospital Primary Service Area ZIP Codes, 2013 ..................................................... 44 Table 51: Occupation, Bethesda Hospital Secondary Service Area ZIP Codes, 2013 ................................................ 45 Table 52: Class of Worker, Palm Beach County and Florida, 2013 ............................................................................. 45 Table 53: Free and Reduced Lunch Status, Palm Beach County and Florida, 2013 ................................................... 46 Table 54: Eligible Women, Infants and Children Eligible Population Served, Palm Beach County and Florida, 1993-
2012 ............................................................................................................................................................................. 47 Table 55: Housing Occupancy and Tenure, Palm Beach County and Florida, 2013 ................................................... 48 Table 56: Housing Units by Vacancy Status, Palm Beach County and Florida, 2013 .................................................. 49 Table 57: Housing Value, Owner-Occupied Units, Palm Beach County and Florida, 2013 ......................................... 49 Table 58: Gross Rent, Palm Beach County and Florida, 2013 .................................................................................... 50 Table 59: Vehicles Available by Household, Palm Beach County and Florida, 2013 ................................................... 51 Table 60: Arrests, Offenses, and Crime Rates, Palm Beach County, 2013-2014 ........................................................ 52 Table 61: Births by Prenatal Status of Mother, Palm Beach County and Florida, 2011-2013 ...................................... 53 Table 62: Births to Mothers with Less Than Adequate Prenatal Care (Kotelchuck Index), Bethesda Hospital Primary
Service Area ZIP Codes, 2013 ..................................................................................................................................... 54 Table 63: Births to Mothers with Less Than Adequate Prenatal Care (Kotelchuck Index), Bethesda Hospital
Secondary Service Area ZIP Codes, 2013................................................................................................................... 55 Table 64: Preterm Births, Palm Beach County and Florida, 2013 ................................................................................ 55 Table 65: Total Resident Live Births, Palm Beach County and Florida, 2011-2013 ..................................................... 56 Table 66: Total Resident Live Births, Bethesda Hospital Service Area ZIP Codes, 2013 ............................................ 56 Table 67: Births by Mother's Age, Palm Beach County and Florida, 2011-2013 ......................................................... 57 Table 68: Birth Rates by Mother's Age, Palm Beach County and Florida, 2011-2013 ................................................. 57 Table 69: Repeat Births by Mother's Age, Palm Beach County and Florida, 2011-2013 ............................................. 58 Table 70: Repeat Births to Teenage Mothers, Bethesda Hospital Service Area ZIP Codes, 2013 .............................. 58 Table 71: Percentage of Repeat Births by Age, Palm Beach County and Florida, 2011- 2013 ................................... 59 Table 72: Live Births Under 1,500 Grams (Very Low Birth Weight), Palm Beach County and Florida, 2011-2013 ..... 60 Table 73: Live Births Under 2,500 Grams (Low Birth Weight), Palm Beach County and Florida, 2011-2013 .............. 60 Table 74: Live Births Under 2,500 Grams (Low Birthweight) and Under 1,500 Grams (Very Low Birthweight),
Bethesda Hospital Primary Service Area ZIP Codes, 2013 ......................................................................................... 61 Table 75: Live Births Under 2,500 Grams (Low Birthweight) and Under 1,500 Grams (Very Low Birthweight),
Bethesda Hospital Secondary Service Area ZIP Codes, 2013 .................................................................................... 62 Table 76: Infant Deaths per 1,000 Live Births, Palm Beach County and Florida, 2011-2013 ...................................... 63 Table 77: Infant Deaths, Bethesda Hospital Service Area ZIP Codes, 2013 ............................................................... 63 Table 78: Infant Deaths per 1,000 Live Births, Palm Beach County and Florida, 2011-2013 ...................................... 64 Table 79: Neonatal Deaths per 1,000 Live Births, Palm Beach County and Florida, 2011-2013 ................................. 65 Table 80: Immunization Levels in Kindergarten, Palm Beach County and Florida, 2011-2013 ................................... 65 Table 81: Selected Vaccine Preventable Disease Rate for All Ages, Palm Beach County and Florida, 2011-2013 .... 66 Table 82: Preventable Hospitalizations for Individuals under the Age of 65 from Dental Conditions, Palm Beach
County and Florida, 2011-2013 .................................................................................................................................... 66 Table 83: Access to Dental Care by Low-Income Persons, Palm Beach County and Florida, 2011-2013 .................. 67 Table 84: Domestic Violence by Offense Type, Palm Beach County, 1995-2013 ....................................................... 68
Bethesda Hospital Community Health Needs Assessment vii | P a g e
Table 85: Percent of Middle School and High School Students Reporting Engaging in Delinquent Behavior, Palm
Beach County and Florida, 2014 .................................................................................................................................. 69 Table 86: Percent of Middle School and High School Students Reporting Involvement in Bullying Behavior, Palm
Beach County and Florida, 2014 .................................................................................................................................. 69 Table 87: HIV Negative and Positive Tests by Age, Sex and Race/Ethnicity, Palm Beach County and Florida, 2013 70 Table 88: HIV Tests, Bethesda Hospital Service Area ZIP Codes, 2013 ..................................................................... 71 Table 89: Percent of Residents Reporting Taking Measures to Prevent Pregnancy, Palm Beach County and Florida,
2010 ............................................................................................................................................................................. 71 Table 90: Psychiatric Beds, Palm Beach County and Florida, 2011-2013 ................................................................... 72 Table 91: Adults with Good Mental Health, Palm Beach County and Florida, 2007, 2010, 2013................................. 72 Table 92: Average Number of Unhealthy Mental Days in the Past 30 Days Reported by Adults, Palm Beach County
and Florida, 2007, 2010, 2013 ..................................................................................................................................... 72 Table 93: Adults who engage in Heavy or Binge Drinking, Palm Beach County and Florida, 2007, 2010, 2013 ......... 73 Table 94: Percent of High School Students who Reported Using Alcohol in the Past 30 Days, Palm Beach County
and Florida, 2004-2014 ................................................................................................................................................ 73 Table 95: Percentage of Middle School and High School Students Reporting Substance Use in the Past 30 Days,
Palm Beach County and Florida, 2014 ........................................................................................................................ 74 Table 96: Suicide Death Rate, Palm Beach County and Florida, 1994-2013............................................................... 75 Table 97: Hospital Utilization, Palm Beach County, January - December 2014........................................................... 76 Table 98: Inpatient Discharges by Primary Service Area ZIP Codes, Bethesda Hospitals, January - December 2014
..................................................................................................................................................................................... 78 Table 99: Inpatient Discharges by Secondary Service Area ZIP Codes, Bethesda Hospitals, January - December
2014 ............................................................................................................................................................................. 79 Table 100: Inpatient Discharges by Age and Primary Service Area ZIP Codes, Bethesda Hospitals, January -
December 2014 ........................................................................................................................................................... 80 Table 101: Inpatient Discharges by Age and Secondary Service Area ZIP Codes, Bethesda Hospitals, January -
December 2014 ........................................................................................................................................................... 81 Table 102: Inpatient Discharges by Race and Primary Service Area ZIP Codes, Bethesda Hospitals, January -
December 2014 ........................................................................................................................................................... 82 Table 103: Inpatient Discharges by Race and Secondary Service Area ZIP Codes, Bethesda Hospitals, January -
December 2014 ........................................................................................................................................................... 83 Table 104: Inpatient Discharges by Ethnicity and Primary Service Area ZIP Codes, Bethesda Hospitals, January -
December 2014 ........................................................................................................................................................... 84 Table 105: Inpatient Discharges by Ethnicity and Secondary Service Area ZIP Codes, Bethesda Hospitals, January -
December 2014 ........................................................................................................................................................... 85 Table 106: Inpatient Discharges by Gender and Primary Service Area ZIP Codes, Bethesda Hospitals, January -
December 2014 ........................................................................................................................................................... 86 Table 107: Inpatient Discharges by Gender and Secondary Service Area ZIP Codes, Bethesda Hospitals, January -
December 2014 ........................................................................................................................................................... 87 Table 108: Inpatient Discharges by Service Line, Bethesda Hospitals Primary Service Area, January - December
2014 ............................................................................................................................................................................. 88 Table 109: Inpatient Discharges by Service Line, Bethesda Hospitals Secondary Service Area, January - December
2014 ............................................................................................................................................................................. 89 Table 110: Hospital Emergency Department Utilization, Palm Beach County, January - December 2014 .................. 90 Table 111: Emergency Department Visits by Primary Service Area ZIP Codes, Bethesda Hospitals, January -
December 2014 ........................................................................................................................................................... 93

Bethesda Hospital Community Health Needs Assessment viii | P a g e
Table 112: Emergency Department Visits by Secondary Service Area ZIP Codes, Bethesda Hospitals, January -
December 2014 ........................................................................................................................................................... 94 Table 113: Emergency Department Visits by Age Group and Primary Service Area ZIP Codes, Bethesda Hospitals,
January - December 2014 ............................................................................................................................................ 95 Table 114: Emergency Department Visits by Age Group and Secondary Service Area ZIP Codes, Bethesda
Hospitals, January - December 2014 ........................................................................................................................... 96 Table 115: Emergency Department Visits by Gender and Primary Service Area ZIP Codes, Bethesda Hospitals,
January - December 2014 ............................................................................................................................................ 97 Table 116: Emergency Department Visits by Gender and Secondary Service Area ZIP Codes, Bethesda Hospitals,
January - December 2014 ............................................................................................................................................ 98 Table 117: Emergency Department Visits by Payer Type and Primary Service Area ZIP Codes, Bethesda Hospitals,
January - December 2014 ............................................................................................................................................ 99 Table 118: Emergency Department Visits by Payer Type and Secondary Service Area ZIP Codes, Bethesda
Hospitals, January - December 2014 ......................................................................................................................... 100 Table 119: Emergency Department Visits by ICD-9 Diagnosis Group, Bethesda Hospitals Primary Service Area,
January - December 2014 .......................................................................................................................................... 101 Table 120: Emergency Department Visits by ICD-9 Diagnosis Group, Bethesda Hospitals Secondary Service Area,
January - December 2014 .......................................................................................................................................... 102 Table 121: Nursing Home Licensed Beds and Admission, Palm Beach County, January - December 2014 ............ 103 Table 122: Nursing Home Patient Days, Palm Beach County, January - December 2014 ........................................ 103 Table 123: Hospitalizations from Coronary Heart Disease, Palm Beach County and Florida, 1993- 2012 ................ 104 Table 124: Age-adjusted Hospitalizations from Stroke, Palm Beach County and Florida, 1993- 2012 ...................... 106 Table 125: Hospitalizations from Chronic Lower Respiratory Disease, Palm Beach County and Florida, 1993- 2012
................................................................................................................................................................................... 107 Table 126: Hospitalizations from Asthma, Palm Beach County and Florida, 1993- 2012 .......................................... 108 Table 127: Hospitalizations from Diabetes, Palm Beach County and Florida, 1993- 2012 ........................................ 109 Table 128: Age-adjusted Cancer Incidence, Palm Beach County and Florida, 2002- 2011 ...................................... 110 Table 129: Enteric Diseases, Palm Beach County and Florida, 1993- 2012.............................................................. 111 Table 130: Percent of High School Students who are Overweight or Obese by Race and Ethnicity, Palm Beach
County, 2013 .............................................................................................................................................................. 112 Table 131: Adults who are Overweight or Obese, Palm Beach County and Florida, 2002, 2007, 2010, 2013 .......... 112 Table 132: Tuberculosis Cases, Palm Beach County and Florida, 1994- 2013 ......................................................... 113 Table 133: Total Reportable Disease Cases, Palm Beach County and Florida, 1993- 2012 ..................................... 114 Table 134: HIV Cases, Palm Beach County and Florida, 1995- 2013 ....................................................................... 115 Table 135: AIDS Cases, Palm Beach County and Florida, 1995- 2013 ..................................................................... 116 Table 136: People Living with HIV/AIDS, Bethesda Hospitals Primary and Secondary Service Area ZIP Codes, 2013
................................................................................................................................................................................... 117 Table 137: Gonorrhea, Chlamydia and Infectious Syphilis Cases, Palm Beach County and Florida, 1994- 2013 ..... 118 Table 138: Leading Causes of Death, Palm Beach County, 2013 ............................................................................. 119 Table 139: Deaths by Major Causes, Bethesda Hospital Primary Service Area ZIP Codes, 2013 ............................ 120 Table 140: Deaths by Major Causes, Bethesda Hospital Secondary Service Area ZIP Codes, 2013 ....................... 121 Table 141: Deaths from Coronary Heart Disease, Palm Beach County and Florida, 1994- 2013.............................. 122 Table 142: Deaths from Stroke, Palm Beach County and Florida, 1994- 2013.......................................................... 123 Table 143: Deaths from Diabetes, Palm Beach County and Florida, 1994- 2013 ...................................................... 124 Table 144: Deaths from Cancer, Palm Beach County and Florida, 1994- 2013 ........................................................ 125 Table 145: Deaths from AIDS, Palm Beach County and Florida, 1994- 2013............................................................ 126 Table 146: Deaths from Unintentional Injuries, Palm Beach County and Florida, 1994- 2013 .................................. 127

Bethesda Hospital Community Health Needs Assessment ix | P a g e
Table 147: Deaths from Unintentional Injuries by Injury Type, Palm Beach County and Florida, 2013 ..................... 128 Table 148: Licensed Hospitals, Palm Beach County, as of June, 2015 ..................................................................... 129 Table 149: Licensed Nursing Homes, Palm Beach County, as of June, 2015 ........................................................... 130 Table 150: Total Licensed Florida Physicians, Palm Beach County and Florida, 2002- 2014 ................................... 132 Table 151: Total Licensed Dentists, Palm Beach County and Florida, 2002- 2014 ................................................... 133 Table 152: Primary Care Health Professional Shortage Areas, Palm Beach County, as of June, 2015 .................... 134 Table 153: Dental Care Health Professional Shortage Areas, Palm Beach County, as of June, 2015 ...................... 136 Table 154: Mental Health Care Health Professional Shortage Areas, Palm Beach County, as of June, 2015 .......... 137 Table 155: Medically Underserved Populations and Areas, Palm Beach County, June 2015 ................................... 138 Table 156: Uninsured by Age and Sex, Palm Beach County and Florida, 2013 ........................................................ 139 Table 157: Health Insurance Coverage, Bethesda Hospital Primary Service Area ZIP Codes, 2013 ........................ 140 Table 158: Health Insurance Coverage, Bethesda Hospital Secondary Service Area ZIP Codes, 2013 ................... 141 Table 159: Uninsured by Race/Ethnicity and Place of Birth, Palm Beach County and Florida, 2013 ........................ 142 Table 160: KidCare Medicaid Enrollment, Title XIX, Palm Beach County and Florida, 2004- 2013 ........................... 143 Table 161: Median Monthly Medicaid Enrollment, Palm Beach County and Florida, 1998- 2013 .............................. 144 Table 162: Federally Qualified Health Centers, Federally Qualified Health Center Look-Alikes, Palm Beach County,
as of June 2015 ......................................................................................................................................................... 146 Table 163: Site, Language, Time and Number of Participants in Focus Groups ....................................................... 147 Table 164: Focus Group Target Population Matrix .................................................................................................... 148
Table of Figures
Figure 1: Bethesda Health, Inc. Primary Service Areas- Bethesda Hospital East and Bethesda Hospital West ....... xvii Figure 2: Florida Map ..................................................................................................................................................... 1 Figure 3: Population by Age, Palm Beach County and Florida, 2013 ............................................................................ 6 Figure 4: Population by Race, Palm Beach County, 2013 ........................................................................................... 11 Figure 5: Population by Ethnicity, Palm Beach County, 2013 ...................................................................................... 11 Figure 6: Percentage of Beds Licensed, Bethesda and Palm Beach County Hospitals, 2014 ..................................... 77 Figure 7: Percent Total Visits, Bethesda and Palm Beach County Hospitals, 2014 ..................................................... 91 Figure 8: Percent Admissions, Bethesda and Palm Beach County Hospitals, 2014 .................................................... 92 Figure 9: Adults who reported ever having had a heart attack, angina or coronary heart disease, by Race/Ethnicity,
Gender and Annual Income in Palm Beach County and Florida, 2013 ...................................................................... 105
Bethesda Hospital Community Health Needs Assessment x | P a g e
Acknowledgments
The 2015 Bethesda Community Health Needs Assessment is a result of the effort, participation and contribution of a broad spectrum of health and human service organizations that came together around the commitment to improve and enhance services for the betterment of the entire community. Bethesda Hospital, along with the Health Council of Southeast Florida, wishes to extend our appreciation and thanks
to all the organizations that participated and contributed to this comprehensive body of work, as well as for their
commitment and collective efforts to improve access to health care on behalf of the residents of Palm Beach County.
Their insight was essential to identifying health care priorities, populations and topics of the assessment. We would
like to especially acknowledge the participation and contribution of the following entities that served on the Advisory
Council:
211 Palm Beach/Treasure Coast
Boynton Beach Fire Rescue Department
Boynton Beach Police Department
Children’s Services Council of Palm Beach County
Coalition of Boynton West Residential Associations (COBWRA)
Florida Department of Health - Palm Beach County
Genesis Community Health
Gulfstream Goodwill Transition to Life Academy
Health Care District of Palm Beach County
March of Dimes – Florida Chapter
Palm Healthcare Foundation, Inc.
The School District of Palm Beach County
Additionally, we would like to acknowledge the following organizations that played a valuable role in gleaning community insight and perspective throughout the community health needs assessment:
Adopt-A-Family of the Palm Beaches
Boynton Beach Mental Health Initiative
BRIDGES at Lake Worth
Caridad Center
Center for Independent Living Options, Inc.
Compass, Inc.
Economic Council of Palm Beach County
Florida Atlantic University Charles E. Schmidt College of Medicine
Palm Beach County Medical Society
Pathways to Prosperity, Inc. (P2P)
Quantum Foundation
Safe Kids Palm Beach County
Temple Shaarei Shalom
The Greater Boynton Beach Chamber of Commerce
The Lord’s Place - Men’s Campus
The Community Health Needs Assessment was conducted in context of the vision, mission and values set forth by
Bethesda Hospital. This publication would not have been possible without the assistance, guidance and support of
Bethesda Hospital and its commitment to improving the quality of life of residents in the community.

Bethesda Hospital Community Health Needs Assessment xi | P a g e
Executive Summary
A community health needs assessment is a systematic method of identifying unmet health care and human service
needs of a population and identifying possible interventions to meet those needs. In 2015, Bethesda Hospital engaged
the Health Council of Southeast Florida to facilitate a comprehensive health needs assessment in adherence with the
Internal Revenue Service (IRS) and Patient Protection and Affordable Care Act requirements and guidelines.
This community health needs assessment provided the opportunity to:
Assess the population’s health status
Highlight areas of unmet need
Present the community’s perspectives
Provide suggestions for possible interventions
Highlight recommendations that policymakers might consider when setting new policy goals and objectives
for health improvement activities
The report includes secondary data from national, state and local databases and when appropriate and possible,
comparative information is presented. It also includes primary data that encompasses the community’s perspective.
The assessment is organized into four sections:
1. Demographic and Socioeconomic Profile
2. Health Status Profile
3. Health Resource Access and Availability Profile
4. Community Perspective
Demographic and Socioeconomic Profile
This section provides information on key demographic, social and economic indicators, such as population,
presented by various cohorts, e.g., age bands, gender, race, income, estimates of poverty, educational attainment,
employment, housing, and transportation.
There are a total 1,339,221 residents in Palm Beach County, and Bethesda Hospital’s service areas
account for 65% of the total population in Palm Beach County.
Over a fifth (21.9%) of the residents in the county are 65 years or older, which is more than the rate of
Florida, which is 17.8%.
Over three quarters (75.8%) of the population are White and 19.5% of the residents in Palm Beach County
identify as Hispanic.
About 30.0% of the residents speak a language other than English.
Just over 14.5% of the population is at or below the poverty level and the per capital income is $32,858.
Both of which are higher than the state of Florida.
Unemployment rate is 6.3% and 82.0% of workers are private wage and salary workers.
In 2015, the count of homeless individuals in Palm Beach County was 1,421.

Bethesda Hospital Community Health Needs Assessment xii | P a g e
Health Status Profile
This section profiles the health status of the community and includes data on maternal and child health such as
prenatal care access, birth rates, infant mortality, child immunization rates; behavioral health including: domestic
violence, alcohol consumption, and violence and injury; hospital utilization data; and morbidity and mortality trends as
reflected by data on chronic diseases, infectious diseases, and leading causes of death. Additionally, inpatient
discharges and emergency department visits for Bethesda Hospitals by primary and secondary service area ZIP
Codes are included in this section.
The rate of live births in Palm Beach County is 10.5%, lower than the state’s rate of 11.1%. Over 58% of
births in Palm Beach County occur in the primary and secondary service areas of Bethesda Hospitals (East
and West).The county’s infant mortality rate (4.6) is a lower than Florida’s rate (6.1) as a whole.
In Palm Beach County, 23.6% of births were to mothers with less than adequate prenatal care according to
the Kotelchuck Index.1
The county’s rate of preterm births has decreased from 2011-2013 to 13.0 per 1,000, while the state of
Florida has an increasing trend in the rate of preterm births.
In Palm Beach, 29.9% of middle school and high school students reported ‘alcohol or any illicit drug’ use,
2.9% higher than in Florida.
The age-adjusted suicide rate in Palm Beach County in 2013 was 14.5 per 100,000, which is higher than
that of the state of Florida (13.8 per 100,000).
The rate of hospitalizations from diabetes has increased from 2010 to 2012 from 1689.1 per 100,000 to
1737.3 per 100,000, while all other rates of hospitalizations from chronic diseases (coronary heart disease,
chronic lower respiratory disease, stroke, cancer and asthma) have decreased during the same time period.
The rate of obesity among adults in Palm Beach County is 60.1%, lower than the state’s rate of 62.8%.
Nearly 1 in 4 high school students (24.8%) were overweight or obese in 2013, 30.5% of which are Black
(non-Hispanic) and 28.0% of which are Hispanic.
The most frequent cause of deaths in Palm Beach County in 2013 was heart disease accounting for 25.6%
of deaths, followed by cancer, responsible for 23.8% of deaths. In 2013, the most frequent leading cause of
deaths was major cardiovascular disease in Bethesda Hospital’s primary service area, accounting for 1,842
deaths, or 33.6% of deaths.
There were 634 deaths due to unintentional injury in Palm Beach County, an age-adjusted death rate of
39.7 per 100,000. Of total unintentional injury deaths, poisoning accounts for 30.8% and fall accounts for
29%. The death rate due to poisoning in Palm Beach County was higher at 15.3 than that of Florida.
Health Resources Availability and Access Profile
This section examines the availability of health care resources and health care access in the community and includes
information on health insurance coverage, Federally Qualified Health Centers (FQHCs), health professional shortage
areas (HPSAs), and medically underserved populations and areas (MUPs/MUAs), as well as the health care safety
net of the community.
There are 4,369 licensed medical physicians and 975 licensed dentists in Palm Beach County, rates of
323.6 per 100,000 residents and 72.2 per 100,000, respectively, which are higher rates than those of the
state.
1 The Kotelchuck Index uses initiation of prenatal care and number of prenatal visits for calculating adequate prenatal care.
Bethesda Hospital Community Health Needs Assessment xiii | P a g e
Palm Beach County has Primary Care Health Professional Shortage Areas at four comprehensive health
centers and in seven population groups, five of which are in Bethesda Hospital's primary service areas.
Palm Beach County has eight Medically Underserved Populations, five of which are in Bethesda Hospital’s
service areas.
In 2013, 29.2% of adults in Palm Beach County ages 18-64 years old were uninsured. Lake Worth, (33460)
had the highest percent (39.9%) of uninsured individuals for Bethesda Hospital’s primary service area in
2013.
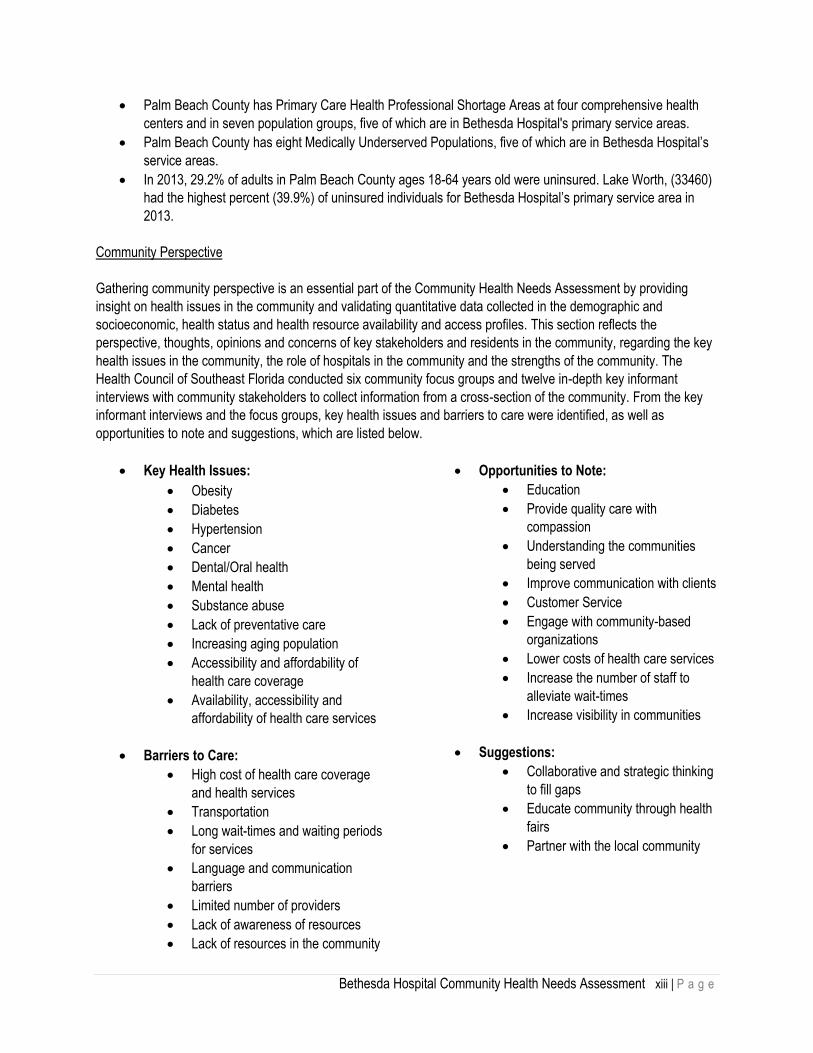
Community Perspective
Gathering community perspective is an essential part of the Community Health Needs Assessment by providing
insight on health issues in the community and validating quantitative data collected in the demographic and
socioeconomic, health status and health resource availability and access profiles. This section reflects the
perspective, thoughts, opinions and concerns of key stakeholders and residents in the community, regarding the key
health issues in the community, the role of hospitals in the community and the strengths of the community. The
Health Council of Southeast Florida conducted six community focus groups and twelve in-depth key informant
interviews with community stakeholders to collect information from a cross-section of the community. From the key
informant interviews and the focus groups, key health issues and barriers to care were identified, as well as
opportunities to note and suggestions, which are listed below.
Key Health Issues:
Obesity
Diabetes
Hypertension
Cancer
Dental/Oral health
Mental health
Substance abuse
Lack of preventative care
Increasing aging population
Accessibility and affordability of
health care coverage
Availability, accessibility and
affordability of health care services
Barriers to Care:
High cost of health care coverage
and health services
Transportation
Long wait-times and waiting periods
for services
Language and communication
barriers
Limited number of providers
Lack of awareness of resources
Lack of resources in the community
Opportunities to Note:
Education
Provide quality care with
compassion
Understanding the communities
being served
Improve communication with clients
Customer Service
Engage with community-based
organizations
Lower costs of health care services
Increase the number of staff to
alleviate wait-times
Increase visibility in communities
Suggestions:
Collaborative and strategic thinking
to fill gaps
Educate community through health
fairs
Partner with the local community

Bethesda Hospital Community Health Needs Assessment xiv | P a g e
Conclusion
Bethesda Hospital convened an Advisory Council of hospital and community stakeholders to evaluate the
quantitative and qualitative data presented in the Community Health Needs Assessment and to synthesize a list
of priorities through a strategic planning process. Bethesda Hospital will use the Community Health Needs
Assessment to create new plans for addressing the unmet needs of the community and strengthen programs
already addressing key health issues in the community through the development and implementation of a
Community Health Implementation Plan.

Bethesda Hospital Community Health Needs Assessment xv | P a g e
Bethesda Hospital Bethesda Hospital’s long-standing commitment to the community spans more than 55 years. This commitment has grown and evolved through significant thought and care in considering the community’s most pressing health needs. Bethesda Health conducted its last assessment in 2012, however continuously strives to meet the needs of the community by conducting a periodic, comprehensive Community Health Needs Assessment. Bethesda Hospital East first opened its doors in 1959, as a community, not-for-profit hospital with a mission "to provide quality health services in a caring manner." Bethesda Hospital East has 401 licensed beds, 670 physicians in more than 40 areas of specialty, and a hospital staff of more than 2,500 employees. Bethesda Hospital East and its affiliates offer various healthcare services, including, but not limited to: Comprehensive cancer care Comprehensive cardiovascular services Advanced Primary Stroke Center Maternity services Inpatient and outpatient rehabilitation Wound care and hyperbaric medicine
Bethesda Hospital West is an all-new, not-for-profit, community hospital. This new hospital facility provides comprehensive inpatient and outpatient medical services, with state-of-the-art technology that incorporates environmentally sound practices. As part of Bethesda Health, Bethesda Hospital West has a total of 80 licensed beds and offers services, including, but not limited to: Comprehensive inpatient and outpatient medical and surgical services A 24-hour Emergency Department, including a Pediatric Emergency Department Respiratory therapy Physical rehabilitation Laboratory and inpatient pharmacy services
Bethesda strives to lead by demonstrating high levels of clinical performance and improvement for quality and safety
measures. Bethesda’s Medical Staff and Clinical teams continue to evaluate and implement evidenced based best
practice medical care to improve community outcomes for healthcare.
Bethesda Hospital by the Numbers
Bethesda Hospital East and West’s service areas cover a total of thirty-one ZIP Codes, spanning six cities in Palm Beach County, including: Boynton Beach, Delray Beach, Boca Raton, Greenacres, Palm Springs, and West Palm Beach
In total, the residents in Bethesda Hospital’s primary and secondary service areas combined account for 65% of the total population in Palm Beach County
The total population for Bethesda Hospital’s primary service area was 534,491, which accounts for just below 40% of Palm Beach County’s population
In 2013, Bethesda Hospital’s secondary service area total population was 333,544; individuals in this service area accounted for 25% of Palm Beach County’s total population
In 2014, Bethesda Hospitals had a total of 481 licensed beds, accounting for 12.2% of all beds licensed in Palm Beach County
In 2014, Bethesda Hospitals had a total of 19,996 number of admissions, accounting for just over 11% of all admissions in Palm Beach County

Bethesda Hospital Community Health Needs Assessment xvi | P a g e
Bethesda Hospital East
In 2014, Bethesda Hospital East had a total of 401 licensed beds and an occupancy rate of 63.0%, which accounted for 10.1% of all bed licensed in Palm Beach County
Bethesda Hospital East had a total of 16,789 number of admissions, accounting for 9.2% of all admissions in Palm Beach County in 2014
In 2014, Boynton Beach, ZIP Code 33435 accounted for 19.7% of the inpatient discharges, which is the highest among all primary service area ZIP Codes for Bethesda Hospital East
Bethesda Hospital East had a total of 56,790 hospital emergency department visits and 12,418 total admissions in 2014
In 2014, Obstetrics- Delivery had the largest percentage of inpatient discharges (14.8%) at Bethesda Hospital East
Bethesda Hospital West
In 2014, Bethesda Hospital West had a total of 80 licensed beds and an occupancy rate of 40.1%, which accounted for to 2.0% of all beds licensed in Palm Beach County
Bethesda Hospital West had a total of 3,207 number of admissions, accounting for just under 2% of all admissions in Palm Beach County in 2014
In 2014, Boynton Beach, ZIP Code 33437, accounted for over 38.6% of the inpatient discharges, the highest among all primary service area ZIP Codes for Bethesda Hospital West.
Bethesda Hospital West had a total of 18,850 hospital emergency department visits and 2,871 total admissions in 2014
In 2014, Bethesda Hospital West’s largest numbers of inpatient discharges (15.7%) were attributed to pulmonary discharges
Community Service Area
Bethesda Hospital’s community lies within Palm Beach County and consists of a total population of 586,271, spanning 31 ZIP Codes and six cities. For planning purposes, Bethesda Hospital’s primary service areas are defined by the following ZIP Codes:
Bethesda Hospital East and Bethesda Hospital West’s secondary service areas are defined by the following ZIP Codes:
33405 33406 33413 33415 33428 33431 33432
33433 33434 33483 33486 33487 33496 33498
Bethesda East Bethesda West Both Hospitals 33426 33435 33444 33445 33460 33461 33462
33414 33446 33449 33467 33484
33436 33437 33463 33472 33473

Bethesda Hospital Community Health Needs Assessment xvii | P a g e
Figure 1 provides a reference map of the primary service area ZIP Codes of Bethesda Hospital East and Bethesda Hospital West.
Figure 1: Bethesda Health, Inc. Primary Service Areas- Bethesda Hospital East and Bethesda Hospital West2
2 Image provided by Bethesda Health Inc.
Primary service area zip codes: 33414, 33426, 33435, 33436, 33437, 33444, 33445, 33446, 33449, 33460,
33461, 33462, 33463, 33467, 33472, 33473 and 33484
Secondary service area zip codes: 33405, 33406, 33413, 33415, 33428, 33431, 33432, 33433, 33434, 33483,
33486, 33487, 33496 and 33498
Bethesda Hospital Community Health Needs Assessment xviii | P a g e
Methodology As part of the new Internal Revenue Service (IRS) requirements, hospital organizations are to conduct a community health needs assessment, which serves as a guiding document for strategic planning. Through the process of developing a Community Health Needs Assessment, a hospital positions itself to address community health needs that are not being met, especially those of poor, homeless individuals and families, as well as those who have been negatively impacted by the downturn of the economy. Health data from primary and secondary sources are examined and discussed prior to the establishment of recommendations and priorities aimed at improving community health status and quality of life. The Affordable Care Act (ACA) establishes specific requirements that hospitals conduct and implement a community health needs assessment at least every three years. Community health needs assessments must take into account input from persons who represent the broad interests of the community being served and must be made widely available to the public. The hospital must provide a description of the unmet needs in the community as well as an explanation for any deficiencies in meeting these needs. Further, the community health needs assessment requirement is the only requirement with a specific penalty if a hospital fails to comply. Under the newly added Section 4959 of the Internal Revenue Code, a hospital which fails to satisfy the community health needs assessment requirement is subject to an excise tax for each tax year in which the requirement is not met. At the request of Bethesda Hospital, the Health Council of Southeast Florida, (HCSEF) facilitated this community health needs assessment process. This assessment includes quantitative and qualitative data that serve to guide both the community’s benefit and strategic planning initiatives. Quantitative and qualitative methods were used to gather primary and secondary data. Data presented in the Demographic and Socioeconomic Profile, Health Status Profile, and Health Resource Availability and Access Profile are comprised of secondary data. Data presented in the Community Perspective section are comprised of primary data. Data sources consulted for this report include, but are not limited to: The U.S. Census Bureau, the Florida Agency for Health Care Administration (AHCA), the Florida Department of Health (FDOH), the Florida Behavioral Risk Factor Surveillance System (BRFSS) Data Report, the Florida Department of Children and Families (FDCF), the Centers for Disease Control and Prevention (CDC), U.S. Department of Labor Statistics, Florida Department of Education Information and Accountability Services (EIAS), Florida Department of Law Enforcement (FDLE), and Bethesda Hospital. Information on the community’s perspective was obtained through primary data collection methodology, including community focus groups and key informant interviews. Data was collected, analyzed and compiled for this assessment to enable and guide healthcare providers, managers, health and program planners, hospital administration and staff, and community leaders to identify health indicators within our community that present areas of concern, gaps in care or services and opportunities for improvement. The information provided in this assessment may be used to identify opportunities to change and improve future health planning activities.

Bethesda Hospital Community Health Needs Assessment 1 | P a g e
Demographic and Socioeconomic Profile
Palm Beach County is located in southeast Florida and is one of three counties that comprise the South Florida metropolitan area. Formed in 1909, it is the largest county in the state in area and the third largest in population. Geographically, Palm Beach County is the largest county east of the Mississippi River. The county has a total area 2,386.33 square miles, of which 1,974.11 square miles (82.73%) is land and 412.22 square miles (17.27%) is water. The county was named for the palm trees and beaches in the area. The county seat is located in the county’s largest city, West Palm Beach. Palm Beach County borders Martin County to the North, the Atlantic Ocean to the East, Broward County to the South, Hendry County to the West, and extends into Lake Okeechobee in the Northwest, where it borders Okeechobee County and Glades County at one point in the center of the lake.3 Eastern Palm Beach includes coastal, urban areas, while the central and western areas of the county are mainly suburban and rural. The demographic and socioeconomic characteristics of the residents of Palm Beach County are highlighted in this section. These characteristics provide context for the health care needs of the community and are indicators and predictors for health care utilization patterns and health outcomes. Furthermore, the demographic and socioeconomic profile of a community provides information important in the identification of barriers to accessing health care services. Data in this assessment is presented for Palm Beach County and in many cases, for comparison purposes, data for the state of Florida. The data presented for Palm Beach County provides a context for Bethesda Hospital’s service areas, which comprise over sixty-five percent of the county’s population. As Bethesda Hospital’s service areas comprise a majority of the county’s population, assumptions can be drawn from the indicators presented for county-level data and attributed to Bethesda Hospital’s service areas. There are also instances where data for the county is presented at the ZIP Code level.
3 Wikipedia, Palm Beach County
Figure 2: Florida Map
http://2010.census.gov/2010census/popmap/
Bethesda Hospital Community Health Needs Assessment 2 | P a g e
Demographic Characteristics
Population
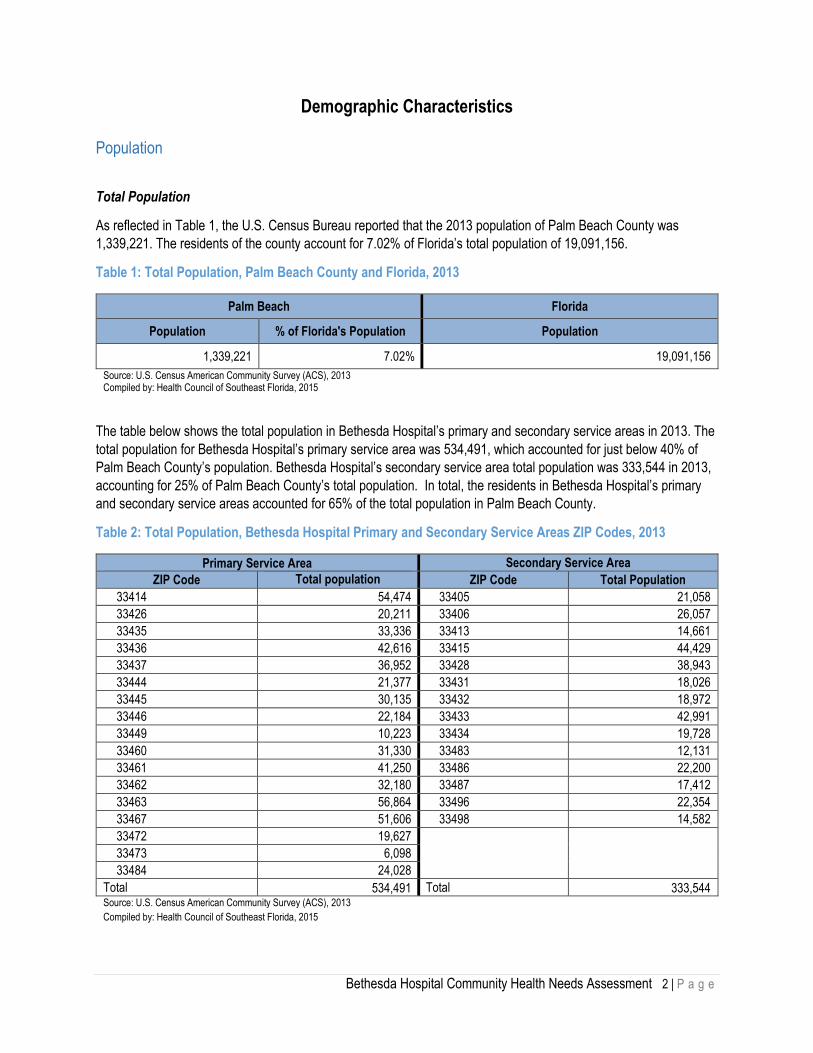
Total Population
As reflected in Table 1, the U.S. Census Bureau reported that the 2013 population of Palm Beach County was
1,339,221. The residents of the county account for 7.02% of Florida’s total population of 19,091,156.
Table 1: Total Population, Palm Beach County and Florida, 2013
Palm Beach Florida
Population % of Florida's Population Population
1,339,221 7.02% 19,091,156
Source: U.S. Census American Community Survey (ACS), 2013 Compiled by: Health Council of Southeast Florida, 2015
The table below shows the total population in Bethesda Hospital’s primary and secondary service areas in 2013. The
total population for Bethesda Hospital’s primary service area was 534,491, which accounted for just below 40% of
Palm Beach County’s population. Bethesda Hospital’s secondary service area total population was 333,544 in 2013,
accounting for 25% of Palm Beach County’s total population. In total, the residents in Bethesda Hospital’s primary
and secondary service areas accounted for 65% of the total population in Palm Beach County.
Table 2: Total Population, Bethesda Hospital Primary and Secondary Service Areas ZIP Codes, 2013
Primary Service Area Secondary Service Area
ZIP Code Total population ZIP Code Total Population
33414 54,474 33405 21,058
33426 20,211 33406 26,057
33435 33,336 33413 14,661
33436 42,616 33415 44,429
33437 36,952 33428 38,943
33444 21,377 33431 18,026
33445 30,135 33432 18,972
33446 22,184 33433 42,991
33449 10,223 33434 19,728
33460 31,330 33483 12,131
33461 41,250 33486 22,200
33462 32,180 33487 17,412
33463 56,864 33496 22,354
33467 51,606 33498 14,582
33472 19,627
33473 6,098
33484 24,028
Total 534,491 Total 333,544 Source: U.S. Census American Community Survey (ACS), 2013
Compiled by: Health Council of Southeast Florida, 2015

Bethesda Hospital Community Health Needs Assessment 3 | P a g e
Population by Gender
The table below shows the gender distribution in Palm Beach and Florida. In 2013, the population was 48.4% males
and 51.6% females.
Table 3: Population by Gender, Palm Beach County and Florida, 2013
Palm Beach Florida
Number Percent Number Percent
Male population 648,352 48.4% 9,332,589 48.9%
Female population 690,869 51.6% 9,758,567 51.1%
Total Population 1,339,221 100.0% 19,091,156 100.0% Source: U.S. Census American Community Survey (ACS), 2013 Compiled by: Health Council of Southeast Florida, 2015
Table 4 below shows the population by gender in Bethesda Hospital’s primary service area in 2013. Lake Worth,
33460 ZIP Code had the highest percentage (57.5%) of male individuals and Delray Beach, 33484 ZIP Code had the
highest percentage (57.5%) of female individuals for Bethesda Hospital’s primary service area. The gender
distribution in the primary service area is similar to that of Palm Beach County.
Table 4: Population by Gender, Bethesda Hospital Primary Service Areas ZIP Codes, 2013
Zip Code Total population Male Female
Number Number Percent Number Percent
33414 54,474 26,177 48.1% 28,297 51.9%
33426 20,211 9,830 48.6% 10,381 51.4%
33435 33,336 15,205 45.6% 18,131 54.4%
33436 42,616 19,649 46.1% 22,967 53.9%
33437 36,952 17,226 46.6% 19,726 53.4%
33444 21,377 11,112 52.0% 10,265 48.0%
33445 30,135 14,039 46.6% 16,096 53.4%
33446 22,184 10,245 46.2% 11,939 53.8%
33449 10,223 4,940 48.3% 5,283 51.7%
33460 31,330 18,019 57.5% 13,311 42.5%
33461 41,250 20,641 50.0% 20,609 50.0%
33462 32,180 15,583 48.4% 16,597 51.6%
33463 56,864 27,832 48.9% 29,032 51.1%
33467 51,606 24,668 47.8% 26,938 52.2%
33472 19,627 9,370 47.7% 10,257 52.3%
33473 6,098 3,273 53.7% 2,825 46.3%
33484 24,028 10,222 42.5% 13,806 57.5%
Total 534,491 258,031 48.3% 276,460 51.7%
Source: U.S. Census American Community Survey (ACS), 2013
Compiled by: Health Council of Southeast Florida, 2015

Bethesda Hospital Community Health Needs Assessment 4 | P a g e
Table 5 below shows the population by gender in Bethesda Hospital’s secondary service area in 2013. West Palm
Beach, 33406 ZIP Code had the highest percentage (52.5%) of male individuals and Boca Raton, 33433 ZIP Code
had the highest percentage (56.4%) of female individuals for Bethesda Hospital secondary service area.
Table 5: Population by Gender, Bethesda Hospital Secondary Service Area ZIP Codes, 2013
Zip Code Total Population Male Female
Number Number Percent Number Percent
33405 21,058 10,893 51.7% 10,165 48.3%
33406 26,057 13,681 52.5% 12,376 47.5%
33413 14,661 7,277 49.6% 7,384 50.4%
33415 44,429 20,995 47.3% 23,434 52.7%
33428 38,943 19,304 49.6% 19,639 50.4%
33431 18,026 8,988 49.9% 9,038 50.1%
33432 18,972 9,476 49.9% 9,496 50.1%
33433 42,991 18,727 43.6% 24,264 56.4%
33434 19,728 9,019 45.7% 10,709 54.3%
33483 12,131 5,910 48.7% 6,221 51.3%
33486 22,200 11,199 50.4% 11,001 49.6%
33487 17,412 8,727 50.1% 8,685 49.9%
33496 22,354 10,607 47.5% 11,747 52.5%
33498 14,582 6,861 47.1% 7,721 52.9%
Total 333,544 161,664 48.5% 171,880 51.5%
Source: U.S. Census American Community Survey (ACS), 2013
Compiled by: Health Council of Southeast Florida, 2015
Bethesda Hospital Community Health Needs Assessment 5 | P a g e
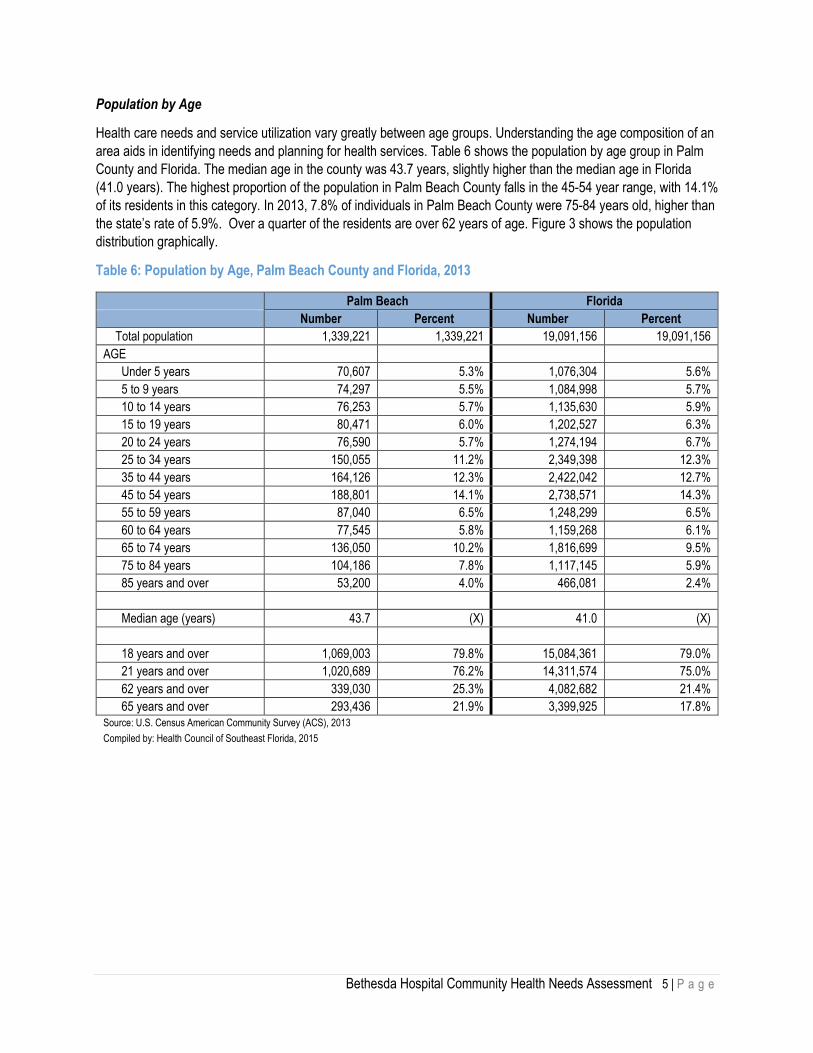
Population by Age
Health care needs and service utilization vary greatly between age groups. Understanding the age composition of an
area aids in identifying needs and planning for health services. Table 6 shows the population by age group in Palm
County and Florida. The median age in the county was 43.7 years, slightly higher than the median age in Florida
(41.0 years). The highest proportion of the population in Palm Beach County falls in the 45-54 year range, with 14.1%
of its residents in this category. In 2013, 7.8% of individuals in Palm Beach County were 75-84 years old, higher than
the state’s rate of 5.9%. Over a quarter of the residents are over 62 years of age. Figure 3 shows the population
distribution graphically.
Table 6: Population by Age, Palm Beach County and Florida, 2013
Palm Beach Florida
Number Percent Number Percent
Total population 1,339,221 1,339,221 19,091,156 19,091,156
AGE
Under 5 years 70,607 5.3% 1,076,304 5.6%
5 to 9 years 74,297 5.5% 1,084,998 5.7%
10 to 14 years 76,253 5.7% 1,135,630 5.9%
15 to 19 years 80,471 6.0% 1,202,527 6.3%
20 to 24 years 76,590 5.7% 1,274,194 6.7%
25 to 34 years 150,055 11.2% 2,349,398 12.3%
35 to 44 years 164,126 12.3% 2,422,042 12.7%
45 to 54 years 188,801 14.1% 2,738,571 14.3%
55 to 59 years 87,040 6.5% 1,248,299 6.5%
60 to 64 years 77,545 5.8% 1,159,268 6.1%
65 to 74 years 136,050 10.2% 1,816,699 9.5%
75 to 84 years 104,186 7.8% 1,117,145 5.9%
85 years and over 53,200 4.0% 466,081 2.4%
Median age (years) 43.7 (X) 41.0 (X)
18 years and over 1,069,003 79.8% 15,084,361 79.0%
21 years and over 1,020,689 76.2% 14,311,574 75.0%
62 years and over 339,030 25.3% 4,082,682 21.4%
65 years and over 293,436 21.9% 3,399,925 17.8% Source: U.S. Census American Community Survey (ACS), 2013
Compiled by: Health Council of Southeast Florida, 2015

Bethesda Hospital Community Health Needs Assessment 6 | P a g e
Figure 3: Population by Age, Palm Beach County and Florida, 2013
0.0% 2.0% 4.0% 6.0% 8.0% 10.0% 12.0% 14.0% 16.0%
Under 5 years
5 to 9 years
10 to 14 years
15 to 19 years
20 to 24 years
25 to 34 years
35 to 44 years
45 to 54 years
55 to 59 years
60 to 64 years
65 to 74 years
75 to 84 years
85 years and over
Population by Age, Palm Beach County and Florida, 2013
Florida Palm Beach

Bethesda Hospital Community Health Needs Assessment 7 | P a g e
The table below shows the population by age for Bethesda Hospital’s primary service area in 2013. Boynton Beach,
33473 ZIP Code had the highest percentage of individuals under 5 years of age (12.4%) and 5-19 years age group
(25.7%) in Bethesda Hospital’s primary service area. Lake Worth, 33460 ZIP Code had the highest percentage of
individuals in the 20-44 year age group and Delray Beach, ZIP Code 33444 had the highest percentage of individuals
in the 45-64 year age group (29.7%). The highest number of individuals in the 65 and over age group for Bethesda
Hospital’s primary service area was in Delray Beach, 33446 ZIP Code (60.3%).
Table 7: Population by Age Group, Bethesda Hospital Primary Service Area ZIP Codes, 2013
Total population Under 5 5-19 20-44 45-64 65+
33414 54,474 5.4% 25.5% 30.3% 28.1% 10.7%
33426 20,211 4.4% 12.7% 35.2% 24.7% 23.0%
33435 33,336 5.7% 17.5% 28.9% 26.3% 21.6%
33436 42,616 5.5% 13.4% 27.0% 26.0% 28.2%
33437 36,952 3.5% 6.3% 17.8% 19.1% 53.3%
33444 21,377 5.2% 16.8% 36.3% 29.7% 12.0%
33445 30,135 4.3% 12.3% 27.7% 27.5% 28.1%
33446 22,184 2.6% 5.6% 10.0% 21.5% 60.3%
33449 10,223 5.6% 25.2% 23.0% 27.6% 18.6%
33460 31,330 7.5% 17.5% 38.2% 25.8% 11.0%
33461 41,250 8.4% 19.9% 38.1% 21.3% 12.4%
33462 32,180 7.1% 17.6% 32.4% 24.4% 18.6%
33463 56,864 6.8% 23.5% 36.8% 22.1% 10.8%
33467 51,606 4.4% 19.0% 22.4% 28.5% 25.7%
33472 19,627 4.4% 14.0% 22.0% 24.1% 35.6%
33473 6,098 12.4% 25.7% 35.4% 17.8% 8.9%
33484 24,028 2.5% 5.4% 13.9% 19.4% 58.8%
Total 534,491 5.6% 16.3% 28.0% 24.3% 25.7%
Source: U.S. Census American Community Survey (ACS), 2013
Compiled by: Health Council of Southeast Florida, 2015

Bethesda Hospital Community Health Needs Assessment 8 | P a g e
Table 8 below shows the population by age for Bethesda Hospital’s secondary service area in 2013. West Palm
Beach, 33406 ZIP Code had the highest percentage of patients under 5 years of age (7.7%) and 20 - 44 year age
group (38.8%) in Bethesda Hospital’s secondary service area. Boca Raton, 33498 ZIP Code had the highest
percentage of individuals in the 5-19 years age group (24.1%) and 45-64 years age group (31.4%) in Bethesda
Hospital’s secondary service area. The highest number of individuals in the 65 and over age group for Bethesda
Hospital’s primary service area was in Boca Raton, 33434 ZIP Code.
Table 8: Population by Age Group, Bethesda Hospital Secondary Service Area ZIP Codes, 2013
Zip Code Total Population Under 5 5-19 20-44 45-64 65+
33405 21,058 6.1% 17.1% 36.3% 26.8% 13.8%
33406 26,057 7.7% 17.5% 38.8% 26.5% 9.5%
33413 14,661 6.4% 19.7% 38.1% 24.0% 11.8%
33415 44,429 7.5% 20.3% 35.1% 23.6% 13.4%
33428 38,943 4.7% 21.1% 30.3% 28.9% 14.9%
33431 18,026 3.0% 23.2% 29.9% 26.4% 17.7%
33432 18,972 3.3% 12.9% 27.1% 29.6% 27.2%
33433 42,991 3.8% 14.9% 25.6% 25.0% 30.7%
33434 19,728 1.9% 12.4% 17.3% 24.7% 43.7%
33483 12,131 2.6% 9.2% 25.8% 30.7% 31.8%
33486 22,200 4.6% 17.6% 32.9% 29.5% 15.4%
33487 17,412 3.9% 13.2% 22.9% 31.0% 28.9%
33496 22,354 3.1% 16.1% 19.0% 27.3% 34.5%
33498 14,582 2.9% 24.1% 23.1% 31.4% 18.6%
Total 333,544 4.4% 17.1% 28.7% 27.5% 22.3%
Source: U.S. Census American Community Survey (ACS), 2013
Compiled by: Health Council of Southeast Florida, 2015
Bethesda Hospital Community Health Needs Assessment 9 | P a g e
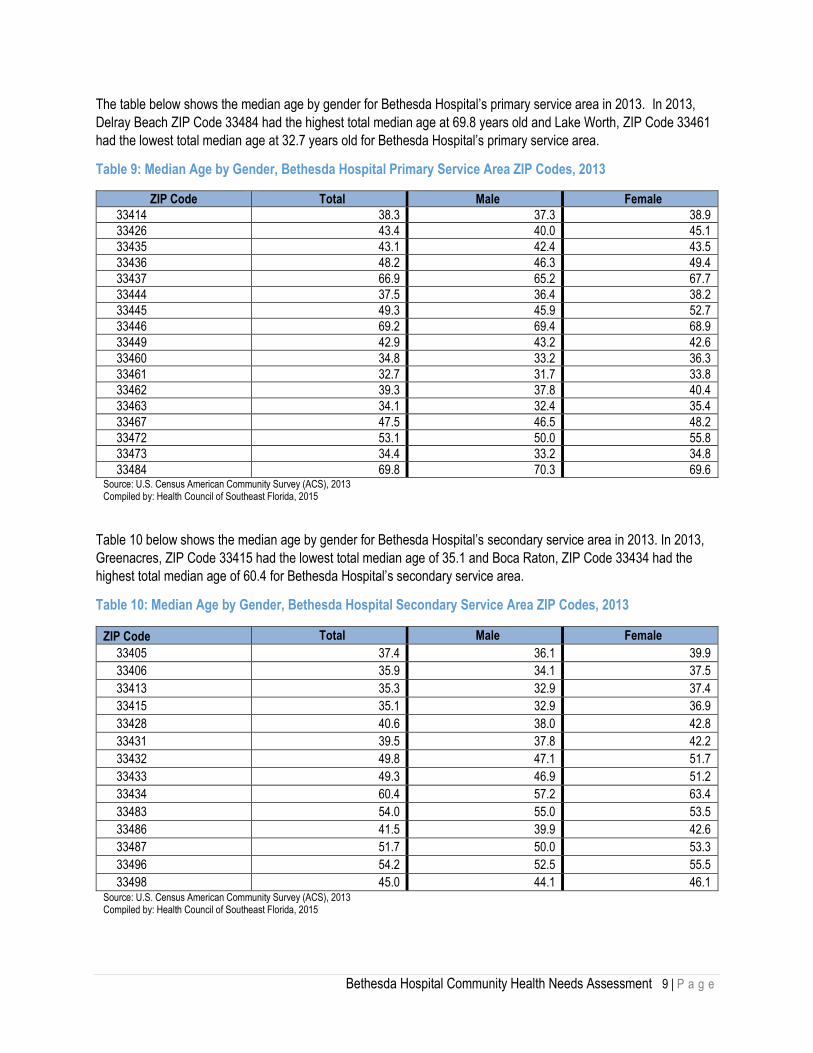
The table below shows the median age by gender for Bethesda Hospital’s primary service area in 2013. In 2013,
Delray Beach ZIP Code 33484 had the highest total median age at 69.8 years old and Lake Worth, ZIP Code 33461
had the lowest total median age at 32.7 years old for Bethesda Hospital’s primary service area.
Table 9: Median Age by Gender, Bethesda Hospital Primary Service Area ZIP Codes, 2013
ZIP Code Total Male Female
33414 38.3 37.3 38.9
33426 43.4 40.0 45.1
33435 43.1 42.4 43.5
33436 48.2 46.3 49.4
33437 66.9 65.2 67.7
33444 37.5 36.4 38.2
33445 49.3 45.9 52.7
33446 69.2 69.4 68.9
33449 42.9 43.2 42.6
33460 34.8 33.2 36.3
33461 32.7 31.7 33.8
33462 39.3 37.8 40.4
33463 34.1 32.4 35.4
33467 47.5 46.5 48.2
33472 53.1 50.0 55.8
33473 34.4 33.2 34.8
33484 69.8 70.3 69.6 Source: U.S. Census American Community Survey (ACS), 2013 Compiled by: Health Council of Southeast Florida, 2015
Table 10 below shows the median age by gender for Bethesda Hospital’s secondary service area in 2013. In 2013,
Greenacres, ZIP Code 33415 had the lowest total median age of 35.1 and Boca Raton, ZIP Code 33434 had the
highest total median age of 60.4 for Bethesda Hospital’s secondary service area.
Table 10: Median Age by Gender, Bethesda Hospital Secondary Service Area ZIP Codes, 2013
ZIP Code Total Male Female
33405 37.4 36.1 39.9
33406 35.9 34.1 37.5
33413 35.3 32.9 37.4
33415 35.1 32.9 36.9
33428 40.6 38.0 42.8
33431 39.5 37.8 42.2
33432 49.8 47.1 51.7
33433 49.3 46.9 51.2
33434 60.4 57.2 63.4
33483 54.0 55.0 53.5
33486 41.5 39.9 42.6
33487 51.7 50.0 53.3
33496 54.2 52.5 55.5
33498 45.0 44.1 46.1 Source: U.S. Census American Community Survey (ACS), 2013 Compiled by: Health Council of Southeast Florida, 2015

Bethesda Hospital Community Health Needs Assessment 10 | P a g e
Population by Race and Ethnicity
The racial and ethnic diversity within an area is another important consideration for health planning, as health
behavior, health care utilization, and subsequently health outcomes often differ between subpopulations. Table 11
shows the population of Palm Beach County and the state of Florida by race and ethnicity. The percentage of
individuals identifying as White was 75.8%, slightly lower than the state (76.3%). The percentage of individuals who
identify as Black or African American was 17.5%, slightly higher than the state’s rate (16.0%).
Nineteen and a half percent (19.5%) of the population in the county identify as Hispanic or Latino, slightly lower than
Florida (22.9%). Figures 4 and 5 show the population distribution by race and ethnicity graphically.
Table 11: Population by Race and Ethnicity, Palm Beach County and Florida, 2013
Palm Beach Florida
Number Percent Number Percent
RACE
Total population 1,339,221 1,339,221 19,091,156 19,091,156
One race 1,312,543 98.0% 18,660,701 97.7%
White 1,015,518 75.8% 14,568,521 76.3%
Black or African American 234,735 17.5% 3,056,152 16.0%
American Indian and Alaska Native 2,363 0.2% 58,390 0.3%
Asian 31,621 2.4% 475,905 2.5%
Native Hawaiian/Other Pacific Islander 654 0.0% 11,258 0.1%
Some other race 27,652 2.1% 490,475 2.6%
Two or more races 26,678 2.0% 430,455 2.3%
HISPANIC OR LATINO AND RACE
Total population 1,339,221 1,339,221 19,091,156 19,091,156
Hispanic or Latino (of any race) 261,279 19.5% 4,369,920 22.9%
Not Hispanic or Latino 1,077,942 80.5% 14,721,236 77.1% Source: U.S. Census American Community Survey (ACS), 2013 Compiled by: Health Council of Southeast Florida, 2015

Bethesda Hospital Community Health Needs Assessment 11 | P a g e
Figure 4: Population by Race, Palm Beach County, 2013
Figure 5: Population by Ethnicity, Palm Beach County, 2013
75.8%
17.5%
0.2%
2.4%2.1%
2.0%
Population by Race, Palm Beach County, 2013
White
Black or African American
American Indian/Alaska Native
Asian
Native Hawaiian/Other Pacific Islander
Some other race
19.5%
80.5%
Population by Ethnicity, Palm Beach County, 2013
Hispanic or Latino (of any race)
Not Hispanic or Latino
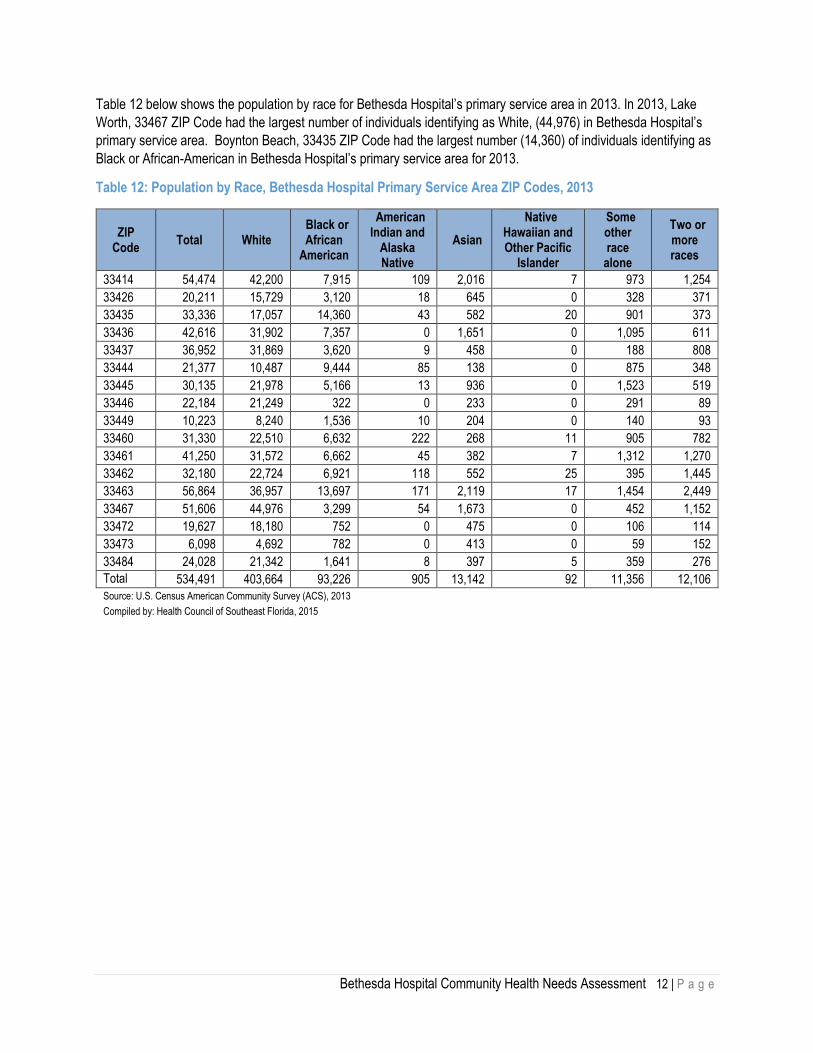
Bethesda Hospital Community Health Needs Assessment 12 | P a g e
Table 12 below shows the population by race for Bethesda Hospital’s primary service area in 2013. In 2013, Lake
Worth, 33467 ZIP Code had the largest number of individuals identifying as White, (44,976) in Bethesda Hospital’s
primary service area. Boynton Beach, 33435 ZIP Code had the largest number (14,360) of individuals identifying as
Black or African-American in Bethesda Hospital’s primary service area for 2013.
Table 12: Population by Race, Bethesda Hospital Primary Service Area ZIP Codes, 2013
ZIP Code
Total White Black or African
American
American Indian and
Alaska Native
Asian
Native Hawaiian and Other Pacific
Islander
Some other race
alone
Two or more races
33414 54,474 42,200 7,915 109 2,016 7 973 1,254
33426 20,211 15,729 3,120 18 645 0 328 371
33435 33,336 17,057 14,360 43 582 20 901 373
33436 42,616 31,902 7,357 0 1,651 0 1,095 611
33437 36,952 31,869 3,620 9 458 0 188 808
33444 21,377 10,487 9,444 85 138 0 875 348
33445 30,135 21,978 5,166 13 936 0 1,523 519
33446 22,184 21,249 322 0 233 0 291 89
33449 10,223 8,240 1,536 10 204 0 140 93
33460 31,330 22,510 6,632 222 268 11 905 782
33461 41,250 31,572 6,662 45 382 7 1,312 1,270
33462 32,180 22,724 6,921 118 552 25 395 1,445
33463 56,864 36,957 13,697 171 2,119 17 1,454 2,449
33467 51,606 44,976 3,299 54 1,673 0 452 1,152
33472 19,627 18,180 752 0 475 0 106 114
33473 6,098 4,692 782 0 413 0 59 152
33484 24,028 21,342 1,641 8 397 5 359 276
Total 534,491 403,664 93,226 905 13,142 92 11,356 12,106
Source: U.S. Census American Community Survey (ACS), 2013 Compiled by: Health Council of Southeast Florida, 2015
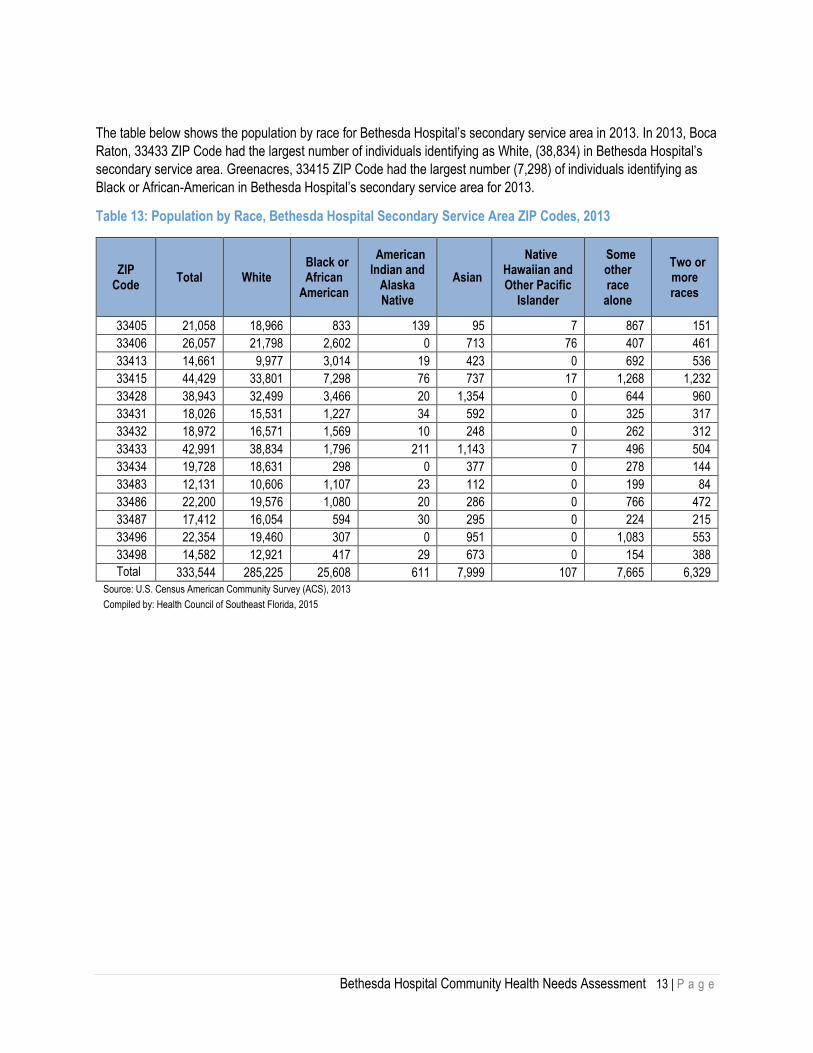
Bethesda Hospital Community Health Needs Assessment 13 | P a g e
The table below shows the population by race for Bethesda Hospital’s secondary service area in 2013. In 2013, Boca
Raton, 33433 ZIP Code had the largest number of individuals identifying as White, (38,834) in Bethesda Hospital’s
secondary service area. Greenacres, 33415 ZIP Code had the largest number (7,298) of individuals identifying as
Black or African-American in Bethesda Hospital’s secondary service area for 2013.
Table 13: Population by Race, Bethesda Hospital Secondary Service Area ZIP Codes, 2013
ZIP Code
Total White Black or African
American
American Indian and
Alaska Native
Asian
Native Hawaiian and Other Pacific
Islander
Some other race
alone
Two or more races
33405 21,058 18,966 833 139 95 7 867 151
33406 26,057 21,798 2,602 0 713 76 407 461
33413 14,661 9,977 3,014 19 423 0 692 536
33415 44,429 33,801 7,298 76 737 17 1,268 1,232
33428 38,943 32,499 3,466 20 1,354 0 644 960
33431 18,026 15,531 1,227 34 592 0 325 317
33432 18,972 16,571 1,569 10 248 0 262 312
33433 42,991 38,834 1,796 211 1,143 7 496 504
33434 19,728 18,631 298 0 377 0 278 144
33483 12,131 10,606 1,107 23 112 0 199 84
33486 22,200 19,576 1,080 20 286 0 766 472
33487 17,412 16,054 594 30 295 0 224 215
33496 22,354 19,460 307 0 951 0 1,083 553
33498 14,582 12,921 417 29 673 0 154 388
Total 333,544 285,225 25,608 611 7,999 107 7,665 6,329
Source: U.S. Census American Community Survey (ACS), 2013 Compiled by: Health Council of Southeast Florida, 2015

Bethesda Hospital Community Health Needs Assessment 14 | P a g e
Table 14 below shows the population by ethnicity for Bethesda Hospital’s primary service area in 2013. In 2013,
Boynton Beach, 33472 ZIP Code had the highest percent (95.4%) of individuals identifying as Non-Hispanic or Latino
in Bethesda Hospital’s primary service area. Lake Worth, 33461 ZIP Code had the highest percentage (51.0%) of
individuals identifying as Hispanic or Latino in Bethesda Hospital’s primary service area for 2013.
Table 14: Population by Ethnicity, Bethesda Hospital Primary Service Area ZIP Codes, 2013
ZIP Code Total Not Hispanic or Latino Hispanic or Latino
Number Percent Number Percent
33414 54,474 44,211 81.2% 10,263 18.8%
33426 20,211 16,982 84.0% 3,229 16.0%
33435 33,336 30,104 90.3% 3,232 9.7%
33436 42,616 37,491 88.0% 5,125 12.0%
33437 36,952 33,983 92.0% 2,969 8.0%
33444 21,377 18,889 88.4% 2,488 11.6%
33445 30,135 26,370 87.5% 3,765 12.5%
33446 22,184 20,174 90.9% 2,010 9.1%
33449 10,223 8,393 82.1% 1,830 17.9%
33460 31,330 18,278 58.3% 13,052 41.7%
33461 41,250 20,199 49.0% 21,051 51.0%
33462 32,180 24,308 75.5% 7,872 24.5%
33463 56,864 35,635 62.7% 21,229 37.3%
33467 51,606 44,119 85.5% 7,487 14.5%
33472 19,627 18,731 95.4% 896 4.6%
33473 6,098 5,467 89.7% 631 10.3%
33484 24,028 21,939 91.3% 2,089 8.7%
Total 534,491 425,273 79.6% 109,218 20.4% Source: U.S. Census American Community Survey (ACS), 2013 Compiled by: Health Council of Southeast Florida, 2015

Bethesda Hospital Community Health Needs Assessment 15 | P a g e
The table below shows the population by ethnicity for Bethesda Hospital’s secondary service area in 2013. In 2013,
Delray Beach, 33483 ZIP Code had the highest percentage (94.1%) of individuals identifying as Non-Hispanic or
Latino in Bethesda Hospital’s secondary service area. West Palm Beach, 33405 ZIP Code had the highest percent
(54.9%) of individuals identifying as Hispanic or Latino in Bethesda Hospital’s secondary service area for 2013.
Table 15: Population by Ethnicity, Bethesda Hospital Secondary Service Area ZIP Codes, 2013
ZIP Code Total Not Hispanic or Latino Hispanic or Latino
Number Percent Number Percent
33405 21,058 9,490 45.1% 11,568 54.9%
33406 26,057 12,857 49.3% 13,200 50.7%
33413 14,661 9,624 65.6% 5,037 34.4%
33415 44,429 24,253 54.6% 20,176 45.4%
33428 38,943 32,091 82.4% 6,852 17.6%
33431 18,026 15,716 87.2% 2,310 12.8%
33432 18,972 17,228 90.8% 1,744 9.2%
33433 42,991 36,458 84.8% 6,533 15.2%
33434 19,728 18,052 91.5% 1,676 8.5%
33483 12,131 11,418 94.1% 713 5.9%
33486 22,200 18,683 84.2% 3,517 15.8%
33487 17,412 15,589 89.5% 1,823 10.5%
33496 22,354 19,900 89.0% 2,454 11.0%
33498 14,582 12,757 87.5% 1,825 12.5%
Total 333,544 254,116 76.2% 79,428 23.8% Source: U.S. Census American Community Survey (ACS), 2013 Compiled by: Health Council of Southeast Florida, 2015

Bethesda Hospital Community Health Needs Assessment 16 | P a g e
Table 16 shows the foreign-born population distribution for Palm Beach and Florida by place of birth. In 2013, 22.6%
of the population in Palm Beach County was born in another country and of those, 73.4% (16.6% of the total
population in the county) were born in Latin America. The percent foreign-born population in Palm Beach County
(22.6%) is higher than that of Florida (19.4%).
Table 16: Foreign-Born Population, Palm Beach County and Florida, 2013
Palm Beach Florida
Number Percent Number Percent
Total population 1,339,221 1,339,221 19,091,156 19,091,156
Total Foreign Born Population 303,161 22.6% 3,698,746 19.4%
Total: 303,161 303,161 3,698,746 3,698,747
Europe: 36,800 12.1% 378,213 10.2%
Northern Europe: 9,954 3.3% 99,696 2.7%
Western Europe: 8,748 2.9% 90,325 2.4%
Southern Europe: 6,458 2.1% 64,268 1.7%
Eastern Europe: 11,580 3.8% 123,048 3.3%
Asia: 27,606 9.1% 375,049 10.1%
Eastern Asia: 5,015 1.7% 78,156 2.1%
South Central Asia: 7,446 2.5% 100,646 2.7%
South Eastern Asia: 9,425 3.1% 148,059 4.0%
Western Asia: 5,145 1.7% 45,074 1.2%
Africa: 5,072 1.7% 58,531 1.6%
Eastern Africa: 577 0.2% 10,844 0.3%
Middle Africa: 191 0.1% 1,597 0.0%
Northern Africa: 2,289 0.8% 19,277 0.5%
Southern Africa: 1,419 0.5% 9,457 0.3%
Western Africa: 472 0.2% 13,257 0.4%
Oceania: 594 0.2% 6,479 0.2%
Americas: 233,089 76.9% 2,880,474 77.9%
Latin America: 222,383 73.4% 2,772,454 75.0%
Caribbean: 114,804 37.9% 1,521,989 41.1%
Central America: 56,776 18.7% 605,702 16.4%
South America: 50,803 16.8% 644,763 17.4%
Northern America: 10,706 3.5% 108,020 2.9% Source: U.S. Census American Community Survey (ACS), 2013 Compiled by: Health Council of Southeast Florida, 2015

Bethesda Hospital Community Health Needs Assessment 17 | P a g e
Language is often a barrier to healthcare access, particularly for individuals with limited English proficiency. Table 17
shows languages spoken in Palm Beach and in Florida. In Palm Beach, 30.0% of the population reported speaking a
language other than English at home. Of those speaking other languages at home, 43.7% reported speaking English
‘less than very well’. In 2013, 17.7% of the population reported speaking Spanish or Spanish Creole at home and
10.0% reported speaking ‘Other Indo-European languages’.
Table 17: Languages Spoken at Home, Palm Beach County and Florida, 2013
Palm Beach County Florida
Total
% specified language speakers
Total
% specified language speakers
Speak English
"very well"
Speak English
less than "very well"
Speak English
"very well"
Speak English
less than "very well"
Population 5 years and over 1,301,699 86.90% 13.10% 18,478,811 88.50% 11.50%
Speak only English 70.0% (X) (X) 72.6% (X) (X)
Speak a language other than English
30.0% 56.3% 43.7% 27.4% 58.1% 41.9%
Spanish or Spanish Creole 17.7% 53.3% 46.7% 20.4% 56.3% 43.7%
Other Indo-European languages
10.0% 60.4% 39.6% 5.0% 64.8% 35.2%
Asian and Pacific Island languages
1.4% 57.2% 42.8% 1.5% 55.7% 44.3%
Other languages 0.9% 67.8% 32.2% 0.5% 70.4% 29.6% Source: U.S. Census American Community Survey (ACS), 2013 Complied by Health Council of Southeast Florida, 2015

Bethesda Hospital Community Health Needs Assessment 18 | P a g e
Table 18 shows languages spoken in Bethesda Hospital’s primary service area in 2013. In Bethesda Hospital’s
primary service area, 59.9% of the individuals in Palm Springs, ZIP Code 33461 reported speaking a language other
than English at home, which accounted for the largest number of individuals speaking a language other than English.
Of those speaking other languages at home, 54.8% reported speaking English ‘less than very well’ in Palm Springs,
ZIP Code 33461. In 2013, Boynton Beach, ZIP Code 33435 over 30% of the patients in this area reported speaking
another language; however, of those speaking other languages at home, 74.5% reported speaking English ‘less than
very well’.
Table 18: Languages Other Than English, Bethesda Hospital Primary Service Area ZIP Codes, 2013
Population 5 years and over
Speak a language other than English
Percent of Population Speak English less than
"very well"
33414 51,529 24.5% 30.0%
33426 19,330 26.7% 53.5%
33435 31,433 31.1% 74.5%
33436 40,284 26.4% 63.9%
33437 35,649 14.5% 61.3%
33444 20,257 29.6% 52.5%
33445 28,840 28.9% 37.6%
33446 21,615 16.3% 32.2%
33449 9,650 21.8% 19.3%
33460 28,984 53.5% 65.7%
33461 37,793 59.9% 54.8%
33462 29,899 38.1% 38.4%
33463 52,973 53.3% 46.9%
33467 49,348 21.2% 33.5%
33472 18,757 11.5% 44.1%
33473 5,344 20.2% 43.1%
33484 23,427 17.8% 59.9% Source: U.S. Census American Community Survey (ACS), 2013 Compiled by: Health Council of Southeast Florida, 2015

Bethesda Hospital Community Health Needs Assessment 19 | P a g e
The table below shows languages spoken in Bethesda Hospital’s secondary service area in 2013. In Bethesda
Hospital’s primary service area, 50.6% of the residents in Greenacres, ZIP Code 33415 reported speaking a
language other than English at home, which accounted for the largest number of patients speaking a language other
than English. Of those speaking other languages at home, 49.5% of Greenacres residents reported speaking English
‘less than very well’.
Table 19: Languages Other Than English, Bethesda Hospital Secondary Service Area ZIP Codes, 2013
Population 5 years and over
Speak a language other than English
Percent of Population Speak English less than
"very well"
33406 24,060 50.3% 47.0%
33413 13,720 40.5% 49.2%
33415 41,095 50.6% 49.5%
33428 37,101 37.0% 39.5%
33431 17,494 24.0% 23.0%
33432 18,351 21.2% 30.1%
33433 41,365 26.5% 30.9%
33434 19,354 19.6% 29.7%
33483 11,816 15.0% 47.6%
33486 21,183 24.5% 23.8%
33487 16,728 20.3% 34.0%
33496 21,665 22.8% 23.9%
33498 14,160 20.9% 27.6% Source: U.S. Census American Community Survey (ACS), 2013 Compiled by: Health Council of Southeast Florida, 2015

Bethesda Hospital Community Health Needs Assessment 20 | P a g e
Population by Census County Division
A Census County Division (CCD) is subdivision of a county that is a relatively permanent statistical area established
cooperatively by the Census Bureau and state and local government authorities. There are 11 CCD’s in Palm Beach
County. Six of these CCD’s are in Bethesda Hospital’s service areas including: Belle Glade-Pahokee, Boca Raton,
Boynton Beach-Delray Beach, Lake Worth, Sunshine Parkway and West Palm Beach. The table below shows
population for each of these divisions.
Table 20: Population by Census County Division (CCD), Palm Beach County and Florida, 2013
Palm Beach Census County Division Population Percent
Total Population 1,339,221 100.0%
Belle Glade-Pahokee CCD 34,447 2.6%
Boca Raton CCD 128,641 9.6%
Boynton Beach-Delray Beach CCD 314,570 23.5%
Glades CCD 332 0.0%
Jupiter CCD 84,306 6.3%
Lake Worth CCD 210,947 15.8%
Riviera Beach CCD 101,647 7.6%
Royal Palm Beach-West Jupiter CCD 100,640 7.5%
Sunshine Parkway CCD 191,576 14.3%
Western Community CCD 27,760 2.1%
West Palm Beach CCD 144,355 10.8% Source: U.S. Census American Community Survey (ACS), 2013 Compiled by: Health Council of Southeast Florida, 2015

Bethesda Hospital Community Health Needs Assessment 21 | P a g e
Population Growth
Table 21 reflects the population change, by age bracket, in Palm Beach County between 2012 and 2013. Overall,
there was a 1.1% increase in total population. Though the total population increased 1.1% from 2012 to 2013, there
are subgroups of the population which increased and decreased at disproportionate rates and this could have
implications for health care planning. The 55 - 59 year old age group represented the largest percent change with a
4.7% increase in the time period shown. The 85 and over age group experienced a significant population increase of
4.6%.
Table 21: Population Change by Age, Palm Beach County and Florida, 2012-2013
Population Percent Change from 2012 to 2013 2012 2013
Total population 1,324,085 1,339,221 1.1%
AGE
Under 5 years 70,611 70,607 0.0%
5 to 9 years 73,390 74,297 1.2%
10 to 14 years 76,156 76,253 0.1%
15 to 19 years 80,454 80,471 0.0%
20 to 24 years 74,892 76,590 2.3%
25 to 34 years 147,006 150,055 2.1%
35 to 44 years 166,286 164,126 -1.3%
45 to 54 years 187,033 188,801 0.9%
55 to 59 years 83,113 87,040 4.7%
60 to 64 years 77,778 77,545 -0.3%
65 to 74 years 131,554 136,050 3.4%
75 to 84 years 104,953 104,186 -0.7%
85 years and over 50,859 53,200 4.6%
Median age (years) 43.5 43.7 0.5% Source: U.S. Census American Community Survey (ACS), 2013 Compiled by: Health Council of Southeast Florida, 2015

Bethesda Hospital Community Health Needs Assessment 22 | P a g e
Socioeconomic Characteristics
Health is determined in part by access to social and economic opportunities, the resources and supports available in
the community, the quality of our schools, the safety of workplaces, the cleanliness of water, food, and air and the
nature of our social interactions and relationships. Social determinants of health are conditions in the environment in
which people are born, live, learn, work, etc. and affect a wide range of health and quality of life outcomes and risks.
There are five key areas of social determinants of health, which reflect critical components and/or key health issues:
economic stability, education, social and community context, health and health care and neighborhood and built
environment.4
The socioeconomic variables and indicators reported in this community health needs assessment include measures
on the social determinants of health, including, but not limited to poverty, income levels, educations,
employment/unemployment status, public assistance benefits, housing, transportation and crime.
Poverty
Poverty creates many difficulties for individuals, families and the communities in which they live. Poverty often
hinders access to a variety of services and products including proper medical care and nutrition. There are different
terms commonly used to reflect certain levels of poverty. The U.S. Census Bureau utilizes ‘poverty thresholds’ which
are statistical calculations used to ascertain the number of poor persons, whereas the Department of Health and
Human Services uses ‘poverty guidelines’ to determine eligibility for certain programs.5
Table 22 shows the Federal Department of Health and Human Services 2015 poverty guidelines.
Table 22: 2015 Poverty Guidelines
Persons in family/household Poverty guideline
1 $11,770
2 $15,930
3 $20,090
4 $24,250
5 $28,410
6 $32,570
7 $36,730
8 $40,890 Source: Department of Health and Human Services, 2015 Compiled by: Health Council of Southeast Florida, 2015
4 Healthy People 2020: Social Determinants of Health. http://www.healthypeople.gov/2020/topics-objectives/topic/social-determinants-health 5 http://aspe.hhs.gov/poverty/faq.shtml#programs

Bethesda Hospital Community Health Needs Assessment 23 | P a g e
Individuals in Poverty/Children in Poverty
This area measures the percent of individuals and children in poverty, as defined by the federal poverty threshold.
The table below shows individuals by age, gender, race and ethnicity in 2013 who have been below the poverty level
in the past 12 months. In Palm Beach County, 22.4% of the population under age 18 were below the poverty level. In
2013, 27.7% of individuals who identified as ‘Black or African American’ were living below the federal poverty line. In
addition, 22.0% of Hispanic or Latino residents were living in poverty.
Table 23: Poverty Status in the Past 12 Months by Age and Gender, Palm Beach County and Florida, 2013
Palm Beach Florida
Total Below
poverty level
Percent below
poverty level
Total Below
poverty level
Percent below
poverty level
Population for whom poverty status is determined 1,321,039 192,034 14.5% 18,681,565 3,052,807 16.3%
AGE
Under 18 years 267,355 59,900 22.4% 3,943,240 930,406 23.6%
Related children under 18 years 266,472 59,080 22.2% 3,926,018 914,242 23.3%
18 to 64 years 765,179 107,904 14.1% 11,403,318 1,784,101 15.6%
65 years and over 288,505 24,230 8.4% 3,335,007 338,300 10.1%
SEX
Male 636,978 87,479 13.7% 9,064,404 1,389,638 15.3%
Female 684,061 104,555 15.3% 9,617,161 1,663,169 17.3%
RACE
One race 1,294,611 186,912 14.4% 18,261,937 2,971,194 16.3%
White 1,003,392 113,546 11.3% 14,306,601 1,944,996 13.6%
Black or African American 229,396 63,567 27.7% 2,935,995 826,598 28.2%
American Indian and Alaska Native
2,326 647 27.8% 56,651 13,623 24.0%
Asian 31,495 3,200 10.2% 470,249 59,207 12.6%
Native Hawaiian and Other Pacific Islander
616 90 14.6% 10,931 1,490 13.6%
Some other race 27,386 5,862 21.4% 481,510 125,280 26.0%
Two or more races 26,428 5,122 19.4% 419,628 81,613 19.4%
EHTNICITY
Hispanic or Latino origin (of any race)
258,251 56,878 22.0% 4,304,700 918,939 21.3%
White alone, not Hispanic or Latino
783,617 65,363 8.3% 10,714,637 1,211,015 11.3%
Source: U.S. Census American Community Survey (ACS), 2013
Compiled by: Health Council of Southeast Florida, 2015

Bethesda Hospital Community Health Needs Assessment 24 | P a g e
The table below shows individuals by age in Bethesda Hospital’s primary service area who have been below the
poverty level in the past 12 months in 2013. In Bethesda Hospital’s primary service area, Lake Worth, ZIP Code
33460 had the highest percentage of patients living below the poverty level in the under 18 years and the 18-64
years age group. Palm Springs, ZIP Code 33461 had the highest percentage (18.7%) of patients living in poverty for
Bethesda Hospital’s primary service area in 2013.
Table 24: Poverty Status in the Past 12 Months by Age Group, Bethesda Hospital Primary Service Area ZIP Codes, 2013
ZIP Code All people Under 18 years 18 to 64 years 65 years and over
33414 8.7% 11.6% 7.8% 6.4%
33426 7.6% 9.0% 7.9% 6.1%
33435 27.0% 44.0% 26.0% 13.5%
33436 10.4% 14.6% 10.1% 8.3%
33437 9.1% 27.7% 12.2% 3.7%
33444 23.4% 33.8% 21.4% 18.1%
33445 10.8% 18.6% 10.2% 8.0%
33446 6.9% 6.3% 8.3% 6.2%
33449 5.5% 7.2% 5.4% 3.4%
33460 32.4% 51.6% 28.8% 12.4%
33461 28.2% 42.2% 24.0% 18.7%
33462 17.0% 23.3% 16.4% 11.1%
33463 16.8% 22.1% 14.6% 16.2%
33467 7.1% 8.6% 6.8% 6.7%
33472 4.9% 1.0% 5.9% 5.4%
33473 0.4% 0.0% 0.3% 3.1%
33484 9.6% 7.7% 10.9% 9.0%
Total 13.3% 19.4% 12.8% 9.2% Source: U.S. Census American Community Survey (ACS), 2013 Compiled by: Health Council of Southeast Florida, 2015

Bethesda Hospital Community Health Needs Assessment 25 | P a g e
The table below shows individuals by age in Bethesda Hospital’s secondary service area who have been below the
poverty level in the past 12 months in 2013. In Bethesda Hospital’s secondary service area, West Palm Beach, ZIP
Code 33405 had the highest percentage (38.0%) of individuals living below the poverty level in the under 18 years
age group. Boca Raton, ZIP Code 33432 had the highest percentage (21.6%) of individuals living in poverty for the
in the 18-64 years age group and Greenacres, ZIP Code 33415 had the highest percentage of individuals living in
poverty in the over 65 age group for the Bethesda Hospital’s secondary service area in 2013.
Table 25: Poverty Status in the Past 12 Months by Age Group, Bethesda Hospital Secondary Service Area ZIP Codes, 2013
ZIP Code All people Under 18 years 18 to 64 years 65 years and over
33405 23.2% 38.0% 20.0% 15.9%
33406 19.0% 27.5% 16.6% 15.4%
33413 16.3% 17.6% 18.0% 4.8%
33415 23.8% 36.0% 20.2% 17.8%
33428 9.5% 15.2% 7.2% 10.4%
33431 10.8% 8.1% 13.0% 5.7%
33432 17.5% 24.1% 21.6% 5.3%
33433 10.5% 12.2% 11.6% 7.6%
33434 8.9% 6.2% 9.4% 9.3%
33483 10.3% 25.4% 11.0% 4.1%
33486 9.0% 8.8% 10.3% 3.7%
33487 9.2% 18.5% 8.7% 5.4%
33496 7.9% 12.3% 9.2% 4.0%
33498 7.5% 10.0% 6.5% 7.2%
Total 13.1% 18.6% 13.1% 8.3% Source: U.S. Census American Community Survey (ACS), 2013 Compiled by: Health Council of Southeast Florida, 2015
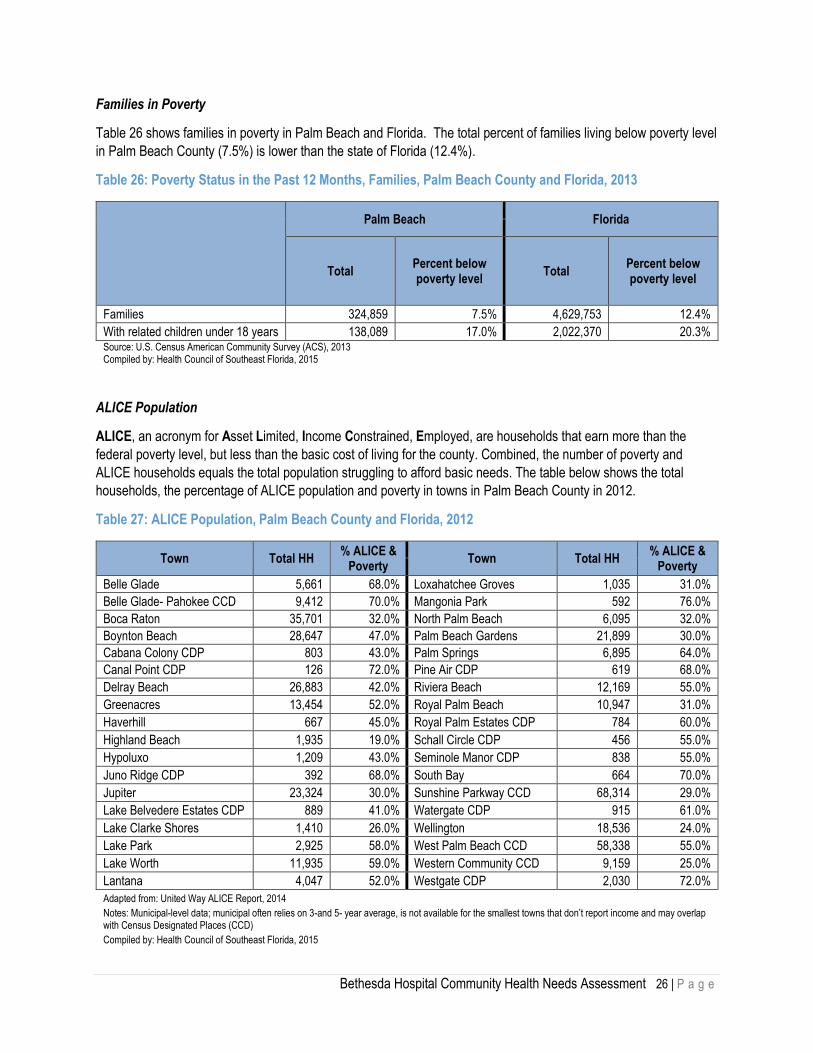
Bethesda Hospital Community Health Needs Assessment 26 | P a g e
Families in Poverty
Table 26 shows families in poverty in Palm Beach and Florida. The total percent of families living below poverty level
in Palm Beach County (7.5%) is lower than the state of Florida (12.4%).
Table 26: Poverty Status in the Past 12 Months, Families, Palm Beach County and Florida, 2013
Palm Beach Florida
Total Percent below poverty level
Total Percent below poverty level
Families 324,859 7.5% 4,629,753 12.4%
With related children under 18 years 138,089 17.0% 2,022,370 20.3% Source: U.S. Census American Community Survey (ACS), 2013 Compiled by: Health Council of Southeast Florida, 2015
ALICE Population
ALICE, an acronym for Asset Limited, Income Constrained, Employed, are households that earn more than the
federal poverty level, but less than the basic cost of living for the county. Combined, the number of poverty and
ALICE households equals the total population struggling to afford basic needs. The table below shows the total
households, the percentage of ALICE population and poverty in towns in Palm Beach County in 2012.
Table 27: ALICE Population, Palm Beach County and Florida, 2012
Town Total HH % ALICE &
Poverty Town Total HH
% ALICE & Poverty
Belle Glade 5,661 68.0% Loxahatchee Groves 1,035 31.0%
Belle Glade- Pahokee CCD 9,412 70.0% Mangonia Park 592 76.0%
Boca Raton 35,701 32.0% North Palm Beach 6,095 32.0%
Boynton Beach 28,647 47.0% Palm Beach Gardens 21,899 30.0%
Cabana Colony CDP 803 43.0% Palm Springs 6,895 64.0%
Canal Point CDP 126 72.0% Pine Air CDP 619 68.0%
Delray Beach 26,883 42.0% Riviera Beach 12,169 55.0%
Greenacres 13,454 52.0% Royal Palm Beach 10,947 31.0%
Haverhill 667 45.0% Royal Palm Estates CDP 784 60.0%
Highland Beach 1,935 19.0% Schall Circle CDP 456 55.0%
Hypoluxo 1,209 43.0% Seminole Manor CDP 838 55.0%
Juno Ridge CDP 392 68.0% South Bay 664 70.0%
Jupiter 23,324 30.0% Sunshine Parkway CCD 68,314 29.0%
Lake Belvedere Estates CDP 889 41.0% Watergate CDP 915 61.0%
Lake Clarke Shores 1,410 26.0% Wellington 18,536 24.0%
Lake Park 2,925 58.0% West Palm Beach CCD 58,338 55.0%
Lake Worth 11,935 59.0% Western Community CCD 9,159 25.0%
Lantana 4,047 52.0% Westgate CDP 2,030 72.0%
Adapted from: United Way ALICE Report, 2014
Notes: Municipal-level data; municipal often relies on 3-and 5- year average, is not available for the smallest towns that don’t report income and may overlap with Census Designated Places (CCD)
Compiled by: Health Council of Southeast Florida, 2015
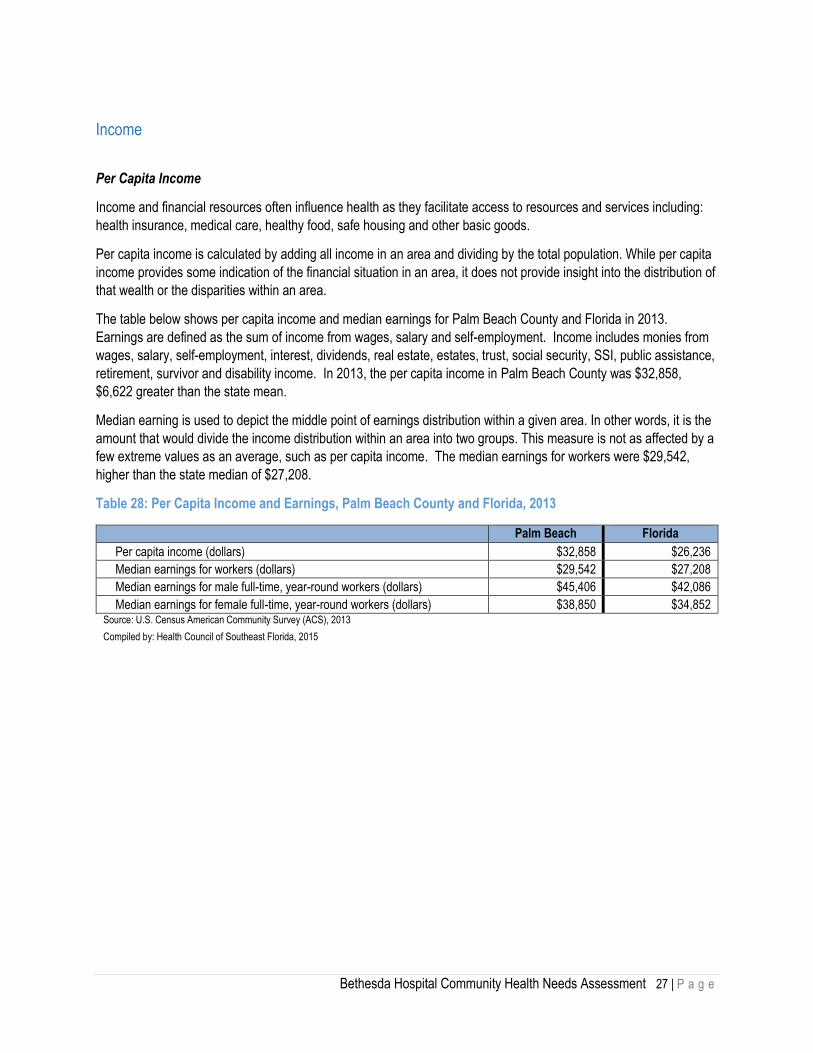
Bethesda Hospital Community Health Needs Assessment 27 | P a g e
Income
Per Capita Income
Income and financial resources often influence health as they facilitate access to resources and services including:
health insurance, medical care, healthy food, safe housing and other basic goods.
Per capita income is calculated by adding all income in an area and dividing by the total population. While per capita
income provides some indication of the financial situation in an area, it does not provide insight into the distribution of
that wealth or the disparities within an area.
The table below shows per capita income and median earnings for Palm Beach County and Florida in 2013.
Earnings are defined as the sum of income from wages, salary and self-employment. Income includes monies from
wages, salary, self-employment, interest, dividends, real estate, estates, trust, social security, SSI, public assistance,
retirement, survivor and disability income. In 2013, the per capita income in Palm Beach County was $32,858,
$6,622 greater than the state mean.
Median earning is used to depict the middle point of earnings distribution within a given area. In other words, it is the
amount that would divide the income distribution within an area into two groups. This measure is not as affected by a
few extreme values as an average, such as per capita income. The median earnings for workers were $29,542,
higher than the state median of $27,208.
Table 28: Per Capita Income and Earnings, Palm Beach County and Florida, 2013
Palm Beach Florida
Per capita income (dollars) $32,858 $26,236
Median earnings for workers (dollars) $29,542 $27,208
Median earnings for male full-time, year-round workers (dollars) $45,406 $42,086
Median earnings for female full-time, year-round workers (dollars) $38,850 $34,852 Source: U.S. Census American Community Survey (ACS), 2013
Compiled by: Health Council of Southeast Florida, 2015
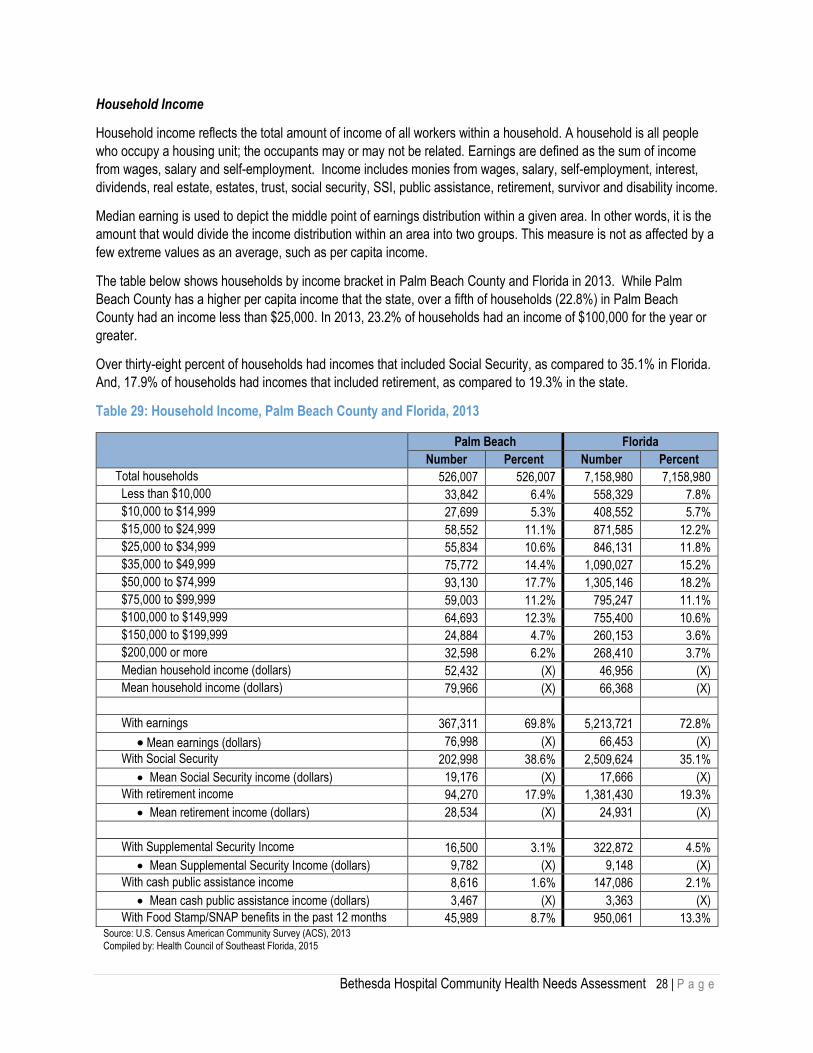
Bethesda Hospital Community Health Needs Assessment 28 | P a g e
Household Income
Household income reflects the total amount of income of all workers within a household. A household is all people
who occupy a housing unit; the occupants may or may not be related. Earnings are defined as the sum of income
from wages, salary and self-employment. Income includes monies from wages, salary, self-employment, interest,
dividends, real estate, estates, trust, social security, SSI, public assistance, retirement, survivor and disability income.
Median earning is used to depict the middle point of earnings distribution within a given area. In other words, it is the
amount that would divide the income distribution within an area into two groups. This measure is not as affected by a
few extreme values as an average, such as per capita income.
The table below shows households by income bracket in Palm Beach County and Florida in 2013. While Palm
Beach County has a higher per capita income that the state, over a fifth of households (22.8%) in Palm Beach
County had an income less than $25,000. In 2013, 23.2% of households had an income of $100,000 for the year or
greater.
Over thirty-eight percent of households had incomes that included Social Security, as compared to 35.1% in Florida.
And, 17.9% of households had incomes that included retirement, as compared to 19.3% in the state.
Table 29: Household Income, Palm Beach County and Florida, 2013
Palm Beach Florida
Number Percent Number Percent
Total households 526,007 526,007 7,158,980 7,158,980
Less than $10,000 33,842 6.4% 558,329 7.8%
$10,000 to $14,999 27,699 5.3% 408,552 5.7%
$15,000 to $24,999 58,552 11.1% 871,585 12.2%
$25,000 to $34,999 55,834 10.6% 846,131 11.8%
$35,000 to $49,999 75,772 14.4% 1,090,027 15.2%
$50,000 to $74,999 93,130 17.7% 1,305,146 18.2%
$75,000 to $99,999 59,003 11.2% 795,247 11.1%
$100,000 to $149,999 64,693 12.3% 755,400 10.6%
$150,000 to $199,999 24,884 4.7% 260,153 3.6%
$200,000 or more 32,598 6.2% 268,410 3.7%
Median household income (dollars) 52,432 (X) 46,956 (X)
Mean household income (dollars) 79,966 (X) 66,368 (X)
With earnings 367,311 69.8% 5,213,721 72.8%
Mean earnings (dollars) 76,998 (X) 66,453 (X)
With Social Security 202,998 38.6% 2,509,624 35.1%
Mean Social Security income (dollars) 19,176 (X) 17,666 (X)
With retirement income 94,270 17.9% 1,381,430 19.3%
Mean retirement income (dollars) 28,534 (X) 24,931 (X)
With Supplemental Security Income 16,500 3.1% 322,872 4.5%
Mean Supplemental Security Income (dollars) 9,782 (X) 9,148 (X)
With cash public assistance income 8,616 1.6% 147,086 2.1%
Mean cash public assistance income (dollars) 3,467 (X) 3,363 (X)
With Food Stamp/SNAP benefits in the past 12 months 45,989 8.7% 950,061 13.3% Source: U.S. Census American Community Survey (ACS), 2013 Compiled by: Health Council of Southeast Florida, 2015

Bethesda Hospital Community Health Needs Assessment 29 | P a g e
Family Income
Table 30 reflects the income and benefits of families in Palm Beach County and in Florida in 2013 by income bracket.
A family, as defined by the US Census Bureau is a household in which the householder and all (one or more) other
people living in the same household are related to the householder by blood, marriage or adoption. In Palm Beach
County in 2013, 15.5% of families had annual income of less than $25,000. Over 8.0% had income $200,000 or
more, which was higher than the state rate of 4.9%.
Table 30: Family Income and Benefits, Palm Beach County and Florida, 2013
Palm Beach Florida
Number Percent Number Percent
Families 324,859 324,859 4,629,753 4,629,753
Less than $10,000 14,269 4.4% 234,996 5.1%
$10,000 to $14,999 9,467 2.9% 161,877 3.5%
$15,000 to $24,999 26,641 8.2% 432,352 9.3%
$25,000 to $34,999 31,125 9.6% 500,916 10.8%
$35,000 to $49,999 44,128 13.6% 696,781 15.1%
$50,000 to $74,999 60,215 18.5% 920,528 19.9%
$75,000 to $99,999 41,339 12.7% 615,280 13.3%
$100,000 to $149,999 50,360 15.5% 619,926 13.4%
$150,000 to $199,999 20,222 6.2% 219,082 4.7%
$200,000 or more 27,093 8.3% 228,015 4.9%
Median family income (dollars) 64,260 (X) 56,738 (X)
Mean family income (dollars) 95,409 (X) 77,438 (X) Source: U.S. Census American Community Survey (ACS), 2013
Compiled by: Health Council of Southeast Florida, 2015

Bethesda Hospital Community Health Needs Assessment 30 | P a g e
Income by Service Areas
Table 31 below shows the income of households and families in Bethesda Hospital’s primary service area in 2013. In
Bethesda Hospital’s primary service area, Boynton Beach, ZIP Code 33473 had the highest median ($124,853) and
mean ($166,854) household income in 2013. The household and family incomes vary by ZIP Code across
Bethesda’s primary service area.
Table 31: Household, Family and Per Capita Income, Bethesda Hospital Primary Service Area ZIP Codes, 2013
ZIP Code Median household
income Mean household
income Median family
income Mean family
income Per capita
income
33414 $75,632 $98,656 $82,039 $107,195 $33,654
33426 $48,968 $59,382 $59,775 $68,246 $28,577
33435 $38,296 $60,107 $42,074 $67,997 $25,078
33436 $51,505 $68,903 $62,299 $83,378 $31,399
33437 $53,745 $73,785 $67,494 $86,239 $37,441
33444 $45,173 $61,499 $49,195 $69,019 $24,408
33445 $49,810 $70,607 $59,970 $81,407 $33,427
33446 $47,124 $89,587 $67,242 $124,467 $49,082
33449 $99,375 $134,630 $114,987 $152,423 $45,671
33460 $36,502 $50,094 $37,857 $53,442 $18,366
33461 $32,319 $41,557 $36,632 $45,253 $15,232
33462 $45,848 $68,120 $53,815 $79,306 $26,566
33463 $51,792 $61,643 $53,834 $64,964 $19,709
33467 $63,891 $82,387 $75,628 $96,413 $32,710
33472 $63,419 $81,031 $69,220 $89,726 $34,423
33473 $124,853 $166,854 $119,969 $149,041 $50,911
33484 $36,832 $55,747 $52,247 $76,649 $32,873
Source: U.S. Census American Community Survey (ACS), 2013
Compiled by: Health Council of Southeast Florida, 2015

Bethesda Hospital Community Health Needs Assessment 31 | P a g e
The table below shows the income of households and families in Bethesda Hospital’s secondary service area in
2013. In Bethesda Hospital’s secondary service area, Boca Raton, ZIP Code 33496 had the highest median
($83,138) and mean ($146,705) household income in 2013.
Table 32: Household, Family and Per Capita Income, Bethesda Hospital Secondary Service Area ZIP Codes, 2013
ZIP Code Median household
income Mean household
income Median family
income Mean family
income Per capita
income
33405 $43,311 $70,364 $42,311 $73,238 $27,323
33406 $47,685 $63,656 $48,432 $65,730 $22,930
33413 $49,881 $56,542 $51,618 $60,022 $19,992
33415 $35,248 $43,896 $39,948 $48,276 $16,799
33428 $59,152 $76,966 $66,903 $86,812 $28,842
33431 $67,500 $101,358 $87,813 $127,250 $38,708
33432 $55,150 $109,364 $80,408 $144,969 $54,603
33433 $53,801 $80,184 $73,896 $102,493 $37,883
33434 $48,713 $94,527 $81,141 $133,236 $47,002
33483 $62,604 $126,737 $87,111 $174,979 $66,120
33486 $76,772 $98,068 $90,368 $113,889 $39,982
33487 $66,439 $107,017 $89,104 $132,011 $48,650
33496 $83,138 $146,705 $97,285 $174,379 $64,715
33498 $82,541 $132,630 $89,688 $148,614 $47,941
Source: U.S. Census American Community Survey (ACS), 2013
Compiled by: Health Council of Southeast Florida, 2015

Bethesda Hospital Community Health Needs Assessment 32 | P a g e
Homelessness
In May 2015, the point in time count of homeless individuals in Palm Beach County was 1,421. Point-in-time
estimates include “both the persons living in emergency sheltered situations, as well as a count of the unsheltered
homeless on the street, or in places not meant for human habitation."6
Table 33 shows the point in time counts of homeless individuals in Palm Beach County by gender, age, race, and
ethnicity as of May 15, 2015. Those individuals who identified as Male accounted for 70.8% of homeless individuals
in Palm Beach County, while 56.6% of homeless individuals identified as White and 88.1% identified as Non-
Hispanic/Non-Latino.
Table 33: Homelessness by Gender, Age, Race and Ethnicity, Palm Beach County, 2015
Palm Beach
Count Percentage
Total Homeless 1,421 1,421
GENDER
Male 1,006 70.8%
Female 415 29.2%
AGE
Persons under 18 years 144 10.1%
Persons 18 to 24 years 97 6.8%
Persons 25 to 60 years 1,180 83.0%
Persons over 60 years 0 0.0%
RACE
American Indian/Alaska Native 11 0.8%
Asian 2 0.1%
Black/African American 573 40.3%
Native Hawaiian/Pacific Islander 3 0.2%
White 804 56.6%
Multiple Races 28 2.0%
ETHNICITY
Hispanic or Latino 169 11.9%
Non-Hispanic/Non-Latino 1,252 88.1%
Source: Department of Children and Families, Office of Homelessness, 2015 Point-in-Time Count Results, 2015
Compiled by: Health Council of Southeast Florida, 2015
6 http://www.pbcgov.com/communityservices/programs/humanservices/pdf/2015_State_PIT_Report_final.pdf

Bethesda Hospital Community Health Needs Assessment 33 | P a g e
Table 34 reflects the disability status, veteran status and household type of those homeless individuals in Palm
Beach County. Just over 45% of homeless individuals identified as having a disability. Additionally, 36.9% reported
having a mental health disability and 42.6% reported having a drug or alcohol addiction.
Table 34: Homelessness by Disability Status, Veteran Status and Household Type, Palm Beach County, 2015
Palm Beach
Count Percentage
Total Homeless 1,421 1,421
DISABILITY
Yes 641 45.1%
Physical 326 22.9%
Developmental 132 9.3%
Mental Health 524 36.9%
Drug or Alcohol Addiction 606 42.6%
HIV/AIDS 28 2.0%
No 116 8.2%
Don’t know 68 4.8%
VETERAN
Yes 157 11.0%
No 1,264 89.0%
HOUSEHOLD TYPE
Households with at least one Adult and one Child 201 14.1%
Households without Children 1,114 78.4%
Households with Children Only 17 1.2% Source: Department of Children and Families, Office of Homelessness, 2015 Point-in-Time Count Results, 2015 Note: Count estimates are from those individuals that responded to the interview. Counts and percentages are not mutually exclusive and should not be added together.
Compiled by: Health Council of Southeast Florida, 2015

Bethesda Hospital Community Health Needs Assessment 34 | P a g e
The table below shows the reported causes of homelessness in Palm Beach County as of May 15, 2015. The leading
reported cause of homelessness was ‘employment/financial reasons’ (32.7%).
Table 35: Homelessness by Cause, Palm Beach County, 2015
Palm Beach
Count Percentage
Total Homeless 1,421 1,421
CAUSE OF HOMELESSNESS
Employment/financial reasons 465 32.7%
Housing Issues- Forces to relocate from home 195 13.7%
Medical/disability problems 139 9.8%
Family problems 185 13.0%
Natural/other disasters 15 1.1%
Recent Immigration 5 0.4% Source: Department of Children and Families, Office of Homelessness, 2015 Point-in-Time Count Results, 2015
Note: Count estimates are from those individuals that responded to the interview. Counts and percentages are not mutually exclusive and should not be added together.
Compiled by: Health Council of Southeast Florida, 2015
The table below shows the point in time estimates of homeless individuals in Palm Beach County and Florida from
2007 to 2014. The number of homeless in Palm Beach County has fluctuated from 2007 to 2014, while in the state of
Florida the number of homeless has steadily decreased over the time period shown.
Table 36: Homelessness, Palm Beach County and Florida, 2007-2014
2007 2008 2009 2010 2011 2012 2013 2014
Florida 60,168 59,034 57,687 57,751 56,771 54,972 43,455 41,335
Palm Beach 1,766 1,766 2,147 2,147 2,148 2,148 1,543 1,543 Source: Department of Children and Families, Council on Homelessness, 2007-2014
Note: Counts cover those identified during one 24-hour period of time. The number of homeless may be higher.
Compiled by: Health Council of Southeast Florida, 2015

Bethesda Hospital Community Health Needs Assessment 35 | P a g e
Education
School Enrollment
Education is a social determinant of health with lower education levels linked with poor health, more stress and lower
self-confidence. Also, education often influences socioeconomic status. As previously noted, low socioeconomic
status can hinder access to health care services and can result in less desirable health outcomes.
Table 37 shows school enrollment by school type in Palm Beach County and Florida. In 2013, more than 305,000
individuals ages 3 and over in Palm Beach County were enrolled in school. Of those, 6.7% were in preschool, 5.2%
were in kindergarten, 19.0% were in grades 1 through 4, 20.5% were in grades 5 through 8, 21.6% were in high
school and more than a quarter were in college or graduate school. School enrollment in Palm Beach County was
comparable to that of the state.
Table 37: School Enrollment, Palm Beach County and Florida, 2013
Palm Beach Florida
Number Percent Number Percent
Enrolled in school: 305,449 305,450 4,625,006 4,625,007
Enrolled in nursery school, preschool 20,493 6.7% 286,859 6.2%
Enrolled in kindergarten 15,765 5.2% 222,951 4.8%
Enrolled in grade 1 to grade 4 58,023 19.0% 885,402 19.1%
Enrolled in grade 5 to grade 8 62,600 20.5% 914,987 19.8%
Enrolled in grade 9 to grade 12 65,918 21.6% 942,798 20.4%
Enrolled in college, undergraduate years 69,095 22.6% 1,151,436 24.9%
Graduate or professional school 13,555 4.4% 220,573 4.8%
Source: U.S. Census American Community Survey (ACS), 2013
Compiled by: Health Council of Southeast Florida, 2015
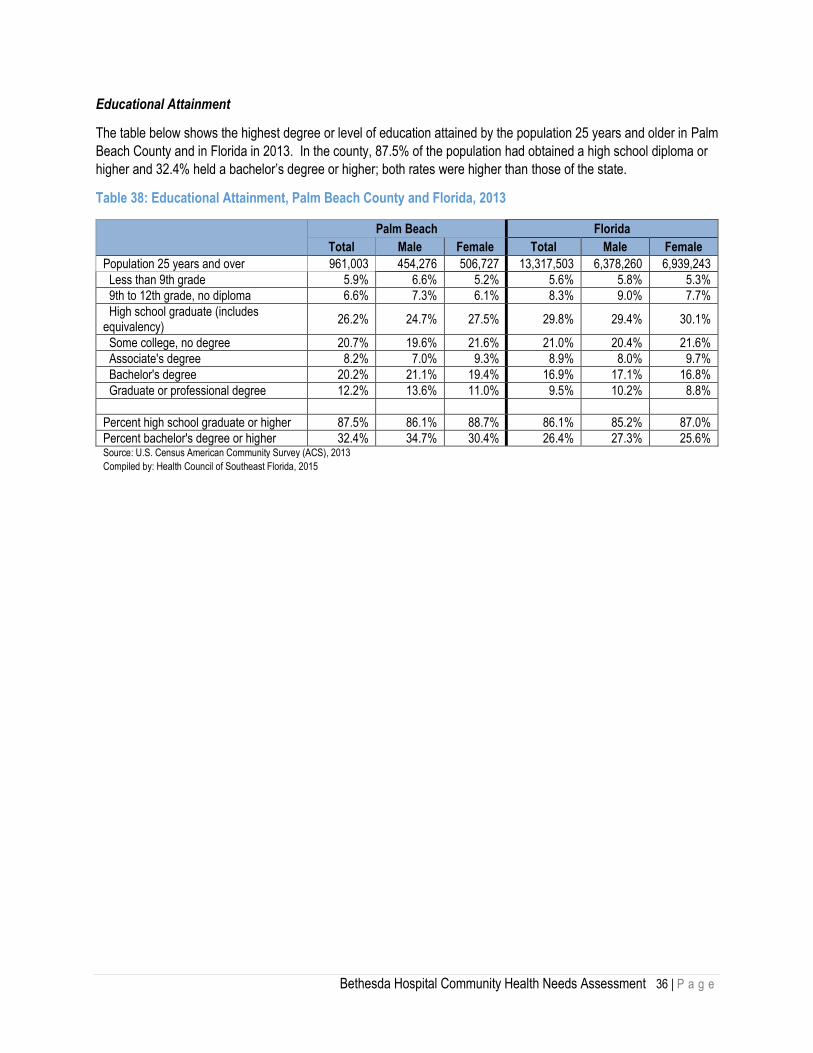
Bethesda Hospital Community Health Needs Assessment 36 | P a g e
Educational Attainment
The table below shows the highest degree or level of education attained by the population 25 years and older in Palm
Beach County and in Florida in 2013. In the county, 87.5% of the population had obtained a high school diploma or
higher and 32.4% held a bachelor’s degree or higher; both rates were higher than those of the state.
Table 38: Educational Attainment, Palm Beach County and Florida, 2013
Palm Beach Florida
Total Male Female Total Male Female
Population 25 years and over 961,003 454,276 506,727 13,317,503 6,378,260 6,939,243
Less than 9th grade 5.9% 6.6% 5.2% 5.6% 5.8% 5.3%
9th to 12th grade, no diploma 6.6% 7.3% 6.1% 8.3% 9.0% 7.7%
High school graduate (includes equivalency)
26.2% 24.7% 27.5% 29.8% 29.4% 30.1%
Some college, no degree 20.7% 19.6% 21.6% 21.0% 20.4% 21.6%
Associate's degree 8.2% 7.0% 9.3% 8.9% 8.0% 9.7%
Bachelor's degree 20.2% 21.1% 19.4% 16.9% 17.1% 16.8%
Graduate or professional degree 12.2% 13.6% 11.0% 9.5% 10.2% 8.8%
Percent high school graduate or higher 87.5% 86.1% 88.7% 86.1% 85.2% 87.0%
Percent bachelor's degree or higher 32.4% 34.7% 30.4% 26.4% 27.3% 25.6% Source: U.S. Census American Community Survey (ACS), 2013 Compiled by: Health Council of Southeast Florida, 2015

Bethesda Hospital Community Health Needs Assessment 37 | P a g e
Table 39 below shows the highest degree or level of education attained by the population 25 years and older in
Bethesda Hospital’s primary service area in 2013. In Bethesda Hospital’s primary service area, Boynton Beach, ZIP
Code 33473 had the highest percent of individuals who had obtained a high school degree or higher (98.4%) and the
highest percent of individuals who obtained a bachelor’s degree or higher (68.9%) in 2013. In Bethesda Hospital’s
primary service areas, the majority of ZIP Codes have a higher percentage of high school graduates and those
earning a bachelor’s degree than in Palm Beach County.
Table 39: Educational Attainment, Bethesda Primary Service Area ZIP Codes, 2013
ZIP Code Population 25 years and over Percent high school graduate
or higher Percent bachelor's degree or
higher
33414 34,288 94.0% 40.2%
33426 15,364 89.1% 26.5%
33435 23,374 81.2% 21.2%
33436 32,571 91.6% 29.7%
33437 32,535 94.1% 39.1%
33444 15,221 77.9% 26.4%
33445 23,365 87.0% 34.3%
33446 19,938 92.3% 38.6%
33449 6,750 93.6% 47.8%
33460 21,234 65.1% 17.8%
33461 25,796 72.0% 15.1%
33462 21,640 80.9% 22.7%
33463 35,919 79.2% 19.4%
33467 37,012 92.5% 35.7%
33472 15,383 96.8% 37.2%
33473 3,664 98.4% 68.9%
33484 21,772 90.4% 30.5%
Total 385,826 86.8% 32.4%
Source: U.S. Census American Community Survey (ACS), 2013
Compiled by: Health Council of Southeast Florida, 2015

Bethesda Hospital Community Health Needs Assessment 38 | P a g e
The table below shows the highest degree or level of education attained by the population 25 years and older in
Bethesda Hospital’s secondary service area in 2013. In Bethesda Hospital’s secondary service area, Boca Raton,
ZIP Codes 33486 (96.1%) and 33498 (96.1%) had the highest percentages of individuals who had obtained a high
school degree or higher in 2013. In 2013, residents in Boca Raton ZIP Code 33496 had the highest percent (52.2%)
of individuals who had obtained a bachelor’s degree or higher. Similar to Bethesda Hospital’s primary service area,
its secondary service area has the majority of ZIP Codes having a higher percentage of high school graduates and
those earning a bachelor’s degree than in Palm Beach County.
Table 40: Educational Attainment, Bethesda Secondary Service Area ZIP Codes, 2013
ZIP Code Population 25 years and over Percent high school graduate
or higher Percent bachelor's degree or
higher
33405 15,271 74.7% 25.2%
33406 17,704 82.9% 23.0%
33413 9,876 86.4% 26.2%
33415 28,897 77.4% 14.5%
33428 26,452 91.0% 31.0%
33431 11,545 95.6% 47.0%
33432 14,447 95.0% 45.3%
33433 32,430 94.8% 42.4%
33434 16,215 92.1% 47.3%
33483 10,245 95.4% 51.0%
33486 15,710 96.1% 49.2%
33487 13,573 93.9% 47.3%
33496 17,261 95.8% 52.2%
33498 10,113 96.1% 50.7%
Total 239,739 90.5% 39.5%
Source: U.S. Census American Community Survey (ACS), 2013
Compiled by: Health Council of Southeast Florida, 2015
High School Graduation Rates
Table 41 shows graduation rates in Palm Beach County and Florida from the school year 2009-10 through 2013-14.
During the time period shown, the rate in Palm Beach County increased from 74.8% to 77.9% and was consistently
higher than the rate in Florida.
Table 41: High School Graduation Rates, Palm Beach County and Florida, 2009-2013
2009-10 2010-11 2011-12 2012-13 2013-14
Palm Beach County 74.8% 74.3% 77.0% 76.3% 77.9%
Florida 69.0% 70.6% 74.5% 75.6% 76.1%
Source: 2013-14 Florida Department of Education (FDOE) cohort graduation data as of 2/25/2015.
Compiled by: Health Council of Southeast Florida, 2015

Bethesda Hospital Community Health Needs Assessment 39 | P a g e
School Performance
The table below shows the school grades received by all schools in Palm Beach County from 2010 to 2014. School
grades for elementary and middle schools are determined by a combination of factors including learning gains and
performance measures. Grades from high school include consideration of other measures.
Table 42: School Grades, Palm Beach County, 2010-2014
Grade 2010 2011 2012 2013 2014
A 107 60.8% 106 59.6% 102 56.7% 74 40.9% 87 44.2%
B 29 16.5% 38 21.3% 35 19.4% 44 24.3% 38 19.3%
C 31 17.6% 25 14.0% 32 17.8% 44 24.3% 43 21.8%
D 5 2.8% 8 4.5% 10 5.6% 15 8.3% 17 8.6%
F 4 2.3% 1 0.6% 1 0.6% 4 2.2% 9 4.6%
Incomplete 0 0.0% 0 0.0% 0 0.0% 0 0.0% 3 1.5%
Source: Florida Department of Education, 2014
Notes: Schools that serve high school grade levels will receive a grade based on a weighting of state-assessment-based components and other components for which data are not currently available. The word “Pending” will appear as their school grade until the other components are available near the end of 2014
Compiled by: Health Council of Southeast Florida, 2015
Standardized Test Scores
Table 43 reflects the percentage of students in Palm Beach County, by grade level, who scored 3 or above on the
reading and mathematics section of the Florida Comprehensive Test 2.0 (FCAT) in the years 2012 – 2014. Scoring
ranges from one (lowest) to five (highest), with three representing a satisfactory performance in the assessed grade
and subject.
Table 43: Percentage of Students Passing (Score of 3 and Above), Palm Beach County, 2012-2014
Grade Reading Mathematics
2012 2013 2014 2012 2013 2014
3 4% 54% 55% 56% 59% 57%
4 61% 61% 61% 62% 64% 66%
5 61% 61% 62% 57% 57% 59%
6 56% 59% 61% 56% 54% 57%
7 58% 59% 56% 61% 60% 58%
8 59% 59% 58% 67% 61% 50%
9 53% 55% 55% NA NA NA
10 54% 58% 56% NA NA NA Source: Florida Department of Education, 2014
Note: NA indicates the FCAT 2.0 was not given that year or is not administered for the selected grade level.
Note: The Spring 2011 FCAT 2.0 Reading and Mathematics and Spring 2012 FCAT 2.0 Science scores were reported as FCAT Equivalent Scores in order to maintain consistent expectations for student performance during the transition year. FCAT Equivalent Scores for these years have been converted to the established FCAT 2.0 scales and are provided in this database so that stakeholders and the general public are able to see what the scores would have been if the established score scales and Achievement Levels had been approved and implemented at that time.
Compiled by: Health Council of Southeast Florida, 2015

Bethesda Hospital Community Health Needs Assessment 40 | P a g e
Business and Employment
Unemployment
High rates of unemployment can affect the financial stability of individuals within a community, can lead to decreased
expenditures for health care and can result in higher rates of uninsured.
The table below shows employment status of the population 16 years and older in Palm Beach County and in Florida
in 2013. In Palm Beach County there were 665,510 individuals in the labor force, constituting 60.4% of the county’s
population. Individuals in the labor force include those who are currently working, as well as those who are not
working but are actively looking for a job and available to start work. In Palm Beach County, 7.1% of the labor force
was unemployed, slightly higher than Florida as a whole.
Table 44: Employment Status, Palm Beach County and Florida, 2013
Palm Beach Florida
Estimate Percent Estimate Percent
Population 16 years and over 1,102,295 1,102,295 15,563,534 15,563,534
In labor force 665,510 60.4% 9,355,809 60.1%
Civilian labor force 665,036 60.3% 9,298,664 59.7%
Employed 586,528 53.2% 8,202,636 52.7%
Unemployed 78,508 7.1% 1,096,028 7.0%
Armed Forces 474 0.0% 57,145 0.4%
Not in labor force 436,785 39.6% 6,207,725 39.9%
Civilian labor force 665,036 665,036 9,298,664 9,298,664
Percent Unemployed (X) 11.8% (X) 11.8% Source: U.S. Census American Community Survey (ACS), 2013 Compiled by: Health Council of Southeast Florida, 2015

Bethesda Hospital Community Health Needs Assessment 41 | P a g e
The table below shows employment status of the population 16 years and older in Bethesda Hospital’s primary
service areas in 2013. In Boynton Beach ZIP Code 33473, 73.3% of the labor force was employed in 2013. Lake
Worth ZIP Code 33460 had the highest percentage of unemployment (14.0%) in Bethesda Hospital’s primary service
areas.
Table 45: Employment Status, Bethesda Hospital Primary Service Area ZIP Codes, 2013
ZIP Code Population 16 years
and over In labor force Employed Unemployed
33414 41,395 68.5% 62.5% 5.9%
33426 17,444 66.0% 58.8% 7.2%
33435 27,530 60.1% 48.7% 11.4%
33436 35,839 58.7% 52.4% 6.3%
33437 33,958 37.7% 33.1% 4.5%
33444 17,835 71.0% 58.6% 12.4%
33445 26,083 59.6% 52.9% 6.7%
33446 20,592 29.0% 26.2% 2.8%
33449 7,840 60.0% 51.8% 8.1%
33460 25,000 71.9% 57.9% 14.0%
33461 31,353 69.2% 57.6% 11.5%
33462 25,653 65.1% 54.9% 10.1%
33463 43,169 72.2% 62.1% 10.1%
33467 42,319 58.0% 52.7% 5.3%
33472 16,762 50.4% 46.0% 4.5%
33473 3,893 77.0% 73.3% 3.8%
33484 22,565 33.2% 29.0% 4.2%
Total 439,230 59.3% 51.7% 7.6%
Source: U.S. Census American Community Survey (ACS), 2013
Compiled by: Health Council of Southeast Florida, 2015

Bethesda Hospital Community Health Needs Assessment 42 | P a g e
Table 46 shows employment status of the population 16 years and older in Bethesda Hospital’s secondary service
area in 2013. In Greenacres ZIP Code 33415, 63.2% of the labor force was employed in 2013. Greenacres ZIP
Code 33413 had the highest percentage of unemployment (10.2%) in Bethesda Hospital’s secondary service area.
Table 46: Employment Status, Bethesda Hospital Secondary Service Area ZIP Codes, 2013
ZIP Code Population 16 years
and over In labor force Employed Unemployed
33405 17,271 66.6% 59.1% 7.5%
33406 20,855 68.5% 60.0% 8.5%
33413 11,585 69.3% 61.4% 7.8%
33415 34,570 65.5% 55.3% 10.2%
33428 31,282 69.2% 63.2% 6.0%
33431 15,800 60.1% 52.2% 8.0%
33432 16,791 60.7% 54.4% 6.3%
33433 36,524 55.1% 49.4% 5.7%
33434 17,713 43.7% 38.8% 4.9%
33483 11,052 54.8% 49.1% 5.7%
33486 18,322 70.2% 63.3% 6.6%
33487 15,059 56.8% 52.5% 4.3%
33496 19,170 47.9% 44.1% 3.8%
33498 11,632 59.4% 54.8% 4.6%
Total 277,626 60.6% 54.1% 6.4% Source: U.S. Census American Community Survey (ACS), 2013
Compiled by: Health Council of Southeast Florida, 2015
Table 47 shows the unemployment rate in the cities of Palm Beach County from 2009 to 2014. There has been a
steady decline in the unemployment rate starting in 2010.
Table 47: Unemployment Rate, Palm Beach County, 2009-2014
City Year
2009 2010 2011 2012 2013 2014
Total 9.9 10.9 10.4 8.7 7.5 6.3
Boca Raton 8.1 8.6 7.8 6.8 5.5 4.6
Boynton Beach 10.0 10.8 9.9 8.4 7.2 5.7
Delray Beach 10.4 10.4 9.5 7.8 6.7 5.7
Greenacres 9.6 8.7 8.0 6.8 5.6 4.7
Lake Worth 9.6 10.8 9.9 8.0 6.9 5.6
Palm Bay City 11.0 11.5 10.4 9.8 8.6 7.3
Palm Beach Garden 6.9 7.7 7.2 6.0 5.1 4.3
West Palm Beach 10.5 10.5 9.5 8.3 6.9 5.4
Royal Palm Beach 8.9 9.3 8.8 7.3 6.0 4.8
Wellington 8.0 8.9 8.3 7.1 5.8 4.8 Source: U.S. Bureau of Labor Statistics, 2014 Notes: Cities and town above 25,000 population. Data not seasonally adjusted Compiled by: Health Council of Southeast Florida, 2015

Bethesda Hospital Community Health Needs Assessment 43 | P a g e
Employer Size & Industry
The table below shows the number and percentage of workers by industry in Palm Beach County and in Florida in
2013. The greatest percentage of workers in the county, 21.1%, were in the educational services, and health care
and social assistance industry.
Table 48: Industry, Palm Beach County and Florida, 2013
Subject Palm Beach Florida
Estimate Percent Estimate Percent
Civilian employed population 16 years and over 586,528 586,528 8,202,636 8,202,636
Agriculture, forestry, fishing and hunting, and mining 7,740 1.3% 92,525 1.1%
Construction 40,169 6.8% 542,384 6.6%
Manufacturing 26,536 4.5% 441,019 5.4%
Wholesale trade 16,079 2.7% 239,548 2.9%
Retail trade 77,852 13.3% 1,095,952 13.4%
Transportation and warehousing, and utilities 25,418 4.3% 414,490 5.1%
Information 11,862 2.0% 166,761 2.0%
Finance and insurance, and real estate and rental and leasing
47,478 8.1% 634,559 7.7%
Professional, scientific, and management, and administrative and waste management services
84,998 14.5% 1,012,055 12.3%
Educational services, and health care and social assistance
123,556 21.1% 1,753,165 21.4%
Arts, entertainment, and recreation, and accommodation and food services
67,590 11.5% 973,248 11.9%
Other services, except public administration 35,122 6.0% 439,870 5.4%
Public administration 22,128 3.8% 397,060 4.8% Source: U.S. Census American Community Survey (ACS), 2013 Compiled by: Health Council of Southeast Florida, 2015
Table 49 reflects the number and percentage of workers in Palm Beach County and in Florida by occupation. Over a
third of individuals in the county were in management, business, science, and arts occupations and over a quarter
were in sales and office occupations, which is similar to the state of Florida.
Table 49: Occupation, Palm Beach County and Florida, 2013
Subject Palm Beach Florida
Estimate Percent Estimate Percent
Civilian employed population 16 years and over 586,528 586,528 8,202,636 8,202,636
Management, business, science, and arts occupations 207,447 35.4% 2,760,656 33.7%
Service occupations 128,072 21.8% 1,677,942 20.5%
Sales and office occupations 155,884 26.6% 2,278,846 27.8%
Natural resources, construction, and maintenance occupations 53,062 9.0% 749,587 9.1%
Production, transportation, and material moving occupations 42,063 7.2% 735,605 9.0% Source: U.S. Census American Community Survey (ACS), 2013 Compiled by: Health Council of Southeast Florida, 2015
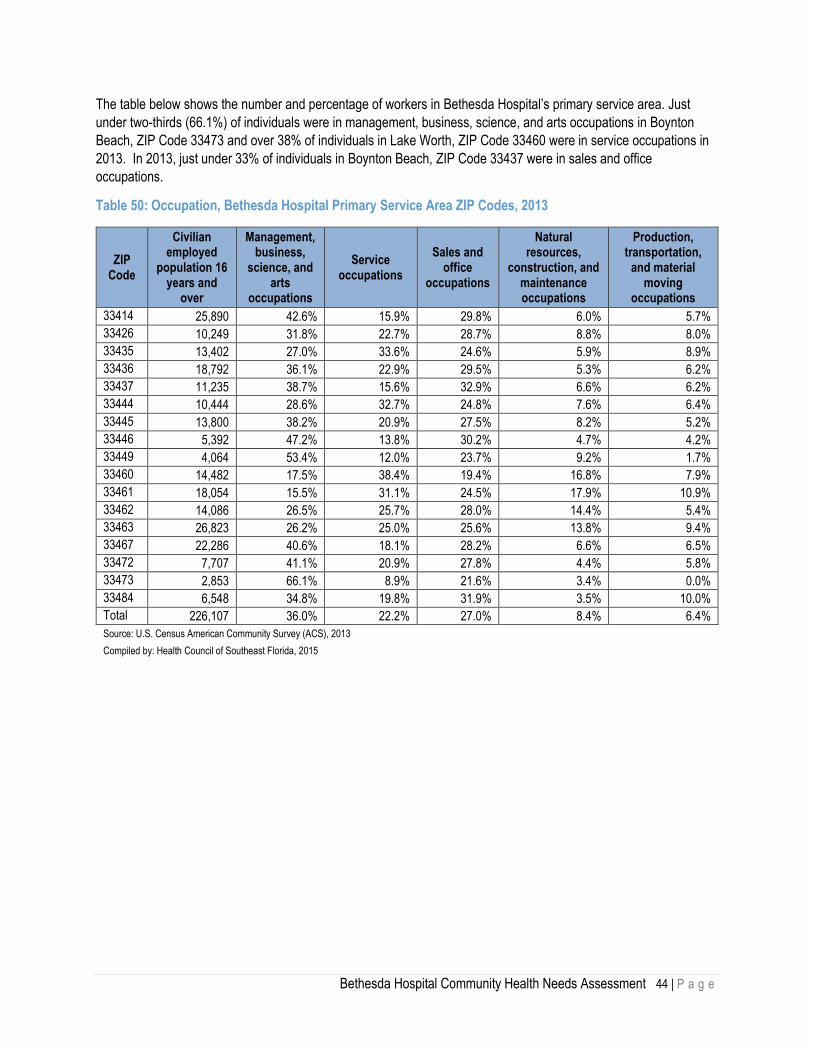
Bethesda Hospital Community Health Needs Assessment 44 | P a g e
The table below shows the number and percentage of workers in Bethesda Hospital’s primary service area. Just
under two-thirds (66.1%) of individuals were in management, business, science, and arts occupations in Boynton
Beach, ZIP Code 33473 and over 38% of individuals in Lake Worth, ZIP Code 33460 were in service occupations in
2013. In 2013, just under 33% of individuals in Boynton Beach, ZIP Code 33437 were in sales and office
occupations.
Table 50: Occupation, Bethesda Hospital Primary Service Area ZIP Codes, 2013
ZIP Code
Civilian employed
population 16 years and
over
Management, business,
science, and arts
occupations
Service occupations
Sales and office
occupations
Natural resources,
construction, and maintenance occupations
Production, transportation,
and material moving
occupations
33414 25,890 42.6% 15.9% 29.8% 6.0% 5.7%
33426 10,249 31.8% 22.7% 28.7% 8.8% 8.0%
33435 13,402 27.0% 33.6% 24.6% 5.9% 8.9%
33436 18,792 36.1% 22.9% 29.5% 5.3% 6.2%
33437 11,235 38.7% 15.6% 32.9% 6.6% 6.2%
33444 10,444 28.6% 32.7% 24.8% 7.6% 6.4%
33445 13,800 38.2% 20.9% 27.5% 8.2% 5.2%
33446 5,392 47.2% 13.8% 30.2% 4.7% 4.2%
33449 4,064 53.4% 12.0% 23.7% 9.2% 1.7%
33460 14,482 17.5% 38.4% 19.4% 16.8% 7.9%
33461 18,054 15.5% 31.1% 24.5% 17.9% 10.9%
33462 14,086 26.5% 25.7% 28.0% 14.4% 5.4%
33463 26,823 26.2% 25.0% 25.6% 13.8% 9.4%
33467 22,286 40.6% 18.1% 28.2% 6.6% 6.5%
33472 7,707 41.1% 20.9% 27.8% 4.4% 5.8%
33473 2,853 66.1% 8.9% 21.6% 3.4% 0.0%
33484 6,548 34.8% 19.8% 31.9% 3.5% 10.0%
Total 226,107 36.0% 22.2% 27.0% 8.4% 6.4%
Source: U.S. Census American Community Survey (ACS), 2013
Compiled by: Health Council of Southeast Florida, 2015

Bethesda Hospital Community Health Needs Assessment 45 | P a g e
Table 51 below reflects the number and percentage of workers in Bethesda Hospital’s secondary service area. Over
52% of individuals were in management, business, science, and arts occupations in Boca Raton, ZIP Code 33498
and over 26% of individuals in West Palm Beach, ZIP Code 33405 were in service occupations in 2013. In 2013,
34.1% of individuals in Boca Raton, ZIP Code 33434 were in sales and office occupations.
Table 51: Occupation, Bethesda Hospital Secondary Service Area ZIP Codes, 2013
ZIP Code
Civilian employed
population 16 years and
over
Management, business,
science, and arts
occupations
Service occupations
Sales and office
occupations
Natural resources,
construction, and maintenance occupations
Production, transportation,
and material moving
occupations
33405 10,209 31.0% 26.6% 19.9% 13.9% 8.5%
33406 12,507 26.7% 23.3% 23.6% 17.6% 8.7%
33413 7,115 30.0% 24.1% 28.5% 9.2% 8.3%
33415 19,109 20.4% 25.9% 27.1% 15.4% 11.2%
33428 19,758 33.9% 21.3% 28.9% 9.0% 7.0%
33431 8,241 44.8% 18.7% 23.6% 7.6% 5.3%
33432 9,142 45.1% 20.3% 24.5% 4.8% 5.3%
33433 18,033 44.0% 18.0% 27.3% 4.5% 6.2%
33434 6,865 45.5% 14.1% 34.1% 3.8% 2.5%
33483 5,428 47.1% 17.8% 27.0% 5.1% 3.0%
33486 11,602 45.7% 16.1% 28.9% 3.8% 5.6%
33487 7,903 44.9% 13.2% 30.4% 5.5% 6.0%
33496 8,452 52.5% 7.9% 30.8% 4.3% 4.5%
33498 6,378 52.9% 11.3% 31.0% 3.2% 1.6%
Total 150,742 40.3% 18.5% 27.5% 7.7% 6.0% Source: U.S. Census American Community Survey (ACS), 2013 Compiled by: Health Council of Southeast Florida, 2015
The table below shows the employed population 16 years and older in Palm Beach County and in Florida by the
class of worker. In 2013, the majority, 82.0%, of workers in the county were private wage or salary workers. There
were less government workers and more self-employed in own not incorporated business workers in Palm Beach
County than the state of Florida.
Table 52: Class of Worker, Palm Beach County and Florida, 2013
Subject Palm Beach Florida
Estimate Percent Estimate Percent
Civilian employed population 16 years and over 586,528 586,528 8,202,636 8,202,636
Private wage and salary workers 480,955 82.0% 6,623,008 80.7%
Government workers 67,174 11.5% 1,084,514 13.2%
Self-employed in own not incorporated business workers 37,317 6.4% 483,758 5.9%
Unpaid family workers 1,082 0.2% 11,356 0.1% Source: U.S. Census American Community Survey (ACS), 2013 Compiled by: Health Council of Southeast Florida, 2015
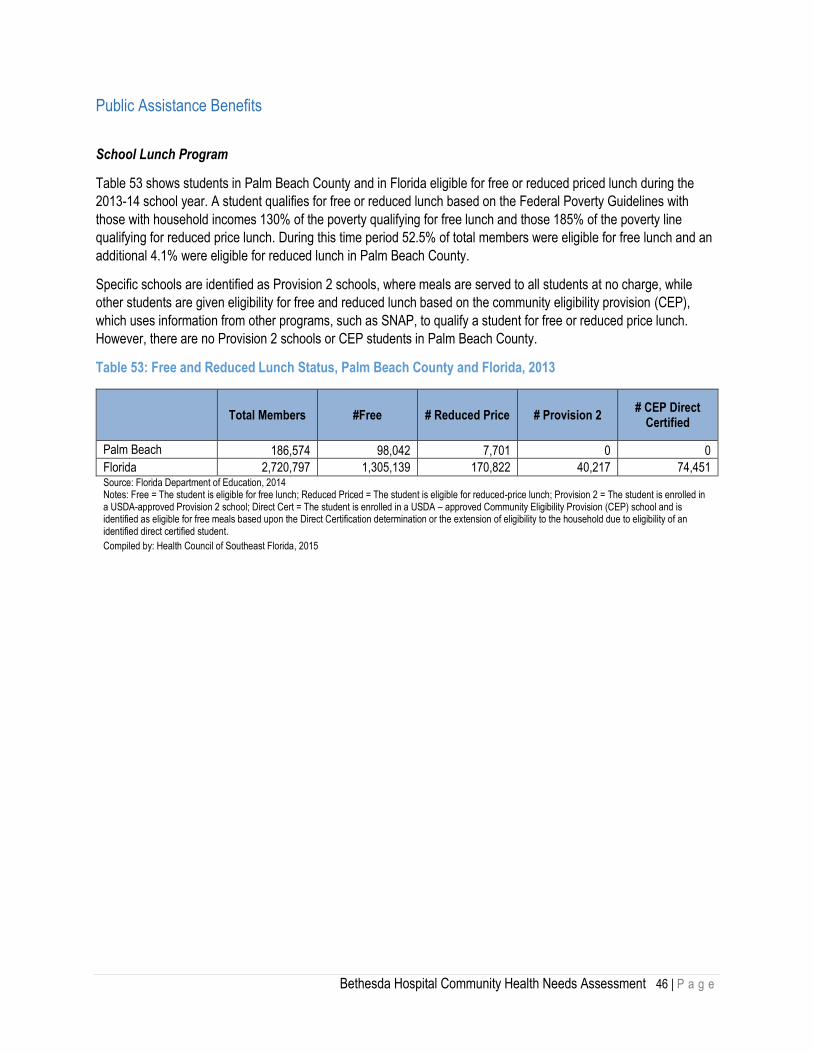
Bethesda Hospital Community Health Needs Assessment 46 | P a g e
Public Assistance Benefits
School Lunch Program
Table 53 shows students in Palm Beach County and in Florida eligible for free or reduced priced lunch during the
2013-14 school year. A student qualifies for free or reduced lunch based on the Federal Poverty Guidelines with
those with household incomes 130% of the poverty qualifying for free lunch and those 185% of the poverty line
qualifying for reduced price lunch. During this time period 52.5% of total members were eligible for free lunch and an
additional 4.1% were eligible for reduced lunch in Palm Beach County.
Specific schools are identified as Provision 2 schools, where meals are served to all students at no charge, while
other students are given eligibility for free and reduced lunch based on the community eligibility provision (CEP),
which uses information from other programs, such as SNAP, to qualify a student for free or reduced price lunch.
However, there are no Provision 2 schools or CEP students in Palm Beach County.
Table 53: Free and Reduced Lunch Status, Palm Beach County and Florida, 2013
Total Members #Free # Reduced Price # Provision 2 # CEP Direct
Certified
Palm Beach 186,574 98,042 7,701 0 0
Florida 2,720,797 1,305,139 170,822 40,217 74,451 Source: Florida Department of Education, 2014 Notes: Free = The student is eligible for free lunch; Reduced Priced = The student is eligible for reduced-price lunch; Provision 2 = The student is enrolled in a USDA-approved Provision 2 school; Direct Cert = The student is enrolled in a USDA – approved Community Eligibility Provision (CEP) school and is identified as eligible for free meals based upon the Direct Certification determination or the extension of eligibility to the household due to eligibility of an identified direct certified student.
Compiled by: Health Council of Southeast Florida, 2015

Bethesda Hospital Community Health Needs Assessment 47 | P a g e
Women, Infants and Children Program
WIC is a supplemental nutrition program that serves to safeguard the health of low-income pregnant, postpartum,
and breastfeeding women, infants, and children up to age 5 who are at nutritional risk. The program provides
nutritious foods to supplement diets, information on healthy eating, breastfeeding promotion and support and
referrals to health care services.
Table 54 shows the number of individuals served who were eligible for WIC benefits. In 2012, 87.7% of Palm Beach
County’s eligible WIC population was served.
Table 54: Eligible Women, Infants and Children Eligible Population Served, Palm Beach County and Florida, 1993-2012
Palm Beach Florida
Year Count Rate (%) Count Rate (%)
1993 15,989 60.4 261,623 48.9
1994 18,032 64.7 289,685 56.5
1995 19,227 66.4 319,587 60.8
1996 19,083 67.1 328,308 63.4
1997 20,610 72.2 352,305 67.9
1998 17,303 62.5 340,686 67.4
1999 16,289 61.5 337,860 67.9
2000 16,289 59.4 337,860 65.7
2001 14,324 53.6 291,679 57.0
2002 15,428 57.0 311,793 59.8
2003 18,195 59.6 334,228 60.7
2004 20,683 65.1 346,030 64.3
2005 21,791 66.2 374,109 67.3
2006 21,531 63.0 366,895 64.2
2007 20,122 59.5 376,795 64.2
2008 25,201 74.3 457,183 76.9
2009 27,092 81.0 496,969 83.9
2010 29,440 89.4 502,959 86.6
2011 29,440 89.4 502,959 86.6
2012 28,888 87.7 481,110 82.9 Source: FloridaCHARTS, Florida Department of Health, WIC & Nutrition Services, 1993-2012 Compiled by: Health Council of Southeast Florida, 2015
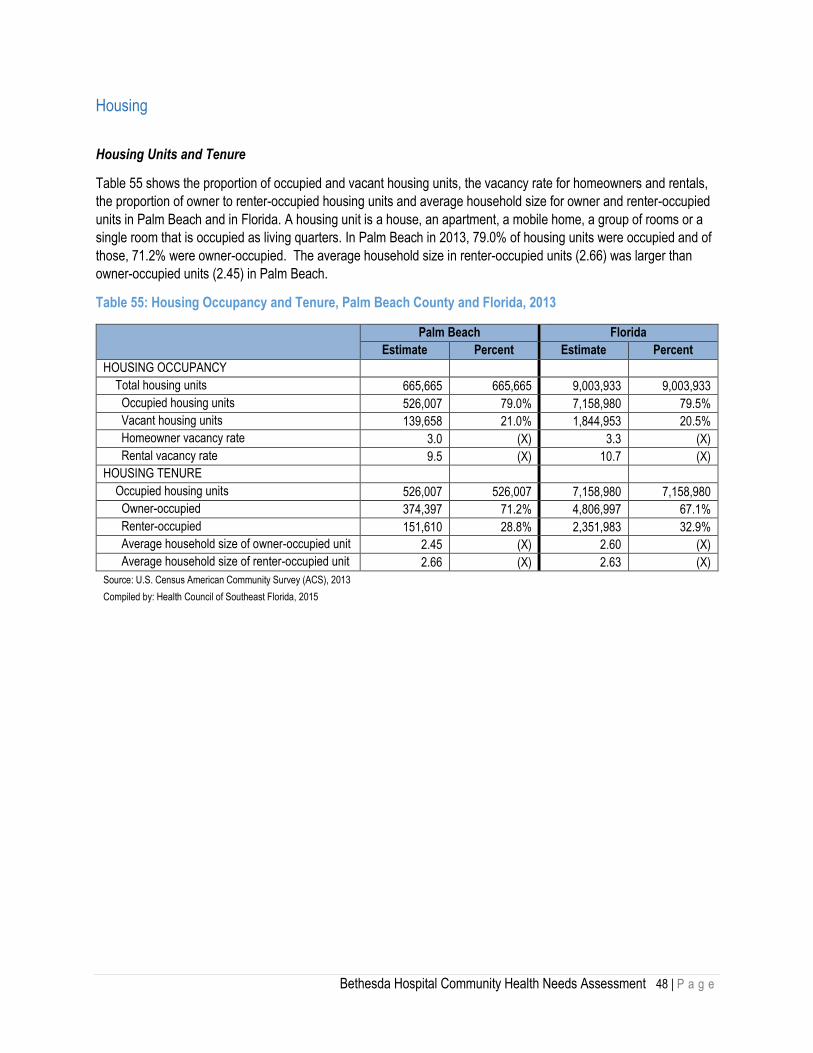
Bethesda Hospital Community Health Needs Assessment 48 | P a g e
Housing
Housing Units and Tenure
Table 55 shows the proportion of occupied and vacant housing units, the vacancy rate for homeowners and rentals,
the proportion of owner to renter-occupied housing units and average household size for owner and renter-occupied
units in Palm Beach and in Florida. A housing unit is a house, an apartment, a mobile home, a group of rooms or a
single room that is occupied as living quarters. In Palm Beach in 2013, 79.0% of housing units were occupied and of
those, 71.2% were owner-occupied. The average household size in renter-occupied units (2.66) was larger than
owner-occupied units (2.45) in Palm Beach.
Table 55: Housing Occupancy and Tenure, Palm Beach County and Florida, 2013
Palm Beach Florida
Estimate Percent Estimate Percent
HOUSING OCCUPANCY
Total housing units 665,665 665,665 9,003,933 9,003,933
Occupied housing units 526,007 79.0% 7,158,980 79.5%
Vacant housing units 139,658 21.0% 1,844,953 20.5%
Homeowner vacancy rate 3.0 (X) 3.3 (X)
Rental vacancy rate 9.5 (X) 10.7 (X)
HOUSING TENURE
Occupied housing units 526,007 526,007 7,158,980 7,158,980
Owner-occupied 374,397 71.2% 4,806,997 67.1%
Renter-occupied 151,610 28.8% 2,351,983 32.9%
Average household size of owner-occupied unit 2.45 (X) 2.60 (X)
Average household size of renter-occupied unit 2.66 (X) 2.63 (X)
Source: U.S. Census American Community Survey (ACS), 2013
Compiled by: Health Council of Southeast Florida, 2015
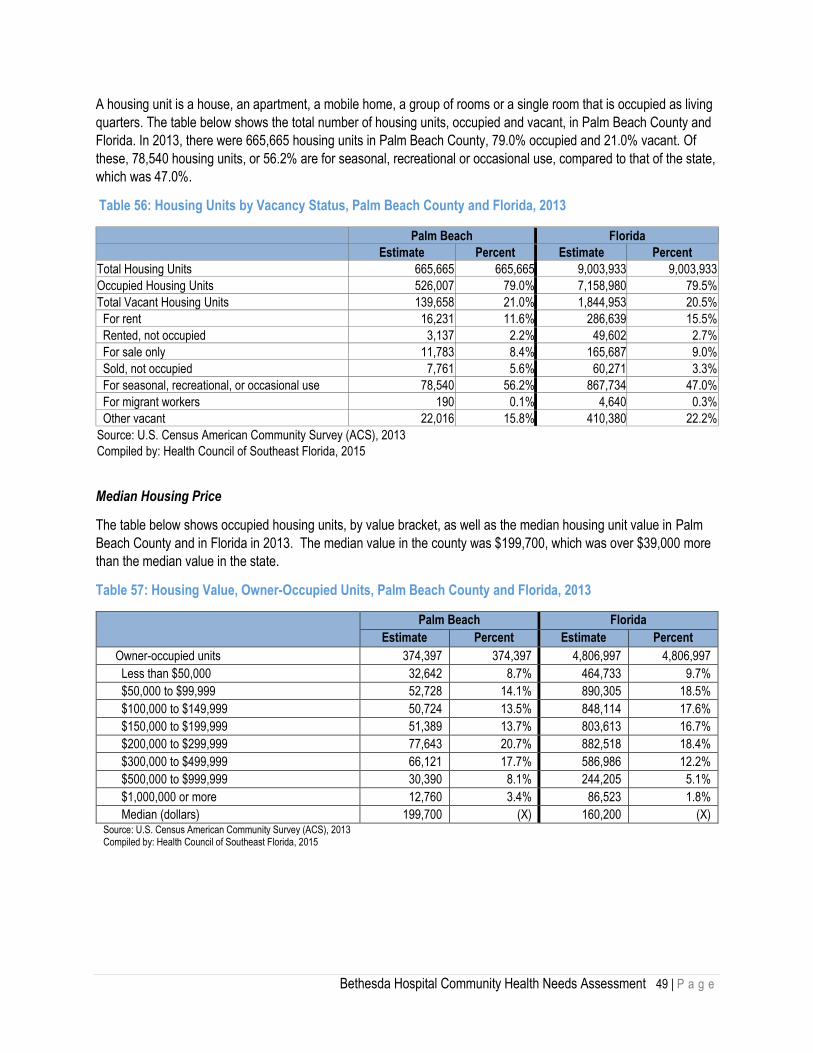
Bethesda Hospital Community Health Needs Assessment 49 | P a g e
A housing unit is a house, an apartment, a mobile home, a group of rooms or a single room that is occupied as living
quarters. The table below shows the total number of housing units, occupied and vacant, in Palm Beach County and
Florida. In 2013, there were 665,665 housing units in Palm Beach County, 79.0% occupied and 21.0% vacant. Of
these, 78,540 housing units, or 56.2% are for seasonal, recreational or occasional use, compared to that of the state,
which was 47.0%.
Table 56: Housing Units by Vacancy Status, Palm Beach County and Florida, 2013
Palm Beach Florida
Estimate Percent Estimate Percent
Total Housing Units 665,665 665,665 9,003,933 9,003,933
Occupied Housing Units 526,007 79.0% 7,158,980 79.5%
Total Vacant Housing Units 139,658 21.0% 1,844,953 20.5%
For rent 16,231 11.6% 286,639 15.5%
Rented, not occupied 3,137 2.2% 49,602 2.7%
For sale only 11,783 8.4% 165,687 9.0%
Sold, not occupied 7,761 5.6% 60,271 3.3%
For seasonal, recreational, or occasional use 78,540 56.2% 867,734 47.0%
For migrant workers 190 0.1% 4,640 0.3%
Other vacant 22,016 15.8% 410,380 22.2%
Source: U.S. Census American Community Survey (ACS), 2013
Compiled by: Health Council of Southeast Florida, 2015
Median Housing Price
The table below shows occupied housing units, by value bracket, as well as the median housing unit value in Palm
Beach County and in Florida in 2013. The median value in the county was $199,700, which was over $39,000 more
than the median value in the state.
Table 57: Housing Value, Owner-Occupied Units, Palm Beach County and Florida, 2013
Palm Beach Florida
Estimate Percent Estimate Percent
Owner-occupied units 374,397 374,397 4,806,997 4,806,997
Less than $50,000 32,642 8.7% 464,733 9.7%
$50,000 to $99,999 52,728 14.1% 890,305 18.5%
$100,000 to $149,999 50,724 13.5% 848,114 17.6%
$150,000 to $199,999 51,389 13.7% 803,613 16.7%
$200,000 to $299,999 77,643 20.7% 882,518 18.4%
$300,000 to $499,999 66,121 17.7% 586,986 12.2%
$500,000 to $999,999 30,390 8.1% 244,205 5.1%
$1,000,000 or more 12,760 3.4% 86,523 1.8%
Median (dollars) 199,700 (X) 160,200 (X) Source: U.S. Census American Community Survey (ACS), 2013 Compiled by: Health Council of Southeast Florida, 2015

Bethesda Hospital Community Health Needs Assessment 50 | P a g e
Average Rent
Table 58 shows 2013 rents for Palm Beach County and Florida by price bands and rent as a percentage of
household income. Palm Beach County had 144,062 occupied rental units paying rent. Of these units, 21.6% had a
monthly rent of $750-$999, 39.5%% rented for between $1,000 and $1,499 and 24.8% rented for $1,500 or more per
month. The median rent in Palm Beach was $1,149 compared to $990 in Florida.
Table 58: Gross Rent, Palm Beach County and Florida, 2013
Palm Beach Florida
Estimate Percent Estimate Percent
Occupied units paying rent 144,062 144,062 2,232,579 2,232,579
Less than $200 1,140 0.8% 24,856 1.1%
$200 to $299 2,013 1.4% 41,763 1.9%
$300 to $499 3,689 2.6% 92,244 4.1%
$500 to $749 13,586 9.4% 359,284 16.1%
$750 to $999 31,062 21.6% 624,883 28.0%
$1,000 to $1,499 56,899 39.5% 759,544 34.0%
$1,500 or more 35,673 24.8% 330,005 14.8%
Median (dollars) 1,149 (X) 990 (X) Source: U.S. Census American Community Survey (ACS), 2013 Compiled by: Health Council of Southeast Florida, 2015

Bethesda Hospital Community Health Needs Assessment 51 | P a g e
Transportation
Public Transport
Palm Beach County’s public transportation system includes the Palm Tran and the Tri-Rail. The Palm Tran system
provides service throughout Palm Beach County with over 3,200 bus stops. With over 150 buses, Palm Tran
provides over 12 million rides per year.7 In addition to providing service to visitors and residents, Palm Tran also
provides a door-to-door paratransit service for disabled residents and visitors under the Americans with Disabilities
Act Program, the Division of Senior Services Program and the Transportation Disadvantaged Program.8 Palm Tran
also provides bus service with stops at both Bethesda Hospital East and West. Tri-Rail provides service through
Palm Beach, Broward and Miami-Dade counties. There are currently six different stops in Palm Beach County.9
Vehicles Available
Table 59 shows the number of vehicles in housing units for Palm Beach County and Florida. In 2013, 6.7% of
housing units in Palm Beach County (35,107) had no vehicles available.
Table 59: Vehicles Available by Household, Palm Beach County and Florida, 2013
Palm Beach Florida
Estimate Percent Estimate Percent
Occupied housing units 526,007 526,007 7,158,980 7,158,980
No vehicles available 35,107 6.7% 502,000 7.0%
1 vehicle available 231,164 43.9% 2,967,753 41.5%
2 vehicles available 197,774 37.6% 2,716,586 37.9%
3 or more vehicles available 61,962 11.8% 972,641 13.6% Source: U.S. Census American Community Survey (ACS), 2013 Compiled by: Health Council of Southeast Florida, 2015
7 Palm Tran, Quick Facts, Revised March 2014. Available at http://www.co.palm-beach.fl.us/palmtran/information/ 8 Palm Tran Connection, Quick Facts, Revised March 2014. Available at http://www.co.palm-
beach.fl.us/palmtran/information/pdf/CONNECTION_Quick_Facts_APR2014.pdf 9 http://www.tri-rail.com/

Bethesda Hospital Community Health Needs Assessment 52 | P a g e
Crime
Crime in a community can influence health status both as a result of direct injury from the crimes themselves and as
a result of the emotional stresses present in areas of high crime. Table 60 shows counts of reported crimes in Palm
Beach County by the type of crime from the Uniform Crime Report (UCR). The UCR is a well-defined list of
reportable offenses and does not include all offenses reported to the police.10 The index offenses are: murder, sexual
offenses, robbery, aggravated assault, burglary, larceny and motor vehicle theft. The index rate is the number of
reported index crimes per 100,000 population. From 2013 to 2014 the number of arrests in the county decreased by
9.5%, the property rate and the index rate decreased by 5.9% and 5.2%, respectively.
Table 60: Arrests, Offenses, and Crime Rates, Palm Beach County, 2013-2014
2013 2014 % Change
Population 1,345,652 1,360,238 1.1%
Total Arrests 59,510 53,885 -9.5%
Total Index Offenses 49,372 47,324 -4.1%
Violent Rate 462.7 463.4 0.2%
Property Rate 3,206.3 3,015.6 -5.9%
Index Rate 3,669.0 3,479.1 -5.2% Source: Florida Department of Law Enforcement, Annual Crime Report- Palm Beach County, 2014 Notes: Offenses: The 7 index crimes of Murder, Sexual Offenses, Robbery, Aggravated Assault, Burglary, Larceny, and Motor Vehicle Theft as reported to law enforcement (not arrest).Violent Crime: Murder, Sexual Offenses, Robbery, and Aggravated Assault Offenses. On-Violent/Property Crime: Burglary, Larceny, and Motor Vehicle Theft Offenses. Arrests: Part I and Part II Crimes. Index Rate: Rate Per 100,000 Population Compiled by: Health Council of Southeast Florida, 2015
10 Florida Department of Law Enforcement

Bethesda Hospital Community Health Needs Assessment 53 | P a g e
Health Status Profile
This section provides data on Palm Beach County’s health status for the following health categories: Maternal and
Child Health, Behavioral Health, Hospital Utilization, Morbidity and Mortality. The data presented herein can be used
to identify health care priorities and to inform policy and program development.
Data in the section may be present as age-adjusted rates or as crude rates. Age adjustment, also called age
standardization, is a statistical technique utilized to better allow populations to be compared when the age profiles
and distributions within the populations are different.11 Age-adjusted rates are often used to answer the question,
“How does the rate in my county compare to the rate in another even though the distribution of persons by age may
vary?”12 The frequency with which health events occur is almost always related to age. Therefore, in order to
examine other risk factors independent of age, age adjustments are often used in public health analyses. The 2010
US Standard population is often used as a guideline to calculate age-adjusted rates.13 Crude rates, conversely, are
the total number of events in a given population over a period of time.14 Crude rates are useful in examining the
burden of disease or death on a community.
Maternal & Child Health
Prenatal Care Access
Table 61 shows prenatal care status of births in Palm Beach and the state of Florida as a whole in 2011, 2012 and
2013. The Kotelchuck Index uses initiation of prenatal care and number of prenatal visits for calculating adequate
prenatal care. Using the Kotelchuck Index to determine adequate care, the percentage of births in Palm Beach
County where the mother had less than adequate prenatal care was 23.6% in 2013. A greater percentage of births
had prenatal care during the first trimester in Florida (79.9%) than in Palm Beach (76.1%).
Table 61: Births by Prenatal Status of Mother, Palm Beach County and Florida, 2011-2013
Palm Beach Florida
2011 2012 2013 2011 2012 2013 2011 2012 2013
Count Percentage Percentage
Births to Mothers With First Trimester Prenatal Care
9,804 9,820 9,935 76.7% 75.8% 76.1% 80.3% 80.0% 79.9%
Births to Mothers With 2nd Trimester Prenatal Care
2,194 2,240 2,164 17.2% 17.3% 16.6% 15.3% 15.2% 15.2%
Births to Mothers With 3rd Trimester Prenatal Care
788 893 951 6.2% 6.9% 7.3% 4.4% 4.8% 4.9%
Births with less than adequate prenatal care (Kotelchuck index)
3,235 3,374 3,348 23.4% 24.2% 23.6% 25.0% 26.9% 27.8%
Source: FloridaCHARTS, Florida Department of Health, Bureau of Vital Statistics and Florida Birth Query System Data Note(s): Starting in 2004, trimester prenatal care began is calculated as the time elapsed from the date of the last menstrual period to the date of the first prenatal care visit. Prior to 2004, these data were obtained by direct question that noted the trimester the mother began prenatal care. Consequently, these data are not comparable to data from prior years. Births with unknown information as to when prenatal care began are excluded from the denominator. Compiled by: Health Council of Southeast Florida, 2015
11 http://seer.cancer.gov/seerstat/tutorials/aarates/definition.html 12 http://www.floridacharts.com/charts/calculate.aspx?RepID=6 13 http://www.floridacharts.com/charts/calculate.aspx?RepID=6 14 http://medical-dictionary.thefreedictionary.com/crude+rate

Bethesda Hospital Community Health Needs Assessment 54 | P a g e
Table 62 shows the number and percent of births to mothers with less than adequate prenatal care according to the
Kotelchuck Index for the primary service area ZIP Codes of Bethesda Hospitals. Within Bethesda Hospital’s primary
service area, ZIP Code 33460 had the highest number (215) and percent (39.1%) of births to mothers with less than
adequate prenatal care in 2013. In ZIP Code 33484, there were 17 births to mothers with less than adequate prenatal
care, accounting for 16.5% of total resident live births.
Table 62: Births to Mothers with Less Than Adequate Prenatal Care (Kotelchuck Index), Bethesda Hospital Primary Service Area ZIP Codes, 2013
ZIP Codes Births Less than Adequate Prenatal Care (Kotelchuck Index)
Number Number Percent
33414 490 88 18.0%
33426 246 49 19.9%
33435 466 137 29.4%
33436 431 92 21.3%
33437 255 72 28.2%
33444 281 83 29.5%
33445 295 75 25.4%
33446 59 12 20.3%
33460 550 215 39.1%
33461 663 191 28.8%
33462 343 75 21.9%
33463 810 207 25.6%
33467 366 78 21.3%
33484 103 17 16.5%
Source: FloridaCHARTS, Florida Department of Health, Bureau of Vital Statistics, 2013
Compiled by: Health Council of Southeast Florida, 2015

Bethesda Hospital Community Health Needs Assessment 55 | P a g e
The table below shows the number and percent of births to mothers with less than adequate prenatal care according
to the Kotelchuck Index for the secondary service area ZIP Codes of Bethesda Hospitals. ZIP Code 33483 had the
highest percent (30.1%) of births to mothers with less than adequate prenatal care in 2013; however, ZIP Code
33415 had the highest number of births (188) to mothers with less than adequate prenatal care. In ZIP Code 33487,
there were 23 births to mothers with less than adequate prenatal care, accounting for 17.0% of total resident live
births.
Table 63: Births to Mothers with Less Than Adequate Prenatal Care (Kotelchuck Index), Bethesda Hospital Secondary Service Area ZIP Codes, 2013
ZIP Codes Births Less than Adequate Prenatal Care (Kotelchuck Index)
Number Number Percent
33405 248 68 27.4%
33406 292 73 25.0%
33413 212 42 19.8%
33415 644 188 29.2%
33428 335 75 22.4%
33431 114 30 26.3%
33432 121 27 22.3%
33433 360 69 19.2%
33434 100 18 18.0%
33483 73 22 30.1%
33486 161 36 22.4%
33487 135 23 17.0%
33496 67 18 26.9%
33498 97 18 18.6%
Source: FloridaCHARTS, Florida Department of Health, Bureau of Vital Statistics, 2013
Compiled by: Health Council of Southeast Florida, 2015
Preterm Births
Preterm births are defined as those births before 37 weeks gestation. The table below shows the number and rate
per 1,000 of preterm births in Palm Beach County and Florida from 2011 to 2013. In Palm Beach County, the rate of
preterm births per 1,000 fell from 13.8 to 13.0, while in the state, the rate increased over the time period shown.
Table 64: Preterm Births, Palm Beach County and Florida, 2013
Number of Total Preterm Births (<37 weeks gestation)
Rate per 1,000
2011 2012 2013 2011 2012 2013
Florida 28,560 30,426 30,145 13.4 14.3 14.0
Palm Beach 1,900 1,816 1,842 13.8 13.0 13.0 Source: FloridaCHARTS, Florida Department of Health, Bureau of Vital Statistics
Compiled by: Health Council of Southeast Florida, 2015

Bethesda Hospital Community Health Needs Assessment 56 | P a g e
Birth Rates
Total Births
Table 65 shows the number of resident live births in Palm Beach County and Florida for 2011, 2012 and 2013. The
rate per 1,000 individuals was lower in Palm Beach for all three years shown and ranged from 10.4 – 10.5 per 1,000.
Table 65: Total Resident Live Births, Palm Beach County and Florida, 2011-2013
Number of Total Births Rate per 1,000
2011 2012 2013 2011 2012 2013
Florida 213,237 212,954 215,194 11.3 11.2 11.1
Palm Beach 13,797 13,936 14,198 10.4 10.5 10.5
Source: FloridaCHARTS, Florida Department of Health, Bureau of Vital Statistics, 2013 Compiled by: Health Council of Southeast Florida, 2015
The table below shows the total resident live births by primary and secondary service area ZIP Codes in 2013.
Among the ZIP Codes of the primary service area, 33446 had the fewest live births (59), while the ZIP Code 33462
had most live births (663). In the secondary service area, ZIP Code 33496 had the fewest live births (67) and 33415
had the most live births (644).
Table 66: Total Resident Live Births, Bethesda Hospital Service Area ZIP Codes, 2013
Primary Service Area Secondary Service Area
ZIP Codes Births ZIP Codes Births
33414 490 33405 248
33426 246 33406 292
33435 466 33413 212
33436 431 33415 644
33437 255 33428 335
33444 281 33431 114
33445 295 33432 121
33446 59 33433 360
33460 550 33434 100
33461 663 33483 73
33462 343 33486 161
33463 810 33487 135
33467 366 33496 67
33484 103 33498 97 Source: FloridaCHARTS, Florida Department of Health, Bureau of Vital Statistics, 2013
Compiled by: Health Council of Southeast Florida, 2015

Bethesda Hospital Community Health Needs Assessment 57 | P a g e
Birth Rates by Age of Mother
Table 67 shows the numbers of births by the mother’s age. The greatest numbers of births in Palm Beach were to
mothers 30 years of age and older for 2012 and 2013. This differed from the state of Florida, which had the highest
number of birth in the 20-29 year age group from 2011 to 2013.
Table 67: Births by Mother's Age, Palm Beach County and Florida, 2011-2013
Palm Beach Florida
2011 2012 2013 2011 2012 2013
Births to Mothers Ages 10-12 1 1 1 2 6 5
Births to Mothers Ages 13-14 18 14 4 192 186 159
Births to Mothers Ages 15-17 266 220 191 4,723 4,219 3,698
Births to Mothers Ages 18-19 495 842 495 16,803 15,708 13,744
Births to Mothers Ages 20-29 6,516 6,529 6,662 112,288 112,004 112,282
Births to Mothers Ages 30+ 6,342 6,551 6,845 83,629 84,808 88,792 Source: FloridaCHARTS, Florida Department of Health, Bureau of Vital Statistics, 2013 Compiled by: Health Council of Southeast Florida, 2015
Table 68 shows birth rates per 1,000 by mother’s age in Palm Beach and Florida. The birth rate to mothers in the
30+ age group was slightly higher in Palm Beach (14.5 per 1,000) than in Florida (13.8 per 1,000). The birth rates to
mothers in the: 10-12, 13-14,15-17, 18-19, 20-29 age groups were lower in Palm Beach than in Florida. In Palm
Beach County and in Florida, the highest birth rate were to mothers 20-29 years of age. Also, the rate of births to
mothers in the 30 and over age group has been increasing in Palm Beach County and Florida from 2011 to 2013.
Table 68: Birth Rates by Mother's Age, Palm Beach County and Florida, 2011-2013
Palm Beach Florida
Rate per 1,000
2011 2012 2013 2011 2012 2013
Births to Mothers Ages 10-12 0.0 0.0 0.0 0.0 0.0 0.0
Births to Mothers Ages 13-14 1.2 0.9 0.3 0.9 0.8 0.7
Births to Mothers Ages 15-17 11.6 9.6 8.3 13.4 12.0 10.5
Births to Mothers Ages 18-19 42.9 40.7 32.4 52.8 50.0 43.7
Births to Mothers Ages 20-29 89.9 87.7 87.3 94.4 92.7 91.3
Births to Mothers Ages 30+ 13.6 14.0 14.5 13.3 13.4 13.8 Source: FloridaCHARTS, Florida Department of Health, Bureau of Vital Statistics, 2013
Compiled by: Health Council of Southeast Florida, 2015

Bethesda Hospital Community Health Needs Assessment 58 | P a g e
Births to Teenage Mothers
Table 69 shows the number of repeat births by mother’s age in Palm Beach and Florida in 2011, 2012 and 2013.
From 2011 to 2013, the number of repeat births decreased among all age groups shown.
Table 69: Repeat Births by Mother's Age, Palm Beach County and Florida, 2011-2013
Palm Beach Florida
2011 2012 2013 2011 2012 2013
Repeat Births to Mothers 10-12 0 0 0 0 0 0
Repeat Births to Mothers 15-17 33 27 12 391 314 274
Repeat Births to Mothers 15-19 187 157 114 2,988 2,693 2,283
Repeat Births to Mothers 18-19 154 130 102 2,597 2,379 2,009 Source: FloridaCHARTS, Florida Department of Health, Bureau of Vital Statistics, 2013 Compiled by: Health Council of Southeast Florida, 2015
The table below shows the total number of resident live births and repeat teen births for Bethesda Hospitals’ primary
and secondary service areas by ZIP Code in 2013.
Table 70: Repeat Births to Teenage Mothers, Bethesda Hospital Service Area ZIP Codes, 2013
Primary Service Area Secondary Service Area
ZIP Codes Total Resident
Live Births Repeat Teen
Births ZIP Codes
Total Resident Live Births
Repeat Teen Births
33414 490 1 33405 248 6
33426 246 0 33406 292 3
33435 466 5 33413 212 1
33436 431 0 33415 644 7
33437 255 0 33428 335 0
33444 281 2 33431 114 0
33445 295 1 33432 121 0
33446 59 1 33433 360 0
33460 550 13 33434 100 0
33461 663 13 33483 73 1
33462 343 7 33486 161 1
33463 810 6 33487 135 0
33467 366 0 33496 67 0
33484 103 0 33498 97 0
Source: FloridaCHARTS, Florida Department of Health, Bureau of Vital Statistics, 2013
Compiled by: Health Council of Southeast Florida, 2015

Bethesda Hospital Community Health Needs Assessment 59 | P a g e
The table below shows the percent of repeat births by mother’s age in Palm Beach and in Florida. Percentage of
repeat births is calculated by dividing the number of repeat births to mothers in an age group by the number of births
to mothers in that age group. The percentage of repeat births to mothers in all age groups was higher in Palm Beach
than in Florida, except for the 15-17 age groups in 2013. However, from 2011 to 2013 the percent of repeat births
has fallen across all age groups.
Table 71: Percentage of Repeat Births by Age, Palm Beach County and Florida, 2011- 2013
Palm Beach Florida
2011 2012 2013 2011 2012 2013
Repeat Births to Mothers 10-12 0 0 0 0 0 0
Repeat Births to Mothers 15-17 12.4% 12.3% 6.3% 8.3% 7.4% 7.4%
Repeat Births to Mothers 15-19 20.3% 18.7% 16.6% 17.4% 16.9% 16.4%
Repeat Births to Mothers 18-19 23.5% 20.9% 20.6% 20.9% 20.3% 19.6% Source: FloridaCHARTS, Florida Department of Health, Bureau of Vital Statistics, 2013 Compiled by: Health Council of Southeast Florida, 2015

Bethesda Hospital Community Health Needs Assessment 60 | P a g e
Birth Weight
Very Low Birth Weight
Proper prenatal care and healthy behaviors during pregnancy can reduce the likelihood of low birthweight babies.
Table 72 shows the number and percentage of live births classified as “very low birth weight”, meaning less than
1500 grams (3 lbs., 4 oz.). In 2013, the percentages were similar in Palm Beach (1.4%) and in Florida (1.5%). From
2011 to 2013, the percent of live births of very low birthweight has fallen in Palm Beach County and Florida.
Table 72: Live Births Under 1,500 Grams (Very Low Birth Weight), Palm Beach County and Florida, 2011-2013
Number of Very Low Birth Weight Births
Number of Total Births Rate / Percent
2011 2012 2013 2011 2012 2013 2011 2012 2013
Florida 3,433 3,415 3,311 213,237 212,954 215,194 1.6% 1.6% 1.5%
Palm Beach 236 207 202 13,797 13,936 14,198 1.7% 1.5% 1.4%
Source: FloridaCHARTS, Florida Department of Health, Bureau of Vital Statistics, 2013
Compiled by: Health Council of Southeast Florida, 2015
Low Birth Weight
Table 73 shows the number and percentage of live births classified as “low birth weight”, meaning less than 2500
grams (5 lbs., 4 oz.). In 2013, the percentages were similar in Palm Beach (8.2%) and in Florida (8.5%). From 2011
to 2013, the percent of live births of low birthweight has fallen in Palm Beach County and Florida.
Table 73: Live Births Under 2,500 Grams (Low Birth Weight), Palm Beach County and Florida, 2011-2013
Number of Low Birth Weight Births
Number of Total Births Rate / Percent
2011 2012 2013 2011 2012 2013 2011 2012 2013
Florida 18,558 18,291 18,371 213,237 212,954 215,194 8.7% 8.6% 8.5%
Palm Beach 1,251 1,229 1,162 13,797 13,936 14,198 9.1% 8.8% 8.2% Source: FloridaCHARTS, Florida Department of Health, Bureau of Vital Statistics, 2013
Compiled by: Health Council of Southeast Florida, 2015
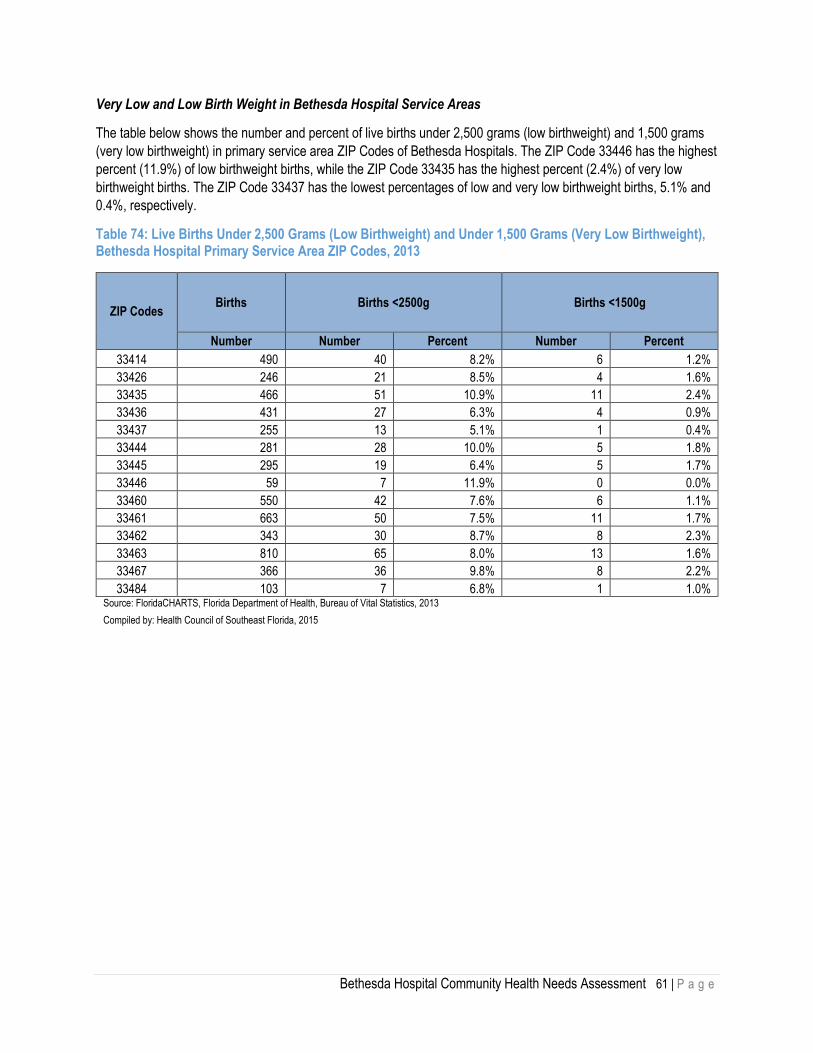
Bethesda Hospital Community Health Needs Assessment 61 | P a g e
Very Low and Low Birth Weight in Bethesda Hospital Service Areas
The table below shows the number and percent of live births under 2,500 grams (low birthweight) and 1,500 grams
(very low birthweight) in primary service area ZIP Codes of Bethesda Hospitals. The ZIP Code 33446 has the highest
percent (11.9%) of low birthweight births, while the ZIP Code 33435 has the highest percent (2.4%) of very low
birthweight births. The ZIP Code 33437 has the lowest percentages of low and very low birthweight births, 5.1% and
0.4%, respectively.
Table 74: Live Births Under 2,500 Grams (Low Birthweight) and Under 1,500 Grams (Very Low Birthweight), Bethesda Hospital Primary Service Area ZIP Codes, 2013
ZIP Codes Births Births <2500g Births <1500g
Number Number Percent Number Percent
33414 490 40 8.2% 6 1.2%
33426 246 21 8.5% 4 1.6%
33435 466 51 10.9% 11 2.4%
33436 431 27 6.3% 4 0.9%
33437 255 13 5.1% 1 0.4%
33444 281 28 10.0% 5 1.8%
33445 295 19 6.4% 5 1.7%
33446 59 7 11.9% 0 0.0%
33460 550 42 7.6% 6 1.1%
33461 663 50 7.5% 11 1.7%
33462 343 30 8.7% 8 2.3%
33463 810 65 8.0% 13 1.6%
33467 366 36 9.8% 8 2.2%
33484 103 7 6.8% 1 1.0% Source: FloridaCHARTS, Florida Department of Health, Bureau of Vital Statistics, 2013
Compiled by: Health Council of Southeast Florida, 2015
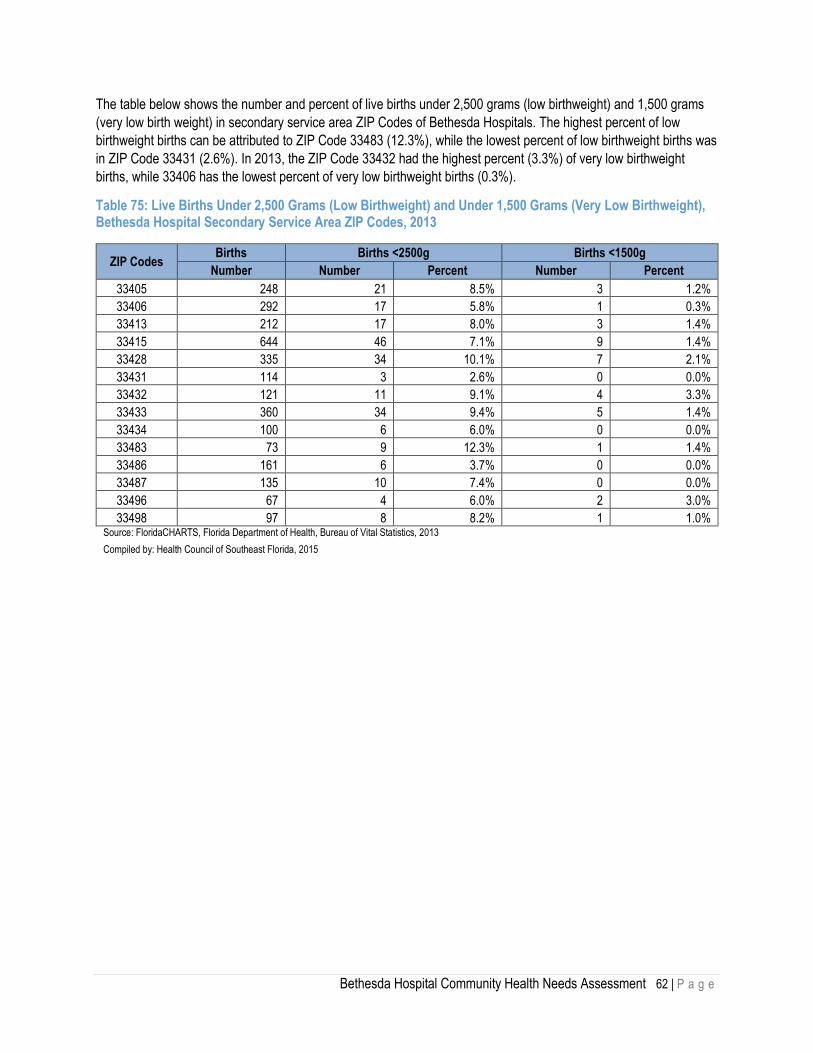
Bethesda Hospital Community Health Needs Assessment 62 | P a g e
The table below shows the number and percent of live births under 2,500 grams (low birthweight) and 1,500 grams
(very low birth weight) in secondary service area ZIP Codes of Bethesda Hospitals. The highest percent of low
birthweight births can be attributed to ZIP Code 33483 (12.3%), while the lowest percent of low birthweight births was
in ZIP Code 33431 (2.6%). In 2013, the ZIP Code 33432 had the highest percent (3.3%) of very low birthweight
births, while 33406 has the lowest percent of very low birthweight births (0.3%).
Table 75: Live Births Under 2,500 Grams (Low Birthweight) and Under 1,500 Grams (Very Low Birthweight), Bethesda Hospital Secondary Service Area ZIP Codes, 2013
ZIP Codes Births Births <2500g Births <1500g
Number Number Percent Number Percent
33405 248 21 8.5% 3 1.2%
33406 292 17 5.8% 1 0.3%
33413 212 17 8.0% 3 1.4%
33415 644 46 7.1% 9 1.4%
33428 335 34 10.1% 7 2.1%
33431 114 3 2.6% 0 0.0%
33432 121 11 9.1% 4 3.3%
33433 360 34 9.4% 5 1.4%
33434 100 6 6.0% 0 0.0%
33483 73 9 12.3% 1 1.4%
33486 161 6 3.7% 0 0.0%
33487 135 10 7.4% 0 0.0%
33496 67 4 6.0% 2 3.0%
33498 97 8 8.2% 1 1.0% Source: FloridaCHARTS, Florida Department of Health, Bureau of Vital Statistics, 2013
Compiled by: Health Council of Southeast Florida, 2015

Bethesda Hospital Community Health Needs Assessment 63 | P a g e
Infant Mortality
Infant Mortality
Infant mortality is the death of an infant 0-364 days old. Infant mortality is an important indicator of health for any
nation. Infant mortality rates are used worldwide to gauge the health and well-being of populations, and growing
evidence suggests that higher infant mortality within a population is linked to that population's overall health and
development across the life course.15 Infant mortality in Palm Beach County ranged between 4.5 and 5.9 per 1,000
live births in 2011-2013. The rate in Palm Beach was consistently lower than Florida for the time period shown.
Table 76: Infant Deaths per 1,000 Live Births, Palm Beach County and Florida, 2011-2013
Number of Infant Deaths Number of Total Live Births Rate per 1,000
2011 2012 2013 2011 2012 2013 2011 2012 2013
Florida 1,372 1,285 1,318 213,237 212,954 215,194 6.4 6.0 6.1
Palm Beach 81 63 65 13,797 13,936 14,198 5.9 4.5 4.6 Source: FloridaCHARTS, Florida Department of Health, Bureau of Vital Statistics, 2013
Compiled by: Health Council of Southeast Florida, 2015
The table below shows the number of infant deaths by ZIP Codes in the primary and secondary service areas of
Bethesda Hospitals in 2013. In the primary service area, Lake Worth, ZIP Code 33463 had the most infant deaths
(7). In the secondary service area, West Palm Beach, ZIP Code 33415 had the highest number of infant deaths (4).
The primary service area ZIP Codes had a total of 19 infant deaths, while the secondary service area ZIP Codes had
11 infant deaths.
Table 77: Infant Deaths, Bethesda Hospital Service Area ZIP Codes, 2013
Primary Service Area Secondary Service Area
ZIP Code Infant Deaths ZIP Code Infant Deaths
33414 0 33405 0
33426 0 33406 0
33435 5 33413 2
33436 1 33415 4
33437 0 33428 2
33444 0 33431 0
33445 1 33432 1
33446 0 33433 0
33460 1 33434 0
33461 2 33483 0
33462 1 33486 1
33463 7 33487 0
33467 0 33496 1
33484 1 33498 0
Total 19 Total 11
Source: FloridaCHARTS, Florida Department of Health, Bureau of Vital Statistics, 2013
Note(s): Deaths occurring within 364 days of birth
Compiled by Health Council of Southeast Florida, 2015
15 Health Resources and Services Administration: Maternal and Child Health- Infant Mortality; http://mchb.hrsa.gov/infantmortality/.

Bethesda Hospital Community Health Needs Assessment 64 | P a g e
Table 78 shows infant deaths in Palm Beach and Florida by race and ethnicity. The rate of infant death in Palm
Beach was considerably higher among the ‘Black & Other’ population, ranging from 7.3- 10.2 per 1,000 than in the
‘White’ population 2.4- 3.6 per 1,000 from 2011 to 2013. In Palm Beach County there has been a significant decline
in the rate of ‘Black & Other’ infant mortality over the time period shown. The rate of infant deaths in Palm Beach was
higher among the ‘Non-Hispanic’ population, ranging from 5.3- 6.6 per 1,000, than in the ‘Hispanic’ population 2.2-
4.1 per 1,000 for the time period shown. The rates in the county were consistently lower, in all categories shown,
than Florida in the time period provided.
Table 78: Infant Deaths per 1,000 Live Births, Palm Beach County and Florida, 2011-2013
Years
Palm Beach Florida
White Black & Other White Black & Other
Count Rate Count Rate Count Rate Count Rate
2011 33 3.6 47 10.2 698 4.6 670 11.1
2012 22 2.4 41 8.5 687 4.6 596 9.7
2013 29 3.1 36 7.3 707 4.6 607 10.0
Years
Palm Beach Florida
Hispanic Non-Hispanic Hispanic Non-Hispanic
Count Rate Count Rate Count Rate Count Rate
2011 17 4.1 63 6.6 304 5.2 1,049 6.8
2012 9 2.2 52 5.3 292 5.1 971 6.3
2013 11 2.6 53 5.4 261 4.4 1,034 6.7 Source: FloridaCHARTS, Florida Department of Health, Bureau of Vital Statistics, 2013 Note(s): Deaths occurring within 364 days of birth
Compiled by Health Council of Southeast Florida, 2015

Bethesda Hospital Community Health Needs Assessment 65 | P a g e
Neonatal Mortality
Neonatal mortality is the death of an infant 0-27 days old. Neonatal mortality in Palm Beach County ranged from 2.7
to 3.9 per 1,000 live births between 2011 and 2013. The rate in Palm Beach was lower than in Florida for all years
shown.
Table 79: Neonatal Deaths per 1,000 Live Births, Palm Beach County and Florida, 2011-2013
Number of Neonatal Deaths Number of Total Live Births Rate per 1,000
2011 2012 2013 2011 2012 2013 2011 2012 2013
Florida 915 826 859 213,237 212,954 215,194 4.3 3.9 4.0
Palm Beach 54 40 39 13,797 13,936 14,198 3.9 2.9 2.7
Source: FloridaCHARTS, Florida Department of Health, Bureau of Vital Statistics, 2013
Data Note(s): Deaths occurring within 27 days of birth.
Compiled by: Health Council of Southeast Florida, 2015
Immunization
Kindergarten Immunization
Having a high percentage of individuals within a population immunized can help prevent the spread of many
diseases. “When a critical portion of a community is immunized against a contagious disease, most members of the
community are protected against that disease because there is little opportunity for an outbreak. Even those who are
not eligible for certain vaccines—such as infants, pregnant women, or immunocompromised individuals—get some
protection because the spread of contagious disease is contained. This is known as "community immunity." Table 80
shows the percent of kindergarten students who have received vaccinations. The 2013 rate in Palm Beach was
92.4%, slightly lower than the percentage in Florida (93.2%).
Table 80: Immunization Levels in Kindergarten, Palm Beach County and Florida, 2011-2013
County Number of Students Immunized Rate / Percent
2011 2012 2013 2011 2012 2013
Florida 208,766 216,027 217,945 92.6% 92.1% 93.2%
Palm Beach 13,939 14,549 14,240 93.2% 92.1% 92.4% Source: FloridaCHARTS, Florida Department of Health, Bureau of Immunization, 2013 Compiled by: Health Council of Southeast Florida, 2015

Bethesda Hospital Community Health Needs Assessment 66 | P a g e
Vaccine Preventable Diseases
Table 81 shows the rate per 100,000 individuals of vaccine preventable diseases in Palm Beach and in Florida. Due
to the relatively low number of the events in the county, small changes in the number of cases can cause
considerable changes in the rate. In 2013, the rate was lower in Palm Beach (4.0 per 100,000) than in Florida (4.6
per 100,000) with between 39- 53 cases per year. During the time period shown, there has been an increase in the
rate of vaccine preventable diseases in Palm Beach County.
Table 81: Selected Vaccine Preventable Disease Rate for All Ages, Palm Beach County and Florida, 2011-2013
Number of Cases Rate per 100,000
2010 2011 2012 2010 2011 2012
Florida 659 571 882 3.5 3.0 4.6
Palm Beach 39 41 53 3.0 3.1 4.0 Source: FloridaCHARTS, Florida Department of Health, Bureau of Epidemiology, 2013 Data Note(s): Includes: DIPHTHERIA, ACUTE HEPATITIS B, MEASLES, MUMPS, PERTUSSIS, RUBELLA, TETANUS, AND POLIO, Beginning in 2007, data includes both probable and confirmed cases. Rates calculated using July 1 population estimates from the Office of the Governor
Compiled by: Health Council of Southeast Florida, 2015
Oral Health
The Palm Beach County Health Department is one of 44 county health departments in the state to offer dental
services as part of the dental safety net. The dental safety net “includes facilities, providers, and payment programs
to support dental care for underserved populations. In Florida, as nationwide, safety net providers are a source of
dental care for Medicaid (and uninsured) patients who do not have access to private providers.”16
Table 82 shows preventable hospitalizations for individuals under the age of 65 from dental conditions in Palm Beach
County and Florida. The 2013 percent in Palm Beach was 10.7%, slightly lower than the rate in Florida (11.1%). The
percent has decreased in Palm Beach County in the time period shown.
Table 82: Preventable Hospitalizations for Individuals under the Age of 65 from Dental Conditions, Palm Beach County and Florida, 2011-2013
County Number of Hospitalizations Percent
2011 2012 2013 2011 2012 2013
Florida 1,598 1,633 1,758 10.3% 10.5% 11.1%
Palm Beach 128 125 112 12.4% 12.0% 10.7%
Source: FloridaCHARTS, Florida Department of Health, Division of Public Health Statistics & Performance Management, 2013 Note: ICD9-CM Codes: 521-523, 525, 528 in Ambulatory Care Sensitive Conditions Compiled by: Health Council of Southeast Florida, 2015
16 Healthy Mouth, Health Body, Florida Oral Health Policy,

Bethesda Hospital Community Health Needs Assessment 67 | P a g e
The table below shows access to dental care in Palm Beach County by low income persons. In 2013, 24.8% of
persons below the poverty level reported having access to dental care in Palm Beach County, which is similar to the
percent of the state (24.9%).
Table 83: Access to Dental Care by Low-Income Persons, Palm Beach County and Florida, 2011-2013
County Counts Percent
2010 2011 2012 2010 2011 2012
Florida 855,659 742,484 808,489 36.4% 23.4% 24.9%
Palm Beach 60,996 50,494 48,102 47.8% 24.3% 24.8%
Source: FloridaCHARTS, Florida Department of Health, Division of Public Health Statistics & Performance Management, 2013 Note: Access data taken from the Public Health Dental Program
Compiled by: Health Council of Southeast Florida, 2015

Bethesda Hospital Community Health Needs Assessment 68 | P a g e
Behavioral Health
This section provides indicators on: domestic violence, sexual behaviors, inpatient mental health services, alcohol
consumption/substance abuse and violence and injury measures.
Domestic Violence
The table below shows reported domestic violence-related, forcible sex offenses in Palm Beach County from 1995-
2013. Forcible sex offenses include rape by force, attempted rape, forcible sodomy and forcible fondling. In 2013,
there were 150 reported forcible sex offenses, an increase from a 109 in 1995.
Table 84: Domestic Violence by Offense Type, Palm Beach County, 1995-2013
Year Rape by Force Attempted Rape Forcible Sodomy
Forcible Fondling
Total Forcible Sex Offenses
1995 57 0 15 37 109
1996 98 1 28 31 158
1997 74 1 23 39 137
1998 96 1 18 21 136
1999 63 1 18 57 139
2000 80 0 12 43 135
2001 63 1 27 45 136
2002 58 1 14 32 105
2003 56 2 17 41 116
2004 59 0 15 39 113
2005 50 1 11 40 102
2006 54 0 13 30 97
2007 54 2 10 33 99
2008 74 2 14 43 133
2009 60 0 19 46 125
2010 50 6 12 53 121
2011 59 0 14 35 108
2012 58 2 16 53 129
2013 129 1 -- 20 150 Source: Florida Department of Law Enforcement, Florida Department of Law Enforcement. Crime in Florida, Florida uniform crime report, 1995-2013 [Computer program]. Tallahassee, FL: FDLE. Florida Statistical Analysis Note: Beginning in 2013, Forcible Sodomy is reported as Forcible Rape in Florida's UCR. Compiled by: Health Council of Southeast Florida, 2015

Bethesda Hospital Community Health Needs Assessment 69 | P a g e
Youth Bullying and Delinquent Behavior
Table 85 shows the percentage of middle and high school youth in Palm Beach County and Florida who reported
engaging in delinquent behavior in the past year from the Florida Youth Substance Abuse Survey. In 2014, 5.7% of
students in the county (2.9% middle school, 7.7% high school), reported ‘selling drugs’, a rate higher than the state’s.
The county’s rates are higher than the state’s rates across all categories for total students, except for ‘carrying a
handgun’ and ‘getting suspended.’
Table 85: Percent of Middle School and High School Students Reporting Engaging in Delinquent Behavior, Palm Beach County and Florida, 2014
Palm Beach Florida
Middle School
High School
Total Middle School
High School
Total
Carrying a handgun 5.4% 3.6% 4.3% 5.1% 5.4% 5.3%
Selling drugs 2.9% 7.7% 5.7% 2.1% 6.9% 4.9%
Attempting to steal a vehicle 1.7% 1.9% 1.8% 1.1% 1.5% 1.4%
Being arrested 2.8% 3.5% 3.2% 2.2% 3.3% 2.8%
Taking a handgun to school 0.8% 1.4% 1.1% 0.6% 0.8% 0.7%
Getting suspended 10.4% 9.2% 9.7% 11.0% 9.7% 10.3%
Attacking someone with intent to harm 5.9% 7.9% 7.1% 6.7% 7.0% 6.9%
Source: Florida Youth Substance Abuse Survey, 2014 Compiled by: Health Council of Southeast Florida, 2015
Table 86 shows the percentage of middle and high school youth in Palm Beach County and Florida who reported
involvement in bullying behavior. In 2014, 36.0% of youth in the county reported ‘bullying caused worry’, a rate
slightly higher than Florida. More than 25% of youth, in Palm Beach County and Florida, reported being ‘taunted or
teased in the past 30 days.’ More than 33% reported ‘bullying caused worry’ in Palm Beach County and Florida.
Reports of bullying others were higher among middle school students.
Table 86: Percent of Middle School and High School Students Reporting Involvement in Bullying Behavior, Palm Beach County and Florida, 2014
Palm Beach Florida
Middle School
High School
Total Middle School
High School
Total
Bullying caused worry 44.1% 30.2% 36.0% 42.3% 27.5% 33.9%
Skipped school because of bullying 4.4% 6.1% 5.4% 5.6% 6.2% 5.9%
Was kicked or shoved in past 30 days 19.1% 6.2% 11.6% 18.1% 7.5% 12.1%
Was taunted or teased in past 30 days 35.9% 20.6% 27.0% 36.1% 22.1% 28.1%
Was victim of cyber bullying in past 30 days 6.3% 7.6% 7.1% 7.3% 4.5% 7.4%
Physically bullied others in past 30 days 6.0% 5.9% 5.9% 7.5% 4.8% 6.0%
Verbally bullied others in past 30 days 15.8% 9.2% 11.9% 14.2% 10.2% 12.0%
Cyber bullied others in past 30 days 2.5% 4.3% 3.5% 3.1% 3.9% 3.6%
Source: Florida Youth Substance Abuse Survey, 2014 Compiled by: Health Council of Southeast Florida, 2015
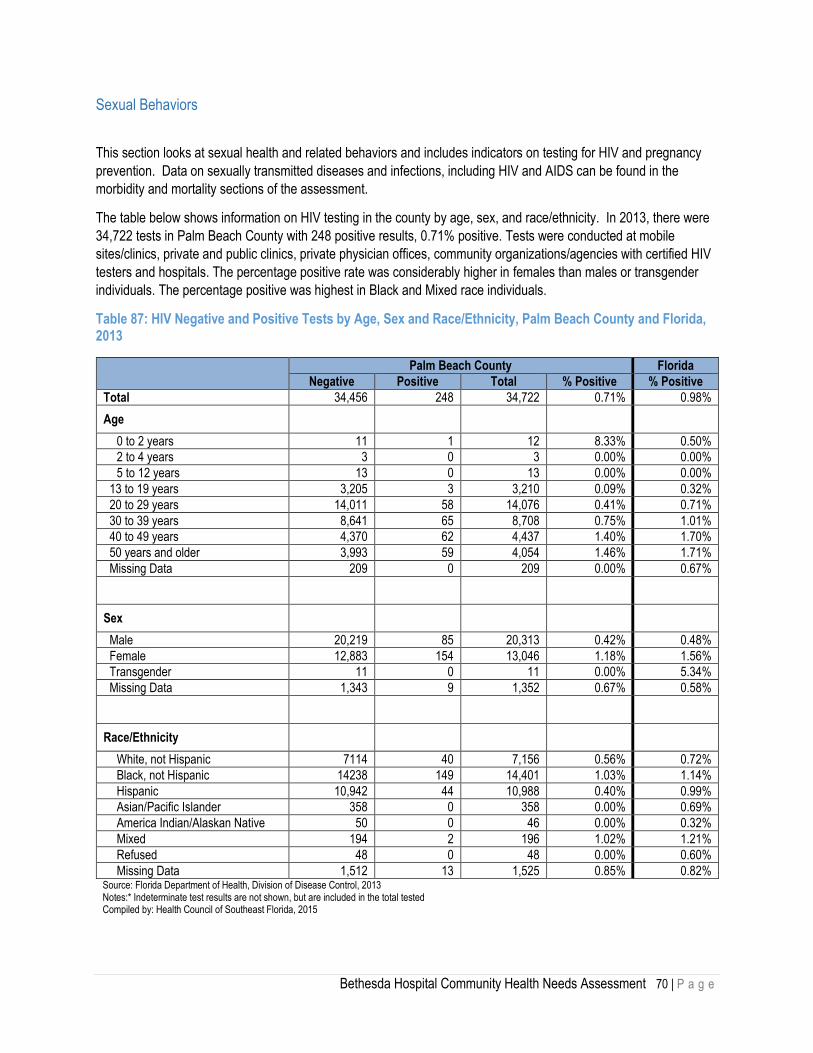
Bethesda Hospital Community Health Needs Assessment 70 | P a g e
Sexual Behaviors
This section looks at sexual health and related behaviors and includes indicators on testing for HIV and pregnancy
prevention. Data on sexually transmitted diseases and infections, including HIV and AIDS can be found in the
morbidity and mortality sections of the assessment.
The table below shows information on HIV testing in the county by age, sex, and race/ethnicity. In 2013, there were
34,722 tests in Palm Beach County with 248 positive results, 0.71% positive. Tests were conducted at mobile
sites/clinics, private and public clinics, private physician offices, community organizations/agencies with certified HIV
testers and hospitals. The percentage positive rate was considerably higher in females than males or transgender
individuals. The percentage positive was highest in Black and Mixed race individuals.
Table 87: HIV Negative and Positive Tests by Age, Sex and Race/Ethnicity, Palm Beach County and Florida, 2013
Palm Beach County Florida
Negative Positive Total % Positive % Positive
Total 34,456 248 34,722 0.71% 0.98%
Age
0 to 2 years 11 1 12 8.33% 0.50%
2 to 4 years 3 0 3 0.00% 0.00%
5 to 12 years 13 0 13 0.00% 0.00%
13 to 19 years 3,205 3 3,210 0.09% 0.32%
20 to 29 years 14,011 58 14,076 0.41% 0.71%
30 to 39 years 8,641 65 8,708 0.75% 1.01%
40 to 49 years 4,370 62 4,437 1.40% 1.70%
50 years and older 3,993 59 4,054 1.46% 1.71%
Missing Data 209 0 209 0.00% 0.67%
Sex
Male 20,219 85 20,313 0.42% 0.48%
Female 12,883 154 13,046 1.18% 1.56%
Transgender 11 0 11 0.00% 5.34%
Missing Data 1,343 9 1,352 0.67% 0.58%
Race/Ethnicity
White, not Hispanic 7114 40 7,156 0.56% 0.72%
Black, not Hispanic 14238 149 14,401 1.03% 1.14%
Hispanic 10,942 44 10,988 0.40% 0.99%
Asian/Pacific Islander 358 0 358 0.00% 0.69%
America Indian/Alaskan Native 50 0 46 0.00% 0.32%
Mixed 194 2 196 1.02% 1.21%
Refused 48 0 48 0.00% 0.60%
Missing Data 1,512 13 1,525 0.85% 0.82% Source: Florida Department of Health, Division of Disease Control, 2013 Notes:* Indeterminate test results are not shown, but are included in the total tested Compiled by: Health Council of Southeast Florida, 2015
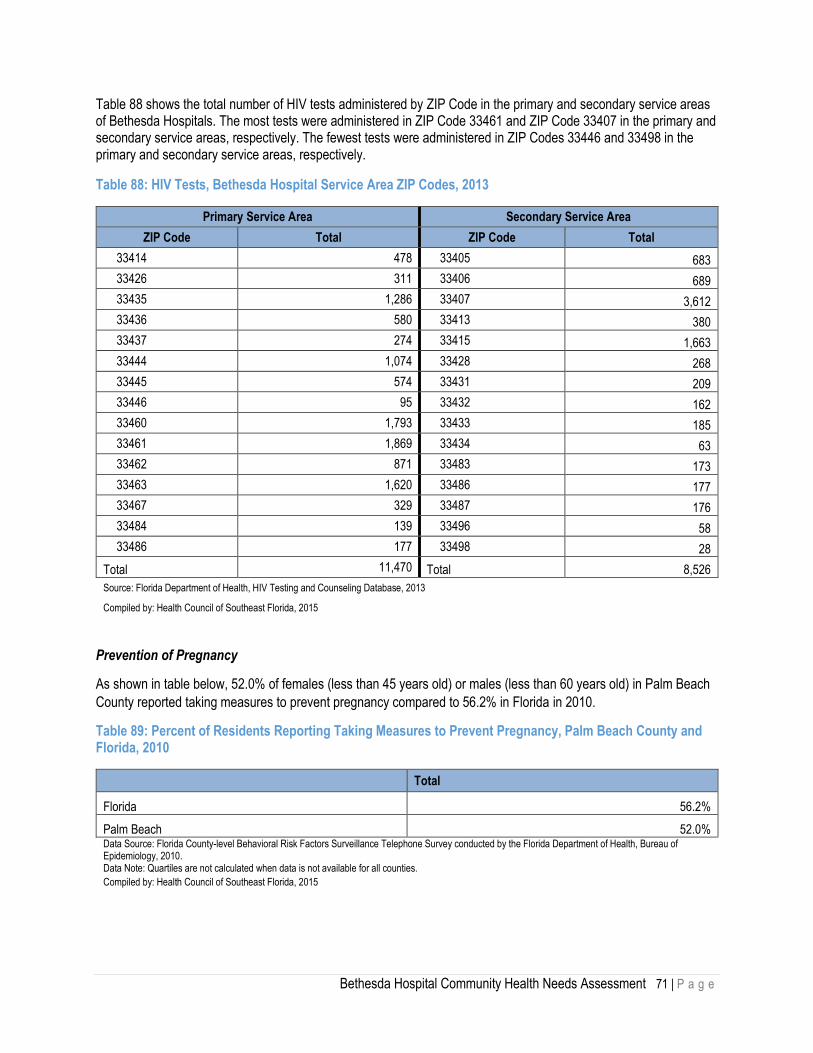
Bethesda Hospital Community Health Needs Assessment 71 | P a g e
Table 88 shows the total number of HIV tests administered by ZIP Code in the primary and secondary service areas of Bethesda Hospitals. The most tests were administered in ZIP Code 33461 and ZIP Code 33407 in the primary and secondary service areas, respectively. The fewest tests were administered in ZIP Codes 33446 and 33498 in the primary and secondary service areas, respectively.
Table 88: HIV Tests, Bethesda Hospital Service Area ZIP Codes, 2013
Primary Service Area Secondary Service Area
ZIP Code Total ZIP Code Total
33414 478 33405 683
33426 311 33406 689
33435 1,286 33407 3,612
33436 580 33413 380
33437 274 33415 1,663
33444 1,074 33428 268
33445 574 33431 209
33446 95 33432 162
33460 1,793 33433 185
33461 1,869 33434 63
33462 871 33483 173
33463 1,620 33486 177
33467 329 33487 176
33484 139 33496 58
33486 177 33498 28
Total 11,470 Total 8,526
Source: Florida Department of Health, HIV Testing and Counseling Database, 2013
Compiled by: Health Council of Southeast Florida, 2015
Prevention of Pregnancy
As shown in table below, 52.0% of females (less than 45 years old) or males (less than 60 years old) in Palm Beach
County reported taking measures to prevent pregnancy compared to 56.2% in Florida in 2010.
Table 89: Percent of Residents Reporting Taking Measures to Prevent Pregnancy, Palm Beach County and Florida, 2010
Total
Florida 56.2%
Palm Beach 52.0% Data Source: Florida County-level Behavioral Risk Factors Surveillance Telephone Survey conducted by the Florida Department of Health, Bureau of Epidemiology, 2010. Data Note: Quartiles are not calculated when data is not available for all counties.
Compiled by: Health Council of Southeast Florida, 2015

Bethesda Hospital Community Health Needs Assessment 72 | P a g e
Mental Health
Number of Psychiatric Beds
Table 90 shows the number of adult psychiatric beds in Palm Beach County and in Florida. There are 224 psychiatric
hospital beds in the county resulting in a rate of 16.6 per 100,000 individuals in 2013, lower than the rate in Florida.
Table 90: Psychiatric Beds, Palm Beach County and Florida, 2011-2013
Number of Beds Rate per 100,000
2011 2012 2013 2011 2012 2013
Florida 3,714 3,736 3,862 19.6 19.6 20.0
Palm Beach 212 224 224 16.0 16.8 16.6 Source: FloridaCHARTS, Florida Agency for Health Care Administration (AHCA), Certificate of Need Office, 2013
Data Note(s): Data as of December of the specified year. Rates calculated using July 1 population estimates from the Office of the Governor
Compiled by: Health Council of Southeast Florida, 2015
Mental Health
As illustrated in Table 91, results from the Behavioral Risk Factor Surveillance System Survey (BRFSS), 90.4% of
respondents in Palm Beach County and 87.3% of respondents in the state of Florida reported being in good mental
health in 2013.
Table 91: Adults with Good Mental Health, Palm Beach County and Florida, 2007, 2010, 2013
Year Palm Beach Florida
2007 92.2% 90.3%
2010 90.6% 88.2%
2013 90.4% 87.3% Source: FloridaCHARTS, Florida County-level Behavioral Risk Factors Surveillance Telephone Survey conducted by the Florida Department of Health, Bureau of Epidemiology, 2013
Compiled by: Health Council of Southeast Florida, 2015
Table 92 shows the average number of unhealthy mental days in the past 30 days reported by individuals in Palm
Beach County and in Florida. Palm Beach County residents reported and average of 3.1 unhealthy mental dates,
slightly more favorable than the 4.1 days reported in Florida.
Table 92: Average Number of Unhealthy Mental Days in the Past 30 Days Reported by Adults, Palm Beach County and Florida, 2007, 2010, 2013
Year Palm Beach Florida
2007 2.7 3.3
2010 3.2 3.8
2013 3.1 4.1 Source: FloridaCHARTS, Florida County-level Behavioral Risk Factors Surveillance Telephone Survey conducted by the Florida Department of Health, Bureau of Epidemiology, 2013 Compiled by: Health Council of Southeast Florida, 2015

Bethesda Hospital Community Health Needs Assessment 73 | P a g e
Alcohol Consumption and Substance Abuse
Excessive alcohol consumption is the third leading lifestyle-related cause of death for people in the United States
each year.17 Excessive drinking is a risk factor associated with a number of adverse health outcomes including:
alcohol poisoning, hypertension, acute myocardial infarction, sexually transmitted infections, unintended pregnancy,
fetal alcohol syndrome, sudden infant death syndrome, suicide, interpersonal violence, and motor vehicle crashes.18
Excessive drinking, as used by the Behavioral Risk Factor Surveillance System (BRFSS), includes binge drinking
and/or heavy drinking and is a frequently used indicator at the population level. Binge drinking is defined as drinking
five or more drinks on a single occasion for men and four or more drinks on a single occasion for women. Heavy
drinking is defined as drinking more than two drinks per day on average for men and more than one drink per day on
average for women.19
Table 93 shows the percentage of adults, who report engaging in heavy or binge drinking in Palm Beach and Florida.
In 2013, the percentage of those who engage in heavy or binge drinking is 17.0%, which was slightly lower than in
Florida.
Table 93: Adults who engage in Heavy or Binge Drinking, Palm Beach County and Florida, 2007, 2010, 2013
Year Palm Beach Florida
2002 17.1% 16.3%
2007 14.6% 16.2%
2010 14.8% 15.0%
2013 17.0% 17.6% Source: FloridaCHARTS, Florida County-level Behavioral Risk Factors Surveillance Telephone Survey conducted by the Florida Department of Health, Bureau of Epidemiology, 2013 Compiled by: Health Council of Southeast Florida, 2015
The table below shows the trend from 2004 to 2014 in the percentage of high school students who reported using
alcohol in the past 30 days in Palm Beach and Florida. In 2014, 34.1% of high school students in Palm Beach
County reported using alcohol in the past 30 days, higher than the percentage in Florida. The 2014 percentage in
Palm Beach decreased from a high of 48.3% in 2004.
Table 94: Percent of High School Students who Reported Using Alcohol in the Past 30 Days, Palm Beach County and Florida, 2004-2014
2004 2006 2008 2010 2012 2014
Florida 42.0% 41.8% 39.5% 38.0% 33.9% 28.4%
Palm Beach 48.3% 46.3% 42.2% 41.8% 38.0% 34.1% Source: FloridaCHARTS, Florida Department of Children and Families, 2014 Data Note(s): Data source is the Florida Youth Substance Abuse Survey (FYSAS). Blanks indicate counties that did not participate in the survey. This is the percent of students reporting any use of alcohol in past 30 days. Data are not collected every year. Compiled by: Health Council of Southeast Florida, 2015
17 Mokdad AH, Marks JS, Stroup DF, Gerberding JL. Actual causes of death in the United States, 2000. JAMA 2004;291(10):1238–1245. 18 The University of Wisconsin, population Health Institute, County Health Rankings, http:// www.countryhealthrankings.org/health-factors/alcohol-use 19 Centers for Disease Control and Prevention Web Site: Alcohol and Public Health. http://www.cdc.gov/alcohol/index.htm. Updated January 13, 2011. Accessed February 8, 2011

Bethesda Hospital Community Health Needs Assessment 74 | P a g e
Table 95 shows the percentage of middle school and high school youth reporting substance use in the previous 30
days in the 2014 Florida Youth Substance Abuse Survey. In Palm Beach, 29.9% reported ‘alcohol or any illicit drug
use’, 2.9% higher than in Florida. In 2014, 22.6 % of Palm Beach high school students reported marijuana or hashish
use in the previous 30 days, over 4% higher than in Florida.
Table 95: Percentage of Middle School and High School Students Reporting Substance Use in the Past 30 Days, Palm Beach County and Florida, 2014
Palm Beach Florida
Middle School
High School
Total Middle School
High School
Total
Any Alcohol 11.5% 34.1% 24.6% 10.1% 28.4% 20.5%
Binge Drinking 4.2% 15.9% 10.9% 3.9% 13.7% 9.5%
Cigarettes 1.0% 8.8% 5.5% 2.0% 7.1% 4.9%
Marijuana or Hashish 4.1% 22.6% 14.8% 4.2% 18.6% 12.4%
Inhalants 2.0% 1.5% 1.7% 3.1% 1.3% 2.1%
Club Drugs 0.0% 1.4% 0.8% 0.3% 1.0% 0.7%
LSD, PCP or Mushrooms 0.2% 1.7% 1.1% 0.6% 1.4% 1.0%
Methamphetamine 0.5% 0.4% 0.5% 0.4% 0.5% 0.5%
Cocaine or Crack Cocaine 0.7% 0.6% 0.7% 0.4% 0.7% 0.6%
Heroin 0.3% 0.4% 0.4% 0.3% 0.3% 0.3%
Depressants 0.2% 1.6% 1.0% 0.8% 2.1% 1.5%
Prescription Pain Relievers 0.9% 1.5% 1.3% 1.4% 2.6% 2.1%
Prescription Amphetamines 0.5% 1.4% 1.0% 0.5% 1.7% 1.2%
Steroids (without a doctor's order) 0.3% 0.8% 0.6% 0.2% 0.3% 0.3%
Over-the-Counter Drugs 1.8% 2.4% 2.1% 1.6% 2.4% 2.1%
Any Illicit Other Than Marijuana 5.1% 7.5% 6.5% 6.2% 8.5% 7.5%
Alcohol or Any Illicit Drug 15.1% 40.7% 29.9% 14.8% 36.3% 27.0%
Source: Florida Youth Substance Abuse Survey, 2014 Data Note: The first 15 data rows show results for alcohol, cigarettes, and other drugs. The last five data rows show results for various combinations of drugs. Binge drinking is defined as having had five or more alcoholic drinks in a row in the past two weeks. Ecstasy, Rohypnol, GHB and ketamine are provided as examples in the question about club drugs. Compiled by: Health Council of Southeast Florida, 2015
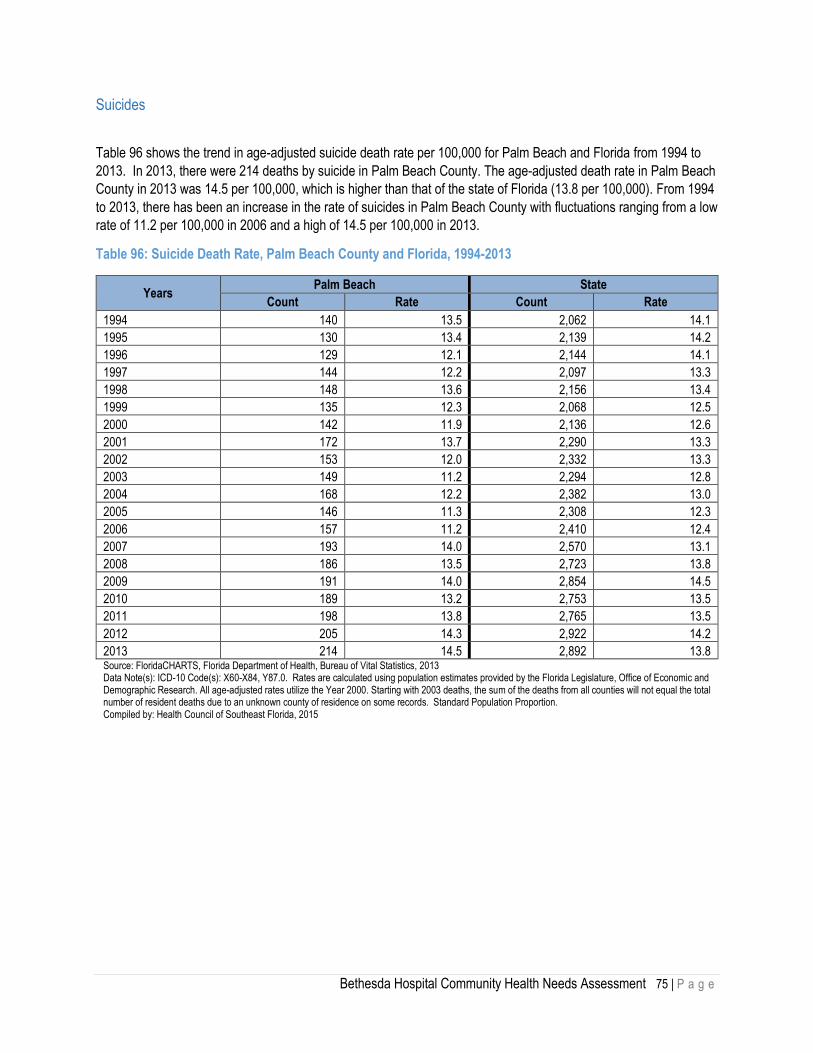
Bethesda Hospital Community Health Needs Assessment 75 | P a g e
Suicides
Table 96 shows the trend in age-adjusted suicide death rate per 100,000 for Palm Beach and Florida from 1994 to
2013. In 2013, there were 214 deaths by suicide in Palm Beach County. The age-adjusted death rate in Palm Beach
County in 2013 was 14.5 per 100,000, which is higher than that of the state of Florida (13.8 per 100,000). From 1994
to 2013, there has been an increase in the rate of suicides in Palm Beach County with fluctuations ranging from a low
rate of 11.2 per 100,000 in 2006 and a high of 14.5 per 100,000 in 2013.
Table 96: Suicide Death Rate, Palm Beach County and Florida, 1994-2013
Years Palm Beach State
Count Rate Count Rate
1994 140 13.5 2,062 14.1
1995 130 13.4 2,139 14.2
1996 129 12.1 2,144 14.1
1997 144 12.2 2,097 13.3
1998 148 13.6 2,156 13.4
1999 135 12.3 2,068 12.5
2000 142 11.9 2,136 12.6
2001 172 13.7 2,290 13.3
2002 153 12.0 2,332 13.3
2003 149 11.2 2,294 12.8
2004 168 12.2 2,382 13.0
2005 146 11.3 2,308 12.3
2006 157 11.2 2,410 12.4
2007 193 14.0 2,570 13.1
2008 186 13.5 2,723 13.8
2009 191 14.0 2,854 14.5
2010 189 13.2 2,753 13.5
2011 198 13.8 2,765 13.5
2012 205 14.3 2,922 14.2
2013 214 14.5 2,892 13.8 Source: FloridaCHARTS, Florida Department of Health, Bureau of Vital Statistics, 2013 Data Note(s): ICD-10 Code(s): X60-X84, Y87.0. Rates are calculated using population estimates provided by the Florida Legislature, Office of Economic and Demographic Research. All age-adjusted rates utilize the Year 2000. Starting with 2003 deaths, the sum of the deaths from all counties will not equal the total number of resident deaths due to an unknown county of residence on some records. Standard Population Proportion. Compiled by: Health Council of Southeast Florida, 2015

Bethesda Hospital Community Health Needs Assessment 76 | P a g e
Hospital Utilization
Utilization at Palm Beach County Hospitals
Table 97 shows the number of beds licensed in Palm Beach County. There is a total of 3,979 beds licensed in Palm
Beach County hospitals.
Table 97: Hospital Utilization, Palm Beach County, January - December 2014
Agency Name Beds Licensed
Bethesda Hospital East 401
Bethesda Hospital West 80
Boca Raton Regional Hospital 394
Delray Medical Center 493
Good Samaritan Medical Center 333
JFK Medical Center 460
Jupiter Medical Center 163
Lakeside Medical Center 75
Palm Beach Gardens Medical Center 195
Palms West Hospital 204
Saint Mary's Medical Center 464
Wellington Regional Medical Center 233
West Boca Medical Center 195
West Palm Hospital 245
TOTAL 3,979
Source: Agency for Health Care Administration, 2014
Compiled By: Health Council of Southeast Florida, 2015

Bethesda Hospital Community Health Needs Assessment 77 | P a g e
Figure 6 shows the percent of beds licensed for Bethesda and Palm Beach County Hospitals. Bethesda Hospitals
account for 12.1% of all beds licensed in Palm Beach County, with 10.1% attributed to Bethesda Hospital East and
2.0% attributed to Bethesda Hospital West.
Figure 6: Percentage of Beds Licensed, Bethesda and Palm Beach County Hospitals, 2014
10.1% 2.0%
87.9%
Beds Licensed
Bethesda Hospital East
Bethesda Hospital West
Palm Beach Hospitals

Bethesda Hospital Community Health Needs Assessment 78 | P a g e
Inpatient Data at Bethesda Hospital East and Bethesda Hospital West
Tables 98 to 109 detail inpatient discharge data at Bethesda Hospital East and Bethesda Hospital West including
proportion of cases by primary and secondary service areas broken down by age group, race, ethnicity, gender and
service line from January 2014 to December 2014.
Table 98 shows the inpatient discharges for the primary service areas of Bethesda Hospital East and Bethesda Hospital West. At Bethesda Hospital East, the ZIP Code 33435 (Boynton Beach) accounts for 19.7% of the discharges, which is the highest among all primary service area ZIP Codes. Comparatively, for Bethesda Hospital West, the ZIP Code 33437 (Boynton Beach) accounts for 38.6% of the discharges, the highest among all primary service area ZIP Codes.
Table 98: Inpatient Discharges by Primary Service Area ZIP Codes, Bethesda Hospitals, January - December 2014
Primary Service Area Percent
Bethesda Hospital East 100.0%
33424 Boynton Beach 0.1%
33425 Boynton Beach 0.1%
33426 Boynton Beach 9.8%
33435 Boynton Beach 19.7%
33436 Boynton Beach 15.0%
33437 Boynton Beach 11.6%
33444 Delray Beach 8.0%
33445 Delray Beach 5.8%
33460 Lake Worth 6.8%
33461 Lake Worth 5.5%
33462 Lake Worth 6.8%
33463 Lake Worth 7.1%
33472 Boynton Beach 2.9%
33473 Boynton Beach 0.7%
33474 Boynton Beach 0.0%
Bethesda Hospital West 100.0%
33414 Wellington 1.9%
33436 Boynton Beach 10.5%
33437 Boynton Beach 38.6%
33446 Delray Beach 4.2%
33449 Lake Worth 1.7%
33463 Lake Worth 4.2%
33467 Lake Worth 19.3%
33472 Boynton Beach 14.3%
33473 Boynton Beach 3.1%
33474 Boynton Beach 0.1%
33484 Delray Beach 2.1%
Total 100.0% Source: Bethesda Hospital: INTELLIMED Market Profile System, Inpatient Data, 2014 Compiled By: Bethesda Hospital and the Health Council of Southeast Florida, 2015

Bethesda Hospital Community Health Needs Assessment 79 | P a g e
Table 99 shows the inpatient discharges for the secondary service areas of Bethesda Hospital East and Bethesda Hospital West. The ZIP Code 33415 (West Palm Beach) accounts for 22.6% of the discharges, which is the highest among all secondary service area ZIP Codes. Conversely, ZIP Code 33498 (Boca Raton) accounts for 2.4% of discharges, the lowest among all secondary service area ZIP Codes.
Table 99: Inpatient Discharges by Secondary Service Area ZIP Codes, Bethesda Hospitals, January - December 2014
Secondary Service Area Percent
33405 West Palm Beach 4.3%
33406 West Palm Beach 10.1%
33413 West Palm Beach 4.6%
33415 West Palm Beach 22.6%
33428 Boca Raton 7.6%
33431 Boca Raton 3.4%
33432 Boca Raton 5.0%
33433 Boca Raton 5.0%
33483 Delray Beach 21.9%
33486 Boca Raton 3.8%
33487 Boca Raton 6.2%
33496 Boca Raton 3.0%
33498 Boca Raton 2.4%
Total 100.0%
Source: Bethesda Hospital: INTELLIMED Market Profile System, Inpatient Data, 2014
Compiled By: Bethesda Hospital and the Health Council of Southeast Florida, 2015

Bethesda Hospital Community Health Needs Assessment 80 | P a g e
Table 100 shows the inpatient discharges for the primary service areas of Bethesda Hospital East and Bethesda Hospital West by age group. There are more discharges for the primary service area ZIP Codes for Lake Worth (33460, 33461, 33462, and 33463) and the Delray Beach ZIP Code 33445 in the 0-29 age groups, while the other ZIP Codes have more discharges in the 65+ age group. At Bethesda Hospital West, the majority of discharges from the primary service area ZIP Codes fall into the 65+ age groups, with the exception of 33414, 33463 and 33474. As shown below, individuals ages 65 and older accounted for the largest number of discharges for both hospitals. In 2014, 41.1% of patients who received services at Bethesda Hospital East were 65 years of age and older, whereas 72.0% of patients who received services at Bethesda Hospital West fell in this age group.
Table 100: Inpatient Discharges by Age and Primary Service Area ZIP Codes, Bethesda Hospitals, January - December 2014
Primary Service Area Ages 0-29 Ages 30-64 Ages 65+
Percent Percent Percent
Bethesda Hospital East 33.1% 25.8% 41.1%
33424 Boynton Beach 12.5% 25.0% 62.5%
33425 Boynton Beach 14.3% 57.1% 28.6%
33426 Boynton Beach 18.9% 23.7% 57.4%
33435 Boynton Beach 29.0% 32.2% 38.8%
33436 Boynton Beach 19.5% 21.0% 59.4%
33437 Boynton Beach 9.3% 13.2% 77.5%
33444 Delray Beach 40.6% 37.4% 22.0%
33445 Delray Beach 33.4% 22.6% 44.0%
33460 Lake Worth 67.1% 25.8% 7.1%
33461 Lake Worth 68.3% 23.8% 7.9%
33462 Lake Worth 44.8% 30.4% 24.8%
33463 Lake Worth 60.7% 28.1% 11.2%
33472 Boynton Beach 14.2% 21.9% 63.9%
33473 Boynton Beach 29.1% 38.8% 32.0%
33474 Boynton Beach 0.0% 100.0% 0.0%
Bethesda Hospital West 3.1% 25.0% 72.0%
33414 Wellington 9.3% 62.8% 27.9%
33436 Boynton Beach 6.9% 28.4% 64.7%
33437 Boynton Beach 2.0% 14.7% 83.3%
33446 Delray Beach 3.2% 23.7% 73.1%
33449 Lake Worth 7.9% 39.5% 52.6%
33463 Lake Worth 2.2% 63.0% 34.8%
33467 Lake Worth 4.0% 30.8% 65.2%
33472 Boynton Beach 0.6% 21.1% 78.2%
33473 Boynton Beach 1.5% 44.1% 54.4%
33474 Boynton Beach 0.0% 50.0% 50.0%
33484 Delray Beach 6.4% 19.1% 74.5%
Total 29.1% 25.7% 45.2% Source: Bethesda Hospital: INTELLIMED Market Profile System, Inpatient Data, 2014 Compiled By: Bethesda Hospital and the Health Council of Southeast Florida, 2015
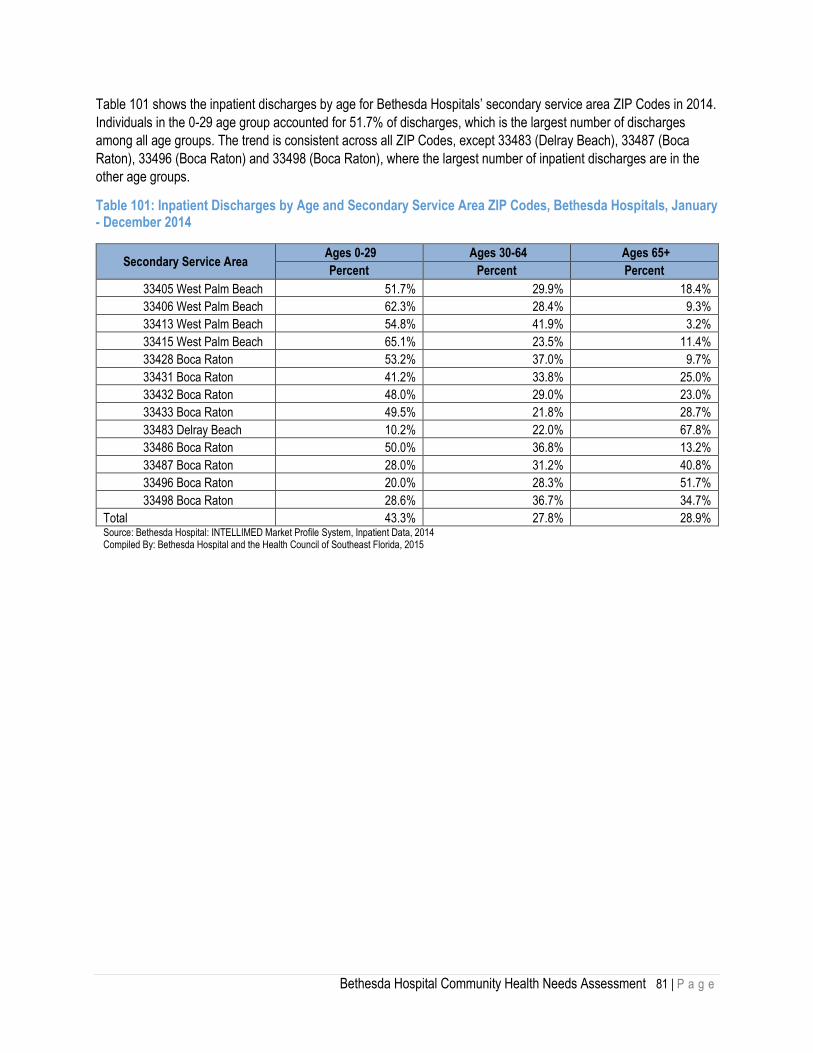
Bethesda Hospital Community Health Needs Assessment 81 | P a g e
Table 101 shows the inpatient discharges by age for Bethesda Hospitals’ secondary service area ZIP Codes in 2014.
Individuals in the 0-29 age group accounted for 51.7% of discharges, which is the largest number of discharges
among all age groups. The trend is consistent across all ZIP Codes, except 33483 (Delray Beach), 33487 (Boca
Raton), 33496 (Boca Raton) and 33498 (Boca Raton), where the largest number of inpatient discharges are in the
other age groups.
Table 101: Inpatient Discharges by Age and Secondary Service Area ZIP Codes, Bethesda Hospitals, January - December 2014
Secondary Service Area Ages 0-29 Ages 30-64 Ages 65+
Percent Percent Percent
33405 West Palm Beach 51.7% 29.9% 18.4%
33406 West Palm Beach 62.3% 28.4% 9.3%
33413 West Palm Beach 54.8% 41.9% 3.2%
33415 West Palm Beach 65.1% 23.5% 11.4%
33428 Boca Raton 53.2% 37.0% 9.7%
33431 Boca Raton 41.2% 33.8% 25.0%
33432 Boca Raton 48.0% 29.0% 23.0%
33433 Boca Raton 49.5% 21.8% 28.7%
33483 Delray Beach 10.2% 22.0% 67.8%
33486 Boca Raton 50.0% 36.8% 13.2%
33487 Boca Raton 28.0% 31.2% 40.8%
33496 Boca Raton 20.0% 28.3% 51.7%
33498 Boca Raton 28.6% 36.7% 34.7%
Total 43.3% 27.8% 28.9% Source: Bethesda Hospital: INTELLIMED Market Profile System, Inpatient Data, 2014 Compiled By: Bethesda Hospital and the Health Council of Southeast Florida, 2015

Bethesda Hospital Community Health Needs Assessment 82 | P a g e
Tables 102 shows the inpatient discharges of the primary and secondary service areas of Bethesda Hospital East and Bethesda Hospital West by race. At Bethesda Hospital East, the ZIP Code 33444 (Boynton Beach) accounts for the highest percentage of discharges identifying as Black among all primary service area ZIP Codes. Comparatively, for Bethesda Hospital West, the ZIP Code 33463 (Lake Worth) has the highest percentage of discharges identifying as Black and Other among all primary service area ZIP Codes. Over the entire primary service area, those who identified as White accounted for 58.1% of the discharges in 2014.
Table 102: Inpatient Discharges by Race and Primary Service Area ZIP Codes, Bethesda Hospitals, January - December 2014
Primary Service Area White Black Other
Percent Percent Percent
Bethesda Hospital East 53.6% 27.4% 19.0%
33424 Boynton Beach 100.0% 0.0% 0.0%
33425 Boynton Beach 63.2% 31.6% 5.3%
33426 Boynton Beach 74.5% 13.9% 11.6%
33435 Boynton Beach 48.5% 40.5% 11.0%
33436 Boynton Beach 72.2% 14.8% 13.0%
33437 Boynton Beach 84.3% 7.1% 8.7%
33444 Delray Beach 25.2% 61.4% 13.4%
33445 Delray Beach 49.1% 35.9% 15.0%
33460 Lake Worth 21.1% 30.3% 48.6%
33461 Lake Worth 23.1% 28.1% 48.7%
33462 Lake Worth 46.1% 27.2% 26.7%
33463 Lake Worth 30.0% 33.1% 36.9%
33472 Boynton Beach 81.4% 6.1% 12.6%
33473 Boynton Beach 70.0% 7.0% 23.0%
33474 Boynton Beach 100.0% 0.0% 0.0%
Bethesda Hospital West 87.0% 3.9% 9.1%
33414 Wellington 71.4% 9.5% 19.0%
33436 Boynton Beach 83.8% 7.9% 8.3%
33437 Boynton Beach 90.4% 3.0% 6.6%
33446 Delray Beach 94.6% 0.0% 5.4%
33449 Lake Worth 81.6% 5.3% 13.2%
33463 Lake Worth 67.0% 12.1% 20.9%
33467 Lake Worth 84.6% 4.7% 10.7%
33472 Boynton Beach 89.1% 1.6% 9.3%
33473 Boynton Beach 86.8% 0.0% 13.2%
33474 Boynton Beach 50.0% 0.0% 50.0%
33484 Delray Beach 91.5% 0.0% 8.5%
Total 58.1% 24.2% 17.7% Source: Bethesda Hospital: INTELLIMED Market Profile System, Inpatient Data, 2014 Compiled By: Bethesda Hospital and the Health Council of Southeast Florida, 2015

Bethesda Hospital Community Health Needs Assessment 83 | P a g e
Table 103 shows the inpatient discharges for the secondary service area ZIP Codes of Bethesda Hospitals in 2014. Over 34% of all inpatient discharges identified as Other, followed by White, which accounted for 51.0% of all discharges. ZIP Code 33483 (Delray Beach) had the largest percent White discharge (82.6%), while ZIP Code 33406 (West Palm Beach) had the largest percent Other discharges (55.9%). As shown below, the ZIP Code 33413 (West Palm Beach) was the only ZIP Code in the secondary service area with the majority of discharges identifying as Black (43.0%).
Table 103: Inpatient Discharges by Race and Secondary Service Area ZIP Codes, Bethesda Hospitals, January - December 2014
Secondary Service Area White Black Other
Percent Percent Percent
33405 West Palm Beach 37.9% 7.6% 54.5%
33406 West Palm Beach 37.3% 6.8% 55.9%
33413 West Palm Beach 34.2% 43.0% 22.8%
33415 West Palm Beach 24.7% 19.6% 55.7%
33428 Boca Raton 38.9% 12.2% 48.9%
33431 Boca Raton 53.3% 18.3% 28.3%
33432 Boca Raton 48.6% 27.8% 23.6%
33433 Boca Raton 51.2% 10.5% 38.4%
33483 Delray Beach 82.6% 12.6% 4.8%
33486 Boca Raton 39.1% 25.0% 35.9%
33487 Boca Raton 67.9% 5.5% 26.6%
33496 Boca Raton 58.2% 3.6% 38.2%
33498 Boca Raton 75.6% 0.0% 24.4%
Total 51.0% 14.9% 34.1%
Source: Bethesda Hospital: INTELLIMED Market Profile System, Inpatient Data, 2014
Compiled By: Bethesda Hospital and the Health Council of Southeast Florida, 2015

Bethesda Hospital Community Health Needs Assessment 84 | P a g e
The table below shows the population of inpatient discharges by ethnicity and primary service area. The percentage
of individuals self-identifying as Non-Hispanic was 92.4% for Bethesda Hospital East, lower than Bethesda Hospital
West at 95.8%. The percentage of individuals who self-identify as Hispanic was 2.7% for Bethesda Hospital East,
higher than Bethesda Hospital West (1.3%).
Table 104: Inpatient Discharges by Ethnicity and Primary Service Area ZIP Codes, Bethesda Hospitals, January - December 2014
Primary Service Area Hispanic Non-Hispanic Unknown
Percent Percent Percent
Bethesda Hospital East 2.7% 92.4% 4.9%
33424 Boynton Beach 12.5% 87.5% 0.0%
33425 Boynton Beach 9.5% 85.7% 4.8%
33426 Boynton Beach 1.9% 95.3% 2.8%
33435 Boynton Beach 2.4% 94.5% 3.0%
33436 Boynton Beach 2.0% 94.2% 3.8%
33437 Boynton Beach 0.8% 96.3% 2.9%
33444 Delray Beach 3.1% 93.0% 3.9%
33445 Delray Beach 1.9% 93.6% 4.4%
33460 Lake Worth 4.7% 83.4% 11.9%
33461 Lake Worth 5.8% 81.5% 12.7%
33462 Lake Worth 3.9% 89.7% 6.4%
33463 Lake Worth 4.5% 87.3% 8.1%
33472 Boynton Beach 0.7% 97.6% 1.7%
33473 Boynton Beach 2.9% 96.1% 1.0%
33474 Boynton Beach 0.0% 100.0% 0.0%
Bethesda Hospital West 1.3% 95.8% 2.9%
33414 Wellington 2.3% 93.0% 4.7%
33436 Boynton Beach 1.7% 94.8% 3.4%
33437 Boynton Beach 1.2% 96.4% 2.5%
33446 Delray Beach 0.0% 100.0% 0.0%
33449 Lake Worth 0.0% 94.7% 5.3%
33463 Lake Worth 1.1% 91.3% 7.6%
33467 Lake Worth 1.4% 95.6% 3.0%
33472 Boynton Beach 1.9% 95.9% 2.2%
33473 Boynton Beach 0.0% 95.6% 4.4%
33474 Boynton Beach 0.0% 100.0% 0.0%
33484 Delray Beach 0.0% 97.9% 2.1%
Total 5.0% 92.7% 9.3% Source: Bethesda Hospital: INTELLIMED Market Profile System, Inpatient Data, 2014 Compiled By: Bethesda Hospital and the Health Council of Southeast Florida, 2015

Bethesda Hospital Community Health Needs Assessment 85 | P a g e
The table below shows the population of inpatient discharges by ethnicity and secondary service area. The
percentage of individuals self-identifying as Non-Hispanic was 85.7% for Bethesda Hospitals. The percentage of
individuals who self-identify as Hispanic was 4.8% across all secondary service area ZIP Codes.
Table 105: Inpatient Discharges by Ethnicity and Secondary Service Area ZIP Codes, Bethesda Hospitals, January - December 2014
Secondary Service Area Hispanic Non-Hispanic Unknown
Percent Percent Percent
33405 West Palm Beach 8.0% 75.9% 16.1%
33406 West Palm Beach 7.8% 78.9% 13.2%
33413 West Palm Beach 2.2% 84.9% 12.9%
33415 West Palm Beach 7.5% 82.7% 9.9%
33428 Boca Raton 8.4% 85.1% 6.5%
33431 Boca Raton 2.9% 88.2% 8.8%
33432 Boca Raton 5.0% 72.0% 23.0%
33433 Boca Raton 3.0% 85.1% 11.9%
33483 Delray Beach 1.8% 95.2% 2.9%
33486 Boca Raton 5.3% 84.2% 10.5%
33487 Boca Raton 1.6% 87.2% 11.2%
33496 Boca Raton 0.0% 91.7% 8.3%
33498 Boca Raton 2.0% 91.8% 6.1%
Total 4.8% 85.7% 9.5%
Source: Bethesda Hospital: INTELLIMED Market Profile System, Inpatient Data, 2014
Compiled By: Bethesda Hospital and the Health Council of Southeast Florida, 2015

Bethesda Hospital Community Health Needs Assessment 86 | P a g e
Table 106 shows the inpatient discharges of the primary service areas of Bethesda Hospital East and Bethesda Hospital West by gender. At Bethesda Hospital East, the ZIP Code 33461 (Lake Worth) accounts for 70.6% discharges identifying as Female, which is the highest among all primary service area ZIP Codes. Comparatively, for Bethesda Hospital West, the ZIP Code 33484 (Delray Beach) has the highest percentage of discharges identifying as Female (63.5%) among all primary service area ZIP Codes. For all primary service area ZIP Codes with more than 50 discharges, there was a higher percentage of identifying as Female than Male.
Table 106: Inpatient Discharges by Gender and Primary Service Area ZIP Codes, Bethesda Hospitals, January - December 2014
Primary Service Area Female Male
Percent Percent
Bethesda Hospital East 59.9% 40.1%
33424 Boynton Beach 25.0% 75.0%
33425 Boynton Beach 66.7% 33.3%
33426 Boynton Beach 59.4% 40.6%
33435 Boynton Beach 57.8% 42.2%
33436 Boynton Beach 56.7% 43.3%
33437 Boynton Beach 53.7% 46.3%
33444 Delray Beach 60.1% 39.9%
33445 Delray Beach 60.8% 39.2%
33460 Lake Worth 68.2% 31.8%
33461 Lake Worth 70.6% 29.4%
33462 Lake Worth 63.4% 36.6%
33463 Lake Worth 65.8% 34.2%
33472 Boynton Beach 54.8% 45.2%
33473 Boynton Beach 46.6% 53.4%
33474 Boynton Beach 0.0% 100.0%
Bethesda Hospital West 54.6% 45.4%
33414 Wellington 51.2% 48.8%
33436 Boynton Beach 57.3% 42.7%
33437 Boynton Beach 55.6% 44.4%
33446 Delray Beach 59.1% 40.9%
33449 Lake Worth 36.8% 63.2%
33463 Lake Worth 56.5% 43.5%
33467 Lake Worth 52.3% 47.7%
33472 Boynton Beach 53.0% 47.0%
33473 Boynton Beach 50.0% 50.0%
33474 Boynton Beach 50.0% 50.0%
33484 Delray Beach 63.8% 36.2%
Total 59.1% 40.9%
Source: Bethesda Hospital: INTELLIMED Market Profile System, Inpatient Data, 2014 Compiled By: Bethesda Hospital and the Health Council of Southeast Florida, 2015

Bethesda Hospital Community Health Needs Assessment 87 | P a g e
Table 107 shows the inpatient discharges of the secondary service areas of Bethesda Hospitals by gender. Similar to the primary service areas, there was a higher percentage of discharges identifying as Female than Male across all ZIP Codes, except 33483 (Delray Beach).
Table 107: Inpatient Discharges by Gender and Secondary Service Area ZIP Codes, Bethesda Hospitals, January - December 2014
Secondary Service Area Female Male
Percent Percent
33405 West Palm Beach 70.1% 29.9%
33406 West Palm Beach 63.2% 36.8%
33413 West Palm Beach 75.3% 24.7%
33415 West Palm Beach 69.5% 30.5%
33428 Boca Raton 74.0% 26.0%
33431 Boca Raton 66.2% 33.8%
33432 Boca Raton 68.0% 32.0%
33433 Boca Raton 64.4% 35.6%
33483 Delray Beach 47.8% 52.2%
33486 Boca Raton 60.5% 39.5%
33487 Boca Raton 53.6% 46.4%
33496 Boca Raton 53.3% 46.7%
33498 Boca Raton 67.3% 32.7%
Total 62.5% 37.5%
Source: Bethesda Hospital: INTELLIMED Market Profile System, Inpatient Data, 2014
Compiled By: Bethesda Hospital and the Health Council of Southeast Florida, 2015

Bethesda Hospital Community Health Needs Assessment 88 | P a g e
Table 108 shows the number and proportion of inpatient discharges in primary service areas from each service line
for Bethesda Hospital East and Bethesda Hospital West from January 2014 to December 2014. In 2014, Obstetrics –
Delivery had the largest percentage of discharges (14.8%) at Bethesda Hospital East. Bethesda Hospital West’s
largest numbers of discharges (15.7%) were attributed to pulmonary discharges in 2014.
Table 108: Inpatient Discharges by Service Line, Bethesda Hospitals Primary Service Area, January - December 2014
Bethesda Hospital East Bethesda Hospital West
Service Line Percent Service Line Percent
Obstetrics - Delivery 14.8% Pulmonary 15.7%
Normal Newborns 11.7% Orthopedics 13.9%
Pulmonary 9.4% Gastroenterology 13.8%
Cardiology 6.2% Cardiology 10.8%
Orthopedics 5.8% Nephrology 7.2%
Gastroenterology 5.6% General Surgery 6.6%
Rehabilitation 4.6% General Medicine 5.7%
General Surgery 4.4% Neurology 4.8%
Neonatology 3.6% Infectious Disease 4.4%
Cardiology - Invasive 3.4% Endocrinology 3.2%
Nephrology 3.4% Hepatobiliary 2.8%
General Medicine 3.1% Hematology 1.9%
Neurology 2.8% Vascular 1.4%
Infectious Disease 2.4% Urology 1.2%
Vascular 2.2% Oncology 1.1%
Hematology 1.8% Rheumatology 0.9%
Endocrinology 1.8% Gynecology 0.8%
Obstetrics - Other 1.6% Trauma 0.6%
Cardiac Surgery 1.5% Psychiatry 0.5%
Gynecology 1.4% Plastic Surgery 0.5%
Oncology 1.4% Cardiology - Invasive 0.4%
Hepatobiliary 1.4% Thoracic Surgery 0.4%
Urology 1.0% Unrelated 0.4%
Otolaryngology 0.8% Otolaryngology 0.3%
Unrelated 0.7% Dermatology 0.2%
Thoracic Surgery 0.6% Obstetrics - Other 0.2%
Rheumatology 0.5% HIV 0.1%
Plastic Surgery 0.4% Cardiac Surgery 0.0%
Neurosurgery 0.3% Dentistry 0.0%
HIV 0.3%
Psychiatry 0.3%
Dermatology 0.3%
Trauma 0.2%
Ophthalmology 0.1%
Dentistry 0.1%
Burns 0.0%
Source: Bethesda Hospital: INTELLIMED Market Profile System, Inpatient Data, 2014
Compiled By: Bethesda Hospital and the Health Council of Southeast Florida, 2015

Bethesda Hospital Community Health Needs Assessment 89 | P a g e
Table 109 shows the number and proportion of inpatient discharges from secondary service areas for each service
line for Bethesda Hospitals from January 2014 to December 2014. In 2014, Obstetrics – Delivery had the largest
percentage of discharges (23.6%) in the secondary service area of Bethesda Hospitals.
Table 109: Inpatient Discharges by Service Line, Bethesda Hospitals Secondary Service Area, January - December 2014
Bethesda Hospital Secondary Service Area
Service Line Percent
Obstetrics - Delivery 23.6%
Normal Newborns 19.3%
Orthopedics 7.5%
Pulmonary 5.3%
Neonatology 5.0%
General Surgery 4.6%
Rehabilitation 4.2%
Gastroenterology 3.6%
Cardiology 3.6%
Infectious Disease 2.0%
Nephrology 2.0%
Obstetrics - Other 2.0%
Gynecology 2.0%
General Medicine 2.0%
Cardiology - Invasive 1.9%
Cardiac Surgery 1.4%
Vascular 1.4%
Neurology 1.4%
Hepatobiliary 1.1%
Hematology 1.0%
Endocrinology 0.9%
Oncology 0.8%
Urology 0.4%
Thoracic Surgery 0.3%
Otolaryngology 0.3%
Unrelated 0.3%
Trauma 0.3%
Rheumatology 0.3%
Neurosurgery 0.3%
Dermatology 0.2%
Psychiatry 0.2%
Plastic Surgery 0.1%
HIV 0.1%
Ophthalmology 0.0%
Source: Bethesda Hospital: INTELLIMED Market Profile System, Inpatient Data, 2014
Compiled By: Bethesda Hospital and the Health Council of Southeast Florida, 2015

Bethesda Hospital Community Health Needs Assessment 90 | P a g e
Emergency Department Utilization
Utilization at Palm Beach County Hospitals
Table 110 shows emergency department utilization in Palm Beach County from January 2014 to December 2014. In
2014, the largest number of adult visits occurred at JFK Medical Center (87,868) and Boca Raton Regional Hospital
had the second highest adult visits. Bethesda Hospital East had 56,790 total visits and 12,418 total admissions, while
Bethesda Hospital West had 18,850 total visits and 2,871 total admissions.
Table 110: Hospital Emergency Department Utilization, Palm Beach County, January - December 2014
Agency Name Adult Visits
Pediatric Visits
Total Visits
Adult Admit
Pediatric Admit
Total Admit
Bethesda Hospital East 42,068 14,722 56,790 11,429 989 12,418
Bethesda Hospital West 15,814 3,036 18,850 2,782 89 2,871
Boca Raton Regional Hospital 45,809 3,973 49,782 16,102 43 16,145
Delray Medical Center 32,469 1,518 33,987 14,842 92 14,934
Good Samaritan Medical Center 35,731 1,809 37,540 7,067 0 7,067
JFK Medical Center 87,868 6,380 94,248 23,845 0 23,845
Jupiter Medical Center 22,810 2,807 25,617 6,483 0 6,483
Lakeside Medical Center 5,626 2,446 24,840 565 130 2,384
Palm Beach Gardens Medical Center 29,439 1,827 31,266 8,259 0 8,259
Palms West Hospital 30,732 18,953 49,685 9,613 2,289 11,902
Saint Mary's Medical Center 30,764 24,419 55,183 7,199 3,804 11,003
Wellington Regional Medical Center 0 0 49,388 0 0 7,458
West Boca Medical Center 20,994 8,730 29,724 5,719 1,335 7,054
West Palm Hospital 26,245 1,588 27,833 6,992 1,872 8,864
TOTAL 426,369 92,208 584,733 120,897 10,643 140,687
Source: Agency for Health Care Administration, 2014
Compiled By: Health Council of Southeast Florida, 2015

Bethesda Hospital Community Health Needs Assessment 91 | P a g e
Figure 7 shows the percent of total emergency department visits at Bethesda and Palm Beach County Hospitals in 2014. Bethesda Hospitals accounted for 12.9% of all emergency department visits. Bethesda Hospital East accounted for 9.7% of all visits, while Bethesda Hospital West accounted for 3.2% of all visits across all Palm Beach County hospitals.
Figure 7: Percent Total Visits, Bethesda and Palm Beach County Hospitals, 2014
9.7%
3.2%
87.1%
Total Visits
Bethesda Hospital East
Bethesda Hospital West
TOTAL

Bethesda Hospital Community Health Needs Assessment 92 | P a g e
Figure 8 shows the percent of total emergency department admissions at Bethesda and Palm Beach County Hospitals in 2014. Bethesda Hospitals accounted for 10.8% of all emergency department admissions. Bethesda Hospital East accounted for 8.8% of all admissions, while Bethesda Hospital West accounted for 2.0% of all admissions across all Palm Beach County hospitals.
Figure 8: Percent Admissions, Bethesda and Palm Beach County Hospitals, 2014
8.8% 2.0%
89.1%
Total Admissions
Bethesda Hospital East
Bethesda Hospital West
TOTAL

Bethesda Hospital Community Health Needs Assessment 93 | P a g e
Emergency Department Data at Bethesda Hospital East and Bethesda Hospital West
Tables 111 to 120 detail emergency department data at Bethesda Hospital East and Bethesda Hospital West
including number and proportion of visits by primary and secondary service areas broken down by age group,
gender, payer type and diagnosis group from January 2014 to December 2014.
Table 111 shows the emergency department visits for the primary service area of Bethesda Hospital East and Bethesda Hospital West. At Bethesda Hospital East, the ZIP Code 33435 (Boynton Beach) accounts for 28.5% of the visits, which is the highest among all primary service area ZIP Codes. Comparatively, for Bethesda Hospital West, the ZIP Code 33437 (Boynton Beach) accounts for 28.1% of the visits, the highest among all primary service area ZIP Codes.
Table 111: Emergency Department Visits by Primary Service Area ZIP Codes, Bethesda Hospitals, January - December 2014
Primary Service Area Percent
Bethesda Hospital East 100.0%
33424 Boynton Beach 0.1%
33425 Boynton Beach 0.2%
33426 Boynton Beach 8.7%
33435 Boynton Beach 28.5%
33436 Boynton Beach 13.4%
33437 Boynton Beach 5.3%
33444 Delray Beach 11.7%
33445 Delray Beach 4.8%
33460 Lake Worth 6.9%
33461 Lake Worth 5.0%
33462 Lake Worth 8.7%
33463 Lake Worth 5.4%
33472 Boynton Beach 1.3%
33473 Boynton Beach 0.1%
33474 Boynton Beach 0.0%
Bethesda Hospital West 100.0%
33414 Wellington 2.2%
33436 Boynton Beach 10.7%
33437 Boynton Beach 28.1%
33446 Delray Beach 3.5%
33449 Lake Worth 2.0%
33463 Lake Worth 8.1%
33467 Lake Worth 21.4%
33472 Boynton Beach 15.0%
33473 Boynton Beach 7.5%
33474 Boynton Beach 0.1%
33484 Delray Beach 1.5%
Total 49,136 Source: Bethesda Hospital: INTELLIMED ED Market Profile System, Emergency Department Data, 2014 Compiled By: Bethesda Hospital and the Health Council of Southeast Florida, 2015

Bethesda Hospital Community Health Needs Assessment 94 | P a g e
Table 112 shows the emergency department visits for the secondary service area of Bethesda Hospitals. The largest percent of emergency department visits came from ZIP Code 33483 (Delray Beach), which accounted for 32.8% of visits. The fewest visits came from 33498 (Boca Raton), which had 52 emergency department visits, accounting for 1.7% of total visits across the secondary service area.
Table 112: Emergency Department Visits by Secondary Service Area ZIP Codes, Bethesda Hospitals, January - December 2014
Secondary Service Area Percent
33405 West Palm Beach 5.3%
33406 West Palm Beach 8.8%
33413 West Palm Beach 4.7%
33415 West Palm Beach 21.6%
33428 Boca Raton 4.7%
33431 Boca Raton 2.4%
33432 Boca Raton 3.6%
33433 Boca Raton 3.3%
33483 Delray Beach 32.8%
33486 Boca Raton 2.6%
33487 Boca Raton 5.3%
33496 Boca Raton 3.1%
33498 Boca Raton 1.7%
Total 100.0%
Source: Bethesda Hospital: INTELLIMED ED Market Profile System, Emergency Department Data, 2014
Compiled By: Bethesda Hospital and the Health Council of Southeast Florida, 2015

Bethesda Hospital Community Health Needs Assessment 95 | P a g e
Table 113 shows the emergency department visits for the primary service area of Bethesda Hospital East and Bethesda Hospital West by age group. The majority of visits across most primary service area ZIP Codes at Bethesda Hospital East come from the 0-29 age group, while at Bethesda Hospital West, the visits are more uniformly distributed across each of the three different age groups.
Table 113: Emergency Department Visits by Age Group and Primary Service Area ZIP Codes, Bethesda Hospitals, January - December 2014
Primary Service Area Ages 0-29 Ages 30-64 Ages 65+
Percent Percent Percent
Bethesda Hospital East 50.2% 32.1% 17.7%
33424 Boynton Beach 30.4% 52.2% 17.4%
33425 Boynton Beach 30.2% 60.3% 9.5%
33426 Boynton Beach 38.2% 34.0% 27.8%
33435 Boynton Beach 46.7% 36.5% 16.8%
33436 Boynton Beach 39.5% 29.7% 30.8%
33437 Boynton Beach 27.1% 22.4% 50.5%
33444 Delray Beach 52.0% 37.5% 10.5%
33445 Delray Beach 53.3% 29.7% 17.1%
33460 Lake Worth 74.2% 23.9% 1.9%
33461 Lake Worth 73.5% 23.4% 3.1%
33462 Lake Worth 60.2% 32.7% 7.1%
33463 Lake Worth 68.6% 27.2% 4.2%
33472 Boynton Beach 30.3% 33.5% 36.1%
33473 Boynton Beach 46.5% 39.5% 14.0%
33474 Boynton Beach 0.0% 40.0% 60.0%
Bethesda Hospital West 28.5% 37.2% 34.3%
33414 Wellington 37.5% 50.6% 12.0%
33436 Boynton Beach 36.1% 39.0% 24.9%
33437 Boynton Beach 20.0% 29.6% 50.4%
33446 Delray Beach 20.2% 38.0% 41.8%
33449 Lake Worth 26.8% 50.4% 22.8%
33463 Lake Worth 47.6% 45.5% 6.9%
33467 Lake Worth 30.7% 40.5% 28.8%
33472 Boynton Beach 23.1% 35.7% 41.2%
33473 Boynton Beach 38.1% 40.3% 21.6%
33474 Boynton Beach 23.1% 23.1% 53.8%
33484 Delray Beach 15.6% 35.6% 48.9%
Total 44.8% 33.4% 21.9% Source: Bethesda Hospital: INTELLIMED ED Market Profile System, Emergency Department Data, 2014
Compiled By: Bethesda Hospital and the Health Council of Southeast Florida, 2015

Bethesda Hospital Community Health Needs Assessment 96 | P a g e
Table 114 shows the emergency department visits for the secondary service area of Bethesda Hospitals by age
group. Overall, 42.9% of all emergency department visits were in the 0-29 year age group in the secondary service
area ZIP Codes of Bethesda Hospitals. The 30-64 year age group accounted for 39.7% of all emergency department
visits, while the 65+ age group accounted for the least emergency department visits. Only ZIP Code 33483 (Delray
Beach), which accounts for the largest number of total emergency department visits, had a higher percent visits in
the 65+ age group than the remaining age groups.
Table 114: Emergency Department Visits by Age Group and Secondary Service Area ZIP Codes, Bethesda Hospitals, January - December 2014
Secondary Service Area Ages 0-29 Ages 30-64 Ages 65+
Percent Percent Percent
33405 West Palm Beach 54.5% 43.0% 2.4%
33406 West Palm Beach 64.6% 33.9% 1.5%
33413 West Palm Beach 63.7% 31.5% 4.8%
33415 West Palm Beach 57.4% 38.3% 4.3%
33428 Boca Raton 42.5% 50.7% 6.8%
33431 Boca Raton 52.0% 41.3% 6.7%
33432 Boca Raton 36.3% 50.4% 13.3%
33433 Boca Raton 36.9% 45.6% 17.5%
33483 Delray Beach 26.2% 36.0% 37.8%
33486 Boca Raton 40.7% 56.8% 2.5%
33487 Boca Raton 34.5% 47.9% 17.6%
33496 Boca Raton 32.0% 50.5% 17.5%
33498 Boca Raton 36.5% 34.6% 28.8%
Total 42.9% 39.7% 17.4%
Source: Bethesda Hospital: INTELLIMED ED Market Profile System, Emergency Department Data, 2014
Compiled By: Bethesda Hospital and the Health Council of Southeast Florida, 2015

Bethesda Hospital Community Health Needs Assessment 97 | P a g e
Table115 shows the emergency department visits of the primary service area of Bethesda Hospital East and Bethesda Hospital West by gender. At Bethesda Hospital East, the ZIP Code 33425 (Boynton Beach) accounts for the highest percentage of identifying as Female among all primary service area ZIP Codes. Comparatively, for Bethesda Hospital West, the ZIP Code 33449 (Lake Worth) has the highest percentage of visits identifying among all primary service area ZIP Codes. For all primary service area ZIP Codes with more than 50 visits, there was a higher percentage of visits identifying as Female than Male.
Table 115: Emergency Department Visits by Gender and Primary Service Area ZIP Codes, Bethesda Hospitals, January - December 2014
Primary Service Area Female Male
Percent Percent
Bethesda Hospital East 57.2% 42.8%
33424 Boynton Beach 39.1% 60.9%
33425 Boynton Beach 65.1% 34.9%
33426 Boynton Beach 60.2% 39.8%
33435 Boynton Beach 56.2% 43.8%
33436 Boynton Beach 57.5% 42.5%
33437 Boynton Beach 55.5% 44.5%
33444 Delray Beach 55.4% 44.6%
33445 Delray Beach 56.3% 43.7%
33460 Lake Worth 56.6% 43.4%
33461 Lake Worth 59.2% 40.8%
33462 Lake Worth 59.4% 40.6%
33463 Lake Worth 58.8% 41.2%
33472 Boynton Beach 57.1% 42.9%
33473 Boynton Beach 51.2% 48.8%
33474 Boynton Beach 100.0% 0.0%
Bethesda Hospital West 56.4% 43.6%
33414 Wellington 59.6% 40.4%
33436 Boynton Beach 61.5% 38.5%
33437 Boynton Beach 57.6% 42.4%
33446 Delray Beach 59.6% 40.4%
33449 Lake Worth 63.6% 36.4%
33463 Lake Worth 61.0% 39.0%
33467 Lake Worth 53.7% 46.3%
33472 Boynton Beach 50.4% 49.6%
33473 Boynton Beach 54.7% 45.3%
33474 Boynton Beach 46.2% 53.8%
33484 Delray Beach 56.7% 43.3%
Total 57.0% 43.0%
Source: Bethesda Hospital: INTELLIMED ED Market Profile System, Emergency Department Data, 2014 Compiled By: Bethesda Hospital and the Health Council of Southeast Florida, 2015

Bethesda Hospital Community Health Needs Assessment 98 | P a g e
Table 116 shows emergency department visits of the secondary service areas of Bethesda Hospitals by gender. Similar to the primary service areas, there was a higher percentage of visits identifying as Female than Male across all ZIP Codes, except 33498 (Boca Raton).
Table 116: Emergency Department Visits by Gender and Secondary Service Area ZIP Codes, Bethesda Hospitals, January - December 2014
Secondary Service Area Female Male
Percent Percent
33405 West Palm Beach 50.9% 49.1%
33406 West Palm Beach 58.8% 41.2%
33413 West Palm Beach 57.5% 42.5%
33415 West Palm Beach 63.3% 36.7%
33428 Boca Raton 59.6% 40.4%
33431 Boca Raton 57.3% 42.7%
33432 Boca Raton 62.8% 37.2%
33433 Boca Raton 52.4% 47.6%
33483 Delray Beach 50.6% 49.4%
33486 Boca Raton 67.9% 32.1%
33487 Boca Raton 56.4% 43.6%
33496 Boca Raton 57.7% 42.3%
33498 Boca Raton 42.3% 57.7%
Total 56.4% 43.6%
Source: Bethesda Hospital: INTELLIMED ED Market Profile System, Emergency Department Data, 2014
Compiled By: Bethesda Hospital and the Health Council of Southeast Florida, 2015

Bethesda Hospital Community Health Needs Assessment 99 | P a g e
Table 117 shows the emergency department visits of the primary service areas of Bethesda Hospital East and Bethesda Hospital West by payer type. At Bethesda Hospital East, the ZIP Code 33437 (Boynton Beach) accounts for the highest number of visits for the Commercial payer types, ZIP Code 33460 (Lake Worth) accounts for the highest percentage of Medicaid payer type and ZIP Code 33474 (Boynton Beach) accounts for the highest percentage of Medicare payer type. At Bethesda Hospital West, the ZIP Code 33473 (Boynton Beach) has the highest percentage of visits for Commercial payer type, ZIP Code 33463 (Lake Worth) has the highest percentage of Medicaid payer type and ZIP Code 33474 (Boynton Beach) has the highest percentage of Medicare payer type. Though payer type varies significantly by primary service area ZIP Code for both Bethesda Hospitals, there are higher percentages of emergency department visits having Medicaid or Medicare payer types.
Table 117: Emergency Department Visits by Payer Type and Primary Service Area ZIP Codes, Bethesda Hospitals, January - December 2014
Primary Service Area Commercial Medicaid Medicare Other
Percent Percent Percent Percent
Bethesda Hospital East 21.3% 45.7% 19.3% 13.8%
33424 Boynton Beach 26.1% 13.0% 26.1% 34.8%
33425 Boynton Beach 33.3% 47.6% 11.1% 7.9%
33426 Boynton Beach 29.4% 30.2% 28.8% 11.5%
33435 Boynton Beach 20.8% 45.0% 19.1% 15.1%
33436 Boynton Beach 24.3% 32.8% 31.6% 11.3%
33437 Boynton Beach 19.7% 20.0% 50.9% 9.4%
33444 Delray Beach 22.2% 46.5% 13.9% 17.4%
33445 Delray Beach 23.7% 45.3% 17.3% 13.7%
33460 Lake Worth 10.0% 72.9% 3.4% 13.7%
33461 Lake Worth 11.9% 70.5% 4.7% 13.0%
33462 Lake Worth 19.8% 57.3% 8.0% 14.9%
33463 Lake Worth 22.2% 60.3% 4.2% 13.3%
33472 Boynton Beach 32.3% 23.7% 36.5% 7.5%
33473 Boynton Beach 48.8% 16.3% 20.9% 14.0%
33474 Boynton Beach 20.0% 20.0% 60.0% 0.0%
Bethesda Hospital West 37.4% 18.4% 34.7% 9.5%
33414 Wellington 53.6% 17.2% 12.4% 16.9%
33436 Boynton Beach 36.8% 25.2% 26.6% 11.3%
33437 Boynton Beach 28.0% 14.0% 50.2% 7.8%
33446 Delray Beach 28.6% 17.1% 45.8% 8.5%
33449 Lake Worth 50.8% 17.2% 22.4% 9.6%
33463 Lake Worth 40.7% 34.2% 7.8% 17.3%
33467 Lake Worth 44.7% 18.0% 28.7% 8.6%
33472 Boynton Beach 30.9% 17.4% 41.7% 10.1%
33473 Boynton Beach 60.5% 13.4% 21.7% 4.3%
33474 Boynton Beach 15.4% 15.4% 53.8% 15.4%
33484 Delray Beach 28.3% 13.3% 51.1% 7.2%
Total 25.3% 38.8% 23.1% 12.7% Source: Bethesda Hospital: INTELLIMED ED Market Profile System, Emergency Department Data, 2014 Compiled By: Bethesda Hospital and the Health Council of Southeast Florida, 2015

Bethesda Hospital Community Health Needs Assessment 100 | P a g e
Table 118 shows emergency department visits of the secondary service areas of Bethesda Hospitals by payer type.
In 2014, 37.4% of visits were from the Medicaid payer type, while 29.3% were from the Commercial payer type. Over
65% of all emergency department visits were Medicaid or Commercial payer types.
Table 118: Emergency Department Visits by Payer Type and Secondary Service Area ZIP Codes, Bethesda Hospitals, January - December 2014
Secondary Service Area Commercial Medicaid Medicare Other
Percent Percent Percent Percent
33405 West Palm Beach 25.5% 45.5% 10.9% 18.2%
33406 West Palm Beach 23.0% 52.6% 4.7% 19.7%
33413 West Palm Beach 31.5% 43.8% 6.8% 17.8%
33415 West Palm Beach 21.0% 54.7% 5.2% 19.1%
33428 Boca Raton 41.1% 28.1% 8.2% 22.6%
33431 Boca Raton 38.7% 25.3% 8.0% 28.0%
33432 Boca Raton 28.3% 34.5% 13.3% 23.9%
33433 Boca Raton 40.8% 22.3% 15.5% 21.4%
33483 Delray Beach 30.8% 26.6% 30.1% 12.5%
33486 Boca Raton 27.2% 44.4% 14.8% 13.6%
33487 Boca Raton 33.3% 27.9% 23.6% 15.2%
33496 Boca Raton 45.4% 23.7% 17.5% 13.4%
33498 Boca Raton 40.4% 26.9% 28.8% 3.8%
Total 29.3% 37.4% 16.6% 16.7%
Source: Bethesda Hospital: INTELLIMED ED Market Profile System, Emergency Department Data, 2014
Compiled By: Bethesda Hospital and the Health Council of Southeast Florida, 2015
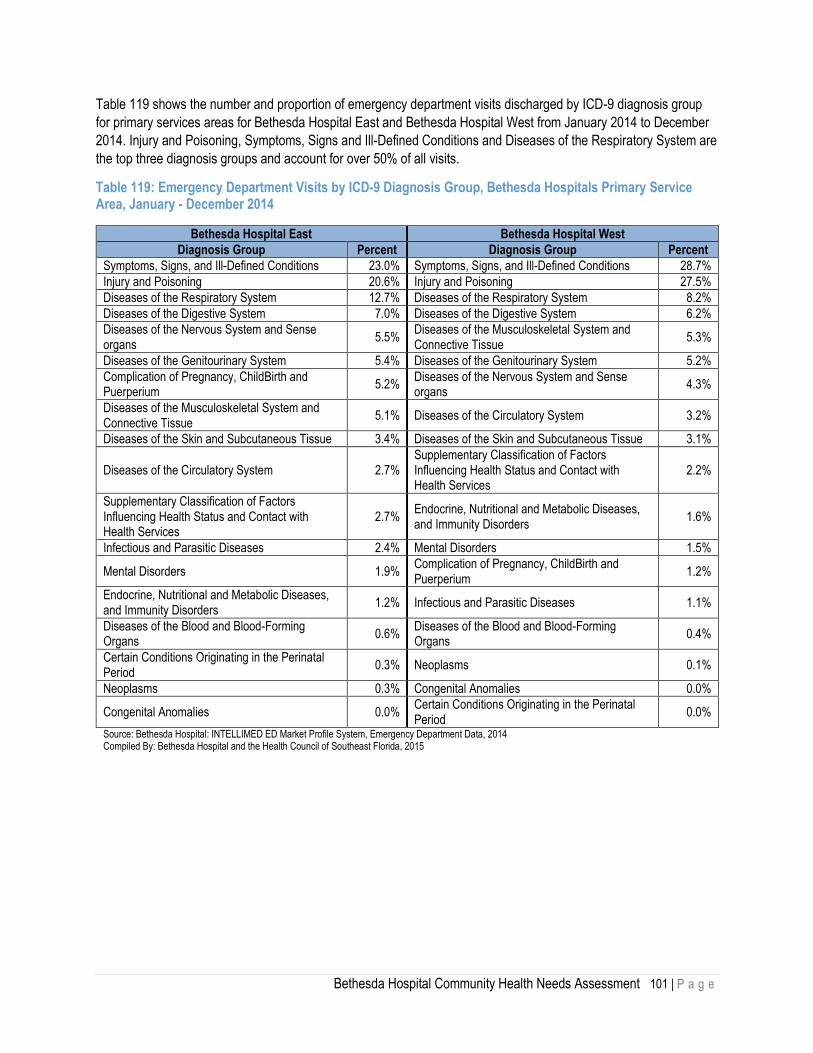
Bethesda Hospital Community Health Needs Assessment 101 | P a g e
Table 119 shows the number and proportion of emergency department visits discharged by ICD-9 diagnosis group
for primary services areas for Bethesda Hospital East and Bethesda Hospital West from January 2014 to December
2014. Injury and Poisoning, Symptoms, Signs and Ill-Defined Conditions and Diseases of the Respiratory System are
the top three diagnosis groups and account for over 50% of all visits.
Table 119: Emergency Department Visits by ICD-9 Diagnosis Group, Bethesda Hospitals Primary Service Area, January - December 2014
Bethesda Hospital East Bethesda Hospital West
Diagnosis Group Percent Diagnosis Group Percent
Symptoms, Signs, and Ill-Defined Conditions 23.0% Symptoms, Signs, and Ill-Defined Conditions 28.7%
Injury and Poisoning 20.6% Injury and Poisoning 27.5%
Diseases of the Respiratory System 12.7% Diseases of the Respiratory System 8.2%
Diseases of the Digestive System 7.0% Diseases of the Digestive System 6.2%
Diseases of the Nervous System and Sense organs
5.5% Diseases of the Musculoskeletal System and Connective Tissue
5.3%
Diseases of the Genitourinary System 5.4% Diseases of the Genitourinary System 5.2%
Complication of Pregnancy, ChildBirth and Puerperium
5.2% Diseases of the Nervous System and Sense organs
4.3%
Diseases of the Musculoskeletal System and Connective Tissue
5.1% Diseases of the Circulatory System 3.2%
Diseases of the Skin and Subcutaneous Tissue 3.4% Diseases of the Skin and Subcutaneous Tissue 3.1%
Diseases of the Circulatory System 2.7% Supplementary Classification of Factors Influencing Health Status and Contact with Health Services
2.2%
Supplementary Classification of Factors Influencing Health Status and Contact with Health Services
2.7% Endocrine, Nutritional and Metabolic Diseases, and Immunity Disorders
1.6%
Infectious and Parasitic Diseases 2.4% Mental Disorders 1.5%
Mental Disorders 1.9% Complication of Pregnancy, ChildBirth and Puerperium
1.2%
Endocrine, Nutritional and Metabolic Diseases, and Immunity Disorders
1.2% Infectious and Parasitic Diseases 1.1%
Diseases of the Blood and Blood-Forming Organs
0.6% Diseases of the Blood and Blood-Forming Organs
0.4%
Certain Conditions Originating in the Perinatal Period
0.3% Neoplasms 0.1%
Neoplasms 0.3% Congenital Anomalies 0.0%
Congenital Anomalies 0.0% Certain Conditions Originating in the Perinatal Period
0.0%
Source: Bethesda Hospital: INTELLIMED ED Market Profile System, Emergency Department Data, 2014 Compiled By: Bethesda Hospital and the Health Council of Southeast Florida, 2015

Bethesda Hospital Community Health Needs Assessment 102 | P a g e
Table 120 shows the number and proportion of emergency department visits discharged by ICD-9 diagnosis group
for secondary services areas for Bethesda Hospitals from January 2014 to December 2014. Injury and Poisoning,
Symptoms, Signs and Ill-Defined Conditions and Diseases of the Respiratory System are the top three diagnosis
groups and account for over 50% of all visits, similar to the primary service areas.
Table 120: Emergency Department Visits by ICD-9 Diagnosis Group, Bethesda Hospitals Secondary Service Area, January - December 2014
Bethesda Hospital Secondary Service Area
Diagnosis Group Percent
Injury and Poisoning 22.6%
Symptoms, Signs, and Ill-Defined Conditions 22.0%
Diseases of the Respiratory System 9.4%
Complication of Pregnancy, ChildBirth and Puerperium 8.1%
Diseases of the Digestive System 6.5%
Diseases of the Genitourinary System 5.0%
Diseases of the Musculoskeletal System and Connective Tissue
4.6%
Diseases of the Nervous System and Sense organs 4.4%
Supplementary Classification of Factors Influencing Health Status and Contact with Health Services
4.2%
Diseases of the Skin and Subcutaneous Tissue 3.8%
Diseases of the Circulatory System 2.8%
Mental Disorders 2.5%
Infectious and Parasitic Diseases 1.7%
Endocrine, Nutritional and Metabolic Diseases, and Immunity Disorders
1.0%
Diseases of the Blood and Blood-Forming Organs 0.7%
Certain Conditions Originating in the Perinatal Period 0.5%
Neoplasms 0.2%
Congenital Anomalies 0.0%
Source: Bethesda Hospital: INTELLIMED ED Market Profile System, Emergency Department Data, 2014
Compiled By: Bethesda Hospital and the Health Council of Southeast Florida, 2015
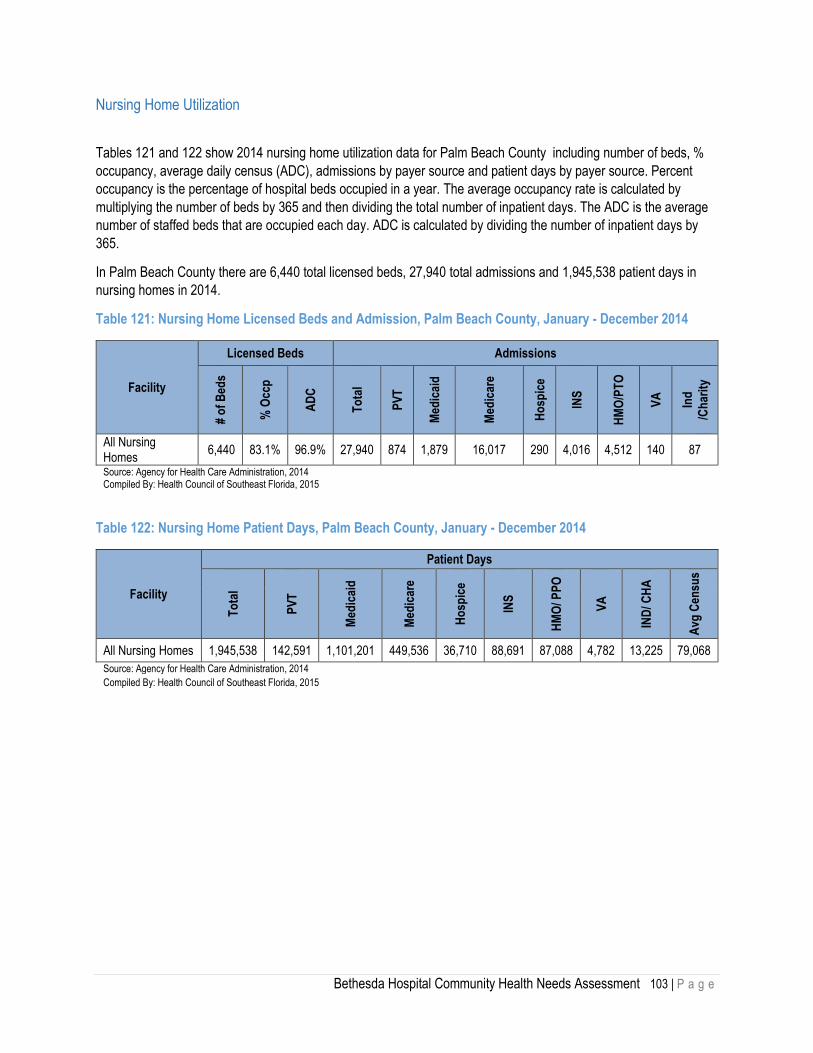
Bethesda Hospital Community Health Needs Assessment 103 | P a g e
Nursing Home Utilization
Tables 121 and 122 show 2014 nursing home utilization data for Palm Beach County including number of beds, %
occupancy, average daily census (ADC), admissions by payer source and patient days by payer source. Percent
occupancy is the percentage of hospital beds occupied in a year. The average occupancy rate is calculated by
multiplying the number of beds by 365 and then dividing the total number of inpatient days. The ADC is the average
number of staffed beds that are occupied each day. ADC is calculated by dividing the number of inpatient days by
365.
In Palm Beach County there are 6,440 total licensed beds, 27,940 total admissions and 1,945,538 patient days in
nursing homes in 2014.
Table 121: Nursing Home Licensed Beds and Admission, Palm Beach County, January - December 2014
Facility
Licensed Beds Admissions
# o
f B
eds
% O
ccp
AD
C
To
tal
PV
T
Med
icai
d
Med
icar
e
Ho
spic
e
INS
HM
O/P
TO
VA
Ind
/Ch
arit
y
All Nursing Homes
6,440 83.1% 96.9% 27,940 874 1,879 16,017 290 4,016 4,512 140 87
Source: Agency for Health Care Administration, 2014 Compiled By: Health Council of Southeast Florida, 2015
Table 122: Nursing Home Patient Days, Palm Beach County, January - December 2014
Facility
Patient Days
To
tal
PV
T
Med
icai
d
Med
icar
e
Ho
spic
e
INS
HM
O/ P
PO
VA
IND
/ CH
A
Avg
Cen
sus
All Nursing Homes 1,945,538 142,591 1,101,201 449,536 36,710 88,691 87,088 4,782 13,225 79,068
Source: Agency for Health Care Administration, 2014
Compiled By: Health Council of Southeast Florida, 2015

Bethesda Hospital Community Health Needs Assessment 104 | P a g e
Morbidity
Morbidity is another term for illness. The tables and figures in the section below illustrate the numbers of and the
rates of hospitalizations for the following diseases: coronary heart disease, cardiovascular disease, stroke, chronic
lower respiratory disease (CLRD), diabetes, cancer, obesity, and communicable diseases including enteric disease,
tuberculosis, HIV/AIDS and other sexually transmitted diseases.
Coronary Heart Disease
Heart disease is the leading cause of death for people of most races and ethnicities in the United States. According
to the Centers for Disease Control and Prevention (CDC), coronary heart disease (CHD) is the most common type of
heart disease.
As shown in Table 123, Palm Beach County and the state of Florida both show a downward trend in the number of
hospitalizations due to coronary heart disease in the years 1993-2012. The rates are consistently lower in Palm
Beach than in Florida. In 2012, the age-adjusted rate in Palm Beach was 264.4 per 100,000 individuals.
Table 123: Hospitalizations from Coronary Heart Disease, Palm Beach County and Florida, 1993- 2012
Palm Beach Florida
Year Count Rate Count Rate
1993 10,069 718.3 132,579 744.1
1994 10,439 717.5 137,071 751.8
1995 10,878 724.0 144,319 774.9
1996 11,302 724.3 151,450 790.3
1997 11,378 710.4 153,688 832.8
1998 12,288 717.2 157,805 820.3
1999 12,288 725.4 157,805 811.6
2000 11,812 677.8 162,415 813.8
2001 11,917 672.6 162,669 752.6
2002 11,132 610.5 157,708 705.8
2003 10,986 595.4 154,551 682.1
2004 10,421 557.4 151,099 657.1
2005 10,403 548.6 143,486 607.9
2006 9,860 509.7 134,330 554.7
2007 8,473 434.0 120,392 486.8
2008 7,953 406.4 112,918 449.3
2009 7,062 356.5 103,981 407.9
2010 6,115 296.9 98,075 375.6
2011 5,756 279.8 91,344 345.0
2012 5,405 264.4 85,179 338.0
Source: FloridaCHARTS, Florida Agency for Health Care Administration (AHCA), 2012
Data Note(s): ICD-9-CM Code(s): 49-CM-414, 429.2. Includes primary diagnosis only. Rates calculated using July 1 population estimates from the Office of the Governor.
Compiled by: Health Council of Southeast Florida, 2015

Bethesda Hospital Community Health Needs Assessment 105 | P a g e
Cardiovascular Disease
Figure 9 charts the number of adults, by race/ethnicity, gender and annual income, who reported ever having a heart
attack, angina or coronary heart disease. “Angina is a type of chest discomfort caused by poor blood flow through the
blood vessels (coronary vessels) of the heart muscle (myocardium).”20
In Palm Beach County there is a significantly smaller proportion of adults identifying as Non-Hispanic Black and
Women who reported ever having had a heart attack, angina or coronary heart disease than in the state of Florida.
As annual income increases, the proportion of adults who reported ever having had a heart attack, angina or
coronary heart disease decreases in both Palm Beach County and the state of Florida in 2013.
Figure 9: Adults who reported ever having had a heart attack, angina or coronary heart disease, by Race/Ethnicity, Gender and Annual Income in Palm Beach County and Florida, 2013
20 A.D.A.M. Medical Encyclopedia, PubMed Health
0.00%
2.00%
4.00%
6.00%
8.00%
10.00%
12.00%
14.00%
16.00%
Adults who reported ever having had a heart attack, angina or coronary heart disease, by Race/Ethnicity, Gender, and Annual Income in Palm Beach and Florida, 2013
Florida
Palm Beach

Bethesda Hospital Community Health Needs Assessment 106 | P a g e
Stroke
Stroke costs the United States an estimated $34 billion each year.21 It is the fifth leading cause of death in the United
States and is a major cause of adult disability. Every year, more than 795,000 people in the United States have a
stroke.22 The table below shows the number of hospitalization rates from stroke in Palm Beach County and Florida
from 1993-2012. In 2012, there were 4,611 hospitalizations from or with stroke by Palm Beach County residents, an
age-adjusted rate of 214.6 per 100,000, lower than the rate in Florida which was 266.2 per 100,000. The rate for the
county was lower for all the years shown than the state’s rate.
Table 124: Age-adjusted Hospitalizations from Stroke, Palm Beach County and Florida, 1993- 2012
Palm Beach Florida
Year Count Rate Count Rate
1993 4,170 274.5 56,765 310.0
1994 4,359 277.8 60,620 323.0
1995 4,913 301.1 67,039 347.6
1996 5,257 310.4 70,847 357.3
1997 5,365 304.4 71,582 368.8
1998 5,591 312.3 73,723 371.9
1999 5,764 315.9 74,352 367.3
2000 5,991 323.5 76,295 368.0
2001 5,766 310.0 76,863 348.7
2002 5,470 280.2 75,430 331.3
2003 5,495 280.1 73,996 320.5
2004 5,327 270.0 73,130 312.6
2005 4,955 247.0 71,169 296.7
2006 4,794 237.2 69,570 282.8
2007 4,885 243.9 70,106 279.0
2008 4,754 234.4 69,482 272.1
2009 4,733 232.5 69,432 268.8
2010 4,700 223.7 70,162 267.7
2011 4,704 221.0 70,232 264.6
2012 4,611 214.6 67,748 266.2 Source: FloridaCHARTS, Florida Agency for Health Care Administration (AHCA), 2012
Data Note(s): ICD-9-CM Code(s): 430-438. Includes primary diagnosis only. Rates calculated using July 1 population estimates from the Office of the Governor. Compiled by: Health Council of Southeast Florida, 2015
21 Center of Disease Control (CDC). (2015) Stroke Facts. Retrieved from http://www.cdc.gov/stroke/facts.htm 22 Center of Disease Control (CDC). (2015) Stroke Facts. Retrieved from http://www.cdc.gov/stroke/facts.htm
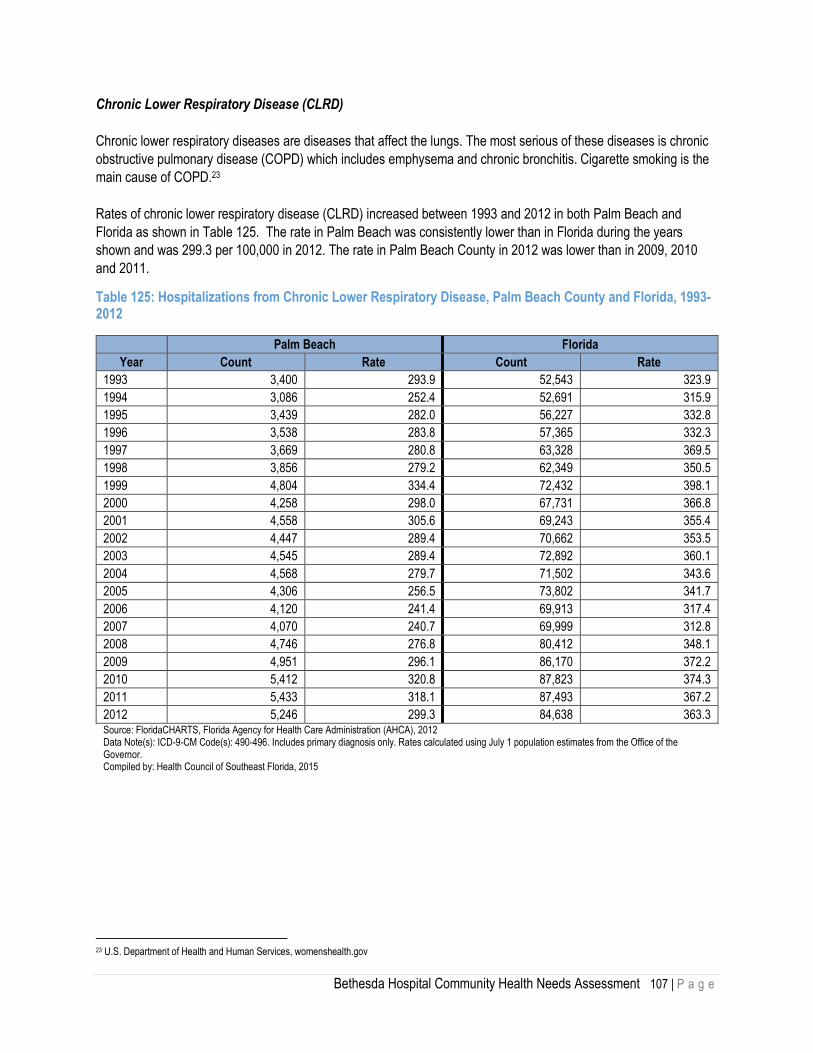
Bethesda Hospital Community Health Needs Assessment 107 | P a g e
Chronic Lower Respiratory Disease (CLRD)
Chronic lower respiratory diseases are diseases that affect the lungs. The most serious of these diseases is chronic
obstructive pulmonary disease (COPD) which includes emphysema and chronic bronchitis. Cigarette smoking is the
main cause of COPD.23
Rates of chronic lower respiratory disease (CLRD) increased between 1993 and 2012 in both Palm Beach and
Florida as shown in Table 125. The rate in Palm Beach was consistently lower than in Florida during the years
shown and was 299.3 per 100,000 in 2012. The rate in Palm Beach County in 2012 was lower than in 2009, 2010
and 2011.
Table 125: Hospitalizations from Chronic Lower Respiratory Disease, Palm Beach County and Florida, 1993- 2012
Palm Beach Florida
Year Count Rate Count Rate
1993 3,400 293.9 52,543 323.9
1994 3,086 252.4 52,691 315.9
1995 3,439 282.0 56,227 332.8
1996 3,538 283.8 57,365 332.3
1997 3,669 280.8 63,328 369.5
1998 3,856 279.2 62,349 350.5
1999 4,804 334.4 72,432 398.1
2000 4,258 298.0 67,731 366.8
2001 4,558 305.6 69,243 355.4
2002 4,447 289.4 70,662 353.5
2003 4,545 289.4 72,892 360.1
2004 4,568 279.7 71,502 343.6
2005 4,306 256.5 73,802 341.7
2006 4,120 241.4 69,913 317.4
2007 4,070 240.7 69,999 312.8
2008 4,746 276.8 80,412 348.1
2009 4,951 296.1 86,170 372.2
2010 5,412 320.8 87,823 374.3
2011 5,433 318.1 87,493 367.2
2012 5,246 299.3 84,638 363.3 Source: FloridaCHARTS, Florida Agency for Health Care Administration (AHCA), 2012 Data Note(s): ICD-9-CM Code(s): 490-496. Includes primary diagnosis only. Rates calculated using July 1 population estimates from the Office of the Governor. Compiled by: Health Council of Southeast Florida, 2015
23 U.S. Department of Health and Human Services, womenshealth.gov

Bethesda Hospital Community Health Needs Assessment 108 | P a g e
Asthma
The table below shows an increased rate of hospitalization due to asthma between 1993 and 2012 in both Palm
Beach and Florida. The rate in Palm Beach was consistently lower than in Florida since 2004 and was 645.2 per
100,000 in 2012.
Table 126: Hospitalizations from Asthma, Palm Beach County and Florida, 1993- 2012
Palm Beach Florida
Year Count Rate Count Rate
1993 3,696 357.7 53,179 354.0
1994 4,019 376.0 55,350 362.2
1995 4,333 411.2 59,349 384.6
1996 4,389 411.7 60,501 385.9
1997 4,549 407.4 66,532 429.5
1998 5,072 435.6 66,950 420.9
1999 6,052 497.6 77,808 476.8
2000 6,157 484.3 81,777 487.8
2001 7,230 549.8 93,299 526.2
2002 7,745 580.0 103,413 571.3
2003 8,926 638.1 118,273 634.5
2004 8,632 591.8 123,498 642.5
2005 8,603 576.0 133,154 675.7
2006 9,398 615.2 144,173 713.7
2007 9,096 594.3 146,711 711.0
2008 9,714 634.8 151,192 726.0
2009 10,024 660.8 161,518 775.2
2010 10,121 667.2 164,021 777.9
2011 10,306 683.5 164,092 773.9
2012 9,818 645.2 163,625 789.2 Source: FloridaCHARTS, Florida Agency for Health Care Administration (AHCA), 2014 Data Note(s): ICD-9-CM Code(s): 493.00-493.91. Includes primary diagnosis only. Rates calculated using July 1 population estimates from the Office of the Governor. Compiled by: Health Council of Southeast Florida, 2015

Bethesda Hospital Community Health Needs Assessment 109 | P a g e
Diabetes
The American Diabetes Association (ADA) released new research on March 6, 2013, estimating the total costs of
diagnosed diabetes have risen to $245 billion in 2012 from $174 billion in 2007, when the cost was last examined.24
Diabetes is a disease that affects how the body uses blood sugar (glucose). Glucose is vital to health because it's an
important source of energy for the cells that make up muscles and tissues. It's also the brain’s main source of fuel.
Too much glucose can lead to serious health problems. Complications of diabetes include cardiovascular disease,
nerve, kidney, foot and eye damage, skin conditions and hearing impairment. Chronic diabetes conditions include
type 1 diabetes and type 2 diabetes.25
The table below shows the number and rate of hospitalizations from or with diabetes in Palm Beach County and in
Florida in the years 1993-2012. In 2012, the rate in Palm Beach County was 1737.3 per 100,000. The rate was
consistently lower in Palm Beach than in Florida.
Table 127: Hospitalizations from Diabetes, Palm Beach County and Florida, 1993- 2012
Palm Beach Florida
Year Count Rate Count Rate
1993 14,199 1034.4 210,878 1220.2
1994 15,156 1087.5 224,455 1269.3
1995 16,255 1118.2 240,282 1328.4
1996 17,002 1126.8 254,983 1371.1
1997 18,502 1193.5 273,457 1489.0
1998 19,432 1222.8 291,685 1553.1
1999 21,126 1304.7 309,543 1611.2
2000 22,788 1373.0 331,877 1686.0
2001 25,151 1497.5 357,895 1726.3
2002 25,363 1464.9 375,753 1759.5
2003 26,355 1498.6 394,563 1818.1
2004 27,114 1527.0 410,164 1866.5
2005 26,556 1469.3 424,236 1880.4
2006 30,770 1664.3 484,511 2081.6
2007 31,211 1675.8 502,628 2116.1
2008 32,068 1715.5 519,227 2157.8
2009 32,266 1722.2 538,941 2219.5
2010 32,874 1689.1 566,381 2274.8
2011 33,750 1732.3 577,529 2293.4
2012 33,959 1737.3 565,117 2305.2 Source: FloridaCHARTS, Florida Agency for Health Care Administration (AHCA), 2012
Data Note(s): ICD-9-CM Code(s): 250.00-250.93. Includes both primary and contributing diagnoses. Rates calculated using July 1 population estimates from the Office of the Governor. Compiled by: Health Council of Southeast Florida, 2015
24 American Diabetes Association (2013). The Cost of Diabetes. Retrieved from: http://www.diabetes.org/advocacy/news-events/cost-of-diabetes.html#sthash.rD7jxOY9.dpuf 25 http://www.mayoclinic.org/diseases-conditions/diabetes/basics/definition/con-20033091

Bethesda Hospital Community Health Needs Assessment 110 | P a g e
Cancer Incidence
The table below shows the number of cancer cases (all types) and the age-adjusted rate of new cancer cases in
Palm Beach County and in Florida from 1993 to 2011. The rate decreased significantly in both areas during the time
period shown. The 2011 age-adjusted rate was lower in Palm Beach (423.3 per 100,000) than in Florida (447.8 per
100,000).
Table 128: Age-adjusted Cancer Incidence, Palm Beach County and Florida, 2002- 2011
Palm Beach Florida
Year Count Rate Count Rate
1992 7,748 554.7 86,971 518.0
1993 7,745 545.6 84,914 496.9
1994 7,610 518.8 86,047 493.7
1995 7,879 524.2 88,193 495.7
1996 7,972 517.6 89,550 492.2
1997 8,131 512.7 93,145 499.6
1998 8,411 513.2 95,620 502.2
1999 8,454 505.9 96,564 496.2
2000 8,425 495.8 96,996 487.3
2001 8,519 495.4 98,261 483.8
2002 8,241 465.9 96,329 458.9
2003 8,122 447.4 94,910 445.6
2004 8,209 456.4 98,547 459.3
2005 8,087 442.6 102,708 466.1
2006 8,289 446.4 103,293 456.2
2007 8,515 454.5 106,022 459.4
2008 8,762 467.3 108,373 463.1
2009 8,420 447.3 107,161 453.4
2010 8,530 434.0 107,258 441.1
2011 8,436 423.3 110,428 447.8
Source: FloridaCHARTS, University of Miami (FL) Medical School, Florida Cancer Data System, 2011
Data Note(s): ICD-9-CM Code(s): C00-C97. Compiled by: Health Council of Southeast Florida, 2015
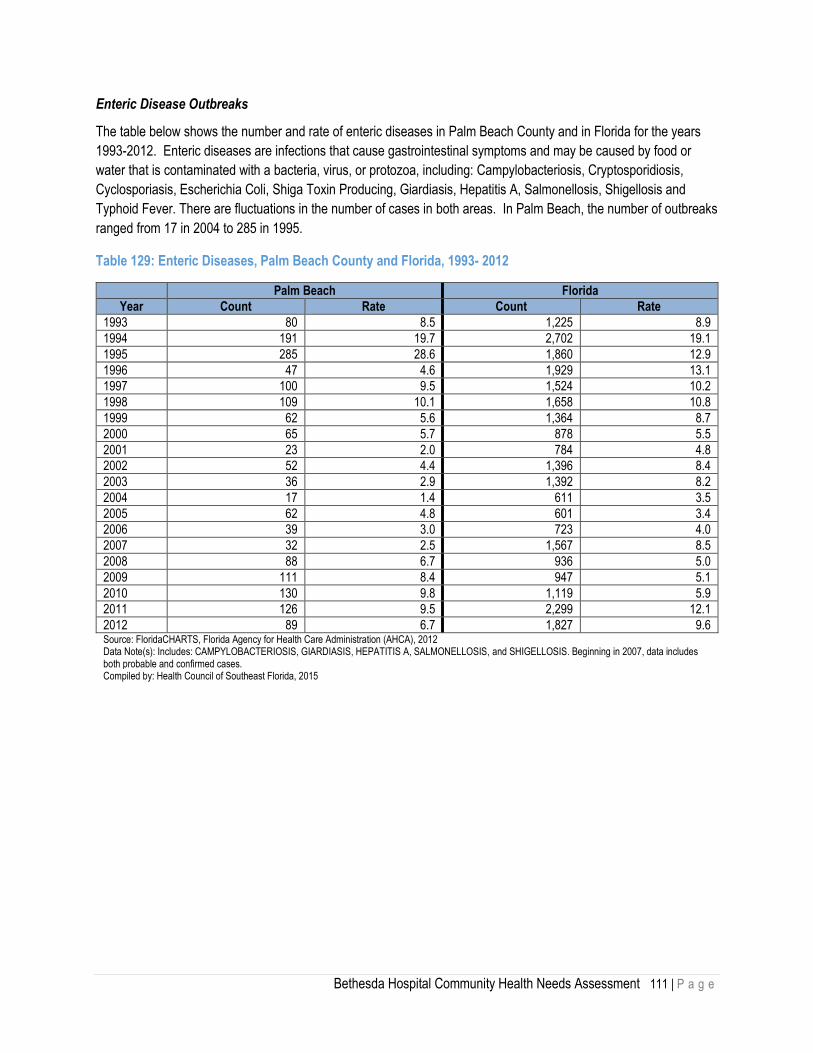
Bethesda Hospital Community Health Needs Assessment 111 | P a g e
Enteric Disease Outbreaks
The table below shows the number and rate of enteric diseases in Palm Beach County and in Florida for the years
1993-2012. Enteric diseases are infections that cause gastrointestinal symptoms and may be caused by food or
water that is contaminated with a bacteria, virus, or protozoa, including: Campylobacteriosis, Cryptosporidiosis,
Cyclosporiasis, Escherichia Coli, Shiga Toxin Producing, Giardiasis, Hepatitis A, Salmonellosis, Shigellosis and
Typhoid Fever. There are fluctuations in the number of cases in both areas. In Palm Beach, the number of outbreaks
ranged from 17 in 2004 to 285 in 1995.
Table 129: Enteric Diseases, Palm Beach County and Florida, 1993- 2012
Palm Beach Florida
Year Count Rate Count Rate
1993 80 8.5 1,225 8.9
1994 191 19.7 2,702 19.1
1995 285 28.6 1,860 12.9
1996 47 4.6 1,929 13.1
1997 100 9.5 1,524 10.2
1998 109 10.1 1,658 10.8
1999 62 5.6 1,364 8.7
2000 65 5.7 878 5.5
2001 23 2.0 784 4.8
2002 52 4.4 1,396 8.4
2003 36 2.9 1,392 8.2
2004 17 1.4 611 3.5
2005 62 4.8 601 3.4
2006 39 3.0 723 4.0
2007 32 2.5 1,567 8.5
2008 88 6.7 936 5.0
2009 111 8.4 947 5.1
2010 130 9.8 1,119 5.9
2011 126 9.5 2,299 12.1
2012 89 6.7 1,827 9.6 Source: FloridaCHARTS, Florida Agency for Health Care Administration (AHCA), 2012 Data Note(s): Includes: CAMPYLOBACTERIOSIS, GIARDIASIS, HEPATITIS A, SALMONELLOSIS, and SHIGELLOSIS. Beginning in 2007, data includes both probable and confirmed cases. Compiled by: Health Council of Southeast Florida, 2015

Bethesda Hospital Community Health Needs Assessment 112 | P a g e
Obesity
Being overweight and obesity are often associated with poor health outcomes and rapidly increase the risk of
mortality. Overweight and obese individuals can develop other diseases such as high blood pressure, high
cholesterol, heart disease, stroke, some types of cancer and orthopedic issues.
For youth, being overweight and obese are determined by body mass index (BMI) percentile using sex- and age-
specific reference data from the 2000 CDC growth charts. BMI is calculated by dividing weight in pounds by height in
inches, squared and multiplying by 703. Table 130 shows the percentage of overweight and obese high school youth
by race and ethnicity in Palm Beach County in 2013. Almost a quarter of high school students were overweight or
obese in 2013.
Table 130: Percent of High School Students who are Overweight or Obese by Race and Ethnicity, Palm Beach County, 2013
To
tal
Am
eric
an In
dia
n/
Ala
ska
Nat
ive
Asi
an
Bla
ck (
no
n-H
isp
anic
)
His
pan
ic
Nat
ive
Haw
aiia
n o
r
Oth
er P
acif
ic
Isla
nd
er
Wh
ite
(no
n-
His
pan
ic)
Mu
ltip
le R
ace
(no
n-
His
pan
ic)
Overweight (students who were >= 85th percentile but < 95th percentile for BMI)
15.3% N/A N/A 16.6% 18.1% N/A 12.5% N/A
Obese (students who were >= 95th percentile for BMI)
9.5% N/A N/A 13.9% 9.9% N/A 6.9% N/A
Described themselves as slightly or very overweight
26.5% N/A N/A 22.9% 32.1% N/A 23.2% N/A
Source: High School Youth Risk Behavior Survey, 2013
Data Note: based on sex- and age-specific reference data from the 2000 CDC growth charts, N/A = < 100 respondents for the subgroup Compiled by: Health Council of Southeast Florida, 2015
The table below shows the percentage of adults who reported being overweight or obese in Palm Beach County and
in Florida, in the years 2002, 2007, 2010 and 2013. The rate increased in the county during the time period shown
and there was a significant number of adults (60.1%) who were either overweight or obese in 2013. However, it is
important to note that that this data is self-reported and is likely an underestimation of the rate of those who are
overweight and obesity in Palm Beach County and Florida.
Table 131: Adults who are Overweight or Obese, Palm Beach County and Florida, 2002, 2007, 2010, 2013
Year Palm Beach Florida
2002 56.9% 57.9%
2007 57.6% 62.1%
2010 61.3% 65.0%
2013 60.1% 62.8%
Source: FloridaCHARTS, Florida Behavioral Risk Factor Surveillance System, 2013
Compiled by: Health Council of Southeast Florida, 2015

Bethesda Hospital Community Health Needs Assessment 113 | P a g e
Infectious Disease
Tuberculosis
Table 132 shows the number of tuberculosis cases in Palm Beach and in Florida from 1994-2010. The number of
cases declined in both areas in the time period shown. In 2013, there were 55 tuberculosis cases in Palm Beach
County yielding a rate of 4.1 per 100,000, a bit higher than the previous year and higher than the state’s rate.
Table 132: Tuberculosis Cases, Palm Beach County and Florida, 1994- 2013
Palm Beach Florida
Year Count Rate Count Rate
1994 170 17.6 1,764 12.5
1995 120 12.1 1,557 10.8
1996 115 11.3 1,417 9.6
1997 115 10.9 1,400 9.3
1998 84 7.8 1,304 8.5
1999 107 9.7 1,281 8.2
2000 76 6.7 1,171 7.3
2001 79 6.8 1,145 7.0
2002 99 8.3 1,086 6.5
2003 87 7.1 1,046 6.1
2004 99 7.9 1,076 6.2
2005 92 7.2 1,094 6.1
2006 82 6.3 1,038 5.7
2007 70 5.4 989 5.3
2008 65 5.0 953 5.1
2009 58 4.4 821 4.4
2010 69 5.2 834 4.4
2011 59 4.4 754 4.0
2012 40 3.0 678 3.6
2013 55 4.1 652 3.4 Source: FloridaCHARTS, Florida Department of Health, Bureau of TB & Refugee Health, 2013 Compiled by: Health Council of Southeast Florida, 2015

Bethesda Hospital Community Health Needs Assessment 114 | P a g e
Reportable Diseases
The Florida Health Department requires that practitioners report certain disease and medical conditions. These
include outbreaks, vector borne diseases, some sexually transmitted diseases, food-borne diseases, pertussis, Q
fever, TB, lead poisoning, carbon monoxide poisoning and some cancers. The table below shows the number and
rate of reportable disease cases in Palm Beach County and in Florida for the years 1993-2012. In 2012, the rate of
reportable diseases in Palm Beach County was 92.3 per 100,000, which was significantly lower than that of the state
of Florida (108.5 per 100,000).
Table 133: Total Reportable Disease Cases, Palm Beach County and Florida, 1993- 2012
Palm Beach Florida
Year Count Rate Count Rate
1993 827 88.0 14,407 104.4
1994 1,020 105.4 16,435 116.4
1995 1,240 124.6 15,028 104.3
1996 1,052 103.1 14,784 100.6
1997 875 83.2 12,721 84.7
1998 886 82.2 13,053 85.3
1999 776 70.1 12,687 80.9
2000 901 79.2 12,619 78.5
2001 851 73.2 11,577 70.7
2002 1,037 87.0 15,470 92.5
2003 1,144 93.5 15,126 88.6
2004 962 76.6 13,174 75.4
2005 1,135 88.8 14,811 82.9
2006 1,067 82.4 14,705 80.6
2007 1,232 94.5 18,050 97.6
2008 1,348 103.0 17,907 96.1
2009 1,639 124.7 24,727 132.1
2010 1,180 89.4 20,455 108.7
2011 1,290 97.2 21,088 111.4
2012 1,231 92.3 20,644 108.4 Source: FloridaCHARTS, Florida Department of Health, Bureau of Epidemiology, 2012 Data Note(s): Includes all reportable diseases. Beginning in 2007, data includes both probable and confirmed cases. Compiled by: Health Council of Southeast Florida, 2015

Bethesda Hospital Community Health Needs Assessment 115 | P a g e
HIV Incidence
The table below shows HIV incidence, or the number and rate of new HIV cases, in Palm Beach County and in
Florida during the years 1995-2013. The number of new cases ranged from 915-275 in the county during the time
period shown with a high of 915 cases in 1999. As shown in Table 147, the rate of reported new HIV cases per
100,000 individuals in Palm Beach ranged from 20.6 to 83.7 per 100,000 in the time period shown. In 2013, the rate
in the county was slightly higher than the state’s rate.
Table 134: HIV Cases, Palm Beach County and Florida, 1995- 2013
Palm Beach Florida
Year Count Rate Count Rate
1995 772 77.6 7,565 52.5
1996 751 73.6 6,773 46.1
1997 717 68.2 7,404 49.3
1998 902 83.7 10,612 69.3
1999 915 82.7 9,855 62.9
2000 762 67.0 8,614 53.6
2001 721 62.0 8,327 50.8
2002 786 65.9 8,605 51.5
2003 689 56.3 7,796 45.7
2004 591 47.1 7,690 44.0
2005 526 41.1 6,923 38.7
2006 459 35.4 6,658 36.5
2007 481 36.9 6,853 37.0
2008 549 41.9 7,814 41.9
2009 355 27.0 5,524 29.5
2010 309 23.4 4,896 26.0
2011 341 25.7 4,997 26.4
2012 275 20.6 4,512 23.7
2013 384 28.4 5,467 28.3
Source: FloridaCHARTS, Florida Department of Health, Bureau of Epidemiology. 2013 Data Note(s): These data represent reported new cases of HIV. No data available prior to 1998. The increased number of cases for 2007 is partially attributable to changes in HIV case definitions for HIV reporting. Compiled by: Health Council of Southeast Florida, 2015

Bethesda Hospital Community Health Needs Assessment 116 | P a g e
AIDS Incidence
Table 135 shows new AIDS cases in Palm Beach County and Florida from 1995 to 2013, according to the clinical
definitions of AIDS. The number of new cases in Palm Beach ranged from 198 to 832 cases per year in the time
period shown and the rate in 2013 was 16.4 per 100.000, which was equal to that of the state of Florida.
Table 135: AIDS Cases, Palm Beach County and Florida, 1995- 2013
Palm Beach Florida
Year Count Rate Count Rate
1995 832 83.6 8,452 58.7
1996 793 77.7 7,293 49.6
1997 579 55.1 5,659 37.7
1998 479 44.5 5,094 33.3
1999 436 39.4 5,014 32.0
2000 498 43.8 4,627 28.8
2001 463 39.8 4,697 28.7
2002 506 42.5 4,748 28.4
2003 433 35.4 4,452 26.1
2004 423 33.7 5,422 31.0
2005 344 26.9 4,677 26.2
2006 358 27.6 4,848 26.6
2007 270 20.7 3,707 20.0
2008 318 24.3 4,622 24.8
2009 287 21.8 4,038 21.6
2010 237 18.0 3,175 16.9
2011 236 17.8 3,297 17.4
2012 198 14.9 2,679 14.1
2013 221 16.4 3,177 16.4 Source: FloridaCHARTS, Florida Department of Health, Bureau of Epidemiology, 2013 Data Note(s): Many 2007 cases were not reported until 2008 because of the change from paper to electronic lab reporting (ELR). This results in an artificially low count of AIDS cases in 2007. Compiled by: Health Council of Southeast Florida, 2015

Bethesda Hospital Community Health Needs Assessment 117 | P a g e
People Living With HIV/AIDS
The table below shows the number of people living with HIV/AIDS in Bethesda Hospital’s primary and secondary
service areas in 2013. Below reflects that the highest number of individuals (3,166) living with HIV/AIDS was in
Bethesda Hospital’s primary service area. Of that, the highest number of individuals (707) living with HIV/AIDS was
in Delray Beach, ZIP Code 33444. In 2013, West Palm Beach, ZIP Code 33407 had the highest number of
individuals living with HIV/AIDs in Bethesda Hospital’s secondary service area. It is important to note that these
numbers do not take into account the estimated population in these ZIP Codes.
Table 136: People Living with HIV/AIDS, Bethesda Hospitals Primary and Secondary Service Area ZIP Codes, 2013
Primary Service Area Secondary Service Area
ZIP Code PLWHA ZIP Code PLWHA
33414 88 33405 169
33426 69 33406 162
33435 495 33407 752
33436 149 33413 42
33437 71 33415 231
33444 707 33428 90
33445 211 33431 58
33446 22 33432 85
33460 531 33433 88
33461 215 33434 37
33462 190 33483 56
33463 244 33486 76
33467 66 33487 53
33484 32 33496 22
33486 76 33498 6
Total 3,166 Total 1,927 Source: Florida Department of Health, 2013 Compiled by: Health Council of Southeast Florida, 2015
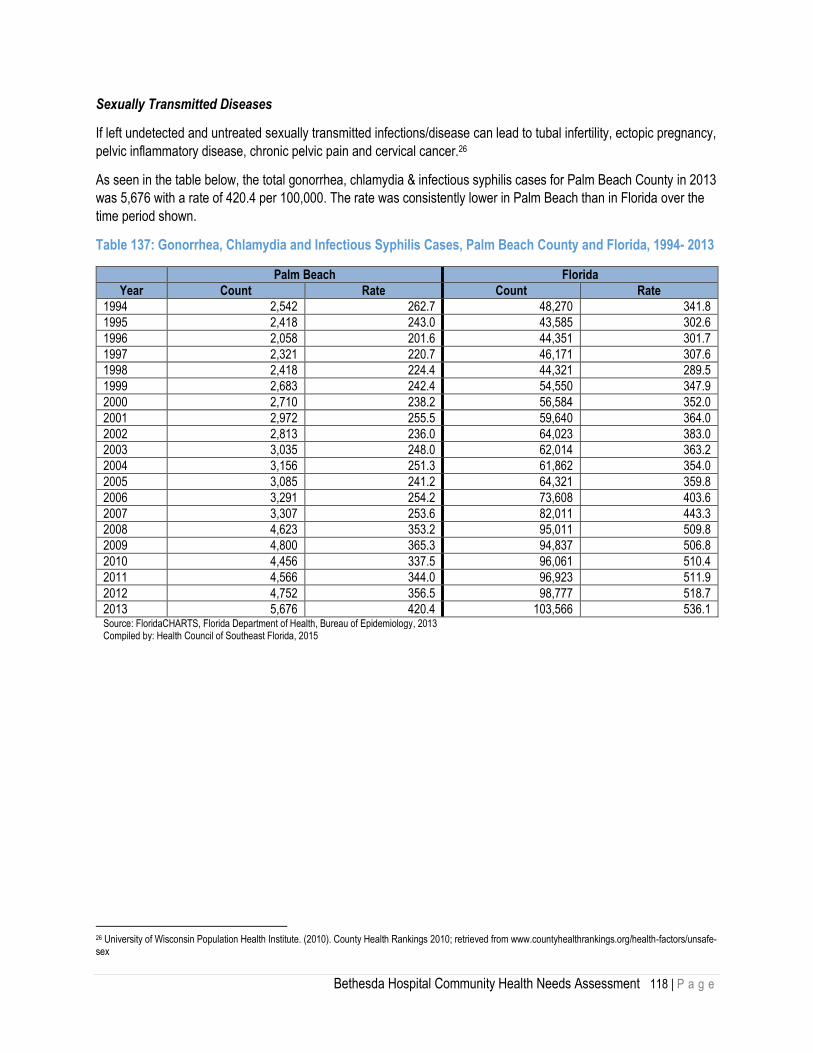
Bethesda Hospital Community Health Needs Assessment 118 | P a g e
Sexually Transmitted Diseases
If left undetected and untreated sexually transmitted infections/disease can lead to tubal infertility, ectopic pregnancy,
pelvic inflammatory disease, chronic pelvic pain and cervical cancer.26
As seen in the table below, the total gonorrhea, chlamydia & infectious syphilis cases for Palm Beach County in 2013
was 5,676 with a rate of 420.4 per 100,000. The rate was consistently lower in Palm Beach than in Florida over the
time period shown.
Table 137: Gonorrhea, Chlamydia and Infectious Syphilis Cases, Palm Beach County and Florida, 1994- 2013
Palm Beach Florida
Year Count Rate Count Rate
1994 2,542 262.7 48,270 341.8
1995 2,418 243.0 43,585 302.6
1996 2,058 201.6 44,351 301.7
1997 2,321 220.7 46,171 307.6
1998 2,418 224.4 44,321 289.5
1999 2,683 242.4 54,550 347.9
2000 2,710 238.2 56,584 352.0
2001 2,972 255.5 59,640 364.0
2002 2,813 236.0 64,023 383.0
2003 3,035 248.0 62,014 363.2
2004 3,156 251.3 61,862 354.0
2005 3,085 241.2 64,321 359.8
2006 3,291 254.2 73,608 403.6
2007 3,307 253.6 82,011 443.3
2008 4,623 353.2 95,011 509.8
2009 4,800 365.3 94,837 506.8
2010 4,456 337.5 96,061 510.4
2011 4,566 344.0 96,923 511.9
2012 4,752 356.5 98,777 518.7
2013 5,676 420.4 103,566 536.1 Source: FloridaCHARTS, Florida Department of Health, Bureau of Epidemiology, 2013 Compiled by: Health Council of Southeast Florida, 2015
26 University of Wisconsin Population Health Institute. (2010). County Health Rankings 2010; retrieved from www.countyhealthrankings.org/health-factors/unsafe-sex

Bethesda Hospital Community Health Needs Assessment 119 | P a g e
Mortality
Leading Causes of Deaths
Table 138 shows numbers of deaths, percent of total deaths, crude rate, age-adjusted rate and years of potential life
lost for the leading causes of death in Palm Beach County. In 2013, there were 13,515 deaths in Palm Beach
County. The most frequent cause of deaths was heart disease accounting for 25.6% of deaths, followed by cancer,
responsible for 23.8% of deaths. The greatest age-adjusted death rate was due to cancer (140.6 per 100,000).
Cancer deaths had the highest rate of years of potential life lost (YPLL) with 1,412.7 per 100,000 people under 75,
indicative of deaths to a population with a younger average age. Years of Potential Life Lost in an estimate of
premature mortality and is the number of years of life lost among persons who die before a predetermined age (75
years).27
Table 138: Leading Causes of Death, Palm Beach County, 2013
Cause of Death Deaths Percent of
Total Deaths
Crude Rate Per 100,000
Age-Adjusted
Death Rate Per
100,000
YPLL < 75 Per
100,000 Under 75
ALL CAUSES 13,515 100.0% 1,001.1 570.9 6,348.4
HEART DISEASE 3,458 25.6% 256.1 130.4 801.1
CANCER 3,218 23.8% 238.4 140.6 1,412.7
STROKE 754 5.6% 55.8 28.9 183.4
CHRONIC LOWER RESPIRATORY DISEASE 656 4.9% 48.6 25.6 137.0
UNINTENTIONAL INJURIES 634 4.7% 47.0 39.7 1,154.8
ALZHEIMER'S DISEASE 440 3.3% 32.6 15.0 13.7
DIABETES MELLITUS 265 2.0% 19.6 11.9 138.9
KIDNEY DISEASE 244 1.8% 18.1 9.4 55.1
SUICIDE 214 1.6% 15.9 14.5 414.7
PARKINSON'S DISEASE 201 1.5% 14.9 7.3 15.8
CHRONIC LIVER DISEASE AND CIRRHOSIS 167 1.2% 12.4 8.9 175.4
PNEUMONIA/INFLUENZA 166 1.2% 12.3 6.6 61.1
SEPTICEMIA 144 1.1% 10.7 5.8 41.4
HOMICIDE 88 0.7% 6.5 7.4 293.2
AIDS/HIV 69 0.5% 5.1 4.9 141.5 Source: FloridaCHARTS, Florida Department of Health, Office of Health Statistics and Assessment, 2013 Data Note: Age-adjusted death rates are computed using the year 2000 standard population. YPLL = Years of Potential Life Lost. Compiled by: Health Council of Southeast Florida, 2015
27 FloridaCHARTS User’s Guide

Bethesda Hospital Community Health Needs Assessment 120 | P a g e
The table below shows numbers of deaths by leading causes of death in Bethesda Hospital’s primary service area by
ZIP Code. In 2013, the most frequent leading cause of deaths was major cardiovascular disease, accounting for
1,842 deaths for Bethesda Hospital’s primary service area. Of that, the highest number of deaths was in Boynton
Beach, ZIP Code 33437. The second most frequent cause of deaths was cancer accounting for 1,314 deaths,
followed by all injuries (331 deaths).
Table 139: Deaths by Major Causes, Bethesda Hospital Primary Service Area ZIP Codes, 2013
ZIP Code
All Cause
Major Cardiovascular
Disease Cancer
Chronic Lower
Respiratory Disease
All Injuries Diabetes
Count Count % Count % Count % Count % Count %
33414 292 90 30.8% 69 23.6% 10 3.4% 26 8.9% 6 2.1%
33426 280 105 37.5% 44 15.7% 19 6.8% 19 6.8% 7 2.5%
33435 342 97 28.4% 94 27.5% 21 6.1% 26 7.6% 8 2.3%
33436 483 162 33.5% 129 26.7% 25 5.2% 16 3.3% 12 2.5%
33437 663 234 35.3% 190 28.7% 21 3.2% 33 5.0% 11 1.7%
33444 196 67 34.2% 48 24.5% 11 5.6% 16 8.2% 4 2.0%
33445 442 151 34.2% 94 21.3% 20 4.5% 19 4.3% 6 1.4%
33446 460 158 34.3% 121 26.3% 23 5.0% 16 3.5% 8 1.7%
33460 250 64 25.6% 58 23.2% 7 2.8% 34 13.6% 6 2.4%
33461 265 87 32.8% 52 19.6% 10 3.8% 39 14.7% 6 2.3%
33462 371 133 35.8% 70 18.9% 18 4.9% 31 8.4% 5 1.3%
33463 321 104 32.4% 71 22.1% 18 5.6% 28 8.7% 8 2.5%
33467 517 175 33.8% 130 25.1% 28 5.4% 1 0.2% 6 1.2%
33484 595 215 36.1% 144 24.2% 25 4.2% 27 4.5% 12 2.0%
Total 5477 1842 33.6% 1314 24.0% 256 4.7% 331 6.0% 105 1.9%
Source: FloridaCHARTS, Florida Department of Health, Office of Health Statistics and Assessment, 2013
Data Note: Malignant Neoplasm (Cancer) ICD-10 Code(s): C00-C97; Diabetes Mellitus ICD-10 Code(s): E10-E14; Major Cardiovascular Disease ICD-10 Code(s): I00-I78; Chronic Lower Respiratory Disease ICD-10 Code(s): J40-J42, J43, J44, J45-J46, J47; All Injuries ICD-10 Code(s): V01-Y89.
Compiled by: Health Council of Southeast Florida, 2015

Bethesda Hospital Community Health Needs Assessment 121 | P a g e
Table 140 shows the numbers of deaths by leading causes of death in Bethesda Hospital’s secondary service area
by ZIP Code. In 2013, the most frequent leading cause of deaths was major cardiovascular disease accounting for
1,066 deaths for Bethesda Hospital’s secondary service area. Of that, the highest number of deaths was in Boca
Raton, ZIP Code 33433. The second most frequent cause of deaths was cancer accounting for 781 deaths, followed
by all injuries (217 deaths).
Table 140: Deaths by Major Causes, Bethesda Hospital Secondary Service Area ZIP Codes, 2013
ZIP Code
All Cause
Major Cardiovascular
Disease Cancer
Chronic Lower
Respiratory Disease
All Injuries Diabetes
Count Count % Count % Count % Count % Count %
33405 157 48 30.6% 36 22.9% 5 3.2% 10 6.4% 3 1.9%
33406 164 47 28.7% 47 28.7% 8 4.9% 12 7.3% 2 1.2%
33413 75 22 29.3% 14 18.7% 3 4.0% 10 13.3% 2 2.7%
33415 359 126 35.1% 73 20.3% 15 4.2% 33 9.2% 10 2.8%
33428 265 92 34.7% 77 29.1% 6 2.3% 17 6.4% 4 1.5%
33431 148 51 34.5% 25 16.9% 6 4.1% 9 6.1% 1 0.7%
33432 195 75 38.5% 49 25.1% 9 4.6% 15 7.7% 2 1.0%
33433 626 227 36.3% 136 21.7% 25 4.0% 23 3.7% 5 0.8%
33434 324 95 29.3% 88 27.2% 17 5.2% 19 5.9% 5 1.5%
33483 132 43 32.6% 30 22.7% 9 6.8% 12 9.1% 2 1.5%
33486 175 48 27.4% 45 25.7% 8 4.6% 17 9.7% 5 2.9%
33487 215 61 28.4% 54 25.1% 11 5.1% 14 6.5% 3 1.4%
33496 274 97 35.4% 73 26.6% 11 4.0% 17 6.2% 4 1.5%
33498 124 34 27.4% 34 27.4% 6 4.8% 9 7.3% 1 0.8%
Total 3233 1066 33.0% 781 24.2% 139 4.3% 217 6.7% 49 1.5%
Source: FloridaCHARTS, Florida Department of Health, Office of Health Statistics and Assessment, 2013
Data Note: Malignant Neoplasm (Cancer) ICD-10 Code(s): C00-C97; Diabetes Mellitus ICD-10 Code(s): E10-E14; Major Cardiovascular Disease ICD-10 Code(s): I00-I78; Chronic Lower Respiratory Disease ICD-10 Code(s): J40-J42, J43, J44, J45-J46, J47; All Injuries ICD-10 Code(s): V01-Y89.

Bethesda Hospital Community Health Needs Assessment 122 | P a g e
Coronary Heart Disease Deaths
Table 141 shows the 1994 to 2013 trend in age-adjusted death rate from coronary heart disease in Palm Beach and
Florida. The rate has decreased in both areas over the time period shown. In 2013, there were 2,267 deaths in the
county from Coronary Heart Disease, resulting in an age-adjusted rate of 85.3 per 100,000, which was lower than the
rate in Florida (100.0 per 100,000).
Table 141: Deaths from Coronary Heart Disease, Palm Beach County and Florida, 1994- 2013
Palm Beach State
Years Count Rate Count Rate
1994 3,316 199.2 39,039 216.4
1995 3,508 201.5 39,890 215.0
1996 3,514 193.6 39,902 208.5
1997 3,697 195.1 39,894 202.6
1998 3,750 190.3 40,633 200.7
1999 4,034 199.8 41,143 197.9
2000 3,634 175.1 39,701 186.3
2001 3,505 167.0 39,189 180.4
2002 3,278 149.3 37,607 165.4
2003 3,313 149.2 36,659 159.6
2004 3,026 130.4 35,430 147.9
2005 2,957 123.7 34,310 140.5
2006 2,686 110.9 32,590 129.2
2007 2,630 109.1 29,917 116.1
2008 2,516 101.4 29,584 110.9
2009 2,302 90.7 28,615 105.5
2010 2,387 93.4 28,451 108.6
2011 2,380 92.7 27,690 103.9
2012 2,519 96.5 27,927 103.5
2013 2,267 85.3 27,712 100.0 Source: FloridaCHARTS, Florida Department of Health, Bureau of Vital Statistics, 2013 Data Note(s): ICD-10 Code(s): I20-I25.Rates calculated using July 1 population estimates from the Office of the Governor. Compiled by: Health Council of Southeast Florida, 2015

Bethesda Hospital Community Health Needs Assessment 123 | P a g e
Stroke Deaths
The table below shows deaths from stroke in Palm Beach and Florida from 1994 to 2013. The rate has decreased in
both areas over the time period shown. In 2013, there were 754 deaths in the county from stroke, resulting in an
age-adjusted rate of 28.9 per 100,000; the rate in Florida was 31.3 per 100,000.
Table 142: Deaths from Stroke, Palm Beach County and Florida, 1994- 2013
Palm Beach Florida
Year Count Rate Count Rate
1994 801 47.6 9,501 52.9
1995 829 47.8 9,800 52.8
1996 787 44.0 9,806 51.2
1997 788 41.3 9,969 50.6
1998 828 43.5 10,011 49.6
1999 819 40.6 10,512 50.5
2000 822 40.1 10,381 48.6
2001 801 38.2 10,376 47.7
2002 833 37.9 10,243 45.0
2003 767 34.9 9,873 42.9
2004 778 34.6 9,661 40.4
2005 832 35.3 9,321 38.2
2006 687 29.0 8,864 35.3
2007 663 28.0 8,715 33.9
2008 651 26.9 8,472 31.9
2009 718 29.1 8,385 30.9
2010 736 29.2 8,324 32.0
2011 700 27.5 8,327 31.5
2012 701 28.5 8,372 31.2
2013 754 28.9 8,611 31.3 Source: FloridaCHARTS, Florida Department of Health, Bureau of Vital Statistics, 2013 Data Note(s): ICD-9-CM Code(s): I60-I69.Rates calculated using July 1 population estimates from the Office of the Governor. Compiled by: Health Council of Southeast Florida, 2015

Bethesda Hospital Community Health Needs Assessment 124 | P a g e
Diabetes Deaths
The table below shows deaths from diabetes in Palm Beach and Florida from 1994 to 2013. The American Diabetes
Association released data on June 10, 2014 reflecting that diabetes as the 7th leading cause of death in the United
States.28 The rate has fluctuated in both areas over the time period shown. In 2013 there were 265 deaths in the
Palm Beach County from diabetes, resulting in an age-adjusted rate of 11.9 per 100,000; the rate in Florida was
significantly higher (19.6 per 100,000).
Table 143: Deaths from Diabetes, Palm Beach County and Florida, 1994- 2013
Palm Beach State
Years Count Rate Count Rate
1994 221 13.9 3,328 18.6
1995 253 15.8 3,652 19.9
1996 277 16.3 3,797 20.2
1997 284 17.5 3,828 19.8
1998 269 14.9 4,018 20.4
1999 310 17.6 4,414 21.9
2000 288 16.0 4,463 21.5
2001 343 18.8 4,583 21.7
2002 305 15.9 4,574 20.9
2003 291 15.0 4,754 21.4
2004 280 14.4 4,790 21.2
2005 341 16.8 5,181 22.2
2006 336 15.8 5,137 21.4
2007 289 13.9 5,092 20.9
2008 282 14.0 5,154 20.7
2009 254 12.3 4,899 19.5
2010 282 13.0 4,992 19.7
2011 252 11.4 5,044 19.6
2012 259 12.1 5,064 19.6
2013 265 11.9 5,209 19.6 Source: FloridaCHARTS, Florida Department of Health, Bureau of Vital Statistics, 2013 Data Note(s): ICD-9-CM Code(s): E10-E14.Rates calculated using July 1 population estimates from the Office of the Governor. Compiled by: Health Council of Southeast Florida, 2015
28 http://www.diabetes.org/diabetes-basics/statistics/?referrer=https://www.google.com/

Bethesda Hospital Community Health Needs Assessment 125 | P a g e
Cancer Deaths
In the United States, cancer is the second leading cause of death, responsible for 1 in 4 deaths. Nearly 14.5 million
Americans with a history of cancer were alive on January 1, 2014. About 1,658,370 new cancer cases are expected
to be diagnosed in 2015.29
Table 144 shows the number and age-adjusted death rate for deaths due to cancer in Palm Beach County and in
Florida for the years 1994-2013. During the time period shown, the rate for Palm Beach County was consistently
lower than the state’s rate.
Table 144: Deaths from Cancer, Palm Beach County and Florida, 1994- 2013
Palm Beach State
Years Count Rate Count Rate
1994 2,996 195.3 36,145 203.5
1995 2,879 181.5 36,866 202.9
1996 2,916 178.5 37,476 200.2
1997 3,151 185.3 37,813 197.6
1998 3,038 173.9 37,783 192.9
1999 3,066 171.0 38,182 190.1
2000 3,111 168.9 38,622 187.8
2001 3,262 176.2 38,835 185.0
2002 3,219 166.4 38,928 178.4
2003 3,147 159.0 39,238 177.5
2004 3,182 159.2 39,502 176.2
2005 3,214 158.6 40,321 174.7
2006 3,092 148.9 40,081 168.6
2007 3,191 152.8 39,790 163.8
2008 3,112 148.4 40,549 164.0
2009 3,234 151.1 40,817 162.9
2010 3,136 142.9 40,883 161.2
2011 3,156 140.5 41,221 159.9
2012 3,208 144.7 41,696 160.3
2013 3,218 140.6 42,350 158.7 Source: FloridaCHARTS, Florida Department of Health, Bureau of Vital Statistics, 2013 Data Note(s): ICD-9-CM Code(s): C00-C97. Rates calculated using July 1 population estimates from the Office of the Governor. Compiled by: Health Council of Southeast Florida, 2015
29 American Cancer Society. (2015). Cancer Facts & Figures 2015. Retrieved from:
http://www.cancer.org/acs/groups/content/@editorial/documents/document/acspc-044552.pdf

Bethesda Hospital Community Health Needs Assessment 126 | P a g e
Deaths Due to AIDS
In the United States, more than 1 million people are currently living with HIV/AIDS. Since the U.S. epidemic began,
an estimated 617,025 people have died of AIDS.30
Table 145 shows deaths due to HIV/AIDS in Palm Beach and Florida in the years 1994 - 2010. Deaths due to
HIV/AIDS in Palm Beach ranged between 64 - 397 deaths per year in the time period shown. In 2013, the rate in
Palm Beach was 4.9 per 100,000 population, slightly higher than the rate in Florida which was 4.5 per 100,000.
Table 145: Deaths from AIDS, Palm Beach County and Florida, 1994- 2013
Palm Beach Florida
Years Count Rate Count Rate
1994 373 41.9 4,142 30.5
1995 397 43.0 4,336 31.1
1996 306 32.2 3,093 21.7
1997 191 19.1 1,879 12.8
1998 135 12.9 1,547 10.3
1999 138 13.2 1,651 10.7
2000 165 15.3 1,809 11.4
2001 147 13.3 1,658 10.3
2002 157 13.8 1,714 10.4
2003 156 13.3 1,742 10.3
2004 175 14.8 1,714 10.0
2005 149 12.3 1,706 9.7
2006 162 12.8 1,746 9.6
2007 118 9.7 1,526 8.3
2008 118 9.3 1,412 7.5
2009 103 8.0 1,232 6.5
2010 64 4.8 1,066 5.4
2011 65 5.0 1,005 5.1
2012 65 4.8 923 4.6
2013 69 4.9 935 4.5 Source: FloridaCHARTS, Florida Department of Health, Bureau of Vital Statistics, 2013 Data Note(s): ICD-10 Code(s): B20-B24. Rates calculated using July 1 population estimates from the Office of the Governor. Compiled by: Health Council of Southeast Florida, 2015
30 www.niaid.nih.gov/topics/HIVAIDS/Understanding/Pages/quickFacts.aspx

Bethesda Hospital Community Health Needs Assessment 127 | P a g e
Unintentional Injury Deaths
According to the National Center for Health Statistics, unintentional injuries are the fourth leading cause of death
overall.31
The table below shows the number and age-adjusted death rate of deaths due to unintentional injuries. In 2013,
there were 634 deaths in the county due to unintentional injuries, an age-adjusted rate of 39.7 per 100,000, which
was slightly higher than the rate in the state.
Table 146: Deaths from Unintentional Injuries, Palm Beach County and Florida, 1994- 2013
Palm Beach Florida
Years Count Rate Count Rate
1994 332 31.1 4,877 33.0
1995 337 31.0 5,122 33.9
1996 392 35.1 5,281 34.0
1997 381 33.3 5,391 34.1
1998 408 33.0 5,731 35.5
1999 444 35.9 5,994 36.1
2000 474 37.7 6,388 37.8
2001 520 41.9 6,872 39.9
2002 556 43.4 7,361 41.6
2003 643 48.6 7,901 43.8
2004 584 43.4 8,176 43.9
2005 608 44.7 8,744 46.1
2006 636 45.6 8,837 45.6
2007 697 50.1 9,020 45.9
2008 638 45.6 8,918 44.6
2009 670 45.7 8,779 43.0
2010 569 37.4 8,644 41.8
2011 521 34.0 8,475 40.2
2012 533 32.6 8,561 39.7
2013 634 39.7 8,534 38.8
Source: FloridaCHARTS, Florida Department of Health, Bureau of Vital Statistics, 2013 Data Note(s): ICD-10 Code(s): V01-X59, Y85-Y86. Rates calculated using July 1 population estimates from the Office of the Governor. Compiled by: Health Council of Southeast Florida, 2015
31 FastStats: Accidents or Unintentional Injuries (Last updated February 6, 2015). Retrieved from http://www.cdc.gov/nchs/fastats/accidental-injury.htm: National
Center for Health Statistics.

Bethesda Hospital Community Health Needs Assessment 128 | P a g e
The table below shows the number, percent and rate of unintentional injuries by injury type for Palm Beach County
and rate of unintentional injuries by injury type for Florida in 2013. Of total unintentional injury deaths, poisoning
accounts for 30.8% and fall accounts for 29%. The death rate due to poisoning in Palm Beach County was higher at
15.3 per 100,000 than that of Florida.
Table 147: Deaths from Unintentional Injuries by Injury Type, Palm Beach County and Florida, 2013
Palm Beach Florida
Deaths Percent Rate Rate
Unintentional Injuries 634 634 39.7 38.8
Poisoning 195 30.8% 15.3 10.6
Drownings 29 4.6% 1.9 1.8
Falls 184 29.0% 7.2 9.4
Fires 1 0.2% - 0.5
Motor Vehicle Crashes 139 21.9% 10.1 12.1 Source: FloridaCHARTS, Florida Department of Health, Bureau of Vital Statistics Data Note(s): Unintentional Injuries ICD-10 Code(s): V01-X59, Y85-Y86. Poisoning ICD-10 Code(s): X40-X49. Drownings ICD-10 Code(s): W65-W74. Falls ICD-10 Code(s): W00-W19. Fires ICD-10 Code(s): X00-X09. Motor Vehicle Crashes ICD-10 Code(s): V02-V04, V09.0, V09.2, V12-V14, V19.0-V19.2, V19.4-V19.6, V20-V79, V80.3-V80.5, V81.0-V81.1, V82.0-V82.1, V83-V86, V87.0-V87.8, V88.0-V88.8, V89.0, V89.2. Rates calculated using July 1 population estimates from the Office of the Governor. Mortality rates are considered unstable if they are based on fewer than 5 events or if the denominator (population at risk) is fewer than 20. Compiled by: Health Council of Southeast Florida, 2015

Bethesda Hospital Community Health Needs Assessment 129 | P a g e
Health Resource Availability and Access
Licensed Facility Overview
Hospitals
Table 148 lists the licensed hospitals in Palm Beach County, their location, the number of licensed beds and profit
status. The Agency for Health Care Administration designates hospitals as ‘not-for-profit’ and ‘for-profit,’ these terms
are often used interchangeably with ‘tax-exempt’ and ‘tax-paying’.
Table 148: Licensed Hospitals, Palm Beach County, as of June, 2015
Name Street City Licensed Beds
Profit Status
BETHESDA HOSPITAL EAST BOYNTON BEACH 401 Not-For-Profit
BETHESDA HOSPITAL WEST BOYNTON BEACH 80 Not-For-Profit
BOCA RATON REGIONAL HOSPITAL BOCA RATON 400 Not-For-Profit
DELRAY MEDICAL CENTER DELRAY BEACH 493 For-Profit
GOOD SAMARITAN MEDICAL CENTER WEST PALM BEACH 333 For-Profit
JFK MEDICAL CENTER ATLANTIS 460 For-Profit
JUPITER MEDICAL CENTER JUPITER 207 Not-For-Profit
KINDRED HOSPITAL THE PALM BEACHES RIVIERA BEACH 70 For-Profit
LAKESIDE MEDICAL CENTER BELLE GLADE 70 Not-For-Profit
PALM BEACH GARDENS MEDICAL CENTER PALM BEACH GARDENS 199 For-Profit
PALMS WEST HOSPITAL LOXAHATCHEE 204 For-Profit
SELECT SPECIALTY HOSPITAL- PALM BEACH LAKE WORTH 60 For-Profit
ST MARY'S MEDICAL CENTER WEST PALM BEACH 464 For-Profit
THE JEROME GOLDEN CENTER FOR BEHAVIORAL HEALTH INC WEST PALM BEACH 44 Not-For-Profit
WELLINGTON REGIONAL MEDICAL CENTER WELLINGTON 233 For-Profit
WEST BOCA MEDICAL CENTER BOCA RATON 195 For-Profit
WEST PALM HOSPITAL WEST PALM BEACH 245 For-Profit Source: FlorideHealthFinder, Agency for Health Care Administration, 2015 Compiled By: Health Council of Southeast Florida, 2015

Bethesda Hospital Community Health Needs Assessment 130 | P a g e
Nursing Homes
Table 149 lists licensed nursing homes in Palm Beach, their location, number of licensed beds and not-for profit or
profit status. According to the Agency for Health Care Administration (AHCA), there are 55 nursing homes in Palm
Beach County with a total of 6,337 licensed nursing home beds.
Table 149: Licensed Nursing Homes, Palm Beach County, as of June, 2015
Name Street City Licensed Beds Profit Status
ABBEY DELRAY DELRAY BEACH 100 Not-For-Profit
ABBEY DELRAY SOUTH DELRAY BEACH 90 Not-For-Profit
AVANTE AT BOCA RATON INC. BOCA RATON 144 For-Profit
AVANTE AT LAKE WORTH INC. LAKE WORTH 138 For-Profit
BARRINGTON TERRACE OF BOYNTON BEACH BOYNTON BEACH 29 For-Profit
BOCA RATON REHABILITATION CENTER BOCA RATON 120 Not-For-Profit
BOULEVARD REHABILITATION CENTER BOYNTON BEACH 167 For-Profit
BOYNTON BEACH REHABILITATION CENTER BOYNTON BEACH 168 For-Profit
BOYNTON HEALTH CARE CENTER BOYNTON BEACH 81 For-Profit
CHATSWORTH AT PGA NATIONAL LLC PALM BEACH GARDENS 76 For-Profit
CONSULATE HEALTH CARE OF WEST PALM BEACH WEST PALM BCH 120 For-Profit
CORAL BAY HEALTHCARE AND REHABILITATION WEST PALM BEACH 120 For-Profit
COURTYARD GARDENS REHABILITATION CENTER LLC JUPITER 120 For-Profit
CROSSINGS THE LAKE WORTH 60 For-Profit
DARCY HALL OF LIFE CARE WEST PALM BEACH 220 For-Profit
EDWARD J HEALEY REHABILITATION AND NURSING CENTER RIVIERA BEACH 120 Not-For-Profit
FOUNTAINS NURSING HOME INC THE BOCA RATON 51 For-Profit
GARDENS COURT THE PALM BEACH GARDENS 120 For-Profit
GLADES HEALTH CARE CENTER PAHOKEE 120 Not-For-Profit
HAMLIN PLACE LANTANA 120 Not-For-Profit
HARBOUR'S EDGE DELRAY BEACH 54 Not-For-Profit
HEARTLAND HEALTH CARE AND REHABILITATION CENTER OF BOCA RATON BOCA RATON 120 For-Profit
HEARTLAND HEALTH CARE CENTER BOYNTON BEACH BOYNTON BEACH 120 For-Profit
HEARTLAND HEALTH CARE CENTER PROSPERITY OAKS PALM BEACH GARDENS 120 For-Profit
JOSEPH L MORSE GERIATRIC CENTER INC WEST PALM BEACH 310 Not-For-Profit
JUPITER MEDICAL CENTER PAVILION INC. JUPITER 120 Not-For-Profit
LAKE VIEW CARE CENTER AT DELRAY DELRAY BEACH 120 For-Profit
LAKESIDE HEALTH CENTER WEST PALM BEACH 107 For-Profit
LOURDES-NOREEN MCKEEN RESIDENCE FOR GERIATRIC CARE INC. WEST PALM BEACH 132 Not-For-Profit
MANORCARE HEALTH SERVICES DELRAY BEACH 120 For-Profit
MANORCARE HEALTH SERVICES BOCA RATON 180 For-Profit
MANORCARE HEALTH SERVICES BOYNTON BEACH BOYNTON BEACH 180 For-Profit
MANORCARE HEALTH SERVICES WEST PALM BEACH WEST PALM BEACH 120 For-Profit
MEDICANA NURSING AND REHAB CENTER LAKE WORTH 117 For-Profit

Bethesda Hospital Community Health Needs Assessment 131 | P a g e
MENORAH HOUSE BOCA RATON 120 For-Profit
NORTH LAKE REHABILITATION AND HEALTH CENTER LAKE PARK 85 For-Profit
NURSING CENTER AT LA POSADA THE PALM BEACH GARDENS 40 For-Profit
NuVISTA LIVING AT WELLINGTON GREEN WELLINGTON 120 For-Profit
OASIS HEALTH AND REHABILITATION CENTER LAKE WORTH 120 For-Profit
PALM GARDEN OF WEST PALM BEACH WEST PALM BEACH 176 For-Profit
REGENTS PARK NURSING & REHABILITATION CENTER BOCA RATON 180 For-Profit
REHABILITATION CENTER OF THE PALM BEACHES THE WEST PALM BEACH 99 Not-For-Profit
RENAISSANCE HEALTH and REHABILITATION WEST PALM BEACH 120 For-Profit
ROYAL PALM BEACH HEALTH AND REHABILITATION CENTER ROYAL PALM BEACH 120 For-Profit
SAVANNAH COVE WEST PALM BEACH 30 For-Profit
SIGNATURE HEALTHCARE OF PALM BEACH LAKE WORTH 120 For-Profit
STRATFORD COURT OF BOCA RATON BOCA RATON 60 For-Profit
TERRACES OF LAKE WORTH REHABILITATION AND HEALTH CENTER LAKE WORTH 99 For-Profit
VI AT LAKESIDE VILLAGE LANTANA 60 For-Profit
VILLAGE ON HIGH RIDGE THE LAKE WORTH 60 Not-For-Profit
WATERFORD THE JUNO BEACH 60 Not-For-Profit
WHITEHALL BOCA RATON BOCA RATON 154 For-Profit
WILLOWBROOKE COURT AT EDGEWATER POINTE ESTATES BOCA RATON 101 Not-For-Profit
WILLOWBROOKE COURT AT ST ANDREWS ESTATES BOCA RATON 89 Not-For-Profit
WOOD LAKE HEALTH AND REHABILITATION CENTER WEST PALM BEACH 120 For-Profit Source: FlorideHealthFinder, Agency for Health Care Administration, 2015 Compiled By: Health Council of Southeast Florida, 2015

Bethesda Hospital Community Health Needs Assessment 132 | P a g e
Health Care Provider Supply
Physicians
The table below shows the number of physicians in the county increased from 2,250 in fiscal year 2002-03 to 4,369
in fiscal year 2013-14. The number of physicians per 100,000 individuals was higher in Palm Beach (323.6) than in
Florida (275.7). This data does not detail whether the physician is actively practicing medicine in the county and is
not an accurate representation of supply or a proxy measure for access to care.
Table 150: Total Licensed Florida Physicians, Palm Beach County and Florida, 2002- 2014
Palm Beach Florida
Year Count Rate Count Rate
FY 02-03 2,250 188.8 27,595 165.1
FY 03-04 2,641 215.8 32,220 188.7
FY 04-05 3,096 246.6 37,267 213.2
FY 05-06 3,229 252.5 38,834 217.2
FY 06-07 3,248 250.9 39,852 218.5
FY 07-08 3,347 256.6 40,815 220.6
FY 08-09 3,518 268.8 42,307 227.0
FY 09-10 3,549 270.1 42,572 227.5
FY 10-11 4,075 308.6 48,098 255.6
FY 11-12 4,165 313.8 49,270 260.2
FY 12-13 4,277 320.8 50,586 265.6
FY 13-14 4,369 323.6 53,259 275.7
Source: FloridaCHARTS, Florida Department of Health, Division of Medical Quality Assurance, 2014 Data Note(s): Licensure data is for a fiscal year (July 1-June 30). Data includes actively licensed providers only. Rates calculated using July 1 population estimates from the Office of the Governor Compiled by: Health Council of Southeast Florida, 2015
Nurses
As of June 2015, there were 16,937 licensed Registered Nurses with an ‘address of record’ in Palm Beach County
according the Florida Department of Health license verification database. As with physicians, this number is not
necessarily indicative of the number of nurses who are actively practicing in the county and is not an accurate
representation of supply or a proxy measure for access to care.

Bethesda Hospital Community Health Needs Assessment 133 | P a g e
Dentists
Table 151 shows the number and rate per 100,000 of licensed dentists in Palm Beach and Florida. In the fiscal year
2013-14 there were 975 licensed dentists in Palm Beach County; a rate of 72.2 per 100,000. This rate was higher
than the state’s rate of 53.8 per 100,000. Similar to physicians and nurses, this number is not necessarily indicative
of the number of dentists who are actively practicing in the county and is not an accurate representation of supply or
a proxy measure for access to care.
Table 151: Total Licensed Dentists, Palm Beach County and Florida, 2002- 2014
Palm Beach Florida
Year Count Rate Count Rate
FY 02-03 718 60.2 6,974 41.7
FY 03-04 877 71.7 8,750 51.2
FY 04-05 931 74.1 9,212 52.7
FY 05-06 935 73.1 9,214 51.5
FY 06-07 924 71.4 9,605 52.7
FY 07-08 924 70.8 9,574 51.7
FY 08-09 940 71.8 9,845 52.8
FY 09-10 985 75.0 9,860 52.7
FY 10-11 975 73.8 10,048 53.4
FY 11-12 1,016 76.5 10,118 53.4
FY 12-13 1,050 78.8 10,443 54.8
FY 13-14 975 72.2 10,396 53.8
Source: FloridaCHARTS, Florida Department of Health, Division of Medical Quality Assurance, 2014 Data Note(s): Licensure data is for a fiscal year (July 1-June 30). Data includes actively licensed providers only. Rates calculated using July 1 population estimates from the Office of the Governor Compiled by: Health Council of Southeast Florida, 2015

Bethesda Hospital Community Health Needs Assessment 134 | P a g e
Federal Health Professional Shortage Areas (HPSA)
Health Professional Shortage Areas (HPSAs) are areas, populations or institutions designated by the Health
Resources and Services Administration (HRSA) to have shortages of primary medical care, dental or mental health
providers. HPSA designations are based on several criteria including: a rational need for services, a provider to
population ratio that falls below a set criteria, and an occurrence of current health providers being over-utilized,
inaccessible or excessively distant.
“HPSA scores range from 1 to 25 for primary care and mental health, 1 to 26 for dental. The higher the score, the
greater the priority. All Federally Qualified Health Centers and those Rural Health Clinics that provide access to care
regardless of ability to pay receive automatic facility HPSA designation. These facilities may have a HPSA score of
0”.32
Primary Care – Palm Beach County
There are three different types of primary care HPSA designations: geographic area, population group and facilities,
each with its own criteria for designation. More information regarding criteria can be accessed on HRSA’s website.
Table 152 shows the primary health professional shortage areas in Palm Beach County.
Table 152: Primary Care Health Professional Shortage Areas, Palm Beach County, as of June, 2015
HPSA Name ID Type FTE Score
Florida Community Health Centers, Inc. 112999124W Comprehensive Health Center
1 15
Genesis Community Health 11299912AX Comprehensive Health Center
0 18
Health Care District of Palm Beach County 1129991217 Comprehensive Health Center
0 17
FoundCare Health Center 11299912AD Comprehensive Health Center
0 15
Low Income - Delray Beach 112999120Q Population
Group 5 8
C.T. 0065.01, C.T. 0065.02, C.T. 0066.04, C.T. 0066.05, C.T. 0067.00, C.T. 0068.01, C.T. 0068.02, C.T. 0069.07, C.T. 0069.08, C.T. 0069.09, C.T. 0069.10
Census Tract
Low Income - Lantana/Lake Worth 112999120U Population
Group 8 10
C.T. 0036.00, C.T. 0037.00, C.T. 0044.01, C.T. 0044.02, C.T. 0045.00, C.T. 0046.01, C.T. 0046.02, C.T. 0049.03, C.T. 0049.04, C.T. 0050.00, C.T. 0051.01, C.T. 0021.02, C.T. 0052.02, C.T. 0052.03, C.T. 0052.04, C.T. 0055.01, C.T. 0055.02
Census Tract
Low Income - Boynton Beach 112999121T Population
Group 1 16
C.T. 0056.01, C.T. 0056.01, C.T. 0057.01, C.T. 0057.02, C.T. 0061.00, C.T. 0062.01, C.T. 0062.03
Census Tract
Low Income - West Palm Beach 112999123C Population
Group 24 11
C.T. 0010.02, C.T. 0010.04, C.T. 0011.01, C.T. 0012.00, C.T. 0013.01, C.T. 0013.02, C.T. 0014.02, C.T. 0014.03, C.T. 0014.04, C.T. 0015.00, C.T. 0016.00, C.T. 0017.00, C.T. 0018.01, C.T. 0018.02, C.T. 0019.04,
Census Tract
32 Health Resource and Service Administration

Bethesda Hospital Community Health Needs Assessment 135 | P a g e
C.T. 0019.07, C.T. 0019.07, C.T. 0019.09, C.T. 0019.10, C.T. 0019.11, C.T. 0019.12, C.T. 0019.13, C.T. 0019.14, C.T. 0019.15, C.T. 0019.16, C.T. 0019.17, C.T. 0020.05, C.T. 0020.06, C.T. 0021.00, C.T. 0022.00, C.T. 0023.00, C.T. 0024.00, C.T. 0026.00, C.T. 0027.00, C.T. 0028.00, C.T. 0029.00, C.T. 0030.00, C.T. 0031.01, C.T. 0031.02, C.T. 0032.01, C.T. 0032.02, C.T. 0033.00, C.T. 0034.00, C.T. 0038.00, C.T. 0039.01, C.T. 0039.02, C.T. 0040.05, C.T. 0040.07, C.T. 0040.08, C.T. 0040.09, C.T. 0040.10, C.T. 0040.11, C.T. 0041.01, C.T. 0041.02, C.T. 0042.01, C.T. 0042.02, C.T. 0042.03, C.T. 0043.00, C.T. 0078.32, C.T. 0078.33, C.T. 009805
Low Income - Greenacres 112999124T Population
Group 0 16
C.T. 0040.12, C.T. 0040.13, C.T. 0047.02, C.T. 0047.04, C.T. 0047.05, C.T. 0047.06, C.T. 0048.12, C.T. 0048.13, C.T. 0048.17, C.T. 0048.18, C.T. 0048.19
Census Tract
Low Income - Boca Raton 112999124U Population
Group 0 17
C.T. 0072.03, C.T. 0075.01, C.T. 0076.02 Census Tract
Low Income/Migrant Farmworker - Belle Glade-Pahokee-Palm Beach 1129991267 Population
Group 7 9
C.T. 0080.01, C.T. 0080.02, C.T. 0081.01, C.T. 0081.02, C.T. 0082.01, C.T. 0082.02, C.T. 0082.03, C.T. 0083.01, C.T. 0083.02, C.T. 009901
Census Tract
South Bay Correctional Facility 11299912AE Correctional
Facility 9
Source: US Department of Health and Human Services, Health Resources and Service Administration, 2015 NOTE: Below are lists of designated HPSAs that reflect the publication of the Federal Register notice on June 25, 2014. This Federal Register notice reflects the status of HPSAs as of May 23, 2014. The main impact of this Federal Register publication will be to officially withdraw those HPSAs that have been in "proposed for withdrawal" status since the last Federal Register notice was published on June 27, 2013. HPSAs that have been placed in “proposed for withdrawal” status since May 23, 2014 will remain in that status until the publication of the next Federal Register notice. If there are any questions about the status of a particular HPSA or area, we recommend that you contact the state primary care office in your state; a listing can be obtained at http://bhpr.hrsa.gov/shortage/hpsas/primarycareoffices.html. Notes: Satellite sites of Comprehensive Health Centers automatically assume the HPSA score of the affiliated grantee. They are not listed separately. Compiled by: Health Council of Southeast Florida, 2015

Bethesda Hospital Community Health Needs Assessment 136 | P a g e
Dental Care – Palm Beach County
There are three different types of dental health care HPSA designations: geographic area, population group, and
facilities, each with its own criteria for designation.
Table 153 shows the dental health professional shortage areas in Palm Beach County.
Table 153: Dental Care Health Professional Shortage Areas, Palm Beach County, as of June, 2015
HPSA Name ID Type FTE Score
Florida Community Health Centers, Inc. 612999123C Comprehensive Health Center
13
Genesis Community Health 61299912PH Comprehensive Health Center
0 19
Foundcare Health Center 61299912OX Comprehensive Health Center
0 23
Health Care District of Palm Beach County 612999120I Comprehensive Health Center
0 20
Low Income - West Palm Beach 6129991245 Population
Group 3 13
C.T. 0010.02, C.T. 0010.04, C.T. 0011.01, C.T. 0012.00, C.T. 0013.01, C.T. 0013.02, C.T. 0014.02, C.T. 0014.03, C.T. 0014.04, C.T. 0015.00, C.T. 0016.00, C.T. 0017.00, C.T. 0018.01, C.T. 0018.02, C.T. 0019.02, C.T. 0019.04, C.T. 0019.07, C.T. 0019.08, C.T. 0019.09, C.T. 0019.10, C.T. 0019.11, C.T. 0019.12, C.T. 0019.13, C.T. 0019.14, C.T. 0019.15, C.T. 0019.16, C.T. 0019.17, C.T. 0020.05, C.T. 0020.06, C.T. 0021.00, C.T. 0022.00, C.T. 0023.00, C.T. 0024.00, C.T. 0026.00, C.T. 0027.00, C.T. 0028.00, C.T. 0029.00, C.T. 0030.00, C.T. 0031.01, C.T. 0031.02, C.T. 0032.01, C.T. 0032.02, C.T. 0033.00, C.T. 0034.00, C.T. 0038.00, C.T. 0039.01, C.T. 0039.02, C.T. 0040.05, C.T. 0040.07, C.T. 0040.08, C.T. 0040.09, C.T. 0040.10, C.T. 0040.11, C.T. 0041.01, C.T. 0041.02, C.T. 0042.01, C.T. 0042.02, C.T. 0042.03, C.T. 0043.00, C.T. 0078.32, C.T. 0078.33, C.T. 009805
Census Tract
Low Income/Migrant Farmworker - Belle Glade/Pahokee 6129991296 Population
Group 4 17
C.T. 0080.01, C.T. 0080.02, C.T. 0081.01, C.T. 0081.02, C.T. 0082.01, C.T. 0082.02, C.T. 0082.03, C.T. 0083.01, C.T. 0083.02
Census Tract
South Bay Correctional Facility 61299912P2 Correctional
Facility 6
Source: US Department of Health and Human Services, Health Resources and Service Administration, 2015 NOTE: Below are lists of designated HPSAs that reflect the publication of the Federal Register notice on June 25, 2014. This Federal Register notice reflects the status of HPSAs as of May 23, 2014. The main impact of this Federal Register publication will be to officially withdraw those HPSAs that have been in "proposed for withdrawal" status since the last Federal Register notice was published on June 27, 2013. HPSAs that have been placed in “proposed for withdrawal” status since May 23, 2014 will remain in that status until the publication of the next Federal Register notice. If there are any questions about the status of a particular HPSA or area, we recommend that you contact the state primary care office in your state; a listing can be obtained at http://bhpr.hrsa.gov/shortage/hpsas/primarycareoffices.html. Notes: Satellite sites of Comprehensive Health Centers automatically assume the HPSA score of the affiliated grantee. They are not listed separately. Compiled by: Health Council of Southeast Florida, 2015

Bethesda Hospital Community Health Needs Assessment 137 | P a g e
Mental Health Care – Palm Beach County
There are three different types of mental health care HPSA designations: geographic area, population group and
facilities, each with its own criteria for designation. More information regarding criterion can be accessed on HRSA’s
website.
Table 154 shows the mental health care health professional shortage areas in Palm Beach County.
Table 154: Mental Health Care Health Professional Shortage Areas, Palm Beach County, as of June, 2015
HPSA Name ID Type FTE Score
Genesis Community Health 71299912A0 Comprehensive Health Center
0 19
Florida Community Health Centers, Inc. 7129991295 Comprehensive Health Center
14
Foundcare Health Center 712999129A Comprehensive Health Center
0 16
Health Care District of Palm Beach County 7129991205 Comprehensive Health Center
0 17
Belle Glade/Pahokee 712999122Y Geographical
Area 1 16
Belle Glade-Pahokee CCD Minor Civil
Division
Source: US Department of Health and Human Services, Health Resources and Service Administration, 2015 NOTE: Below are lists of designated HPSAs that reflect the publication of the Federal Register notice on June 25, 2014. This Federal Register notice reflects the status of HPSAs as of May 23, 2014. The main impact of this Federal Register publication will be to officially withdraw those HPSAs that have been in "proposed for withdrawal" status since the last Federal Register notice was published on June 27, 2013. HPSAs that have been placed in “proposed for withdrawal” status since May 23, 2014 will remain in that status until the publication of the next Federal Register notice. If there are any questions about the status of a particular HPSA or area, we recommend that you contact the state primary care office in your state; a listing can be obtained at http://bhpr.hrsa.gov/shortage/hpsas/primarycareoffices.html. Notes: Satellite sites of Comprehensive Health Centers automatically assume the HPSA score of the affiliated grantee. They are not listed separately. Compiled by: Health Council of Southeast Florida, 2015

Bethesda Hospital Community Health Needs Assessment 138 | P a g e
Medically Underserved Areas (MUAs)/Populations (MUPs)
Medically Underserved Areas (MUAs)/Populations (MUPs) are designated by the Health Resources Service
Administration (HRSA) as areas or populations having: too few primary care providers, high infant mortality, high
poverty and/or high elderly population. An Index of Medical Underservice (IMU) uses weighted values for different
factors to determine the score.
Medically Underserved Populations (MUPs) are comprised of groups of individuals who face economic, cultural or
linguistic barriers to health care. Medically Underserved Areas (MUAs) are a whole county or a group of contiguous
counties, a group of county or civil divisions or a group of urban census tracts in which residents have a shortage of
personal health services. 33
Table 155 shows the MUPs and MUAs in Palm Beach County.
Table 155: Medically Underserved Populations and Areas, Palm Beach County, June 2015
Name ID# Type Score Designation
Date Update
Date
Low Inc. - Boynton Beach 570 MUP 56.2 9/4/2002 5/22/2007
CT 0061.00
Low Inc. - West Palm Beach 7064 MUP 59.9 6/22/2001
CT 0022.00
Low Inc. - Greenacres 7245 MUP 47.5 7/25/2002 10/5/2007
CT 0040.12
Low Inc. - Boca Raton 7246 MUP 57.8 7/26/2002 5/29/2007
CT 0072.03
Low Inc. - Delray Beach 7279 MUP 46.7 8/28/2002
CT 0065.02
Low Inc. - Lantana/ Lake Worth 7280 MUP 58.9 8/28/2002
CT 0055.01
Low Inc./ M F W - Belle Glade/ Pahokee 7531 MUP 53.6 5/11/1994 3/23/2006
CT 0082.03
Low Income - Jupiter 7817 MUP 61.2 4/15/2011
CT 0002.06 Source: US Department of Health and Human Services, Health Resources and Services Administration, 2015 Compiled by: Health Council of Southeast Florida, 2015
33 Health Resources and Services Administration

Bethesda Hospital Community Health Needs Assessment 139 | P a g e
Health Insurance
Uninsured
The table below shows the number and percent of uninsured individuals in Palm Beach County and in Florida in 2013
by age bracket and gender. In 2013 there were 268,619 uninsured individuals in the county, representing 19.7% of
the total population; this rate was a bit lower than the percent uninsured in the state as a whole, 20.0%. Over 29% of
individuals ages 18-64 were uninsured and in the under 18 year age group, 12.3% were without health insurance
coverage. The percent uninsured are similar in Palm Beach and Florida.
Table 156: Uninsured by Age and Sex, Palm Beach County and Florida, 2013
Palm Beach Florida
Total Number Uninsured Percent Uninsured Percent Uninsured
Total civilian noninstitutionalized population
1,360,633 268,619 19.7% 20.0%
AGE
Under 18 years 270,230 33,233 12.3% 11.1%
18 to 64 years 786,854 229,633 29.2% 28.8%
65 years and older 303,549 5,753 1.9% 1.7%
SEX
Male 657,276 142,075 21.6% 21.8%
Female 703,357 126,544 18.0% 18.3% Source: US Census Bureau, American Community Survey, 2013 Compiled by: Health Council of Southeast Florida, 2015

Bethesda Hospital Community Health Needs Assessment 140 | P a g e
The table below shows the number and percent of insured and uninsured individuals in Bethesda Hospital’s primary
service area in 2013 by ZIP Code. In 2013, Boynton Beach, ZIP Code 33473 had the highest percent (93.7%) of
individuals with insurance coverage. Lake Worth, ZIP Code 33460 had the highest percent (39.9%) of uninsured
individuals for Bethesda Hospital’s primary service area in 2013. Over the primary service area, Lake Worth ZIP
Codes (33460, 33461, 33462 and 33463) had significantly higher percentages of uninsured individuals.
Table 157: Health Insurance Coverage, Bethesda Hospital Primary Service Area ZIP Codes, 2013
ZIP Code Civilian
noninstitutionalized population
With health insurance coverage
No health insurance coverage
33414 54,449 86.1% 13.9%
33426 20,057 85.6% 14.4%
33435 33,098 72.7% 27.3%
33436 42,284 81.9% 18.1%
33437 36,868 89.8% 10.2%
33444 21,356 69.1% 30.9%
33445 29,892 80.0% 20.0%
33446 22,112 92.7% 7.3%
33449 10,223 89.1% 10.9%
33460 30,863 60.1% 39.9%
33461 41,007 61.9% 38.1%
33462 31,938 72.6% 27.4%
33463 56,751 69.3% 30.7%
33467 51,594 89.1% 10.9%
33472 19,542 88.0% 12.0%
33473 6,098 93.7% 6.3%
33484 23,736 89.1% 10.9% Source: U.S. Census American Community Survey (ACS), 2013 Compiled by: Health Council of Southeast Florida, 2015

Bethesda Hospital Community Health Needs Assessment 141 | P a g e
The table below shows the number and percent of insured and uninsured individuals in Bethesda Hospital’s
secondary service area in 2013 by ZIP Code. In 2013, Boca Raton, ZIP Code 33496 had the highest percent
(92.6%) of individuals with insurance coverage in the secondary service area. Greenacres, ZIP Code 33415 had the
highest percent (35.5%) of uninsured individuals for Bethesda Hospital’s secondary service area in 2013.
Table 158: Health Insurance Coverage, Bethesda Hospital Secondary Service Area ZIP Codes, 2013
ZIP Code Civilian
noninstitutionalized population
With health insurance coverage
No health insurance coverage
33405 21,049 66.0% 34.0%
33406 24,857 70.6% 29.4%
33413 14,661 67.1% 32.9%
33415 44,257 64.5% 35.5%
33428 38,810 76.9% 23.1%
33431 17,955 85.2% 14.8%
33432 18,970 84.1% 15.9%
33433 42,383 84.6% 15.4%
33434 19,725 91.5% 8.5%
33483 12,102 86.0% 14.0%
33486 21,953 85.4% 14.6%
33487 17,332 88.7% 11.3%
33496 22,322 92.9% 7.1%
33498 14,582 91.1% 8.9% Source: U.S. Census American Community Survey (ACS), 2013 Compiled by: Health Council of Southeast Florida, 2015

Bethesda Hospital Community Health Needs Assessment 142 | P a g e
Table 159 shows the number and percent of uninsured individuals, by race/ethnicity and place of birth, in Palm
Beach and Florida. In Palm Beach County, the number of uninsured Black individuals (27.3%) was higher than the
percentage of uninsured White individuals. The percentage of Hispanic or Latino individuals uninsured was 36.8%
compared to 11.2% of ‘White alone, not Hispanic or Latino’. In Palm Beach, 40.0% of foreign born individuals in the
county were uninsured compared to the 13.4% who were native born.
Table 159: Uninsured by Race/Ethnicity and Place of Birth, Palm Beach County and Florida, 2013
Palm Beach Florida
Total Number
Uninsured Percent
Uninsured Percent
Uninsured
RACE AND HISPANIC OR LATINO ORIGIN
One Race N N N 20.0%
White alone 1,014,570 170,761 16.8% 18.6%
Black or African American alone 243,793 66,438 27.3% 24.0%
American Indian and Alaska Native alone 2,609 1,618 62.0% 31.8%
Asian alone 33,254 6,821 20.5% 21.6%
Native Hawaiian and Other Pacific Islander alone
N N N 20.9%
Some other race alone 32,561 13,732 42.2% 36.9%
Two or more races 33,694 9,097 27.0% 19.5%
White alone, not Hispanic or Latino 787,883 88,613 11.2% 14.2%
Hispanic or Latino (of any race) 276,360 101,663 36.8% 31.3%
PLACE OF BIRTH/U.S. CITIZENSHIP STATUS
Native born 1,034,398 138,244 13.4% 15.9%
Foreign born 326,235 130,375 40.0% 36.8%
Naturalized 160,039 33,514 20.9% 22.2%
Not a citizen 166,196 96,861 58.3% 53.5% Source: US Census Bureau, American Community Survey, 2013 Compiled by: Health Council of Southeast Florida, 2015

Bethesda Hospital Community Health Needs Assessment 143 | P a g e
Florida KidCare
Florida KidCare is health insurance offered by the state of Florida for individuals up to 18 years. The four parts of
Florida KidCare for which one may be eligible are: MediKids, Healthy Kids, Children’s Medical Services Network and
Medicaid. MediKids covers children ages 1 through 4; Healthy Kids covers children ages 5 through 18; Children’s
Medical Services Network through KidCare covers clinically eligible children with special health care needs from birth
through 18; and Medicaid covers children birth through 18. To qualify for premium assistance, a child must: be under
the age of 19, be uninsured, meet income eligibility requirements based on household size and income, be a U.S.
citizen or qualified non-citizen, not be eligible for Medicaid and not be in a public institution. Those children who are
eligible for premium assistance can buy MediKids or Healthy Kids at the “Full pay” premium rate.34
Table 160 shows the percentage of children under 5 covered by KidCare. The percentage enrolled in Palm Beach
(3.1%) is slightly higher than the percentage in Florida (2.9%).
Table 160: KidCare Medicaid Enrollment, Title XIX, Palm Beach County and Florida, 2004- 2013
Palm Beach Florida
Year Count Rate (%) Count Rate (%)
2004 2,780 3.8% 35,348 3.3%
2005 1,703 2.4% 22,249 2.1%
2006 1,306 1.8% 16,827 1.5%
2007 1,674 2.3% 22,916 2.1%
2008 2,163 2.9% 29,901 2.6%
2009 1,647 2.2% 23,873 2.1%
2010 2,435 3.5% 33,495 3.2%
2011 2,465 3.5% 35,019 3.3%
2012 2,318 3.2% 34,045 3.2%
2013 2,205 3.1% 31,904 2.9% Source: FloridaCHARTS, Agency for Health Care Administration (AHCA), 2013 Compiled by: Health Council of Southeast Florida, 2015
34 www.floridakidcare.org

Bethesda Hospital Community Health Needs Assessment 144 | P a g e
Medicaid
Medicaid is a federally and state funded health program in the United States that provides health services to low
income individuals and families.
The table below shows the median monthly Medicaid enrollment in Palm Beach County and in Florida for the years
1998-2013. In 2013, the median monthly enrollment in the county was 198,730, a rate of 14,719.9 per 100,000. As
seen in Table 173, Medicaid enrollment increased significantly in both Palm Beach and in Florida over the 1998 to
2013 time period. It is important to note that median monthly Medicaid enrollment includes those individuals enrolled
in the Medically Needy program. Individuals enrolled in the Medically Needy Program have income or assets that
exceed the limits for regular Medicaid. In the program, a certain amount of medical bills must be incurred each month
before Medicaid is approved.35
Table 161: Median Monthly Medicaid Enrollment, Palm Beach County and Florida, 1998- 2013
Year Palm Beach Florida
Count Rate Count Rate
1998 69,769 6,475.5 1,479,753 9,665.3
1999 76,287 6,891.0 1,620,062 10,332.3
2000 87,801 7,718.6 1,846,013 11,483.8
2001 97,102 8,348.4 1,964,514 11,989.8
2002 107,935 9,055.3 2,102,401 12,575.6
2003 106,952 8,740.2 2,056,610 12,045.0
2004 94,776 7,547.7 2,144,415 12,270.3
2005 111,227 8,697.7 2,216,268 12,397.5
2006 111,161 8,585.2 2,186,843 11,990.9
2007 106,555 8,170.1 2,109,988 11,404.8
2008 136,060 10,396.3 2,637,603 14,152.6
2009 139,313 10,603.4 2,678,520 14,314.6
2010 163,003 12,345.8 2,995,439 15,916.0
2011 173,243 13,052.2 3,128,693 16,524.1
2013 198,730 14,719.9 3,611,417 18,693.7 Source: FloridaCHARTS, Agency for Health Care Administration (AHCA), 2013 Data Note: The median enrollment in Medicaid is the number where, over 12 months of enrollment, half are more than this number median and half are below this number. Compiled by: Health Council of Southeast Florida, 2015
35 http://www.myflfamilies.com/service-programs/access-florida-food-medical-assistance-cash/medicaid

Bethesda Hospital Community Health Needs Assessment 145 | P a g e
Safety Net
Safety net providers are generally non-profit, consumer directed health care centers whose mission is to provide high
quality, cost-effective and comprehensive primary and preventive care to medically underserved and uninsured
people. These organizations serve low income, working families, the uninsured and other high risk populations, such
as homeless, migrant farm workers, isolated rural families, poor women, children and the elderly.
These centers have chosen to focus on wellness and prevention, which are key to cost savings in a health care
system. Through innovative approaches and interventions in community outreach, patient education and prevention,
these health centers also strive to teach their patients to take responsibility for their own health.
Federally Qualified Health Centers (FQHC) and Federally Qualified Health Center Look-Alikes (FQHC Look-Alikes)
are supported by the Health Resources and Service Administration (HRSA) and aim to provide primary health care
services to underserved and vulnerable populations. The health centers serve populations with limited access to
health care including: low income populations, the uninsured, individuals with language barriers, migrant and
seasonal farmworkers, the homeless, and individuals living in public housing.36 FQHCs and FQHC Look-Alikes may
include community health centers, migrant health centers, Healthcare for the Homeless programs, and public
housing primary care programs. These clinics provide health services at sliding scale fees based on household
income and size. These organizations play an instrumental role in filling critical gaps in health care.
36 www.bphc.hrsa.gov

Bethesda Hospital Community Health Needs Assessment 146 | P a g e
Federally Qualified Health Centers, Federally Qualified Health Center Look-Alikes
Table 162 shows the Federally Qualifies Health Centers (FQHC) and Federally Qualified Health Center Look-Alikes
(FQHC Look Alikes) in Palm Beach County.
Table 162: Federally Qualified Health Centers, Federally Qualified Health Center Look-Alikes, Palm Beach County, as of June 2015
Facility Location Type Setting
C.L. Brumback Primary Care Clinic, Golden Center
Permanent Urban 1041 45th Street, West Palm Beach, FL 33407
C.L. Brumback Primary Care Clinic- Belle Glade- Administrative Site Only
Permanent Rural 38754 State Road 80, Belle Glade, FL 33430
C.L. Brumback Primary Care Clinic- Delray
Permanent Urban 225 S Congress Avenue, Delray Beach, F L33445
C.L. Brumback Primary Care Clinic- Lantana
Permanent Urban 1250 Southwinds Drive, Lantana, FL 33462
C.L. Brumback Primary Care Clinic- West Palm Beach
Permanent Urban 1150 45th Street, West Palm Beach, FL 33407
C.L. Brumback Primary Care Clinic- Lewis Center
Permanent Urban 1000 45th Street, West Palm Beach, FL 33407
Florida CHC's Inc.- Administrative Site Only
Permanent Urban 4450 S Tiffany Drive, West Palm Beach, FL 33407
FoundCare Health Center
Permanent Urban 2330 S Congress Avenue, West Palm Beach, FL 33406
Genesis Community Health
Permanent Urban 2815 S Seacrest Blvd, Boynton Beach, FL 33435
Genesis Community Health, Inc.- Administrative Site Only
Permanent Urban 2623 S Seacrest Blvd, Suite 65, Boynton Beach, FL 33435
HCD Belle Glade Primary Car Clinic
Permanent Rural 941 SE 1st Street, Belle Glade, FL 33430
HCD RAMS Clinic
Permanent Urban 3505 Shiloh Drive, West Palm Beach, FL 33407
Pahokee Community Health Center
Permanent Rural 170 S Barfield Hwy, Suite 103, Pahokee, FL 33476
Data Source: HRSA Data Warehouse, 2015
Compiled by: Health Council or Southeast Florida, 2015

Bethesda Hospital Community Health Needs Assessment 147 | P a g e
Community Perspective
To glean perspective on the thoughts, opinions and concerns of the community and its residents, the Health Council
of Southeast Florida conducted community focus groups and key informant interviews. The Health Council of
Southeast Florida conducted six community focus groups and 12 in-depth key informant interviews. The purpose was
to collect information from a cross-section of the community, including community stakeholders and members. The
approaches were selected in order to obtain the thoughts and opinions of the key health issues, barriers and
strengths of the community and opportunities for improvement.
Community Focus Groups The Health Council of Southeast Florida conducted focus groups during July 2015 in order to gain knowledge and insight from community residents living in Palm Beach County. The discussions aimed to understand the experiences and needs of the community and its residents regarding health issues, health services and the health care system, including hospitals. This report outlines the focus group methodology and provides a summary of the common themes, key health issues, assets of the community, barriers to care, opportunities to note and suggestions for improvement. Methodology
The Health Council of Southeast Florida developed focus group protocols and questions. A trained focus group
facilitator conducted the discussions. Community–based organizations serving specific target populations aided in
the recruitment of participants. The following segments of the population were recruited: individuals over 65 years of
age, individuals residing in the west and east regions in Palm Beach County, parents with children and the homeless.
Participants completed a demographic questionnaire at the start of the focus group; a compilation of this information
is in the tables below. Refreshments were provided at each session and participants were incentivized to participate
with $20 Walmart gift cards, which were distributed at the conclusion of the session.
Each of the six focus groups had between 11 and 21 participants and lasted approximately 60 to 90 minutes.
Sessions were audio-taped and notes were taken for clarity. Participants were assured no names would be attributed
to responses given. Only comments made by participants across different focus groups were included below. Thus,
not everything said in the interviews was included in the results.
Table 163: Site, Language, Time and Number of Participants in Focus Groups
Site Language Time # of Participants
The Lord's Place- Men's Campus English 9:30am 21
BRIDGES of Lake Worth Spanish 11:00am 14
COMPASS Community Center English 5:30pm 18
Coalition for Independent Living Options American Sign Language/English 10:00am 14
Adopt-A-Family of the Palm Beaches English 10:30am 11
Pathways to Prosperity, Inc. English/Haitian-Creole 5:30pm 13
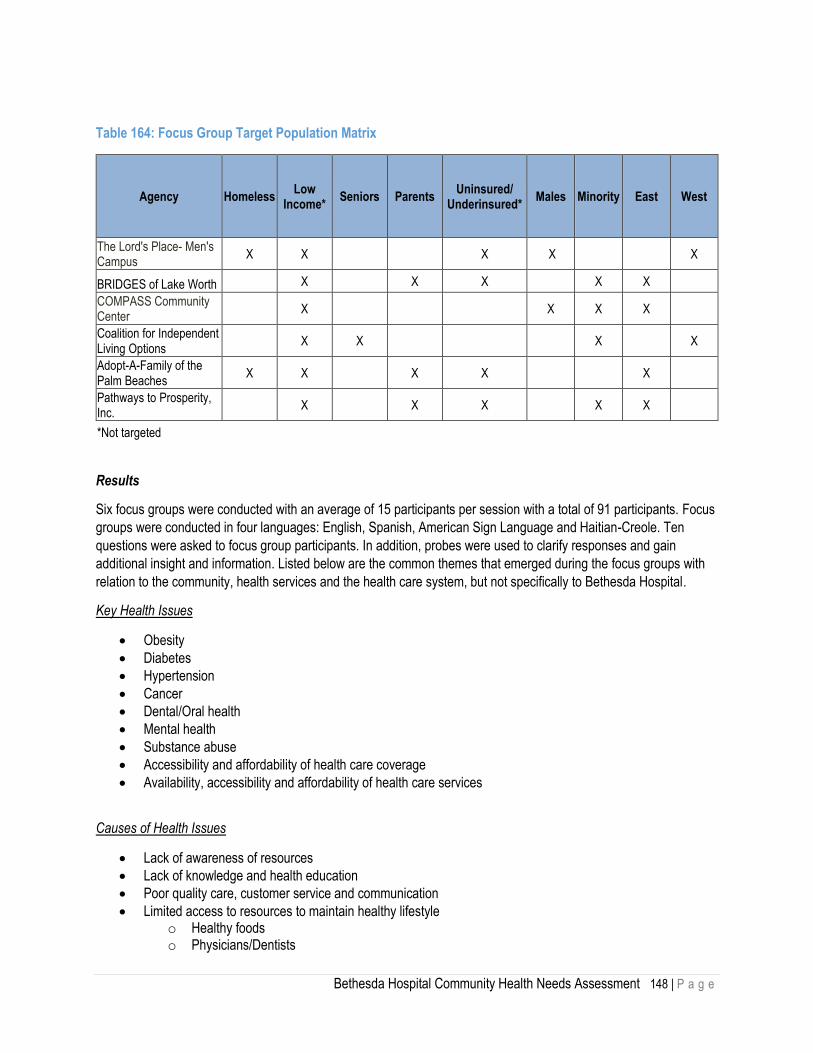
Bethesda Hospital Community Health Needs Assessment 148 | P a g e
Table 164: Focus Group Target Population Matrix
Agency Homeless Low
Income* Seniors Parents
Uninsured/ Underinsured*
Males Minority East West
The Lord's Place- Men's Campus
X X X X X
BRIDGES of Lake Worth X X X X X
COMPASS Community Center
X X X X
Coalition for Independent Living Options
X X X X
Adopt-A-Family of the Palm Beaches
X X X X X
Pathways to Prosperity, Inc.
X X X X X
*Not targeted
Results
Six focus groups were conducted with an average of 15 participants per session with a total of 91 participants. Focus
groups were conducted in four languages: English, Spanish, American Sign Language and Haitian-Creole. Ten
questions were asked to focus group participants. In addition, probes were used to clarify responses and gain
additional insight and information. Listed below are the common themes that emerged during the focus groups with
relation to the community, health services and the health care system, but not specifically to Bethesda Hospital.
Key Health Issues
Obesity
Diabetes
Hypertension
Cancer
Dental/Oral health
Mental health
Substance abuse
Accessibility and affordability of health care coverage
Availability, accessibility and affordability of health care services
Causes of Health Issues
Lack of awareness of resources
Lack of knowledge and health education
Poor quality care, customer service and communication
Limited access to resources to maintain healthy lifestyle o Healthy foods o Physicians/Dentists

Bethesda Hospital Community Health Needs Assessment 149 | P a g e
o Safe places to exercise
Complex health care coverage system
Barriers to Care
High cost of health care coverage and health services o High copays for services and medications o Limited health care coverage and coverage gaps
Transportation
Long wait-times and waiting periods for services
Language and communication barriers
Limited number of providers o Specialists o Oral/dental health providers o Pediatric health o Providers accepting Medicaid or other health insurance
Lack of resources in the community o Health education o Hospitals and clinics
Health Services Needed
Affordable health care coverage
Providers (Quality) o Specialists o Physicians/Dentists/Mental Health Providers
Safer and more affordable community facilities
Better access to healthy foods
Community Strengths/Assets
Hospitals, mobile and non-mobile clinics, health department
Community agencies providing resources
Parks
Health workshops provided by hospitals/clinics
Local churches
Law Enforcement agencies
Opportunities to Note
Provide quality care with compassion o Meet individuals where they are o Provide home-based follow-up o Understand the diversity of populations o Understand the sense of urgency an individual has
Improve communication with clients o Provide explanation of charges

Bethesda Hospital Community Health Needs Assessment 150 | P a g e
Customer Service o Perception that this may be related to socio-economic status, health insurance, and health
coverage
Provide relevant and local referrals o Health education o Discharge information
Communicate and network with other hospitals and agencies to provide collaborative treatment and services
Lower costs of health care services
Increase the number of staff to alleviate wait-times

Bethesda Hospital Community Health Needs Assessment 151 | P a g e
Key Informant Interviews
The Health Council of Southeast Florida conducted 12 informant interviews with key community leaders in July 2015.
The purpose was to collect first-hand knowledge from a wide range of people who have expert knowledge about the
community, available resources and services. The individuals selected were from federal, tribal, regional, state, or
local health or other departments or agencies, with current data or other information relevant to the health needs of
the community served by the hospital facility and included leaders, representatives, or members of medically
underserved, low-income, and minority populations, and populations with chronic disease needs, in the community
served by the hospital. Their particular knowledge and understanding provided insight on the existing health issues in
the community and the perceived systemic healthcare problems.
Methodology
The Health Council of Southeast Florida developed key informant interview protocols and questions. Each key
informant interview was conducted by a trained facilitator via telephone and lasted 30-45 minutes. The facilitator
provided an overview of the process at the beginning of the interview and assured that the confidentiality of their
comments, the names and any other identifying information would not be reported.
Results
Twelve key informant interviews were conducted with community stakeholders. Ten questions were asked to key
informants. In addition, probes were used to clarify responses and gain additional insight and information. Listed
below are the common themes that emerged during the key informant interviews with relation to the community,
health services and the health care system, but not specifically to Bethesda Hospital.
Key Health Issues
Obesity
Diabetes
Hypertension
Cancer
Dental/Oral health
Mental health
Substance abuse
Lack of preventative care
Increasing aging population
Accessibility to health care services Populations with Unmet Needs
African Americans
Haitians
Hispanics/Latinos
Elderly
Individuals suffering from mental illness
Low income residents
Uninsured

Bethesda Hospital Community Health Needs Assessment 152 | P a g e
Community Strengths/Assets
Hospitals
Clinics
Federally-Qualified Health Centers
Community Centers
Social Service Programs
Faith-based organizations Challenges and Barriers in Maintaining Health
Lack of awareness of resources
Lack of knowledge and health education
Lack of health care coverage
Lack of focus and interest on prevention
Limited access to resources to maintain healthy lifestyle o Healthy foods o Physicians/Dentists o Safe places to exercise
Transportation
Cost of being healthy
Poverty
Stigma Opportunities to Note
Education
Additional funding and resources
Collaboration for the greater good of the community
Re-galvanize resources
Understanding the communities being served
Engage with community-based organizations
Increase visibility in communities Suggestions
Collaborative and strategic thinking to fill gaps
Educate community through health fairs
Partner with the local community

Bethesda Hospital Community Health Needs Assessment 153 | P a g e
Identification of Priority Strategic Health Issues
On August 13, 2015, the Health Council of Southeast Florida presented the trigger report, this report summarized
highlights from the quantitative and qualitative findings. This presentation was designed to provide a platform for the
initial phase of ongoing strategic healthcare planning and community health improvement planning which will
ultimately become Bethesda Hospital’s focus for the next 3-5 years.
Methodology
On August 13, 2015, HCSEF provided an overview of the summary results from the quantitative and qualitative data
in the form of a ‘Trigger Report’. The ‘Trigger Report’ essentially recapped and highlighted pertinent points on various
key health indicators contained in this assessment. Upon reviewing the results of the quantitative and qualitative
data, HCSEF then led a facilitated discussion on the most pressing health issues influencing the health and quality of
life of community members in Palm Beach County, with a specific focus members residing in Bethesda Hospital’s
service areas. At that point, participants provided their thoughts, ideas, and suggestions on the issues, needs,
challenges, and barriers affecting community members. The facilitation occurred during a two-hour sessions held at
Bethesda Hospital East. The group was comprised of 20 advisory committee members. HCSEF facilitated advisory
committee members through the following process:
1. Flip charts for the identified priorities were placed around the room.
2. The Advisory Committee were provided three (3) sticker dots and asked to place their dots on the top health
priorities that should receive consideration/attention.
3. Advisory committee members were allotted 10 minutes to select the key health priorities.
4. After the allotted time period, HCSEF tailed the results from the exercise.
Results
Participants provided their thoughts, ideas and suggestions on the issues, needs, challenges and barriers affecting community members in Palm Beach County. The following list (in no ranked order) is the result of that session; below are the most important issues identified by the Steering Committee following the prioritization process:
1. Diabetes
2. Prevention & Education
3. Lack of Awareness
4. Mental Health and Substance Abuse
5. Prenatal Care
6. Access and Utilization of Primary Care Services
7. Home-based Care
8. Aging Population
Bethesda Hospital will work to synthesize the list of priorities by identifying 2-3 overarching priorities through a
strategic planning process. With support from its partners, Bethesda Hospital will determine addressing ways to
strengthen programs already addressing the same issues and new plans for the new healthy concerns for the
county.

Bethesda Hospital Community Health Needs Assessment 154 | P a g e
Conclusion
Communities face the challenge of balancing desire to provide residents access to quality health and human services
with decreasing resources and increasing demand. This community health needs assessment will enable Bethesda
Hospital to better understand the characteristics, health status and needs of its community and aid in planning efforts
for services in an effort to improve the health status of the community. The data from the Community Health
Perspective should be considered along with the quantitative data from the Demographic and Socioeconomic Profile,
Health Status Profile and Health Resource Availability and Access Profile to help the development specific goals,
objectives and an implementation plan. With this information, Bethesda Hospital will address unmet needs within the
context of the overall approach, mission commitments and key clinical strengths and within the overarching goals of
the hospital.